Cambridge IGCSE Physics 0625 — 2013 May/June Paper 5 · Variant 2
0625/52/M/J/13 · 4 questions · 40 marks · ≈45 min
The question paper and its mark scheme, free to read here and free to download. This is Cambridge’s own paper, exactly as it was sat.
Question paper12 pages

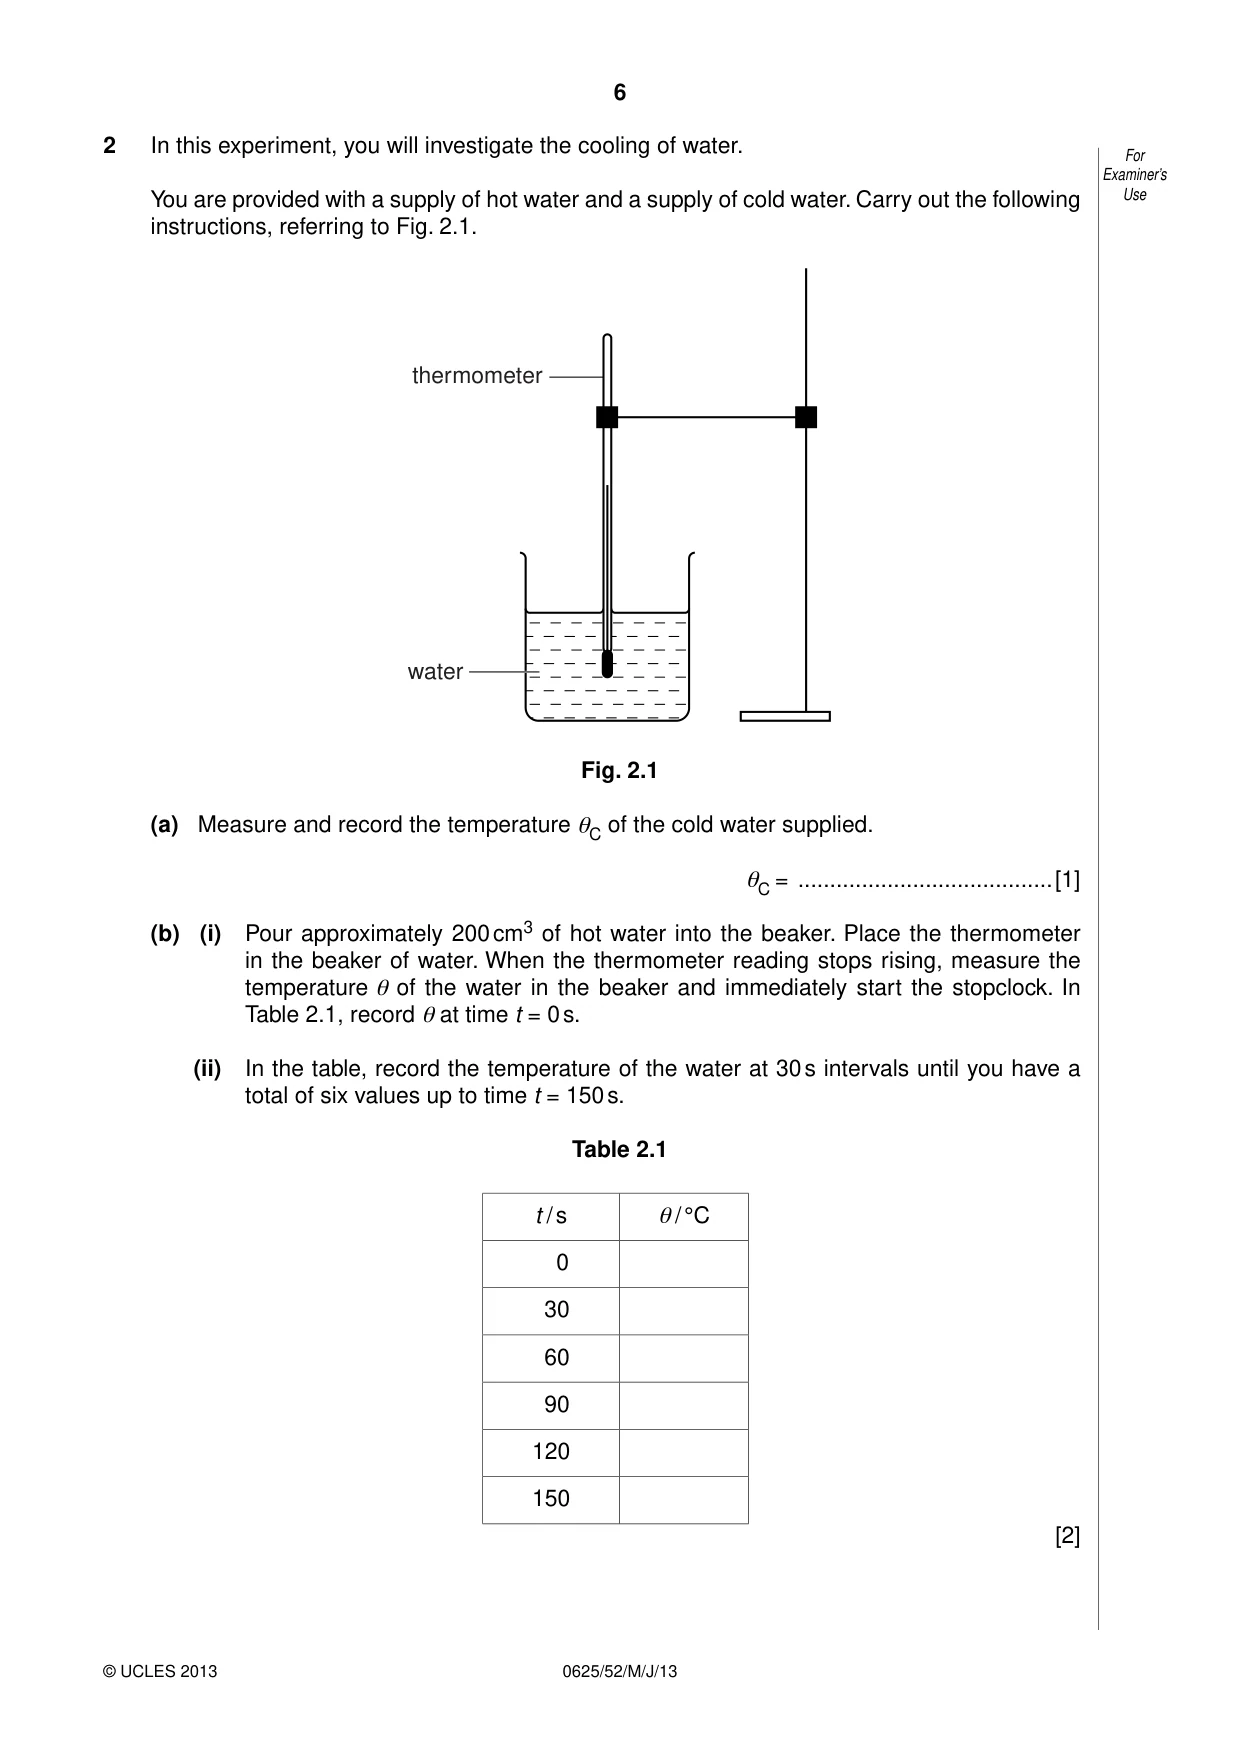
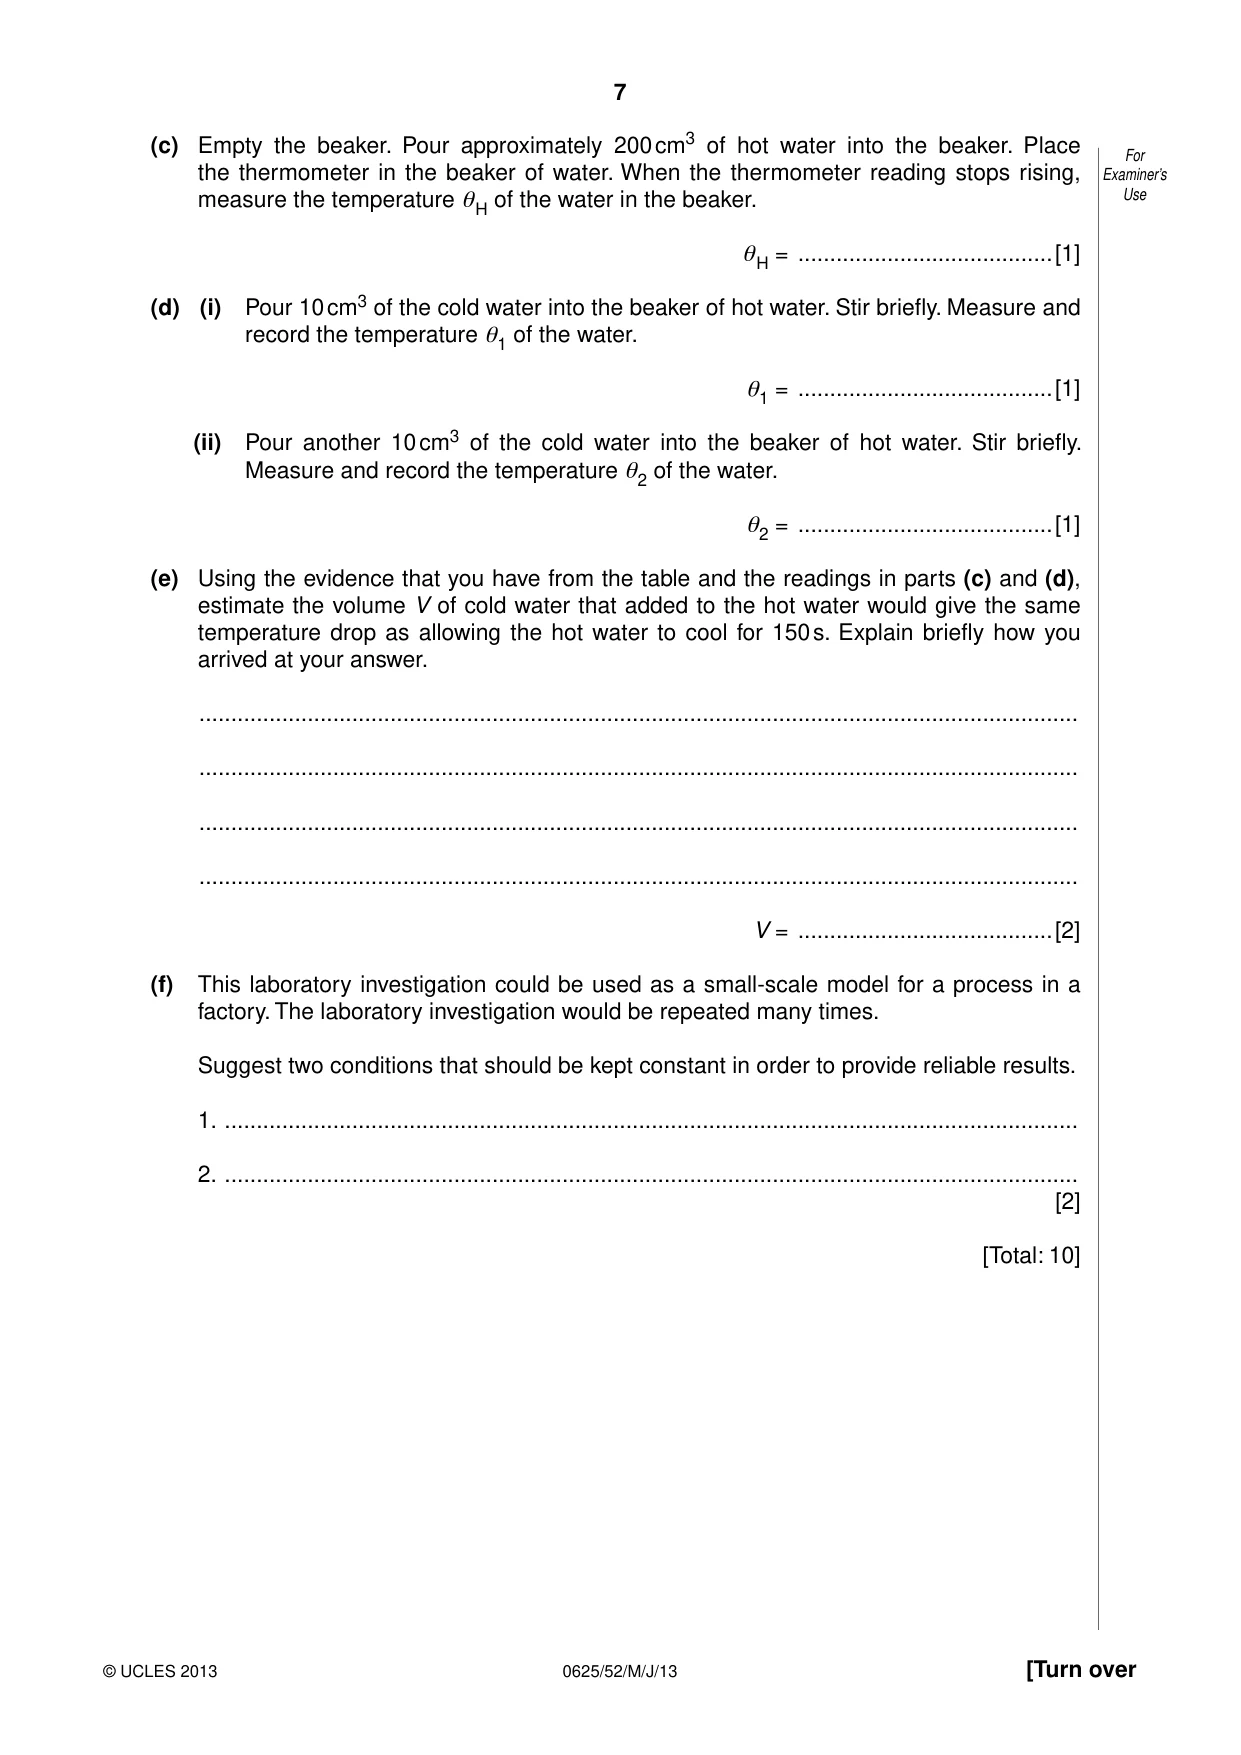
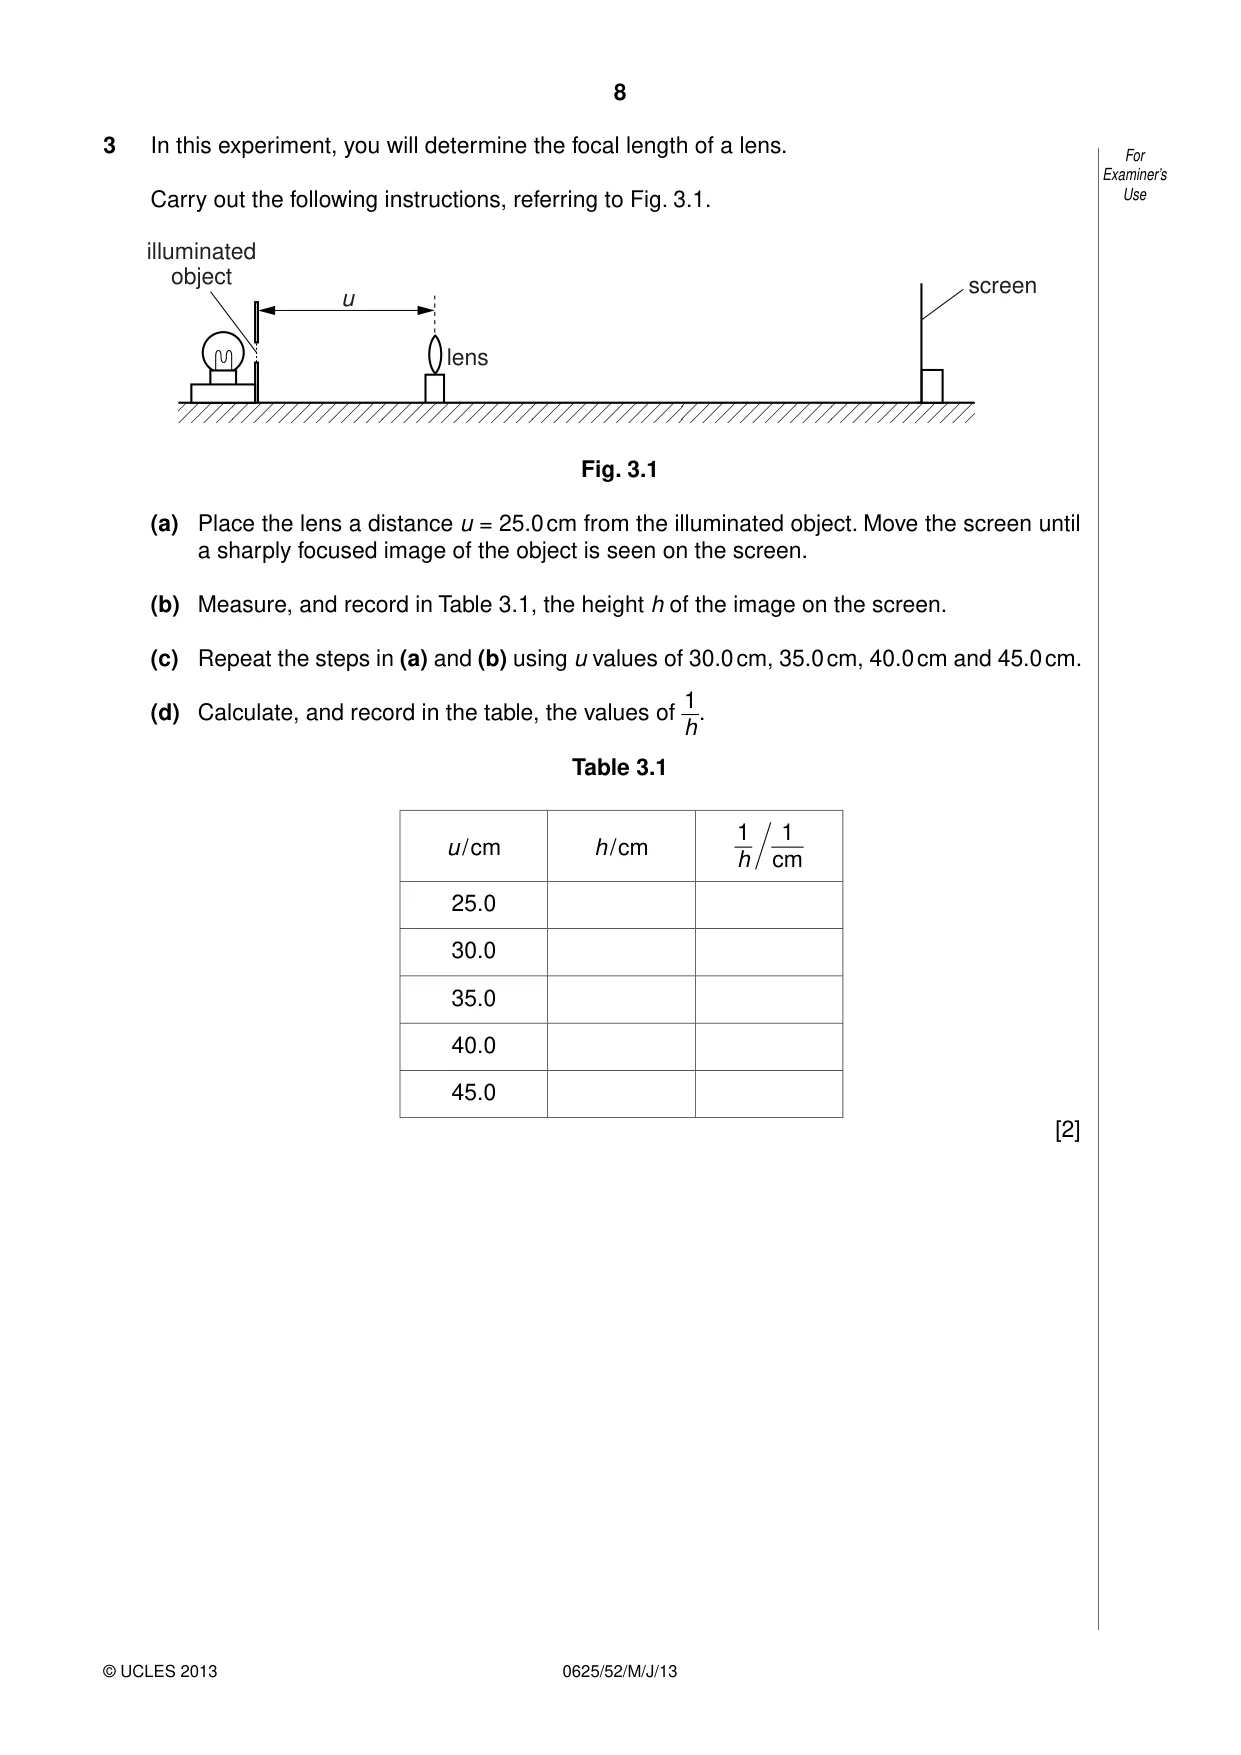
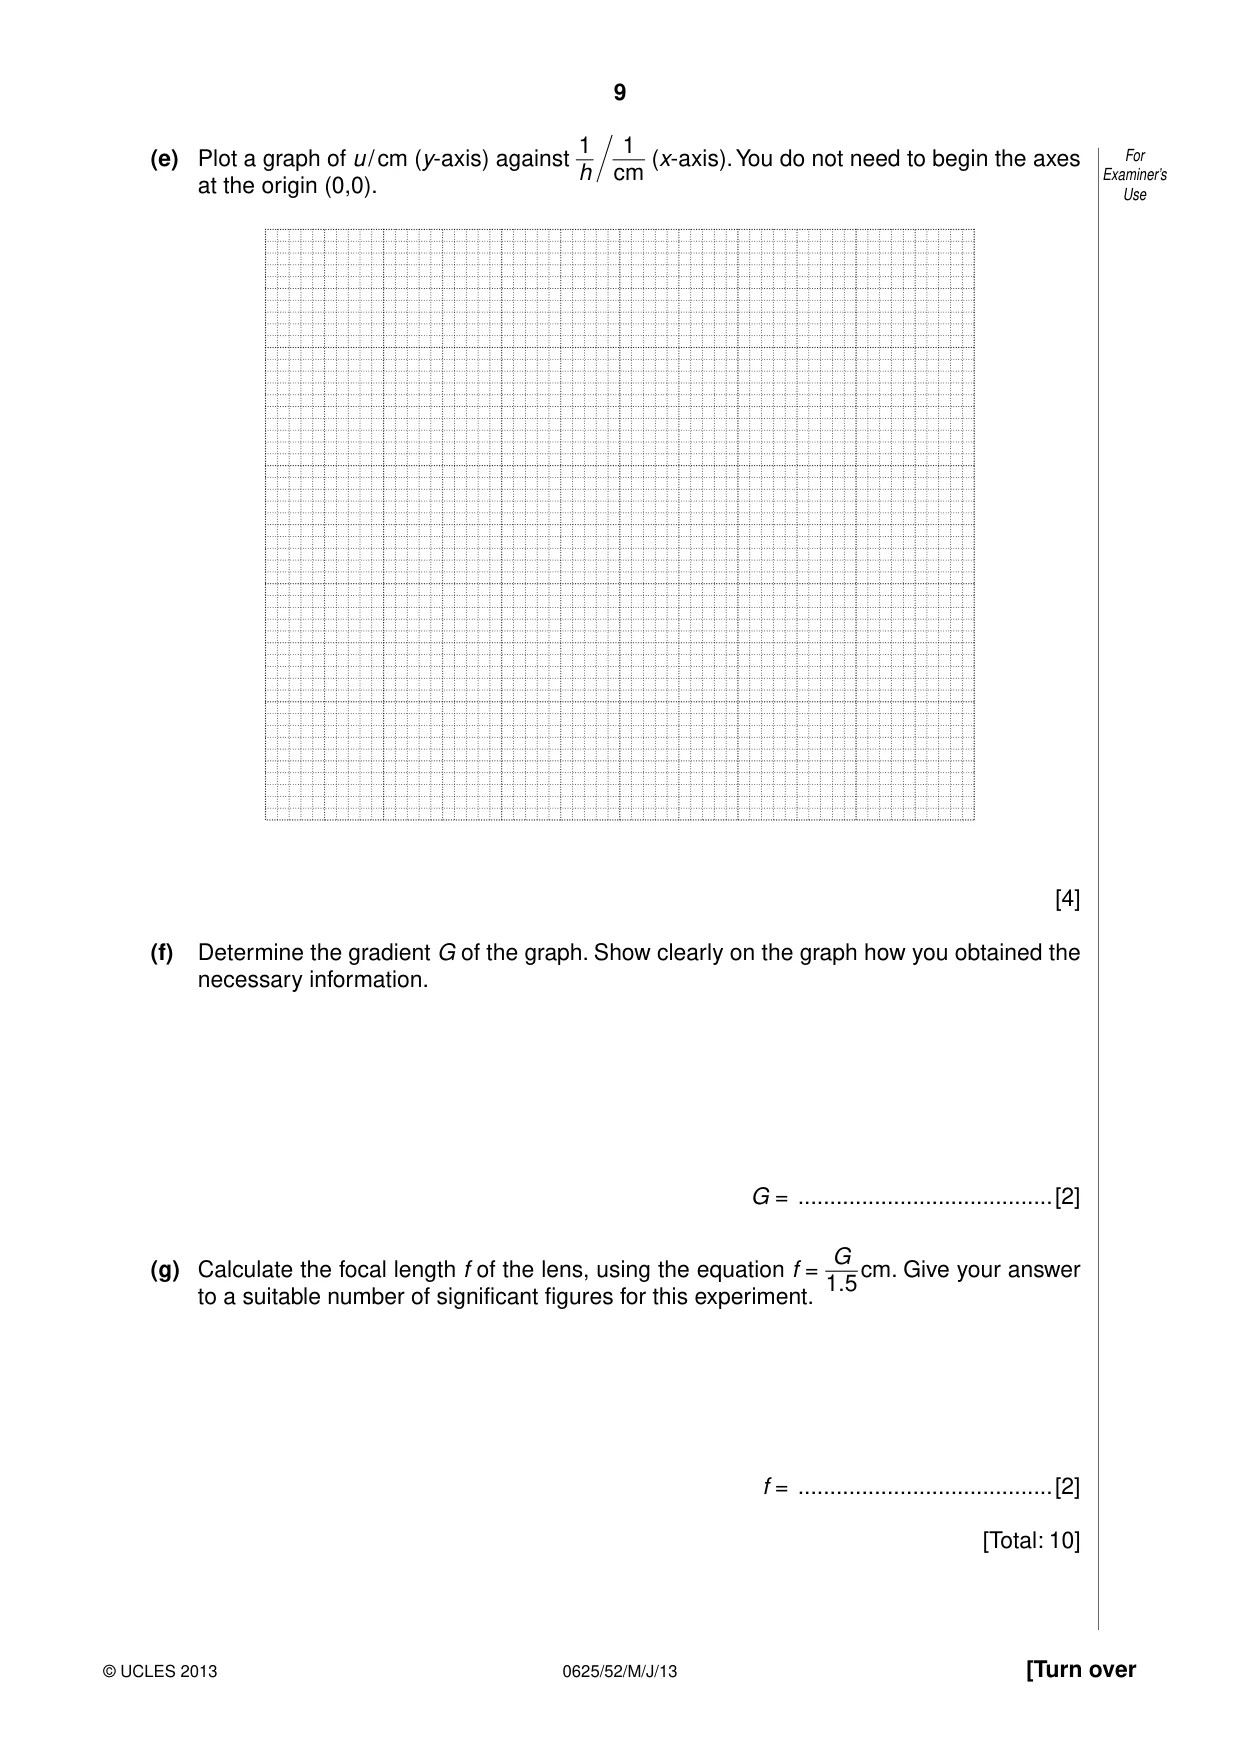
Mark scheme3 pages
Answers below. Sit the paper first if you are practising.
Questions as text
Q1 · In this experiment, you will determine the mass of a metre rule using two methods
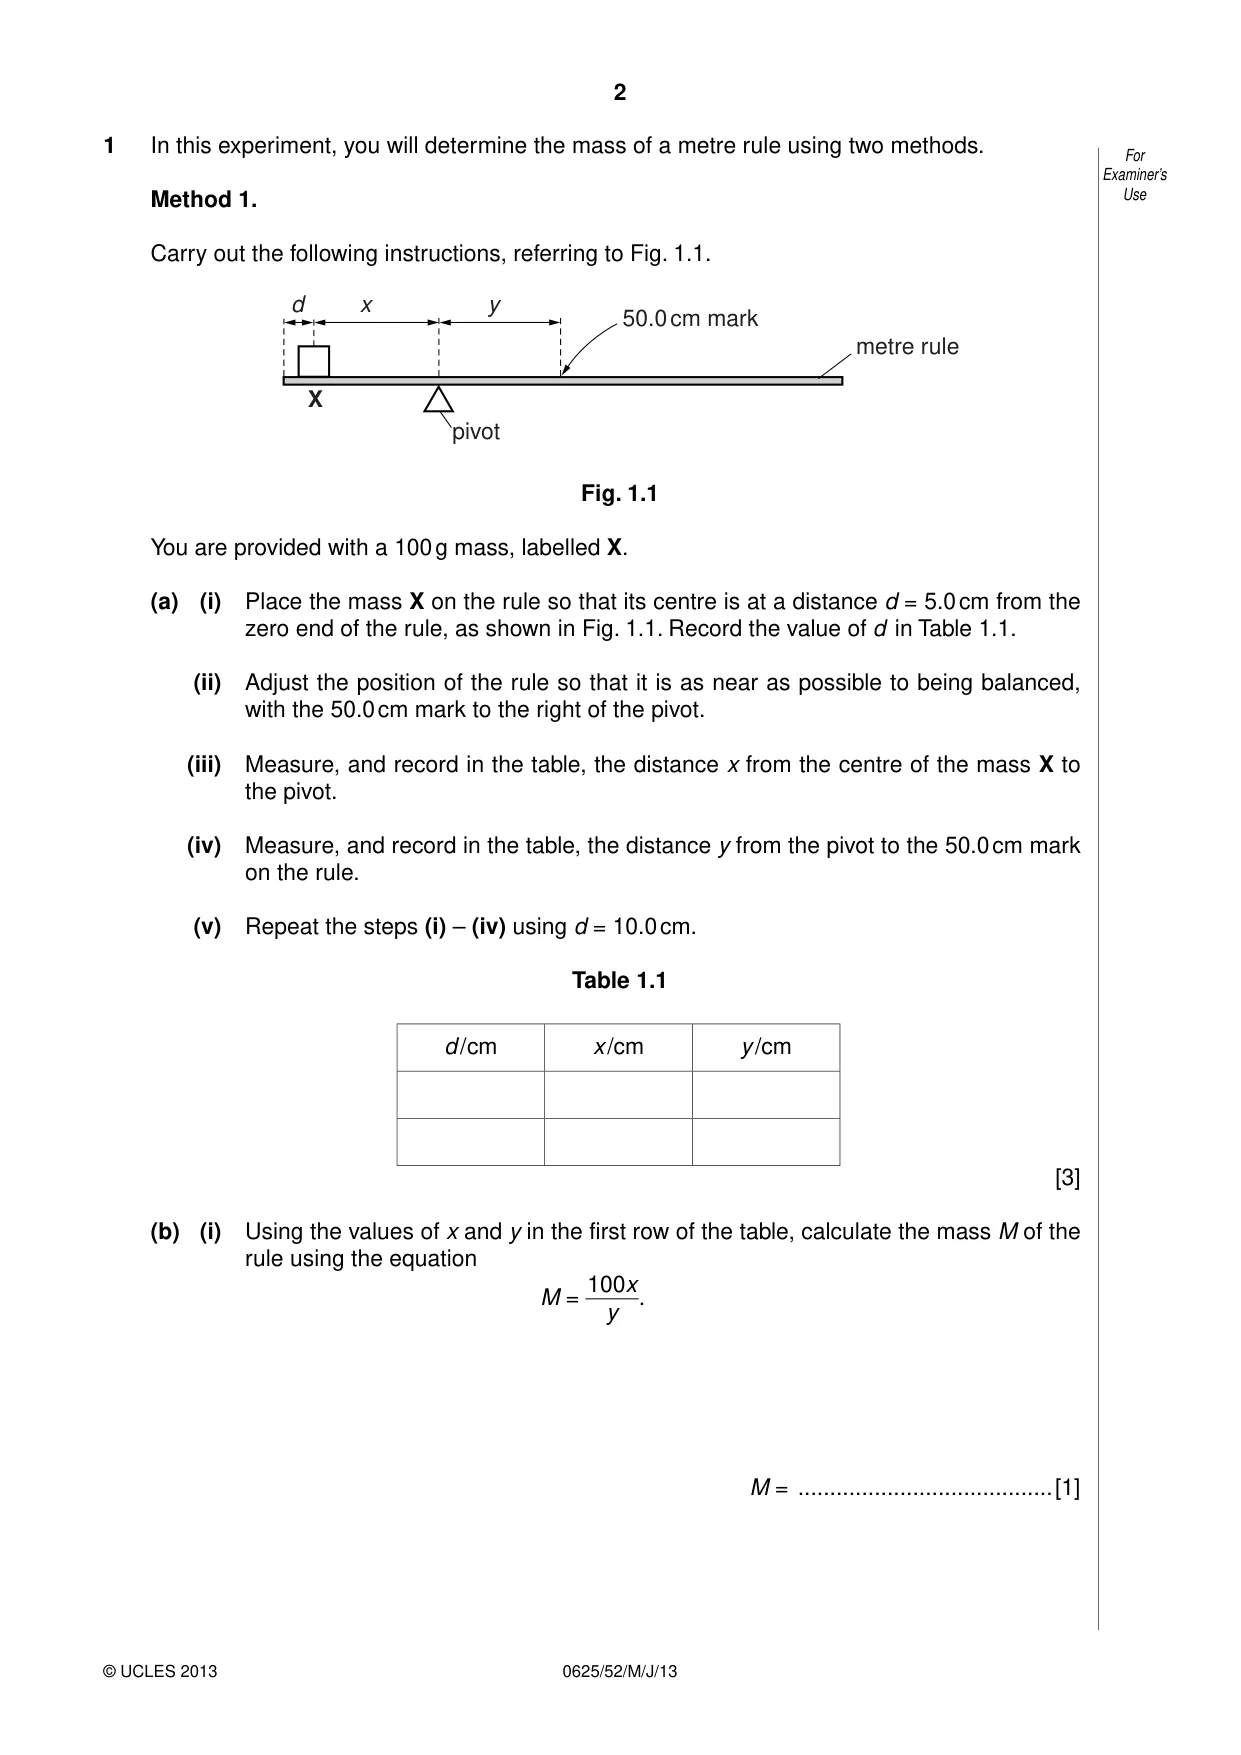
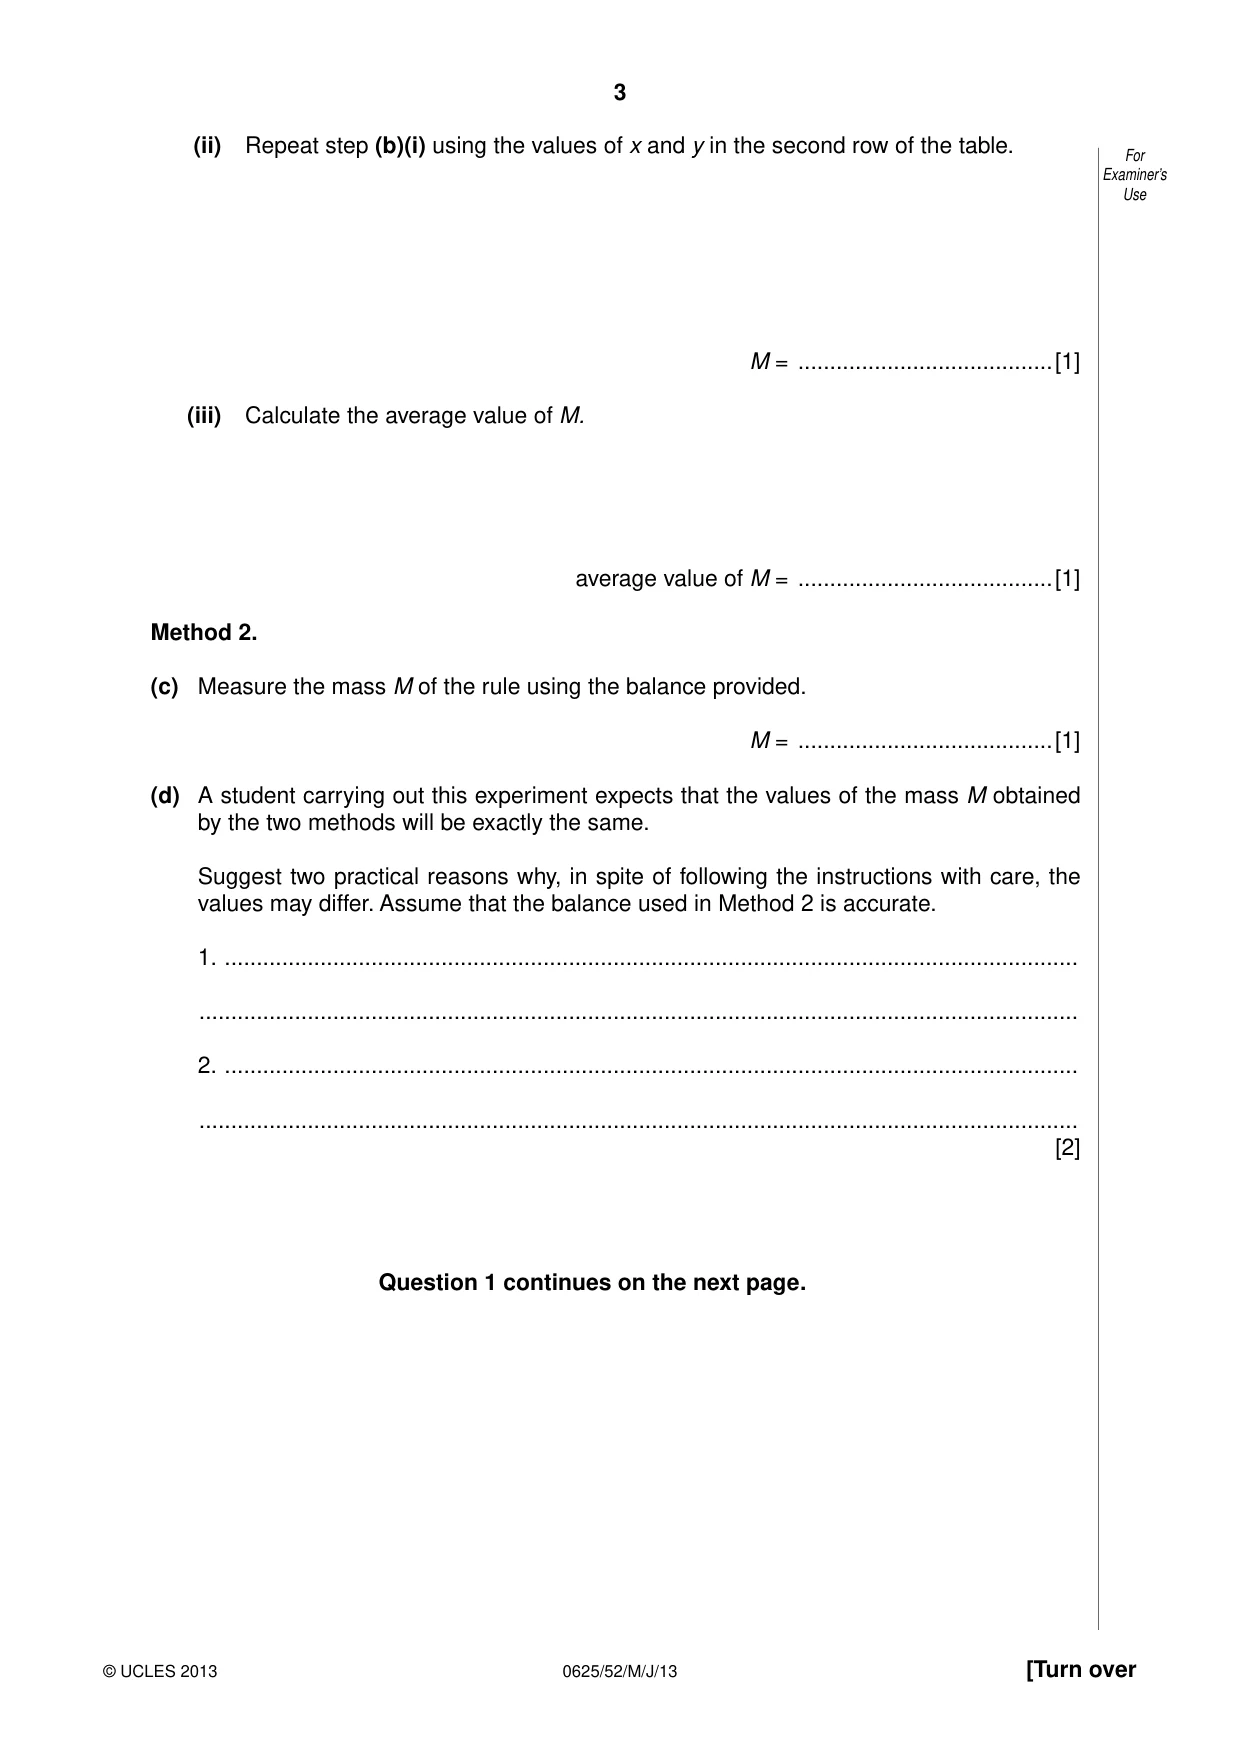
1 In this experiment, you will determine the mass of a metre rule using two methods. For Examiner’s Method 1. Use Carry out the following instructions, referring to Fig. 1.1. d x y 50.0 cm mark metre rule X pivot Fig. 1.1 You are provided with a 100 g mass, labelled X. (a) (i) Place the mass X on the rule so that its centre is at a distance d = 5.0 cm from the zero end of the rule, as shown in Fig. 1.1. Record the value of d in Table 1.1. (ii) Adjust the position of the rule so that it is as near as possible to being balanced, with the 50.0 cm mark to the right of the pivot. (iii) Measure, and record in the table, the distance x from the centre of the mass X to the pivot. (iv) Measure, and record in the table, the distance y from the pivot to the 50.0 cm mark on the rule. (v) Repeat the steps (i) – (iv) using d = 10.0 cm. Table 1.1 d /cm x /cm y /cm [3] (b) (i) Using the values of x and y in the first row of the table, calculate the mass M of the rule using the equation 100x M = . y M = ........................................[1] (ii) Repeat step (b)(i) using the values of x and y in the second row of the table. For Examiner’s Use M = ........................................[1] (iii) Calculate the average value of M. average value of M = ........................................[1] Method 2. (c) Measure the mass M of the rule using the balance provided. M = ........................................[1] (d) A student carrying out this experiment expects that the values of the mass M obtained by the two methods will be exactly the same. Suggest two practical reasons why, in spite of following the instructions with care, the values may differ. Assume that the balance used in Method 2 is accurate. 1. ...................................................................................................................................... .......................................................................................................................................... 2. ...................................................................................................................................... .......................................................................................................................................... [2] Question 1 continues on the next page. (e) Explain briefly how you judge the position of the centre of the mass X when it is on the For rule in (a)(iii). You may draw a diagram. Examiner’s Use .......................................................................................................................................... .......................................................................................................................................... ......................................................................................................................................[1] [Total: 10]
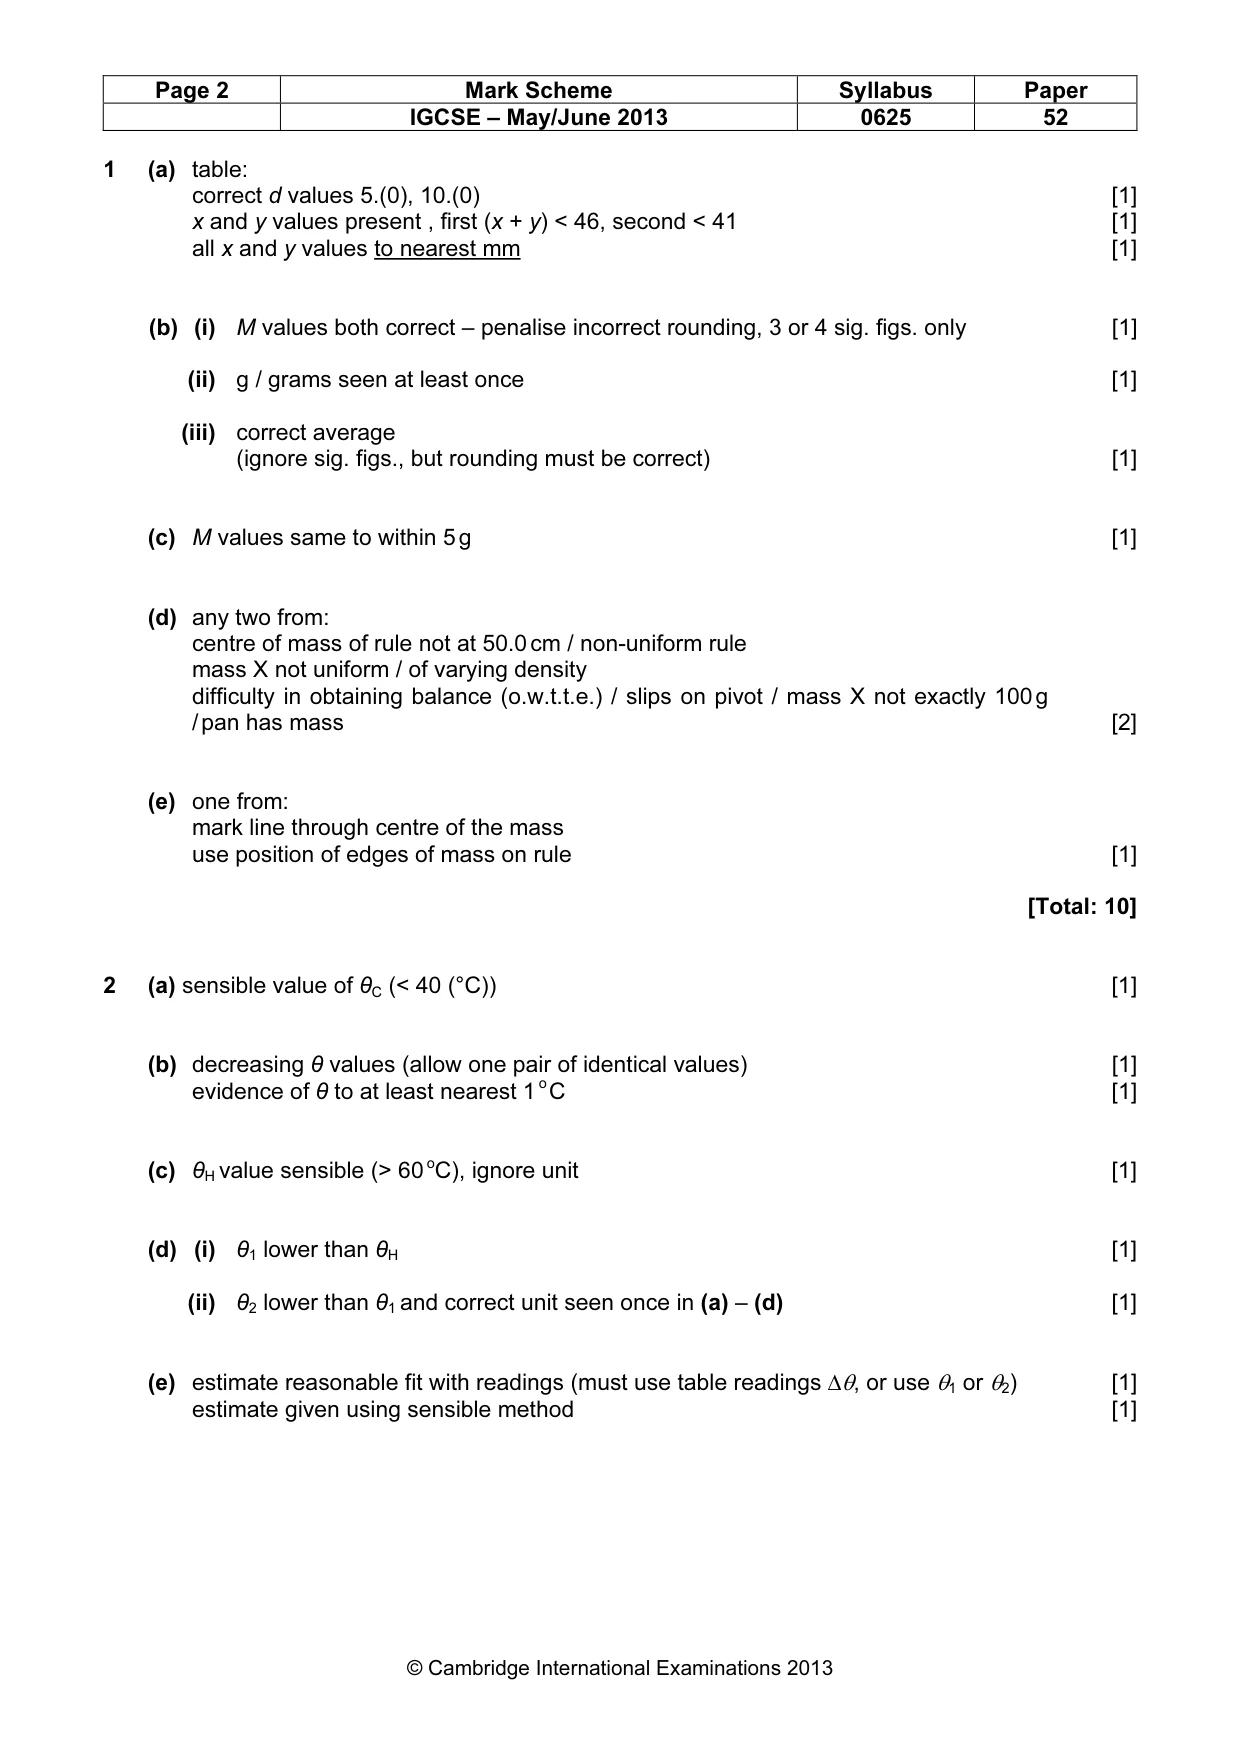
Mark scheme: 1 (a) table: correct d values 5.(0), 10.(0) [1] x and y values present , first (x + y) < 46, second < 41 [1] all x and y values to nearest mm [1] (b) (i) M values both correct – penalise incorrect rounding, 3 or 4 sig. figs. only [1] (ii) g / grams seen at least once [1] (iii) correct average (ignore sig. figs., but rounding must be correct) [1] (c) M values same to within 5 g [1] (d) any two from: centre of mass of rule not at 50.0 cm / non-uniform rule mass X not uniform / of varying density difficulty in obtaining balance (o.w.t.t.e.) / slips on pivot / mass X not exactly 100 g / pan has mass [2] (e) one from: mark line through centre of the mass use position of edges of mass on rule [1] [Total: 10]
Q2 · In this experiment, you will investigate the cooling of water
2 In this experiment, you will investigate the cooling of water. For Examiner’s You are provided with a supply of hot water and a supply of cold water. Carry out the following Use instructions, referring to Fig. 2.1. thermometer water Fig. 2.1 (a) Measure and record the temperature θC of the cold water supplied. θC = ........................................[1] (b) (i) Pour approximately 200 cm3 of hot water into the beaker. Place the thermometer in the beaker of water. When the thermometer reading stops rising, measure the temperature θ of the water in the beaker and immediately start the stopclock. In Table 2.1, record θ at time t = 0 s. (ii) In the table, record the temperature of the water at 30 s intervals until you have a total of six values up to time t = 150 s. Table 2.1 t / s θ / °C 0 30 60 90 120 150 [2] (c) Empty the beaker. Pour approximately 200 cm3 of hot water into the beaker. Place For the thermometer in the beaker of water. When the thermometer reading stops rising, Examiner’s measure the temperature θH of the water in the beaker. Use θH = ........................................[1] (d) (i) Pour 10 cm3 of the cold water into the beaker of hot water. Stir briefly. Measure and record the temperature θ1 of the water. θ1 = ........................................[1] (ii) Pour another 10 cm3 of the cold water into the beaker of hot water. Stir briefly. Measure and record the temperature θ2 of the water. θ2 = ........................................[1] (e) Using the evidence that you have from the table and the readings in parts (c) and (d), estimate the volume V of cold water that added to the hot water would give the same temperature drop as allowing the hot water to cool for 150 s. Explain briefly how you arrived at your answer. .......................................................................................................................................... .......................................................................................................................................... .......................................................................................................................................... .......................................................................................................................................... V = ........................................[2] (f) This laboratory investigation could be used as a small-scale model for a process in a factory. The laboratory investigation would be repeated many times. Suggest two conditions that should be kept constant in order to provide reliable results. 1. ...................................................................................................................................... 2. ...................................................................................................................................... [2] [Total: 10]
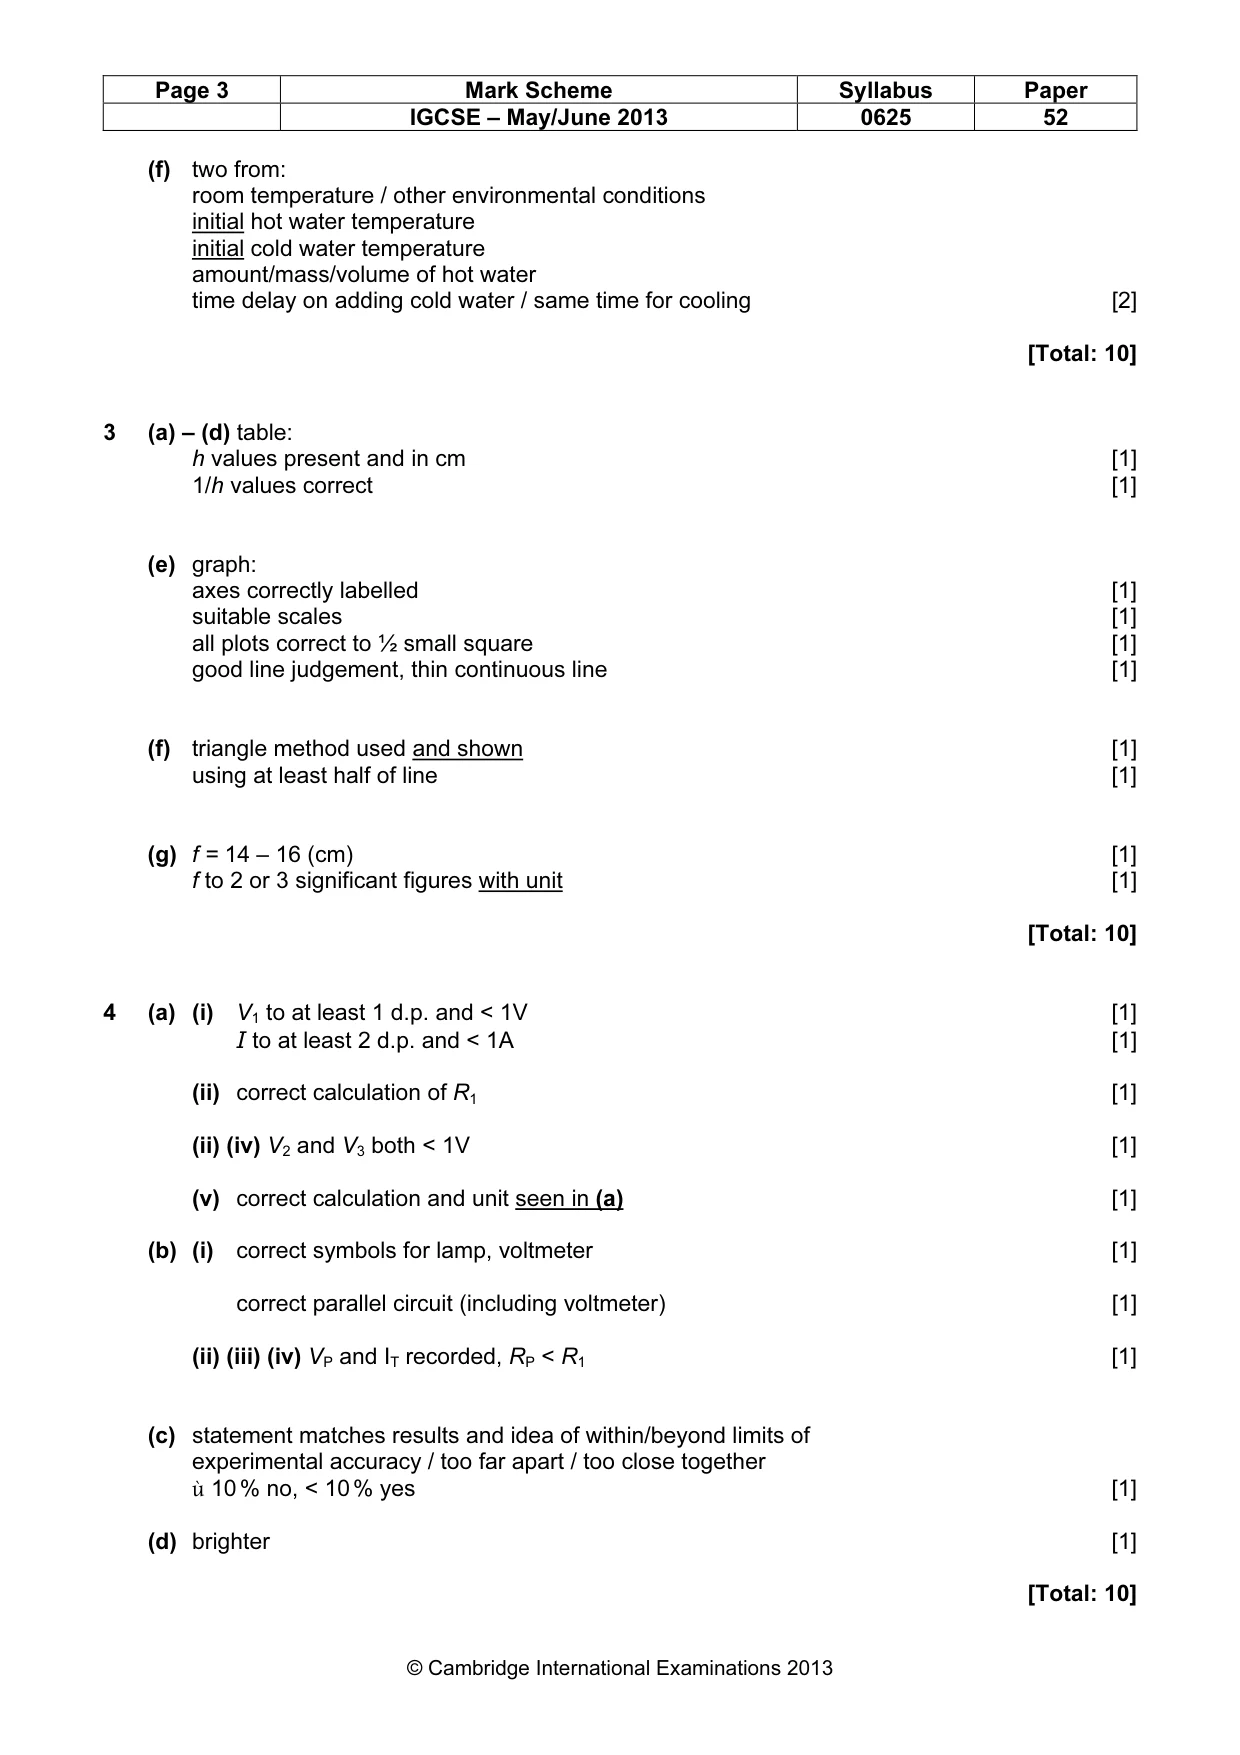
Mark scheme: 2 (a) sensible value of θC (< 40 (°C)) [1] (b) decreasing θ values (allow one pair of identical values) [1] evidence of θ to at least nearest 1 o C [1] (c) θH value sensible (> 60 oC), ignore unit [1] (d) (i) θ1 lower than θH [1] (ii) θ2 lower than θ1 and correct unit seen once in (a) – (d) [1] (e) estimate reasonable fit with readings (must use table readings ∆θ, or use θ1 or θ2) [1] estimate given using sensible method [1] IGCSE – May/June 2013 0625 52 (f) two from: room temperature / other environmental conditions initial hot water temperature initial cold water temperature amount/mass/volume of hot water time delay on adding cold water / same time for cooling [2] [Total: 10]
Q3 · In this experiment, you will determine the focal length of a lens
3 In this experiment, you will determine the focal length of a lens. For Examiner’s Carry out the following instructions, referring to Fig. 3.1. Use illuminated object screen u lens Fig. 3.1 (a) Place the lens a distance u = 25.0 cm from the illuminated object. Move the screen until a sharply focused image of the object is seen on the screen. (b) Measure, and record in Table 3.1, the height h of the image on the screen. (c) Repeat the steps in (a) and (b) using u values of 30.0 cm, 35.0 cm, 40.0 cm and 45.0 cm. 1 (d) Calculate, and record in the table, the values of h. Table 3.1 1 1 u / cm h / cm h cm 25.0 30.0 35.0 40.0 45.0 [2] 1 1 For(e) Plot a graph of u / cm (y-axis) against (x-axis). You do not need to begin the axes h cm Examiner’s at the origin (0,0). Use [4] (f) Determine the gradient G of the graph. Show clearly on the graph how you obtained the necessary information. G = ........................................[2] G (g) Calculate the focal length f of the lens, using the equation f = cm. Give your answer 1.5 to a suitable number of significant figures for this experiment. f = ........................................[2] [Total: 10]
Mark scheme: 3 (a) – (d) table: h values present and in cm [1] 1/h values correct [1] (e) graph: axes correctly labelled [1] suitable scales [1] all plots correct to ½ small square [1] good line judgement, thin continuous line [1] (f) triangle method used and shown [1] using at least half of line [1] (g) f = 14 – 16 (cm) [1] f to 2 or 3 significant figures with unit [1] [Total: 10]
Q4 · In this experiment, you will investigate lamps in series and parallel combinations
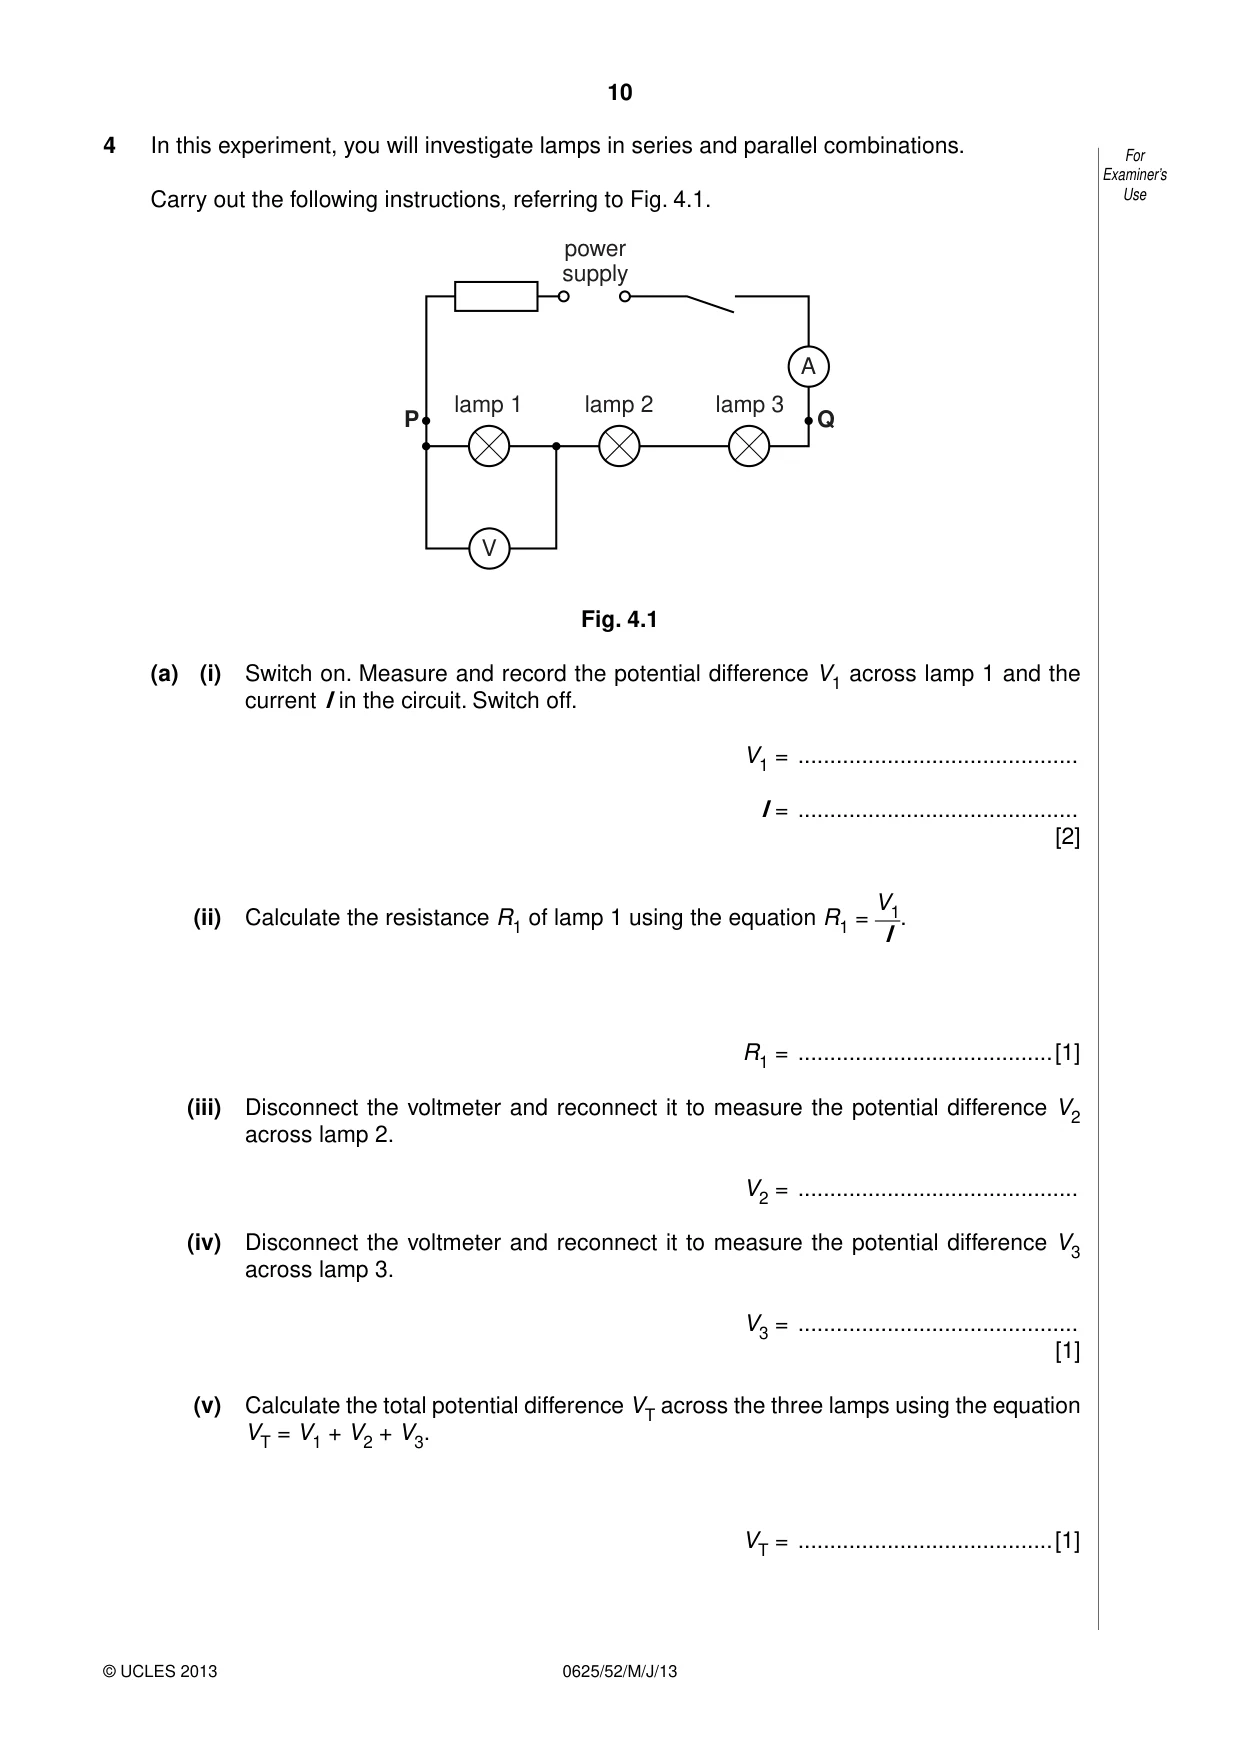
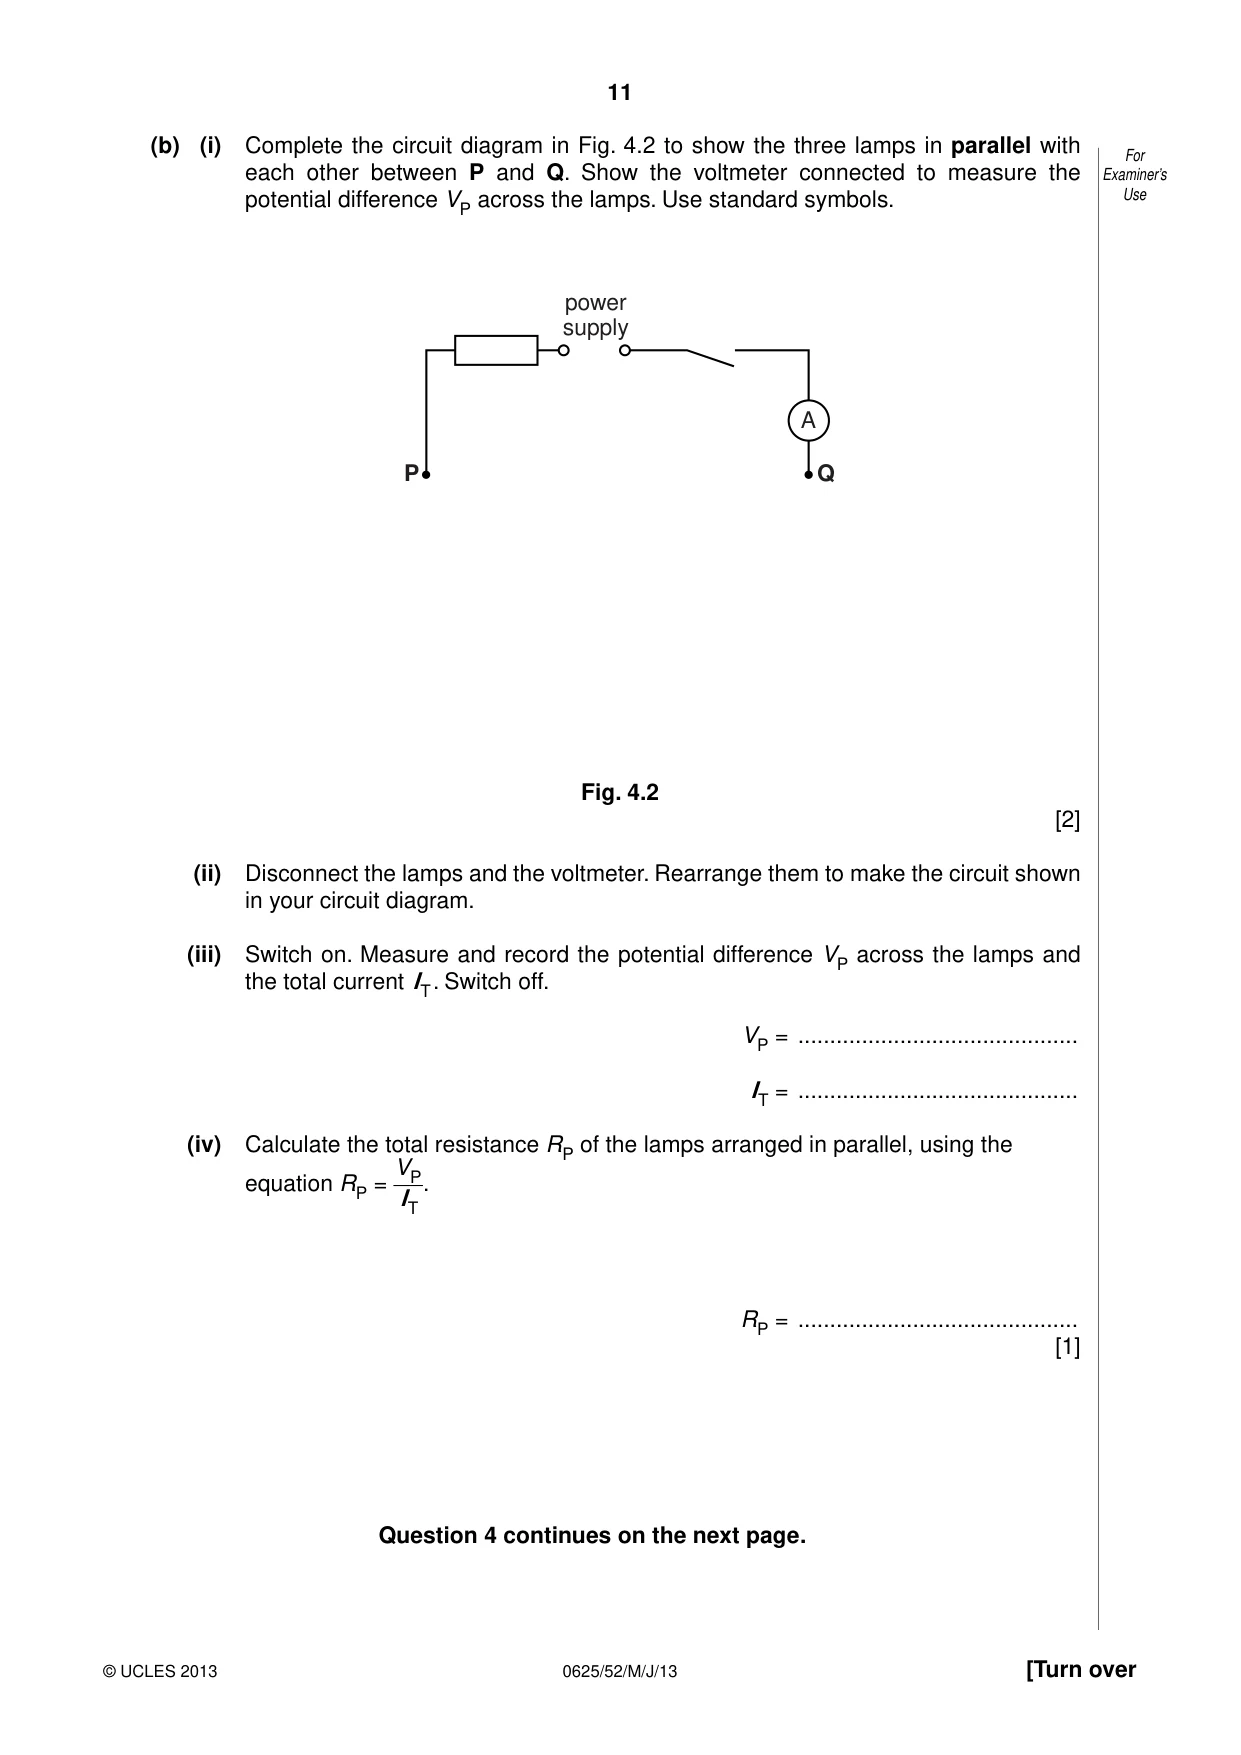
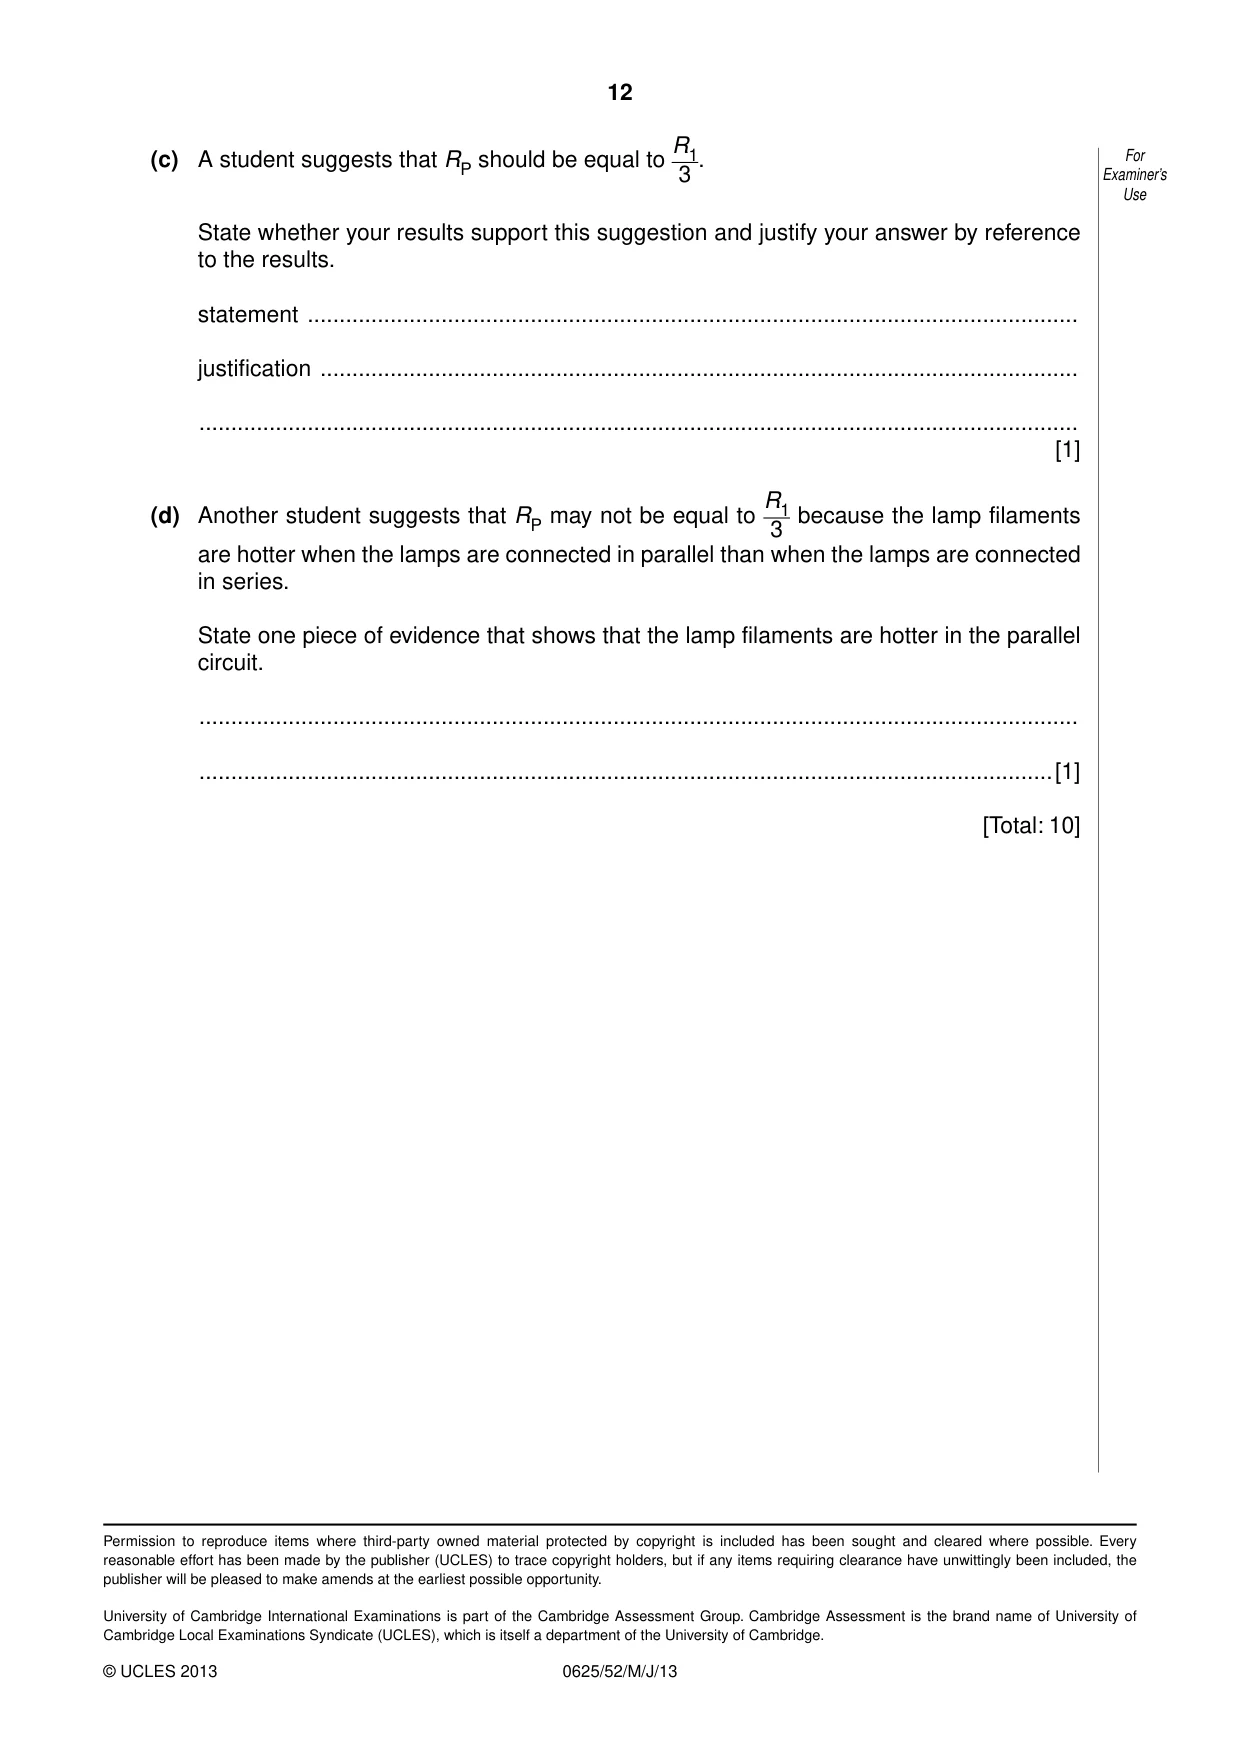
4 In this experiment, you will investigate lamps in series and parallel combinations. For Examiner’s Carry out the following instructions, referring to Fig. 4.1. Use power supply A lamp 1 lamp 2 lamp 3 P Q V Fig. 4.1 (a) (i) Switch on. Measure and record the potential difference V1 across lamp 1 and the current I in the circuit. Switch off. V1 = ............................................ I = ............................................ [2] V1 (ii) Calculate the resistance R1 of lamp 1 using the equation R1 = . I R1 = ........................................[1] (iii) Disconnect the voltmeter and reconnect it to measure the potential difference V2 across lamp 2. V2 = ............................................ (iv) Disconnect the voltmeter and reconnect it to measure the potential difference V3 across lamp 3. V3 = ............................................ [1] (v) Calculate the total potential difference VT across the three lamps using the equation VT = V1 + V2 + V3. VT = ........................................[1] (b) (i) Complete the circuit diagram in Fig. 4.2 to show the three lamps in parallel with For each other between P and Q. Show the voltmeter connected to measure the Examiner’s potential difference VP across the lamps. Use standard symbols. Use power supply A P Q Fig. 4.2 [2] (ii) Disconnect the lamps and the voltmeter. Rearrange them to make the circuit shown in your circuit diagram. (iii) Switch on. Measure and record the potential difference VP across the lamps and the total current IT . Switch off. VP = ............................................ IT = ............................................ (iv) Calculate the total resistance RP of the lamps arranged in parallel, using the VP equation RP = . IT RP = ............................................ [1] Question 4 continues on the next page. R1 For .(c) A student suggests that RP should be equal to Examiner’s 3 Use State whether your results support this suggestion and justify your answer by reference to the results. statement ......................................................................................................................... justification ....................................................................................................................... .......................................................................................................................................... [1] R1 (d) Another student suggests that RP may not be equal to because the lamp filaments 3 are hotter when the lamps are connected in parallel than when the lamps are connected in series. State one piece of evidence that shows that the lamp filaments are hotter in the parallel circuit. .......................................................................................................................................... ......................................................................................................................................[1] [Total: 10]
Mark scheme: 4 (a) (i) V1 to at least 1 d.p. and < 1V [1] I to at least 2 d.p. and < 1A [1] (ii) correct calculation of R1 [1] (ii) (iv) V2 and V3 both < 1V [1] (v) correct calculation and unit seen in (a) [1] (b) (i) correct symbols for lamp, voltmeter [1] correct parallel circuit (including voltmeter) [1] (ii) (iii) (iv) VP and IT recorded, RP < R1 [1] (c) statement matches results and idea of within/beyond limits of experimental accuracy / too far apart / too close together ù 10 % no, < 10 % yes [1] (d) brighter [1] [Total: 10]
What was in this paper
The subtopics covered by these 4 questions, and how many questions each got. Open one in a new tab to see every Cambridge question on it.
What you needed in this session
Cambridge’s own grade thresholds for 2013 May/June, Paper 5 · Variant 2. A higher threshold means an easier paper — the bar moves with how the cohort did.