Cambridge IGCSE Physics 0625 — 2013 May/June Paper 5 · Variant 1
0625/51/M/J/13 · 4 questions · 40 marks · ≈45 min
The question paper and its mark scheme, free to read here and free to download. This is Cambridge’s own paper, exactly as it was sat.
Question paper16 pages

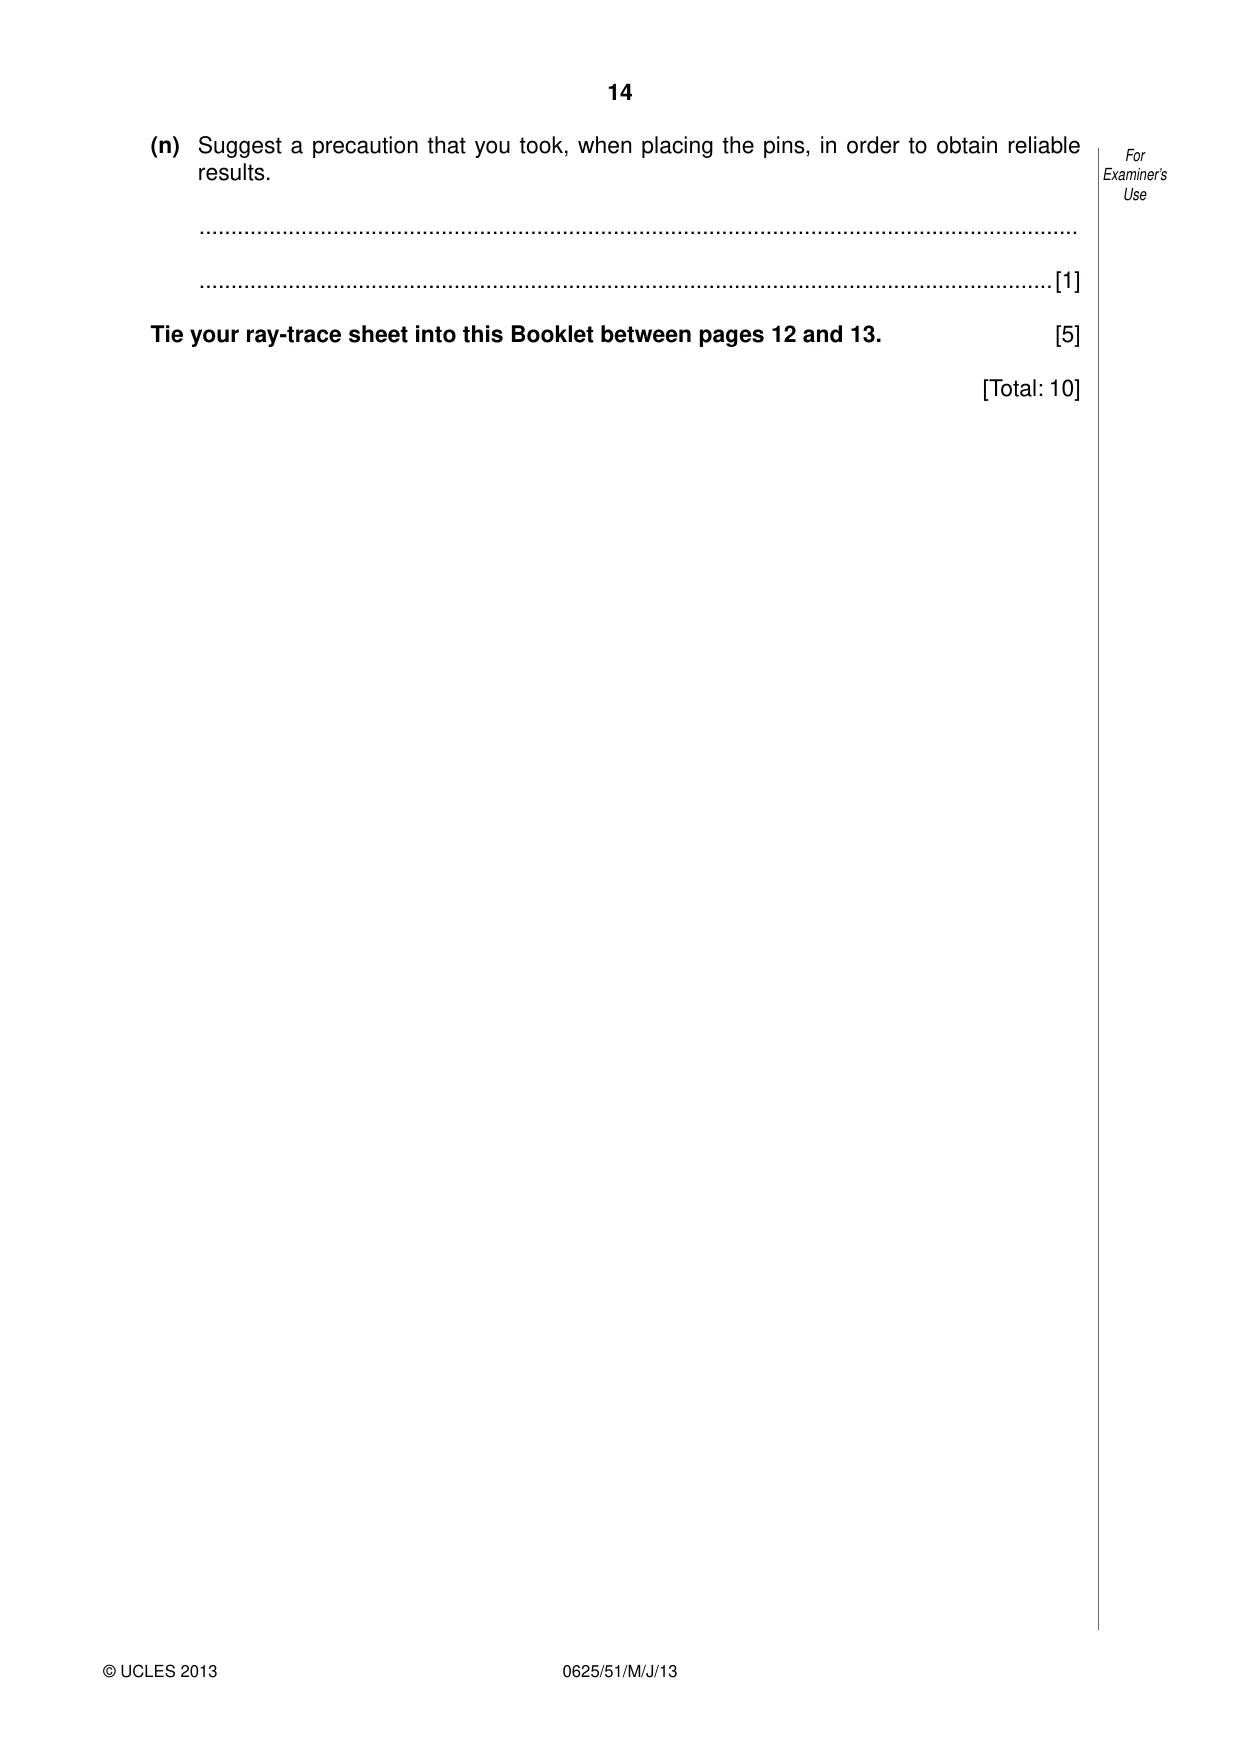

Mark scheme3 pages
Answers below. Sit the paper first if you are practising.
Questions as text
Q1 · The aim of this experiment is to investigate the stability of a block
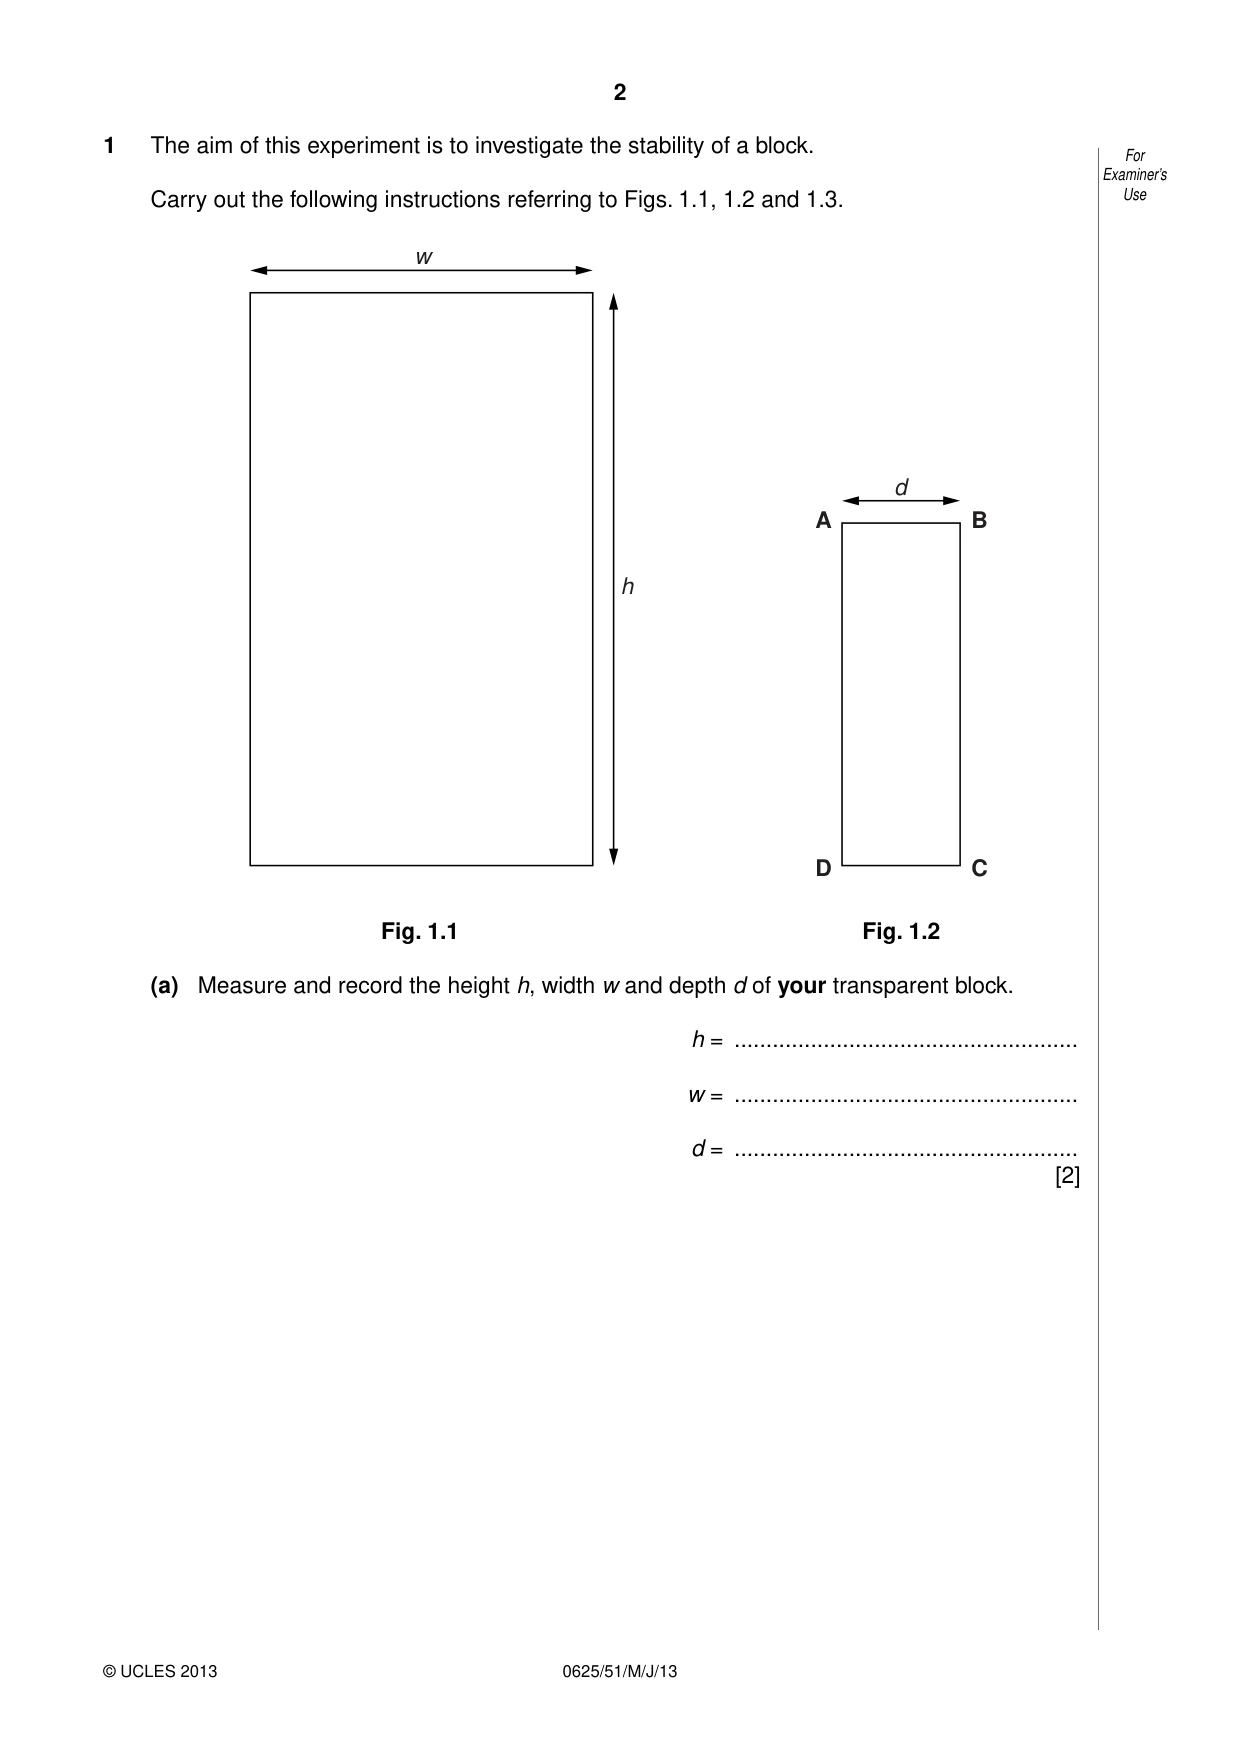
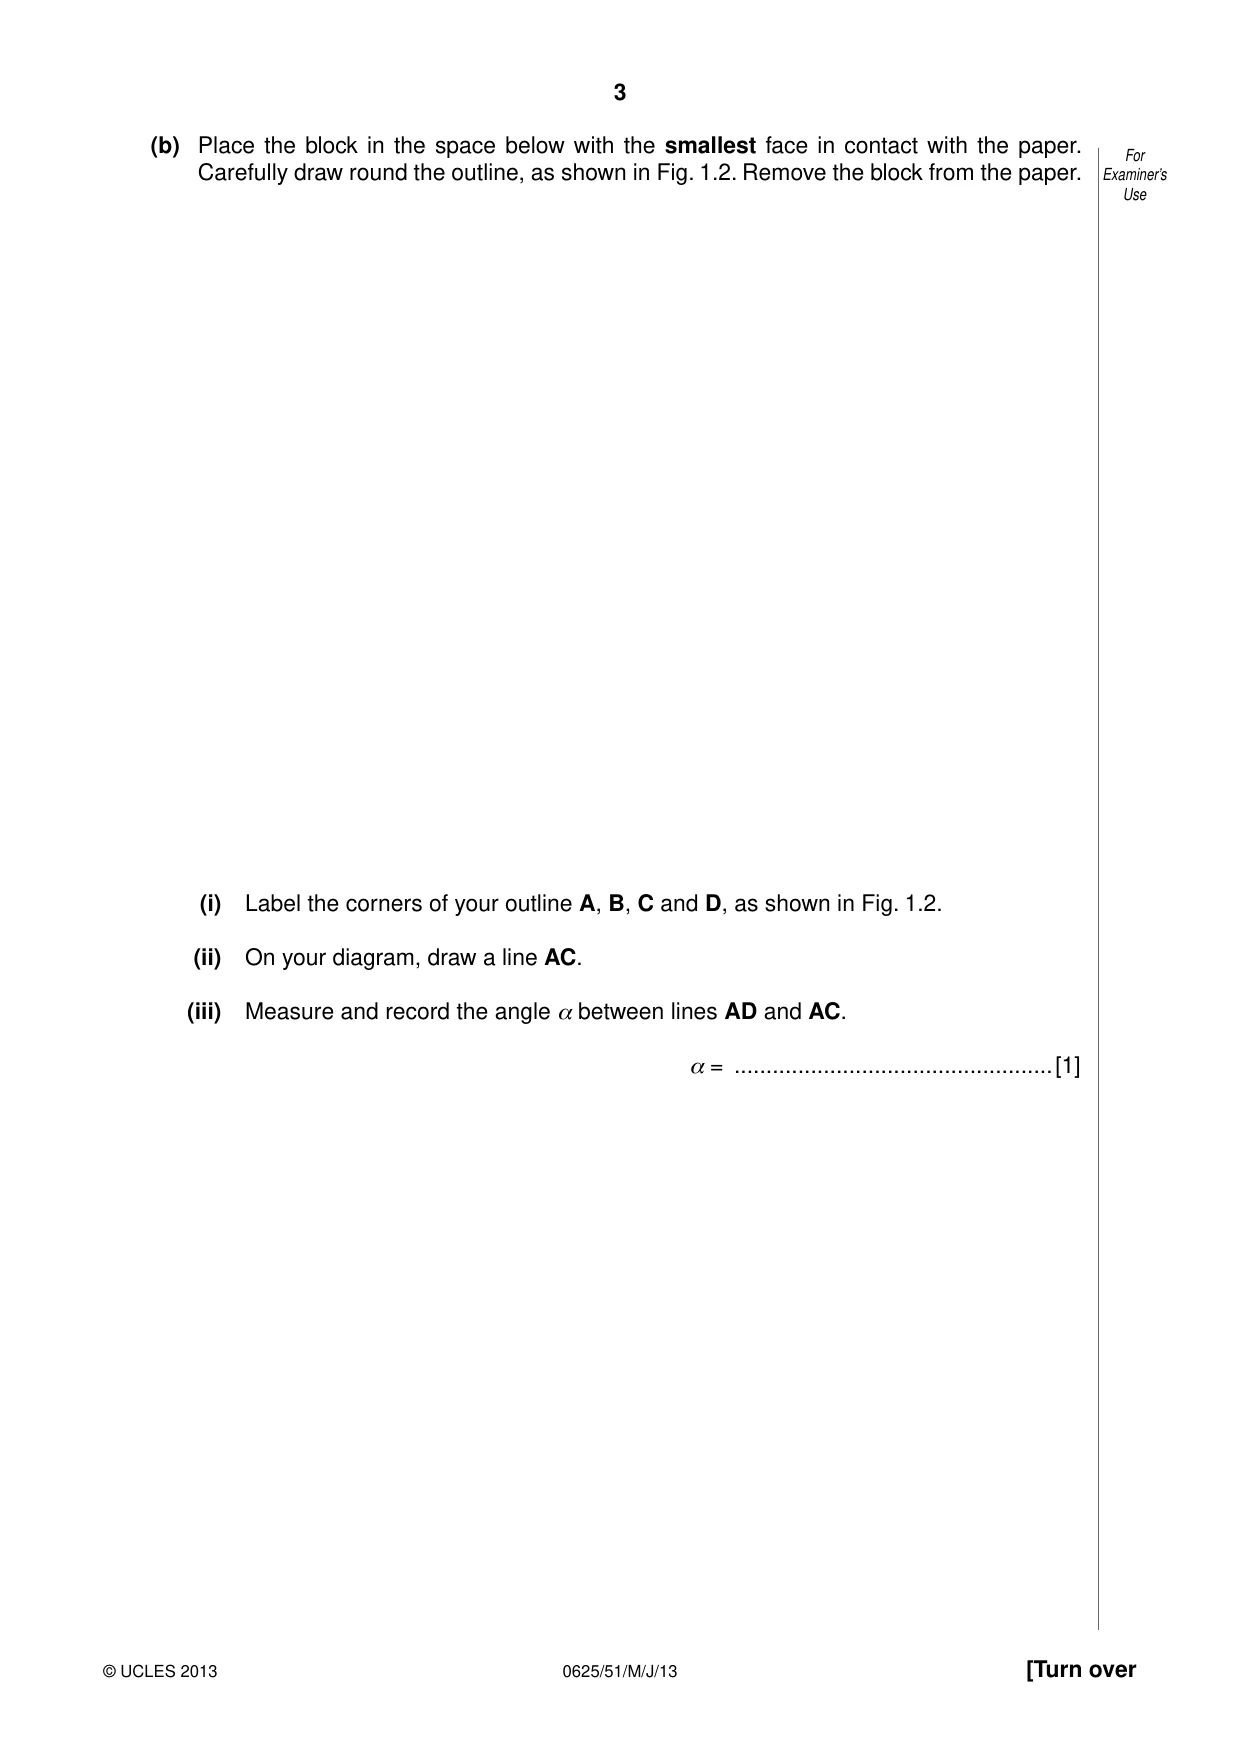
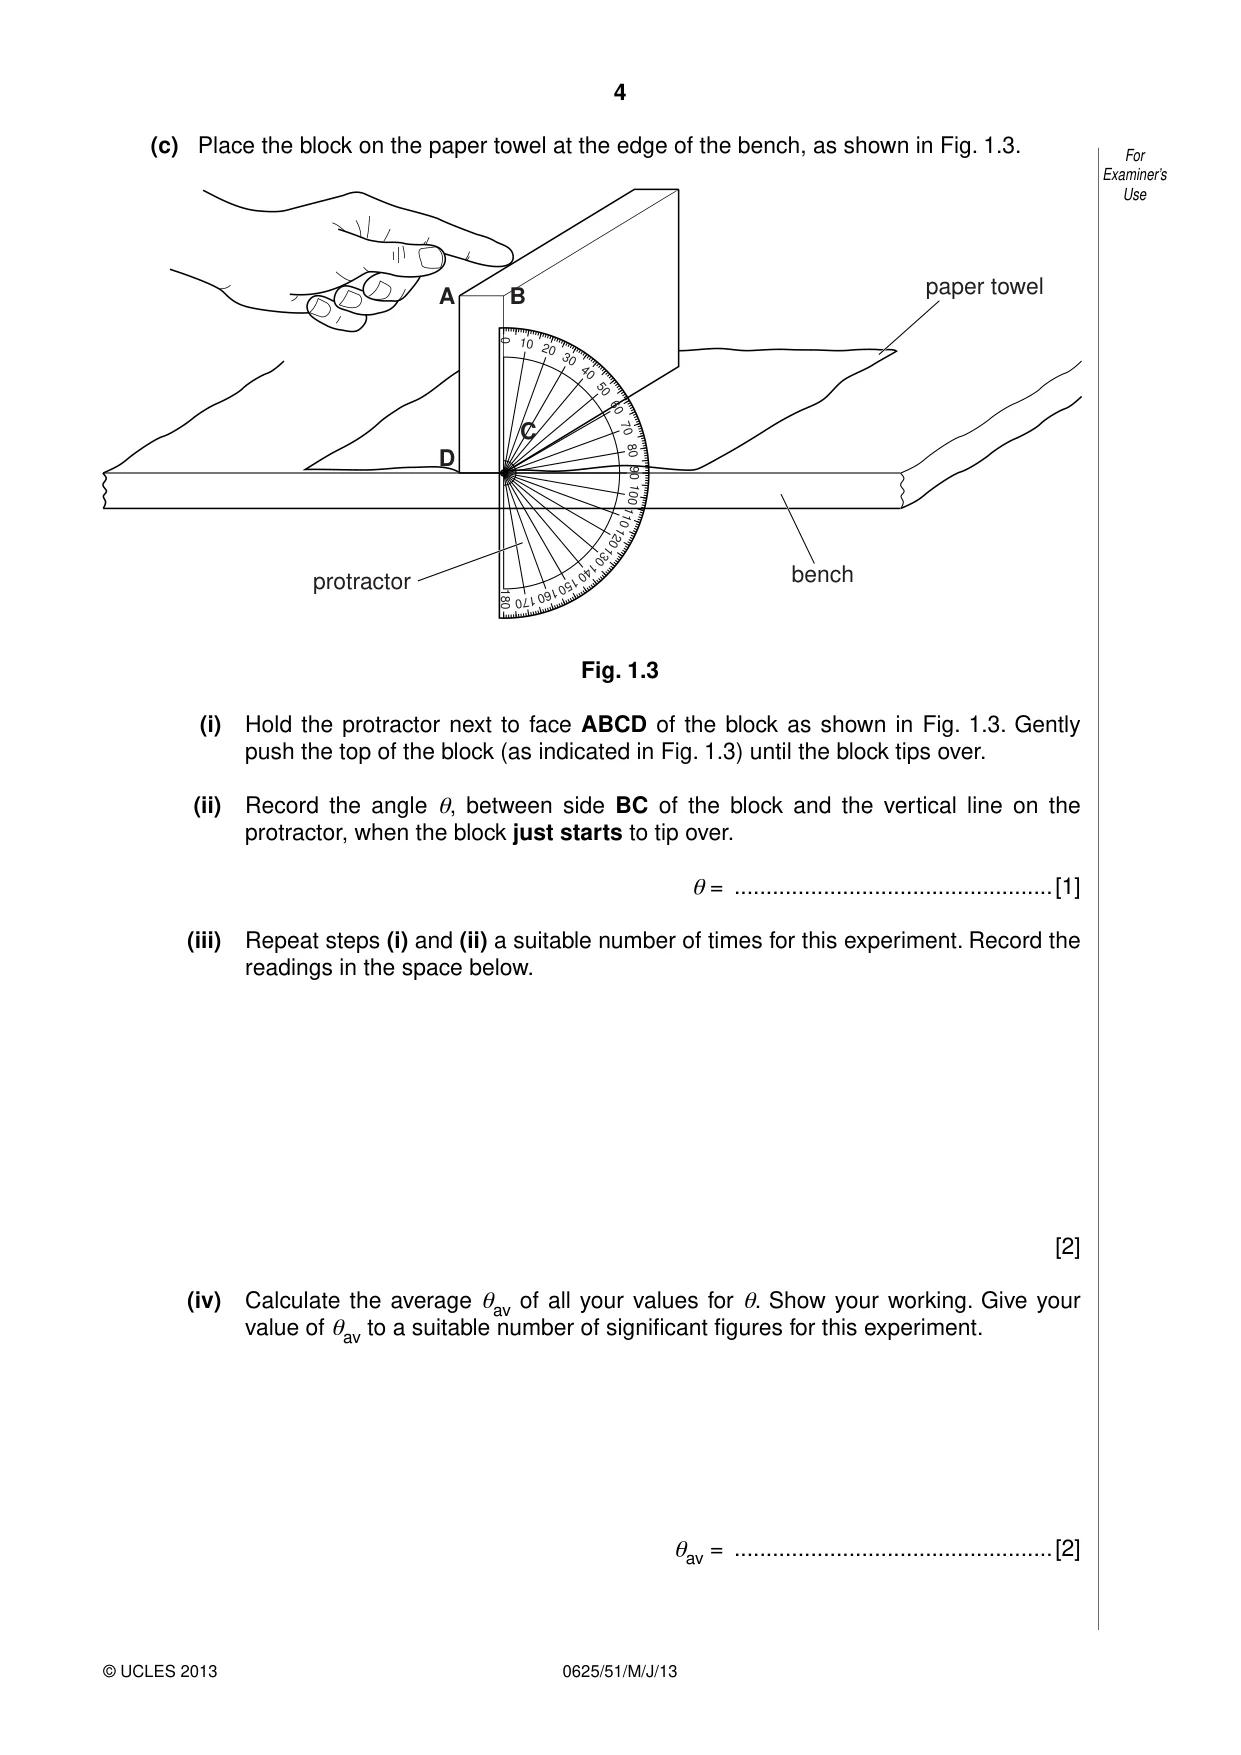
1 The aim of this experiment is to investigate the stability of a block. For Examiner’s Carry out the following instructions referring to Figs. 1.1, 1.2 and 1.3. Use w d A B h D C Fig. 1.1 Fig. 1.2 (a) Measure and record the height h, width w and depth d of your transparent block. h = ...................................................... w = ...................................................... d = ...................................................... [2] (b) Place the block in the space below with the smallest face in contact with the paper. For Carefully draw round the outline, as shown in Fig. 1.2. Remove the block from the paper. Examiner’s Use (i) Label the corners of your outline A, B, C and D, as shown in Fig. 1.2. (ii) On your diagram, draw a line AC. (iii) Measure and record the angle α between lines AD and AC. α = ..................................................[1] (c) Place the block on the paper towel at the edge of the bench, as shown in Fig. 1.3. For Examiner’s Use paper towel A B 0 10 20 30 40 50 60 C 70 D 80 90 100 110 120 130 140 bench protractor 150 180 170160 Fig. 1.3 (i) Hold the protractor next to face ABCD of the block as shown in Fig. 1.3. Gently push the top of the block (as indicated in Fig. 1.3) until the block tips over. (ii) Record the angle θ, between side BC of the block and the vertical line on the protractor, when the block just starts to tip over. θ = ..................................................[1] (iii) Repeat steps (i) and (ii) a suitable number of times for this experiment. Record the readings in the space below. [2] (iv) Calculate the average θav of all your values for θ. Show your working. Give your value of θav to a suitable number of significant figures for this experiment. θav = ..................................................[2] (d) A student suggests that θav should be equal to α. For Examiner’s State whether your results support this suggestion. Justify your statement by reference Use to your results. statement ......................................................................................................................... justification ....................................................................................................................... .......................................................................................................................................... .......................................................................................................................................... [2] [Total: 10]
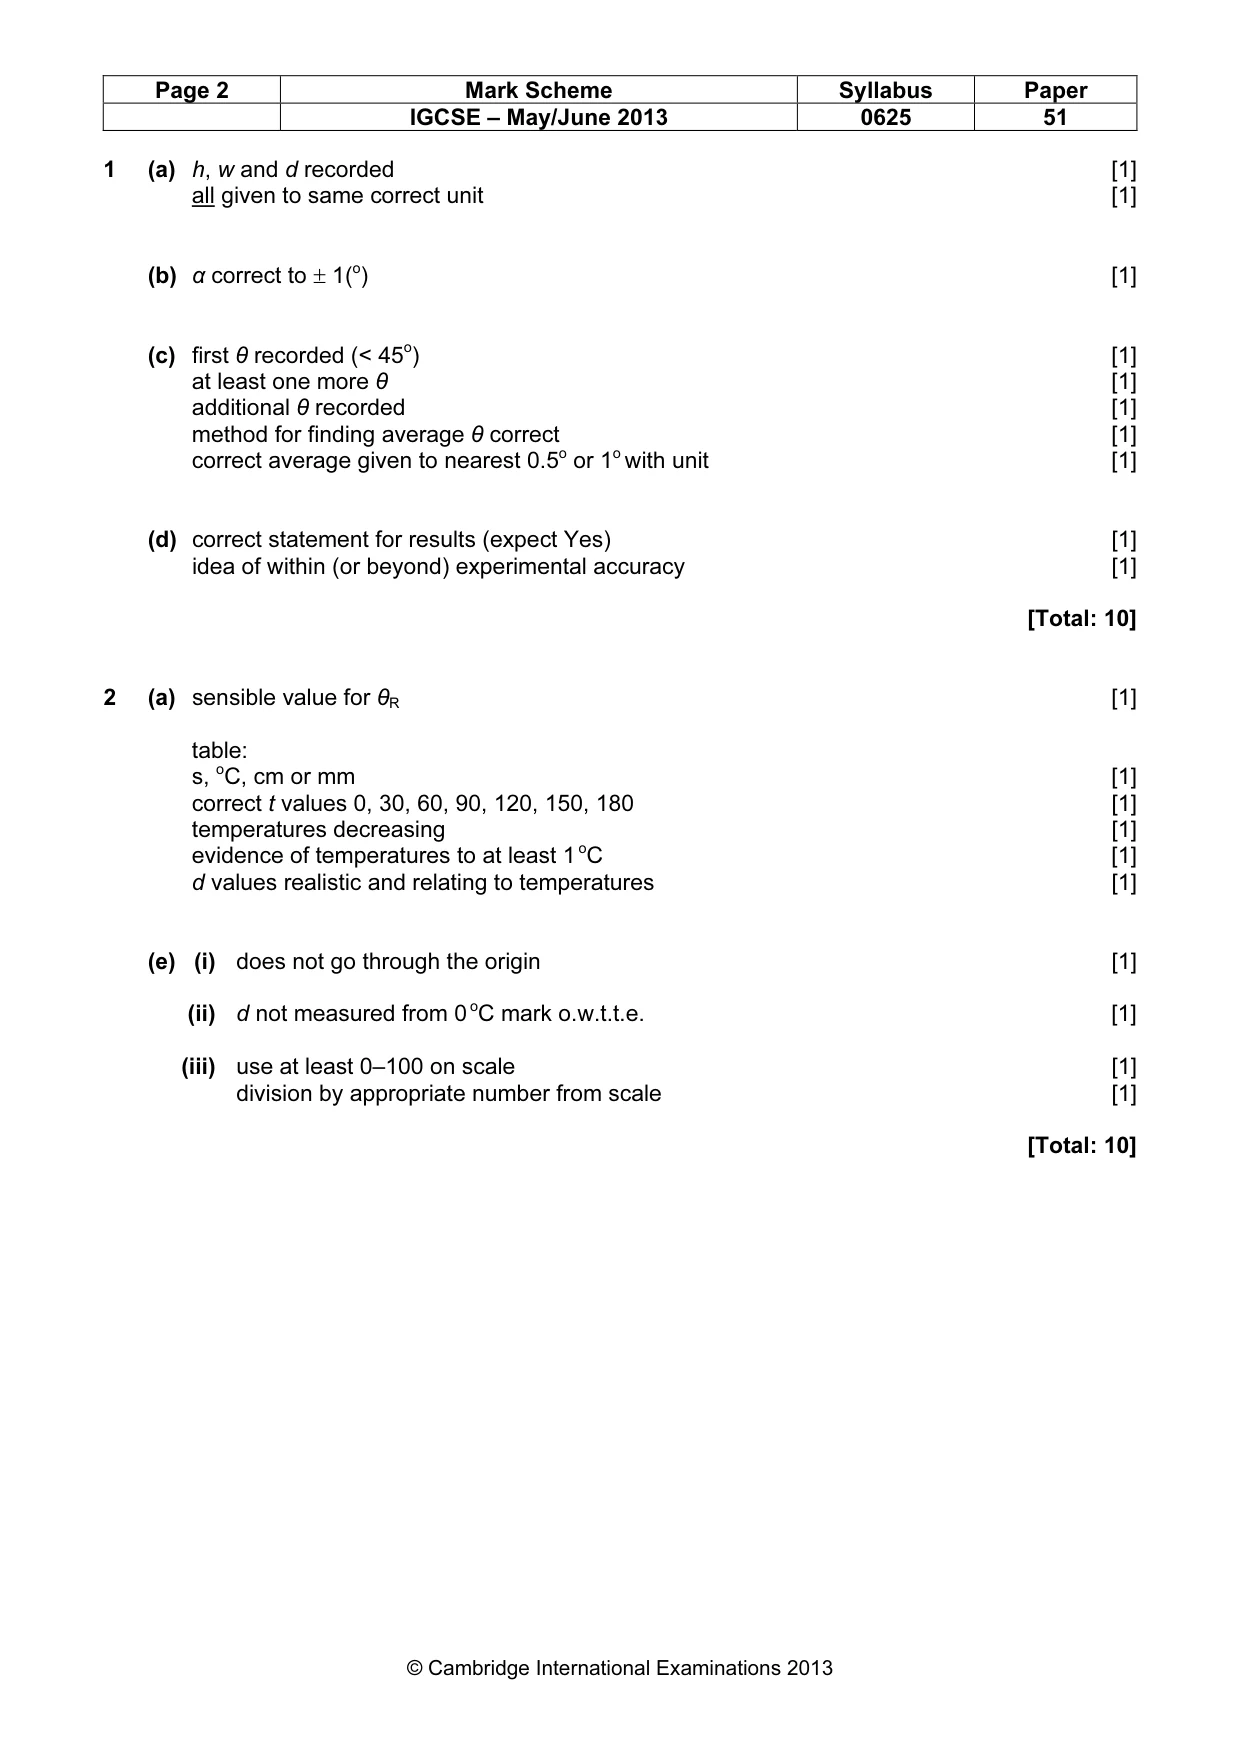
Mark scheme: 1 (a) h, w and d recorded [1] all given to same correct unit [1] (b) α correct to ± 1(o) [1] (c) first θ recorded (< 45o) [1] at least one more θ [1] additional θ recorded [1] method for finding average θ correct [1] correct average given to nearest 0.5o or 1o with unit [1] (d) correct statement for results (expect Yes) [1] idea of within (or beyond) experimental accuracy [1] [Total: 10]
More questions on Physical quantities and measurement techniques
Q2 · In this experiment, you will investigate the scale of a thermometer
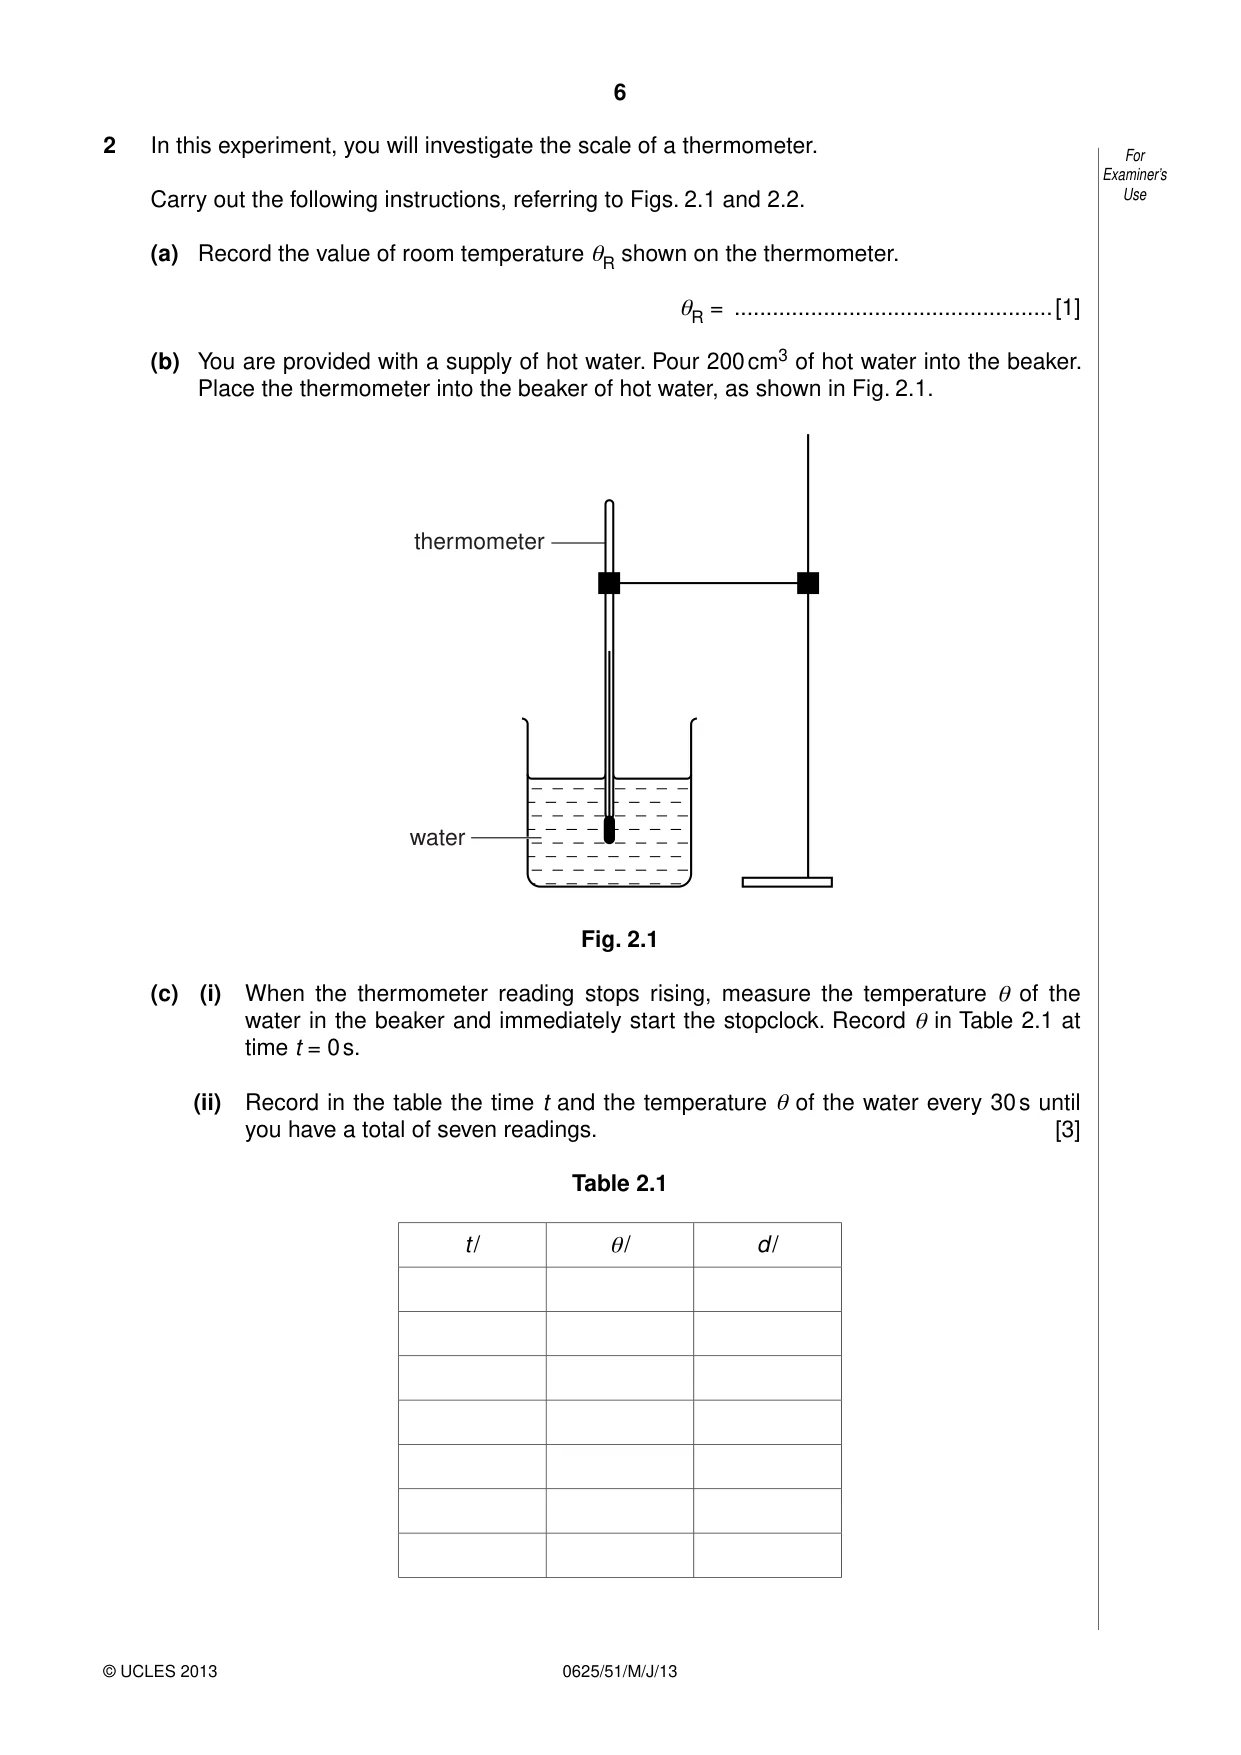
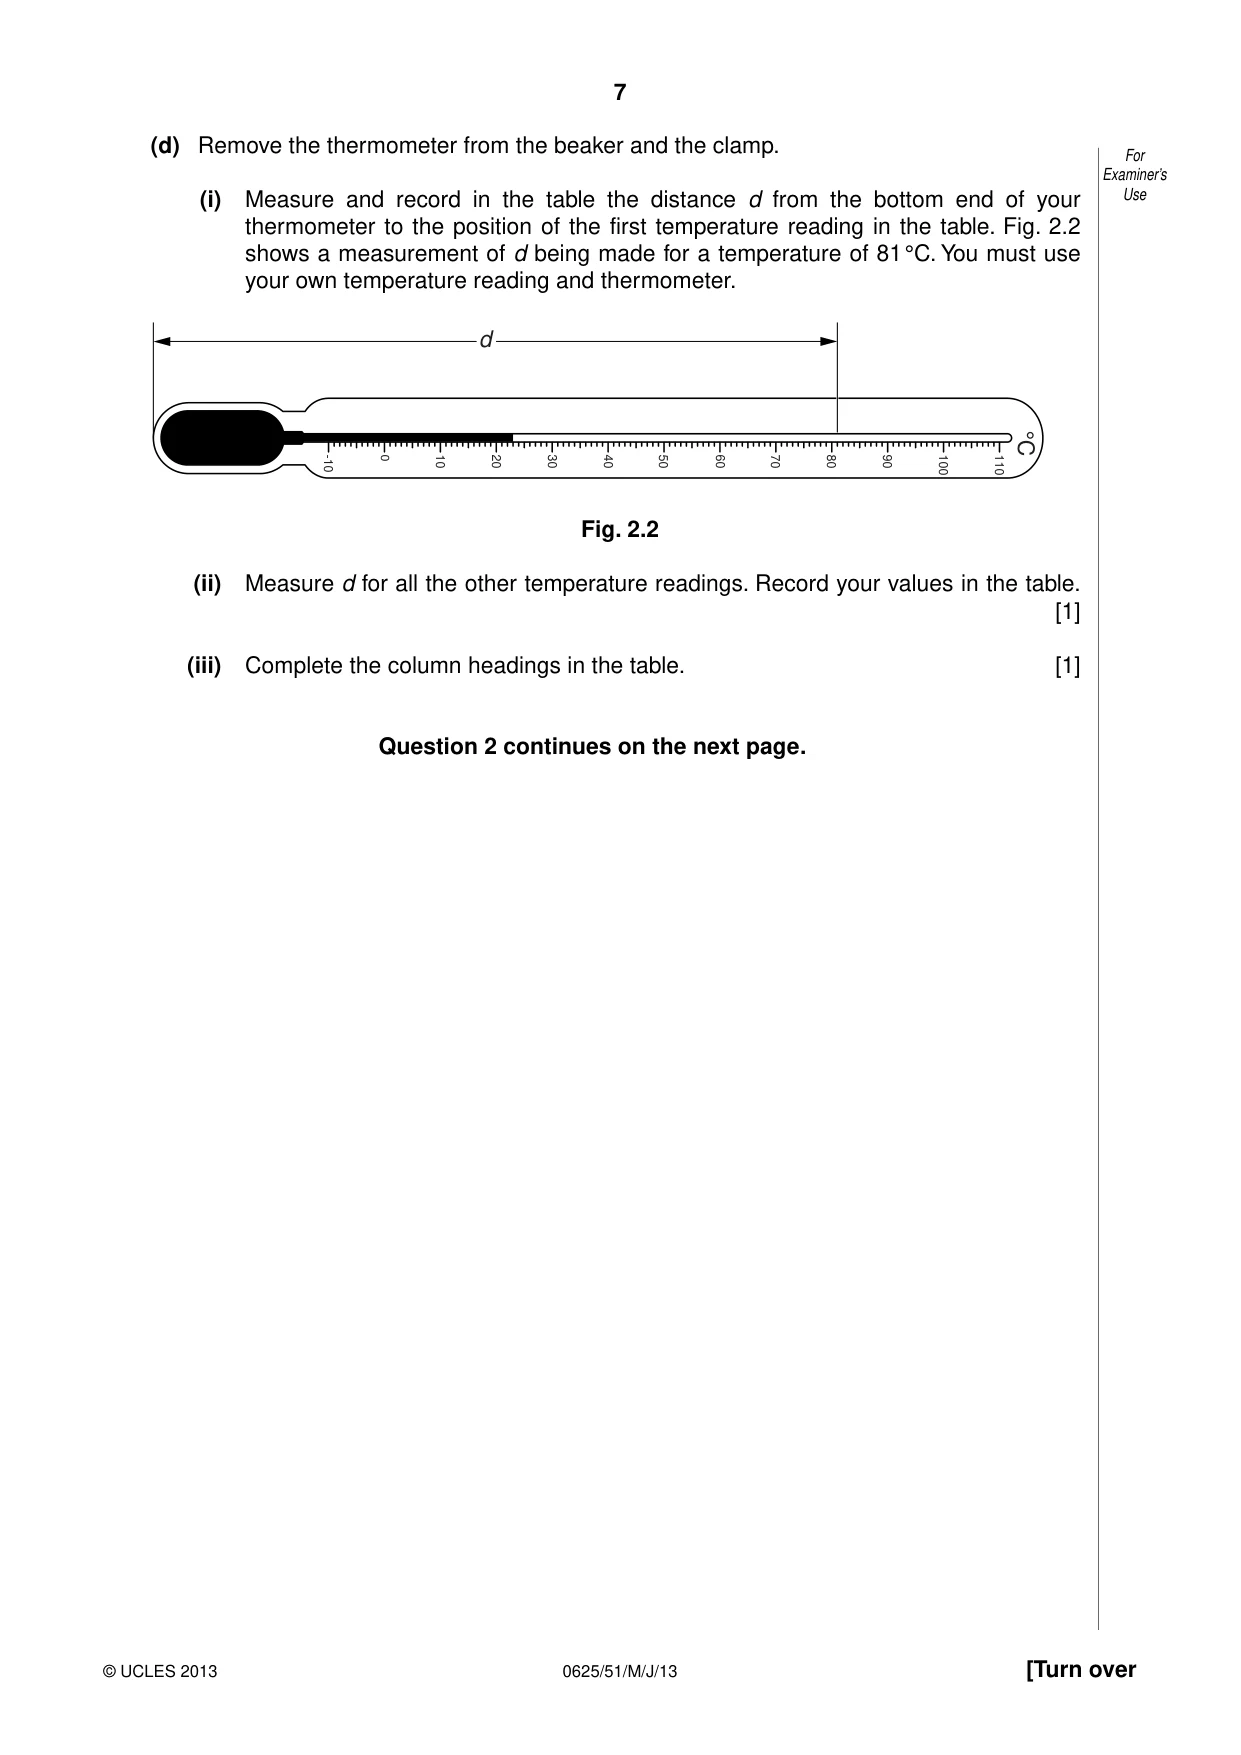
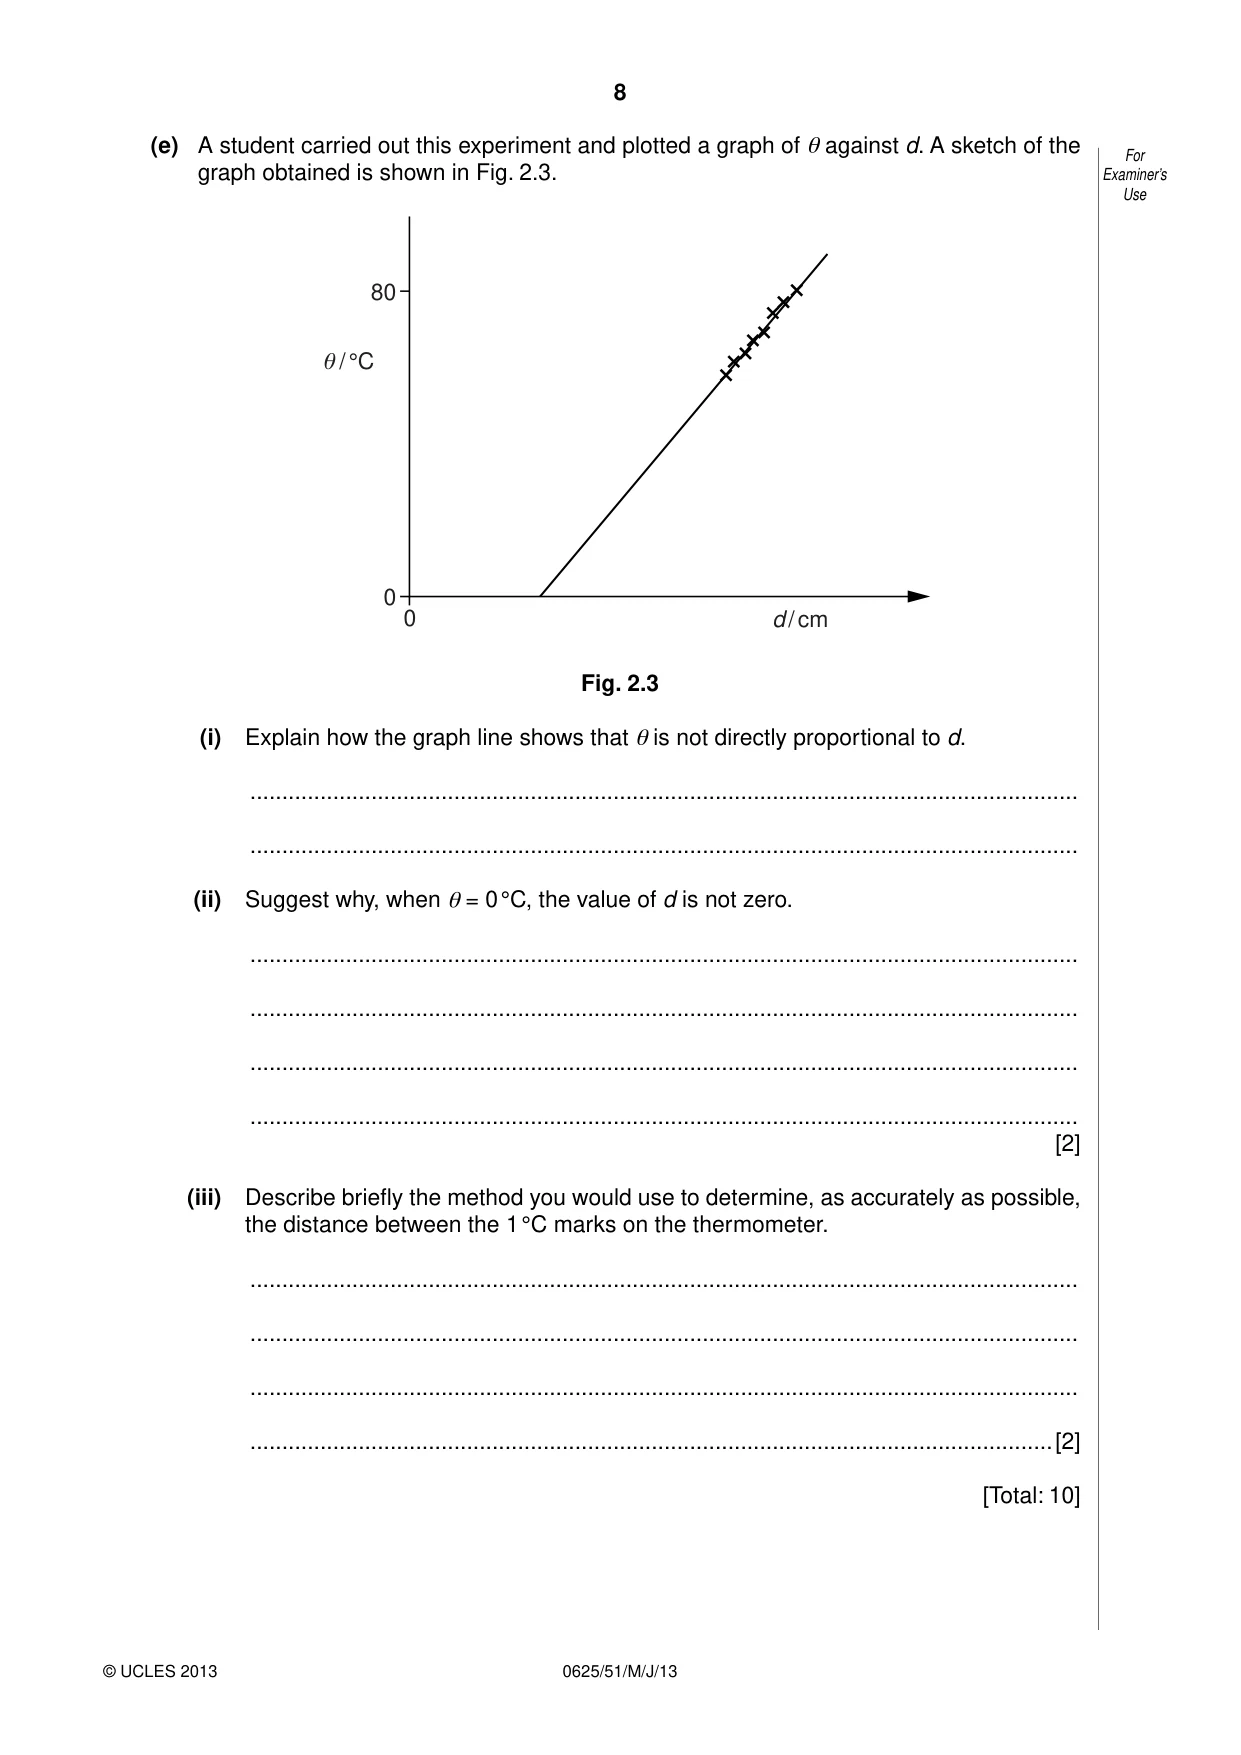
2 In this experiment, you will investigate the scale of a thermometer. For Examiner’s Carry out the following instructions, referring to Figs. 2.1 and 2.2. Use (a) Record the value of room temperature θR shown on the thermometer. θR = ..................................................[1] (b) You are provided with a supply of hot water. Pour 200 cm3 of hot water into the beaker. Place the thermometer into the beaker of hot water, as shown in Fig. 2.1. thermometer water Fig. 2.1 (c) (i) When the thermometer reading stops rising, measure the temperature θ of the water in the beaker and immediately start the stopclock. Record θ in Table 2.1 at time t = 0 s. (ii) Record in the table the time t and the temperature θ of the water every 30 s until you have a total of seven readings. [3] Table 2.1 t / θ/ d / (d) Remove the thermometer from the beaker and the clamp. For Examiner’s (i) Measure and record in the table the distance d from the bottom end of your Use thermometer to the position of the first temperature reading in the table. Fig. 2.2 shows a measurement of d being made for a temperature of 81 °C. You must use your own temperature reading and thermometer. d 0 °C -10 10 20 30 40 50 60 70 80 90 100 110 Fig. 2.2 (ii) Measure d for all the other temperature readings. Record your values in the table. [1] (iii) Complete the column headings in the table. [1] Question 2 continues on the next page. (e) A student carried out this experiment and plotted a graph of θ against d. A sketch of the For graph obtained is shown in Fig. 2.3. Examiner’s Use 80 Ƨ / °C 0 0 d / cm Fig. 2.3 (i) Explain how the graph line shows that θ is not directly proportional to d. .................................................................................................................................. .................................................................................................................................. (ii) Suggest why, when θ = 0 °C, the value of d is not zero. .................................................................................................................................. .................................................................................................................................. .................................................................................................................................. .................................................................................................................................. [2] (iii) Describe briefly the method you would use to determine, as accurately as possible, the distance between the 1 °C marks on the thermometer. .................................................................................................................................. .................................................................................................................................. .................................................................................................................................. ..............................................................................................................................[2] [Total: 10]
Mark scheme: 2 (a) sensible value for θR [1] table: s, oC, cm or mm [1] correct t values 0, 30, 60, 90, 120, 150, 180 [1] temperatures decreasing [1] evidence of temperatures to at least 1 oC [1] d values realistic and relating to temperatures [1] (e) (i) does not go through the origin [1] (ii) d not measured from 0 oC mark o.w.t.t.e. [1] (iii) use at least 0–100 on scale [1] division by appropriate number from scale [1] [Total: 10] IGCSE – May/June 2013 0625 51
More questions on Physical quantities and measurement techniques
Q3 · In this experiment, you will investigate the resistance of a wire
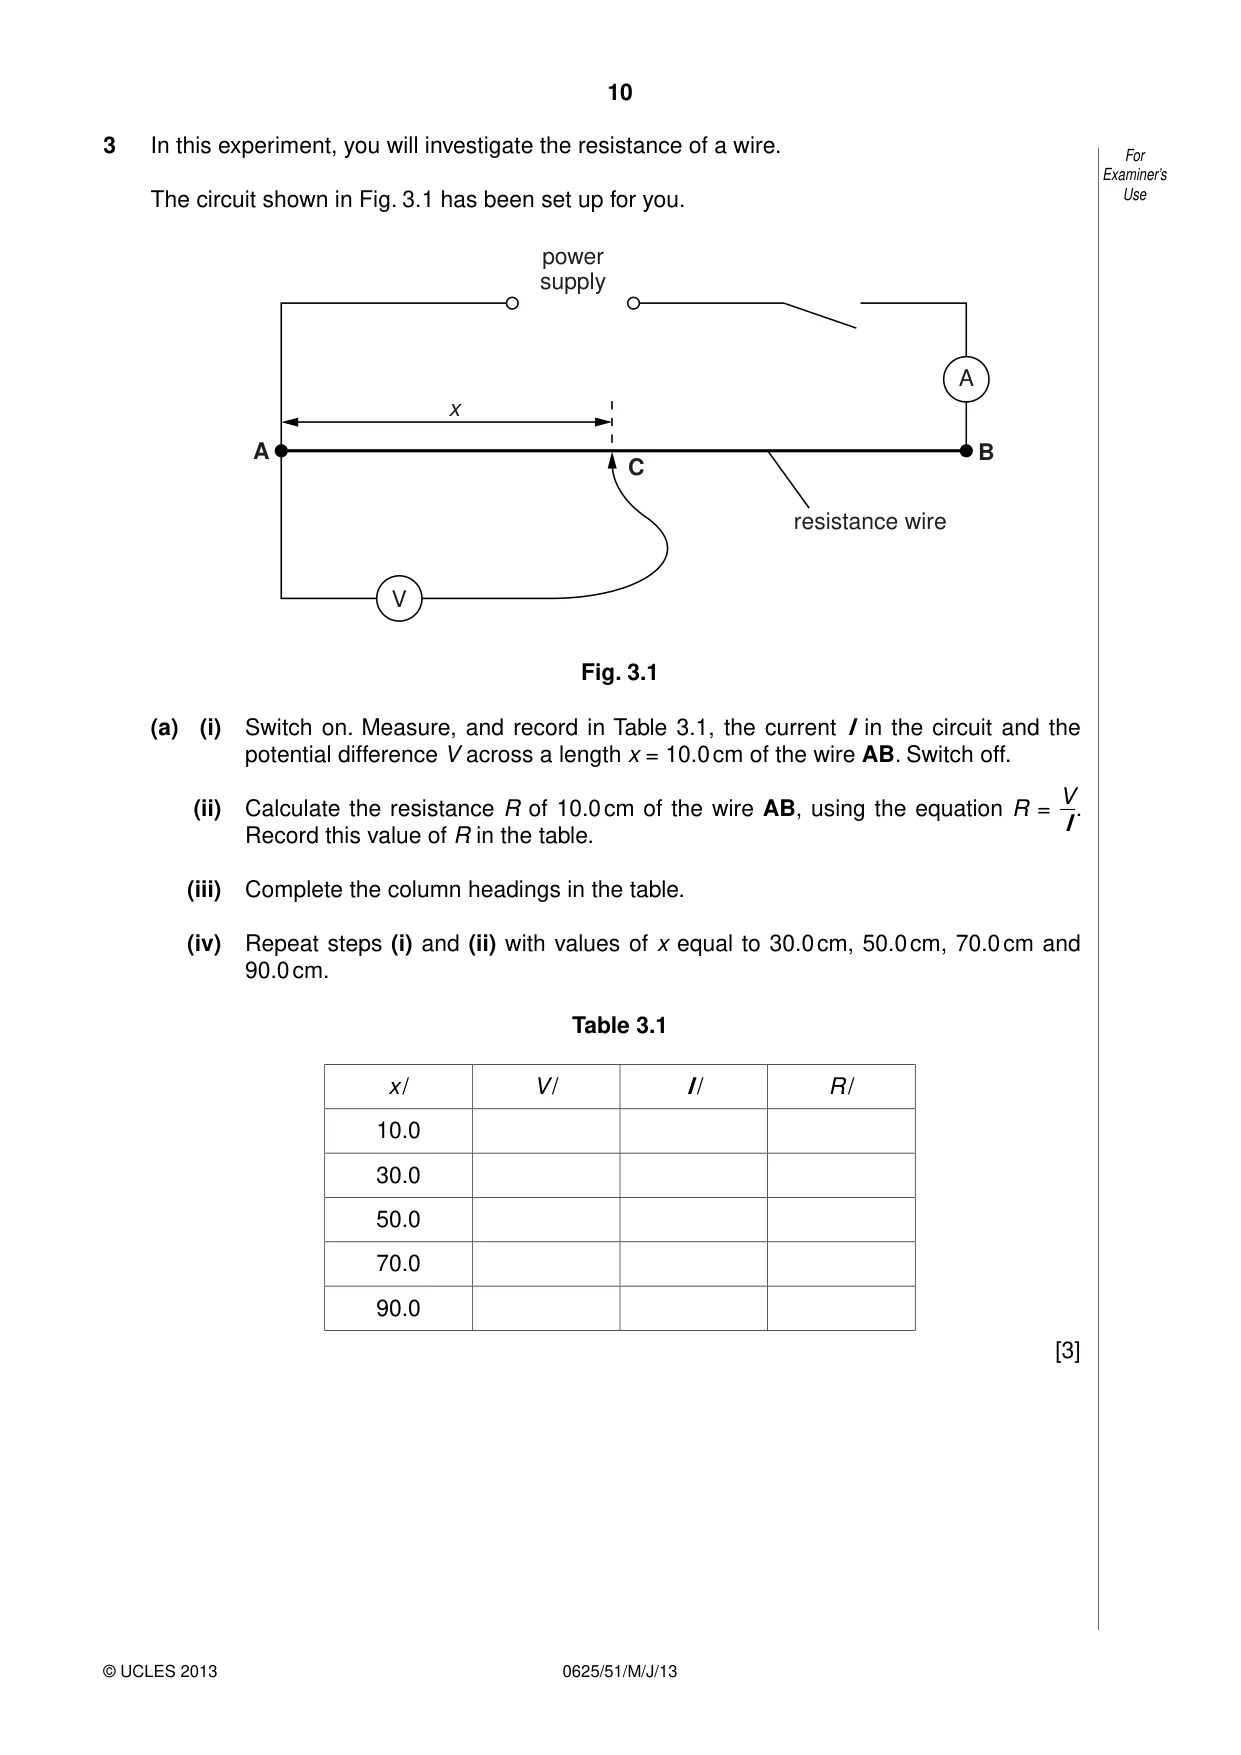
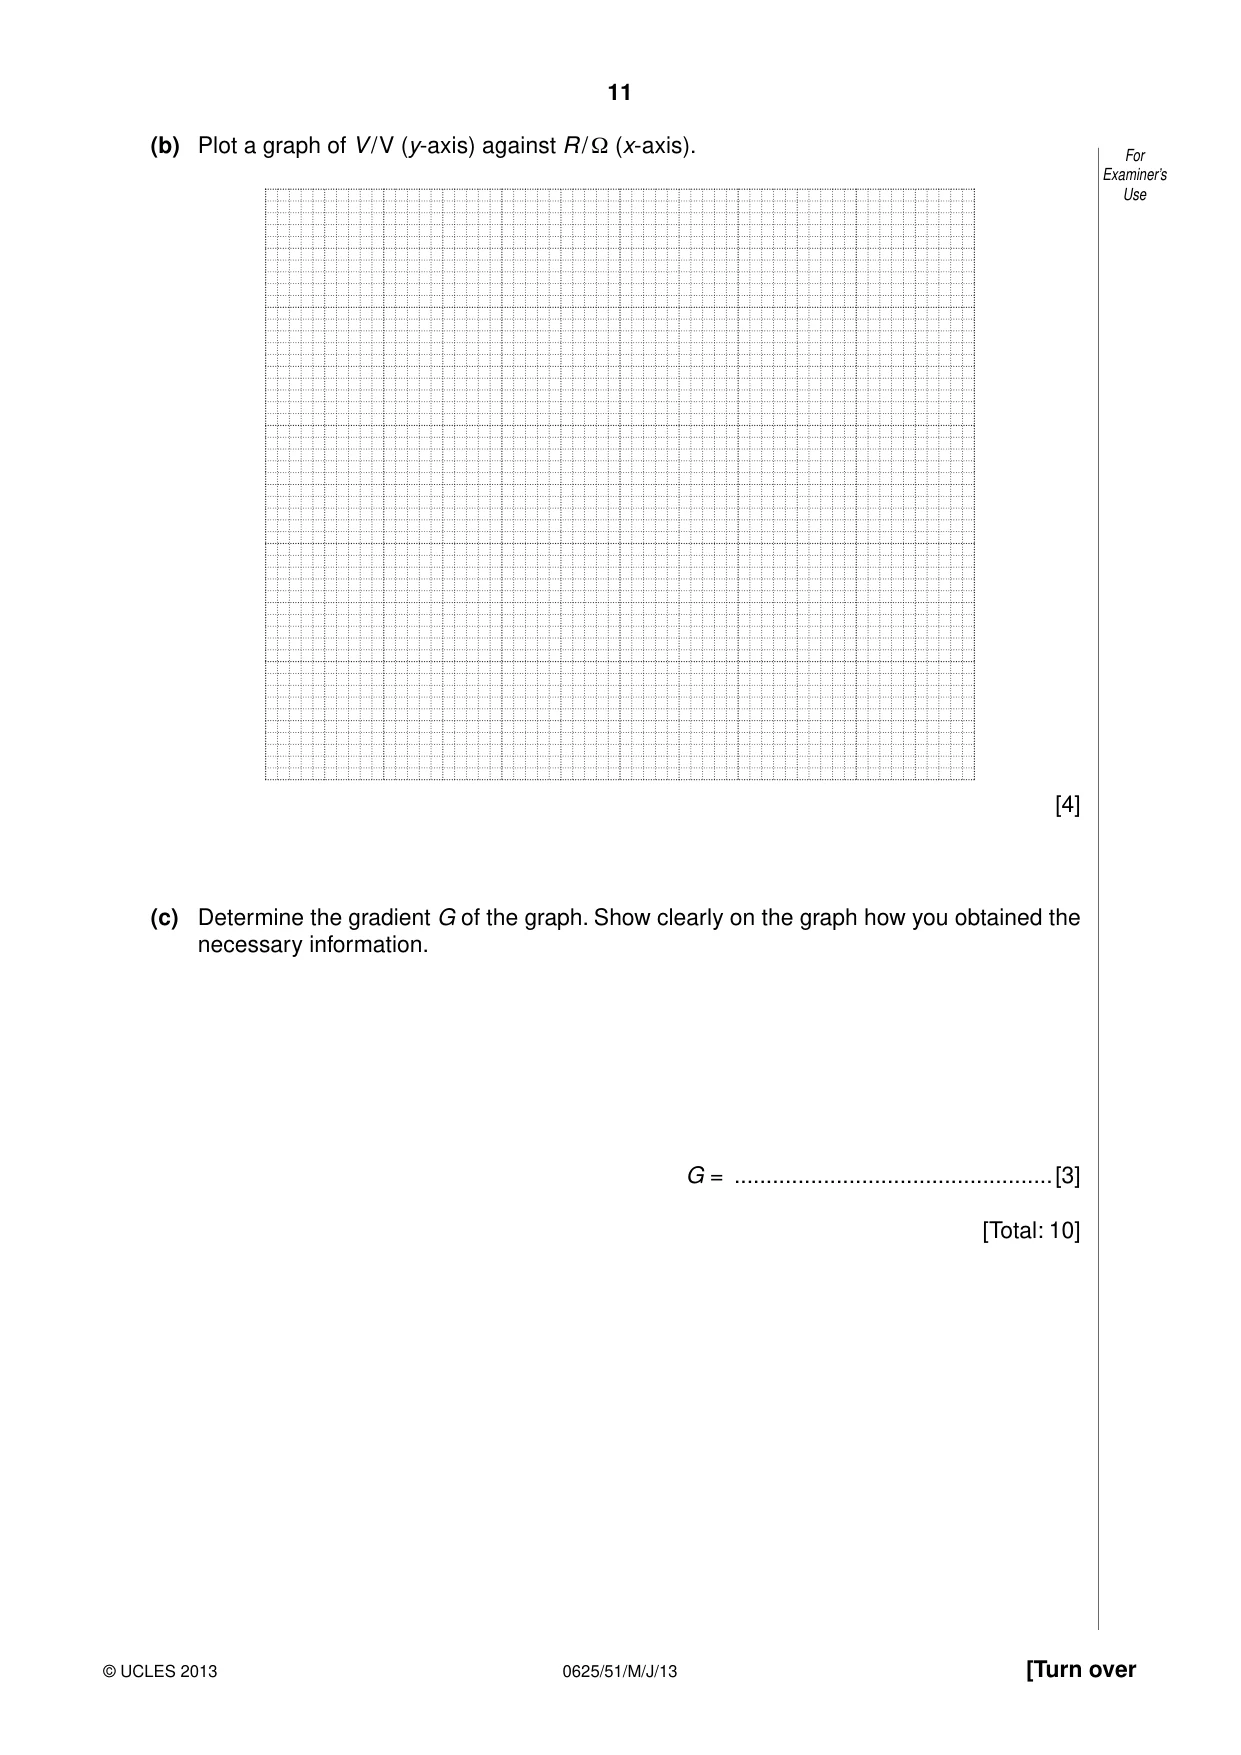
3 In this experiment, you will investigate the resistance of a wire. For Examiner’s The circuit shown in Fig. 3.1 has been set up for you. Use power supply A x A B C resistance wire V Fig. 3.1 (a) (i) Switch on. Measure, and record in Table 3.1, the current I in the circuit and the potential difference V across a length x = 10.0 cm of the wire AB. Switch off. V (ii) Calculate the resistance R of 10.0 cm of the wire AB, using the equation R = I. Record this value of R in the table. (iii) Complete the column headings in the table. (iv) Repeat steps (i) and (ii) with values of x equal to 30.0 cm, 50.0 cm, 70.0 cm and 90.0 cm. Table 3.1 x / V / I / R / 10.0 30.0 50.0 70.0 90.0 [3] (b) Plot a graph of V / V (y-axis) against R / Ω (x-axis). For Examiner’s Use [4] (c) Determine the gradient G of the graph. Show clearly on the graph how you obtained the necessary information. G = ..................................................[3] [Total: 10]
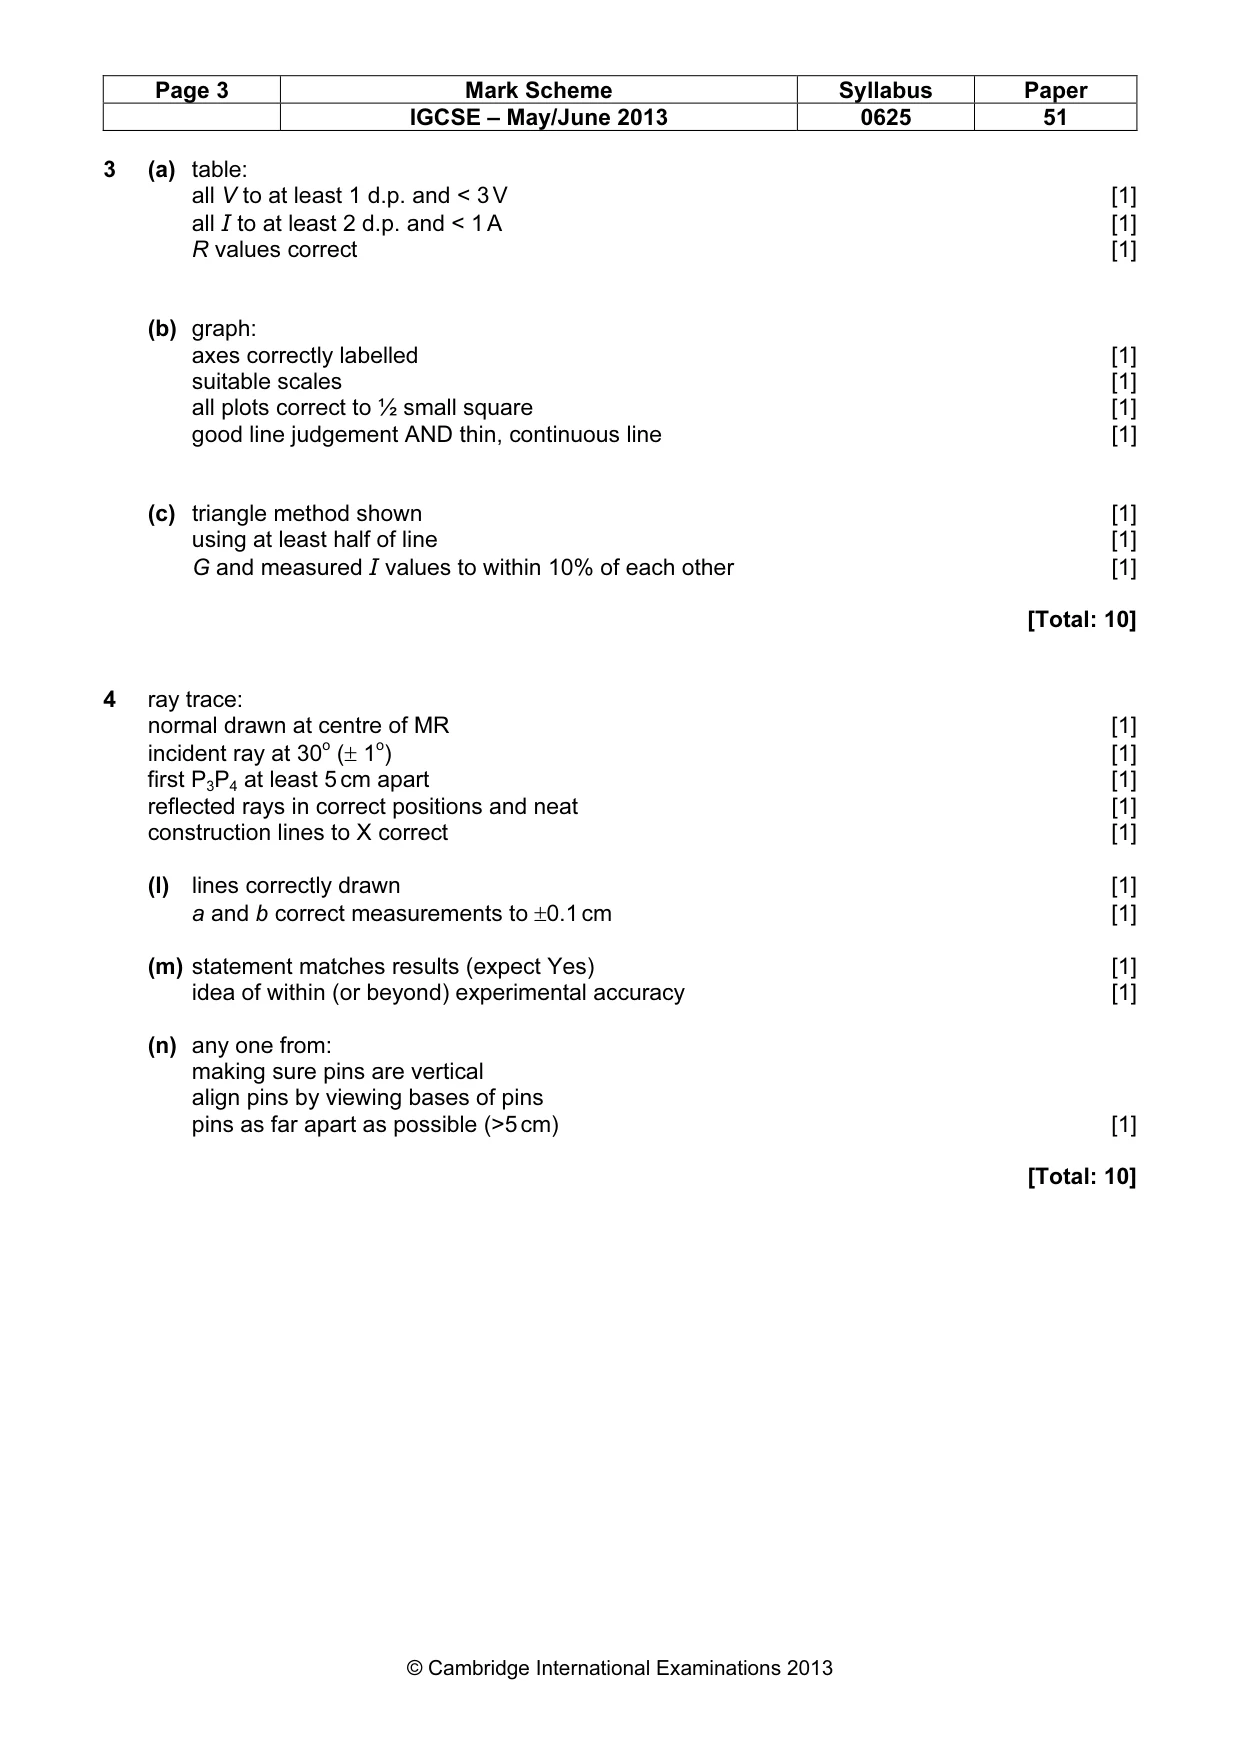
Mark scheme: 3 (a) table: all V to at least 1 d.p. and < 3 V [1] all I to at least 2 d.p. and < 1 A [1] R values correct [1] (b) graph: axes correctly labelled [1] suitable scales [1] all plots correct to ½ small square [1] good line judgement AND thin, continuous line [1] (c) triangle method shown [1] using at least half of line [1] G and measured I values to within 10% of each other [1] [Total: 10]
Q4 · In this experiment, you will investigate the position of the image in a plane mirror
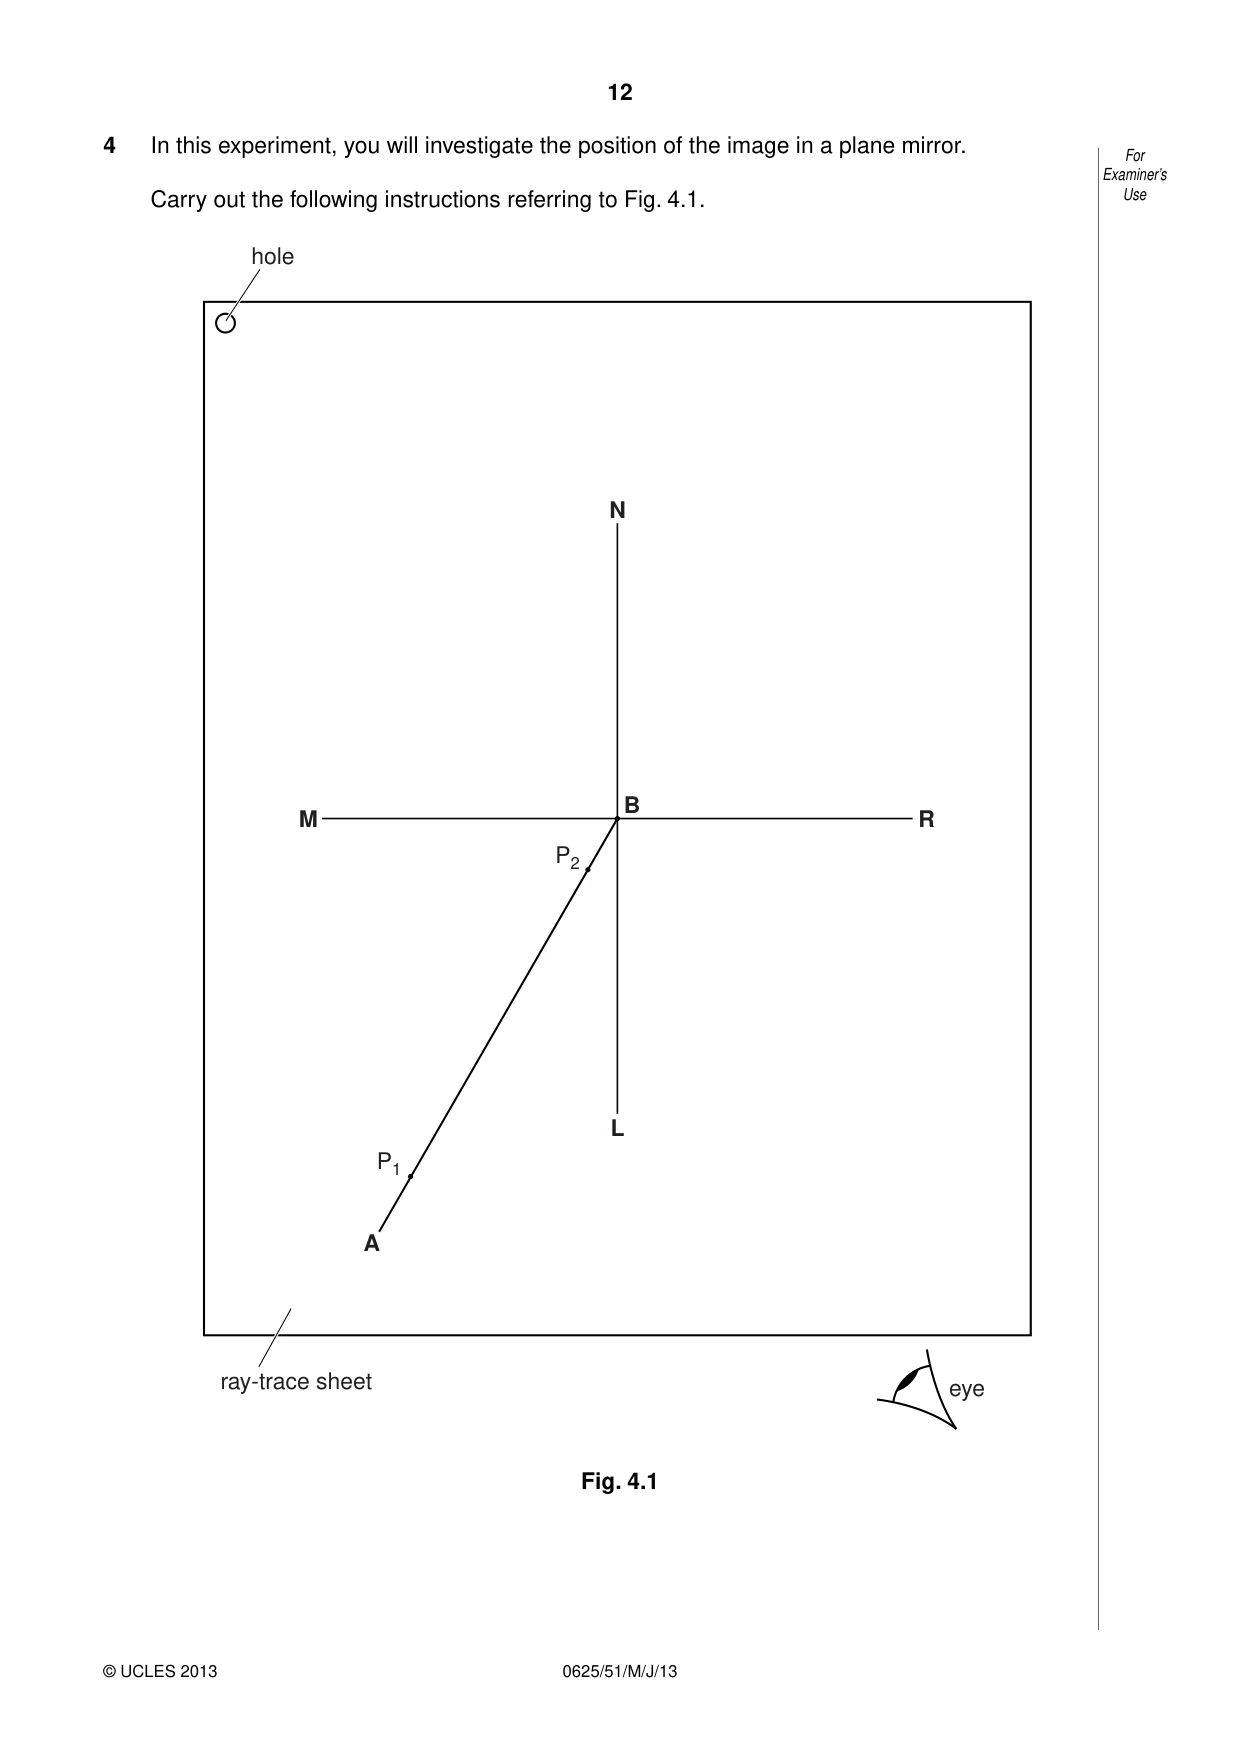
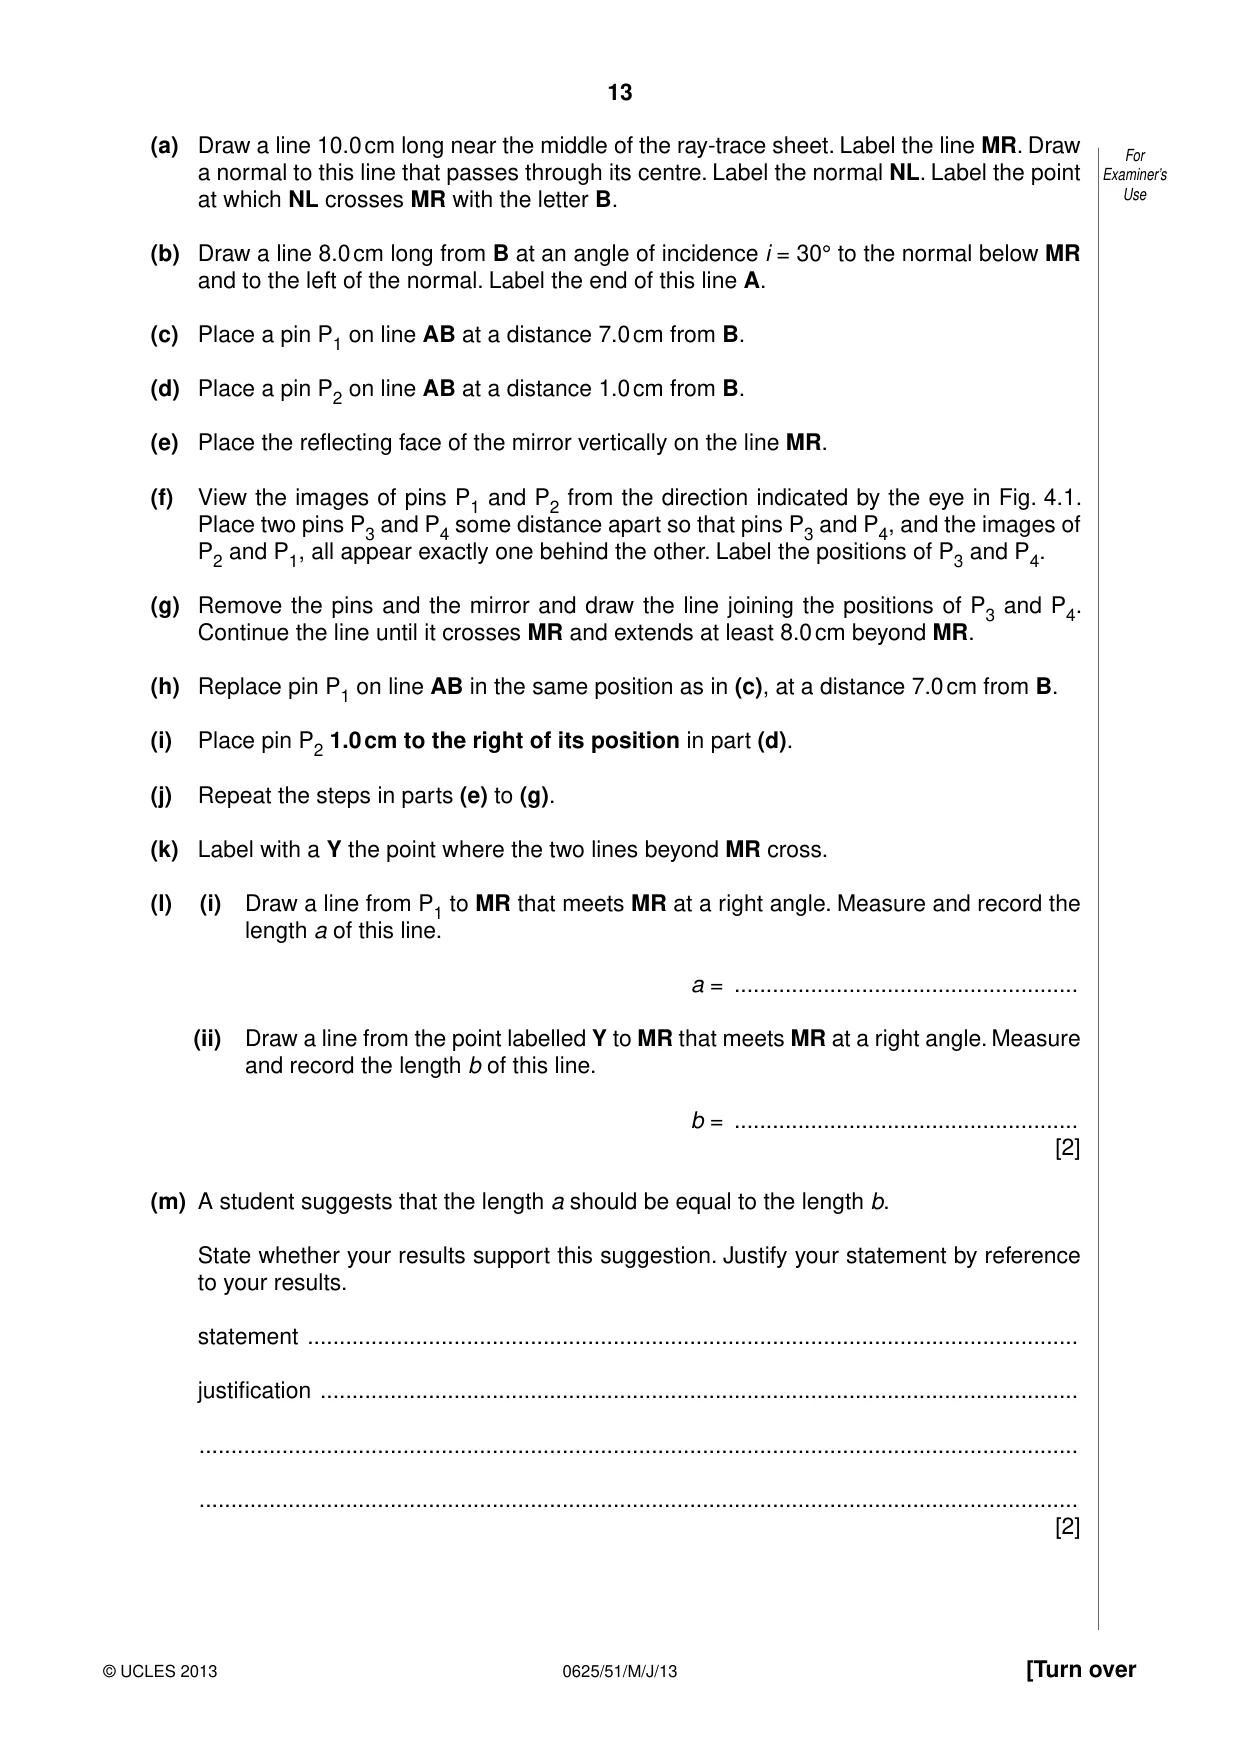
4 In this experiment, you will investigate the position of the image in a plane mirror. For Examiner’s Carry out the following instructions referring to Fig. 4.1. Use hole N B M R P2 L P1 A ray-trace sheet eye Fig. 4.1 (a) Draw a line 10.0 cm long near the middle of the ray-trace sheet. Label the line MR. Draw For a normal to this line that passes through its centre. Label the normal NL. Label the point Examiner’s at which NL crosses MR with the letter B. Use (b) Draw a line 8.0 cm long from B at an angle of incidence i = 30° to the normal below MR and to the left of the normal. Label the end of this line A. (c) Place a pin P1 on line AB at a distance 7.0 cm from B. (d) Place a pin P2 on line AB at a distance 1.0 cm from B. (e) Place the reflecting face of the mirror vertically on the line MR. (f) View the images of pins P1 and P2 from the direction indicated by the eye in Fig. 4.1. Place two pins P3 and P4 some distance apart so that pins P3 and P4, and the images of P2 and P1, all appear exactly one behind the other. Label the positions of P3 and P4. (g) Remove the pins and the mirror and draw the line joining the positions of P3 and P4. Continue the line until it crosses MR and extends at least 8.0 cm beyond MR. (h) Replace pin P1 on line AB in the same position as in (c), at a distance 7.0 cm from B. (i) Place pin P2 1.0 cm to the right of its position in part (d). (j) Repeat the steps in parts (e) to (g). (k) Label with a Y the point where the two lines beyond MR cross. (l) (i) Draw a line from P1 to MR that meets MR at a right angle. Measure and record the length a of this line. a = ...................................................... (ii) Draw a line from the point labelled Y to MR that meets MR at a right angle. Measure and record the length b of this line. b = ...................................................... [2] (m) A student suggests that the length a should be equal to the length b. State whether your results support this suggestion. Justify your statement by reference to your results. statement ......................................................................................................................... justification ....................................................................................................................... .......................................................................................................................................... .......................................................................................................................................... [2] (n) Suggest a precaution that you took, when placing the pins, in order to obtain reliable For results. Examiner’s Use .......................................................................................................................................... ......................................................................................................................................[1] Tie your ray-trace sheet into this Booklet between pages 12 and 13. [5] [Total: 10]
Mark scheme: 4 ray trace: normal drawn at centre of MR [1] incident ray at 30o (± 1o) [1] first P3P4 at least 5 cm apart [1] reflected rays in correct positions and neat [1] construction lines to X correct [1] (l) lines correctly drawn [1] a and b correct measurements to ±0.1 cm [1] (m) statement matches results (expect Yes) [1] idea of within (or beyond) experimental accuracy [1] (n) any one from: making sure pins are vertical align pins by viewing bases of pins pins as far apart as possible (>5 cm) [1] [Total: 10]
What was in this paper
The subtopics covered by these 4 questions, and how many questions each got. Open one in a new tab to see every Cambridge question on it.
What you needed in this session
Cambridge’s own grade thresholds for 2013 May/June, Paper 5 · Variant 1. A higher threshold means an easier paper — the bar moves with how the cohort did.