Cambridge IGCSE Physics 0625 — 2010 May/June Paper 5 · Variant 2
0625/52/M/J/10 · 4 questions · 40 marks · ≈45 min
The question paper and its mark scheme, free to read here and free to download. This is Cambridge’s own paper, exactly as it was sat.
Question paper12 pages


Mark scheme3 pages
Answers below. Sit the paper first if you are practising.
Questions as text
Q1 · In this experiment, you are to determine the mass of a load using a balancing method
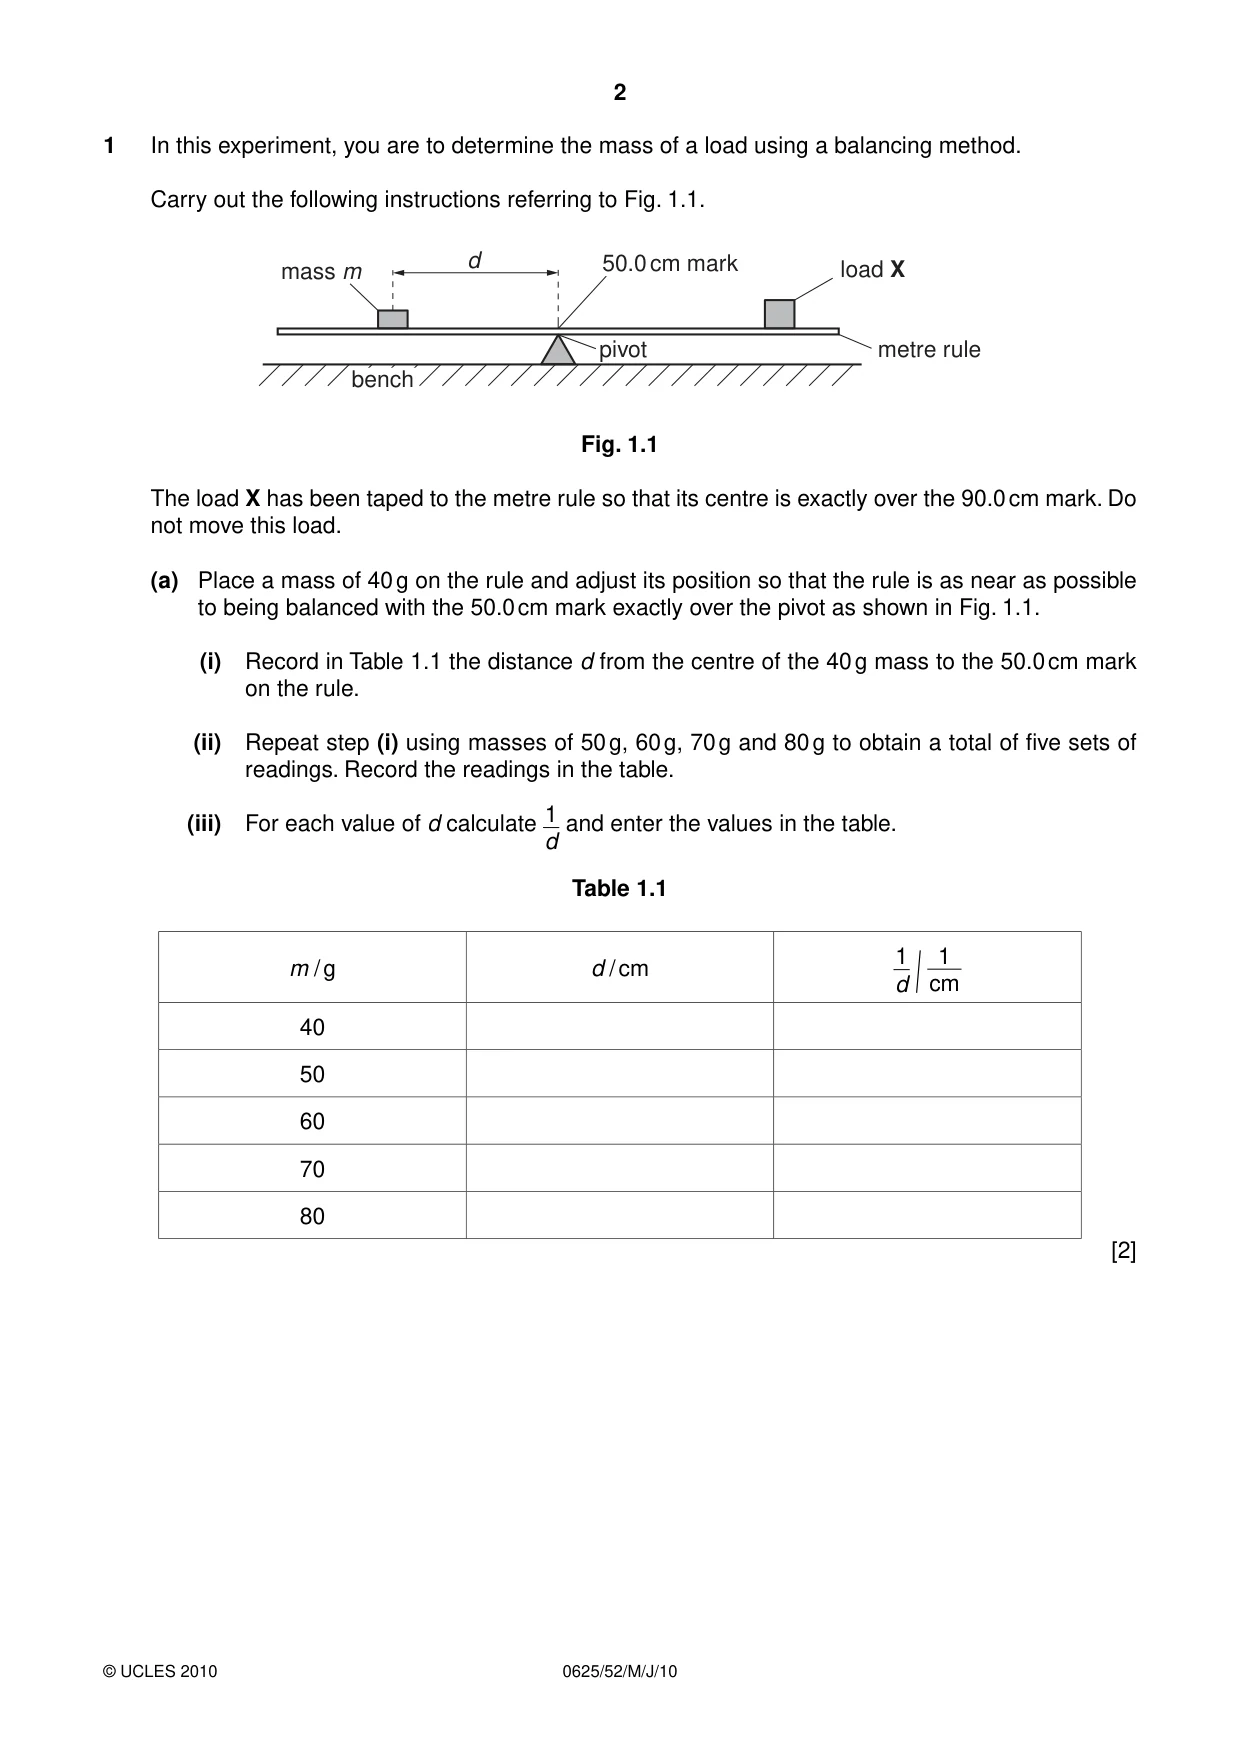
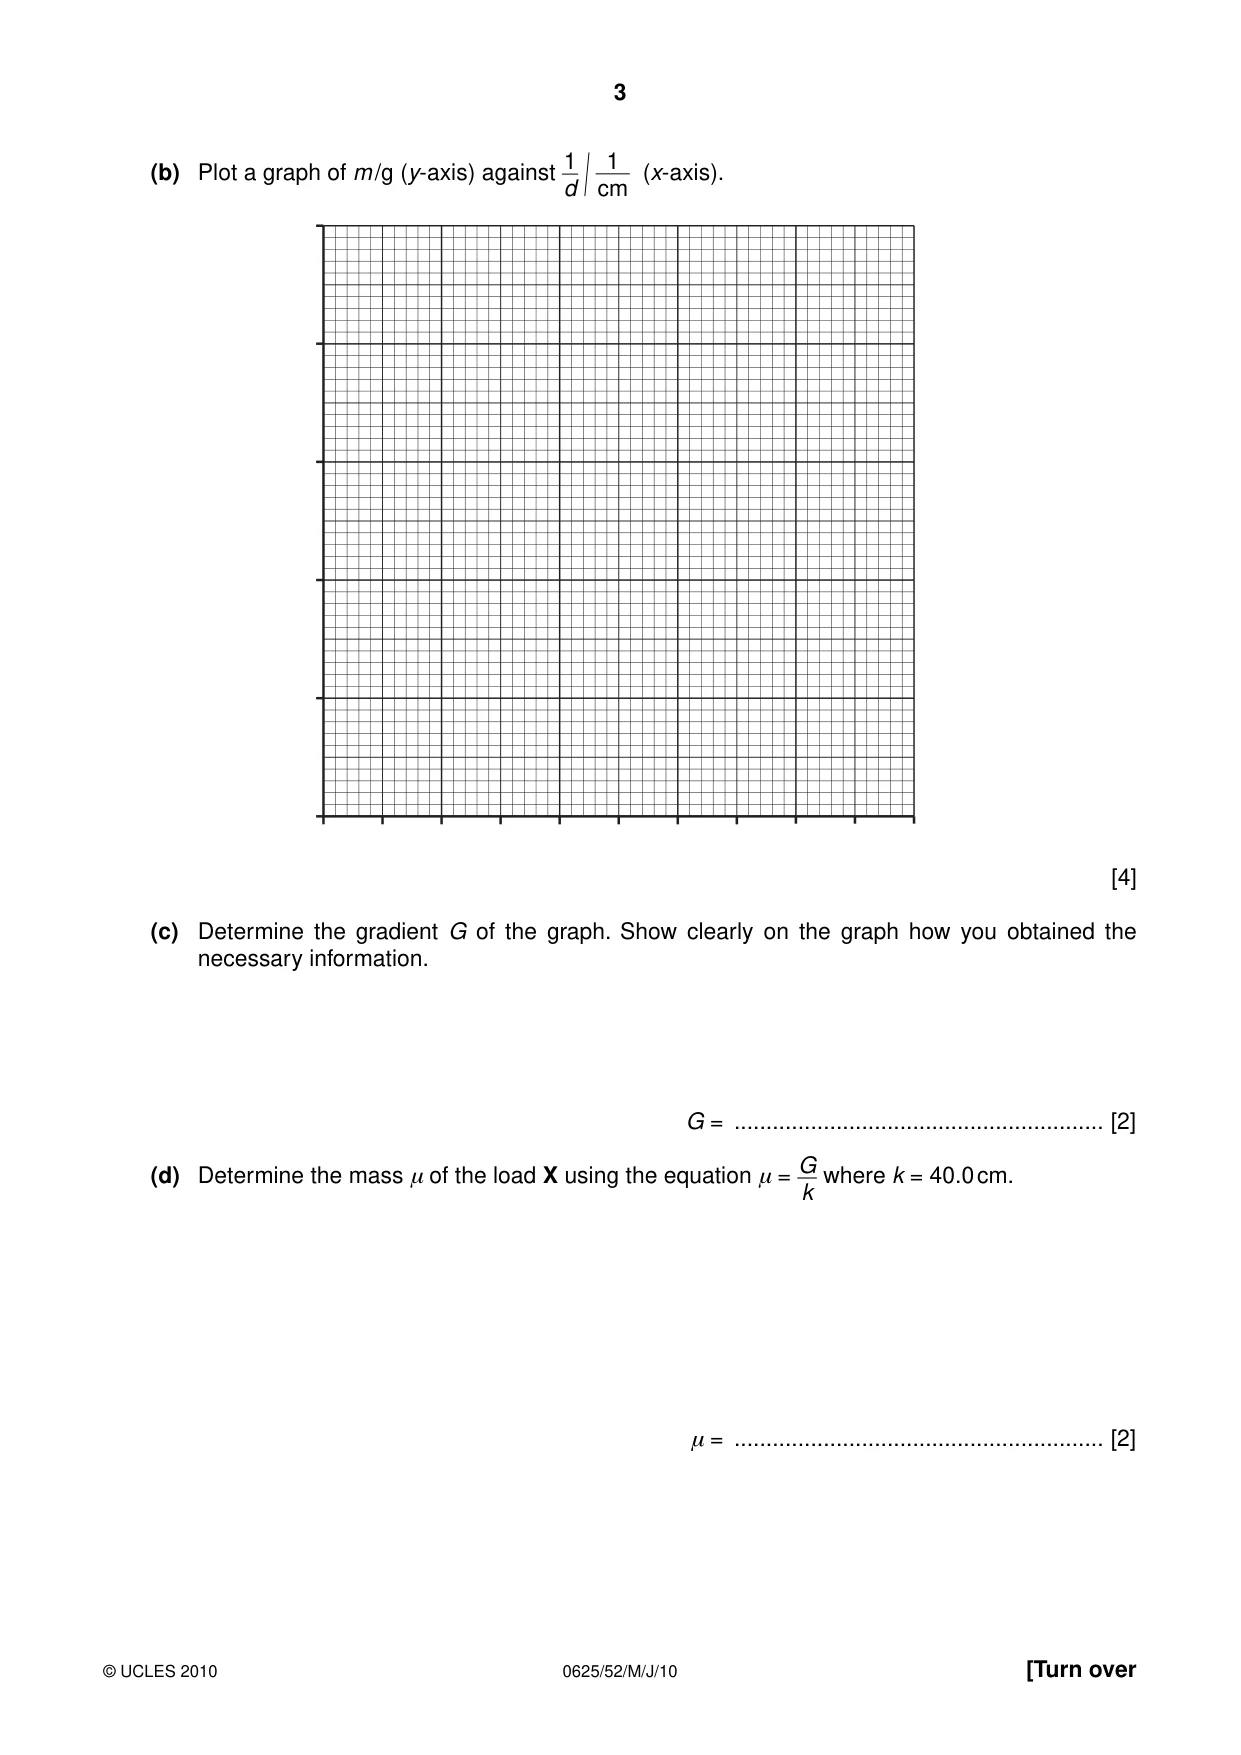
1 In this experiment, you are to determine the mass of a load using a balancing method. Carry out the following instructions referring to Fig. 1.1. d 50.0 cm mark mass m load X pivot metre rule bench Fig. 1.1 The load X has been taped to the metre rule so that its centre is exactly over the 90.0 cm mark. Do not move this load. (a) Place a mass of 40 g on the rule and adjust its position so that the rule is as near as possible to being balanced with the 50.0 cm mark exactly over the pivot as shown in Fig. 1.1. (i) Record in Table 1.1 the distance d from the centre of the 40 g mass to the 50.0 cm mark on the rule. (ii) Repeat step (i) using masses of 50 g, 60 g, 70 g and 80 g to obtain a total of five sets of readings. Record the readings in the table. 1 (iii) For each value of d calculate and enter the values in the table. d Table 1.1 1 1 m / g d / cm d / cm 40 50 60 70 80 [2] 1 1(b) Plot a graph of m /g (y-axis) against (x-axis). d / cm [4] (c) Determine the gradient G of the graph. Show clearly on the graph how you obtained the necessary information. G = .......................................................... [2] G(d) Determine the mass μ of the load X using the equation μ = where k = 40.0 cm. k μ = .......................................................... [2]
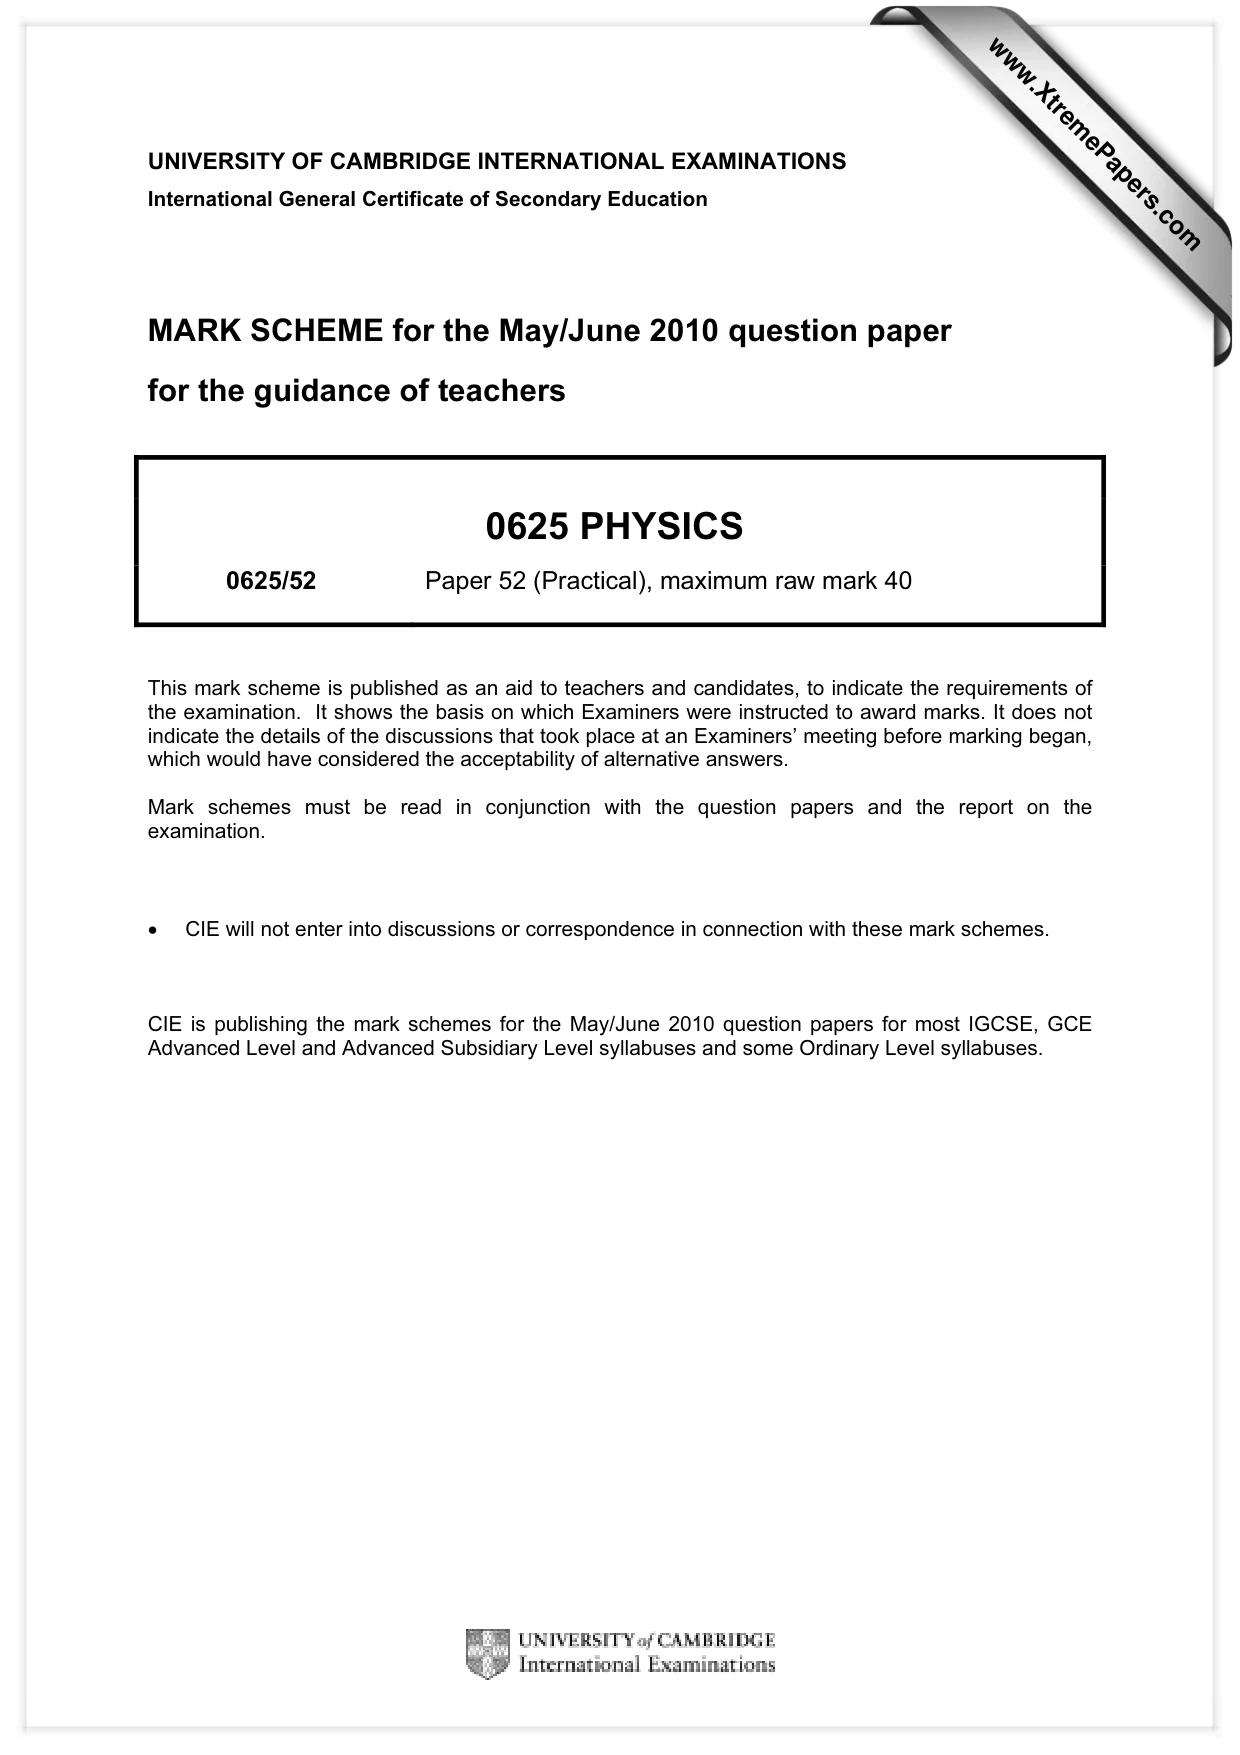
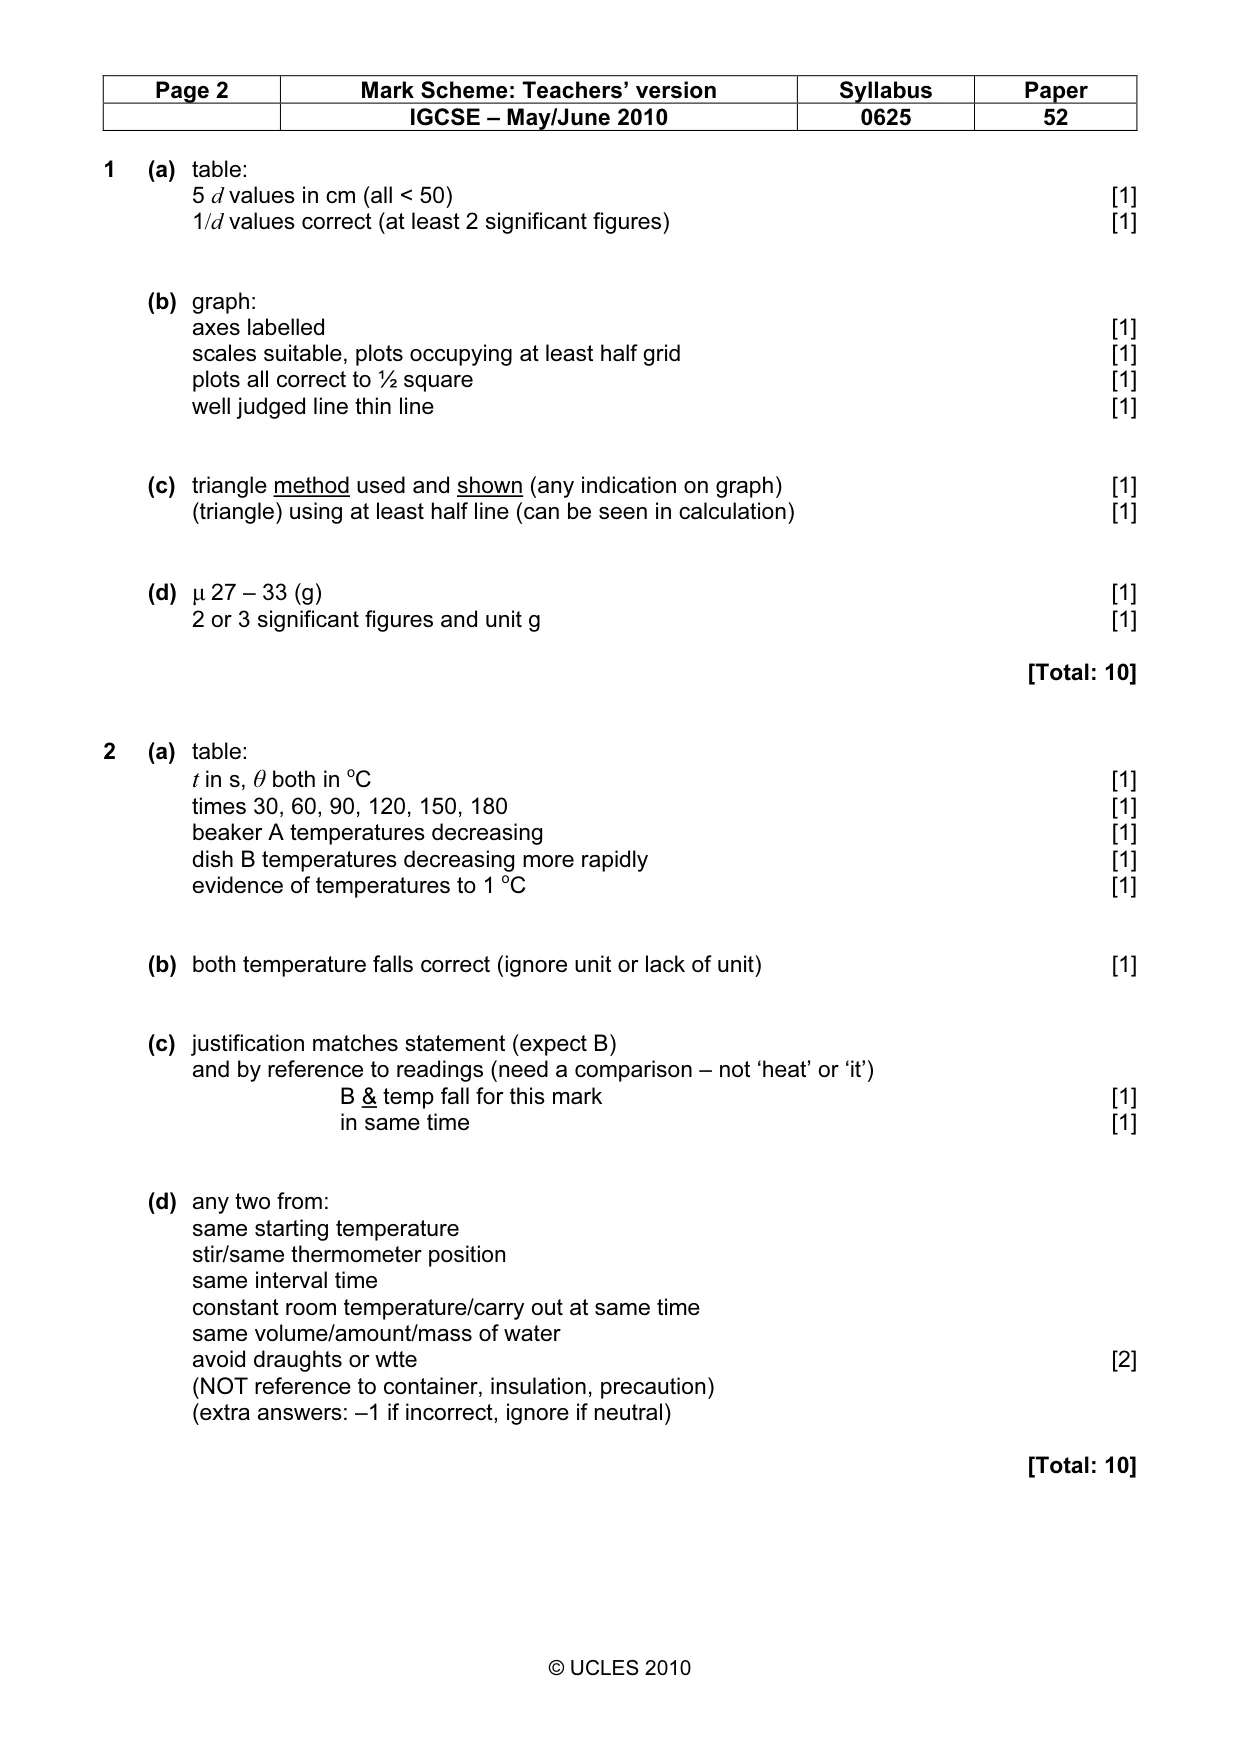
Mark scheme: 1 (a) table: 5 d values in cm (all < 50) [1] 1/d values correct (at least 2 significant figures) [1] (b) graph: axes labelled [1] scales suitable, plots occupying at least half grid [1] plots all correct to ½ square [1] well judged line thin line [1] (c) triangle method used and shown (any indication on graph) [1] (triangle) using at least half line (can be seen in calculation) [1] (d) µ 27 – 33 (g) [1] 2 or 3 significant figures and unit g [1] [Total: 10]
More questions on Physical quantities and measurement techniques
Q2 · In this experiment you will investigate the rate of cooling of water in different…
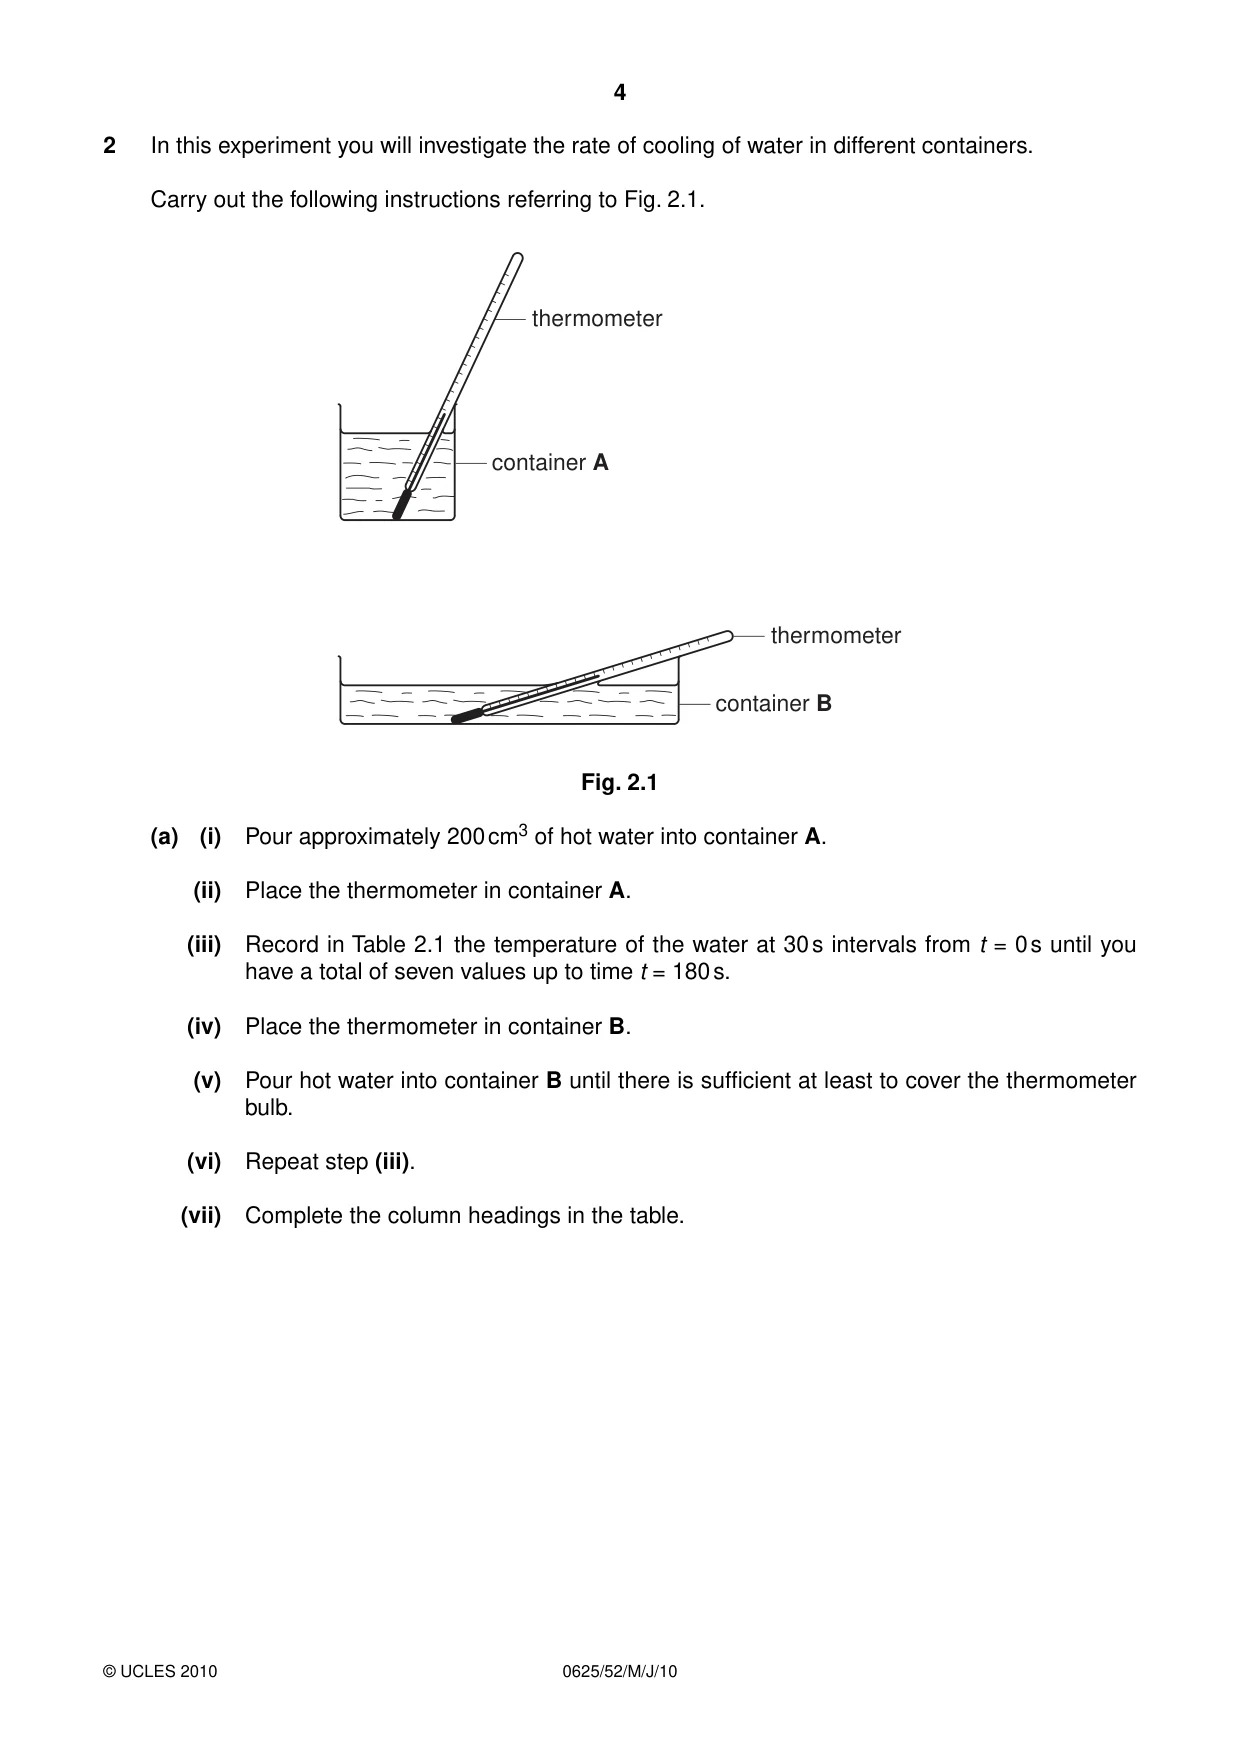
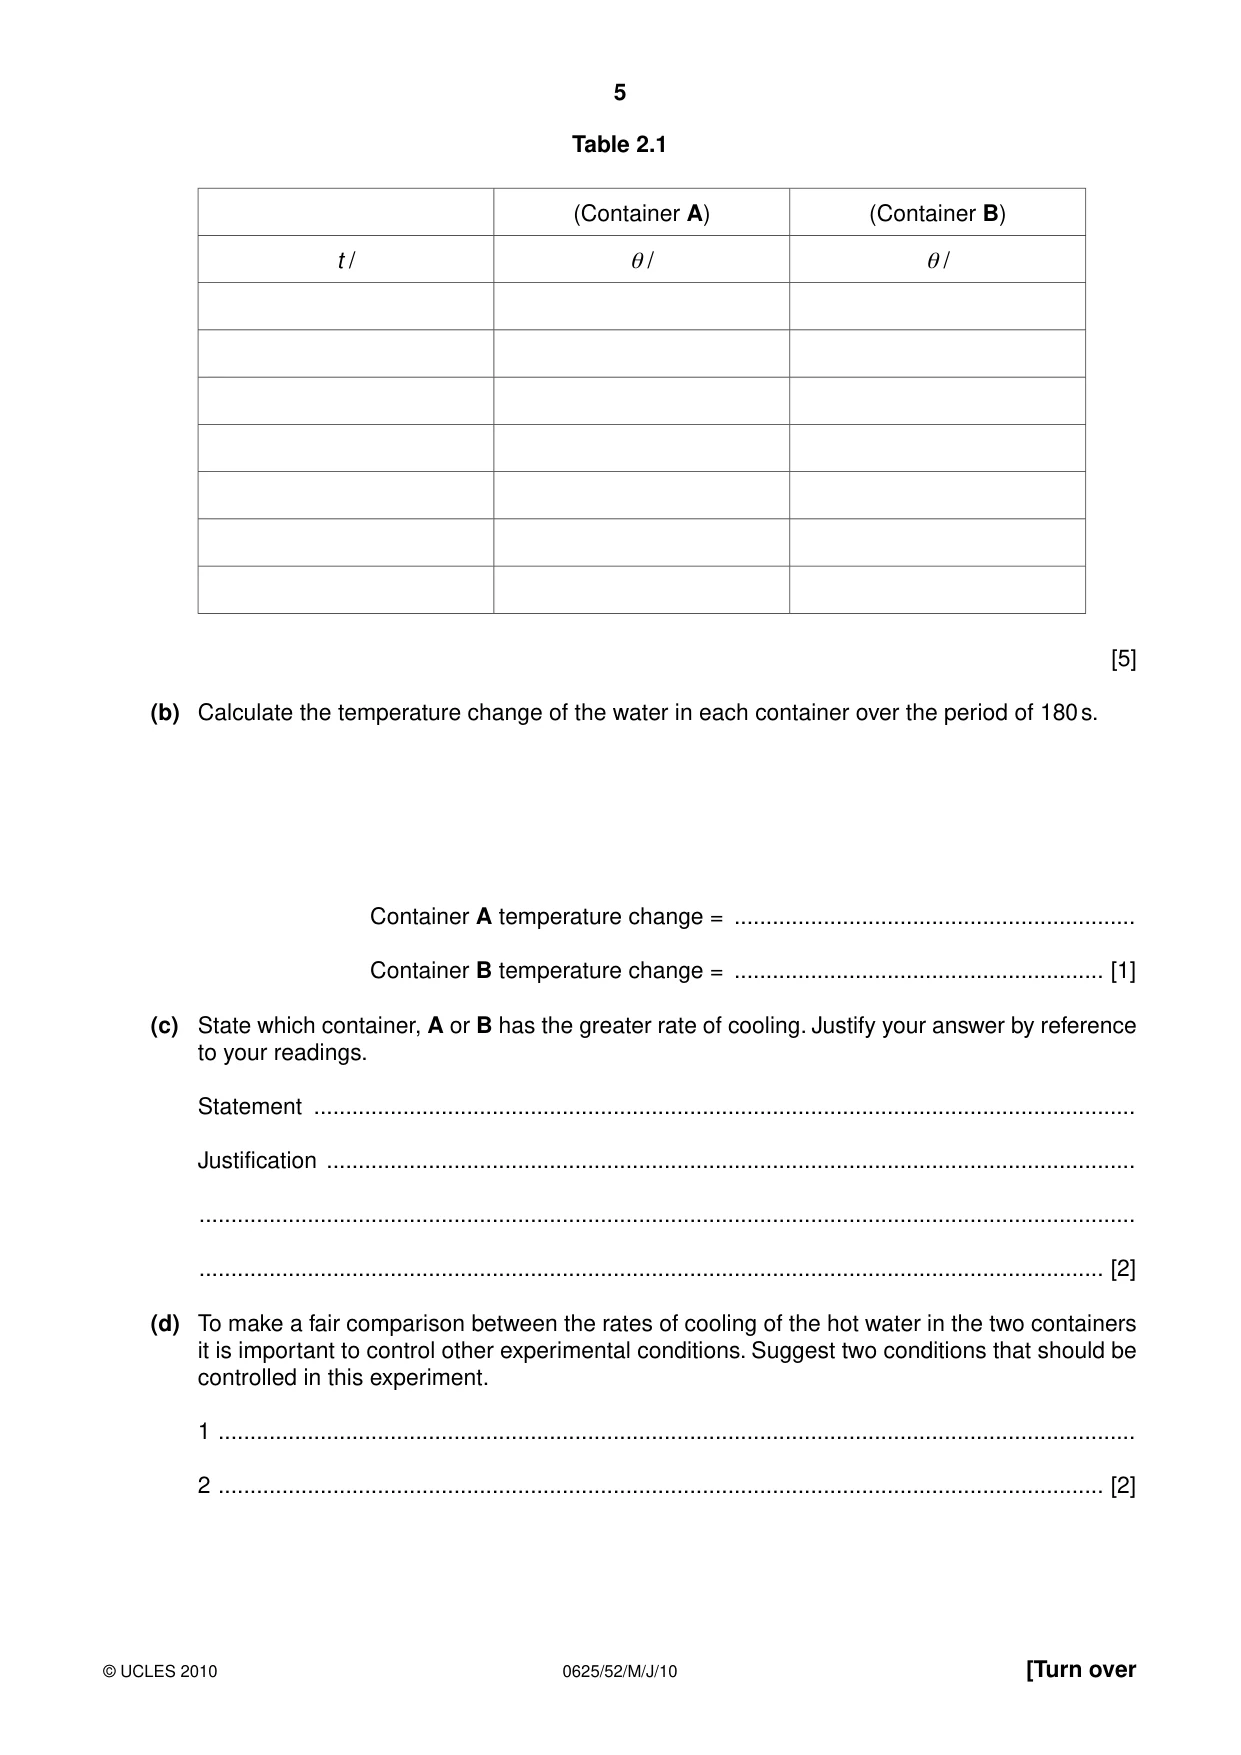
2 In this experiment you will investigate the rate of cooling of water in different containers. Carry out the following instructions referring to Fig. 2.1. thermometer container A thermometer container B Fig. 2.1 (a) (i) Pour approximately 200 cm3 of hot water into container A. (ii) Place the thermometer in container A. (iii) Record in Table 2.1 the temperature of the water at 30 s intervals from t = 0 s until you have a total of seven values up to time t = 180 s. (iv) Place the thermometer in container B. (v) Pour hot water into container B until there is sufficient at least to cover the thermometer bulb. (vi) Repeat step (iii). (vii) Complete the column headings in the table. Table 2.1 (Container A) (Container B) t / θ / θ / [5] (b) Calculate the temperature change of the water in each container over the period of 180 s. Container A temperature change = ............................................................... Container B temperature change = .......................................................... [1] (c) State which container, A or B has the greater rate of cooling. Justify your answer by reference to your readings. Statement ................................................................................................................................. Justification ............................................................................................................................... ................................................................................................................................................... .............................................................................................................................................. [2] (d) To make a fair comparison between the rates of cooling of the hot water in the two containers it is important to control other experimental conditions. Suggest two conditions that should be controlled in this experiment. 1 ................................................................................................................................................ 2 ........................................................................................................................................... [2]
Mark scheme: 2 (a) table: t in s, θ both in oC [1] times 30, 60, 90, 120, 150, 180 [1] beaker A temperatures decreasing [1] dish B temperatures decreasing more rapidly [1] evidence of temperatures to 1 oC [1] (b) both temperature falls correct (ignore unit or lack of unit) [1] (c) justification matches statement (expect B) and by reference to readings (need a comparison – not ‘heat’ or ‘it’) B & temp fall for this mark [1] in same time [1] (d) any two from: same starting temperature stir/same thermometer position same interval time constant room temperature/carry out at same time same volume/amount/mass of water avoid draughts or wtte [2] (NOT reference to container, insulation, precaution) (extra answers: –1 if incorrect, ignore if neutral) [Total: 10] IGCSE – May/June 2010 0625 52
Q3 · In this experiment, you are to determine the resistances of lamps in different circuit…
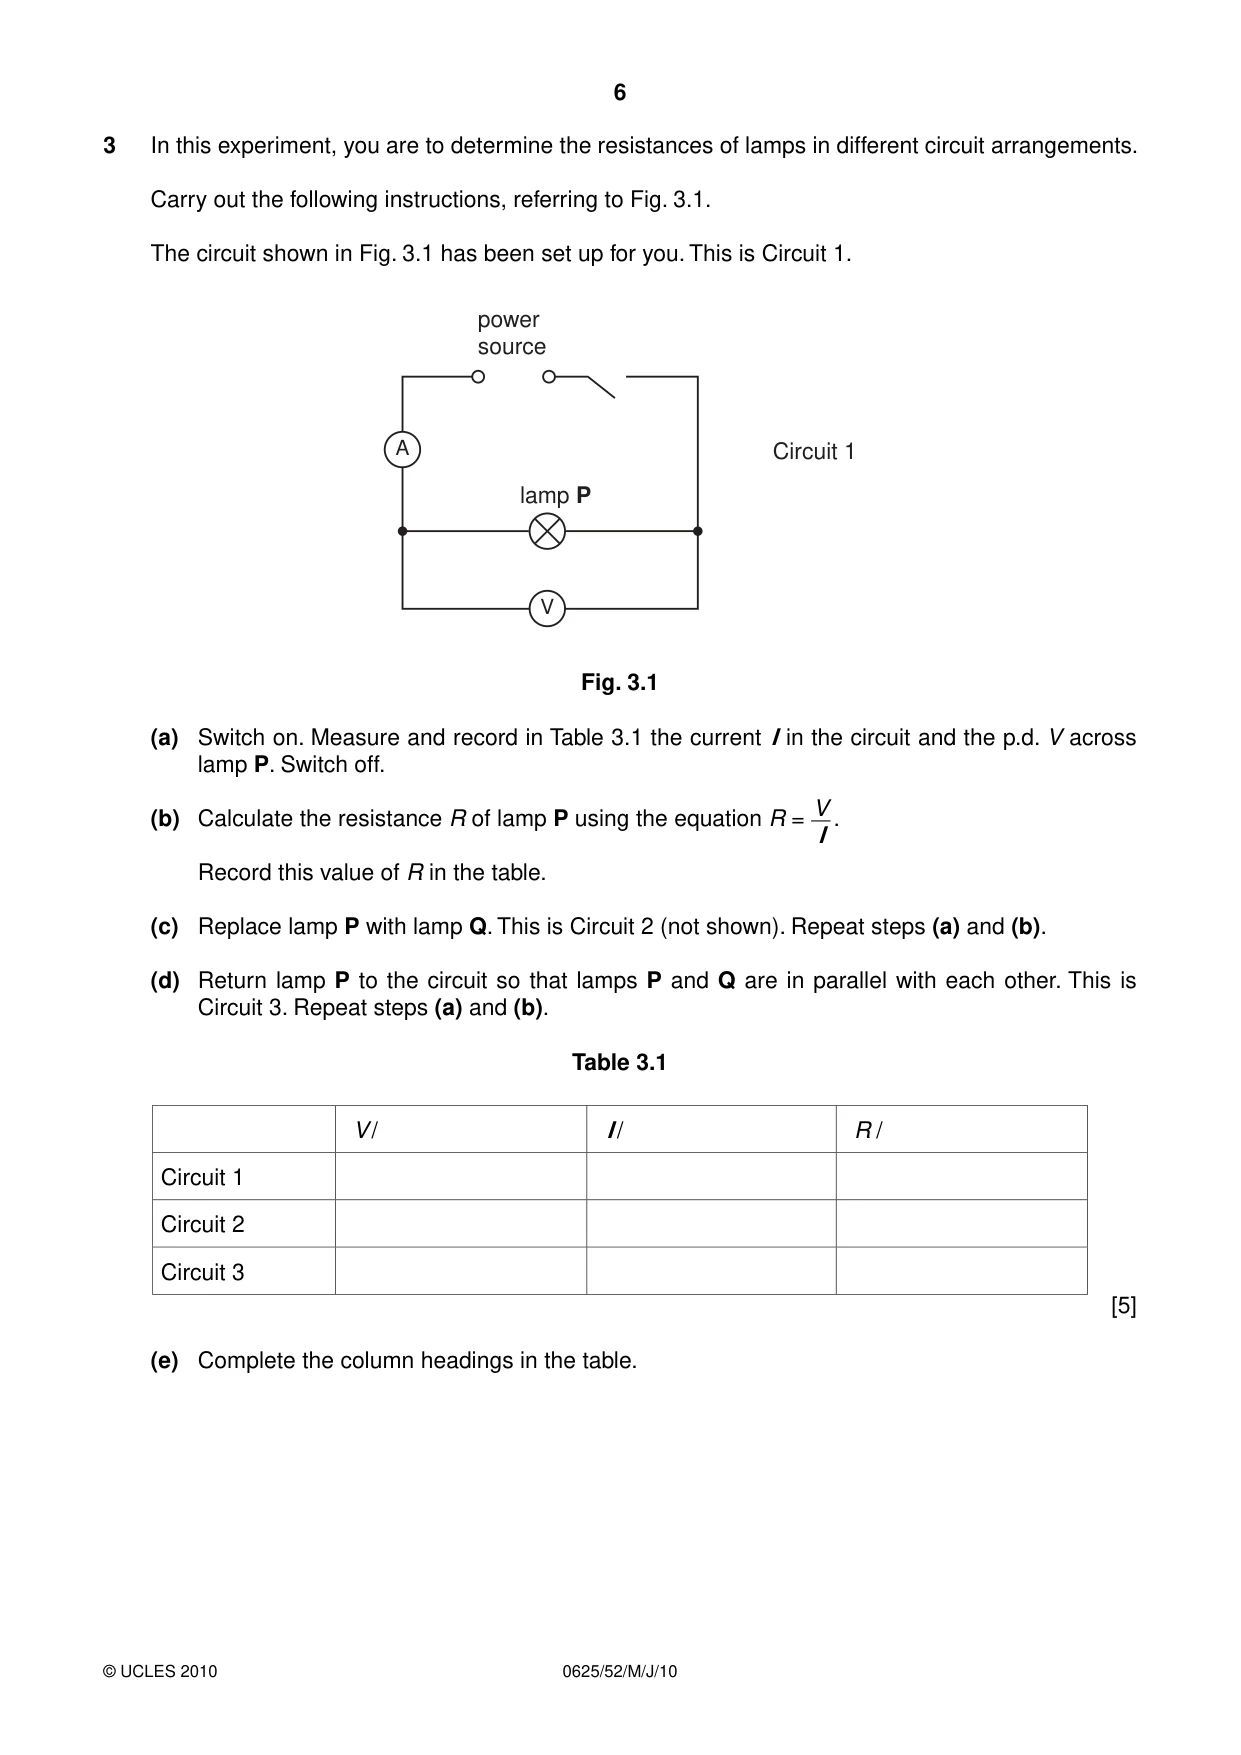
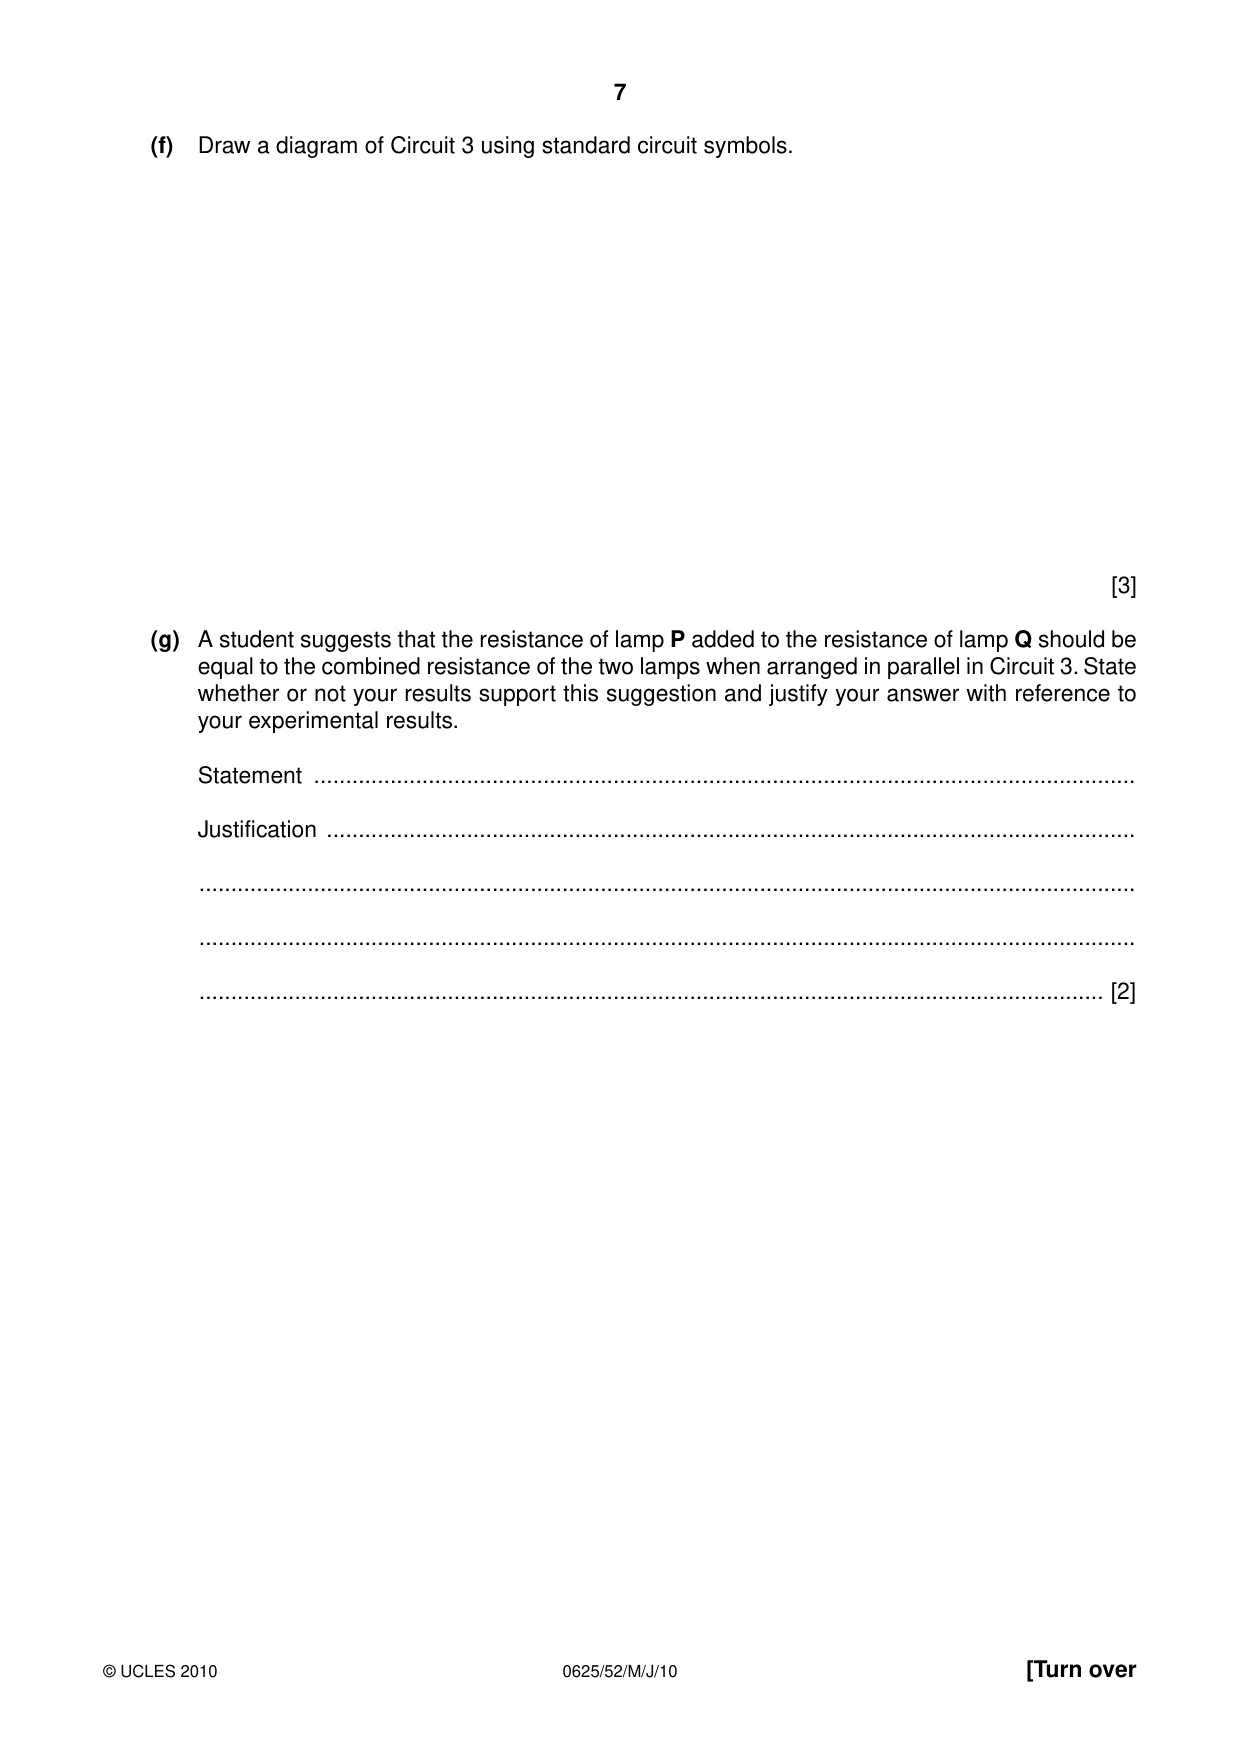
3 In this experiment, you are to determine the resistances of lamps in different circuit arrangements. Carry out the following instructions, referring to Fig. 3.1. The circuit shown in Fig. 3.1 has been set up for you. This is Circuit 1. power source A Circuit 1 lamp P V Fig. 3.1 (a) Switch on. Measure and record in Table 3.1 the current I in the circuit and the p.d. V across lamp P. Switch off. V (b) Calculate the resistance R of lamp P using the equation R = . I Record this value of R in the table. (c) Replace lamp P with lamp Q. This is Circuit 2 (not shown). Repeat steps (a) and (b). (d) Return lamp P to the circuit so that lamps P and Q are in parallel with each other. This is Circuit 3. Repeat steps (a) and (b). Table 3.1 V / I / R / Circuit 1 Circuit 2 Circuit 3 [5] (e) Complete the column headings in the table. (f) Draw a diagram of Circuit 3 using standard circuit symbols. [3] (g) A student suggests that the resistance of lamp P added to the resistance of lamp Q should be equal to the combined resistance of the two lamps when arranged in parallel in Circuit 3. State whether or not your results support this suggestion and justify your answer with reference to your experimental results. Statement ................................................................................................................................. Justification ............................................................................................................................... ................................................................................................................................................... ................................................................................................................................................... .............................................................................................................................................. [2]
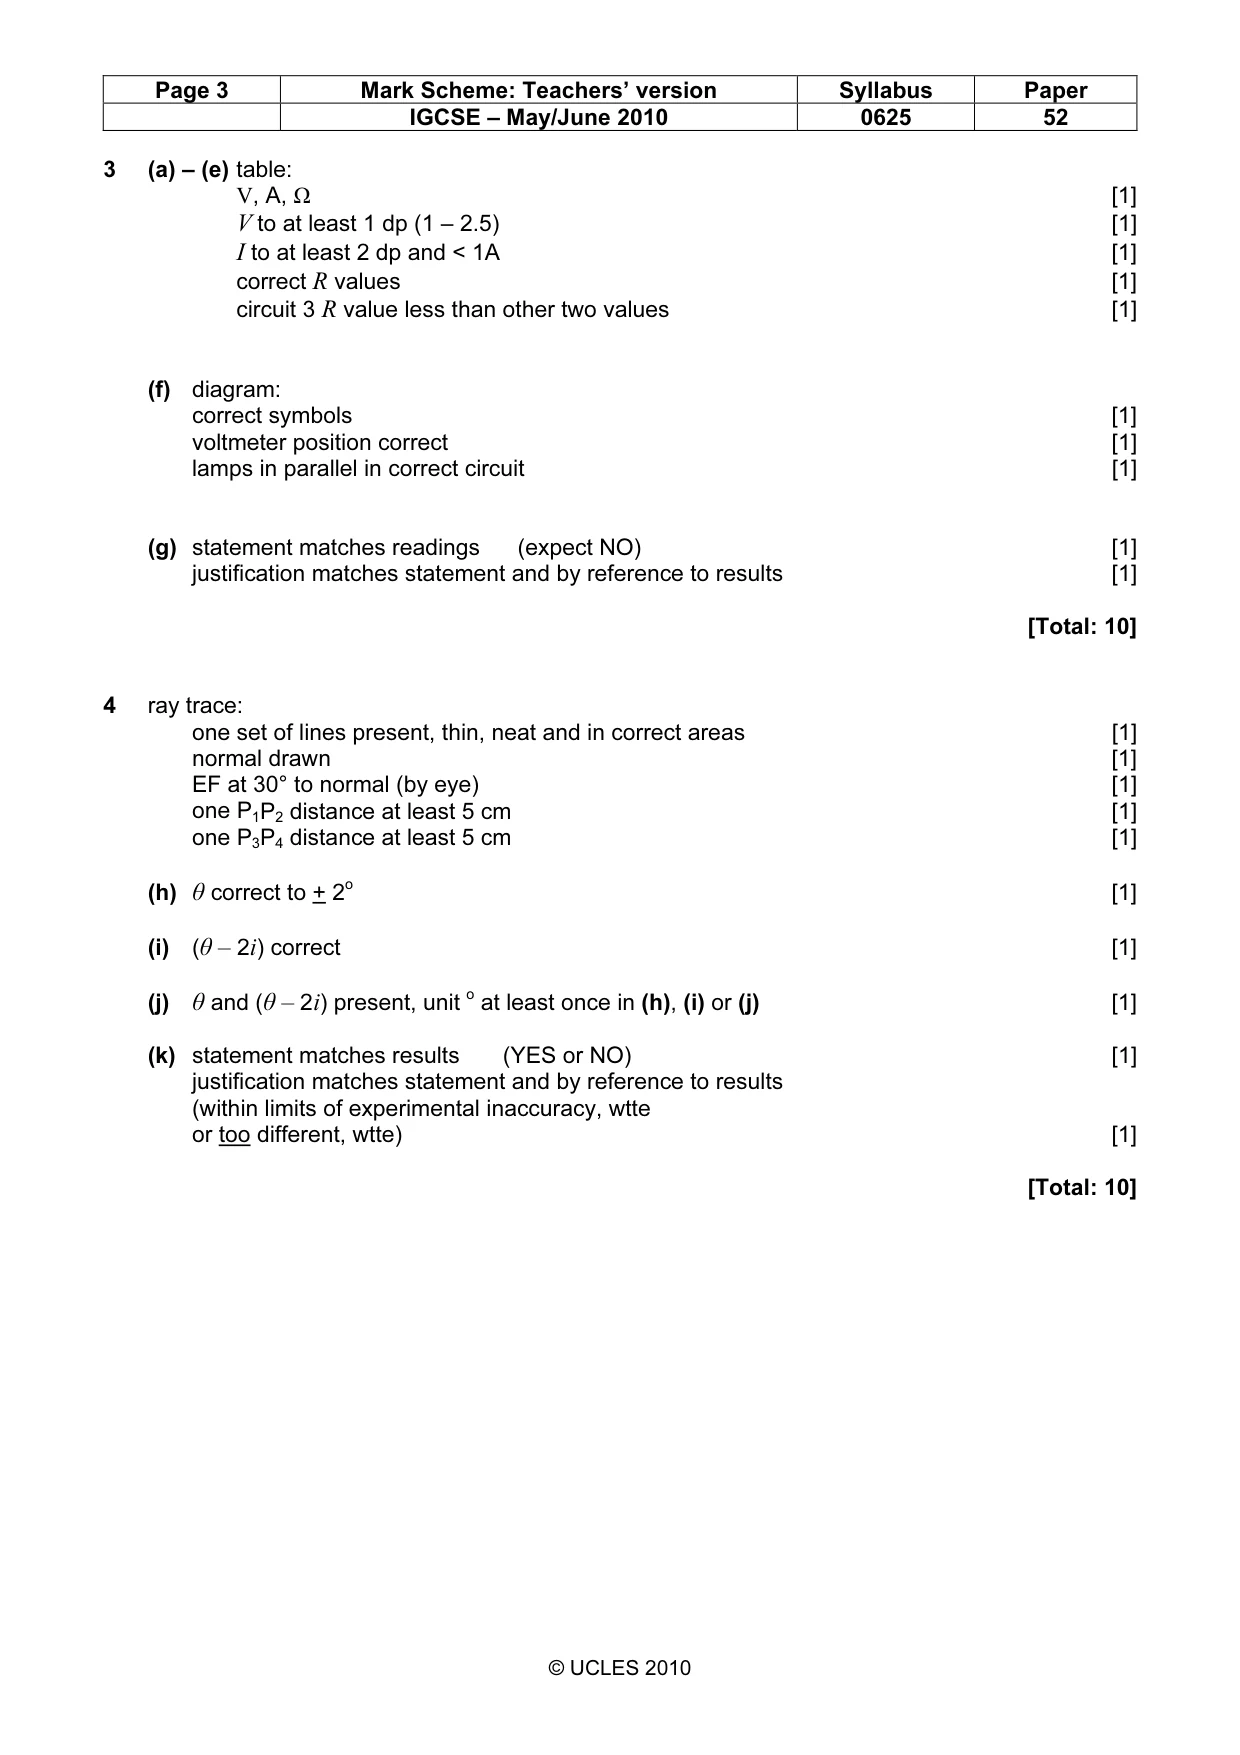
Mark scheme: 3 (a) – (e) table: V, A, Ω [1] V to at least 1 dp (1 – 2.5) [1] I to at least 2 dp and < 1A [1] correct R values [1] circuit 3 R value less than other two values [1] (f) diagram: correct symbols [1] voltmeter position correct [1] lamps in parallel in correct circuit [1] (g) statement matches readings (expect NO) [1] justification matches statement and by reference to results [1] [Total: 10]
Q4 · In this experiment you will investigate refraction and reflection of light in a…
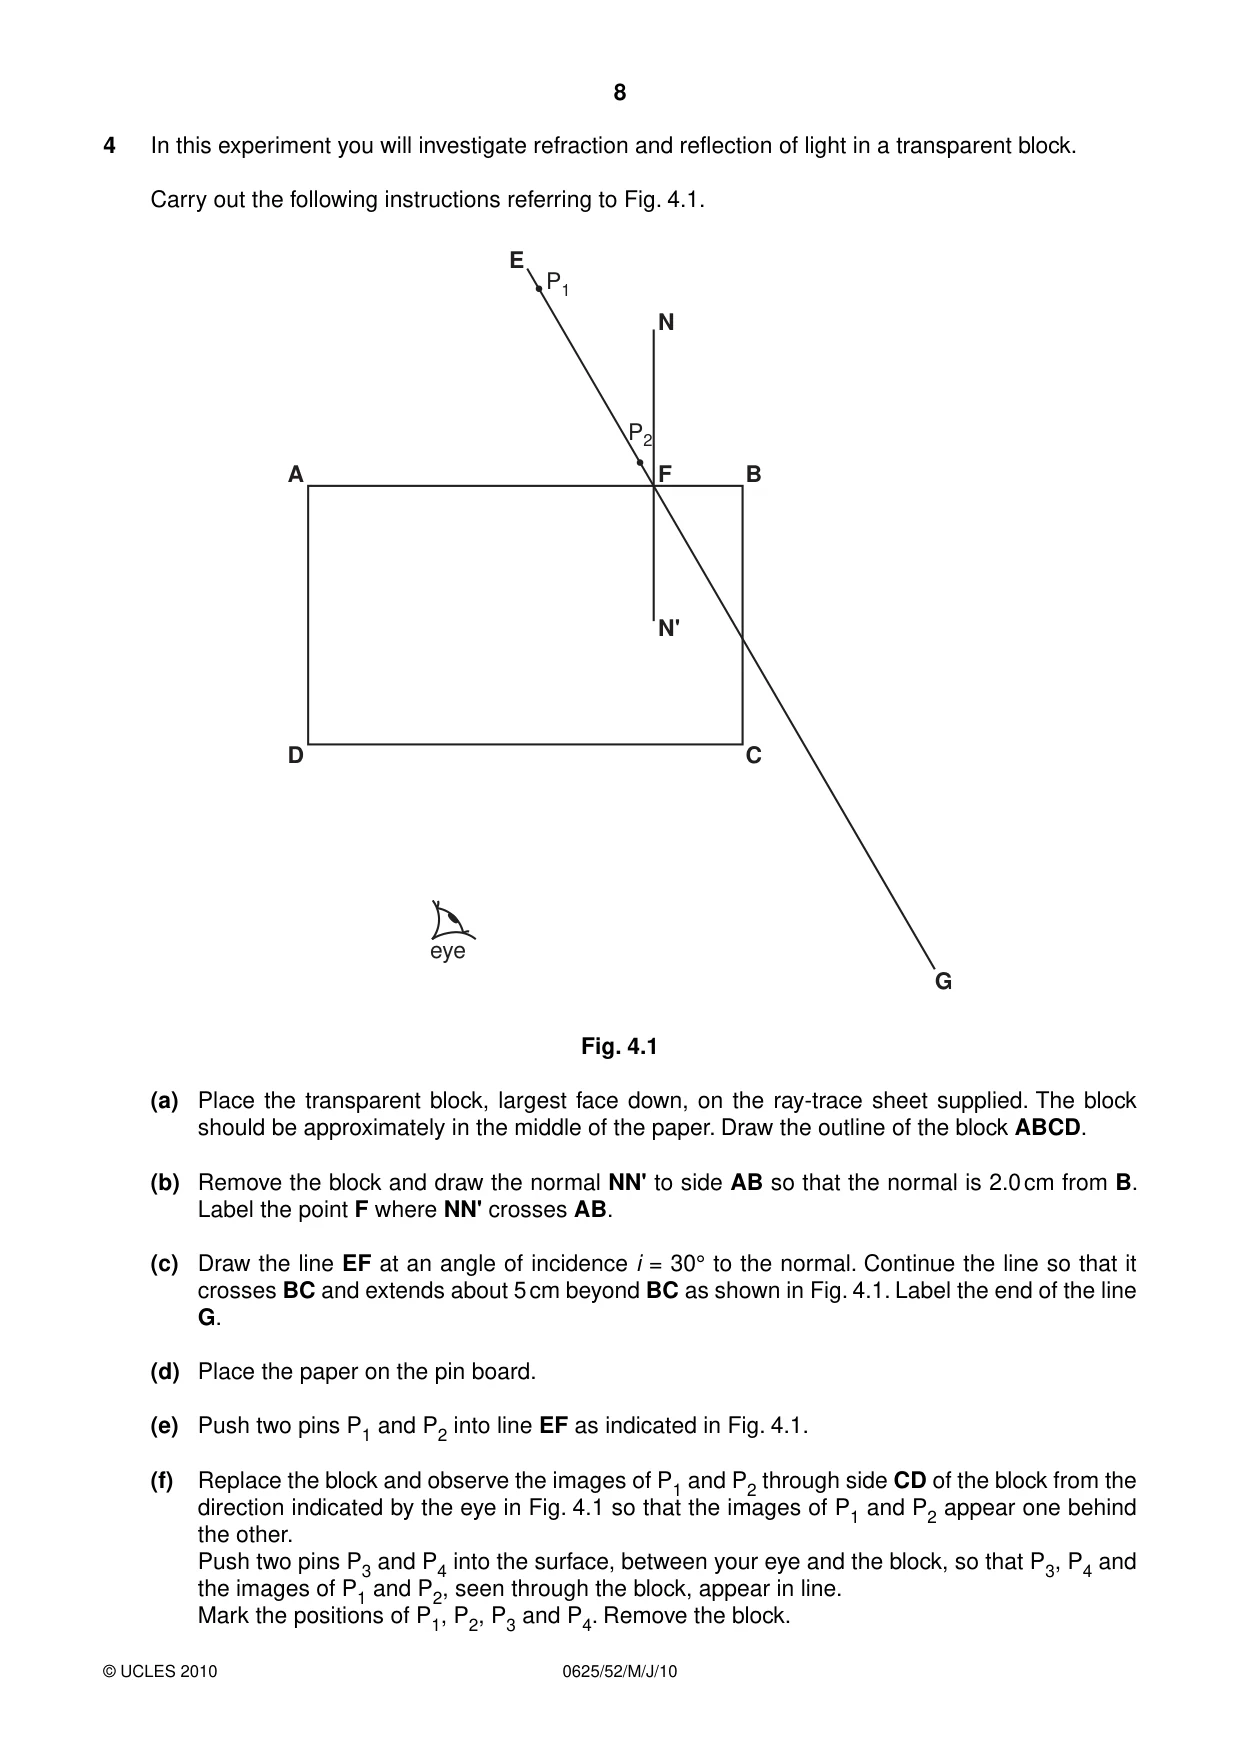
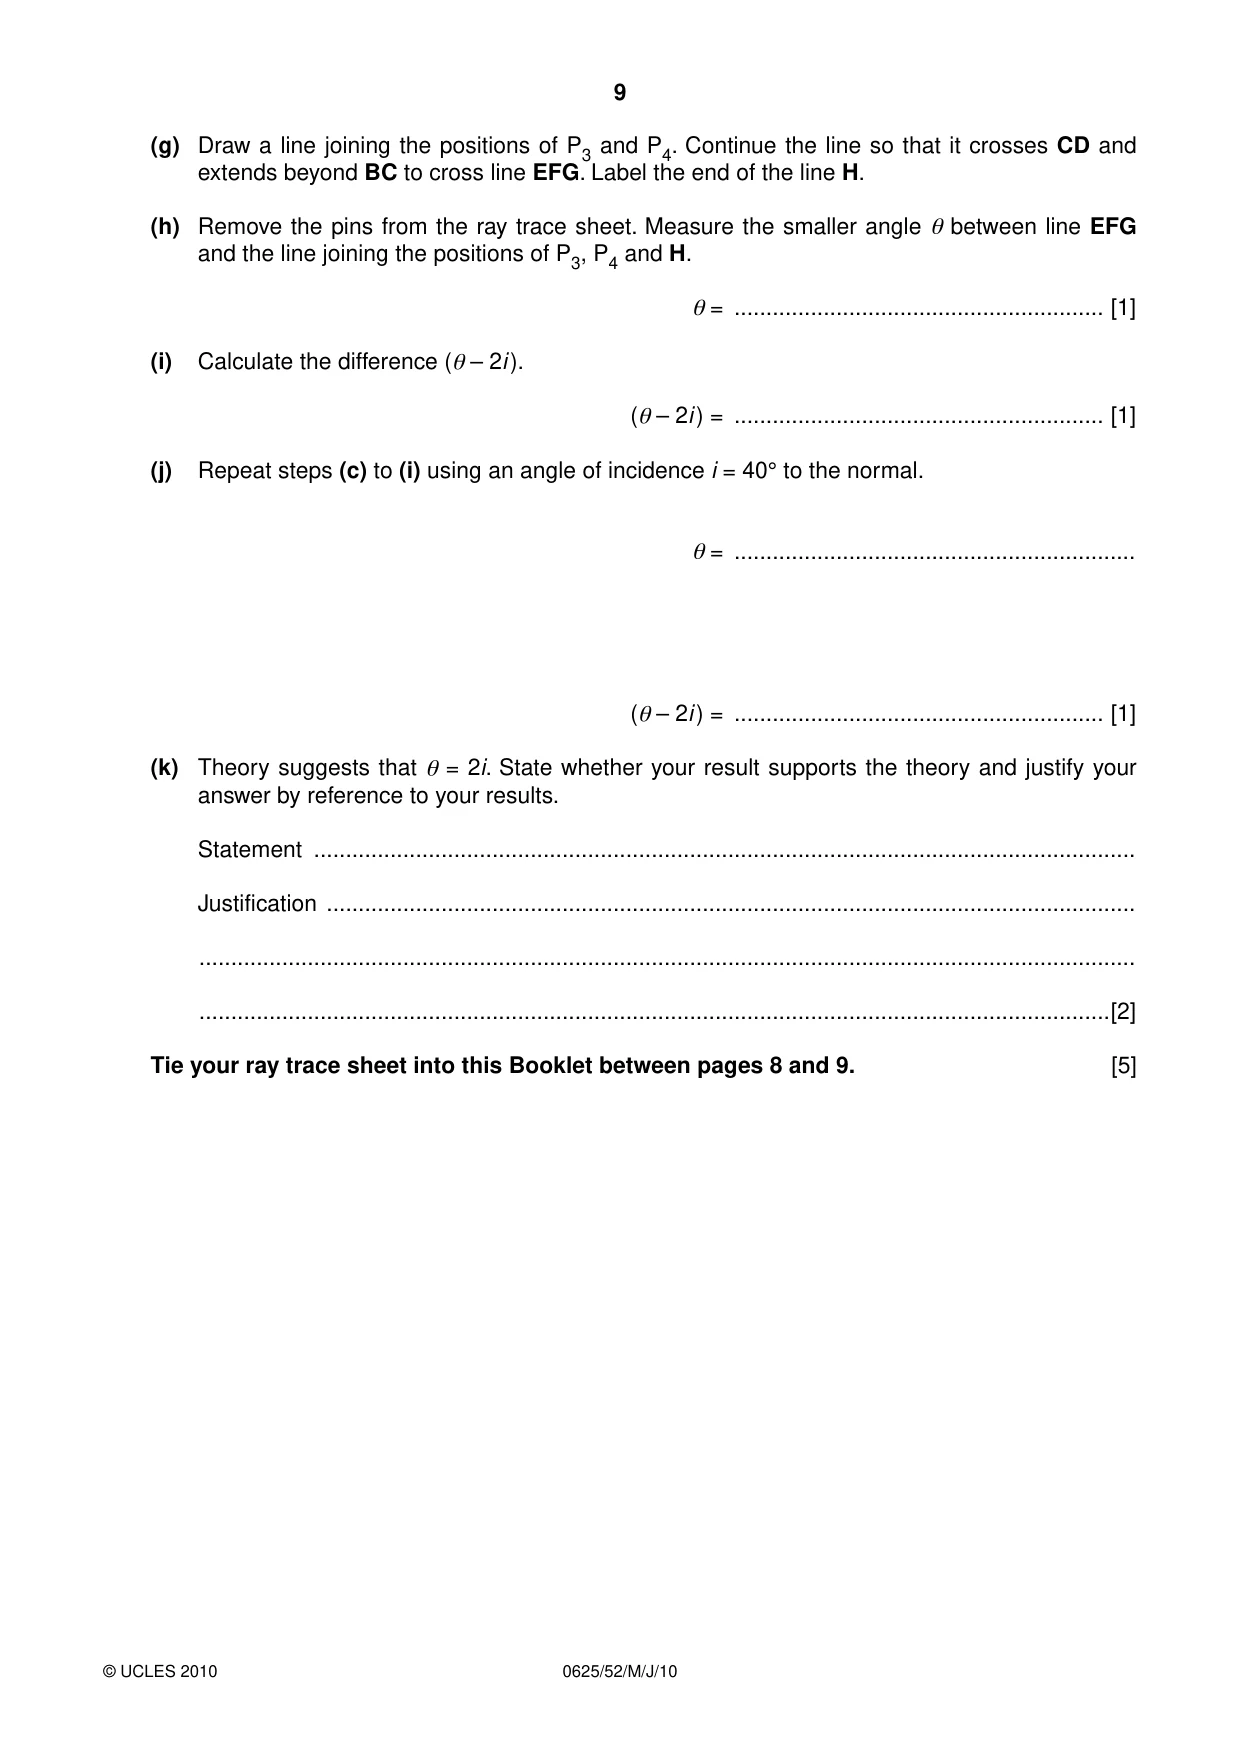
4 In this experiment you will investigate refraction and reflection of light in a transparent block. Carry out the following instructions referring to Fig. 4.1. E P1 N P2 A F B N' D C eye G Fig. 4.1 (a) Place the transparent block, largest face down, on the ray-trace sheet supplied. The block should be approximately in the middle of the paper. Draw the outline of the block ABCD. (b) Remove the block and draw the normal NN' to side AB so that the normal is 2.0 cm from B. Label the point F where NN' crosses AB. (c) Draw the line EF at an angle of incidence i = 30° to the normal. Continue the line so that it crosses BC and extends about 5 cm beyond BC as shown in Fig. 4.1. Label the end of the line G. (d) Place the paper on the pin board. (e) Push two pins P1 and P2 into line EF as indicated in Fig. 4.1. (f) Replace the block and observe the images of P1 and P2 through side CD of the block from the direction indicated by the eye in Fig. 4.1 so that the images of P1 and P2 appear one behind the other. Push two pins P3 and P4 into the surface, between your eye and the block, so that P3, P4 and the images of P1 and P2, seen through the block, appear in line. Mark the positions of P1, P2, P3 and P4. Remove the block. (g) Draw a line joining the positions of P3 and P4. Continue the line so that it crosses CD and extends beyond BC to cross line EFG. Label the end of the line H. (h) Remove the pins from the ray trace sheet. Measure the smaller angle θ between line EFG and the line joining the positions of P3, P4 and H. θ = .......................................................... [1] (i) Calculate the difference (θ – 2i ). (θ – 2i ) = .......................................................... [1] (j) Repeat steps (c) to (i) using an angle of incidence i = 40° to the normal. θ = ............................................................... (θ – 2i ) = .......................................................... [1] (k) Theory suggests that θ = 2i. State whether your result supports the theory and justify your answer by reference to your results. Statement ................................................................................................................................. Justification ............................................................................................................................... ................................................................................................................................................... ...............................................................................................................................................[2] Tie your ray trace sheet into this Booklet between pages 8 and 9. [5]
Mark scheme: 4 ray trace: one set of lines present, thin, neat and in correct areas [1] normal drawn [1] EF at 30° to normal (by eye) [1] one P1P2 distance at least 5 cm [1] one P3P4 distance at least 5 cm [1] (h) θ correct to + 2o [1] (i) (θ – 2i) correct [1] (j) θ and (θ – 2i) present, unit o at least once in (h), (i) or (j) [1] (k) statement matches results (YES or NO) [1] justification matches statement and by reference to results (within limits of experimental inaccuracy, wtte or too different, wtte) [1] [Total: 10]
What was in this paper
The subtopics covered by these 4 questions, and how many questions each got. Open one in a new tab to see every Cambridge question on it.
What you needed in this session
Cambridge’s own grade thresholds for 2010 May/June, Paper 5 · Variant 2. A higher threshold means an easier paper — the bar moves with how the cohort did.