Cambridge IGCSE Physics 0625 — 2007 Oct/Nov Paper 3 · Variant 1
0625/31/O/N/07 · 11 questions · 80 marks · ≈90 min
The question paper and its mark scheme, free to read here and free to download. This is Cambridge’s own paper, exactly as it was sat.
Question paper16 pages


Mark scheme7 pages
Answers below. Sit the paper first if you are practising.
Questions as text
Q1 · A large plastic ball is dropped from the top of a tall building
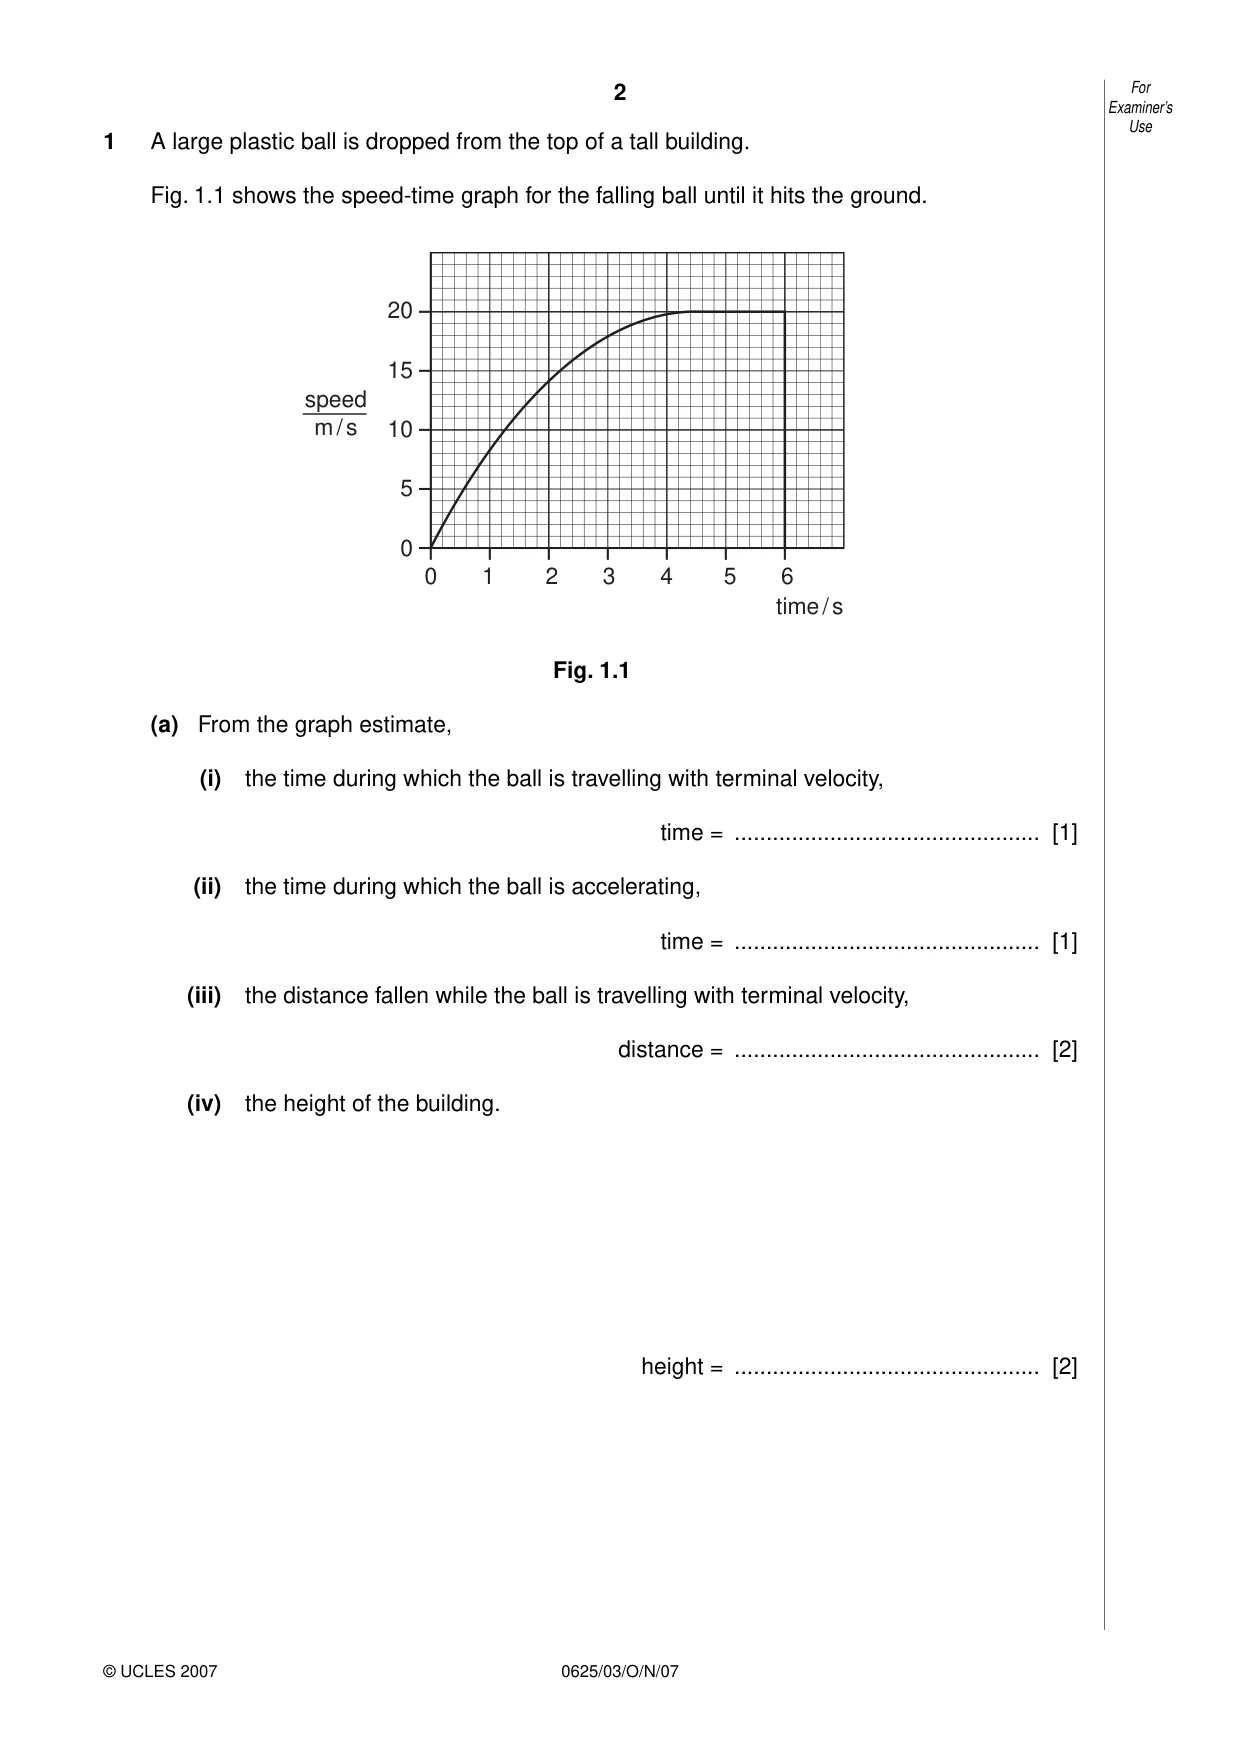
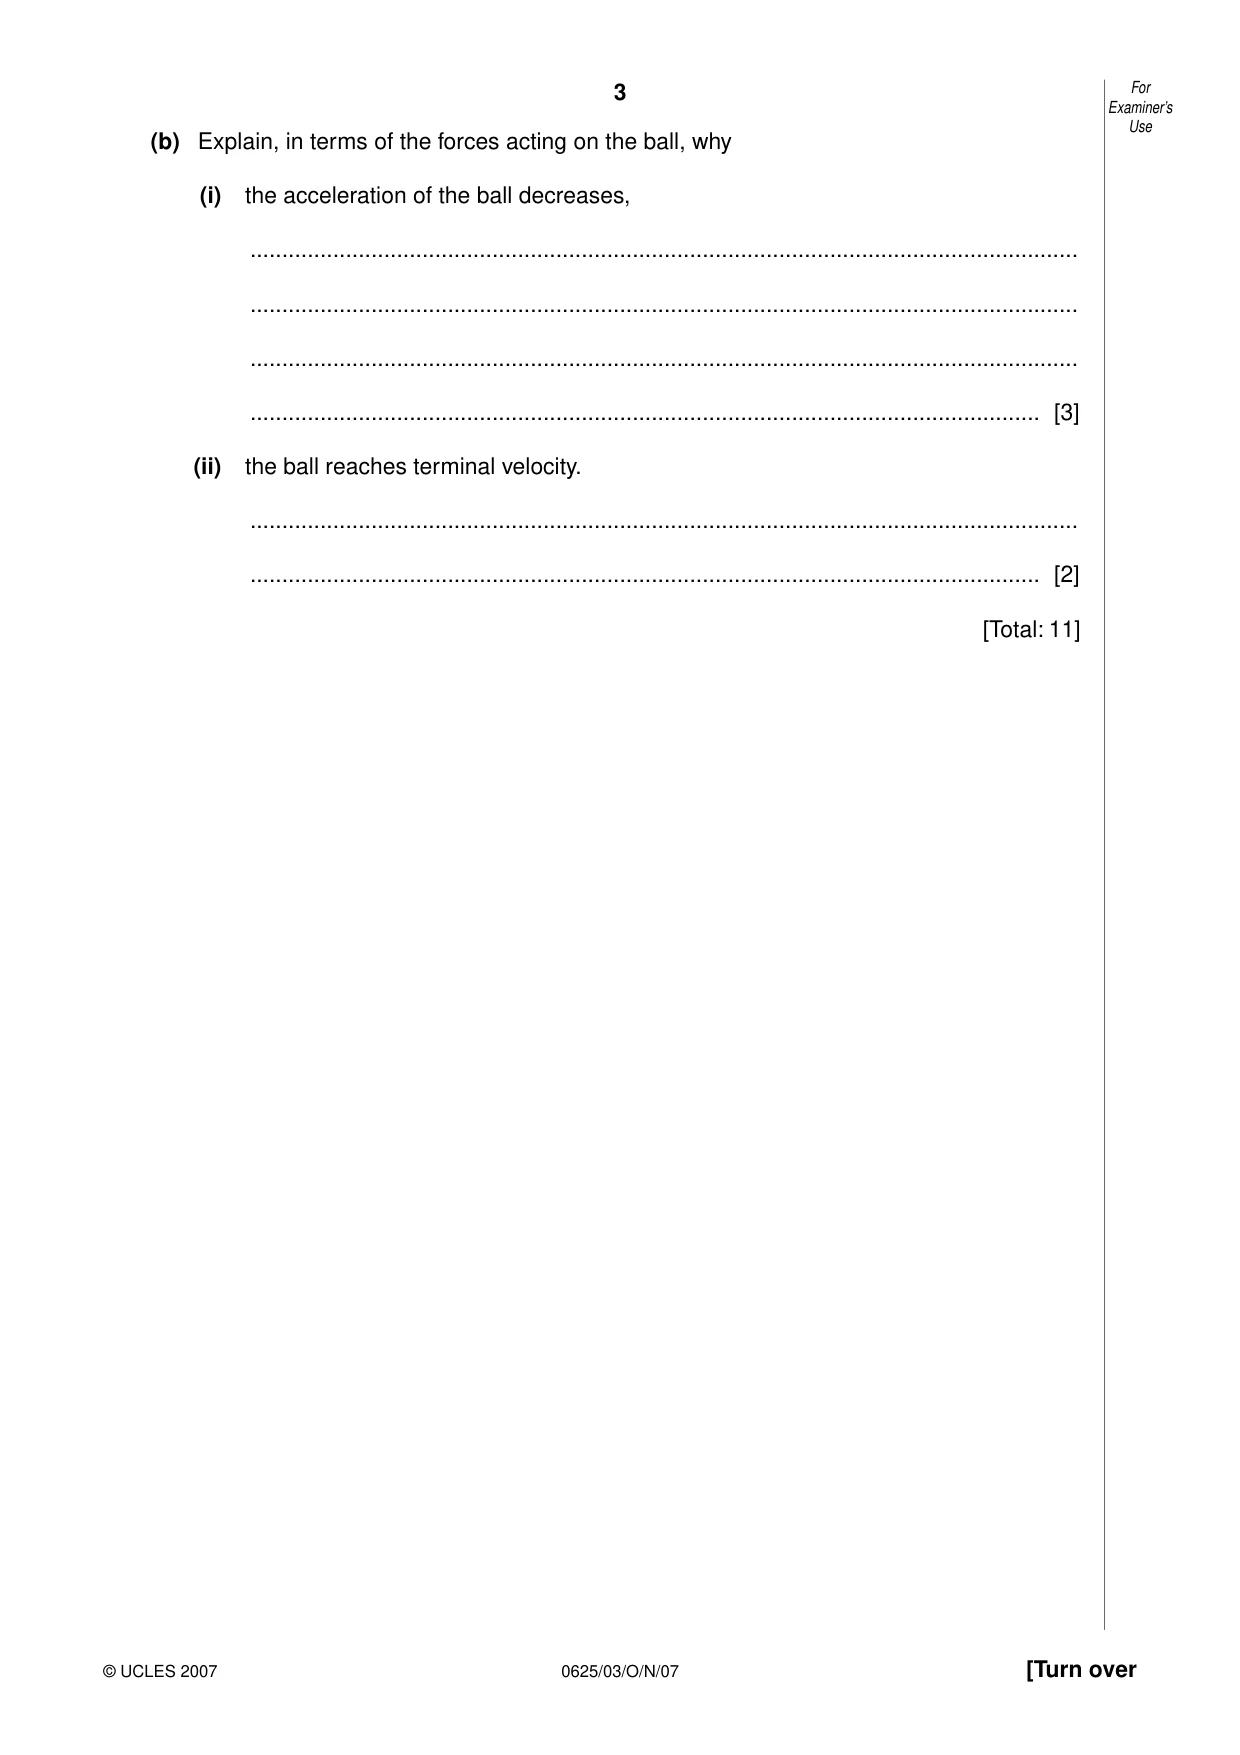
1 A large plastic ball is dropped from the top of a tall building. Fig. 1.1 shows the speed-time graph for the falling ball until it hits the ground. 20 15 speed m / s 10 5 0 0 1 2 3 4 5 6 time / s Fig. 1.1 (a) From the graph estimate, (i) the time during which the ball is travelling with terminal velocity, time = ................................................ [1] (ii) the time during which the ball is accelerating, time = ................................................ [1] (iii) the distance fallen while the ball is travelling with terminal velocity, distance = ................................................ [2] (iv) the height of the building. height = ................................................ [2] Examiner’s Use (b) Explain, in terms of the forces acting on the ball, why (i) the acceleration of the ball decreases, .................................................................................................................................. .................................................................................................................................. .................................................................................................................................. ............................................................................................................................ [3] (ii) the ball reaches terminal velocity. .................................................................................................................................. ............................................................................................................................ [2] [Total: 11]
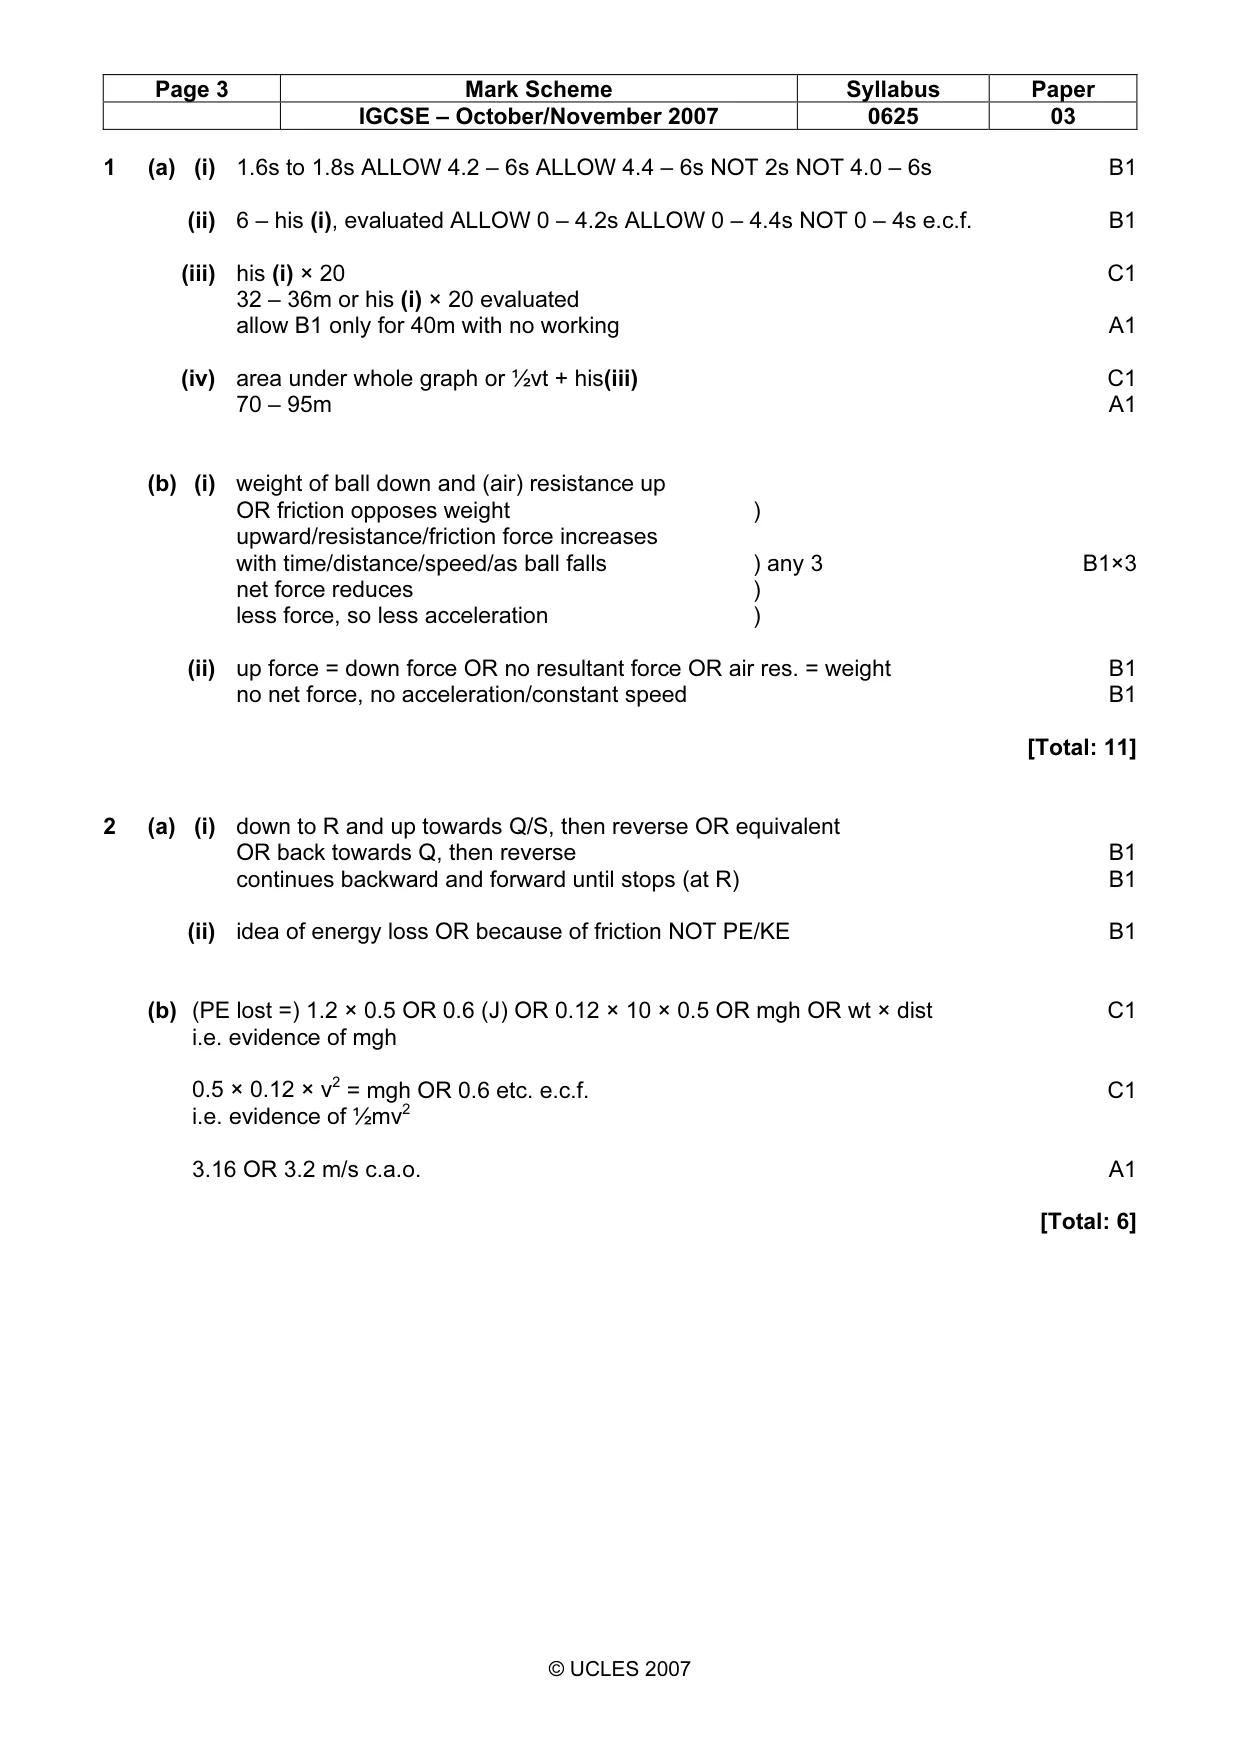
Mark scheme: 1 (a) (i) 1.6s to 1.8s ALLOW 4.2 – 6s ALLOW 4.4 – 6s NOT 2s NOT 4.0 – 6s B1 (ii) 6 – his (i), evaluated ALLOW 0 – 4.2s ALLOW 0 – 4.4s NOT 0 – 4s e.c.f. B1 (iii) his (i) × 20 C1 32 – 36m or his (i) × 20 evaluated allow B1 only for 40m with no working A1 (iv) area under whole graph or ½vt + his(iii) C1 70 – 95m A1 (b) (i) weight of ball down and (air) resistance up OR friction opposes weight ) upward/resistance/friction force increases with time/distance/speed/as ball falls ) any 3 B1×3 net force reduces ) less force, so less acceleration ) (ii) up force = down force OR no resultant force OR air res. = weight B1 no net force, no acceleration/constant speed B1 [Total: 11]
Q2 · A track for a model car
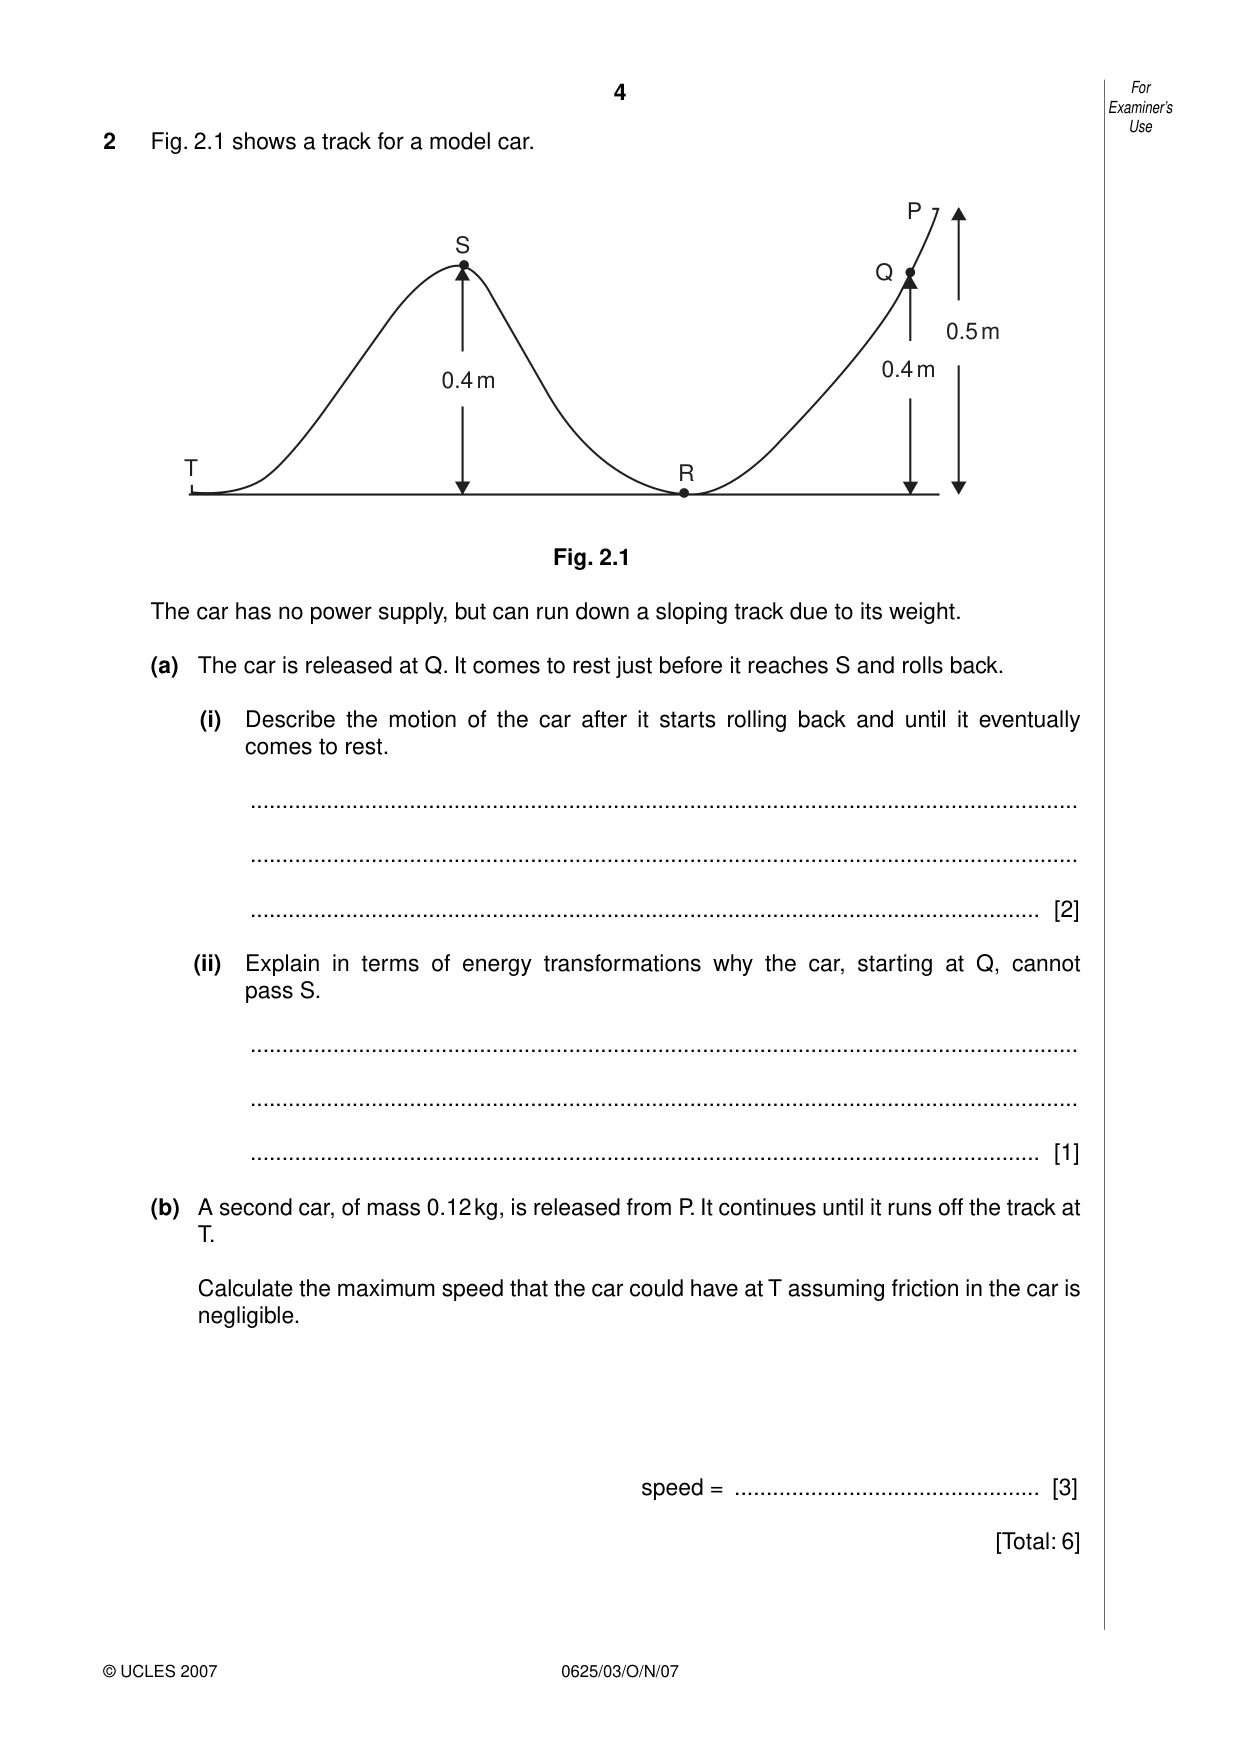
2 Fig. 2.1 shows a track for a model car. P S Q 0.5 m 0.4 m 0.4 m T R Fig. 2.1 The car has no power supply, but can run down a sloping track due to its weight. (a) The car is released at Q. It comes to rest just before it reaches S and rolls back. (i) Describe the motion of the car after it starts rolling back and until it eventually comes to rest. .................................................................................................................................. .................................................................................................................................. ............................................................................................................................ [2] (ii) Explain in terms of energy transformations why the car, starting at Q, cannot pass S. .................................................................................................................................. .................................................................................................................................. ............................................................................................................................ [1] (b) A second car, of mass 0.12 kg, is released from P. It continues until it runs off the track at T. Calculate the maximum speed that the car could have at T assuming friction in the car is negligible. speed = ................................................ [3] [Total: 6]
Mark scheme: 2 (a) (i) down to R and up towards Q/S, then reverse OR equivalent OR back towards Q, then reverse B1 continues backward and forward until stops (at R) B1 (ii) idea of energy loss OR because of friction NOT PE/KE B1 (b) (PE lost =) 1.2 × 0.5 OR 0.6 (J) OR 0.12 × 10 × 0.5 OR mgh OR wt × dist C1 i.e. evidence of mgh 0.5 × 0.12 × v2 = mgh OR 0.6 etc. e.c.f. C1 i.e. evidence of ½mv2 3.16 OR 3.2 m/s c.a.o. A1 [Total: 6] IGCSE – October/November 2007 0625 03
Q3 · A spring of original length 3.0 cm is extended to a total length of 5.0 cm by a force of…
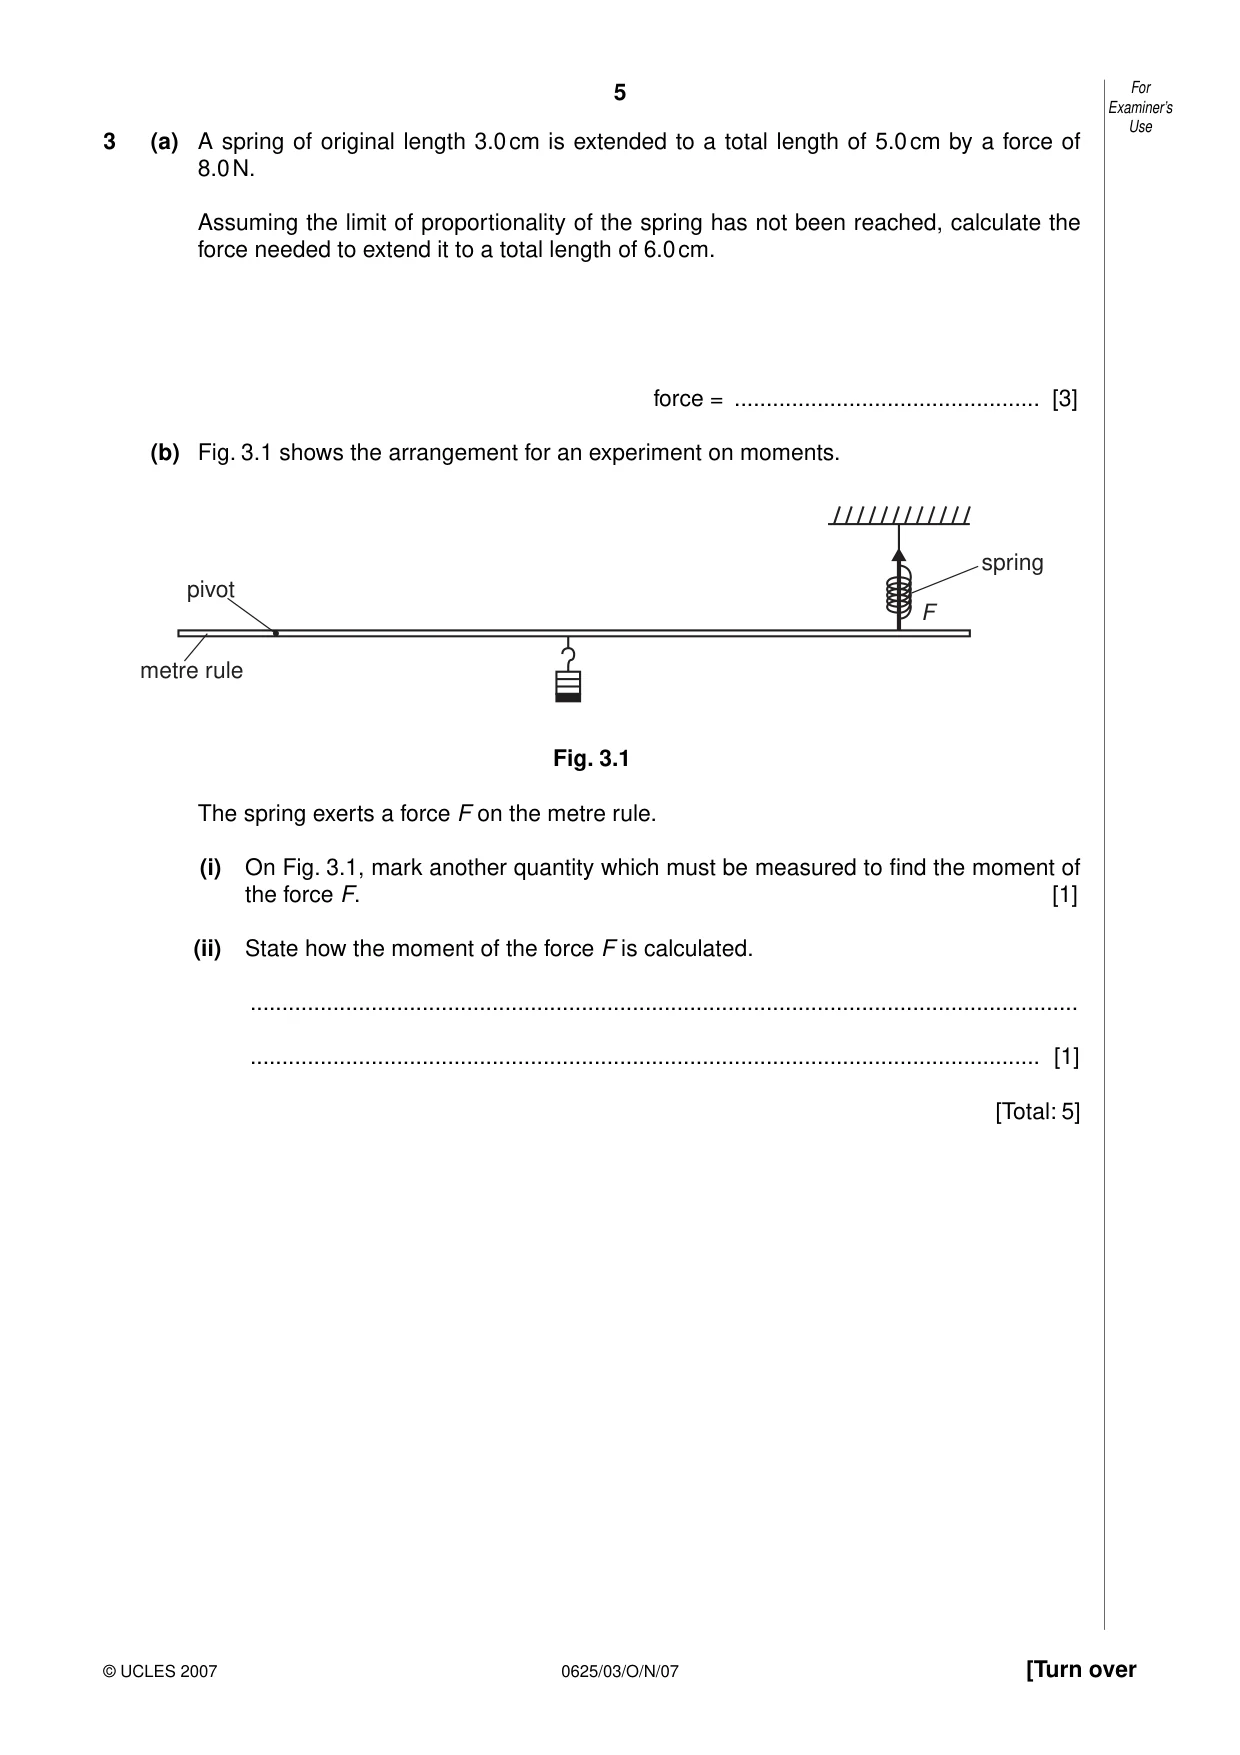
3 (a) A spring of original length 3.0 cm is extended to a total length of 5.0 cm by a force of 8.0 N. Assuming the limit of proportionality of the spring has not been reached, calculate the force needed to extend it to a total length of 6.0 cm. force = ................................................ [3] (b) Fig. 3.1 shows the arrangement for an experiment on moments. spring pivot F metre rule Fig. 3.1 The spring exerts a force F on the metre rule. (i) On Fig. 3.1, mark another quantity which must be measured to find the moment of the force F. [1] (ii) State how the moment of the force F is calculated. .................................................................................................................................. ............................................................................................................................ [1] [Total: 5]
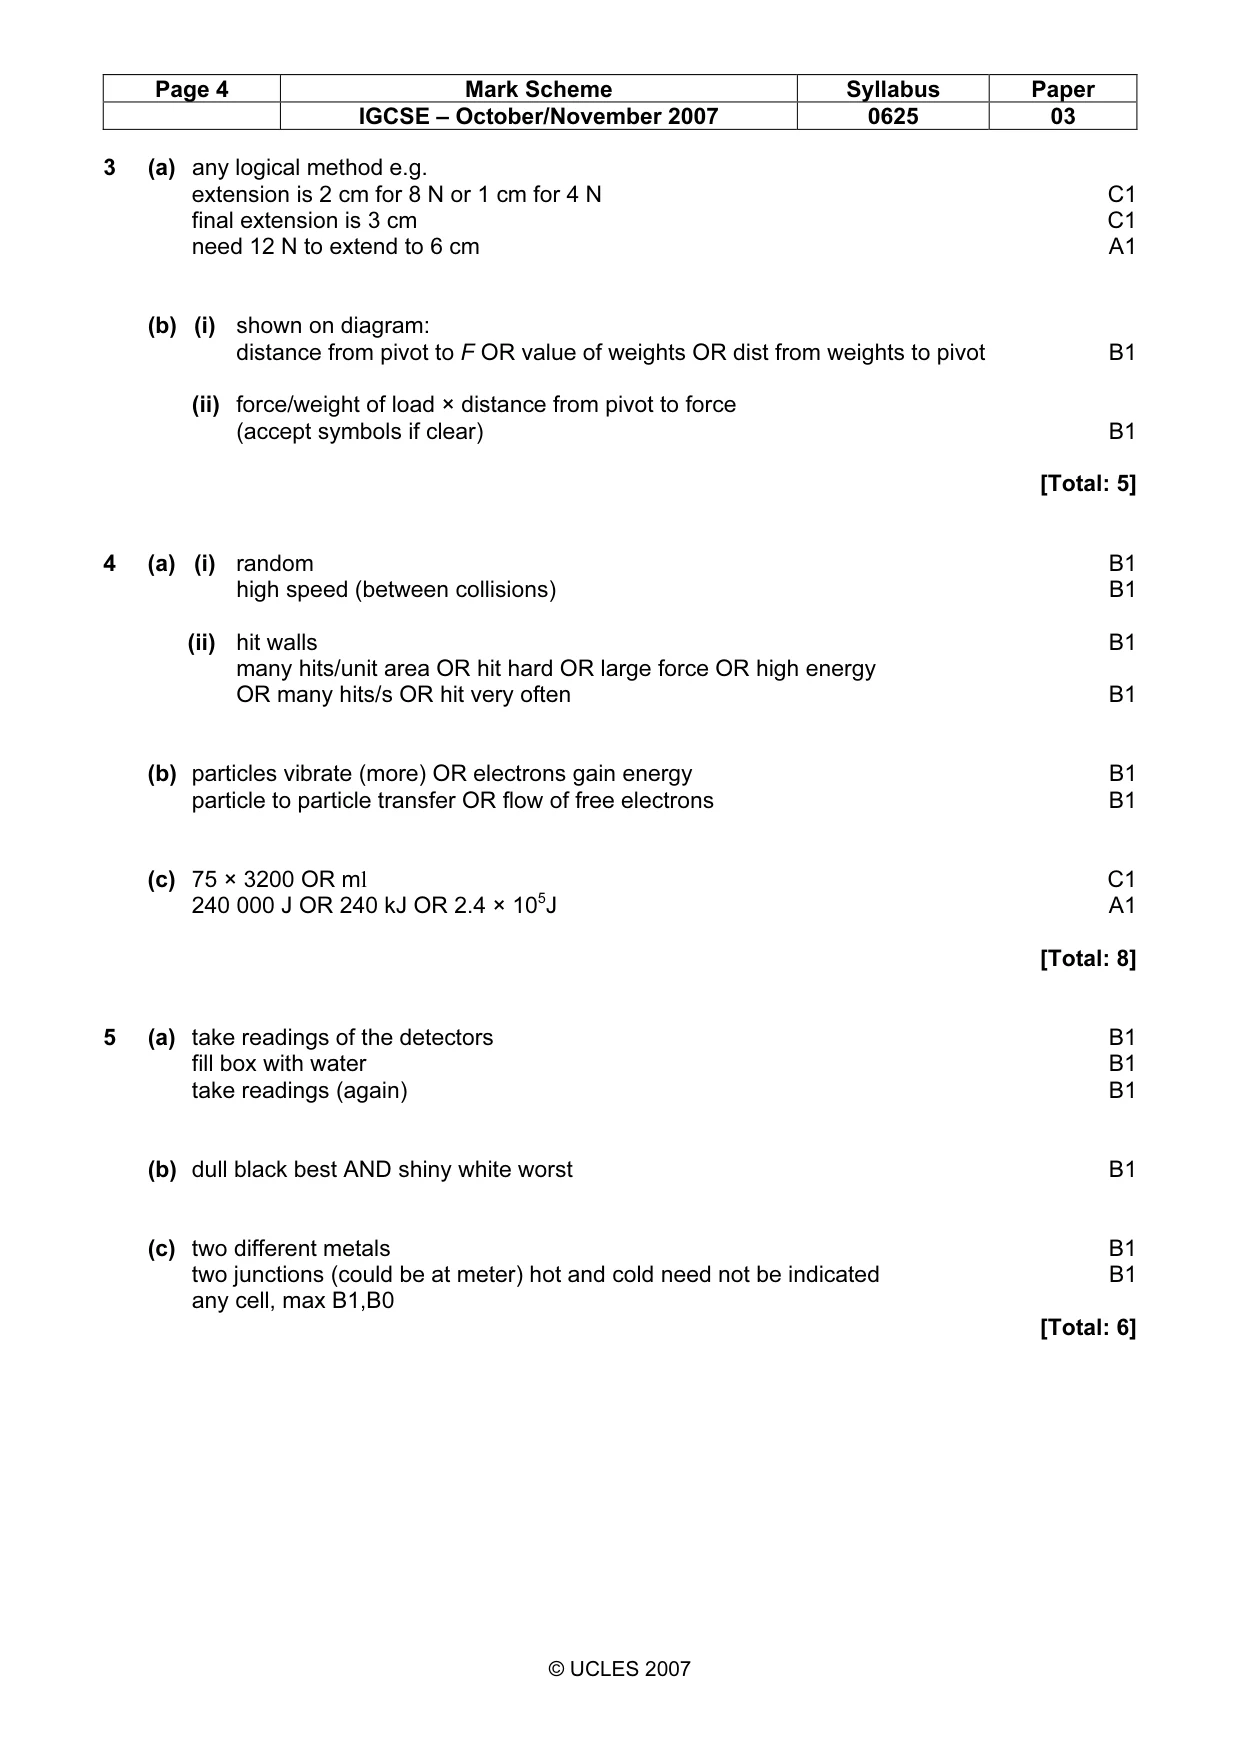
Mark scheme: 3 (a) any logical method e.g. extension is 2 cm for 8 N or 1 cm for 4 N C1 final extension is 3 cm C1 need 12 N to extend to 6 cm A1 (b) (i) shown on diagram: distance from pivot to F OR value of weights OR dist from weights to pivot B1 (ii) force/weight of load × distance from pivot to force (accept symbols if clear) B1 [Total: 5]
Q4 · A sealed steel cylinder filled with high pressure steam
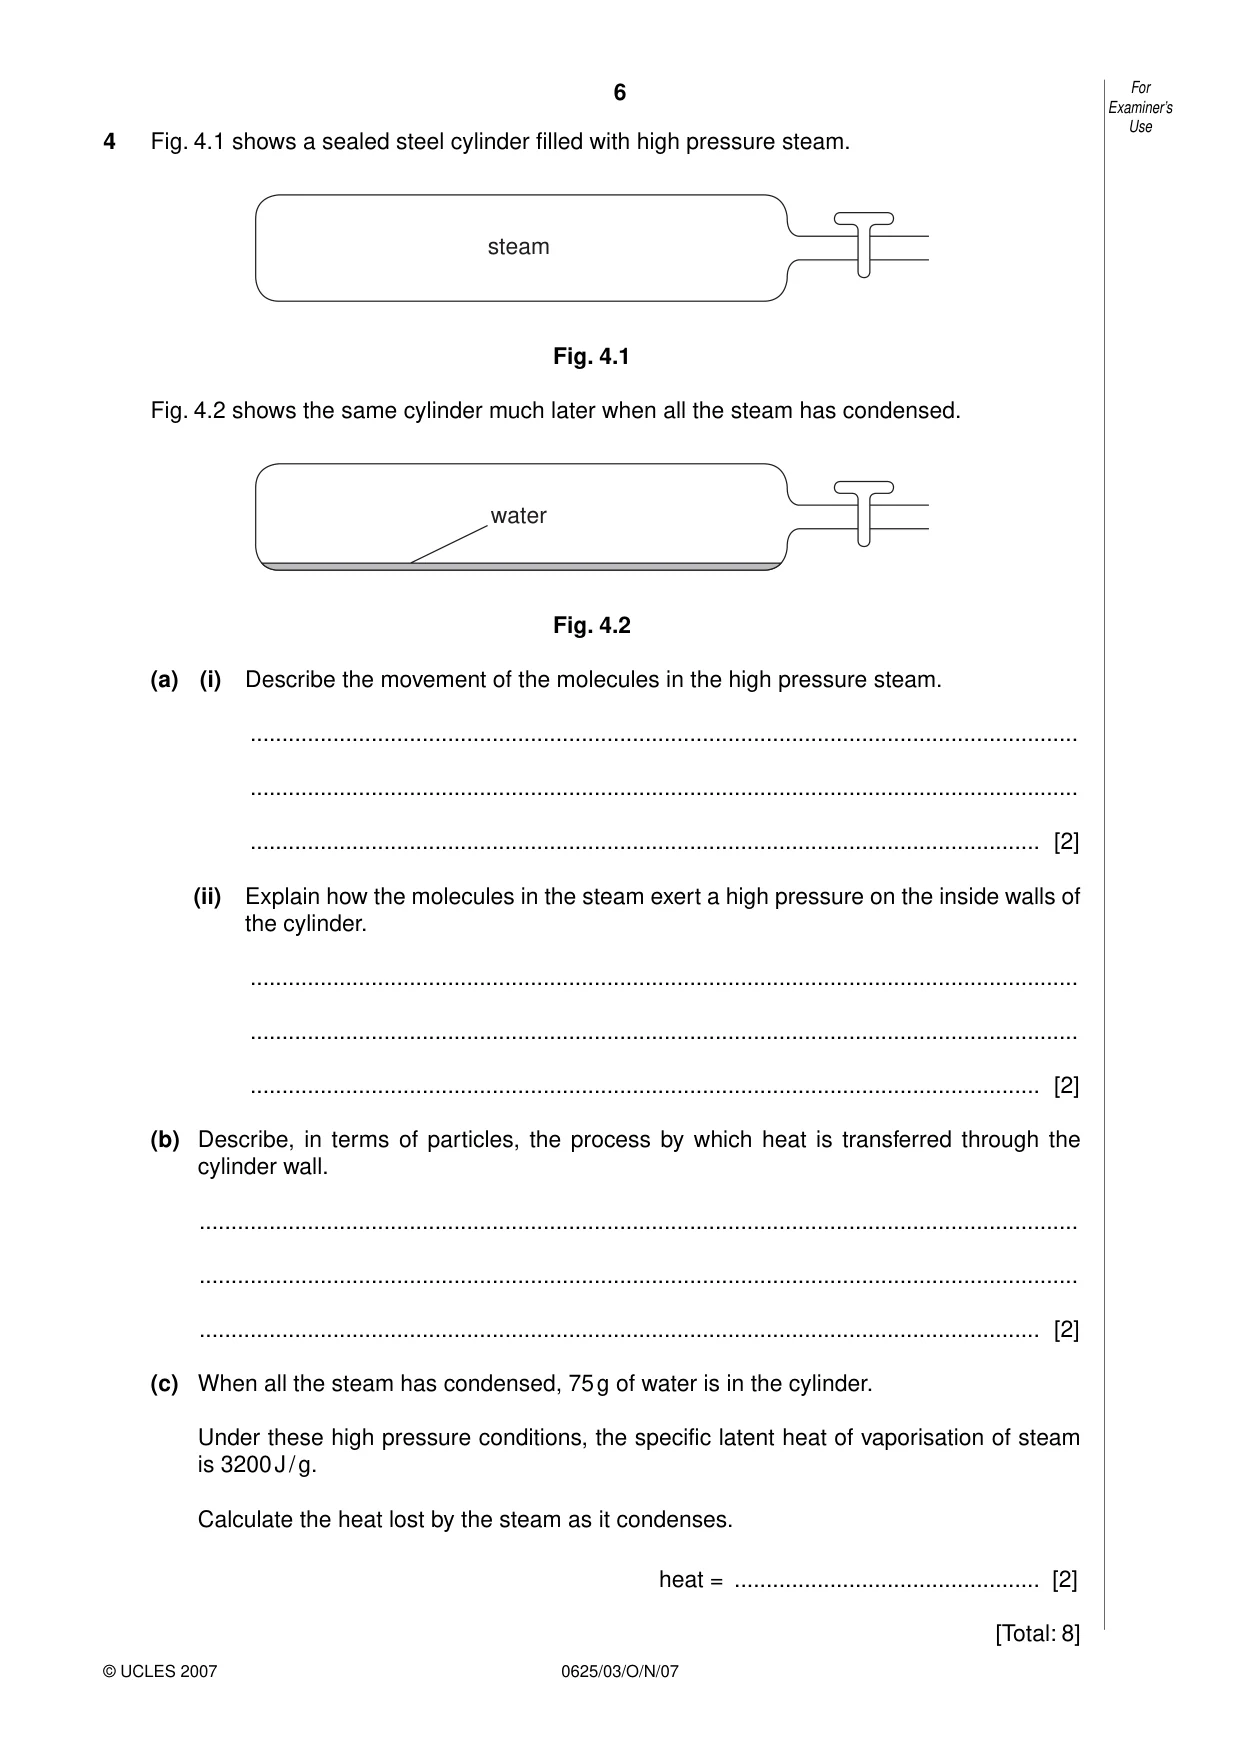
4 Fig. 4.1 shows a sealed steel cylinder filled with high pressure steam. steam Fig. 4.1 Fig. 4.2 shows the same cylinder much later when all the steam has condensed. water Fig. 4.2 (a) (i) Describe the movement of the molecules in the high pressure steam. .................................................................................................................................. .................................................................................................................................. ............................................................................................................................ [2] (ii) Explain how the molecules in the steam exert a high pressure on the inside walls of the cylinder. .................................................................................................................................. .................................................................................................................................. ............................................................................................................................ [2] (b) Describe, in terms of particles, the process by which heat is transferred through the cylinder wall. .......................................................................................................................................... .......................................................................................................................................... .................................................................................................................................... [2] (c) When all the steam has condensed, 75 g of water is in the cylinder. Under these high pressure conditions, the specific latent heat of vaporisation of steam is 3200 J / g. Calculate the heat lost by the steam as it condenses. heat = ................................................ [2] [Total: 8]
Mark scheme: 4 (a) (i) random B1 high speed (between collisions) B1 (ii) hit walls B1 many hits/unit area OR hit hard OR large force OR high energy OR many hits/s OR hit very often B1 (b) particles vibrate (more) OR electrons gain energy B1 particle to particle transfer OR flow of free electrons B1 (c) 75 × 3200 OR ml C1 240 000 J OR 240 kJ OR 2.4 × 10⁵J A1 [Total: 8]
Q5 · Some apparatus which is to be used to compare the emission of infra-red radiation from…
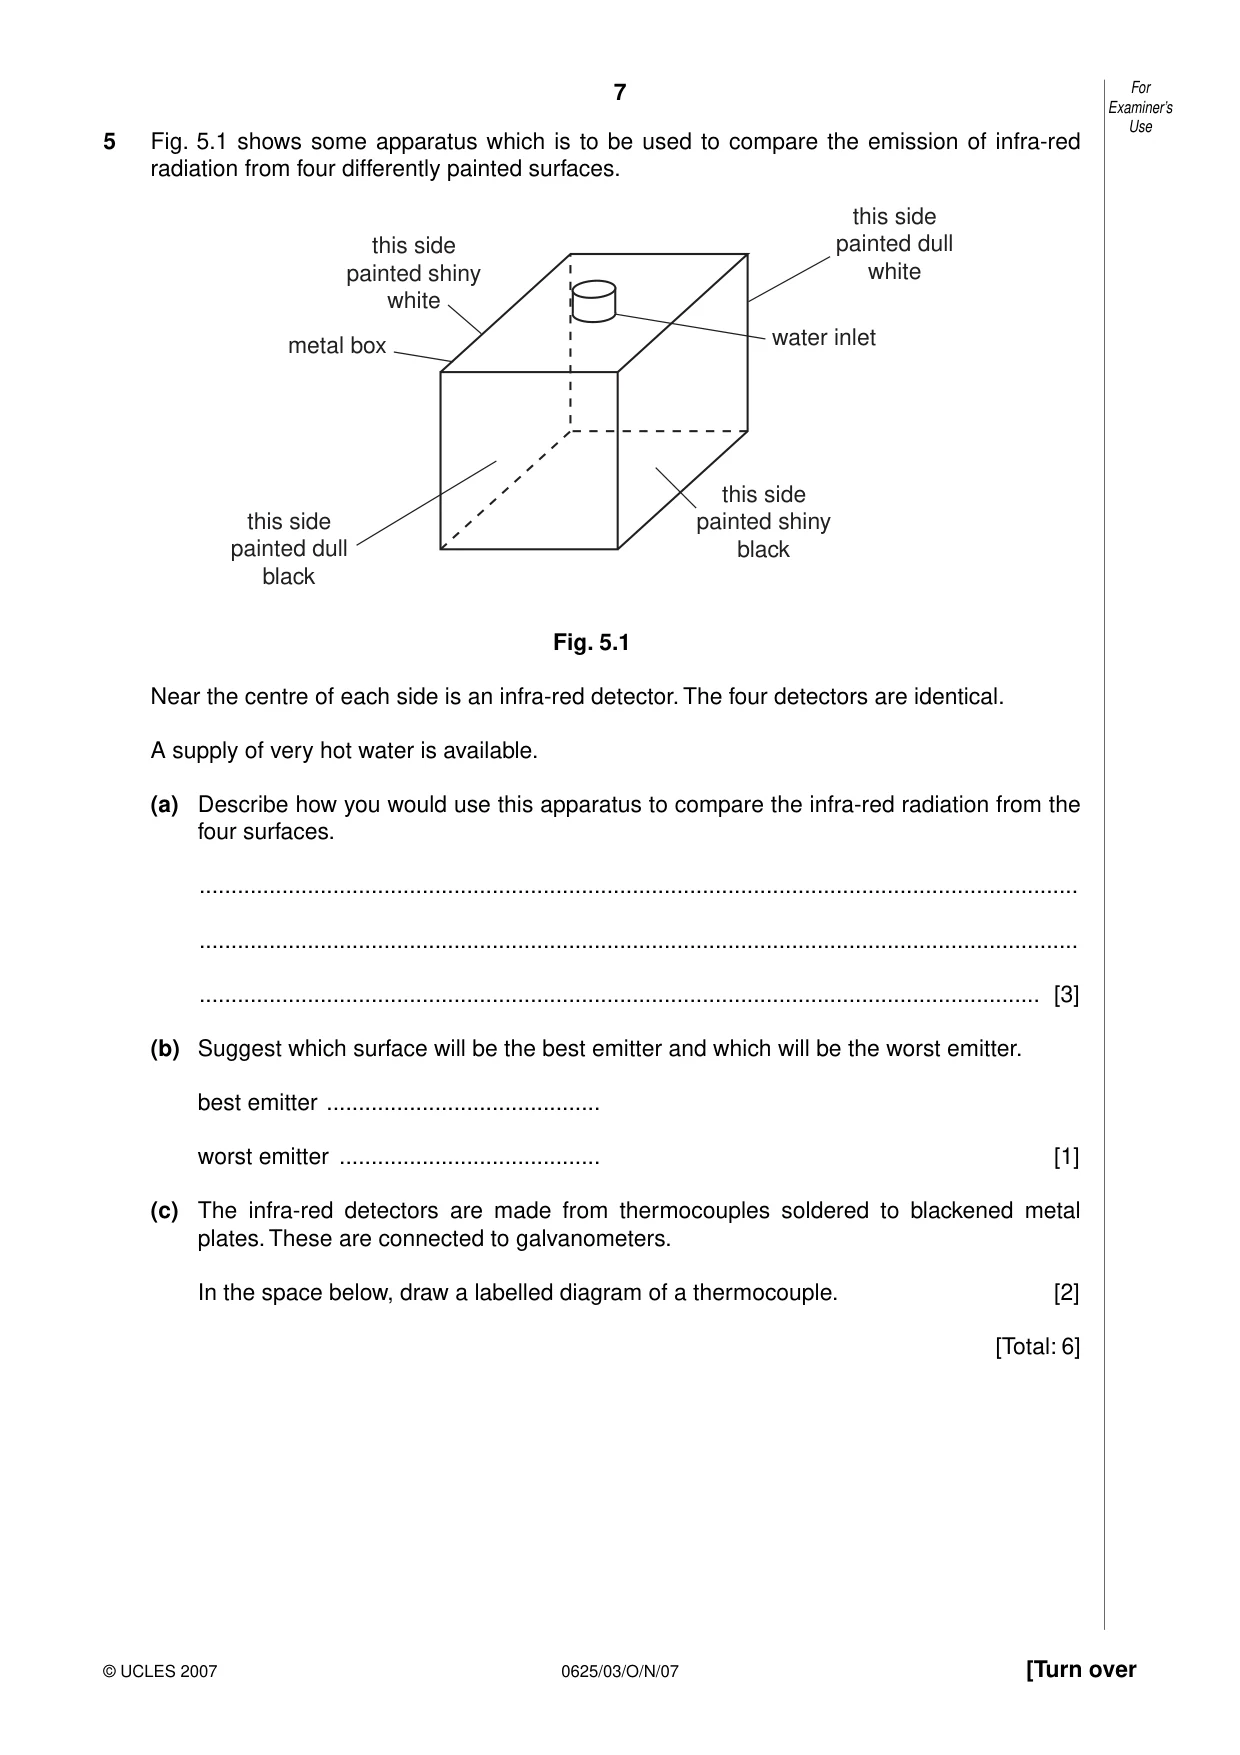
5 Fig. 5.1 shows some apparatus which is to be used to compare the emission of infra-red radiation from four differently painted surfaces. this side this side painted dull painted shiny white white water inlet metal box this side this side painted shiny painted dull black black Fig. 5.1 Near the centre of each side is an infra-red detector. The four detectors are identical. A supply of very hot water is available. (a) Describe how you would use this apparatus to compare the infra-red radiation from the four surfaces. .......................................................................................................................................... .......................................................................................................................................... .................................................................................................................................... [3] (b) Suggest which surface will be the best emitter and which will be the worst emitter. best emitter ........................................... worst emitter ......................................... [1] (c) The infra-red detectors are made from thermocouples soldered to blackened metal plates. These are connected to galvanometers. In the space below, draw a labelled diagram of a thermocouple. [2] [Total: 6]
Mark scheme: 5 (a) take readings of the detectors B1 fill box with water B1 take readings (again) B1 (b) dull black best AND shiny white worst B1 (c) two different metals B1 two junctions (could be at meter) hot and cold need not be indicated B1 any cell, max B1,B0 [Total: 6] IGCSE – October/November 2007 0625 03
Q6 · Virtual images may be formed by both plane mirrors and by convex lenses
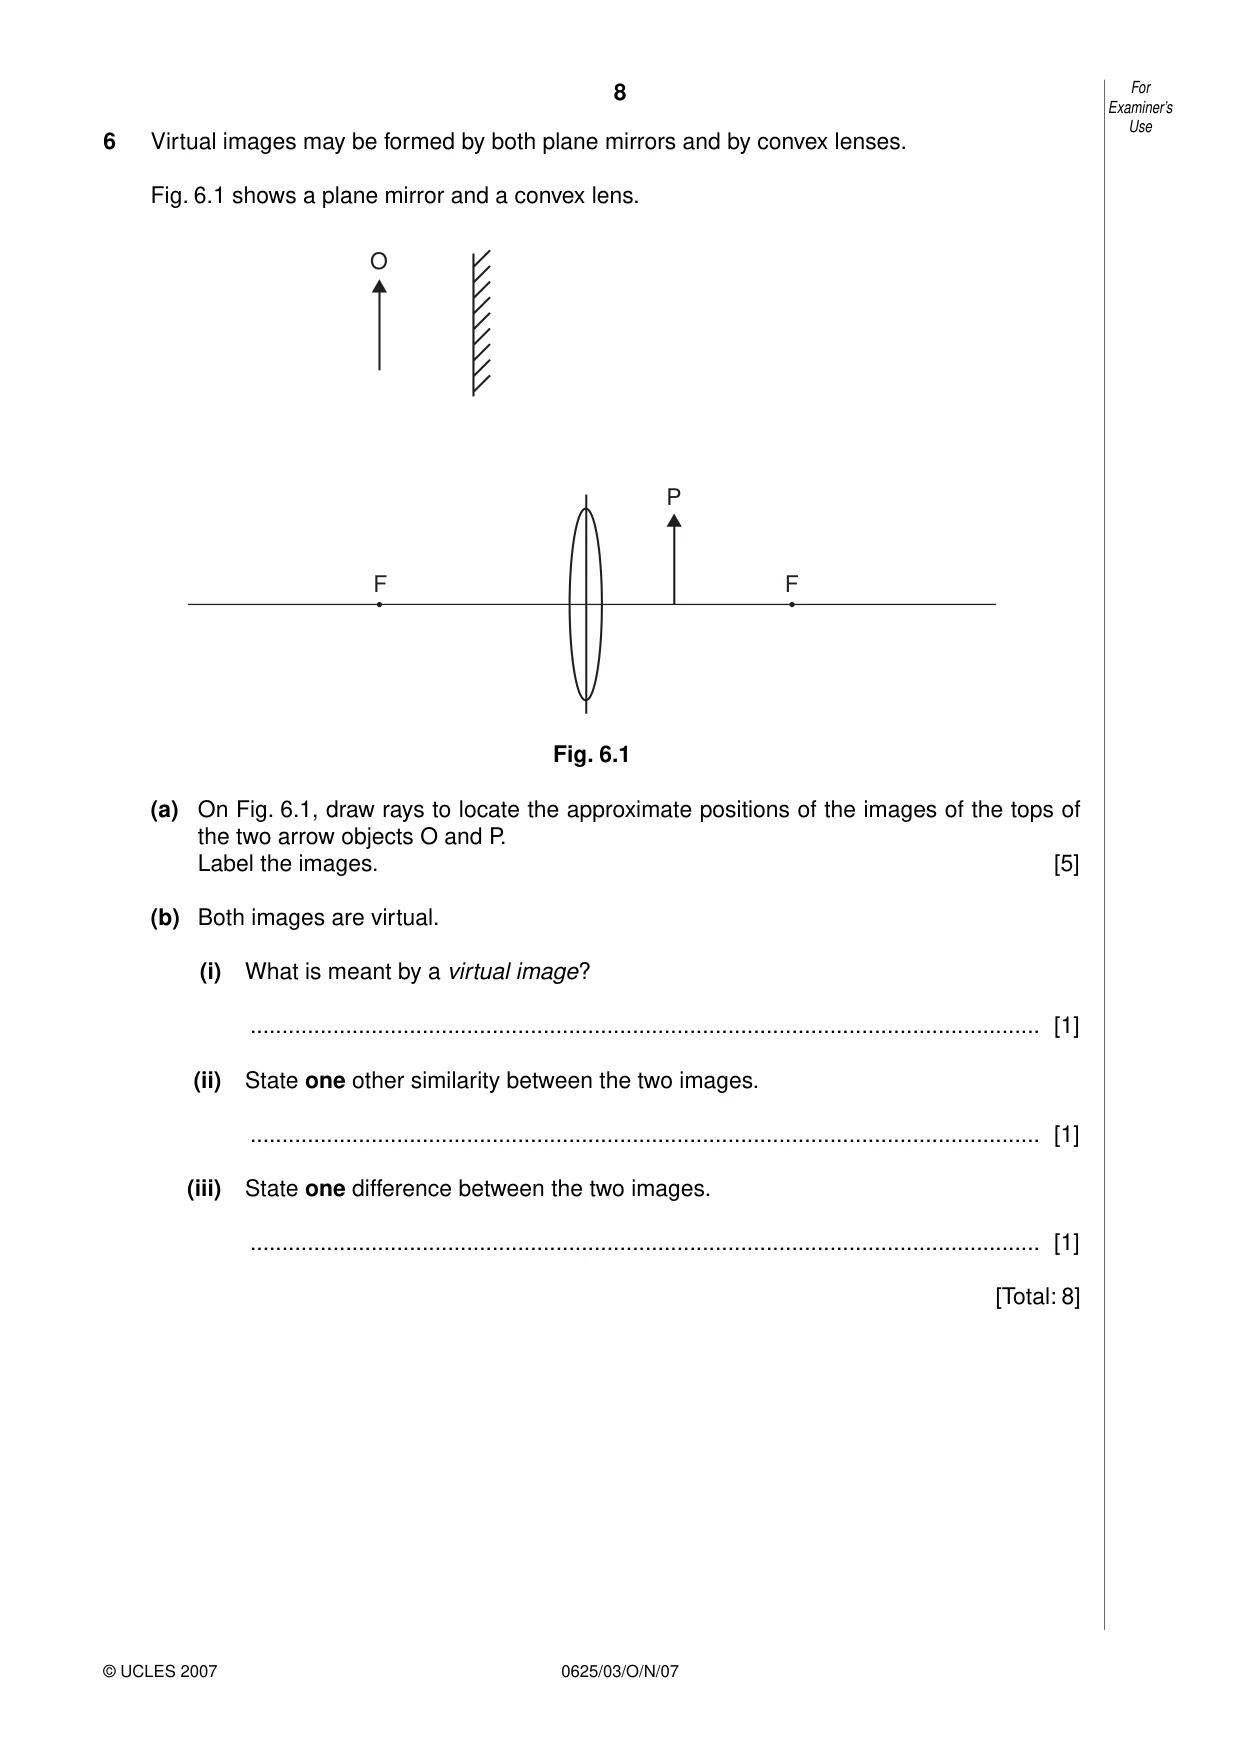
6 Virtual images may be formed by both plane mirrors and by convex lenses. Fig. 6.1 shows a plane mirror and a convex lens. O P F F Fig. 6.1 (a) On Fig. 6.1, draw rays to locate the approximate positions of the images of the tops of the two arrow objects O and P. Label the images. [5] (b) Both images are virtual. (i) What is meant by a virtual image? ............................................................................................................................ [1] (ii) State one other similarity between the two images. ............................................................................................................................ [1] (iii) State one difference between the two images. ............................................................................................................................ [1] [Total: 8]
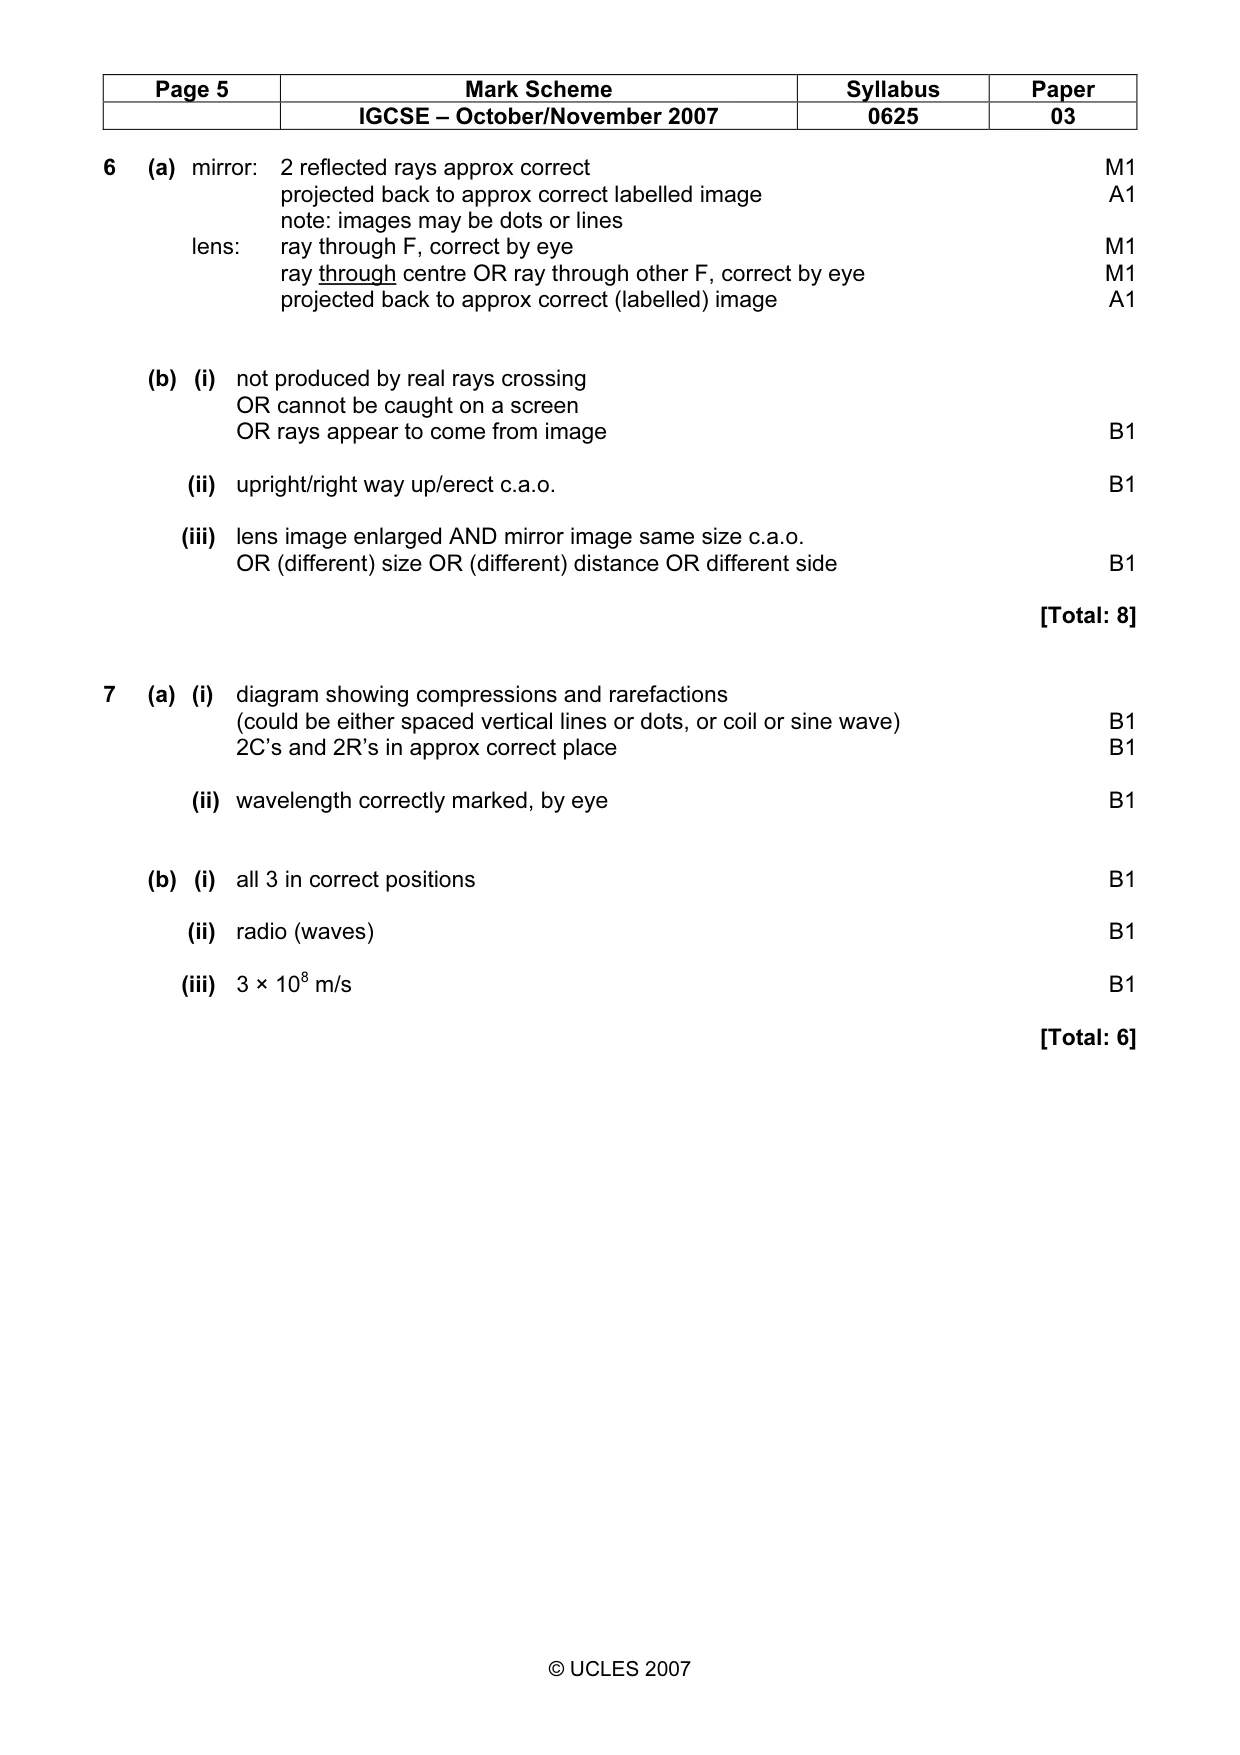
Mark scheme: 6 (a) mirror: 2 reflected rays approx correct M1 projected back to approx correct labelled image A1 note: images may be dots or lines lens: ray through F, correct by eye M1 ray through centre OR ray through other F, correct by eye M1 projected back to approx correct (labelled) image A1 (b) (i) not produced by real rays crossing OR cannot be caught on a screen OR rays appear to come from image B1 (ii) upright/right way up/erect c.a.o. B1 (iii) lens image enlarged AND mirror image same size c.a.o. OR (different) size OR (different) distance OR different side B1 [Total: 8]
Q7 · In the space below, draw a diagram to represent a sound wave
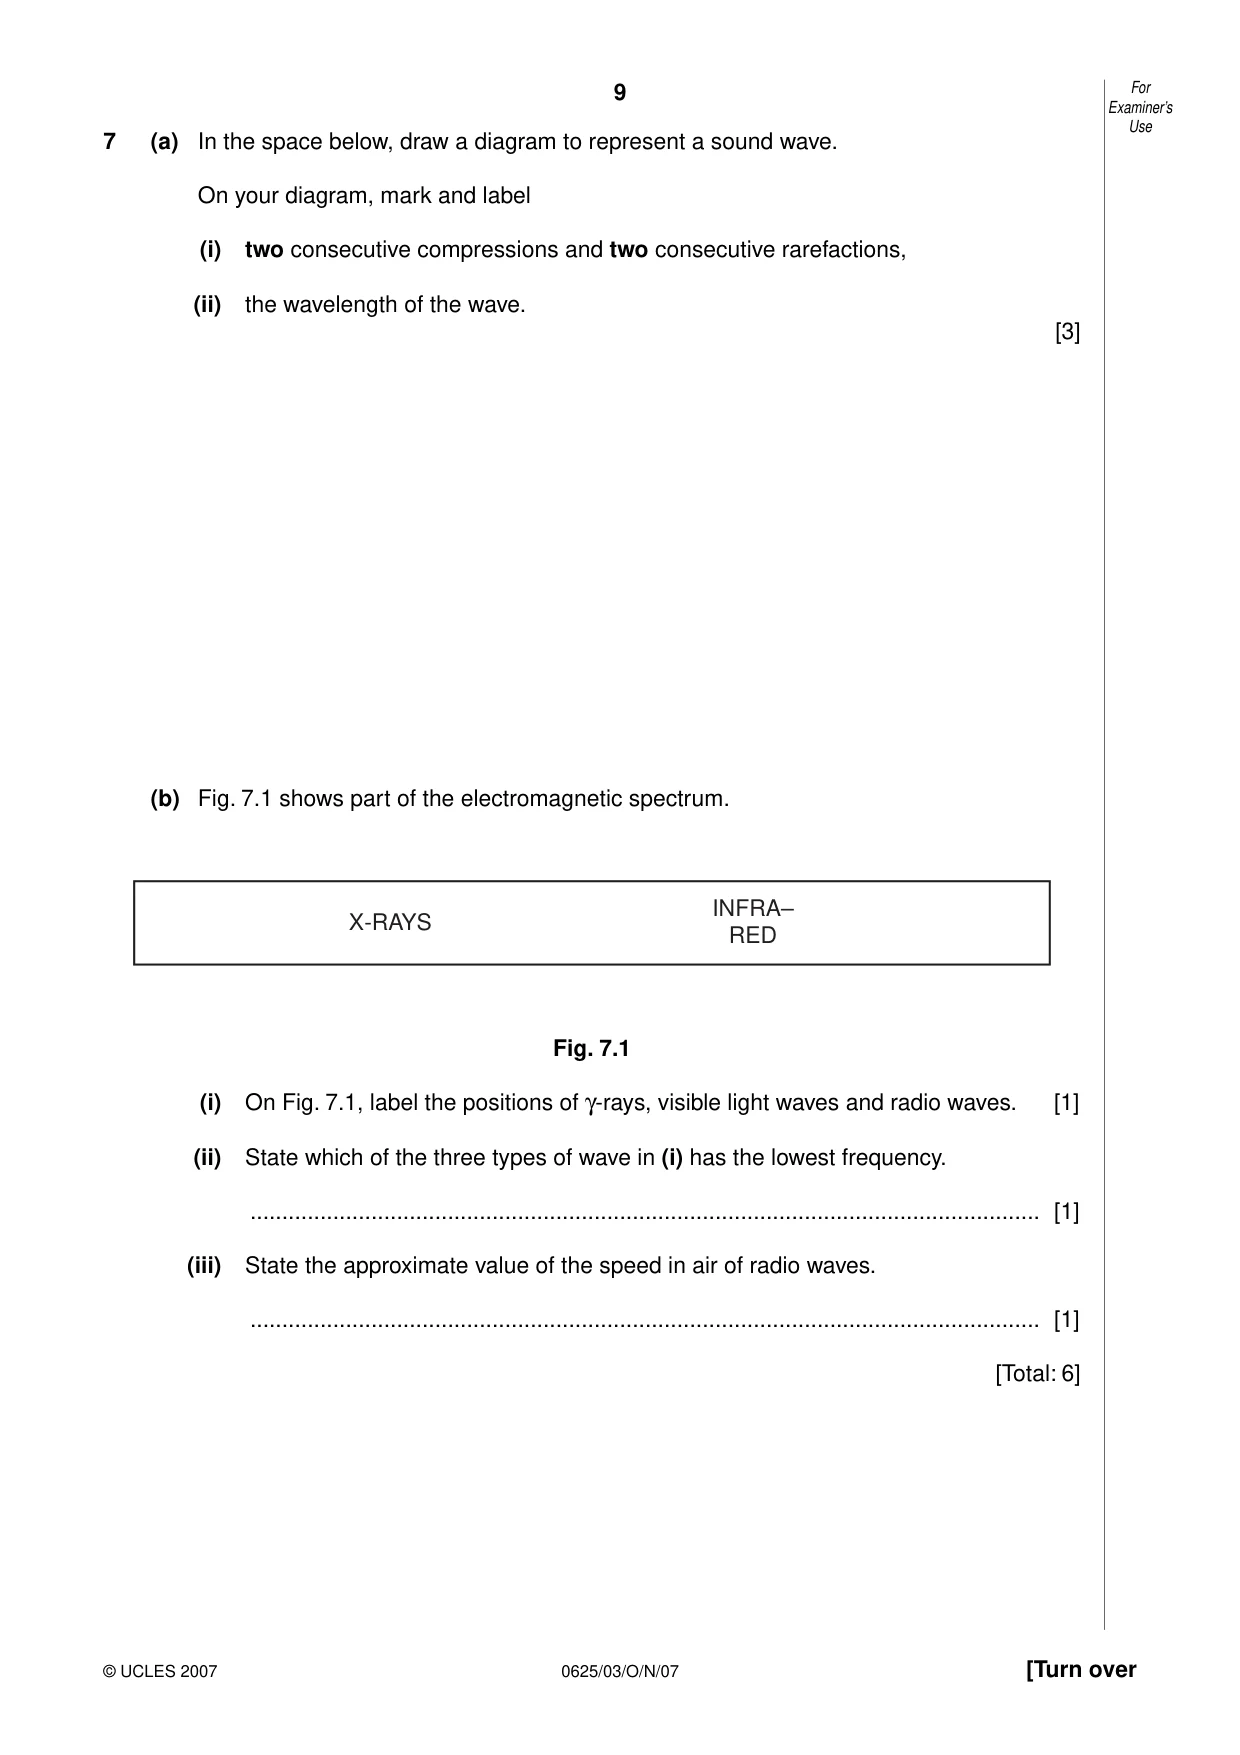
7 (a) In the space below, draw a diagram to represent a sound wave. On your diagram, mark and label (i) two consecutive compressions and two consecutive rarefactions, (ii) the wavelength of the wave. [3] (b) Fig. 7.1 shows part of the electromagnetic spectrum. INFRA– X-RAYS RED Fig. 7.1 (i) On Fig. 7.1, label the positions of γ-rays, visible light waves and radio waves. [1] (ii) State which of the three types of wave in (i) has the lowest frequency. ............................................................................................................................ [1] (iii) State the approximate value of the speed in air of radio waves. ............................................................................................................................ [1] [Total: 6]
Mark scheme: 7 (a) (i) diagram showing compressions and rarefactions (could be either spaced vertical lines or dots, or coil or sine wave) B1 2C’s and 2R’s in approx correct place B1 (ii) wavelength correctly marked, by eye B1 (b) (i) all 3 in correct positions B1 (ii) radio (waves) B1 (iii) 3 × 10⁸ m/s B1 [Total: 6] IGCSE – October/November 2007 0625 03
Question 8
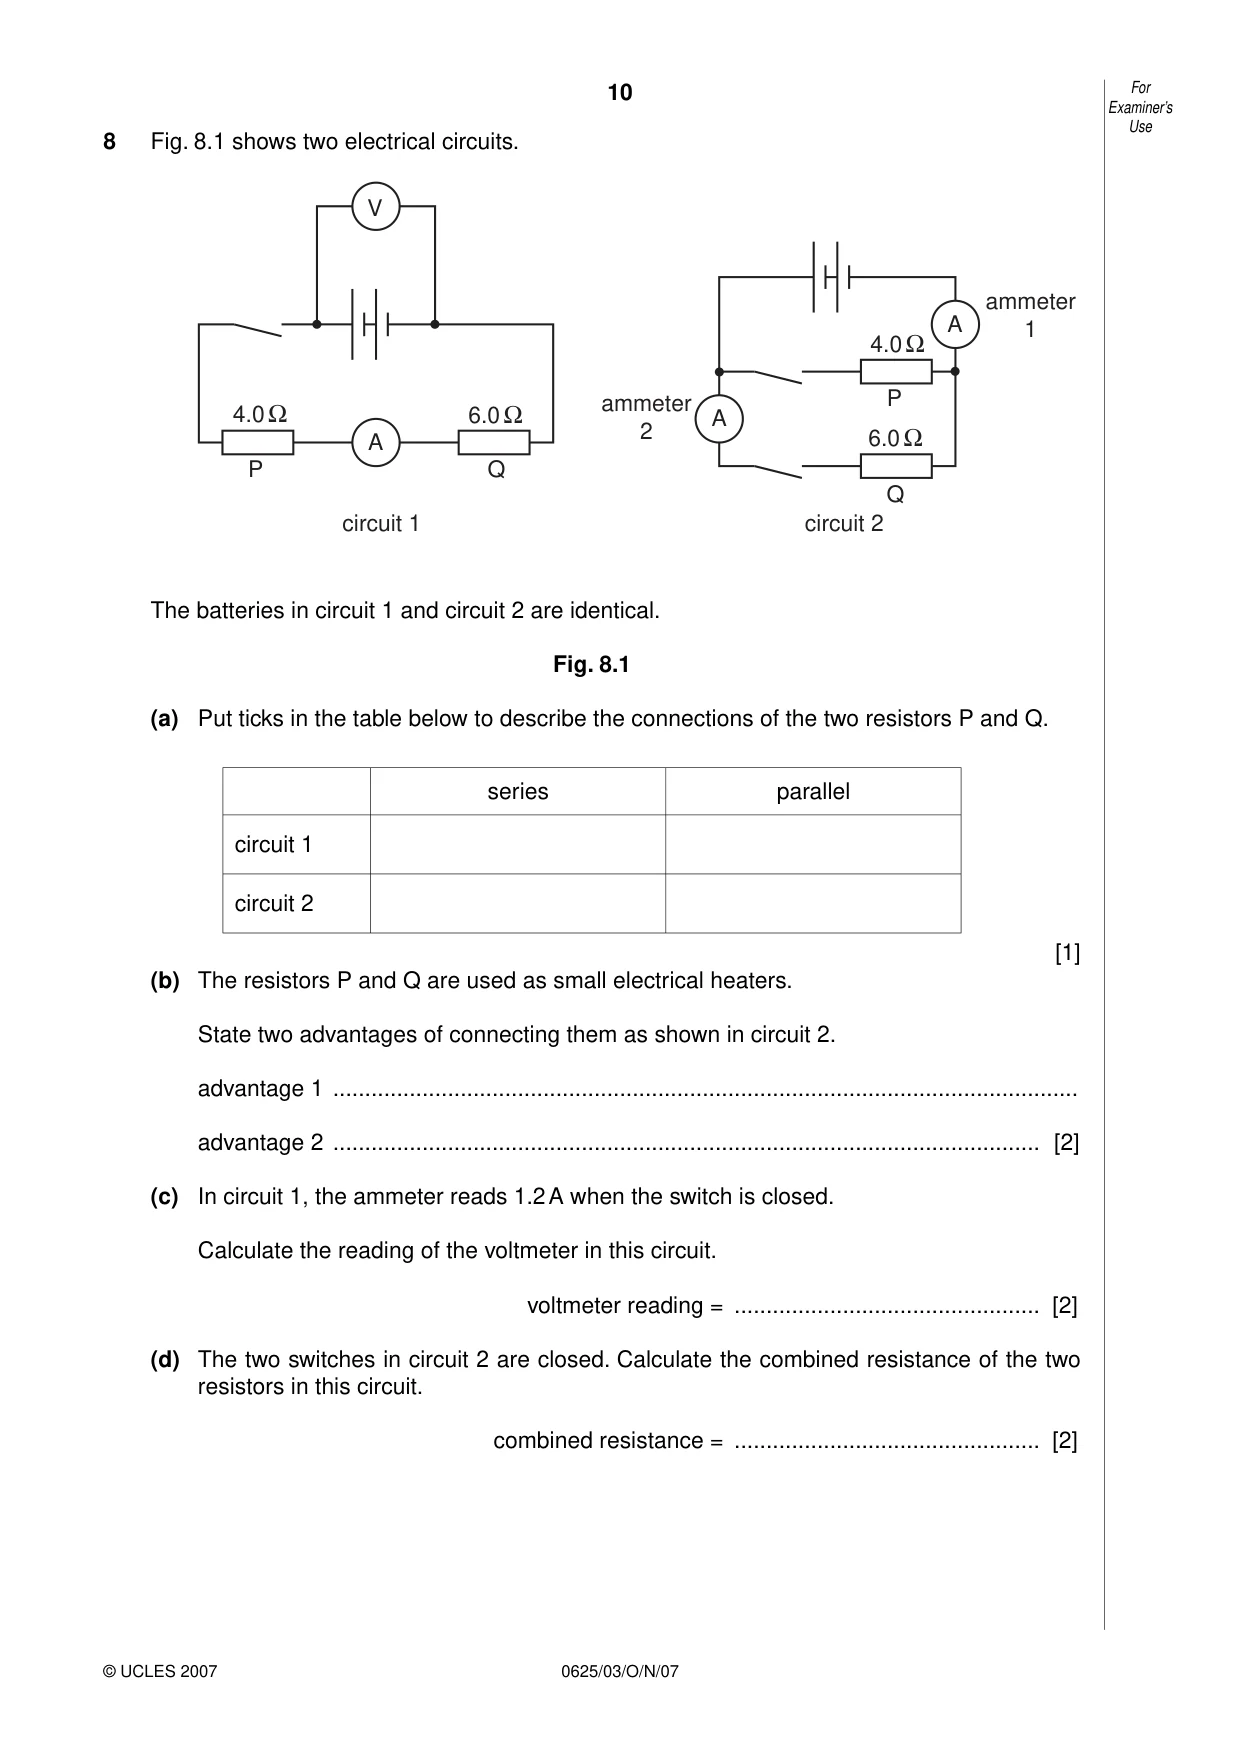
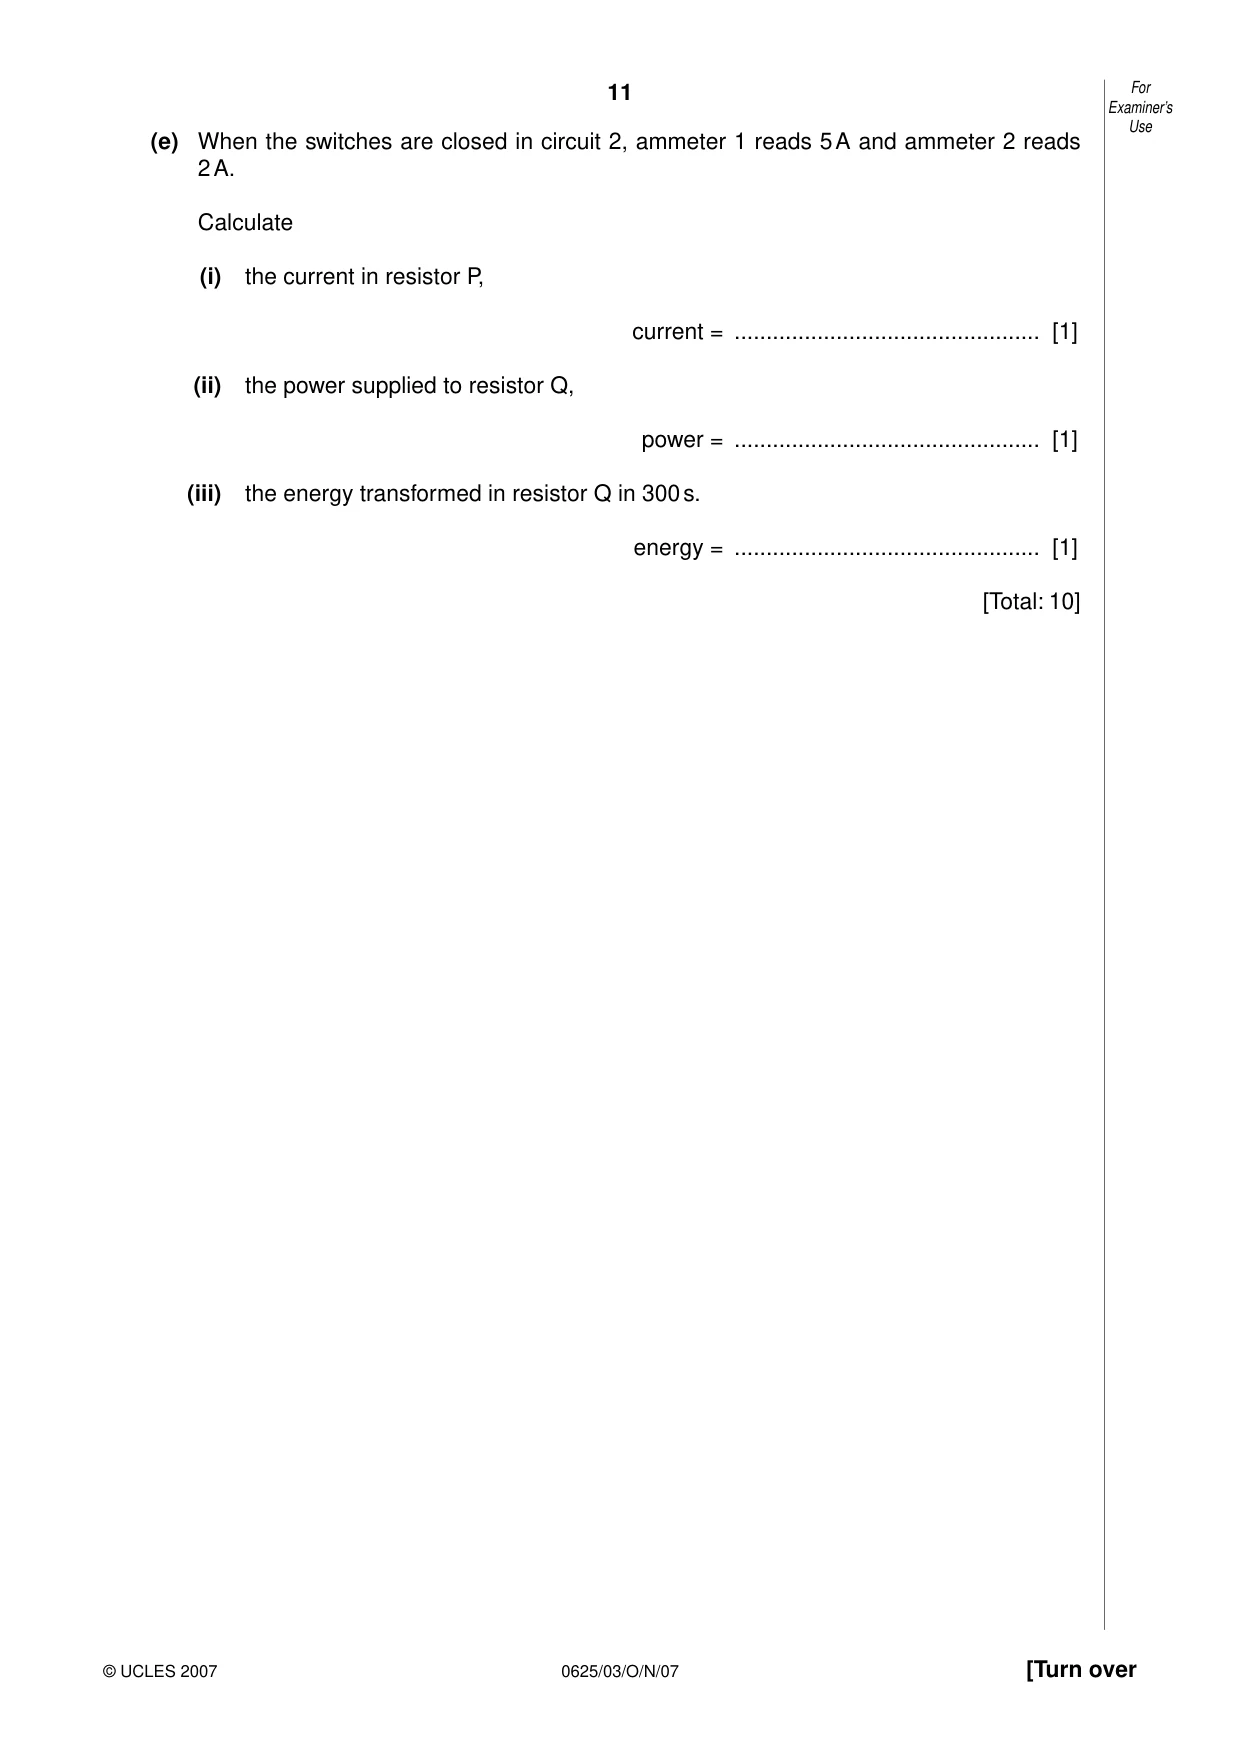
8 Fig. 8.1 shows two electrical circuits. V ammeter A 1 4.0 Ω ammeter P 4.0 Ω 6.0 Ω A 2 A 6.0 Ω P Q Q circuit 1 circuit 2 The batteries in circuit 1 and circuit 2 are identical. Fig. 8.1 (a) Put ticks in the table below to describe the connections of the two resistors P and Q. series parallel circuit 1 circuit 2 [1] (b) The resistors P and Q are used as small electrical heaters. State two advantages of connecting them as shown in circuit 2. advantage 1 ..................................................................................................................... advantage 2 ............................................................................................................... [2] (c) In circuit 1, the ammeter reads 1.2 A when the switch is closed. Calculate the reading of the voltmeter in this circuit. voltmeter reading = ................................................ [2] (d) The two switches in circuit 2 are closed. Calculate the combined resistance of the two resistors in this circuit. combined resistance = ................................................ [2] Examiner’s Use (e) When the switches are closed in circuit 2, ammeter 1 reads 5 A and ammeter 2 reads 2 A. Calculate (i) the current in resistor P, current = ................................................ [1] (ii) the power supplied to resistor Q, power = ................................................ [1] (iii) the energy transformed in resistor Q in 300 s. energy = ................................................ [1] [Total: 10]
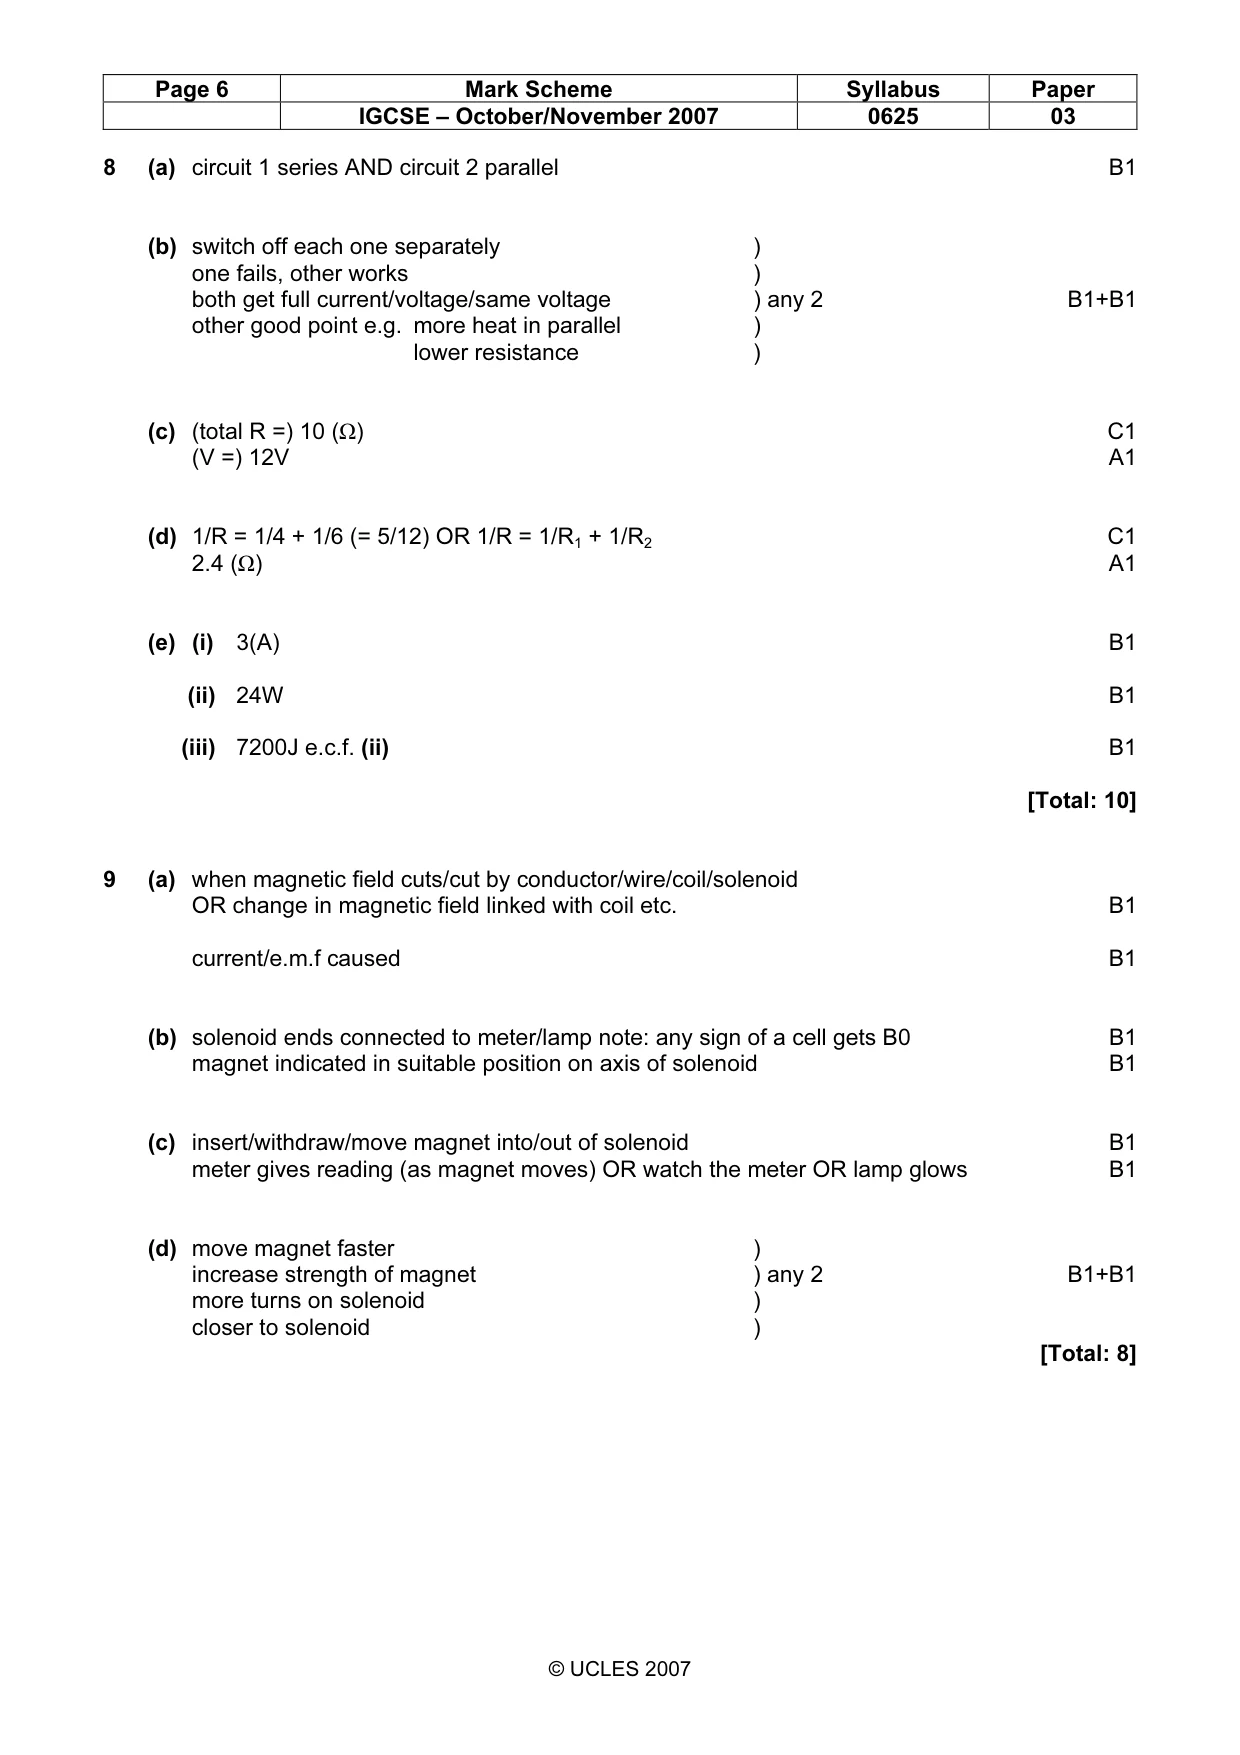
Mark scheme: 8 (a) circuit 1 series AND circuit 2 parallel B1 (b) switch off each one separately ) one fails, other works ) both get full current/voltage/same voltage ) any 2 B1+B1 other good point e.g. more heat in parallel ) lower resistance ) (c) (total R =) 10 (Ω) C1 (V =) 12V A1 (d) 1/R = 1/4 + 1/6 (= 5/12) OR 1/R = 1/R1 + 1/R2 C1 2.4 (Ω) A1 (e) (i) 3(A) B1 (ii) 24W B1 (iii) 7200J e.c.f. (ii) B1 [Total: 10]
Q9 · Electromagnetic induction may be demonstrated using a magnet, a solenoid and other…
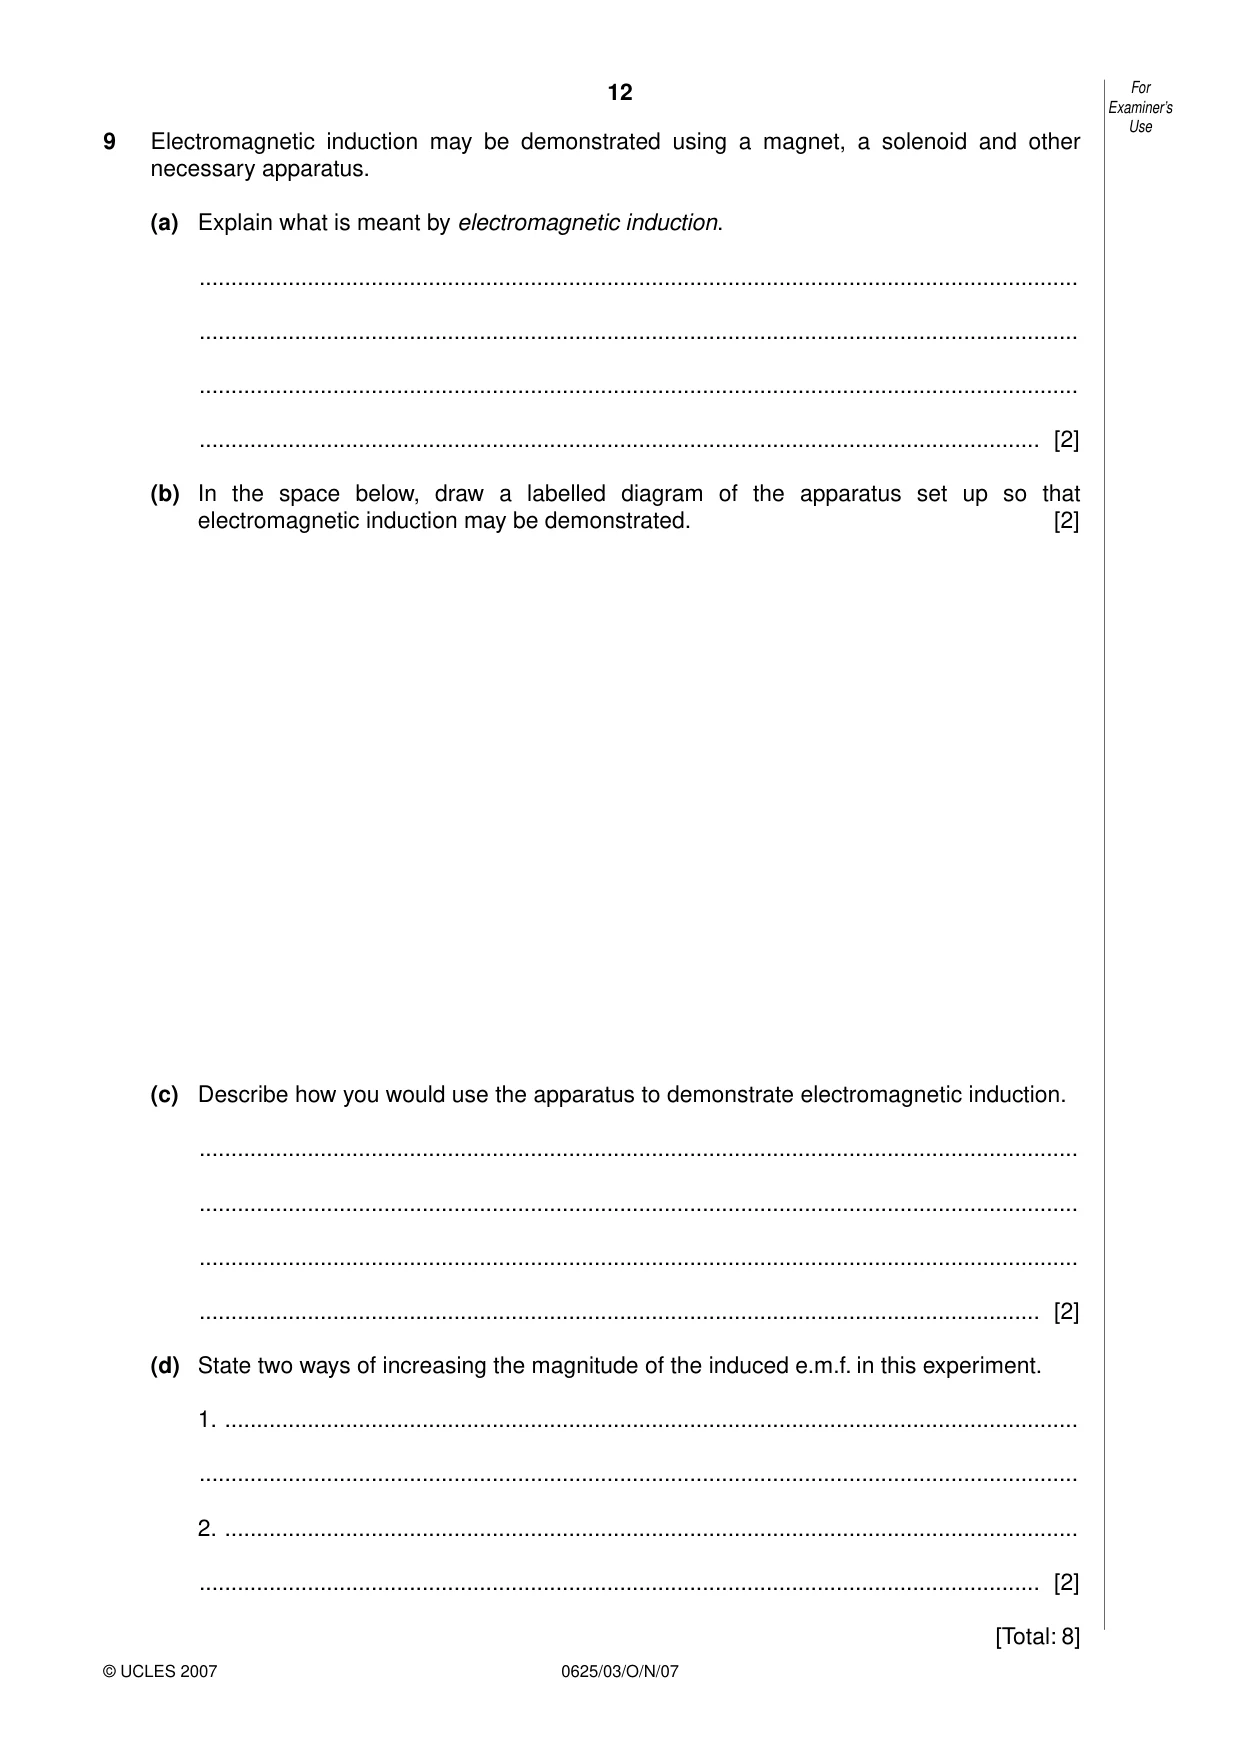
9 Electromagnetic induction may be demonstrated using a magnet, a solenoid and other necessary apparatus. (a) Explain what is meant by electromagnetic induction. .......................................................................................................................................... .......................................................................................................................................... .......................................................................................................................................... .................................................................................................................................... [2] (b) In the space below, draw a labelled diagram of the apparatus set up so that electromagnetic induction may be demonstrated. [2] (c) Describe how you would use the apparatus to demonstrate electromagnetic induction. .......................................................................................................................................... .......................................................................................................................................... .......................................................................................................................................... .................................................................................................................................... [2] (d) State two ways of increasing the magnitude of the induced e.m.f. in this experiment. 1. ...................................................................................................................................... .......................................................................................................................................... 2. ...................................................................................................................................... .................................................................................................................................... [2] [Total: 8]
Mark scheme: 9 (a) when magnetic field cuts/cut by conductor/wire/coil/solenoid OR change in magnetic field linked with coil etc. B1 current/e.m.f caused B1 (b) solenoid ends connected to meter/lamp note: any sign of a cell gets B0 B1 magnet indicated in suitable position on axis of solenoid B1 (c) insert/withdraw/move magnet into/out of solenoid B1 meter gives reading (as magnet moves) OR watch the meter OR lamp glows B1 (d) move magnet faster ) increase strength of magnet ) any 2 B1+B1 more turns on solenoid ) closer to solenoid ) [Total: 8] IGCSE – October/November 2007 0625 03
Q10 · An AND gate with two inputs A and B and one output
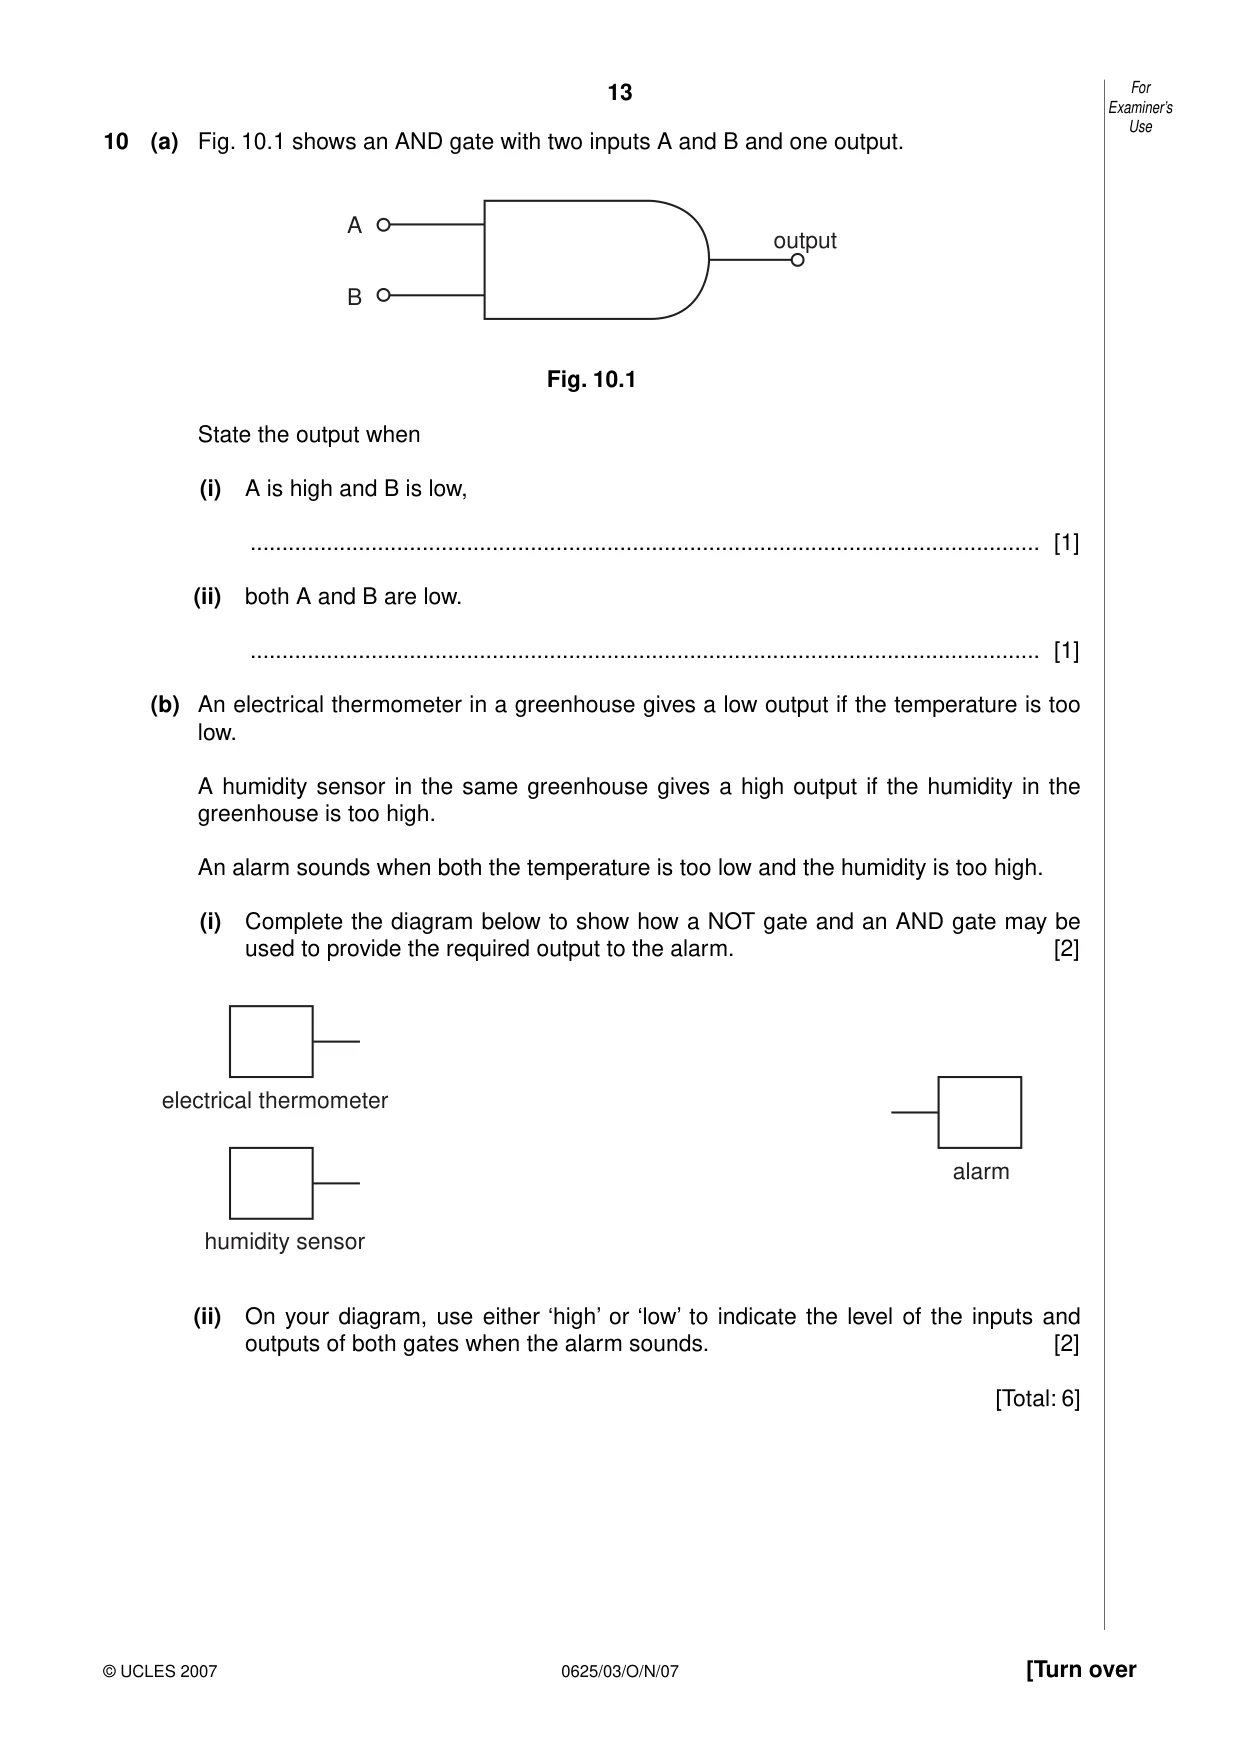
10 (a) Fig. 10.1 shows an AND gate with two inputs A and B and one output. A output B Fig. 10.1 State the output when (i) A is high and B is low, ............................................................................................................................ [1] (ii) both A and B are low. ............................................................................................................................ [1] (b) An electrical thermometer in a greenhouse gives a low output if the temperature is too low. A humidity sensor in the same greenhouse gives a high output if the humidity in the greenhouse is too high. An alarm sounds when both the temperature is too low and the humidity is too high. (i) Complete the diagram below to show how a NOT gate and an AND gate may be used to provide the required output to the alarm. [2] electrical thermometer alarm humidity sensor (ii) On your diagram, use either ‘high’ or ‘low’ to indicate the level of the inputs and outputs of both gates when the alarm sounds. [2] [Total: 6]
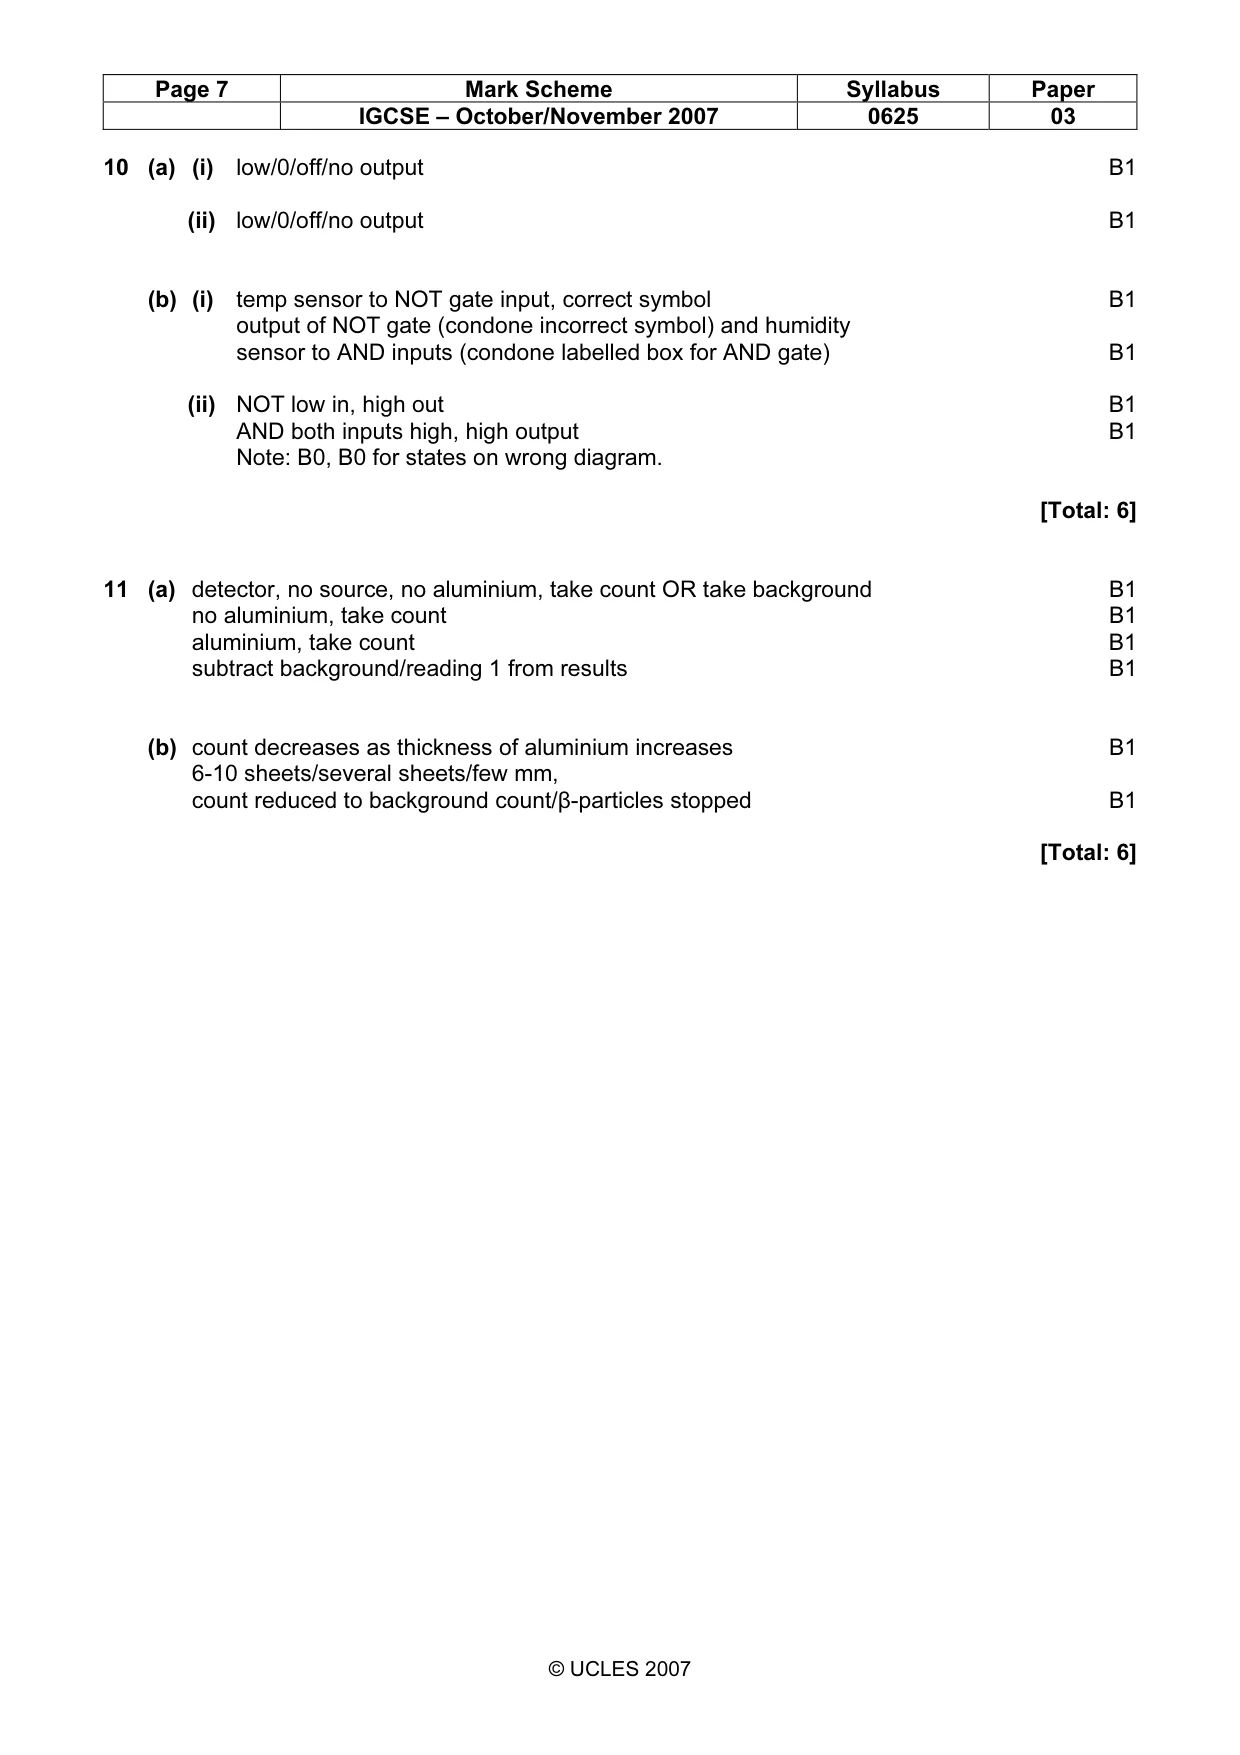
Mark scheme: 10 (a) (i) low/0/off/no output B1 (ii) low/0/off/no output B1 (b) (i) temp sensor to NOT gate input, correct symbol B1 output of NOT gate (condone incorrect symbol) and humidity sensor to AND inputs (condone labelled box for AND gate) B1 (ii) NOT low in, high out B1 AND both inputs high, high output B1 Note: B0, B0 for states on wrong diagram. [Total: 6]
Question 11
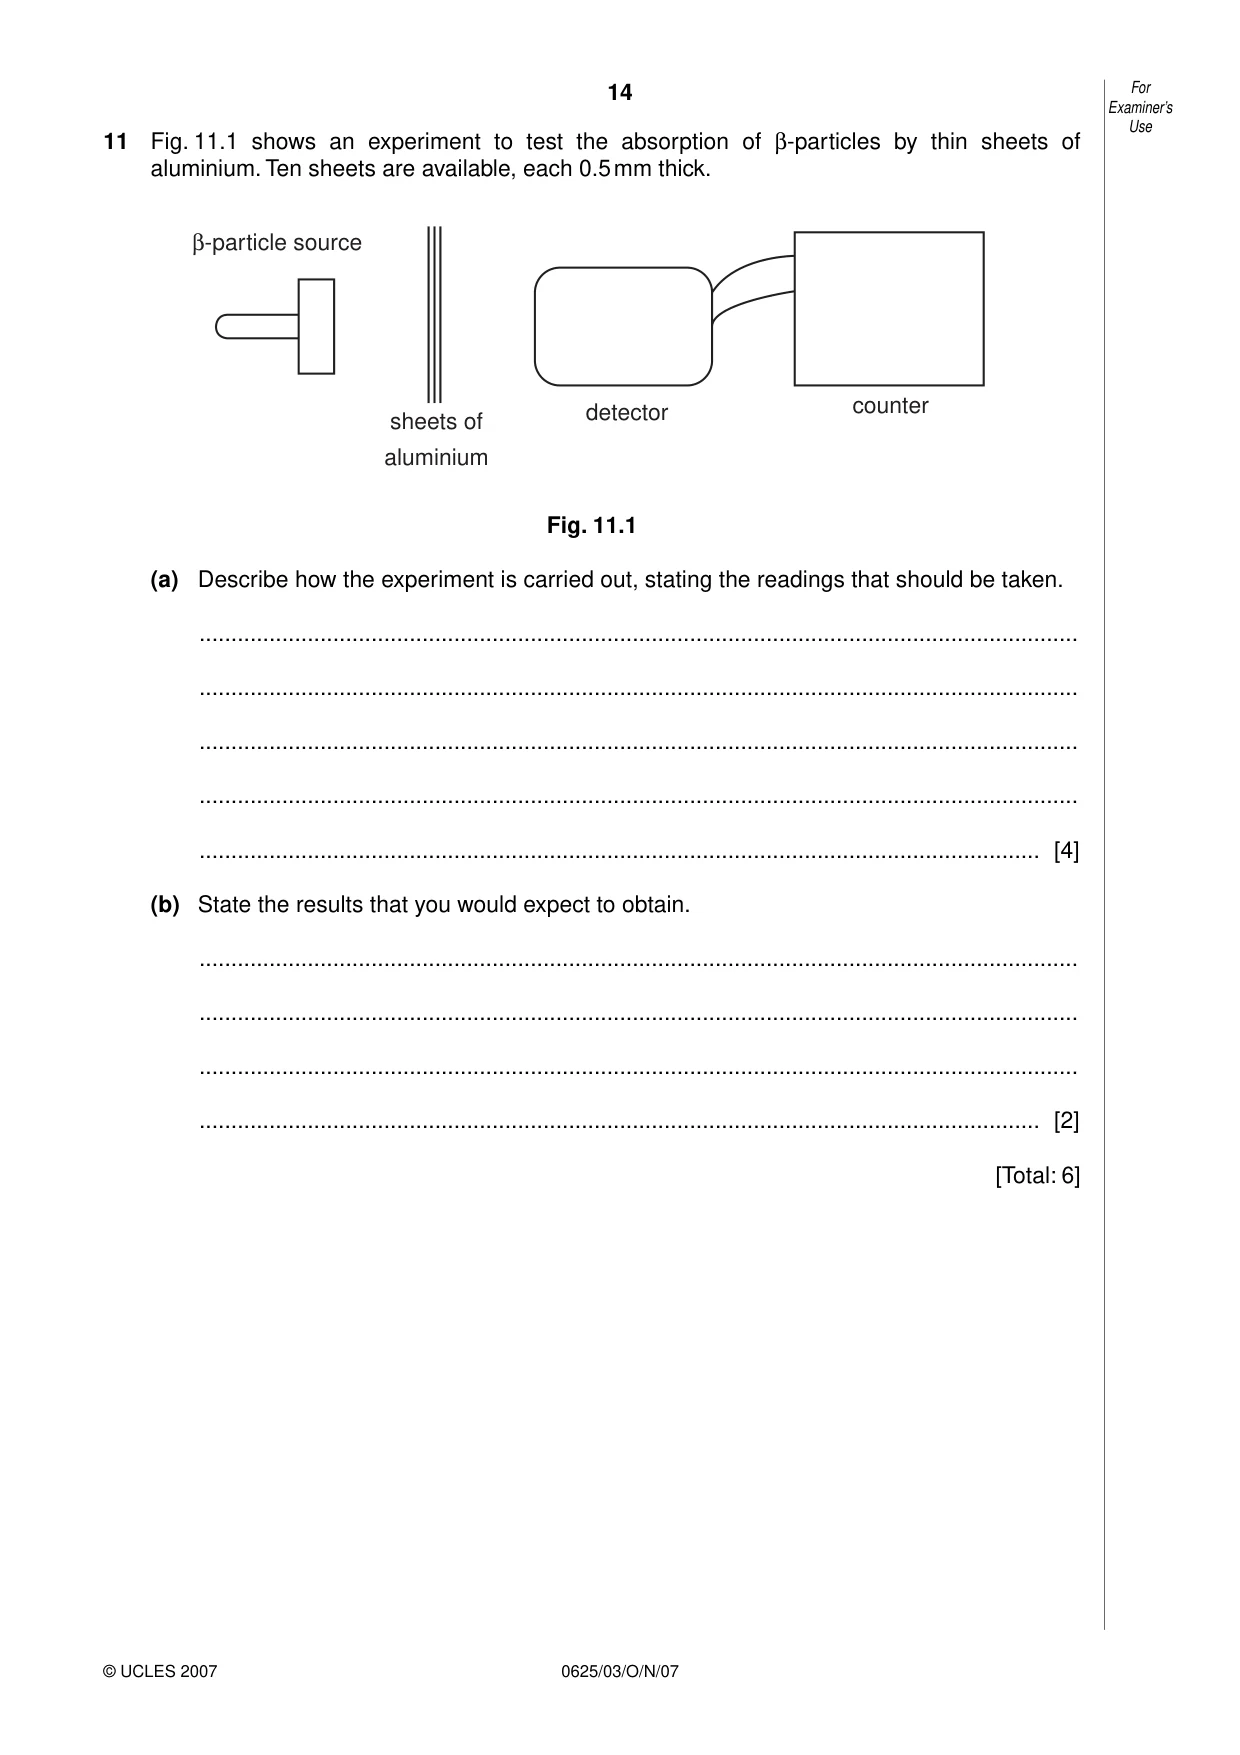
Use 11 Fig. 11.1 shows an experiment to test the absorption of β-particles by thin sheets of aluminium. Ten sheets are available, each 0.5 mm thick. β-particle source detector counter sheets of aluminium Fig. 11.1 (a) Describe how the experiment is carried out, stating the readings that should be taken. .......................................................................................................................................... .......................................................................................................................................... .......................................................................................................................................... .......................................................................................................................................... .................................................................................................................................... [4] (b) State the results that you would expect to obtain. .......................................................................................................................................... .......................................................................................................................................... .......................................................................................................................................... .................................................................................................................................... [2] [Total: 6]
Mark scheme: 11 (a) detector, no source, no aluminium, take count OR take background B1 no aluminium, take count B1 aluminium, take count B1 subtract background/reading 1 from results B1 (b) count decreases as thickness of aluminium increases B1 6-10 sheets/several sheets/few mm, count reduced to background count/β-particles stopped B1 [Total: 6]
What was in this paper
The subtopics covered by these 11 questions, and how many questions each got. Open one in a new tab to see every Cambridge question on it.
What you needed in this session
Cambridge’s own grade thresholds for 2007 Oct/Nov, Paper 3 · Variant 1. A higher threshold means an easier paper — the bar moves with how the cohort did.