Cambridge IGCSE Physical Science 0652 — 2015 Oct/Nov Paper 6 · Variant 2
0652/62/O/N/15 · 60 marks · ≈68 min
The question paper and its mark scheme, free to read here and free to download. This is Cambridge’s own paper, exactly as it was sat.
Question paper24 pages


Mark scheme4 pages
Answers below. Sit the paper first if you are practising.
Paper as text
Question paper, page 1
This document consists of 22 printed pages and 2 blank pages. IB15 11_0652_62/4RP © UCLES 2015 [Turn over *6888019672* Cambridge International Examinations Cambridge International General Certificate of Secondary Education PHYSICAL SCIENCE 0652/62 Paper 6 Alternative to Practical October/November 2015 1 hour Candidates answer on the Question Paper. No Additional Materials are required. READ THESE INSTRUCTIONS FIRST Write your Centre number, candidate number and name on all the work you hand in. Write in dark blue or black pen. You may use an HB pencil for any diagrams or graphs. Do not use staples, paper clips, glue or correction fluid. DO NOT WRITE IN ANY BARCODES. Answer all questions. Electronic calculators may be used. You may lose marks if you do not show your working or if you do not use appropriate units. At the end of the examination, fasten all your work securely together. The number of marks is given in brackets [ ] at the end of each question or part question.
Question paper, page 2
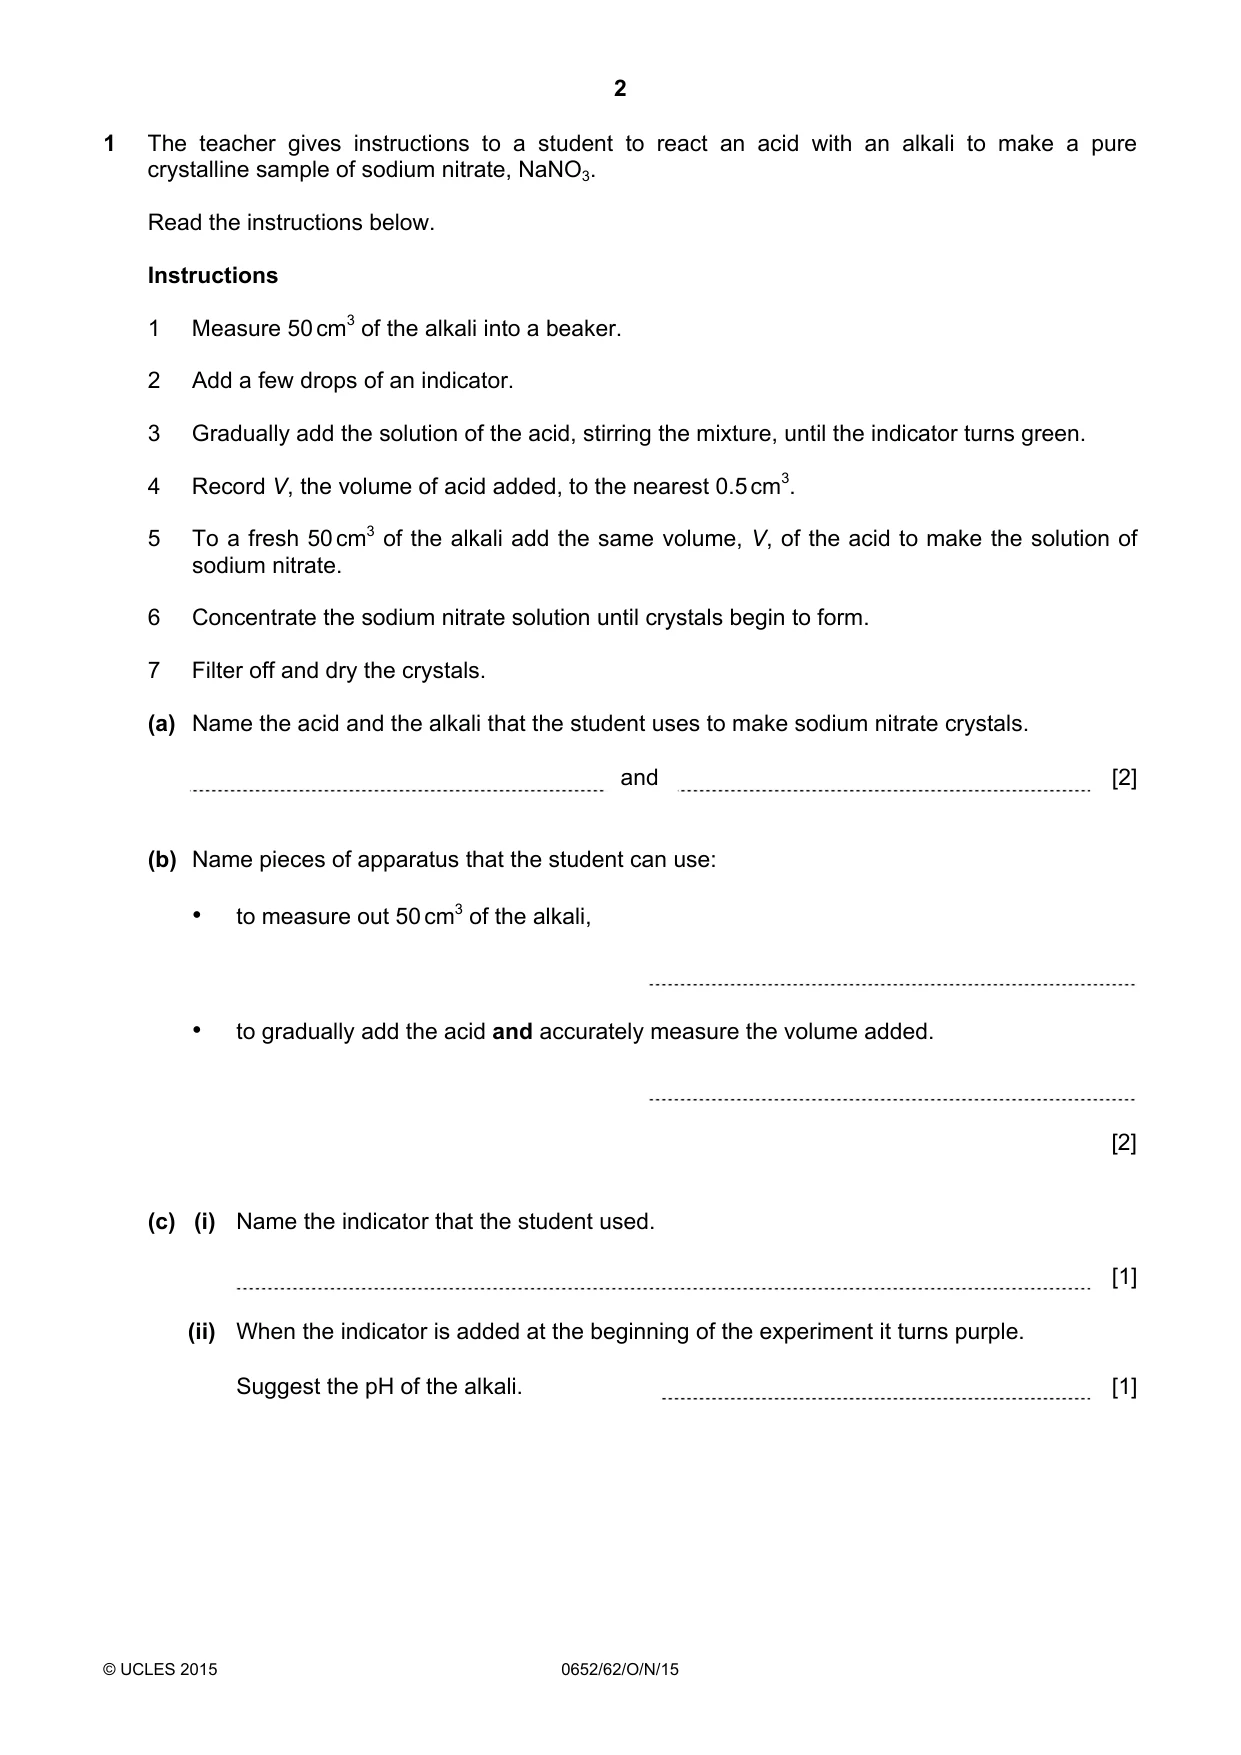
2 © UCLES 2015 0652/62/O/N/15 1 The teacher gives instructions to a student to react an acid with an alkali to make a pure crystalline sample of sodium nitrate, NaNO3. Read the instructions below. Instructions 1 Measure 50 cm3 of the alkali into a beaker. 2 Add a few drops of an indicator. 3 Gradually add the solution of the acid, stirring the mixture, until the indicator turns green. 4 Record V, the volume of acid added, to the nearest 0.5 cm3. 5 To a fresh 50 cm3 of the alkali add the same volume, V, of the acid to make the solution of sodium nitrate. 6 Concentrate the sodium nitrate solution until crystals begin to form. 7 Filter off and dry the crystals. (a) Name the acid and the alkali that the student uses to make sodium nitrate crystals. and [2] (b) Name pieces of apparatus that the student can use: • to measure out 50 cm3 of the alkali, • to gradually add the acid and accurately measure the volume added. [2] (c) (i) Name the indicator that the student used. [1] (ii) When the indicator is added at the beginning of the experiment it turns purple. Suggest the pH of the alkali. [1]
Question paper, page 3
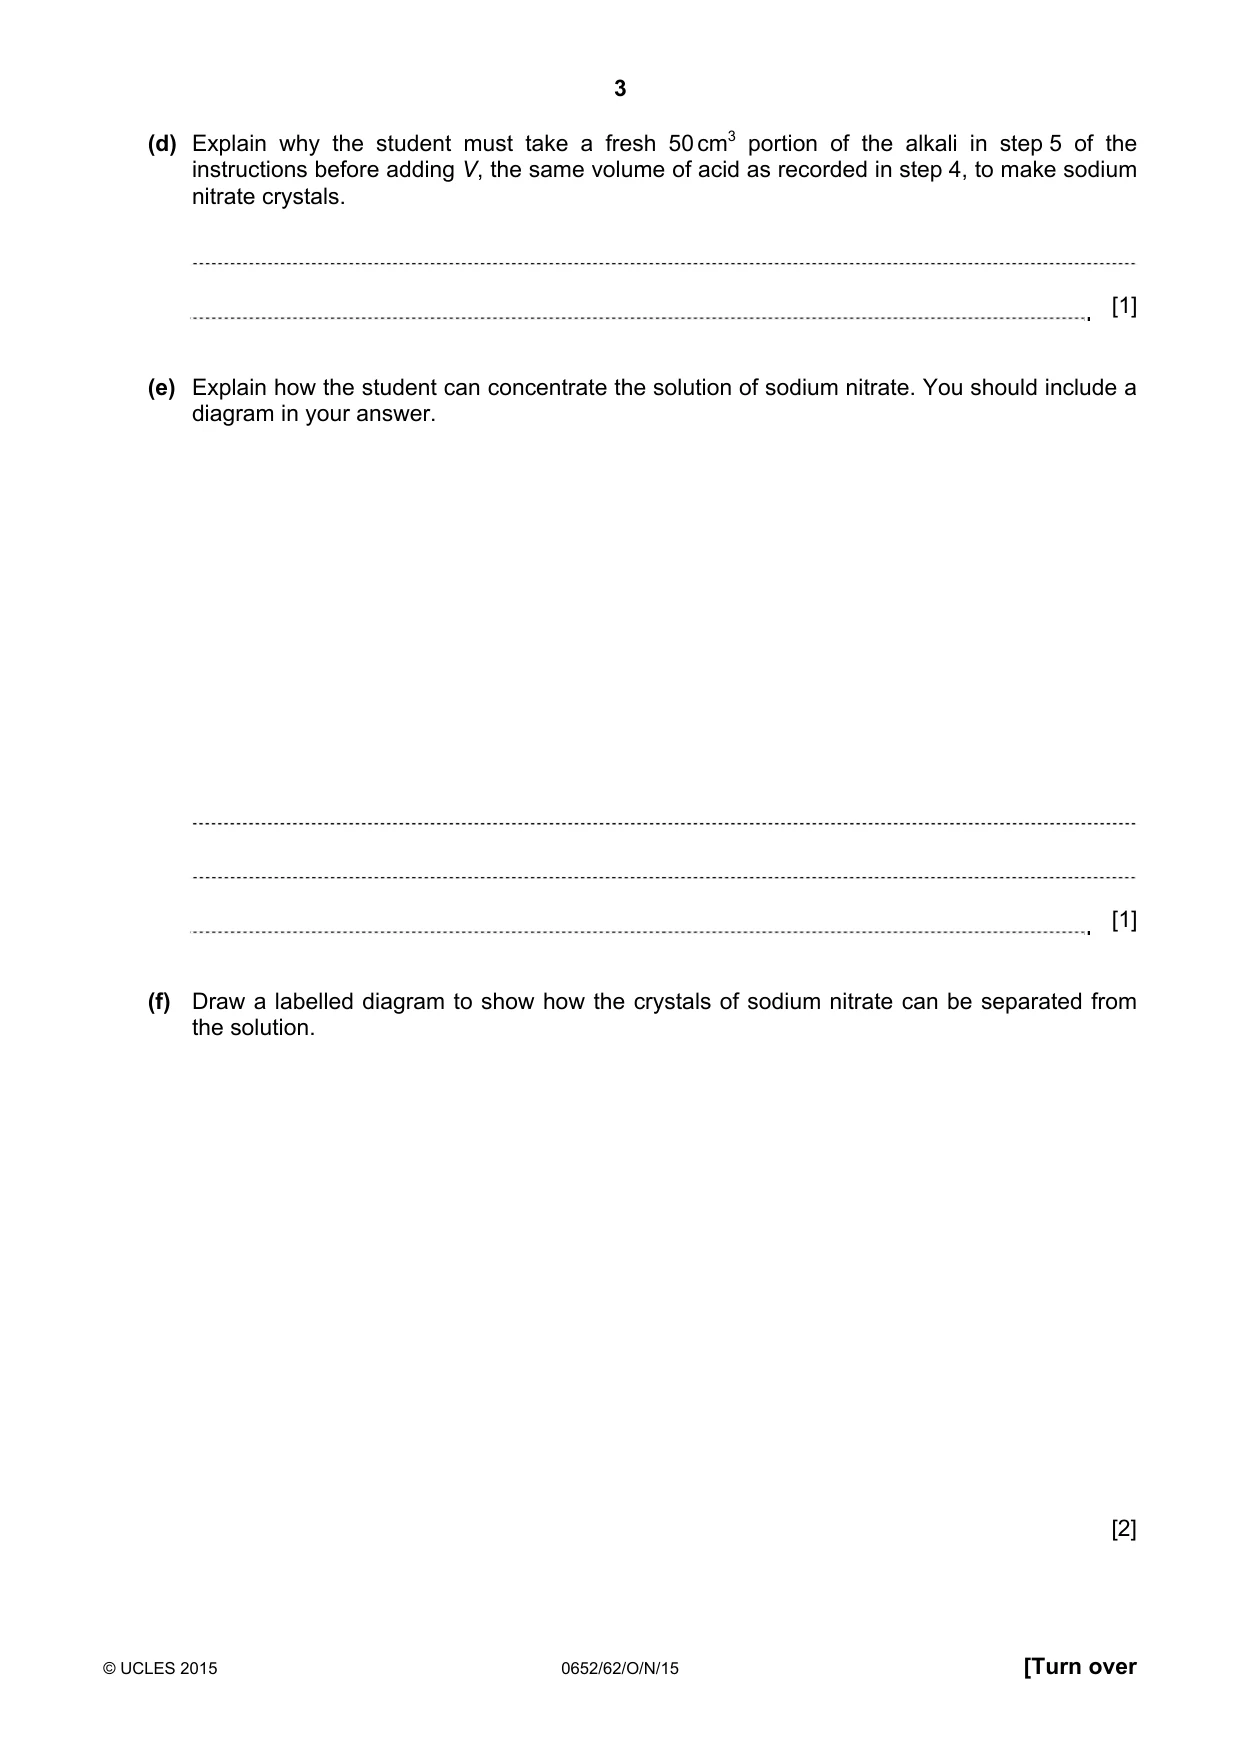
3 © UCLES 2015 0652/62/O/N/15 [Turn over (d) Explain why the student must take a fresh 50 cm3 portion of the alkali in step 5 of the instructions before adding V, the same volume of acid as recorded in step 4, to make sodium nitrate crystals. [1] (e) Explain how the student can concentrate the solution of sodium nitrate. You should include a diagram in your answer. [1] (f) Draw a labelled diagram to show how the crystals of sodium nitrate can be separated from the solution. [2]
Question paper, page 4
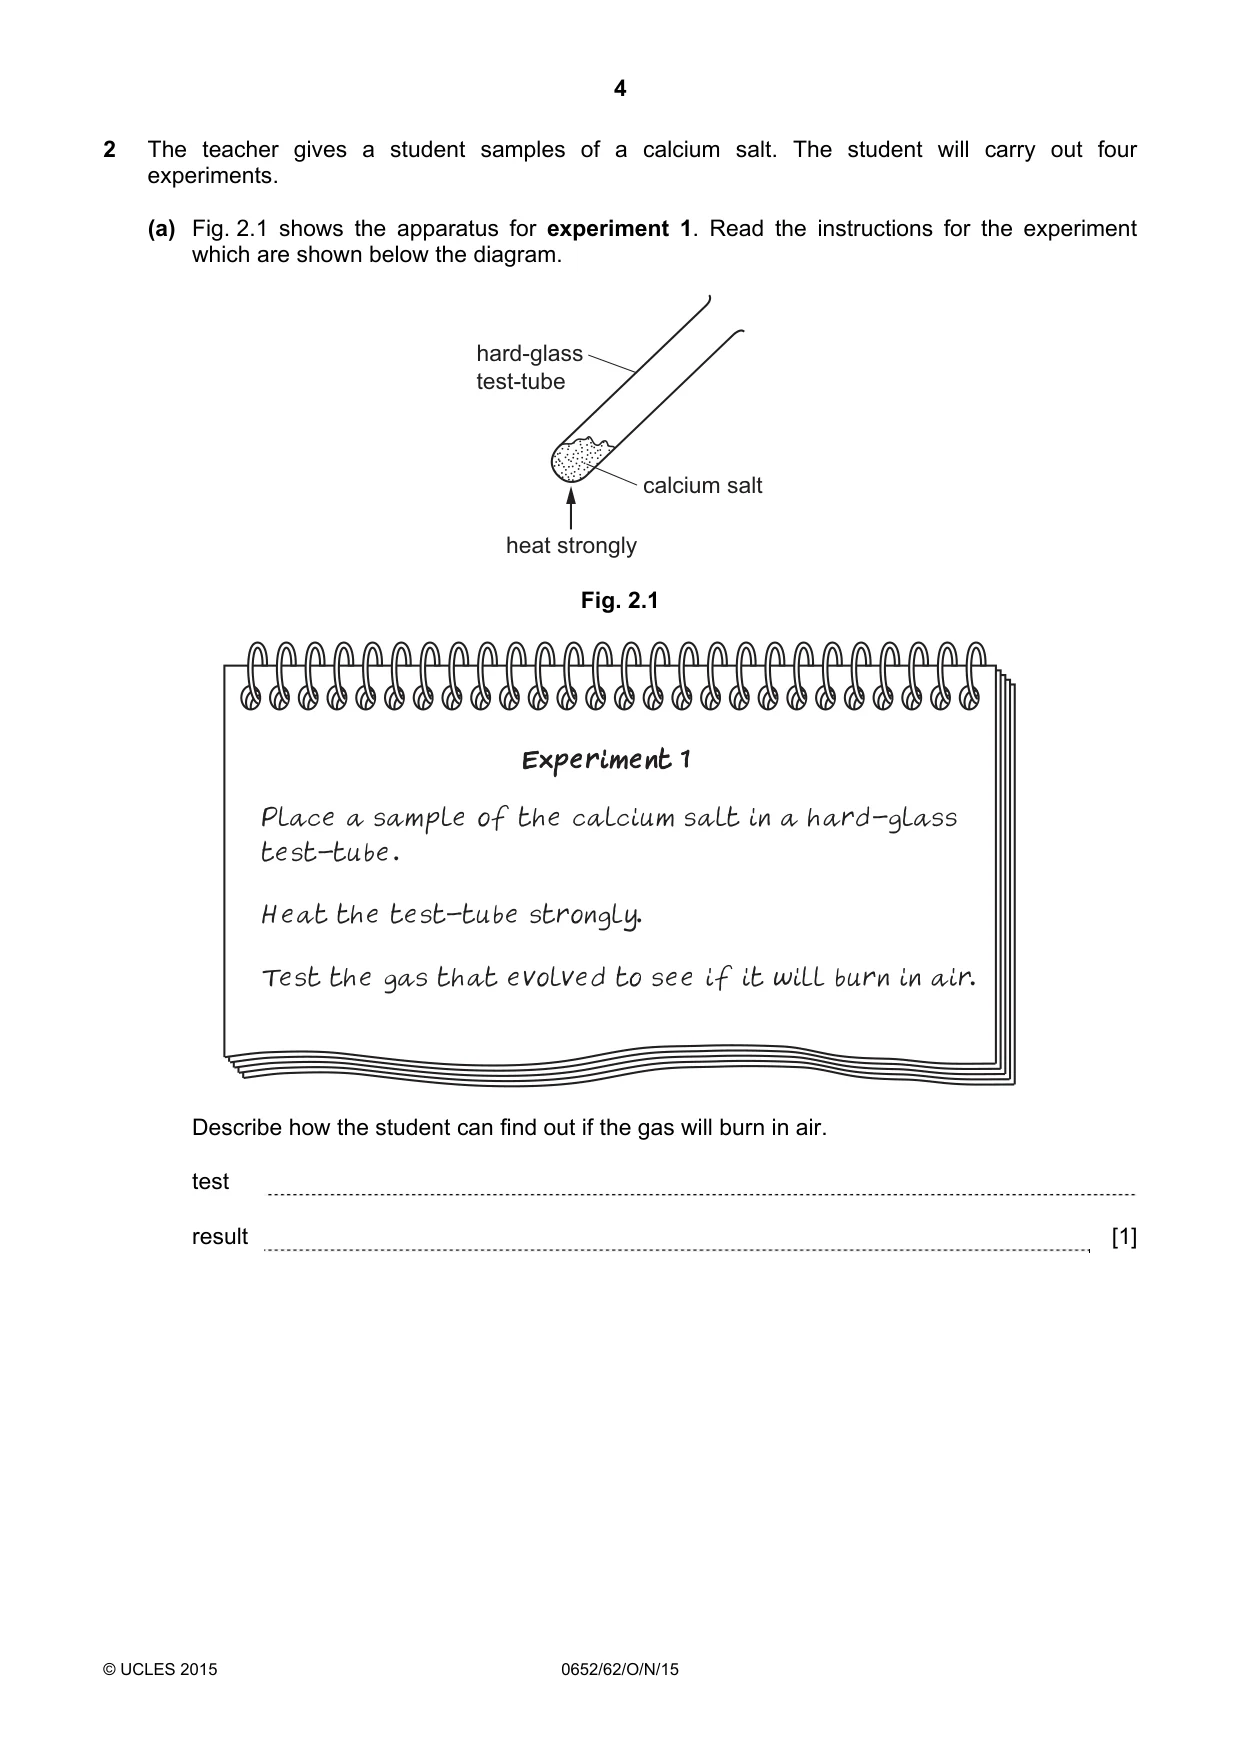
4 © UCLES 2015 0652/62/O/N/15 2 The teacher gives a student samples of a calcium salt. The student will carry out four experiments. (a) Fig. 2.1 shows the apparatus for experiment 1. Read the instructions for the experiment which are shown below the diagram. heat strongly hard-glass test-tube calcium salt Fig. 2.1 Place a sample of the calcium salt in a hard-glass test-tube. Heat the test-tube strongly. Test the gas that evolved to see if it will burn in air. Experiment 1 Describe how the student can find out if the gas will burn in air. test result [1]
Question paper, page 5
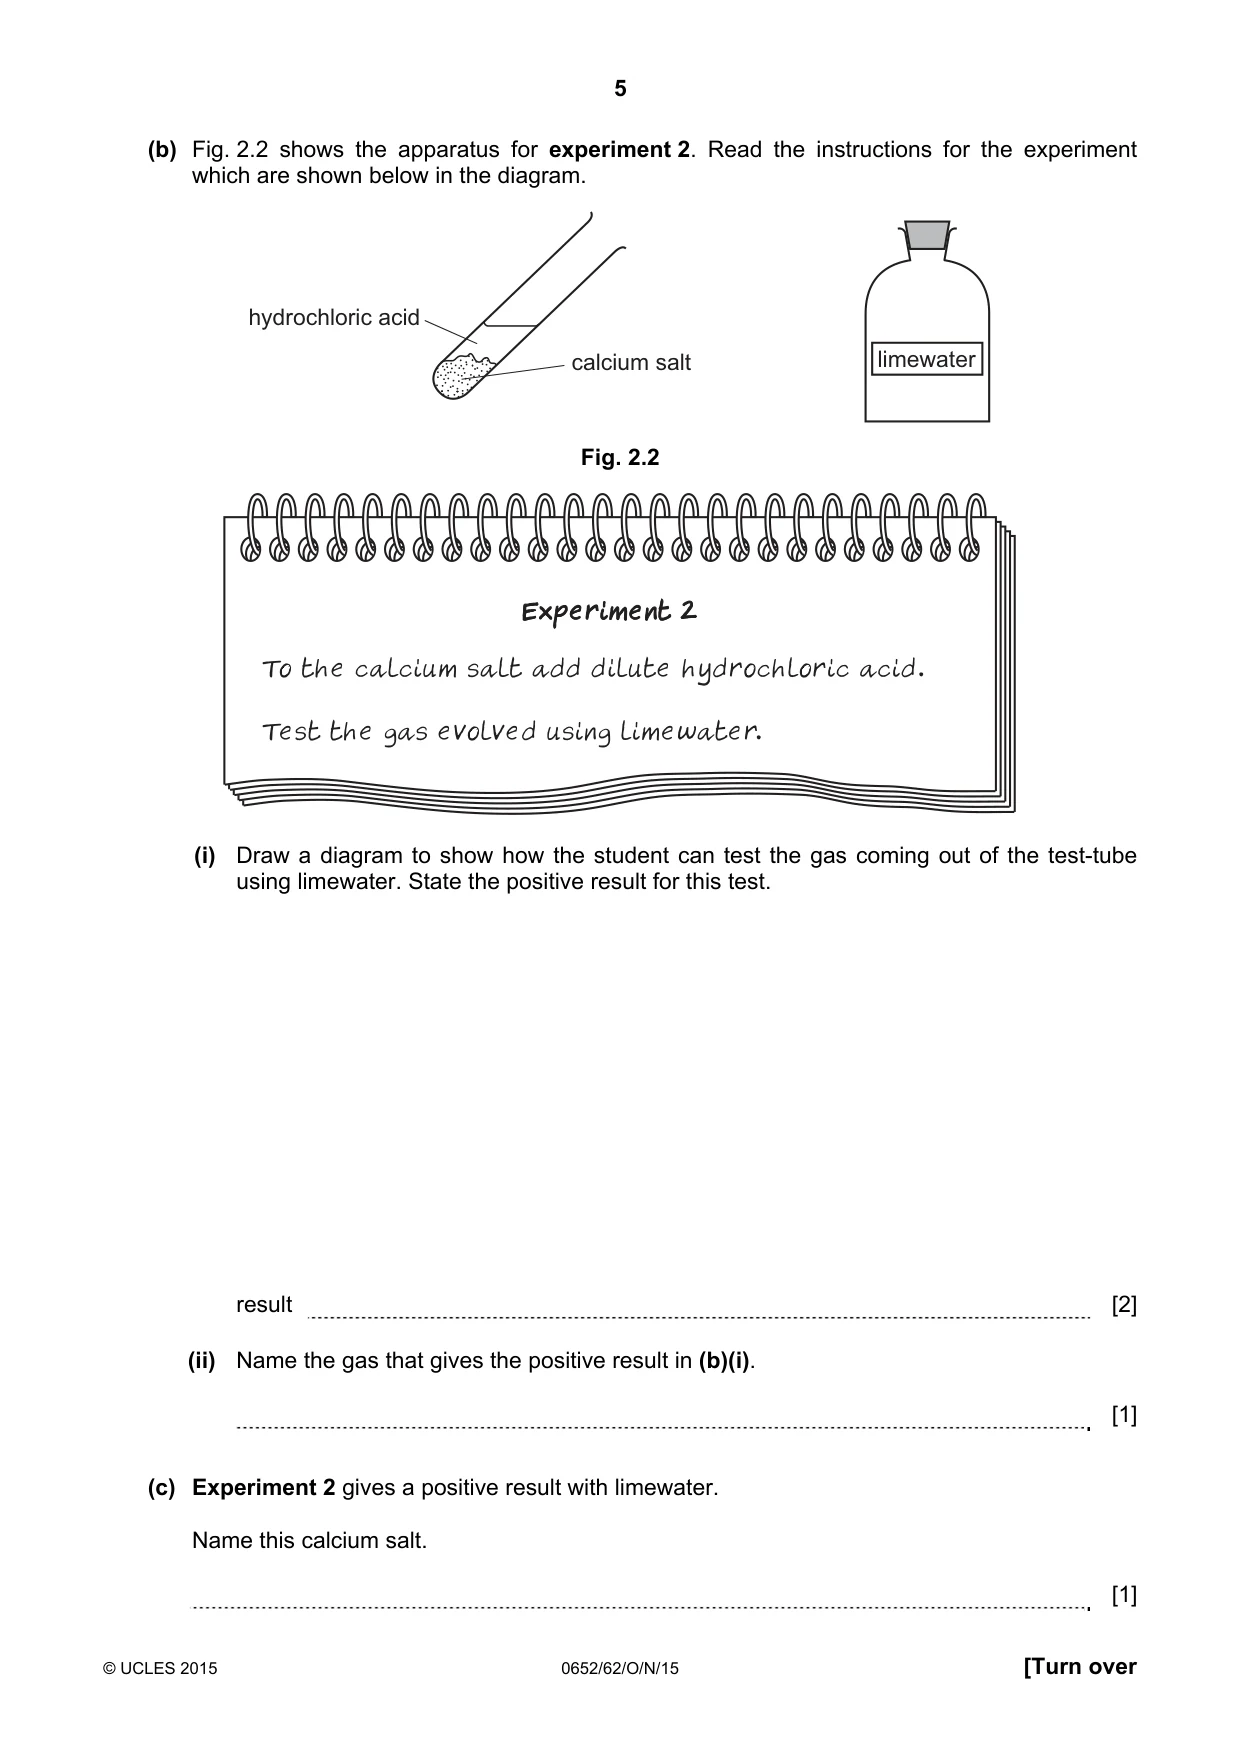
5 © UCLES 2015 0652/62/O/N/15 [Turn over (b) Fig. 2.2 shows the apparatus for experiment 2. Read the instructions for the experiment which are shown below in the diagram. hydrochloric acid calcium salt limewater Fig. 2.2 To the calcium salt add dilute hydrochloric acid. Test the gas evolved using limewater. Experiment 2 (i) Draw a diagram to show how the student can test the gas coming out of the test-tube using limewater. State the positive result for this test. result [2] (ii) Name the gas that gives the positive result in (b)(i). [1] (c) Experiment 2 gives a positive result with limewater. Name this calcium salt. [1]
Question paper, page 6
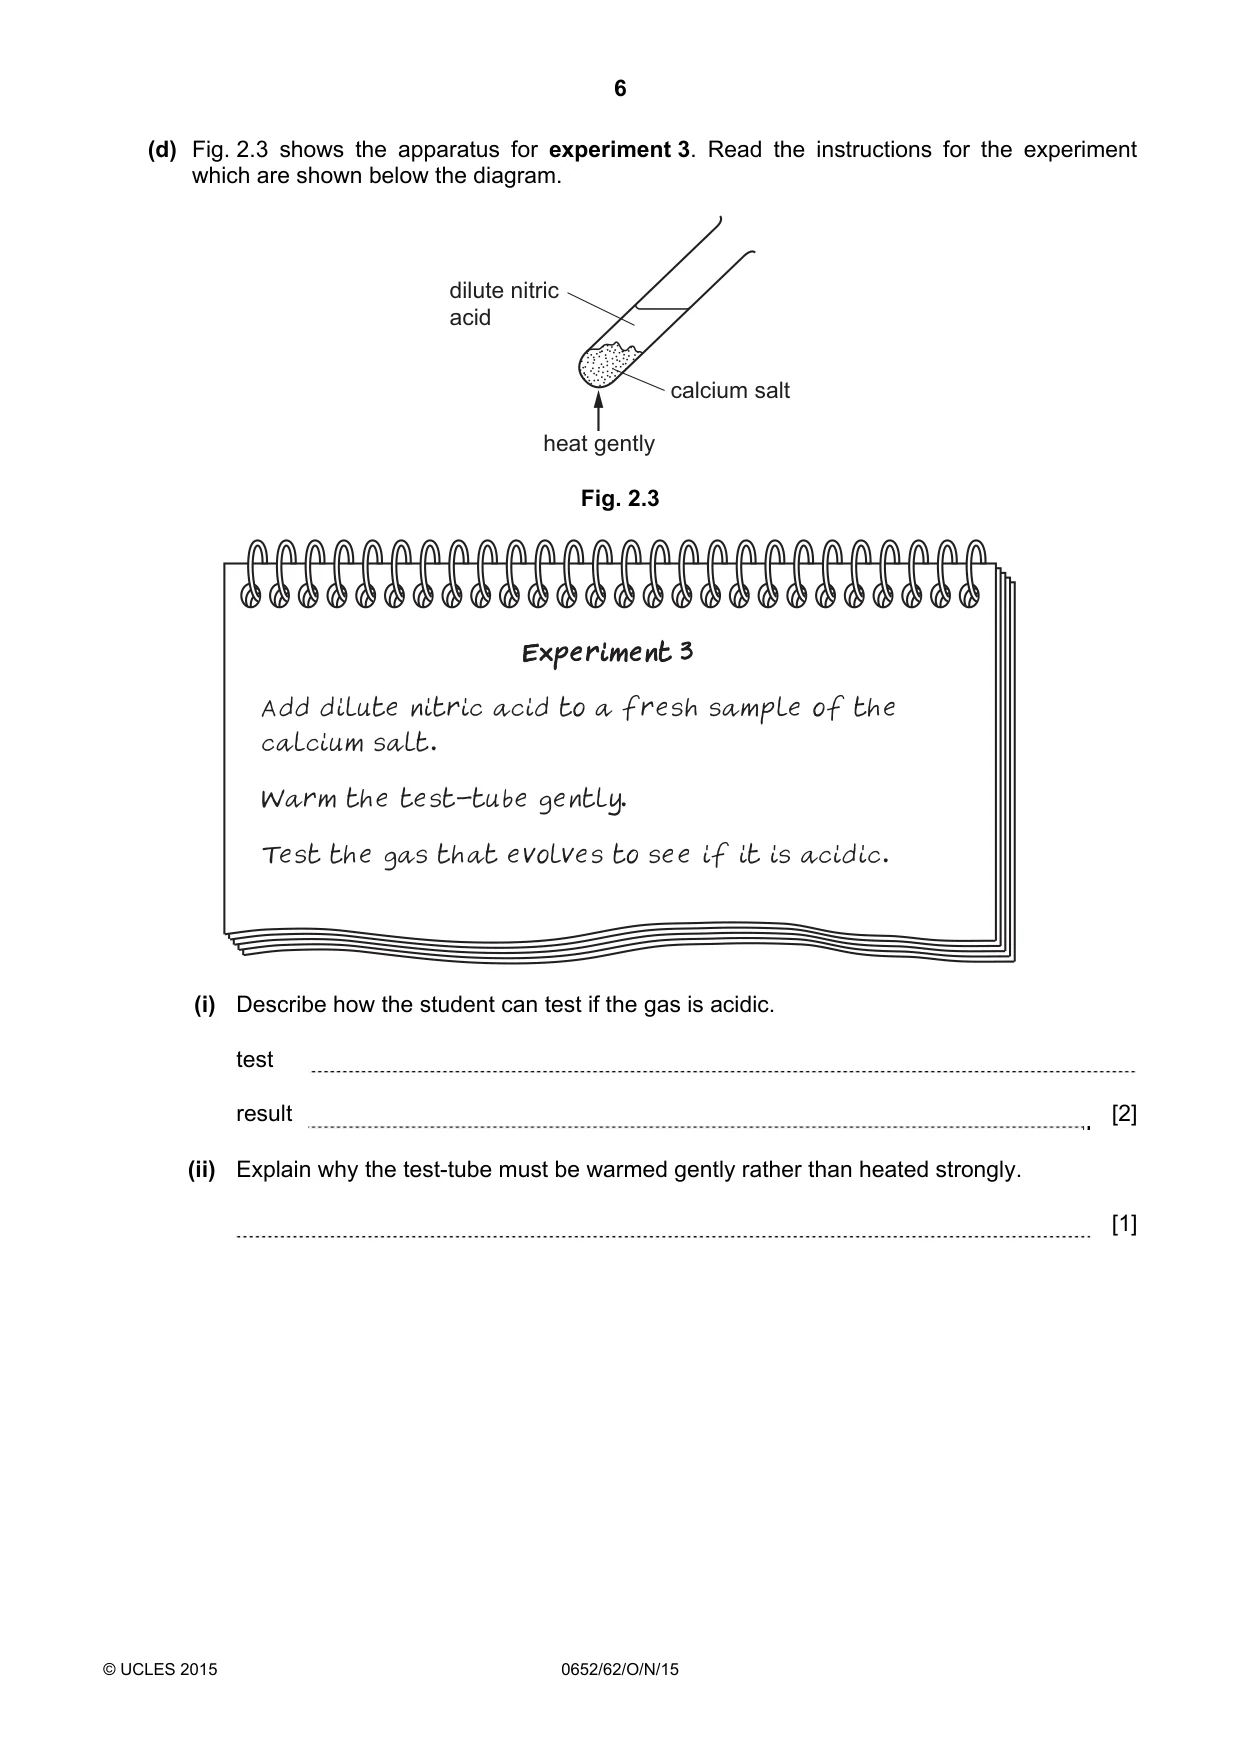
6 © UCLES 2015 0652/62/O/N/15 (d) Fig. 2.3 shows the apparatus for experiment 3. Read the instructions for the experiment which are shown below the diagram. heat gently dilute nitric acid calcium salt Fig. 2.3 Add dilute nitric acid to a fresh sample of the calcium salt. Warm the test-tube gently. Test the gas that evolves to see if it is acidic. Experiment 3 (i) Describe how the student can test if the gas is acidic. test result [2] (ii) Explain why the test-tube must be warmed gently rather than heated strongly. [1]
Question paper, page 7
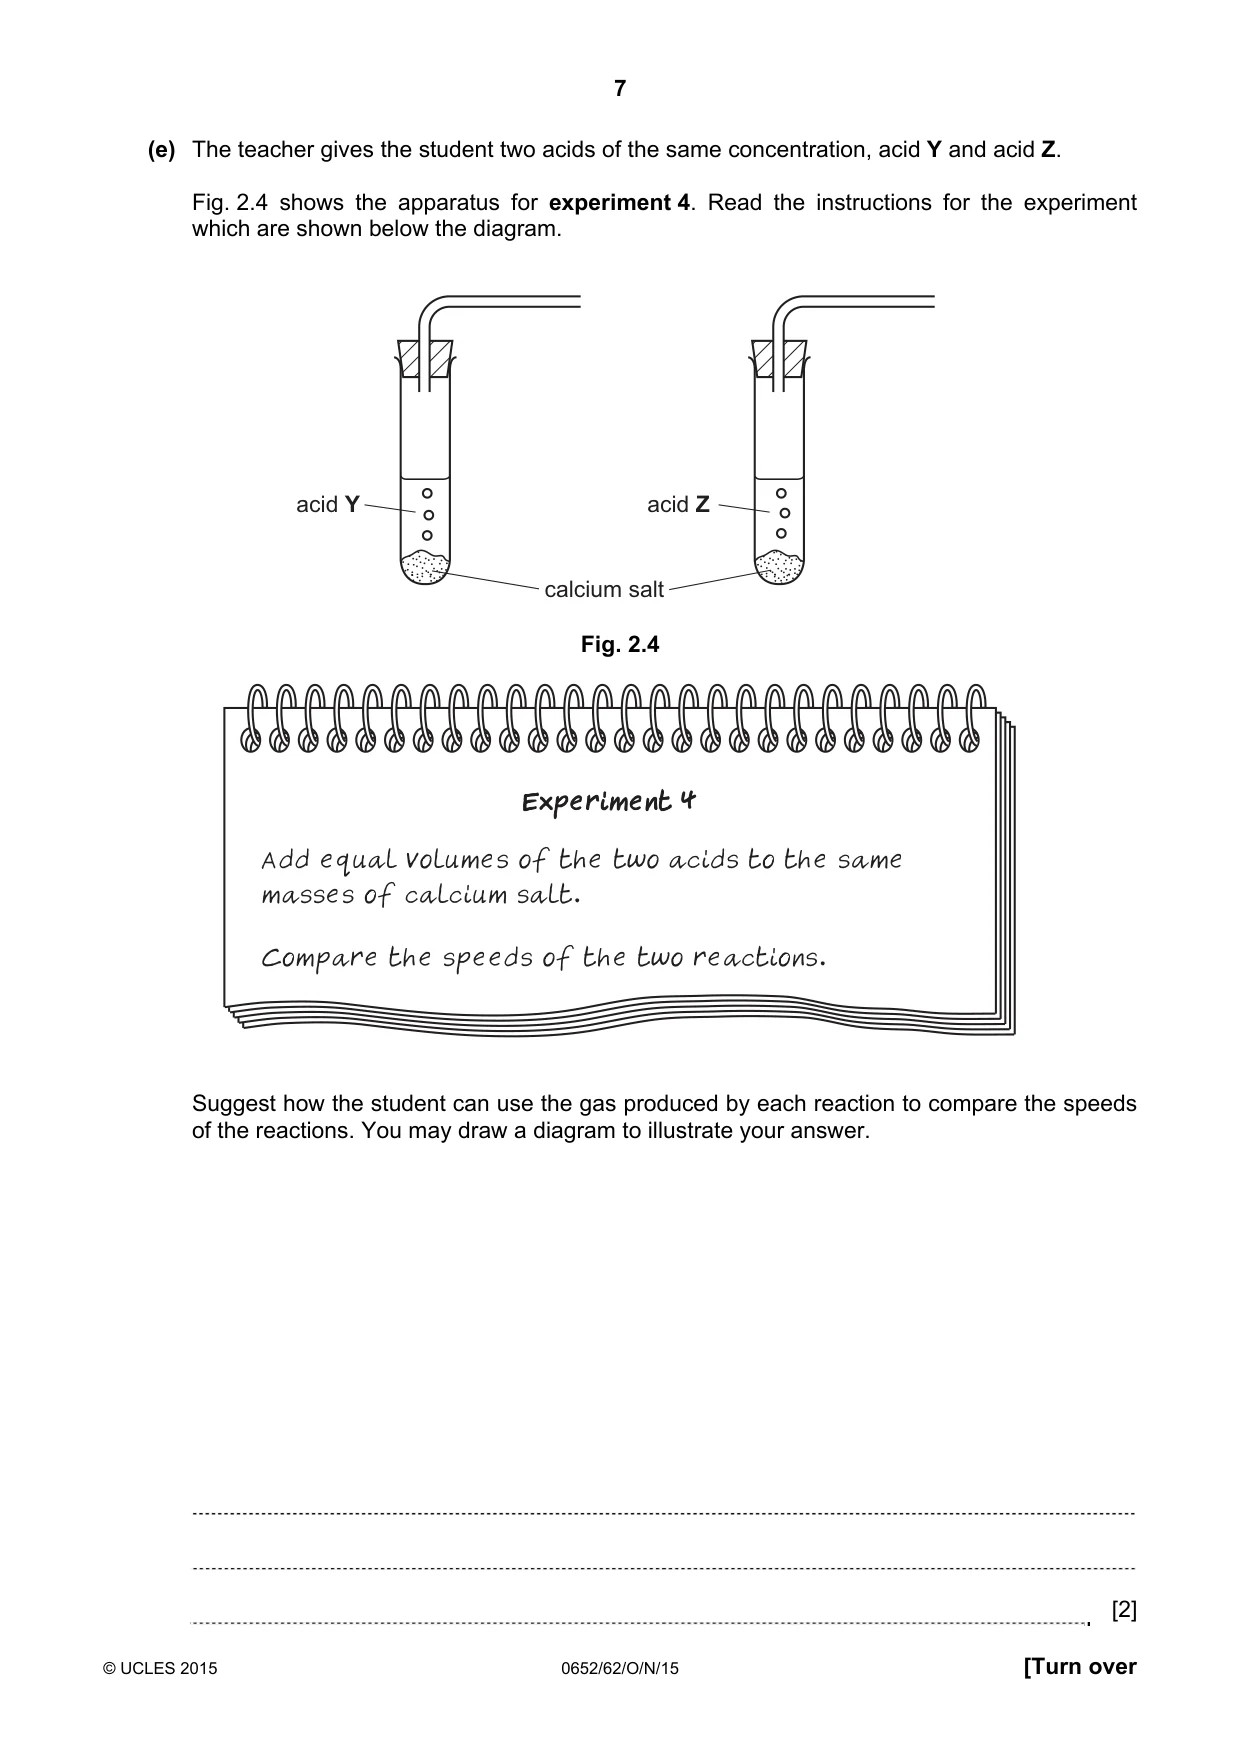
7 © UCLES 2015 0652/62/O/N/15 [Turn over (e) The teacher gives the student two acids of the same concentration, acid Y and acid Z. Fig. 2.4 shows the apparatus for experiment 4. Read the instructions for the experiment which are shown below the diagram. acid Y acid Z calcium salt Fig. 2.4 Add equal volumes of the two acids to the same masses of calcium salt. Compare the speeds of the two reactions. Experiment 4 Suggest how the student can use the gas produced by each reaction to compare the speeds of the reactions. You may draw a diagram to illustrate your answer. [2]
Question paper, page 8
8 © UCLES 2015 0652/62/O/N/15 BLANK PAGE
Question paper, page 9
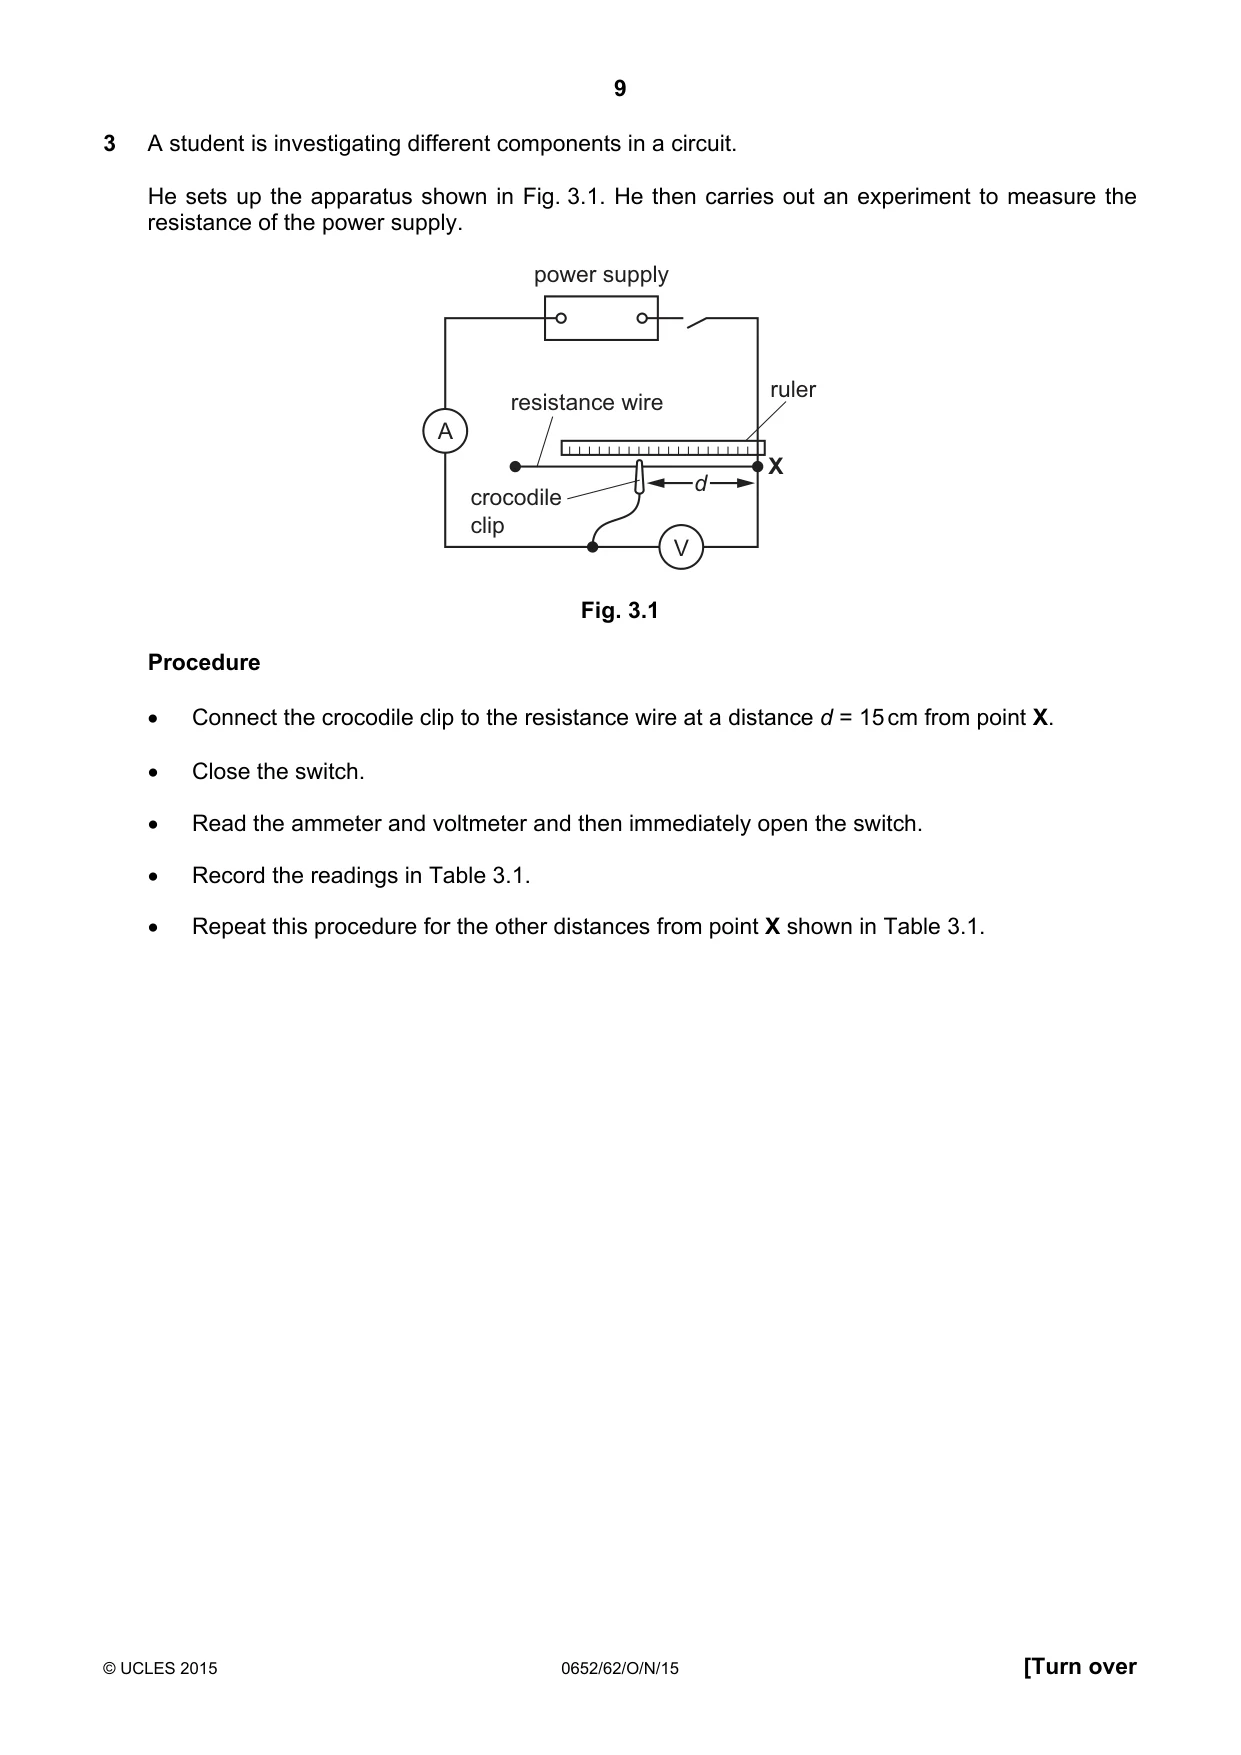
9 © UCLES 2015 0652/62/O/N/15 [Turn over 3 A student is investigating different components in a circuit. He sets up the apparatus shown in Fig. 3.1. He then carries out an experiment to measure the resistance of the power supply. A V power supply X resistance wire ruler crocodile clip d Fig. 3.1 Procedure • Connect the crocodile clip to the resistance wire at a distance d = 15 cm from point X. • Close the switch. • Read the ammeter and voltmeter and then immediately open the switch. • Record the readings in Table 3.1. • Repeat this procedure for the other distances from point X shown in Table 3.1.
Question paper, page 10
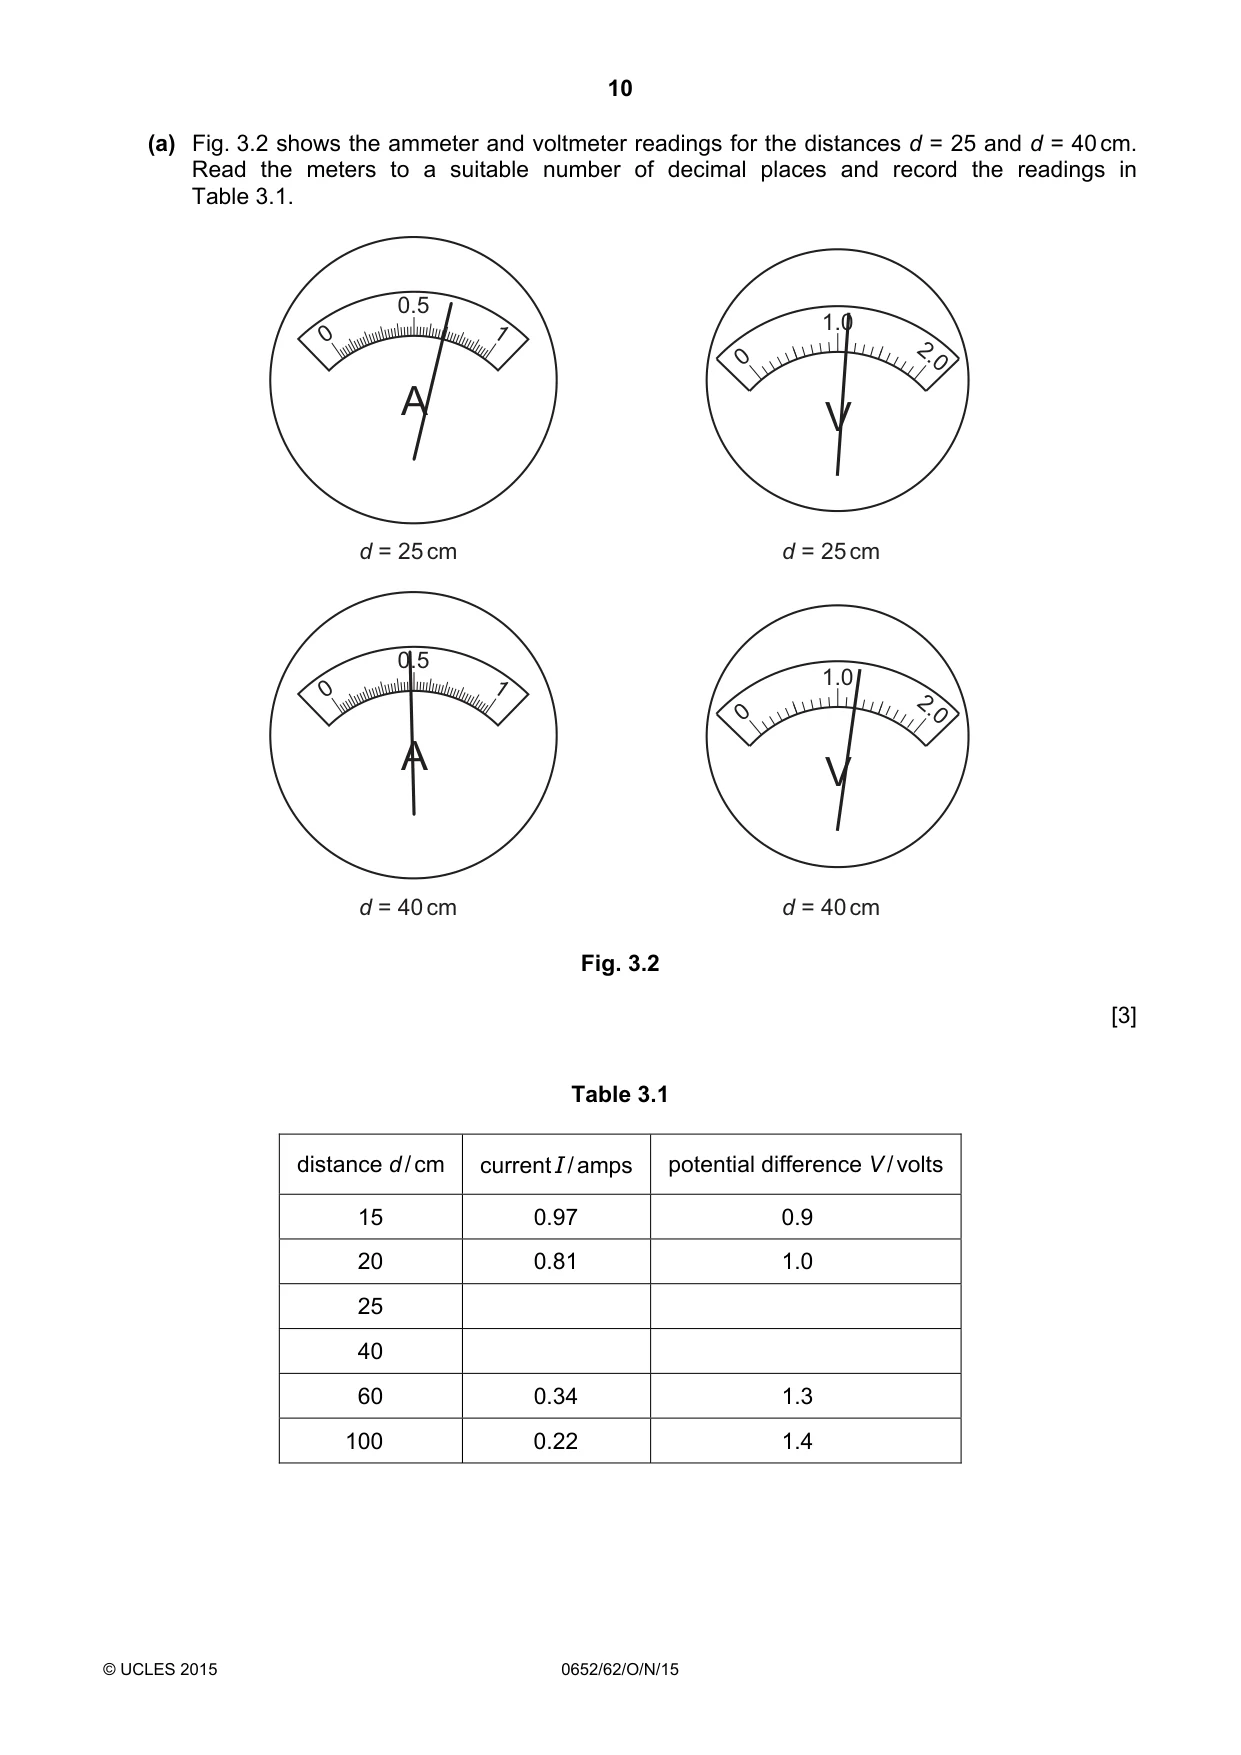
10 © UCLES 2015 0652/62/O/N/15 (a) Fig. 3.2 shows the ammeter and voltmeter readings for the distances d = 25 and d = 40 cm. Read the meters to a suitable number of decimal places and record the readings in Table 3.1. V 1.0 2.0 0 A 0.5 1 0 V 1.0 2.0 0 A 0.5 1 0 d = 25 cm d = 25 cm d = 40 cm d = 40 cm Fig. 3.2 [3] Table 3.1 distance d / cm current I / amps potential difference V / volts 15 0.97 0.9 20 0.81 1.0 25 40 60 0.34 1.3 100 0.22 1.4
Question paper, page 11
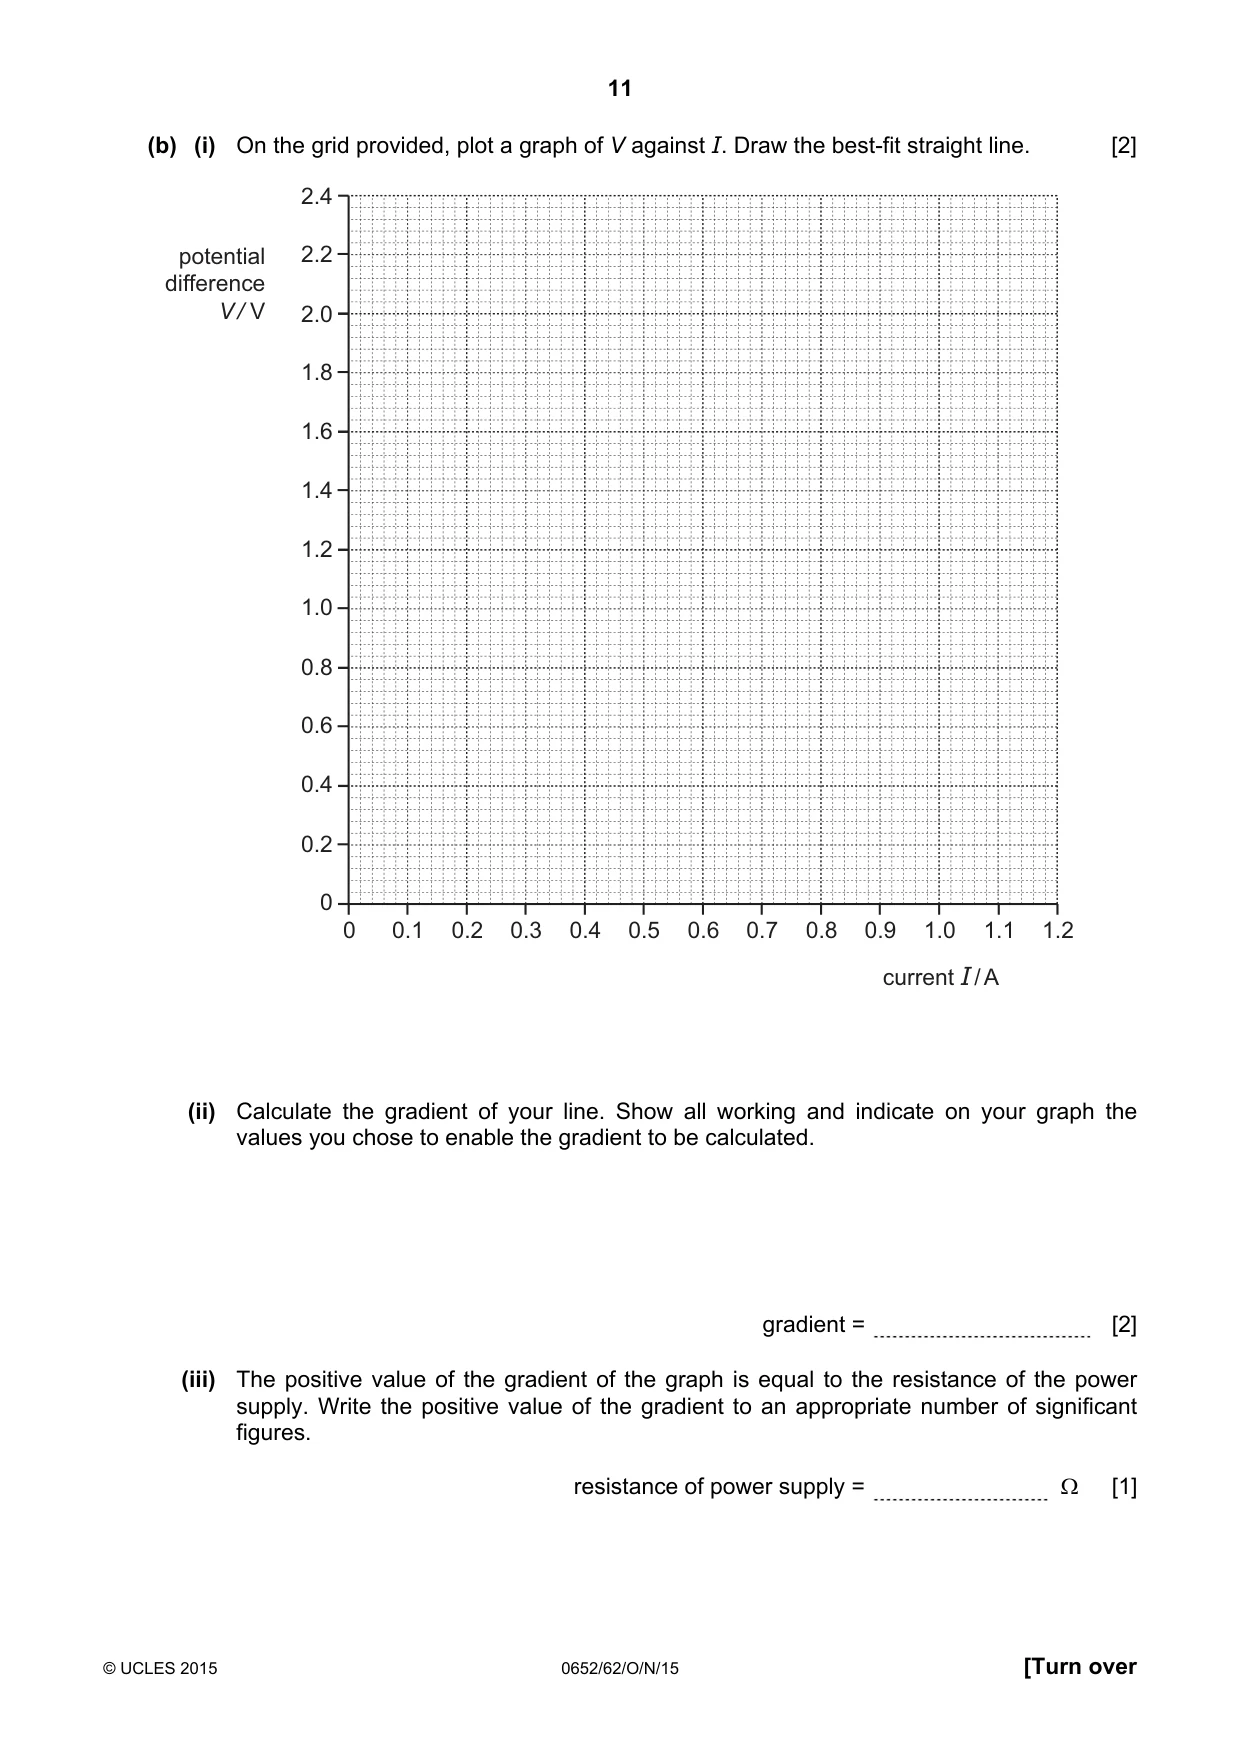
11 © UCLES 2015 0652/62/O/N/15 [Turn over (b) (i) On the grid provided, plot a graph of V against I. Draw the best-fit straight line. [2] potential difference V / V 0 0.2 0.4 0.6 0.8 current I / A 1.0 0.1 0.3 0.5 0.7 0.9 1.1 1.2 2.4 2.2 2.0 1.8 1.6 1.4 1.2 1.0 0.8 0.6 0.4 0.2 0 (ii) Calculate the gradient of your line. Show all working and indicate on your graph the values you chose to enable the gradient to be calculated. gradient = [2] (iii) The positive value of the gradient of the graph is equal to the resistance of the power supply. Write the positive value of the gradient to an appropriate number of significant figures. resistance of power supply = Ω [1]
Question paper, page 12
12 © UCLES 2015 0652/62/O/N/15 (c) (i) Suggest a reason why distance d must not be less than 15 cm. [1] (ii) Suggest a reason why the student must open the switch immediately after taking each reading. [1]
Question paper, page 13
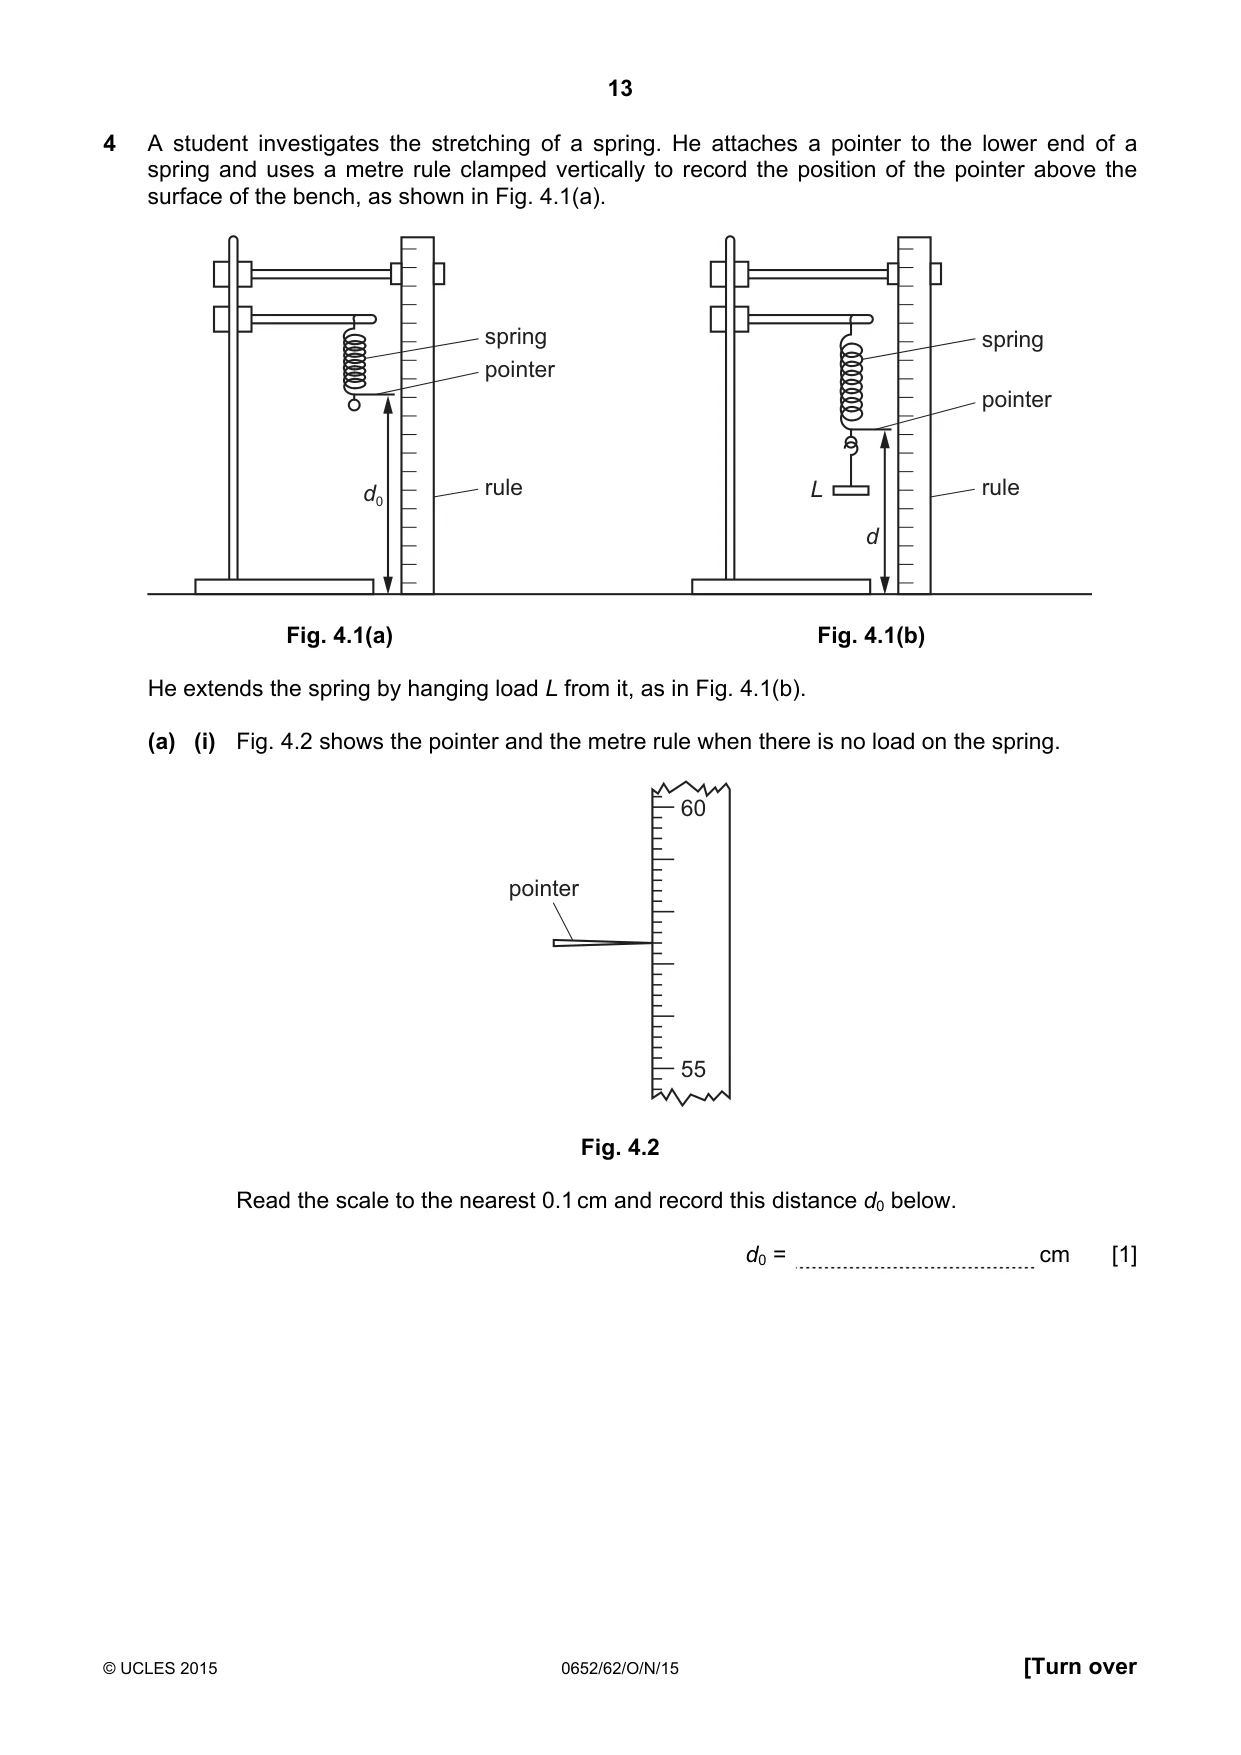
13 © UCLES 2015 0652/62/O/N/15 [Turn over 4 A student investigates the stretching of a spring. He attaches a pointer to the lower end of a spring and uses a metre rule clamped vertically to record the position of the pointer above the surface of the bench, as shown in Fig. 4.1(a). d0 spring pointer rule L d spring pointer rule Fig. 4.1(a) Fig. 4.1(b) He extends the spring by hanging load L from it, as in Fig. 4.1(b). (a) (i) Fig. 4.2 shows the pointer and the metre rule when there is no load on the spring. 60 55 pointer Fig. 4.2 Read the scale to the nearest 0.1 cm and record this distance d0 below. d0 = cm [1]
Question paper, page 14
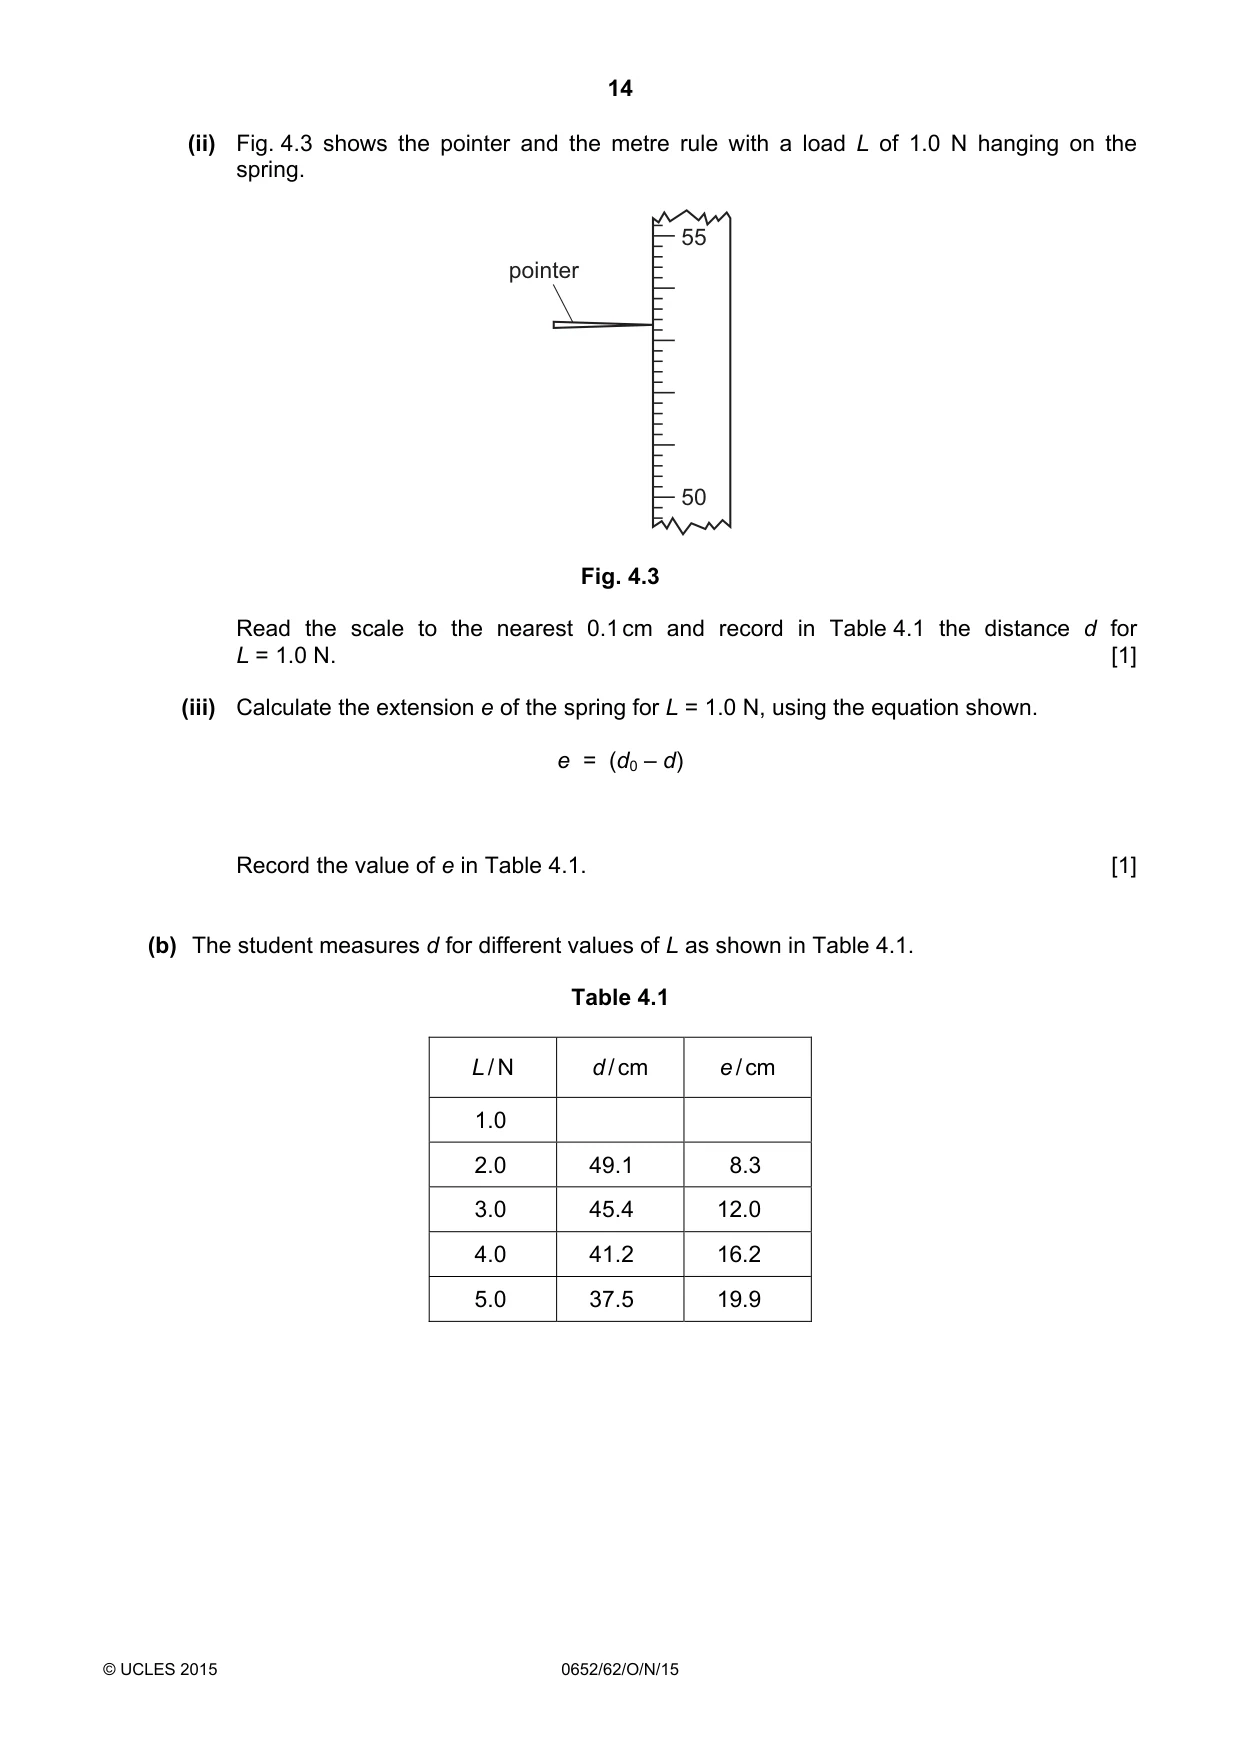
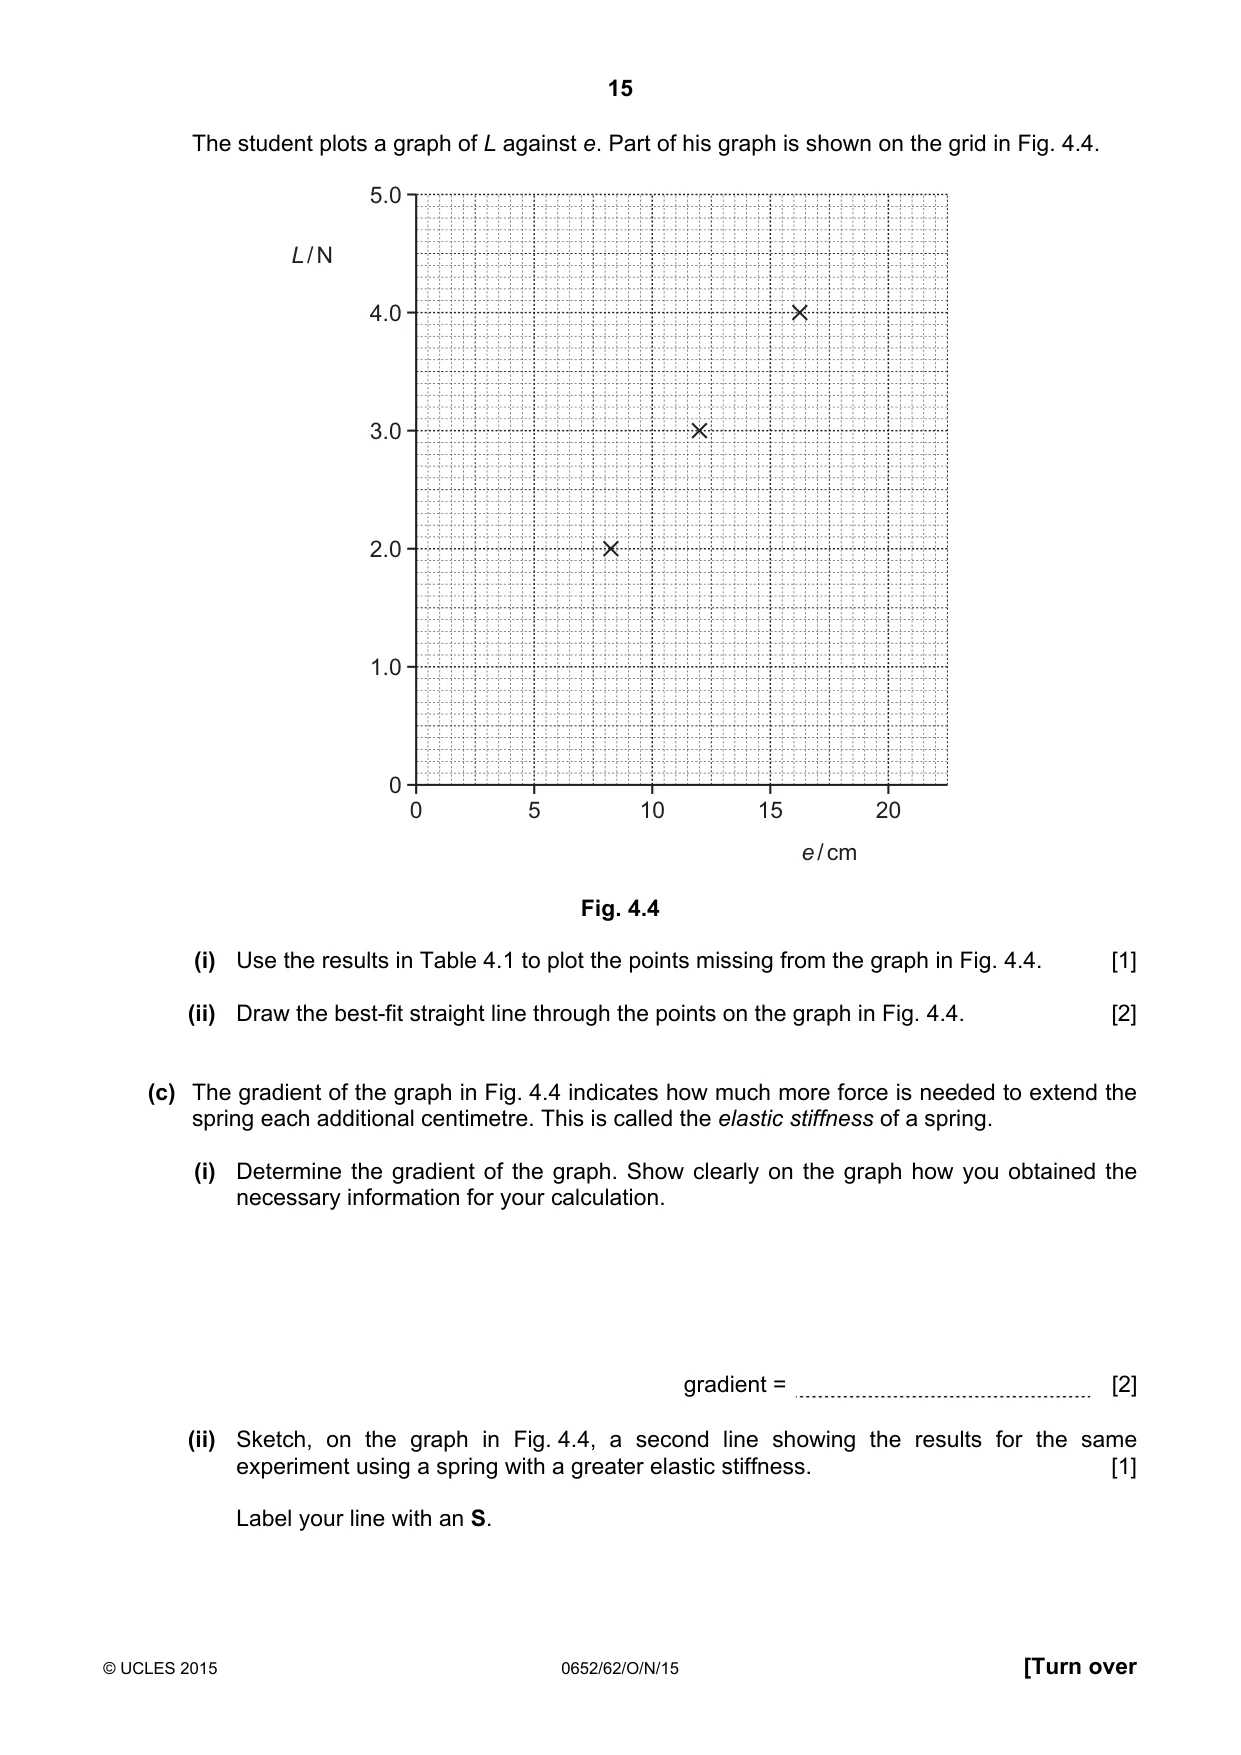
14 © UCLES 2015 0652/62/O/N/15 (ii) Fig. 4.3 shows the pointer and the metre rule with a load L of 1.0 N hanging on the spring. 55 50 pointer Fig. 4.3 Read the scale to the nearest 0.1 cm and record in Table 4.1 the distance d for L = 1.0 N. [1] (iii) Calculate the extension e of the spring for L = 1.0 N, using the equation shown. e = (d0 – d) Record the value of e in Table 4.1. [1] (b) The student measures d for different values of L as shown in Table 4.1. Table 4.1 L / N d / cm e / cm 1.0 2.0 49.1 8.3 3.0 45.4 12.0 4.0 41.2 16.2 5.0 37.5 19.9
Question paper, page 15
15 © UCLES 2015 0652/62/O/N/15 [Turn over The student plots a graph of L against e. Part of his graph is shown on the grid in Fig. 4.4. 0 5 10 15 20 5.0 4.0 3.0 2.0 1.0 0 e / cm L / N Fig. 4.4 (i) Use the results in Table 4.1 to plot the points missing from the graph in Fig. 4.4. [1] (ii) Draw the best-fit straight line through the points on the graph in Fig. 4.4. [2] (c) The gradient of the graph in Fig. 4.4 indicates how much more force is needed to extend the spring each additional centimetre. This is called the elastic stiffness of a spring. (i) Determine the gradient of the graph. Show clearly on the graph how you obtained the necessary information for your calculation. gradient = [2] (ii) Sketch, on the graph in Fig. 4.4, a second line showing the results for the same experiment using a spring with a greater elastic stiffness. [1] Label your line with an S.
Question paper, page 16
16 © UCLES 2015 0652/62/O/N/15 (d) Describe briefly one precaution that the student should take to obtain accurate measurements. [1]
Question paper, page 17
17 © UCLES 2015 0652/62/O/N/15 [Turn over Please turn over for Question 5.
Question paper, page 18
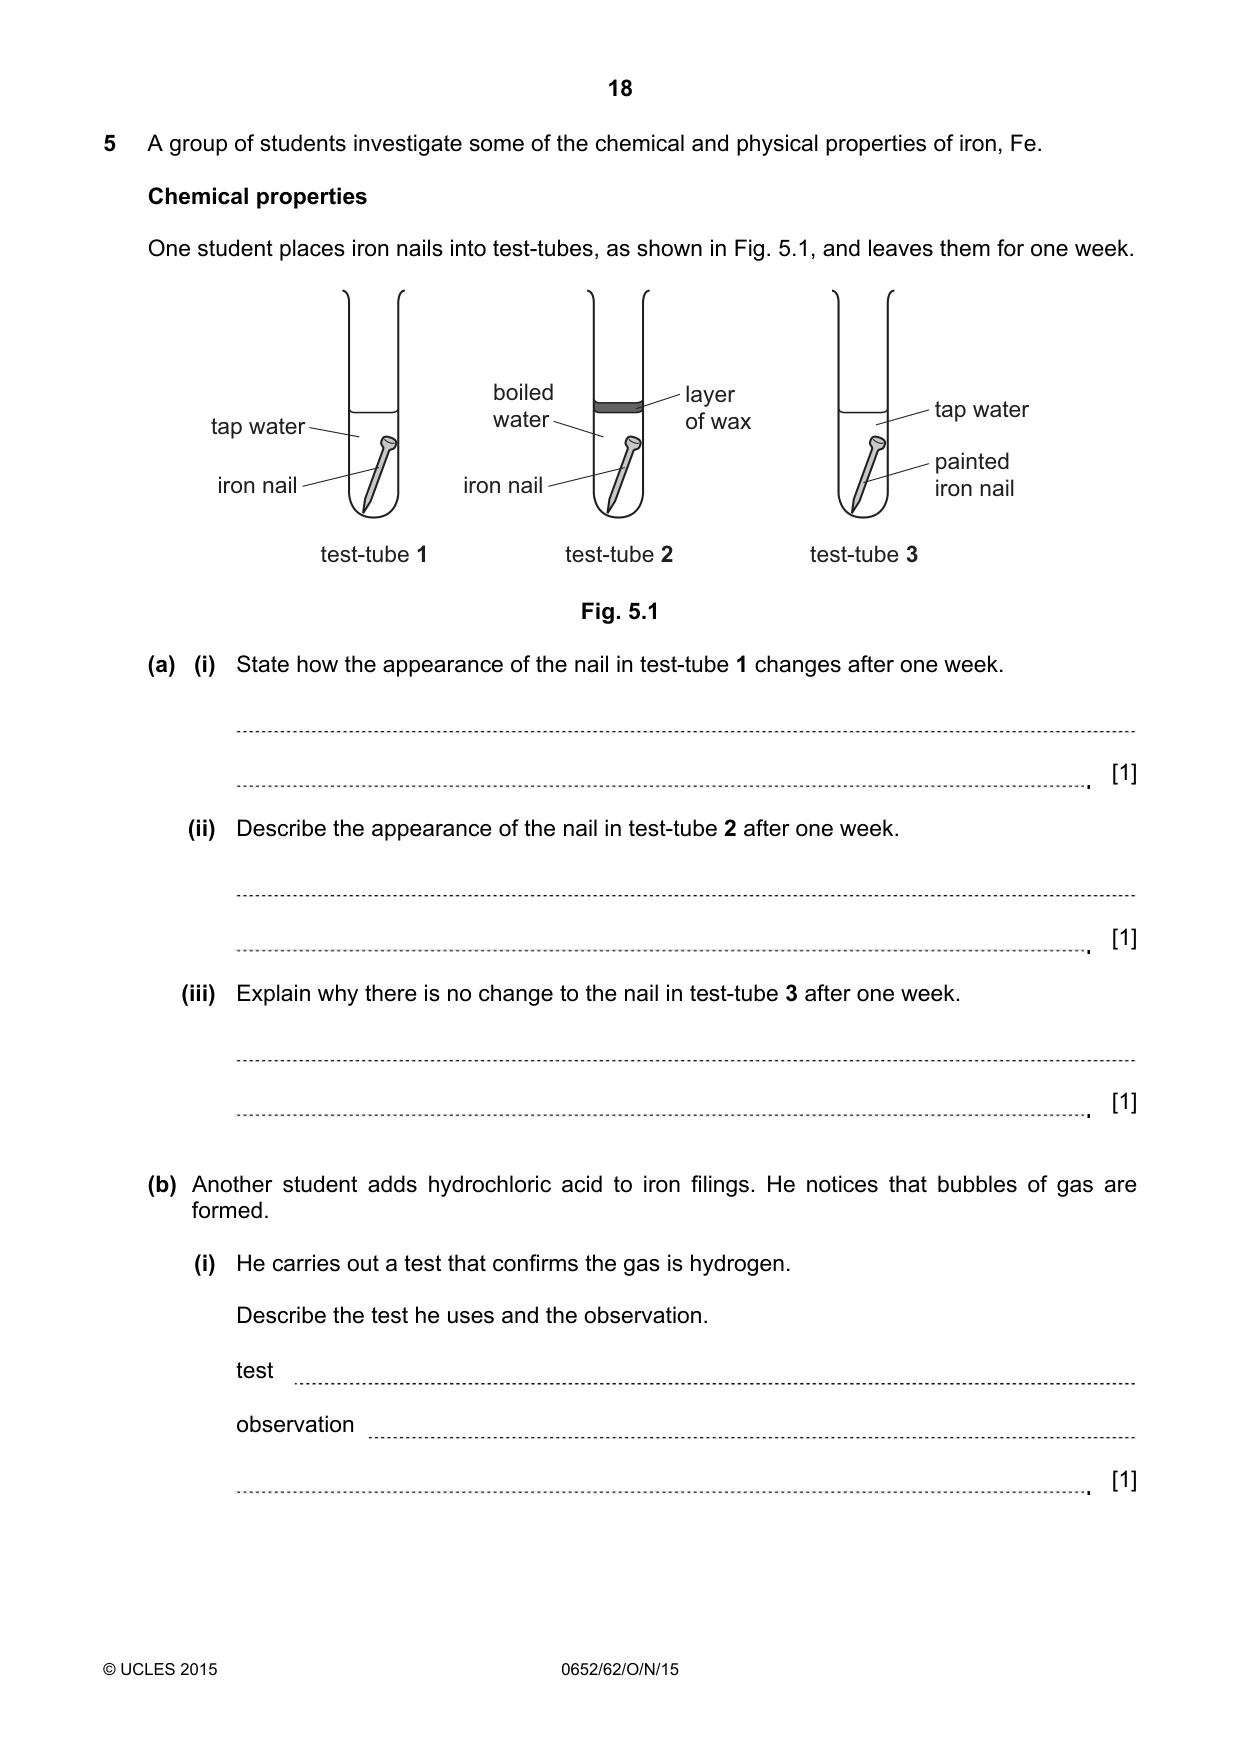
18 © UCLES 2015 0652/62/O/N/15 5 A group of students investigate some of the chemical and physical properties of iron, Fe. Chemical properties One student places iron nails into test-tubes, as shown in Fig. 5.1, and leaves them for one week. test-tube 3 test-tube 2 test-tube 1 tap water tap water boiled water iron nail iron nail layer of wax painted iron nail Fig. 5.1 (a) (i) State how the appearance of the nail in test-tube 1 changes after one week. [1] (ii) Describe the appearance of the nail in test-tube 2 after one week. [1] (iii) Explain why there is no change to the nail in test-tube 3 after one week. [1] (b) Another student adds hydrochloric acid to iron filings. He notices that bubbles of gas are formed. (i) He carries out a test that confirms the gas is hydrogen. Describe the test he uses and the observation. test observation [1]
Question paper, page 19
19 © UCLES 2015 0652/62/O/N/15 [Turn over (ii) The iron dissolves, making a light green solution. The student thinks that the green solution contains iron(II) ions. Explain how he proves the presence of iron(II) ions in the green solution. [1] (iii) The student takes some of the green solution and adds a colourless oxidising agent. The mixture changes colour. The teacher says that the iron(II) ions have been changed to iron(III) ions. State the colour of the mixture containing iron(III) ions. [1] (iv) Explain how the student proves the presence of iron(III) ions in this mixture. [1]
Question paper, page 20
20 © UCLES 2015 0652/62/O/N/15 (c) Physical properties A student uses the apparatus in Fig. 5.2 to investigate how a thick metal wire changes shape when a force is applied to it. thick wire slotted masses rule Fig. 5.2 Describe a procedure, using this apparatus, that the student can carry out to compare a wire made of iron with a wire made of steel (an alloy of iron). Explain how you can ensure that this is a fair comparison. [3]
Question paper, page 21
21 © UCLES 2015 0652/62/O/N/15 [Turn over 6 A student has samples of three different liquids, A, B and C. He carries out an experiment to compare the densities of these liquids. The apparatus he uses is shown in Fig. 6.1. liquid A mark on test-tube water is slowly added water Fig. 6.1 Method • He makes a mark on a test-tube. • He holds the test-tube upright in the beaker and slowly adds water to it, drop by drop, until it floats in the beaker of liquid A and the mark on the test-tube is level with the surface of liquid A. • He pours the water from the test-tube into a measuring cylinder and records the volume in Table 6.1. • He repeats the experiment using liquids B and C.
Question paper, page 22
22 © UCLES 2015 0652/62/O/N/15 (a) Name the piece of apparatus that the student could use to add water, drop by drop, to the test-tube in Fig. 6.1. [1] (b) The liquid which requires the greatest volume of water in the test-tube is the most dense. Fig. 6.2 shows the volume of water contained in each test-tube when it floats in liquids A, B and C. 20 15 10 5 20 15 10 5 20 15 10 5 liquid A liquid B liquid C Fig. 6.2 (i) Record, in Table 6.1, each volume of water to the nearest 0.5 cm3. Table 6.1 liquid A liquid B liquid C volume of water / cm3 [3] (ii) Use the results from Table 6.1 to place the liquids A, B, and C in order of density. most dense least dense [1]
Question paper, page 23
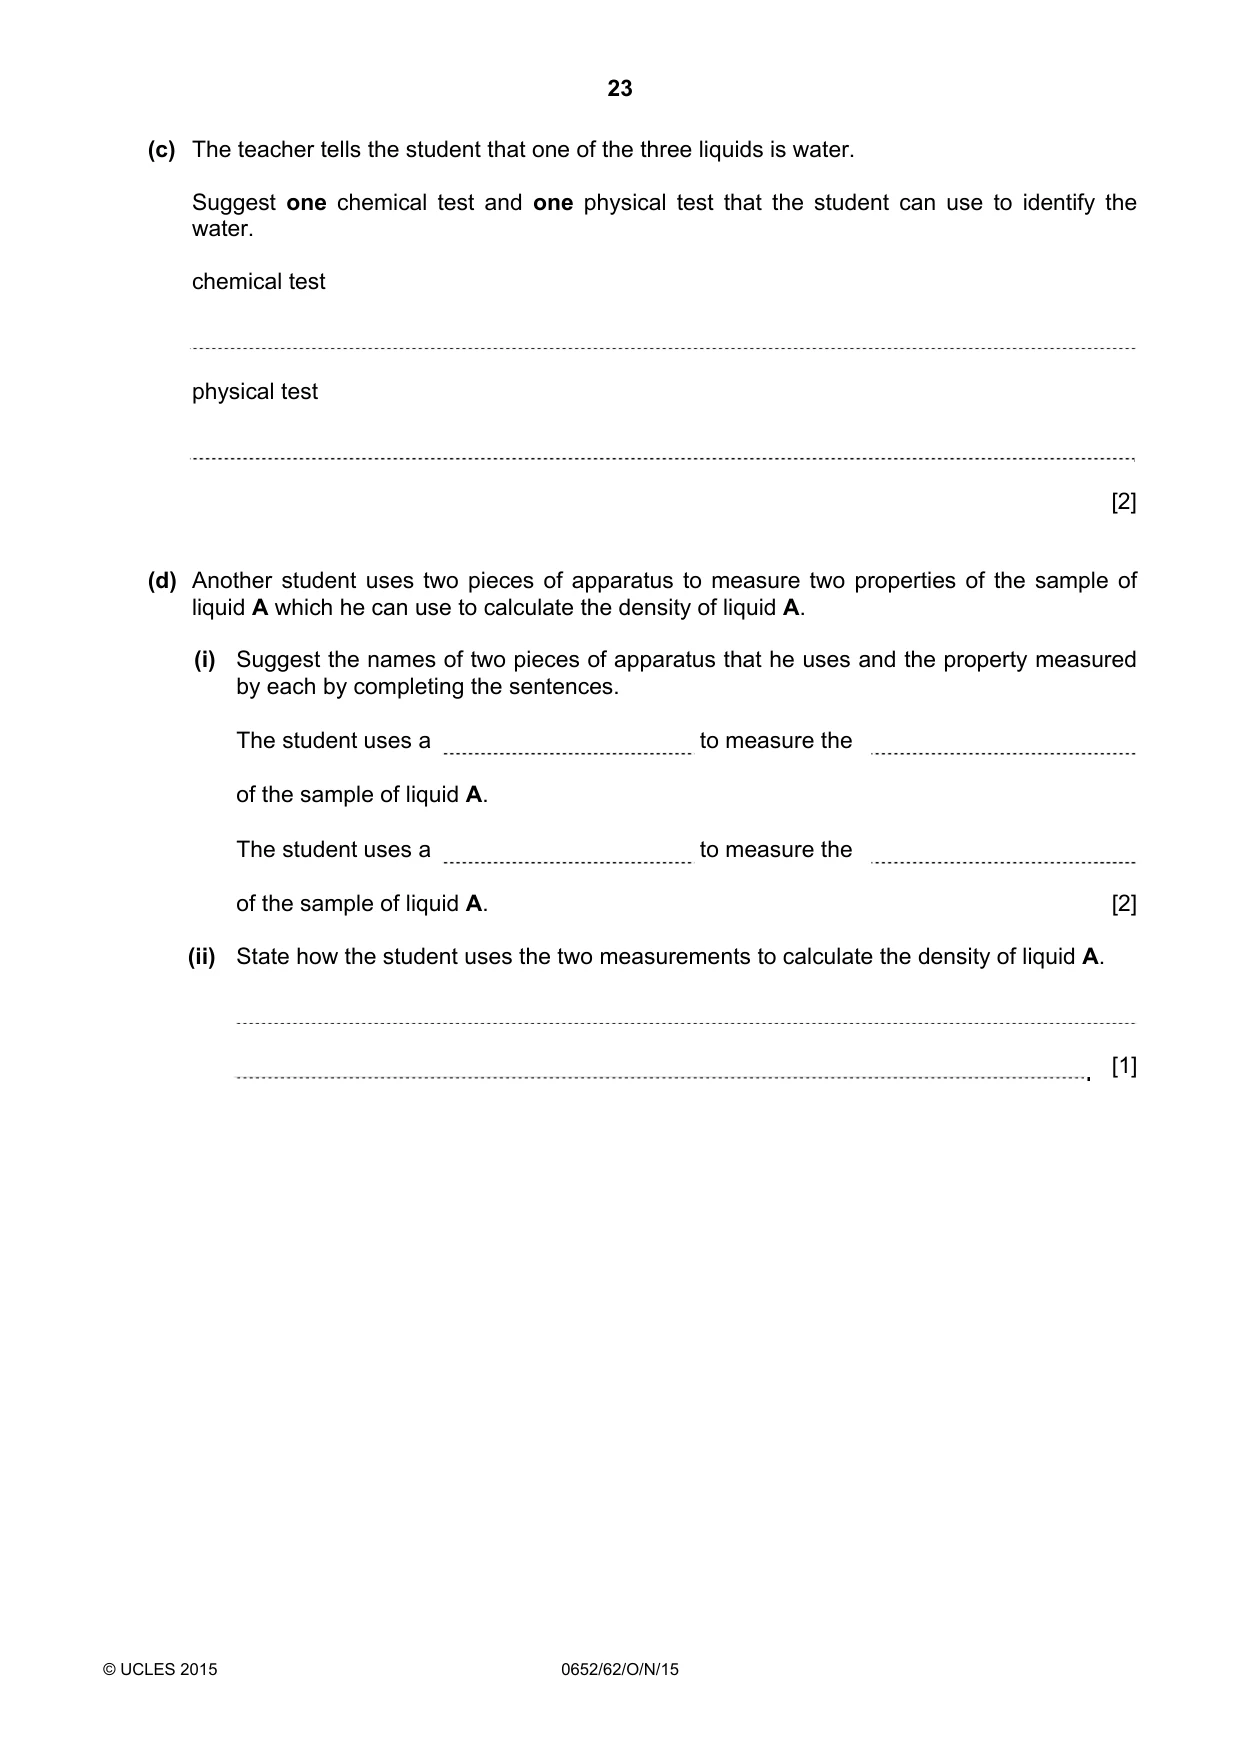
23 © UCLES 2015 0652/62/O/N/15 (c) The teacher tells the student that one of the three liquids is water. Suggest one chemical test and one physical test that the student can use to identify the water. chemical test physical test [2] (d) Another student uses two pieces of apparatus to measure two properties of the sample of liquid A which he can use to calculate the density of liquid A. (i) Suggest the names of two pieces of apparatus that he uses and the property measured by each by completing the sentences. The student uses a to measure the of the sample of liquid A. The student uses a to measure the of the sample of liquid A. [2] (ii) State how the student uses the two measurements to calculate the density of liquid A. [1]
Question paper, page 24
24 Permission to reproduce items where third-party owned material protected by copyright is included has been sought and cleared where possible. Every reasonable effort has been made by the publisher (UCLES) to trace copyright holders, but if any items requiring clearance have unwittingly been included, the publisher will be pleased to make amends at the earliest possible opportunity. To avoid the issue of disclosure of answer-related information to candidates, all copyright acknowledgements are reproduced online in the Cambridge International Examinations Copyright Acknowledgements Booklet. This is produced for each series of examinations and is freely available to download at www.cie.org.uk after the live examination series. Cambridge International Examinations is part of the Cambridge Assessment Group. Cambridge Assessment is the brand name of University of Cambridge Local Examinations Syndicate (UCLES), which is itself a department of the University of Cambridge. © UCLES 2015 0652/62/O/N/15 BLANK PAGE
Mark scheme, page 1
® IGCSE is the registered trademark of Cambridge International Examinations. CAMBRIDGE INTERNATIONAL EXAMINATIONS Cambridge International General Certificate of Secondary Education MARK SCHEME for the October/November 2015 series 0652 PHYSICAL SCIENCE 0652/62 Paper 6 (Alternative to Practical), maximum raw mark 60 This mark scheme is published as an aid to teachers and candidates, to indicate the requirements of the examination. It shows the basis on which Examiners were instructed to award marks. It does not indicate the details of the discussions that took place at an Examiners’ meeting before marking began, which would have considered the acceptability of alternative answers. Mark schemes should be read in conjunction with the question paper and the Principal Examiner Report for Teachers. Cambridge will not enter into discussions about these mark schemes. Cambridge is publishing the mark schemes for the October/November 2015 series for most Cambridge IGCSE®, Cambridge International A and AS Level components and some Cambridge O Level components.
Mark scheme, page 2
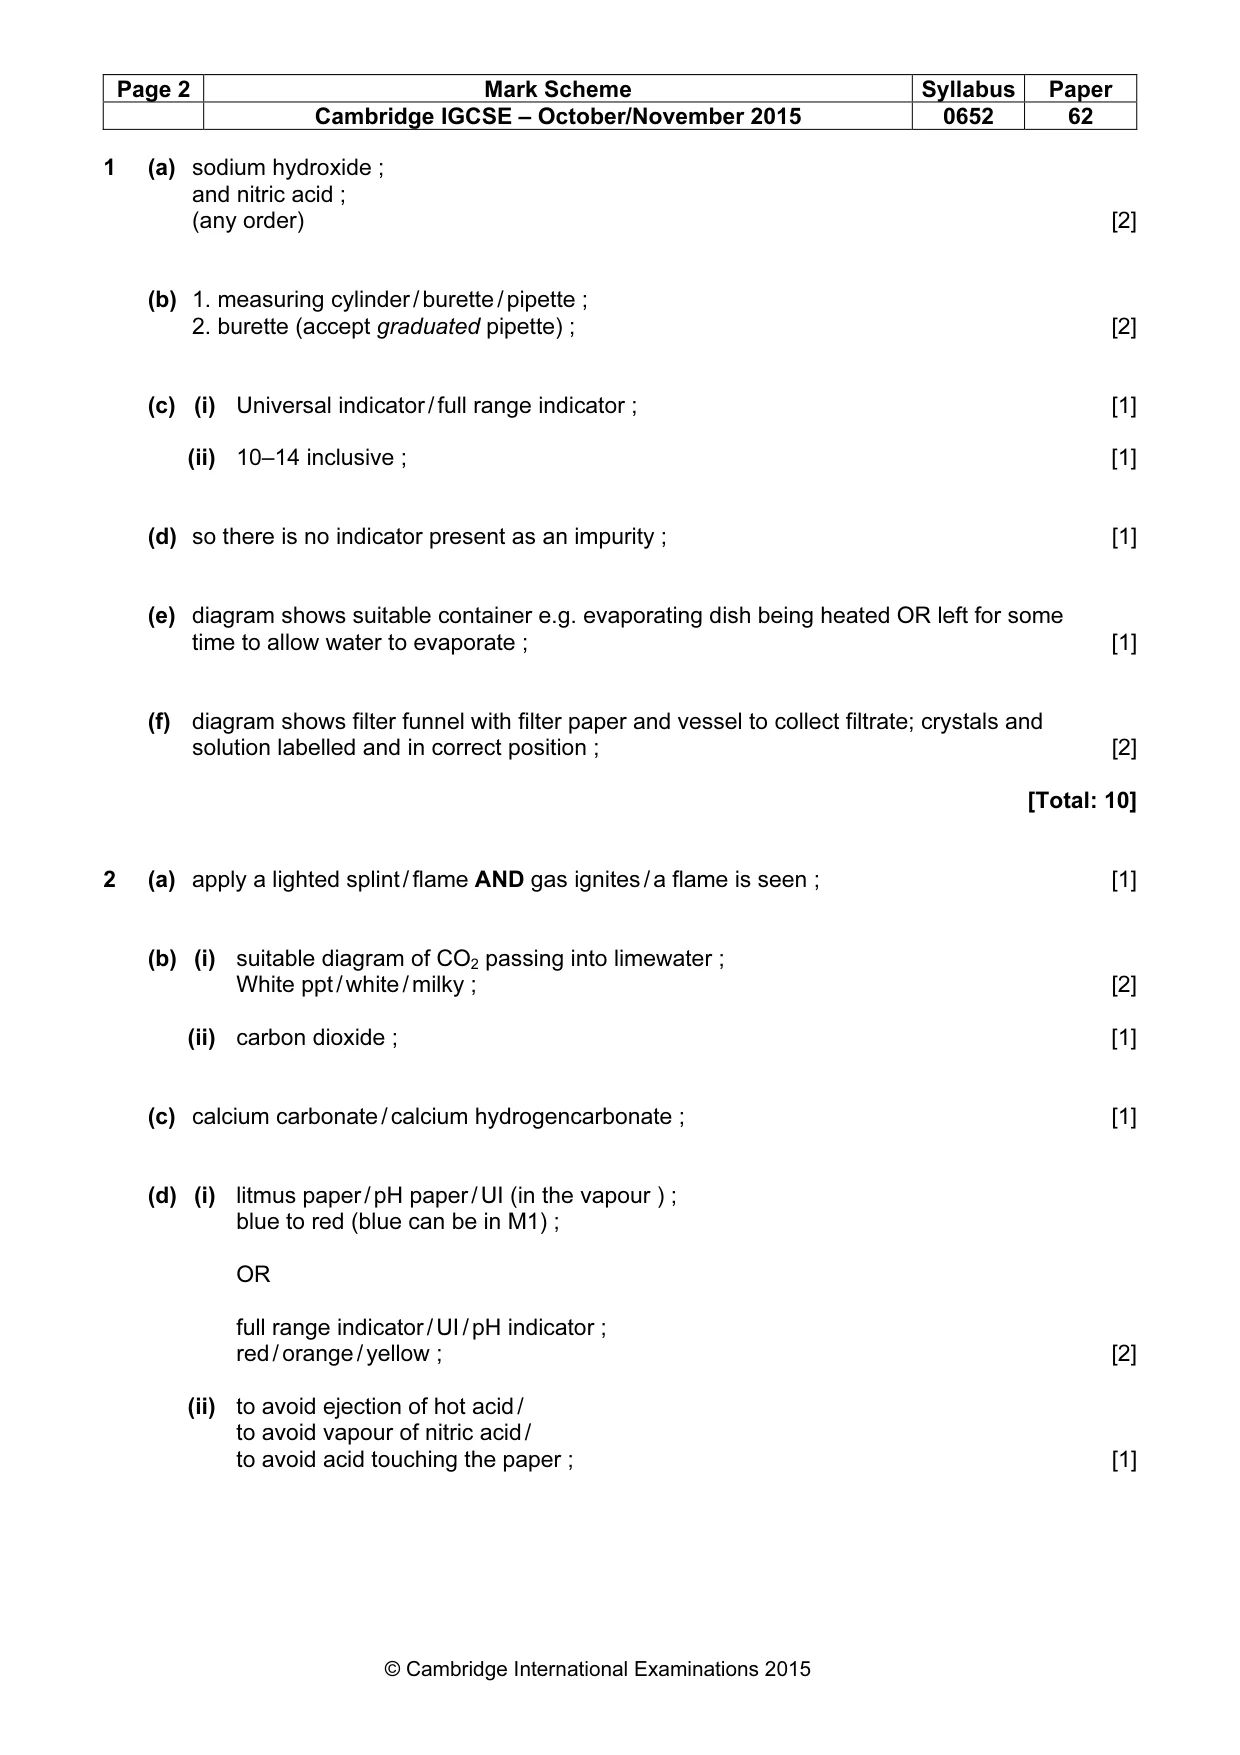
Page 2 Mark Scheme Syllabus Paper Cambridge IGCSE – October/November 2015 0652 62 © Cambridge International Examinations 2015 1 (a) sodium hydroxide ; and nitric acid ; (any order) [2] (b) 1. measuring cylinder / burette / pipette ; 2. burette (accept graduated pipette) ; [2] (c) (i) Universal indicator / full range indicator ; [1] (ii) 10–14 inclusive ; [1] (d) so there is no indicator present as an impurity ; [1] (e) diagram shows suitable container e.g. evaporating dish being heated OR left for some time to allow water to evaporate ; [1] (f) diagram shows filter funnel with filter paper and vessel to collect filtrate; crystals and solution labelled and in correct position ; [2] [Total: 10] 2 (a) apply a lighted splint / flame AND gas ignites / a flame is seen ; [1] (b) (i) suitable diagram of CO2 passing into limewater ; White ppt / white / milky ; [2] (ii) carbon dioxide ; [1] (c) calcium carbonate / calcium hydrogencarbonate ; [1] (d) (i) litmus paper / pH paper / UI (in the vapour ) ; blue to red (blue can be in M1) ; OR full range indicator / UI / pH indicator ; red / orange / yellow ; [2] (ii) to avoid ejection of hot acid / to avoid vapour of nitric acid / to avoid acid touching the paper ; [1]
Mark scheme, page 3
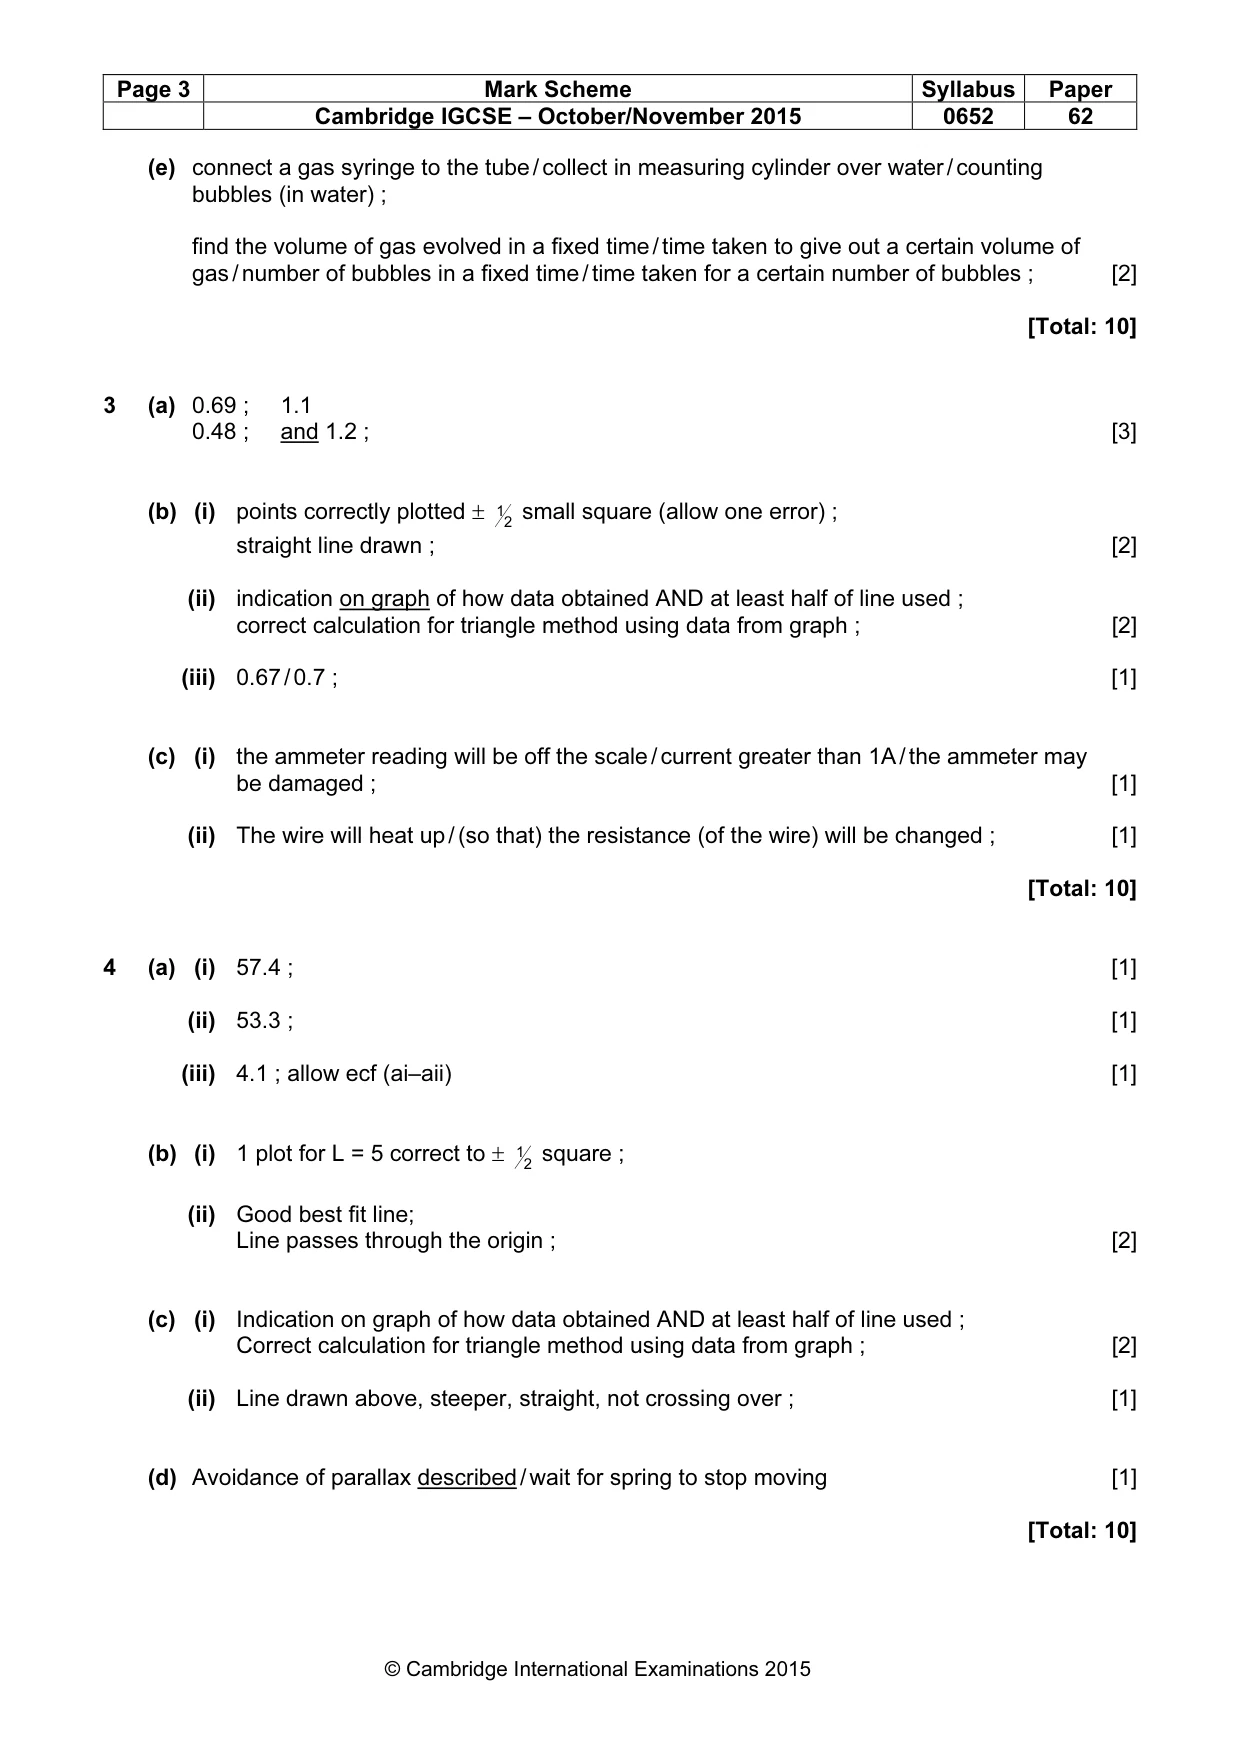
Page 3 Mark Scheme Syllabus Paper Cambridge IGCSE – October/November 2015 0652 62 © Cambridge International Examinations 2015 (e) connect a gas syringe to the tube / collect in measuring cylinder over water / counting bubbles (in water) ; find the volume of gas evolved in a fixed time / time taken to give out a certain volume of gas / number of bubbles in a fixed time / time taken for a certain number of bubbles ; [2] [Total: 10] 3 (a) 0.69 ; 1.1 0.48 ; and 1.2 ; [3] (b) (i) points correctly plotted ± 2 1 small square (allow one error) ; straight line drawn ; [2] (ii) indication on graph of how data obtained AND at least half of line used ; correct calculation for triangle method using data from graph ; [2] (iii) 0.67 / 0.7 ; [1] (c) (i) the ammeter reading will be off the scale / current greater than 1A / the ammeter may be damaged ; [1] (ii) The wire will heat up / (so that) the resistance (of the wire) will be changed ; [1] [Total: 10] 4 (a) (i) 57.4 ; [1] (ii) 53.3 ; [1] (iii) 4.1 ; allow ecf (ai–aii) [1] (b) (i) 1 plot for L = 5 correct to ± 2 1 square ; (ii) Good best fit line; Line passes through the origin ; [2] (c) (i) Indication on graph of how data obtained AND at least half of line used ; Correct calculation for triangle method using data from graph ; [2] (ii) Line drawn above, steeper, straight, not crossing over ; [1] (d) Avoidance of parallax described / wait for spring to stop moving [1] [Total: 10]
Mark scheme, page 4
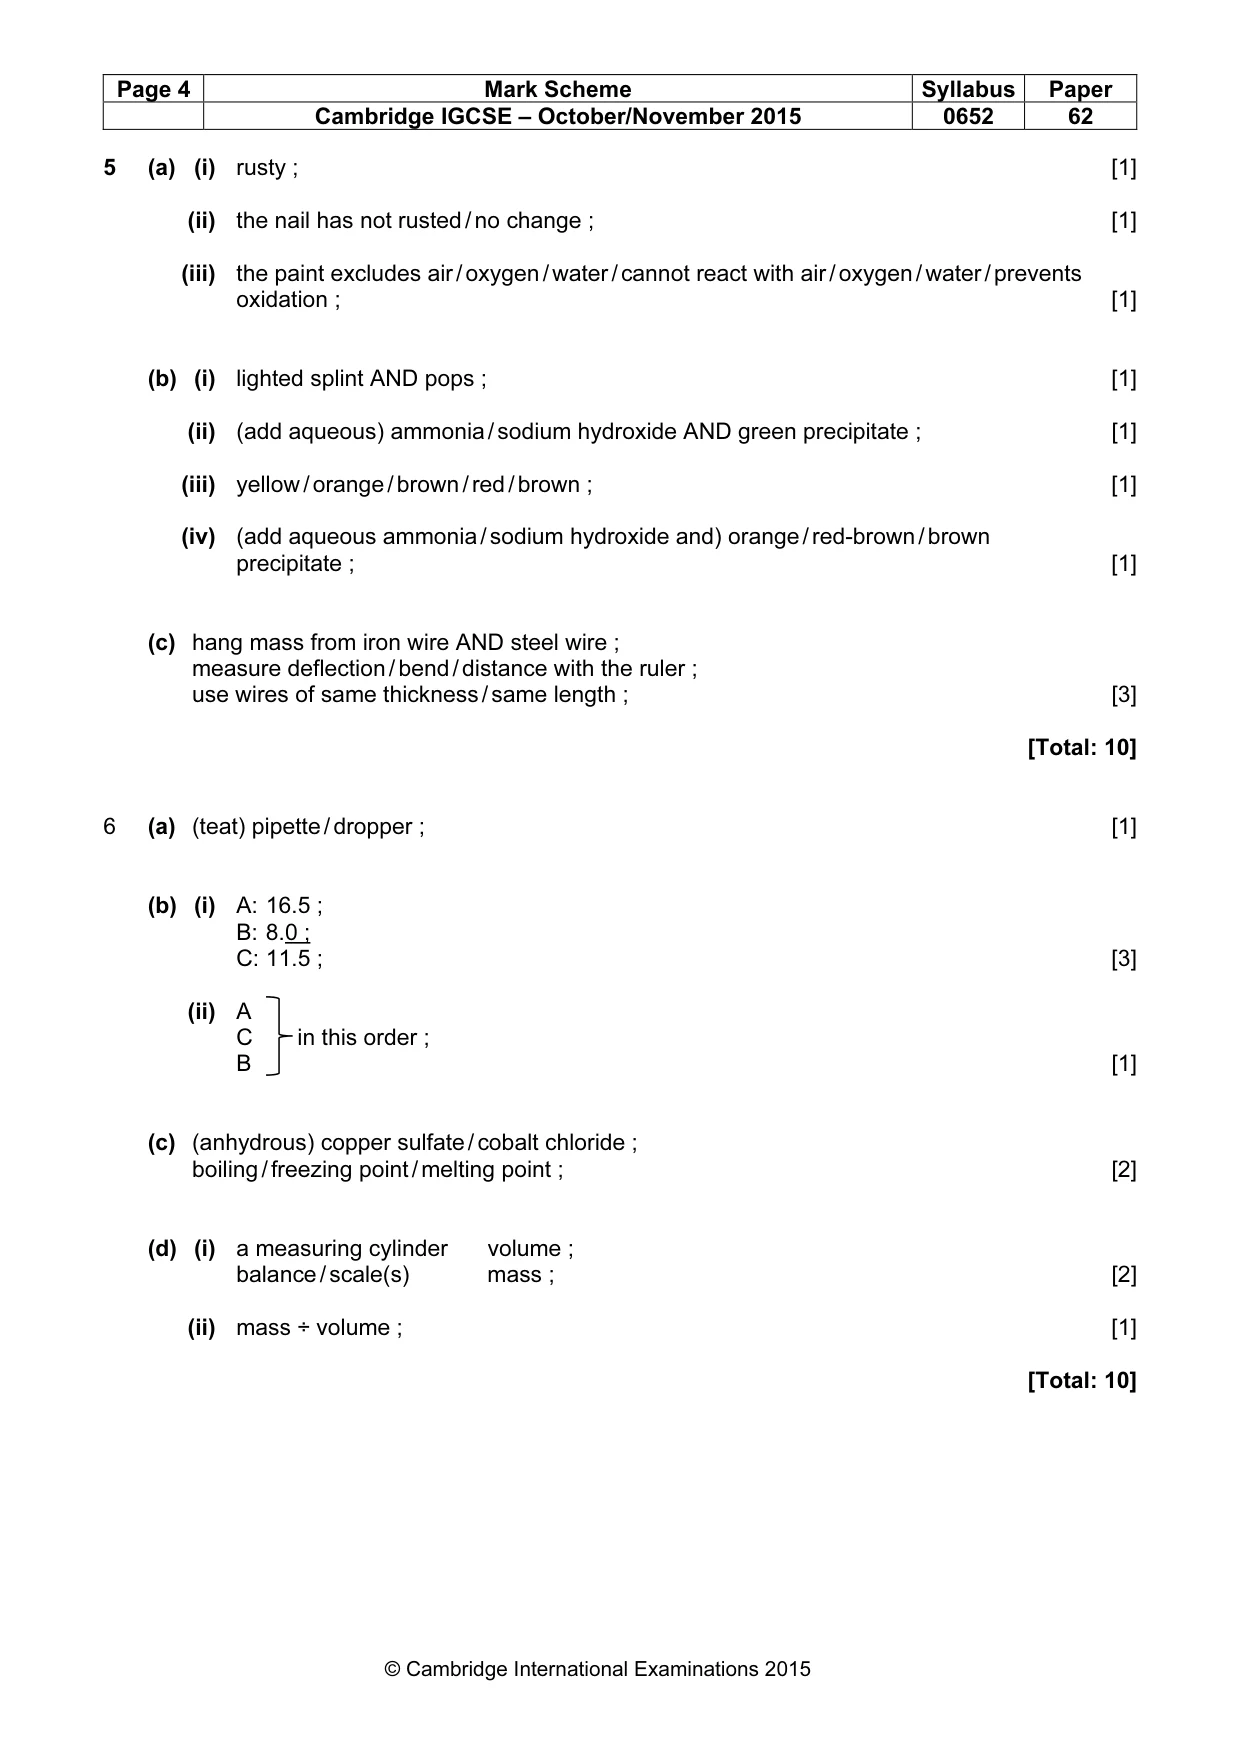
Page 4 Mark Scheme Syllabus Paper Cambridge IGCSE – October/November 2015 0652 62 © Cambridge International Examinations 2015 5 (a) (i) rusty ; [1] (ii) the nail has not rusted / no change ; [1] (iii) the paint excludes air / oxygen / water / cannot react with air / oxygen / water / prevents oxidation ; [1] (b) (i) lighted splint AND pops ; [1] (ii) (add aqueous) ammonia / sodium hydroxide AND green precipitate ; [1] (iii) yellow / orange / brown / red / brown ; [1] (iv) (add aqueous ammonia / sodium hydroxide and) orange / red-brown / brown precipitate ; [1] (c) hang mass from iron wire AND steel wire ; measure deflection / bend / distance with the ruler ; use wires of same thickness / same length ; [3] [Total: 10] 6 (a) (teat) pipette / dropper ; [1] (b) (i) A: 16.5 ; B: 8.0 ; C: 11.5 ; [3] (ii) A C in this order ; B [1] (c) (anhydrous) copper sulfate / cobalt chloride ; boiling / freezing point / melting point ; [2] (d) (i) a measuring cylinder volume ; balance / scale(s) mass ; [2] (ii) mass ÷ volume ; [1] [Total: 10]
What you needed in this session
Cambridge’s own grade thresholds for 2015 Oct/Nov, Paper 6 · Variant 2. A higher threshold means an easier paper — the bar moves with how the cohort did.