Cambridge IGCSE Physical Science 0652 — 2017 Oct/Nov Paper 6 · Variant 2
0652/62/O/N/17 · 6 questions · 60 marks · ≈68 min
The question paper and its mark scheme, free to read here and free to download. This is Cambridge’s own paper, exactly as it was sat.
Question paper24 pages


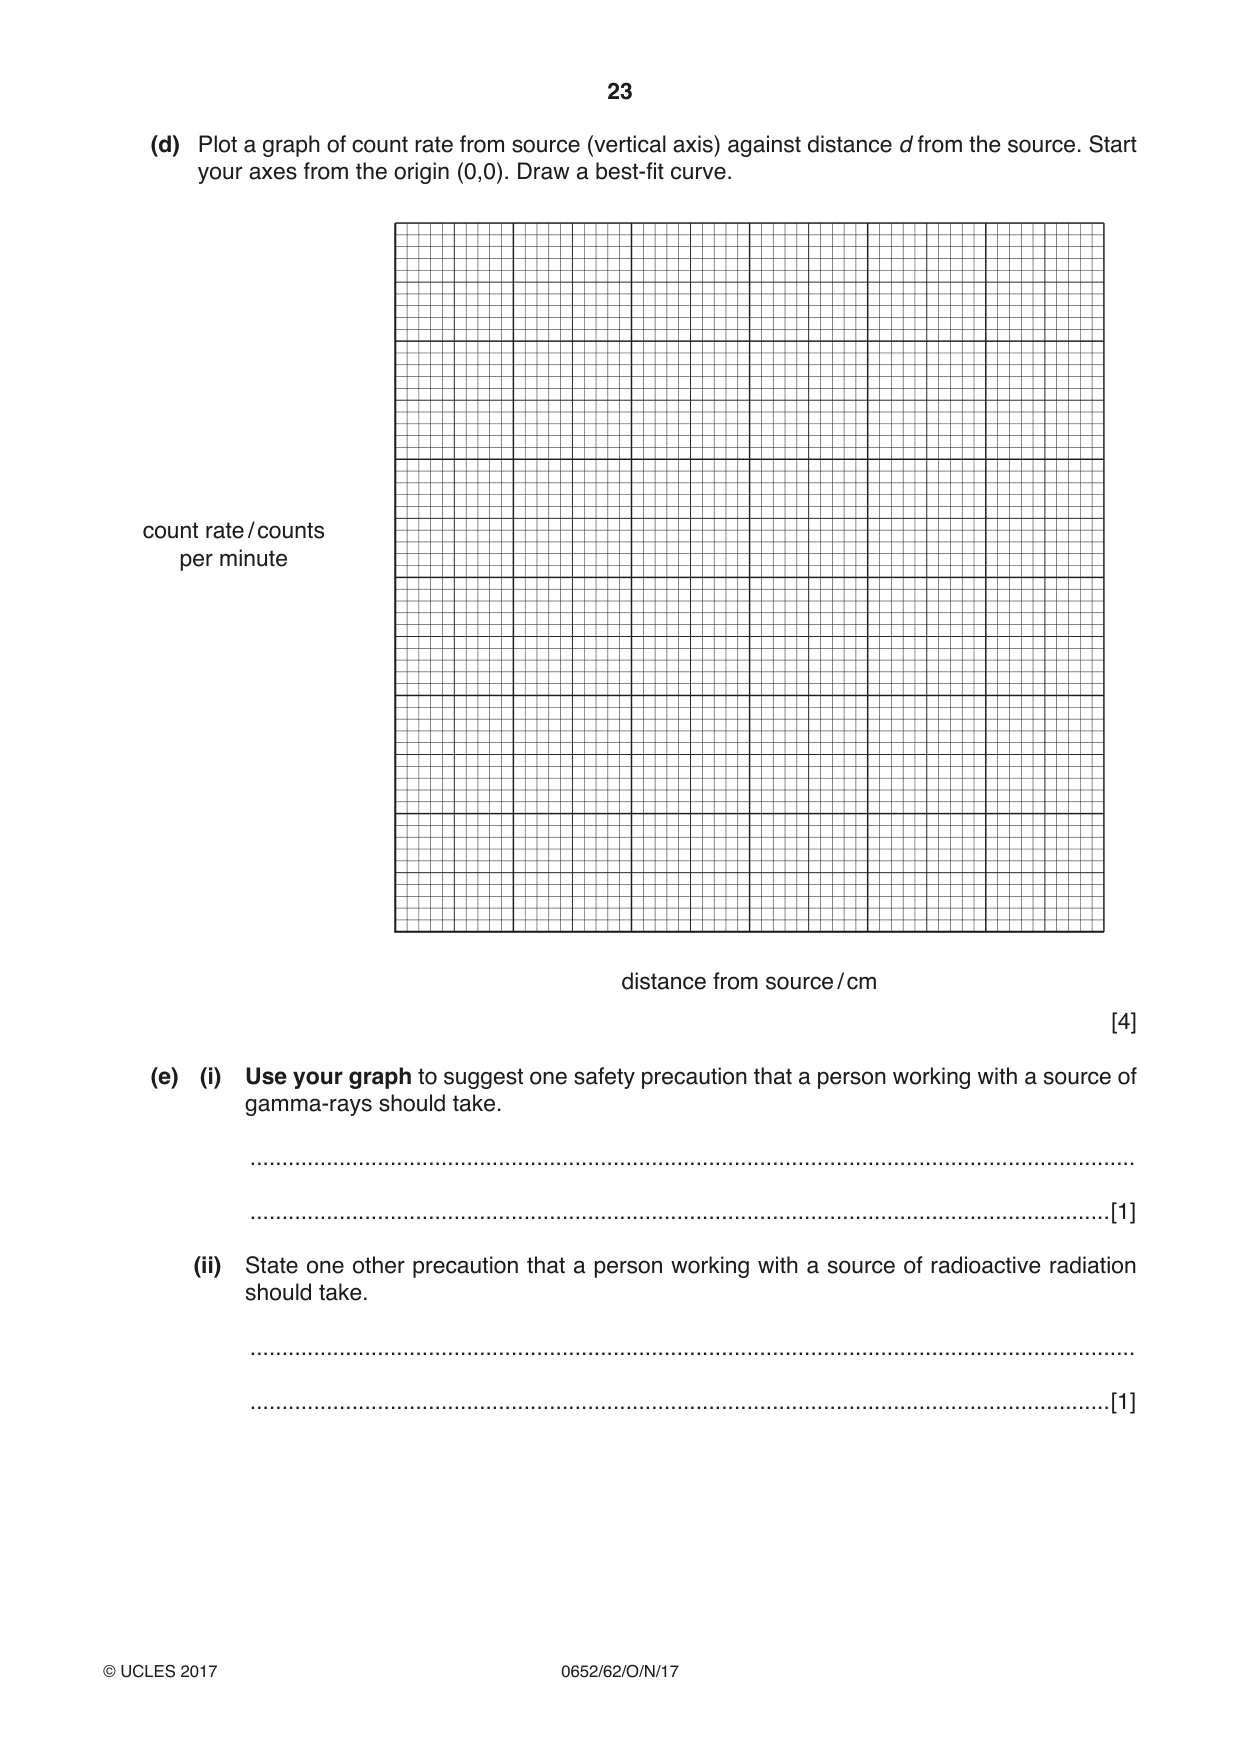
Mark scheme5 pages
Answers below. Sit the paper first if you are practising.
Questions as text
Q1 · A student investigates the temperature changes when metals L, M and N react with acid
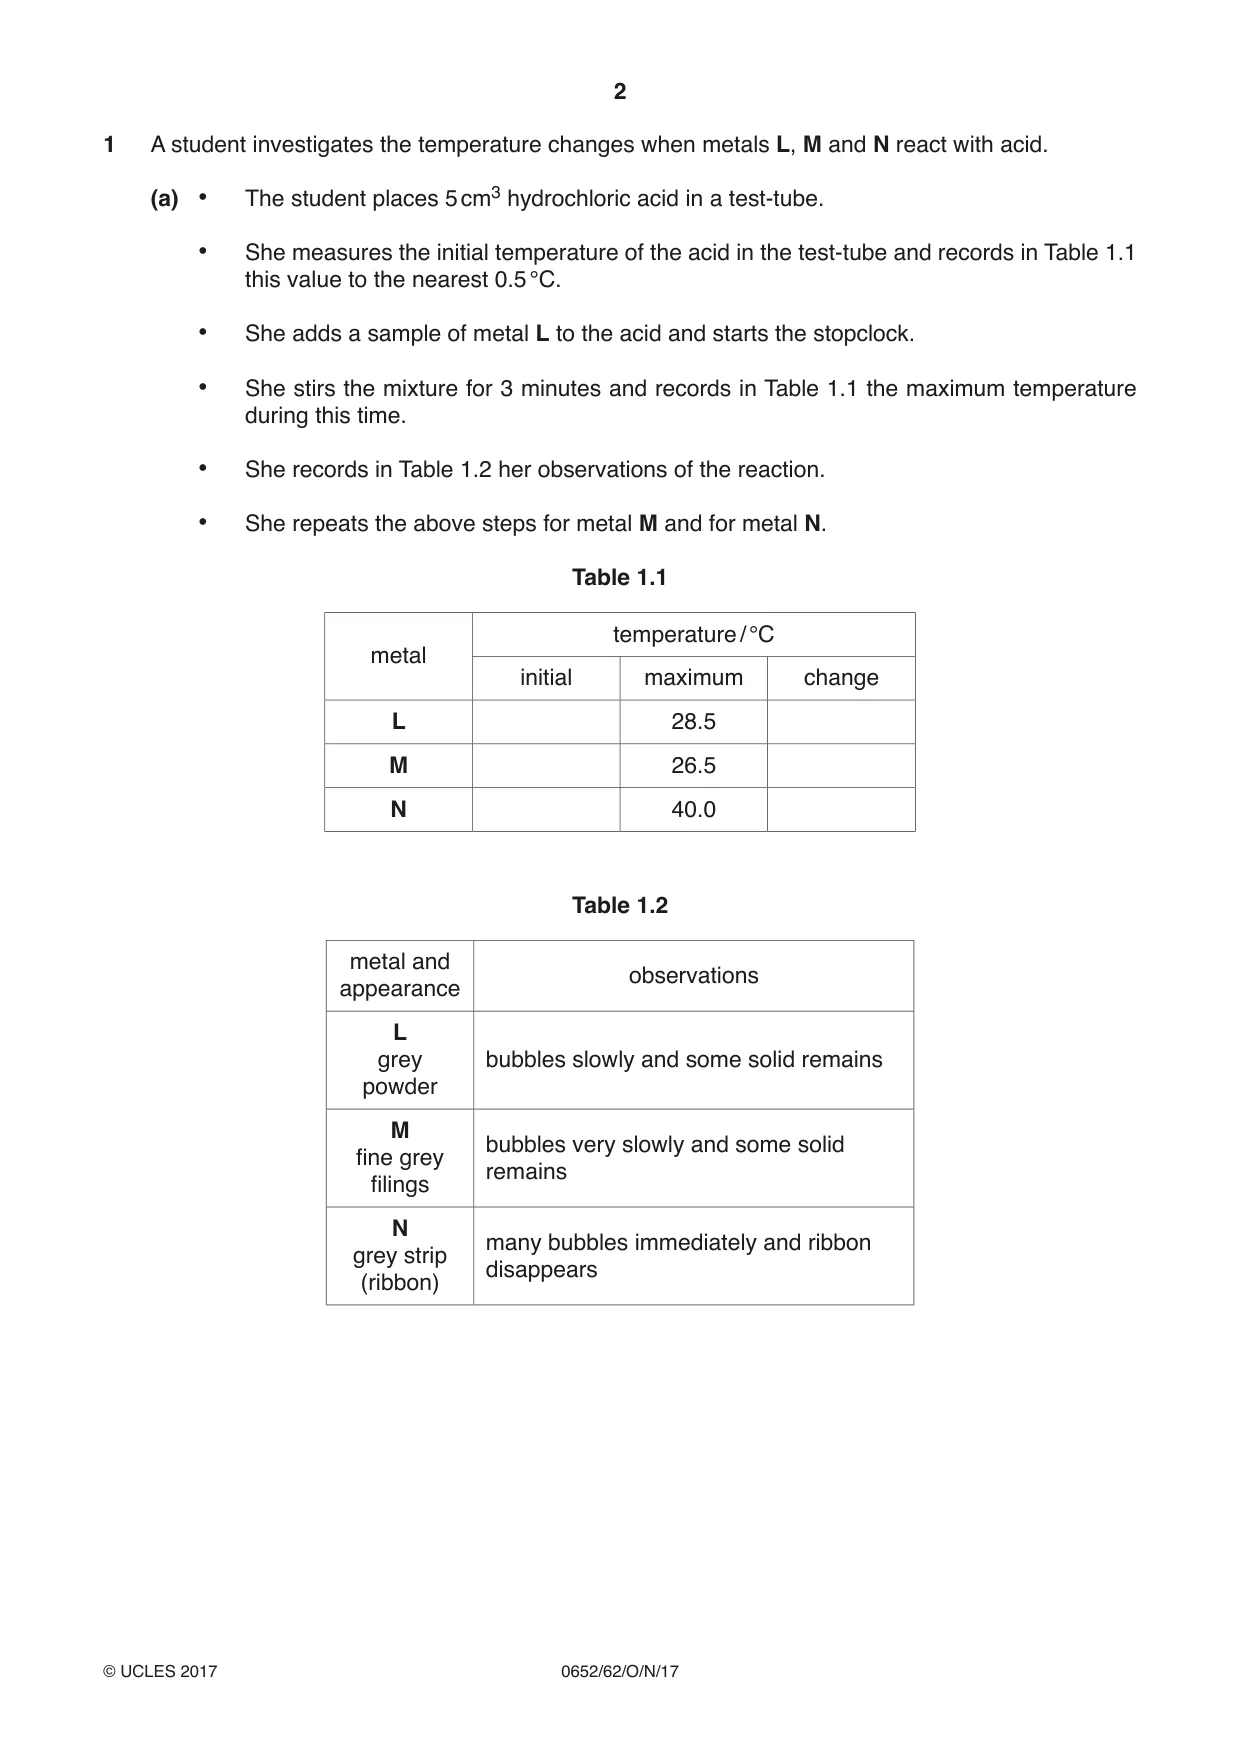
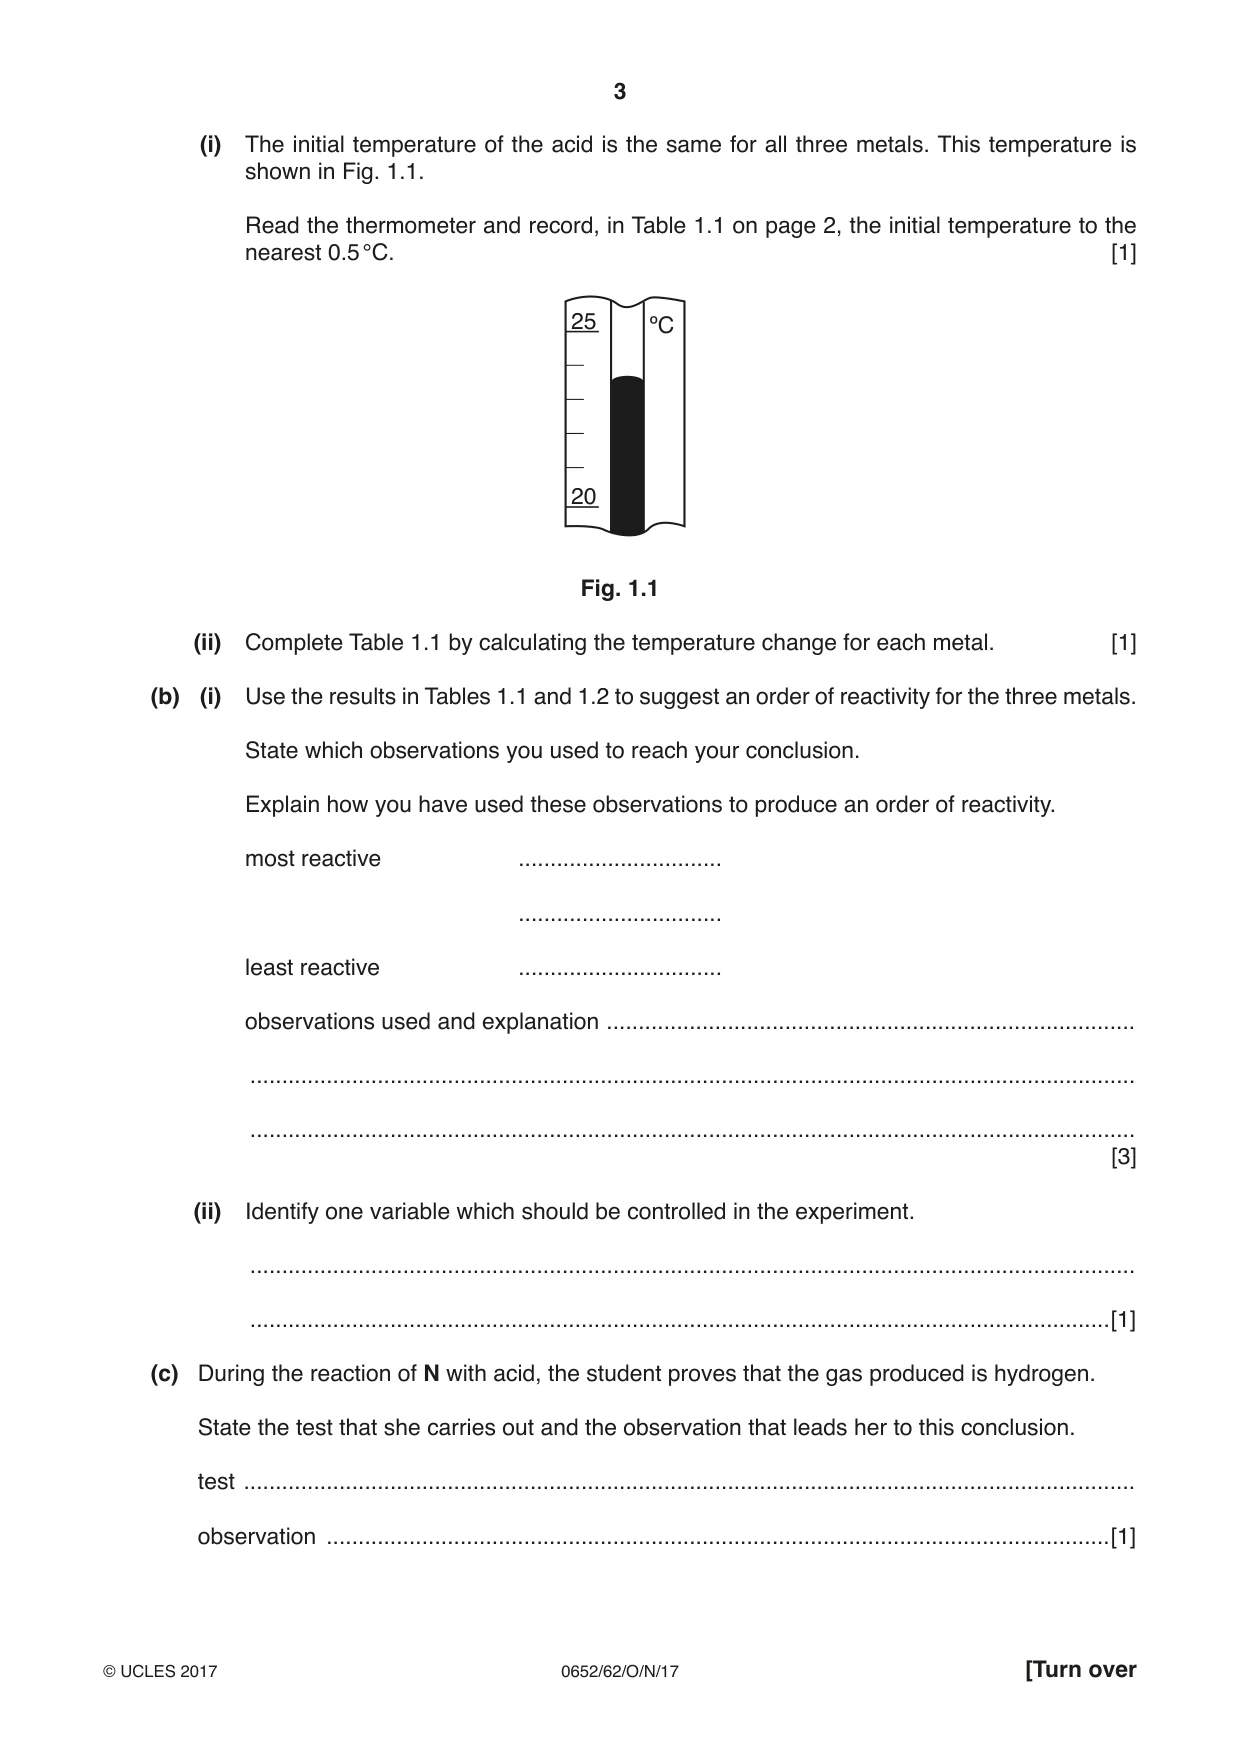
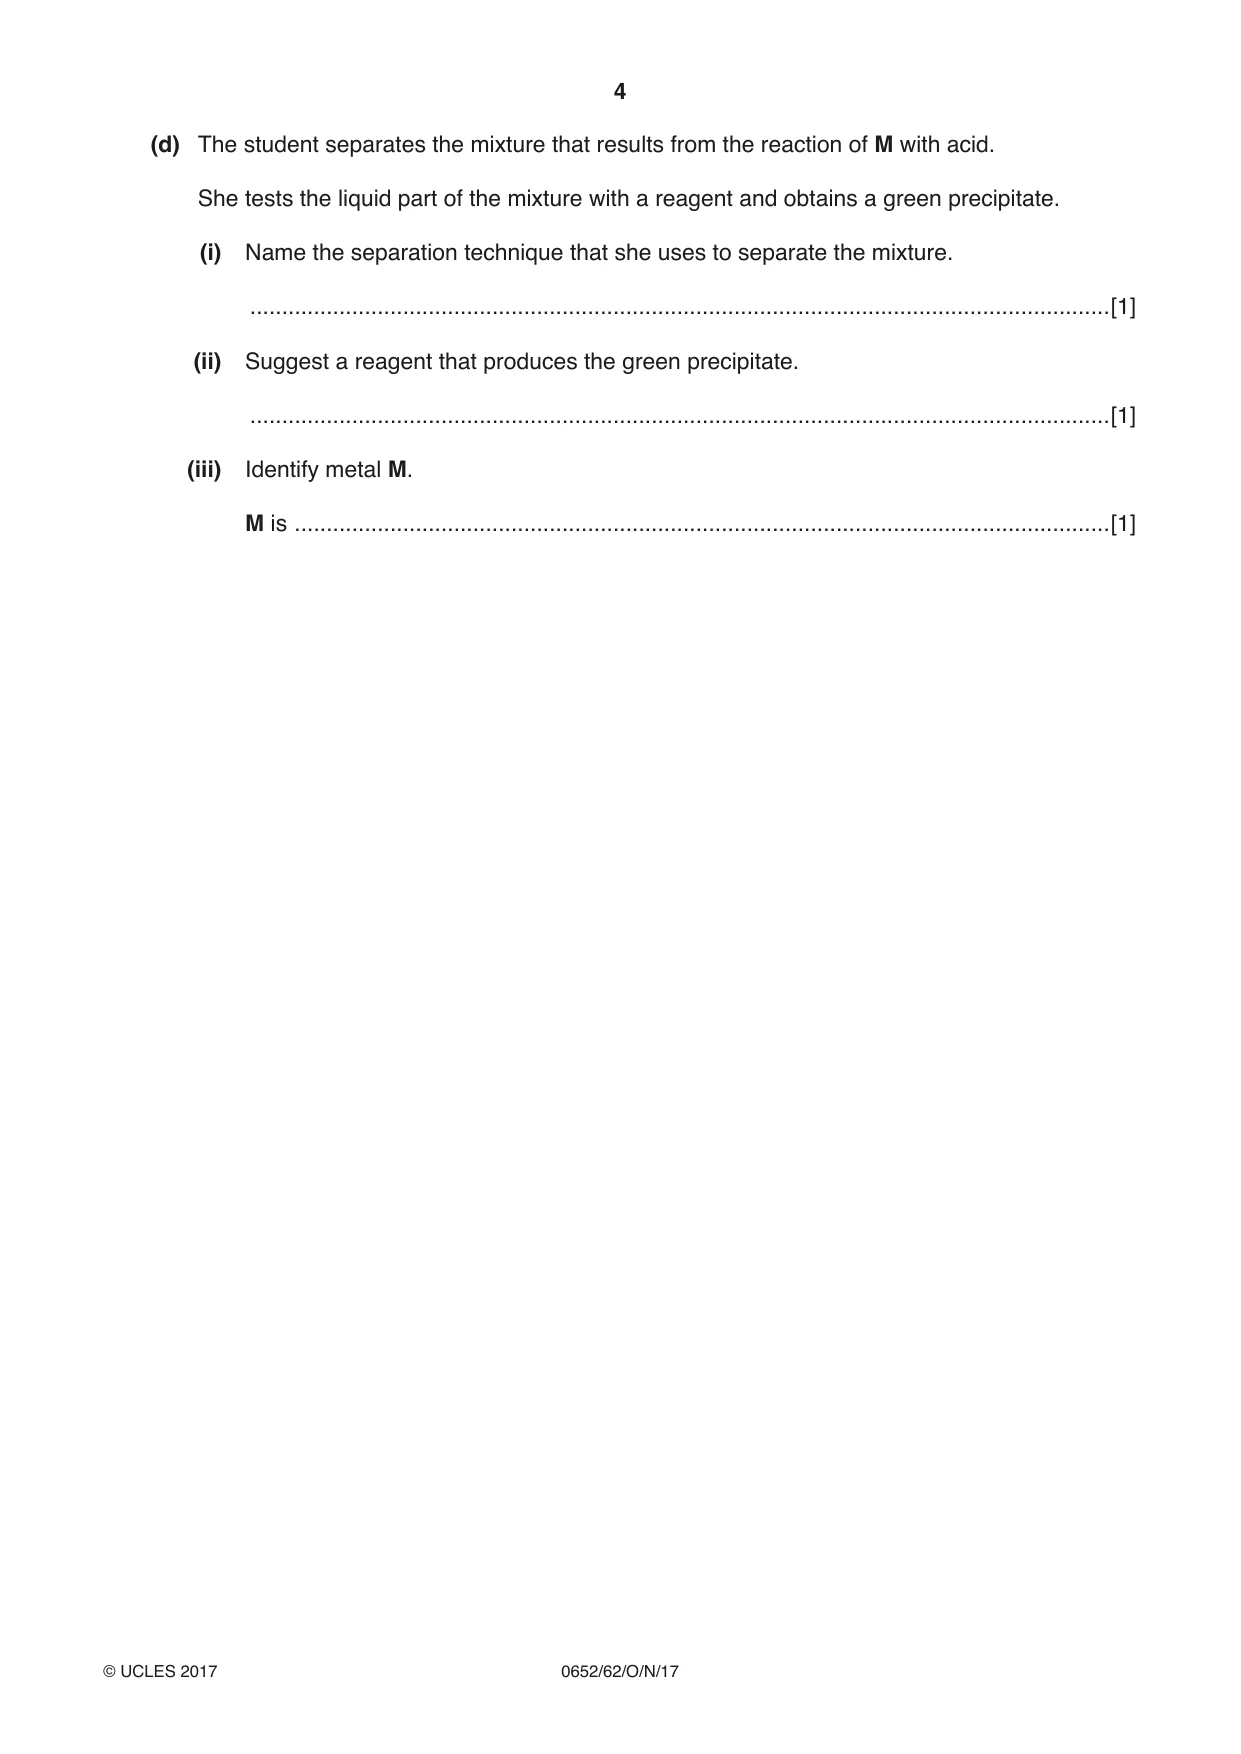
1 A student investigates the temperature changes when metals L, M and N react with acid. (a) • The student places 5 cm3 hydrochloric acid in a test-tube. • She measures the initial temperature of the acid in the test-tube and records in Table 1.1 this value to the nearest 0.5 °C. • She adds a sample of metal L to the acid and starts the stopclock. • She stirs the mixture for 3 minutes and records in Table 1.1 the maximum temperature during this time. • She records in Table 1.2 her observations of the reaction. • She repeats the above steps for metal M and for metal N. Table 1.1 temperature / °C metal initial maximum change L 28.5 M 26.5 N 40.0 Table 1.2 metal and observations appearance L grey bubbles slowly and some solid remains powder M bubbles very slowly and some solid fine grey remains filings N many bubbles immediately and ribbon grey strip disappears (ribbon) (i) The initial temperature of the acid is the same for all three metals. This temperature is shown in Fig. 1.1. Read the thermometer and record, in Table 1.1 on page 2, the initial temperature to the nearest 0.5 °C. [1] 25 ºC 20 Fig. 1.1 (ii) Complete Table 1.1 by calculating the temperature change for each metal. [1] (b) (i) Use the results in Tables 1.1 and 1.2 to suggest an order of reactivity for the three metals. State which observations you used to reach your conclusion. Explain how you have used these observations to produce an order of reactivity. most reactive ................................ ................................ least reactive ................................ observations used and explanation ................................................................................... ........................................................................................................................................... ........................................................................................................................................... [3] (ii) Identify one variable which should be controlled in the experiment. ........................................................................................................................................... .......................................................................................................................................[1] (c) During the reaction of N with acid, the student proves that the gas produced is hydrogen. State the test that she carries out and the observation that leads her to this conclusion. test ............................................................................................................................................ observation ...........................................................................................................................[1] (d) The student separates the mixture that results from the reaction of M with acid. She tests the liquid part of the mixture with a reagent and obtains a green precipitate. (i) Name the separation technique that she uses to separate the mixture. .......................................................................................................................................[1] (ii) Suggest a reagent that produces the green precipitate. .......................................................................................................................................[1] (iii) Identify metal M. M is ................................................................................................................................[1]
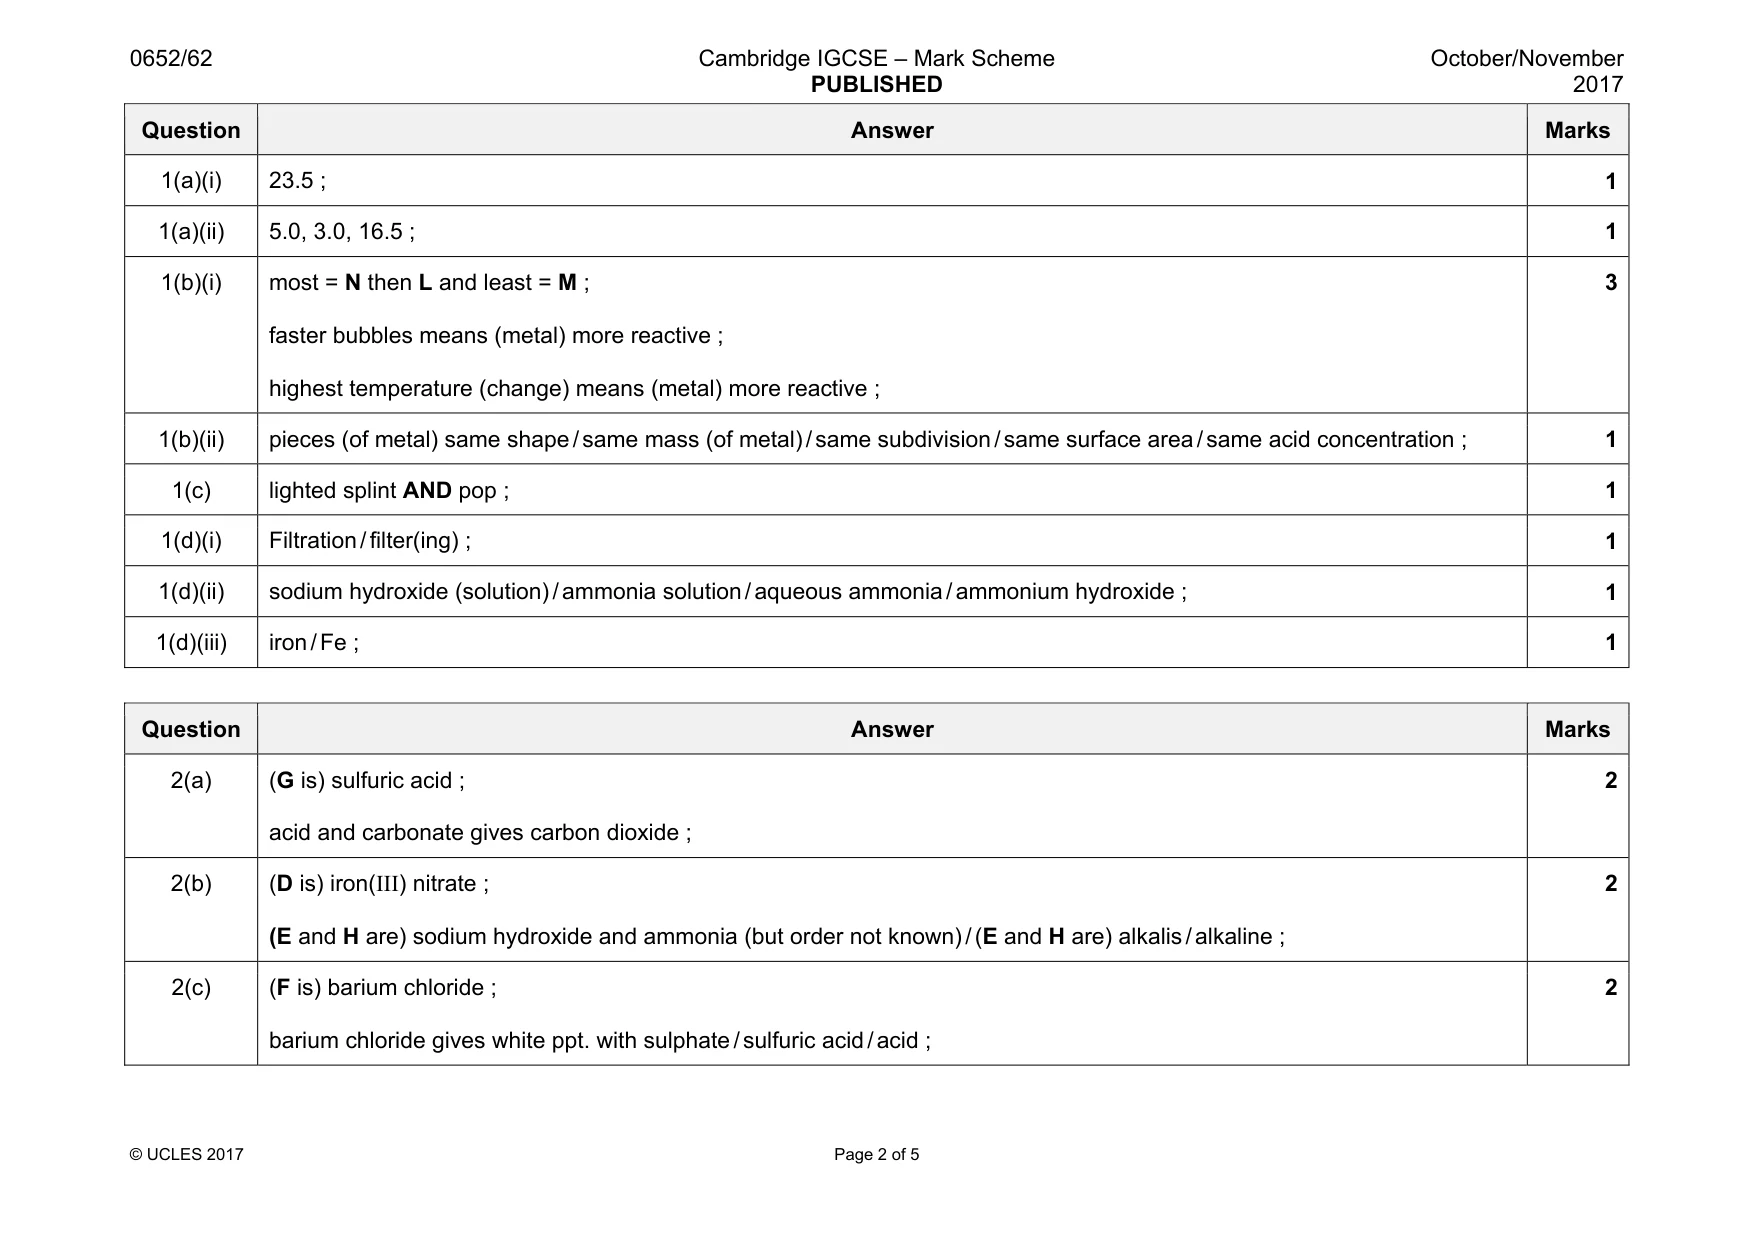
Mark scheme: 1(a)(i) 23.5 ; 1 1(a)(ii) 5.0, 3.0, 16.5 ; 1 1(b)(i) most = N then L and least = M ; faster bubbles means (metal) more reactive ; highest temperature (change) means (metal) more reactive ; 3 1(b)(ii) pieces (of metal) same shape / same mass (of metal) / same subdivision / same surface area / same acid concentration ; 1 1(c) lighted splint AND pop ; 1 1(d)(i) Filtration / filter(ing) ; 1 1(d)(ii) sodium hydroxide (solution) / ammonia solution / aqueous ammonia / ammonium hydroxide ; 1 1(d)(iii) iron / Fe ; 1
Q2 · A student carries out reactions to identify five solutions, D, E, F, G and H
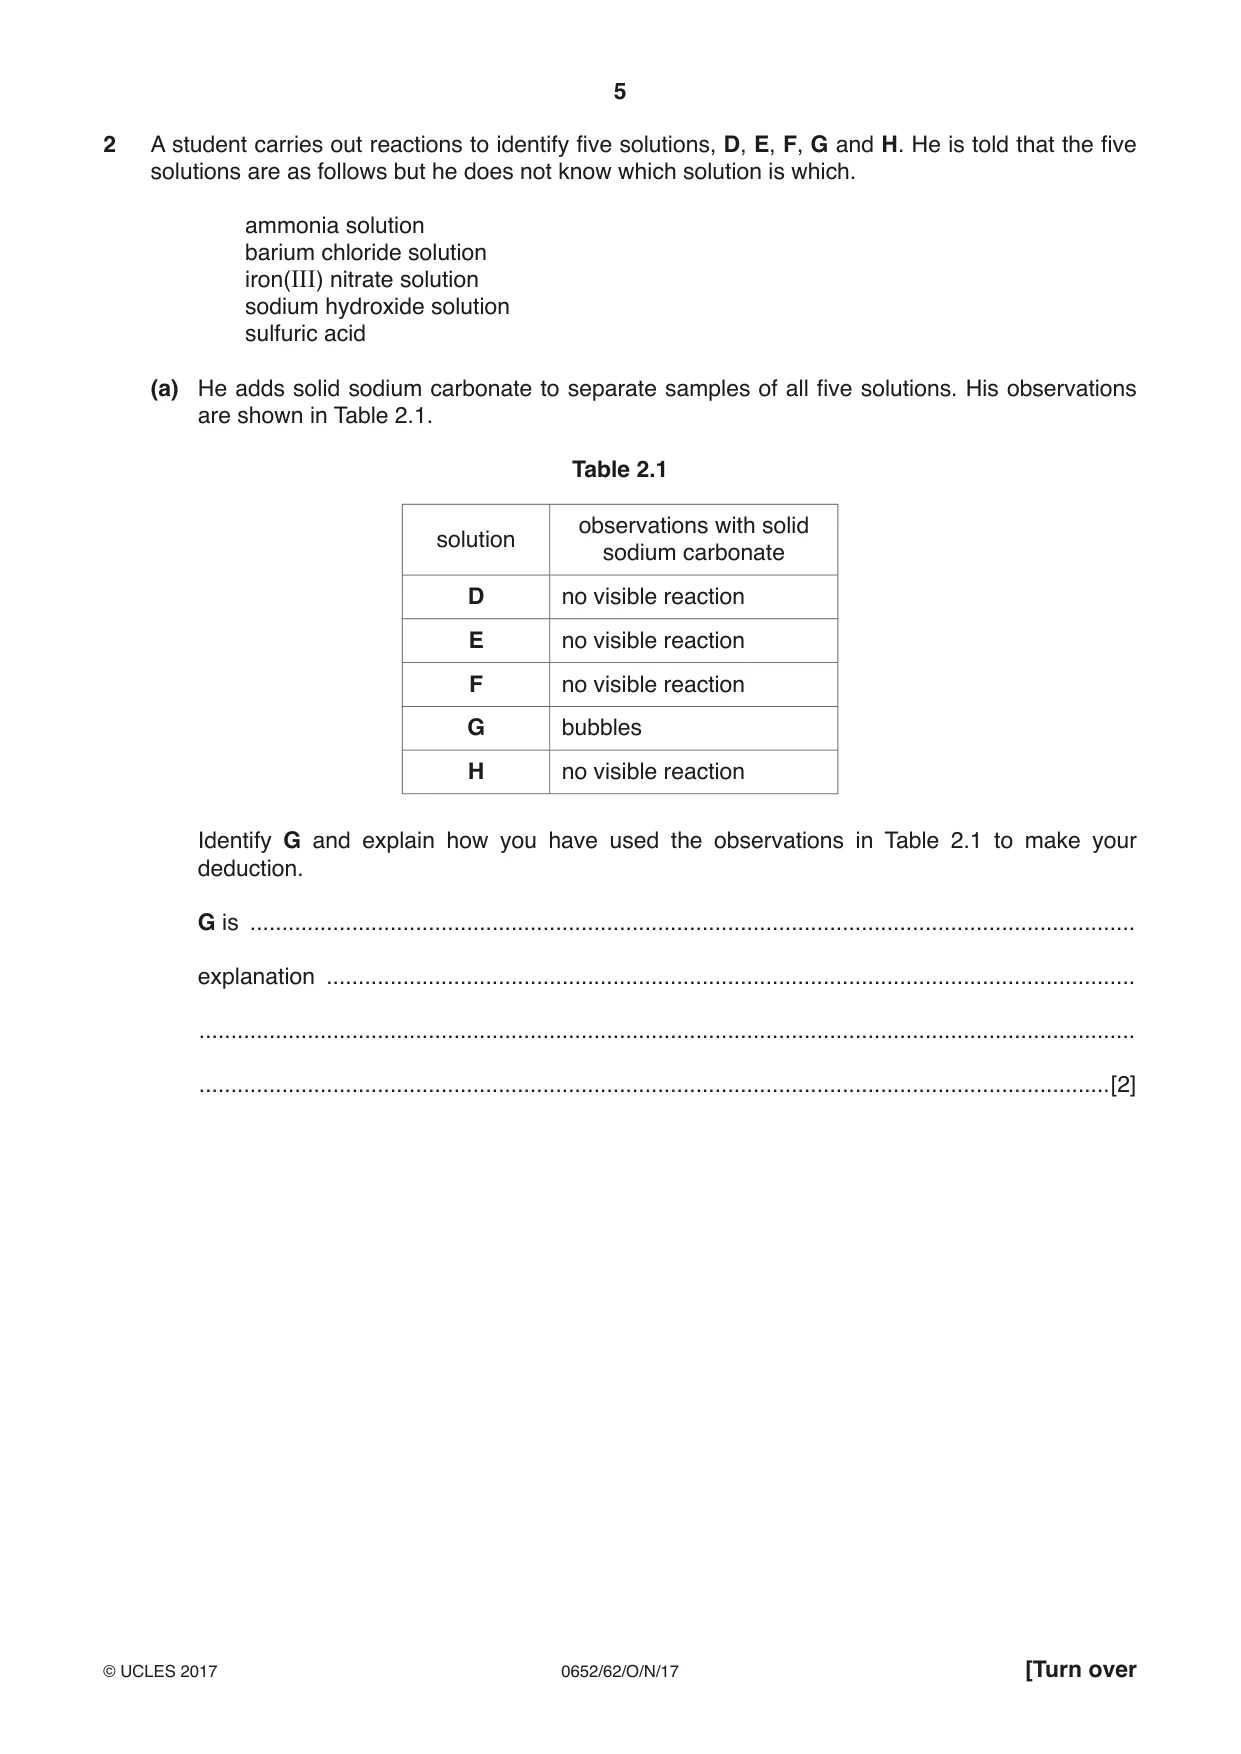
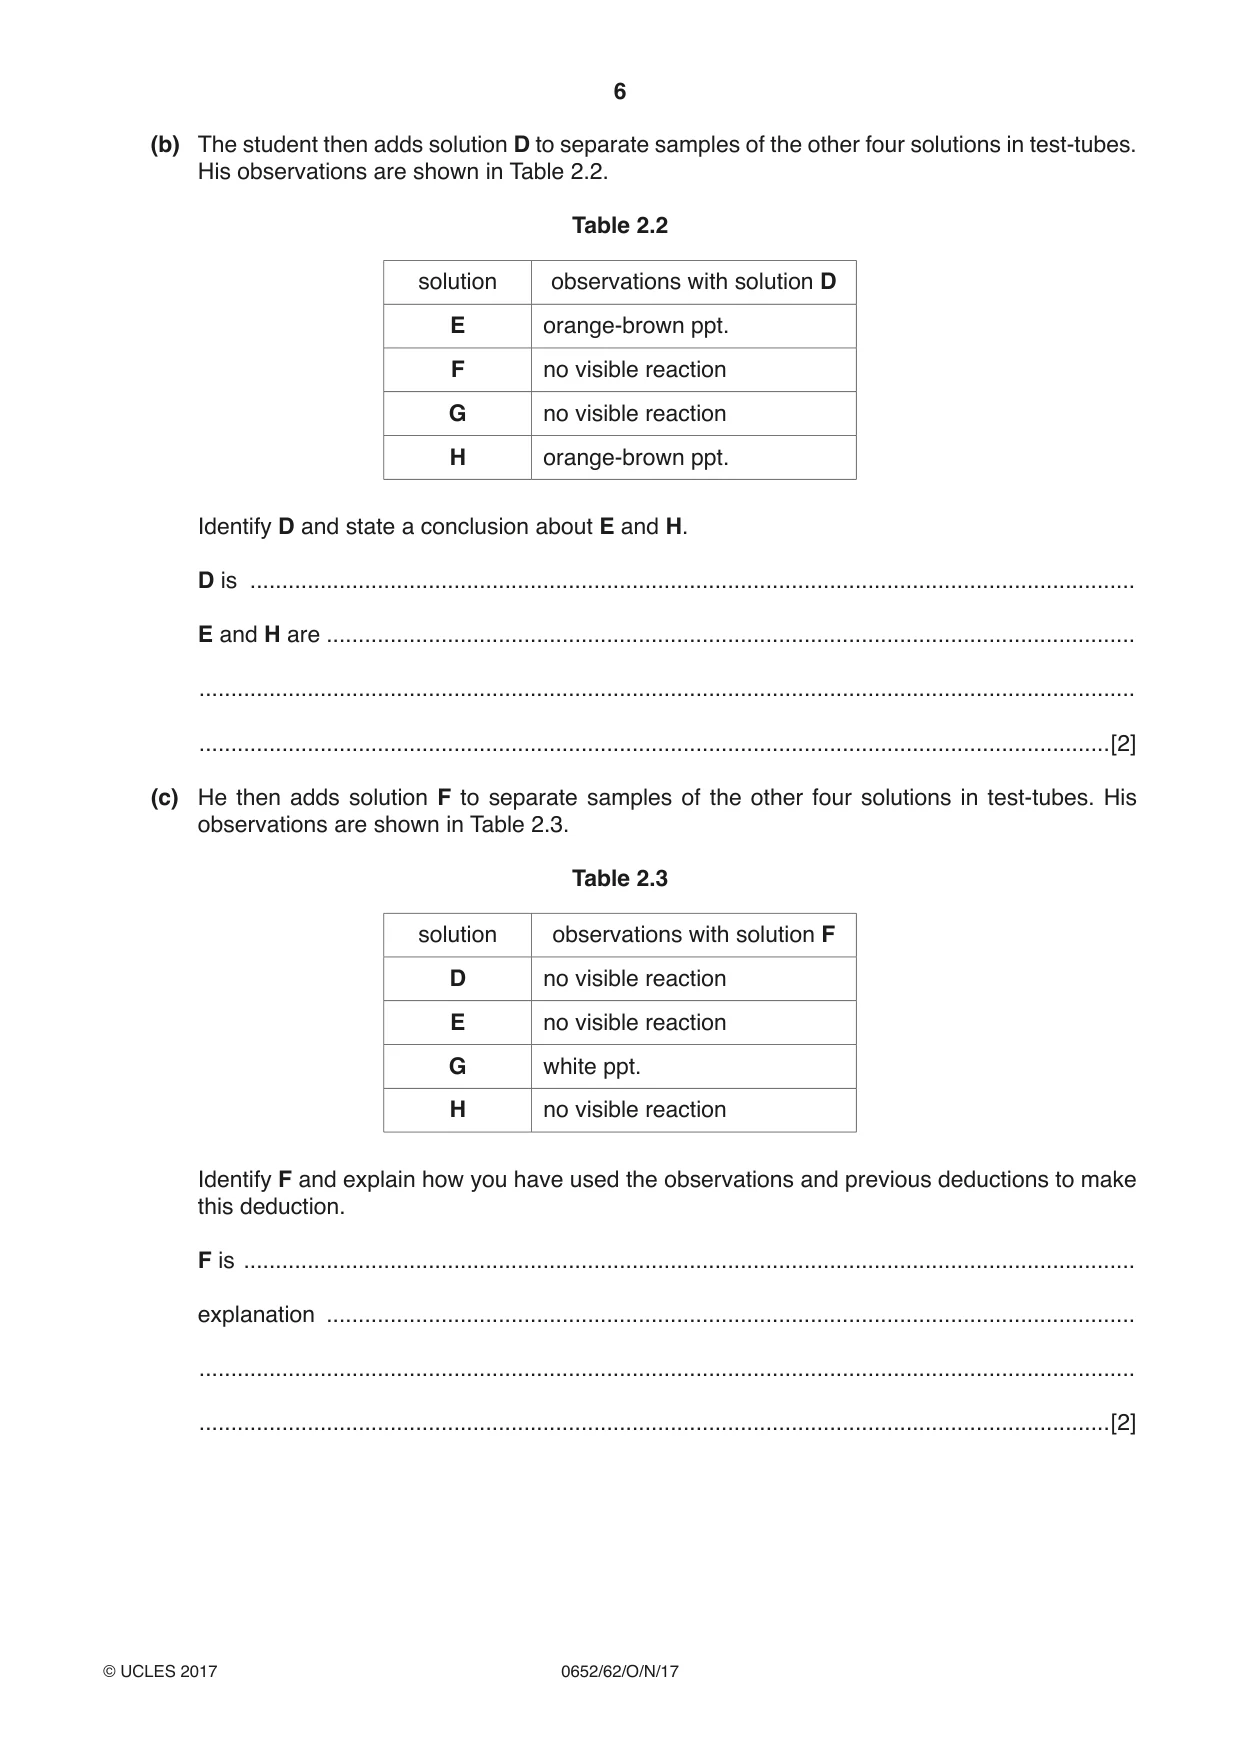
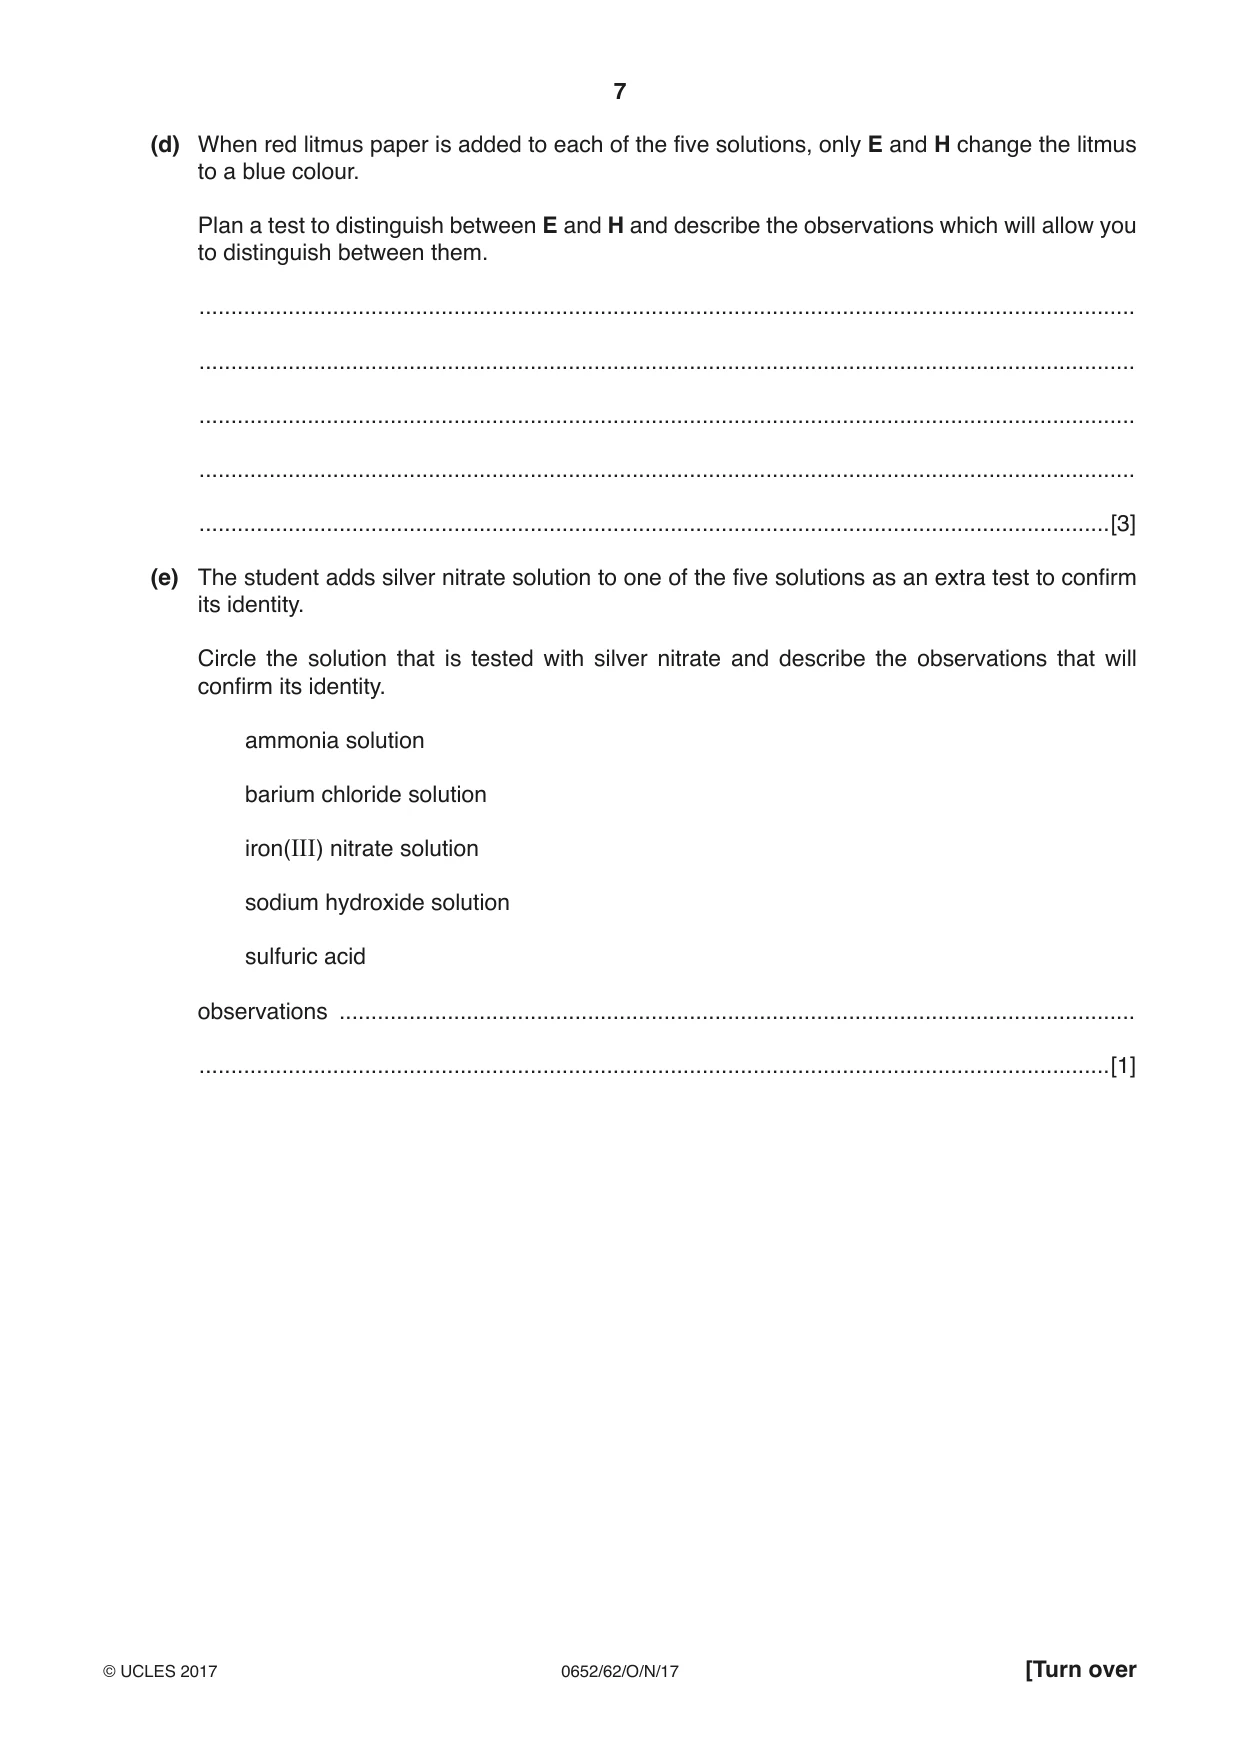
2 A student carries out reactions to identify five solutions, D, E, F, G and H. He is told that the five solutions are as follows but he does not know which solution is which. ammonia solution barium chloride solution iron(III) nitrate solution sodium hydroxide solution sulfuric acid (a) He adds solid sodium carbonate to separate samples of all five solutions. His observations are shown in Table 2.1. Table 2.1 observations with solid solution sodium carbonate D no visible reaction E no visible reaction F no visible reaction G bubbles H no visible reaction Identify G and explain how you have used the observations in Table 2.1 to make your deduction. G is ........................................................................................................................................... explanation ............................................................................................................................... ................................................................................................................................................... ...............................................................................................................................................[2] (b) The student then adds solution D to separate samples of the other four solutions in test-tubes. His observations are shown in Table 2.2. Table 2.2 solution observations with solution D E orange-brown ppt. F no visible reaction G no visible reaction H orange-brown ppt. Identify D and state a conclusion about E and H. D is ........................................................................................................................................... E and H are ............................................................................................................................... ................................................................................................................................................... ...............................................................................................................................................[2] (c) He then adds solution F to separate samples of the other four solutions in test-tubes. His observations are shown in Table 2.3. Table 2.3 solution observations with solution F D no visible reaction E no visible reaction G white ppt. H no visible reaction Identify F and explain how you have used the observations and previous deductions to make this deduction. F is ............................................................................................................................................ explanation ............................................................................................................................... ................................................................................................................................................... ...............................................................................................................................................[2] (d) When red litmus paper is added to each of the five solutions, only E and H change the litmus to a blue colour. Plan a test to distinguish between E and H and describe the observations which will allow you to distinguish between them. ................................................................................................................................................... ................................................................................................................................................... ................................................................................................................................................... ................................................................................................................................................... ...............................................................................................................................................[3] (e) The student adds silver nitrate solution to one of the five solutions as an extra test to confirm its identity. Circle the solution that is tested with silver nitrate and describe the observations that will confirm its identity. ammonia solution barium chloride solution iron(III) nitrate solution sodium hydroxide solution sulfuric acid observations ............................................................................................................................. ...............................................................................................................................................[1]
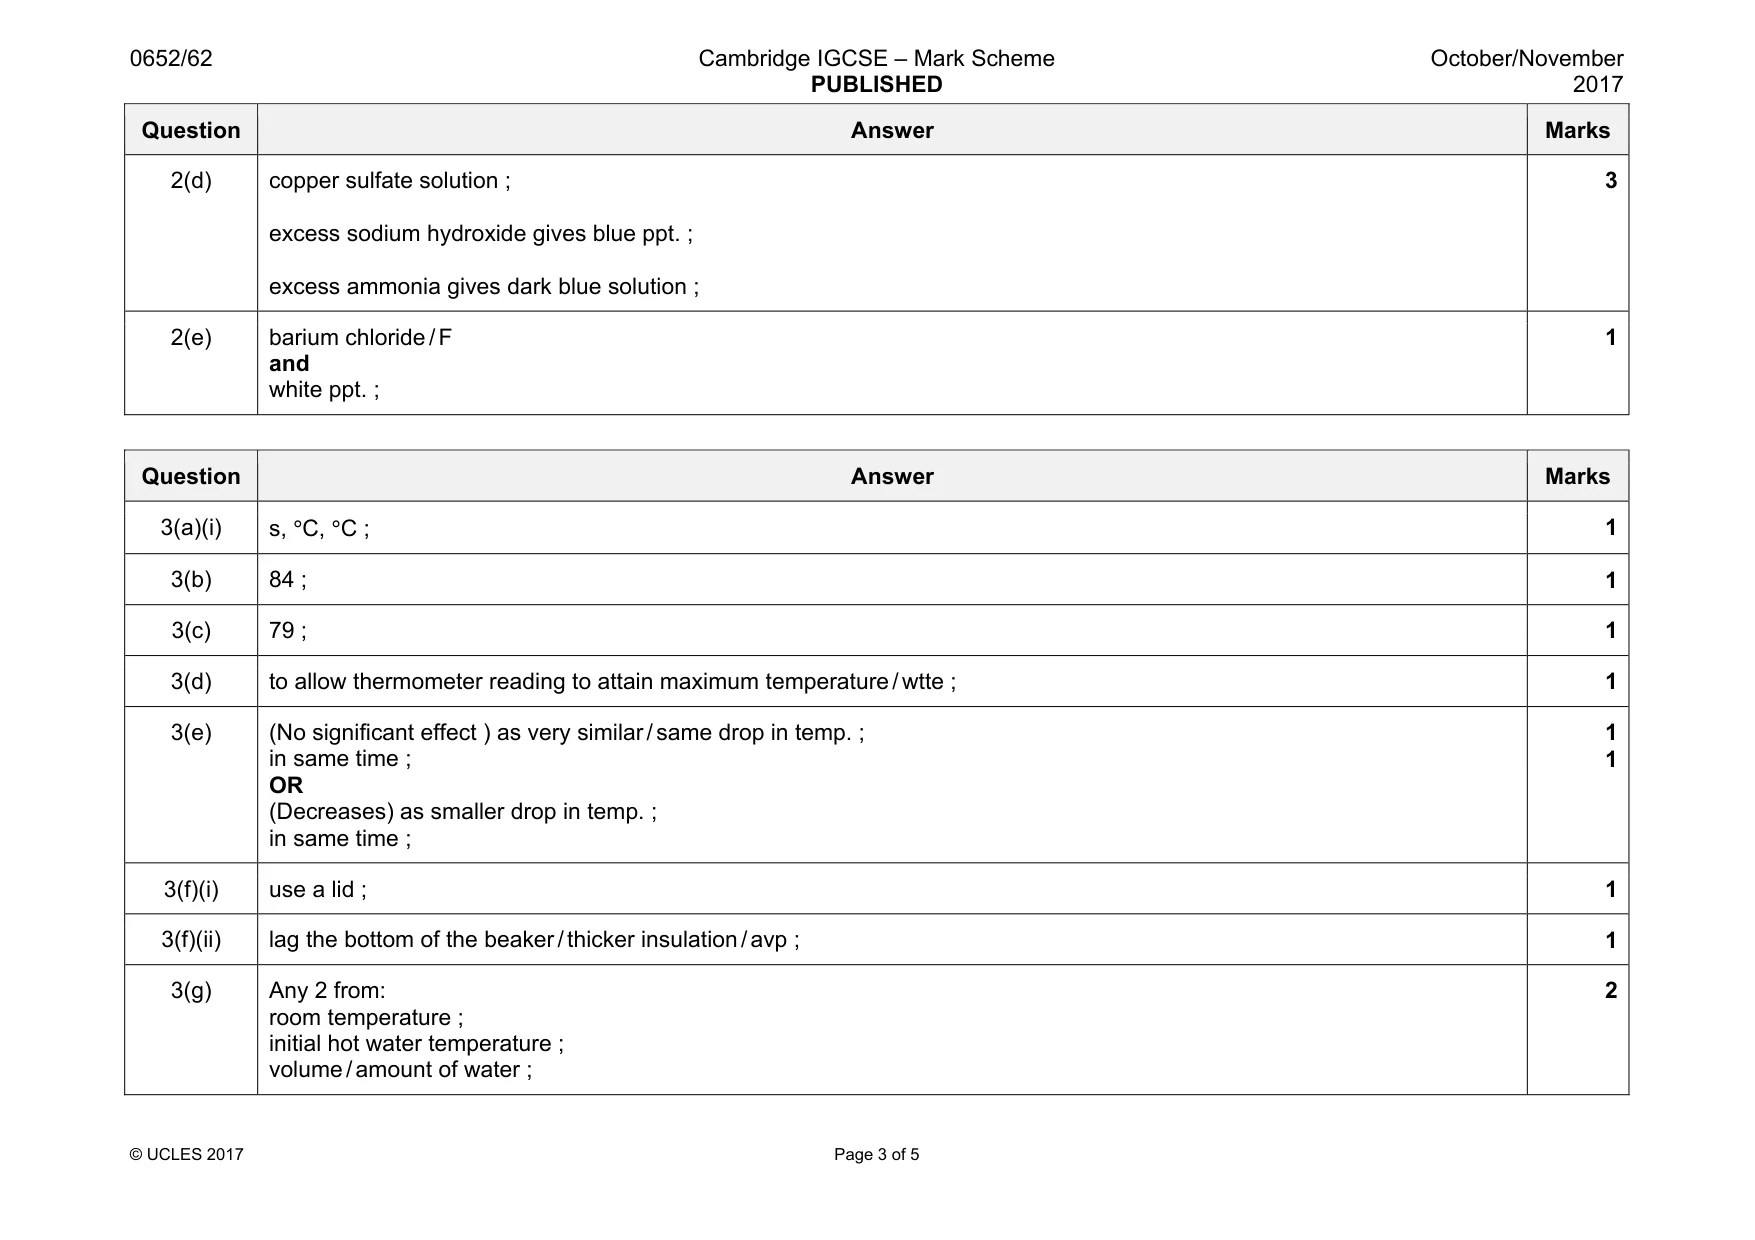
Mark scheme: 2(a) (G is) sulfuric acid ; acid and carbonate gives carbon dioxide ; 2 2(b) (D is) iron(III) nitrate ; (E and H are) sodium hydroxide and ammonia (but order not known) / (E and H are) alkalis / alkaline ; 2 2(c) (F is) barium chloride ; barium chloride gives white ppt. with sulphate / sulfuric acid / acid ; 2 Question Answer Marks 2(d) copper sulfate solution ; excess sodium hydroxide gives blue ppt. ; excess ammonia gives dark blue solution ; 3 2(e) barium chloride / F and white ppt. ; 1
Q3 · A student investigates the cooling of two beakers of hot water, P and Q
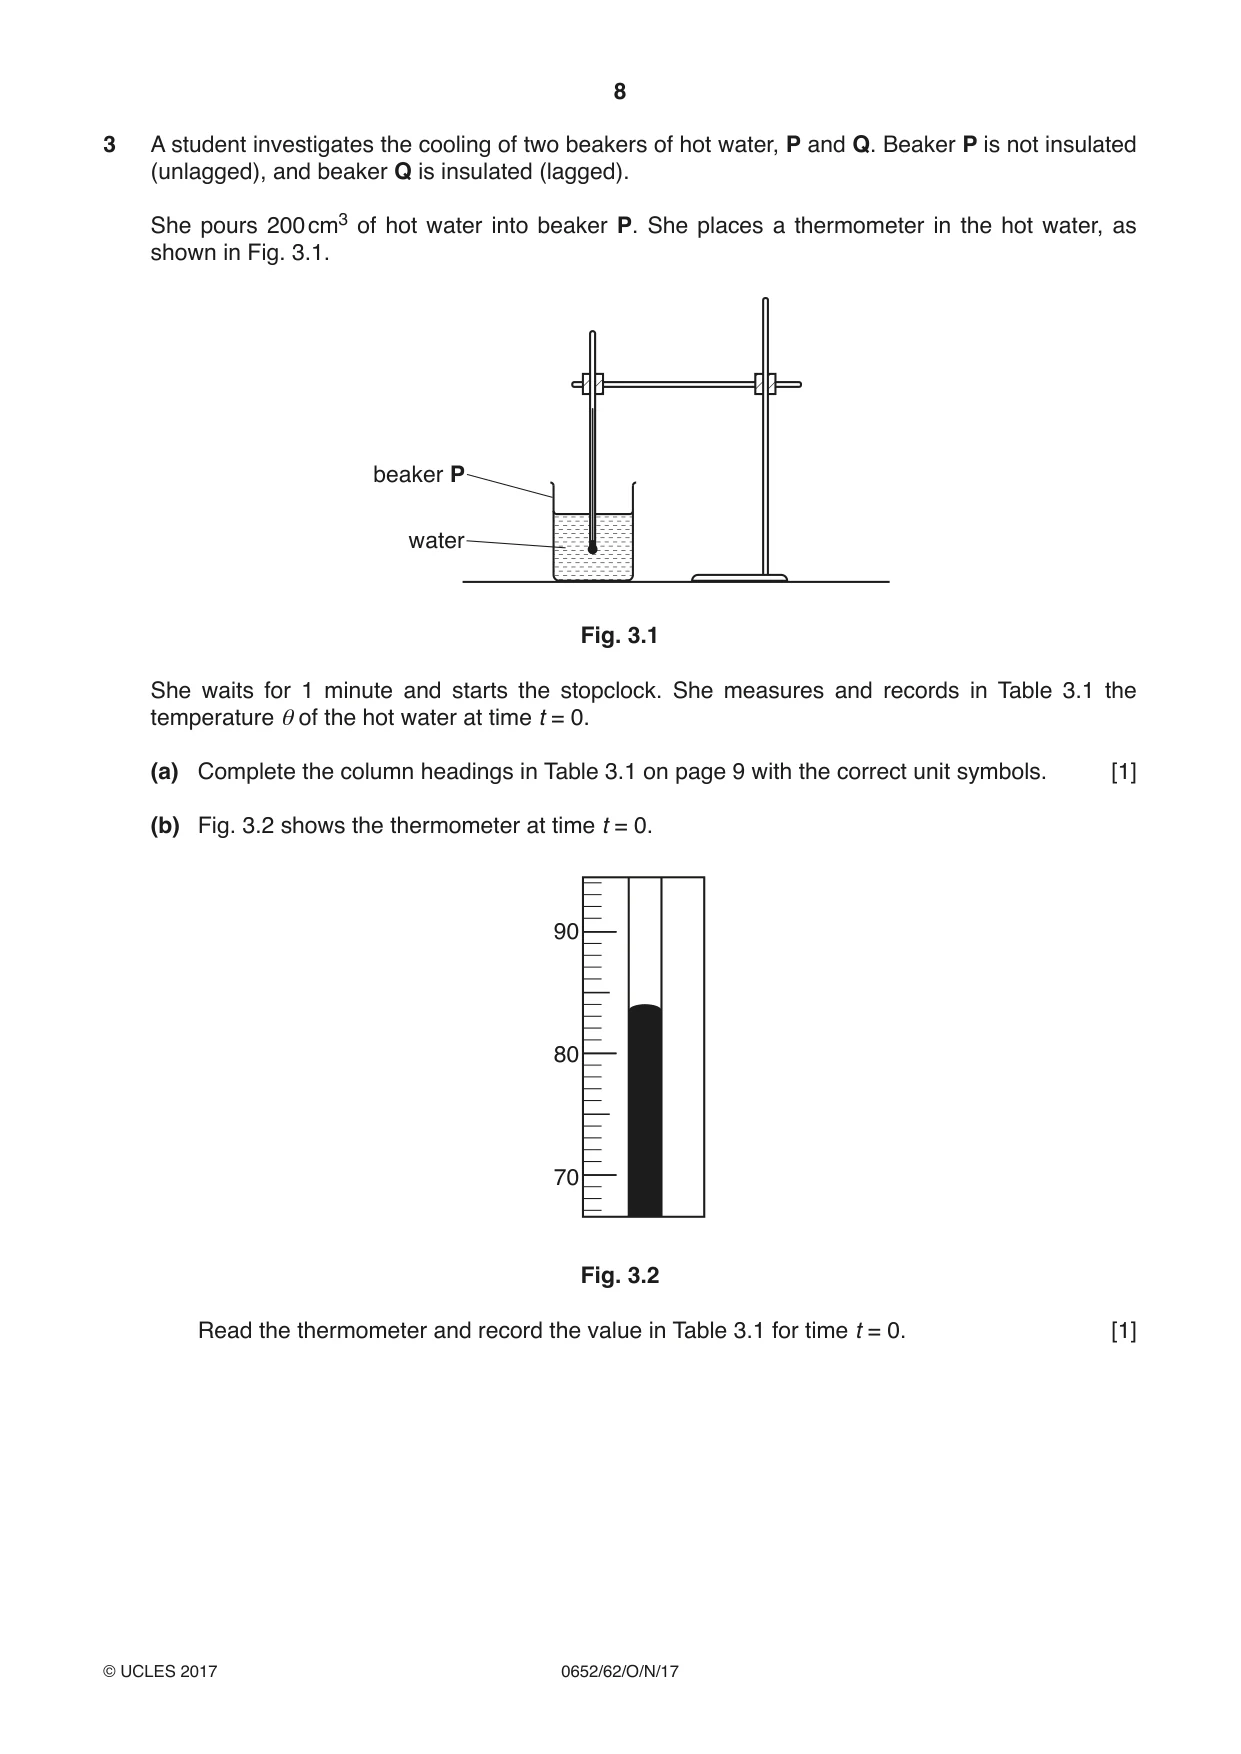
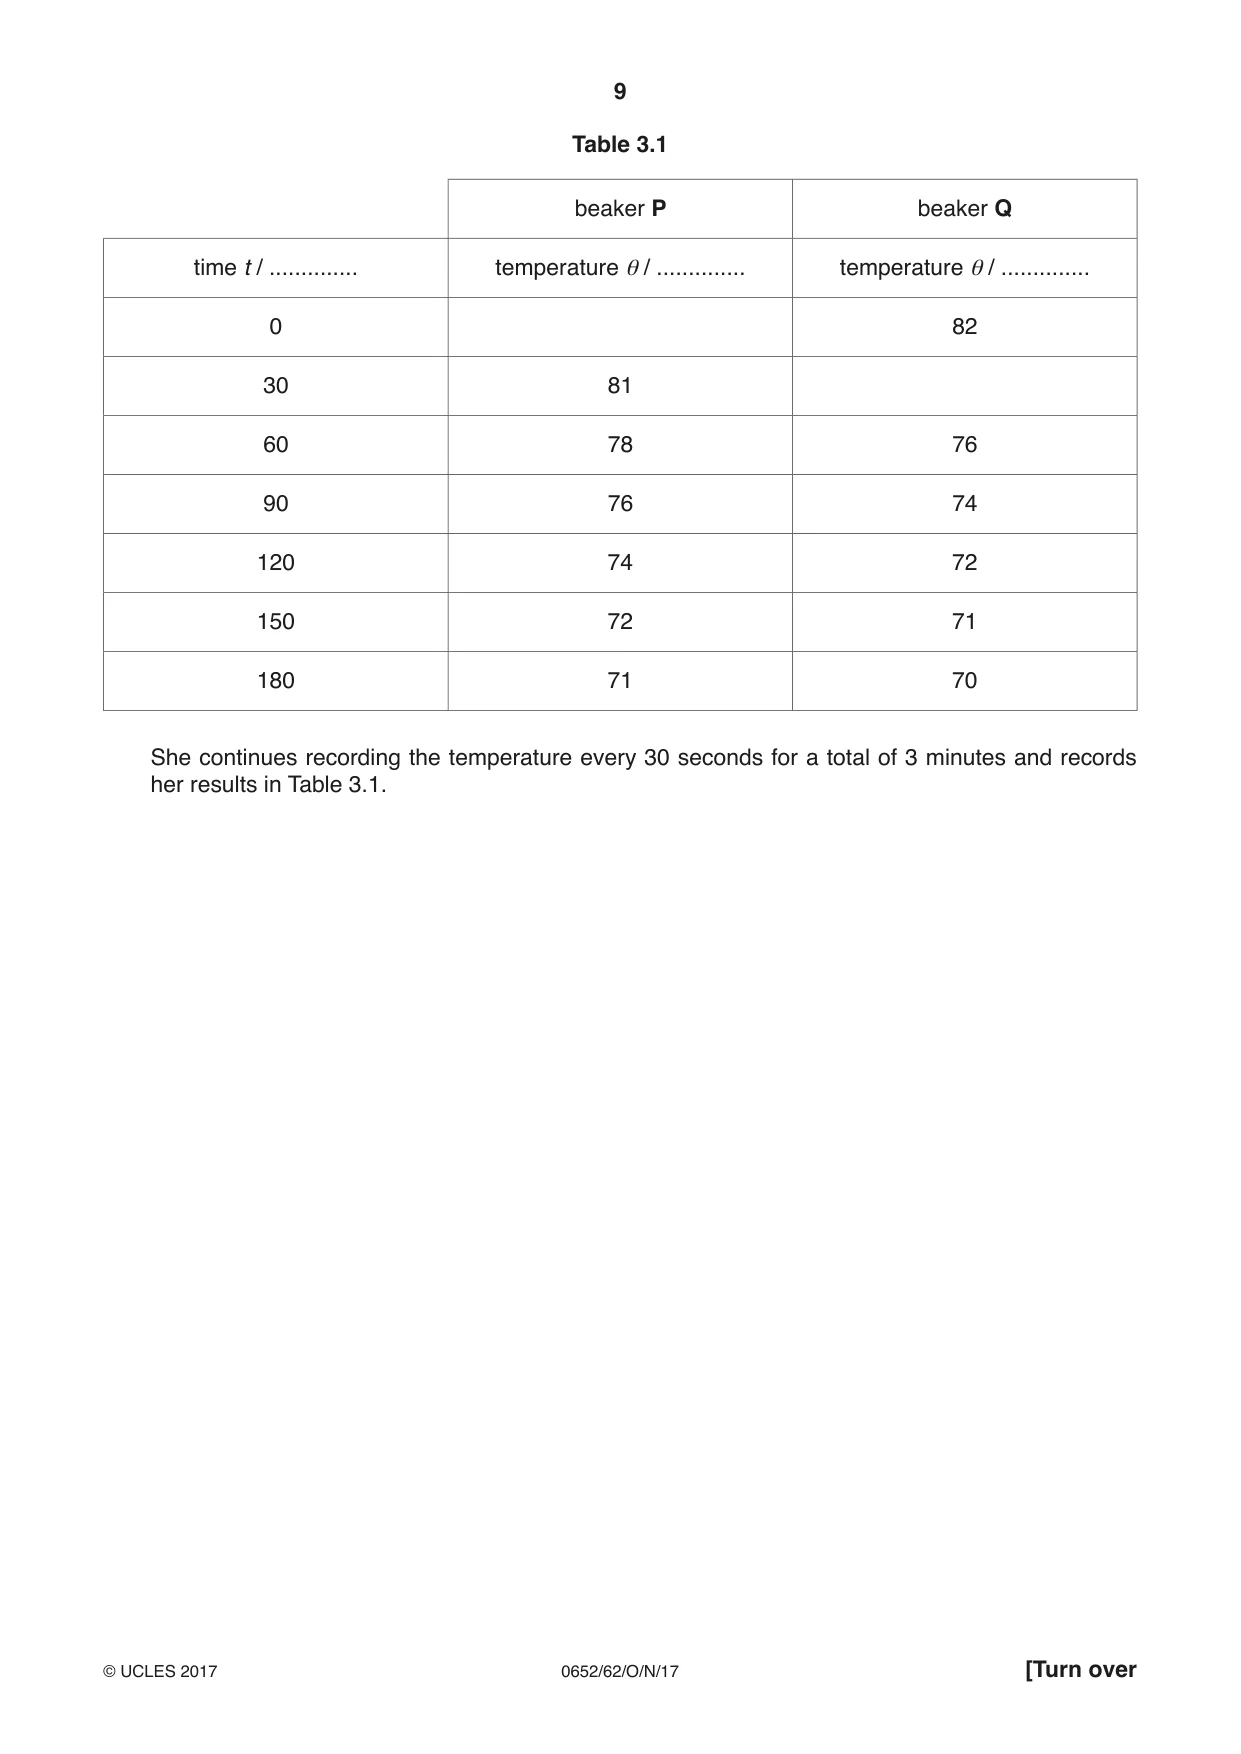
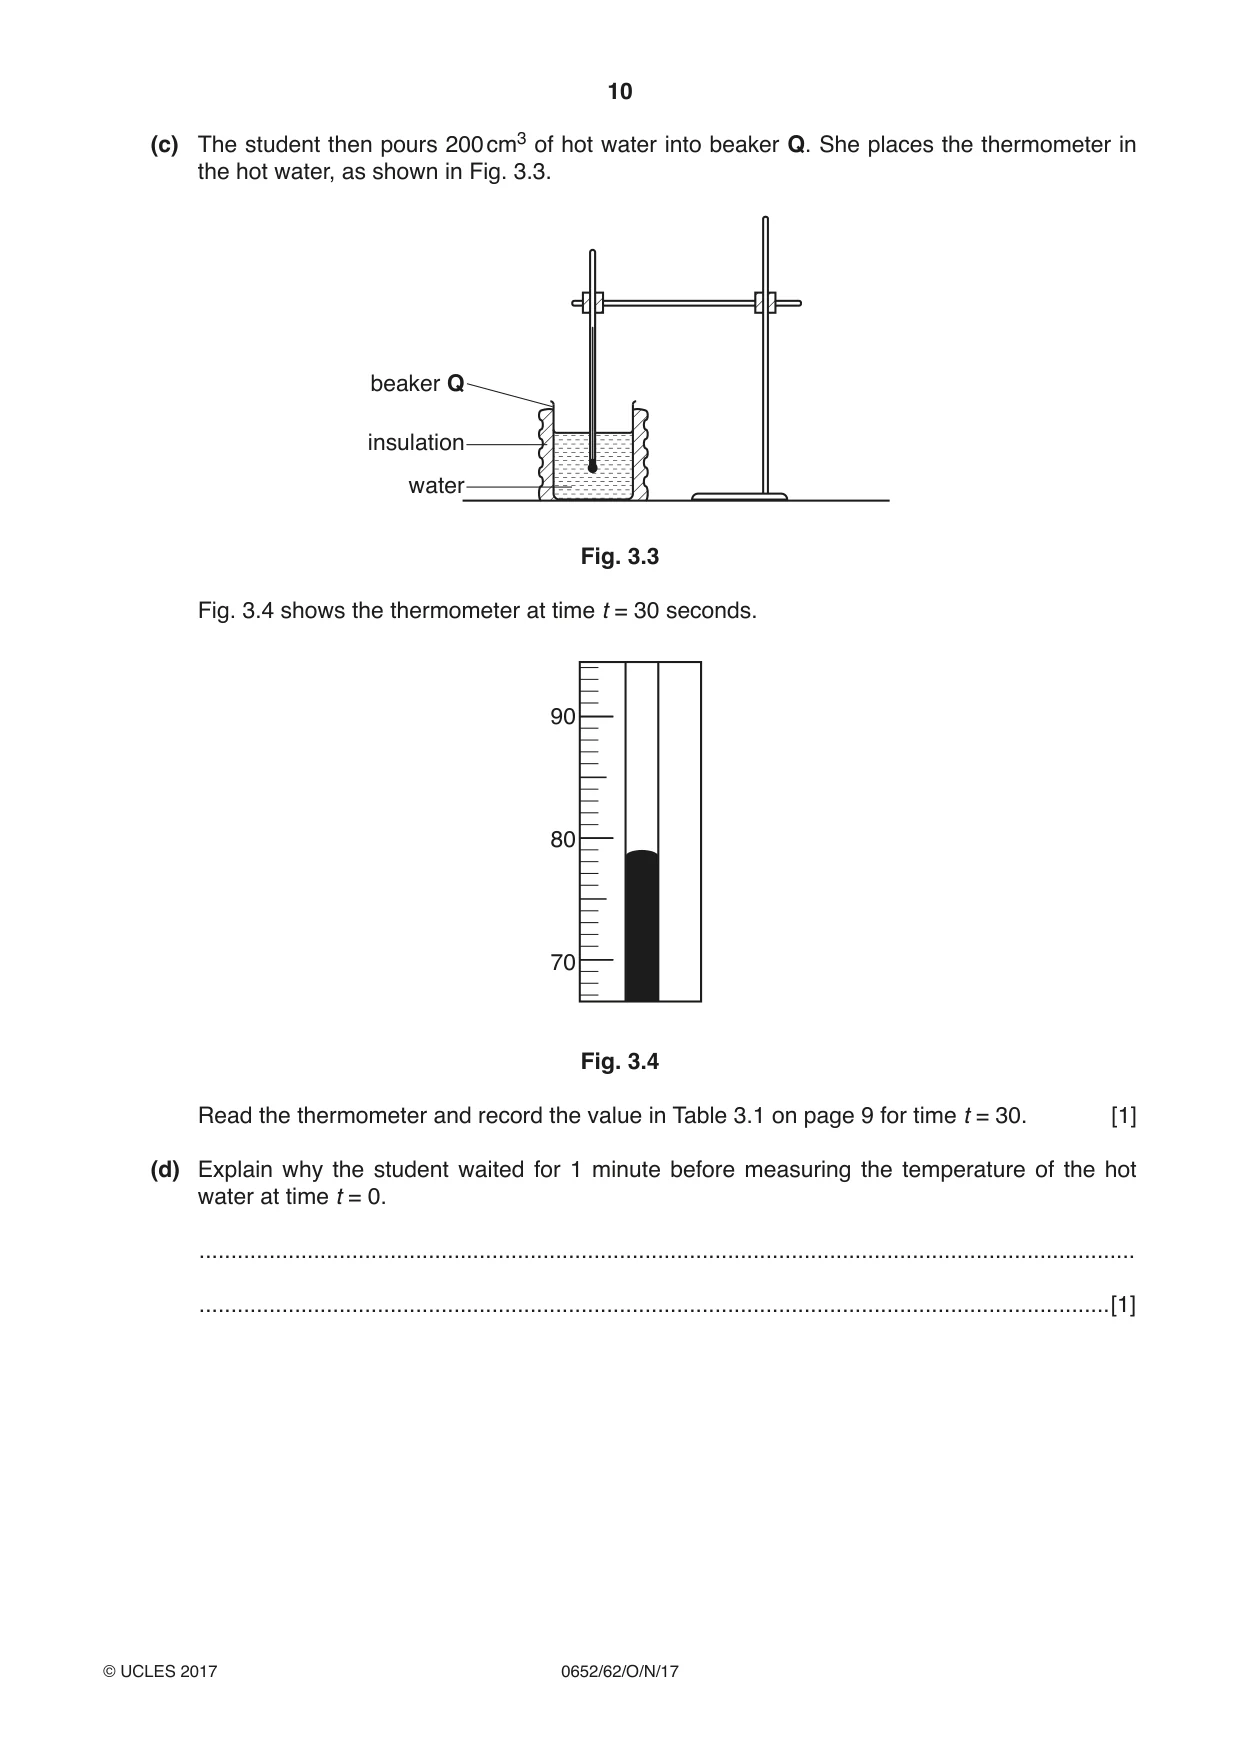
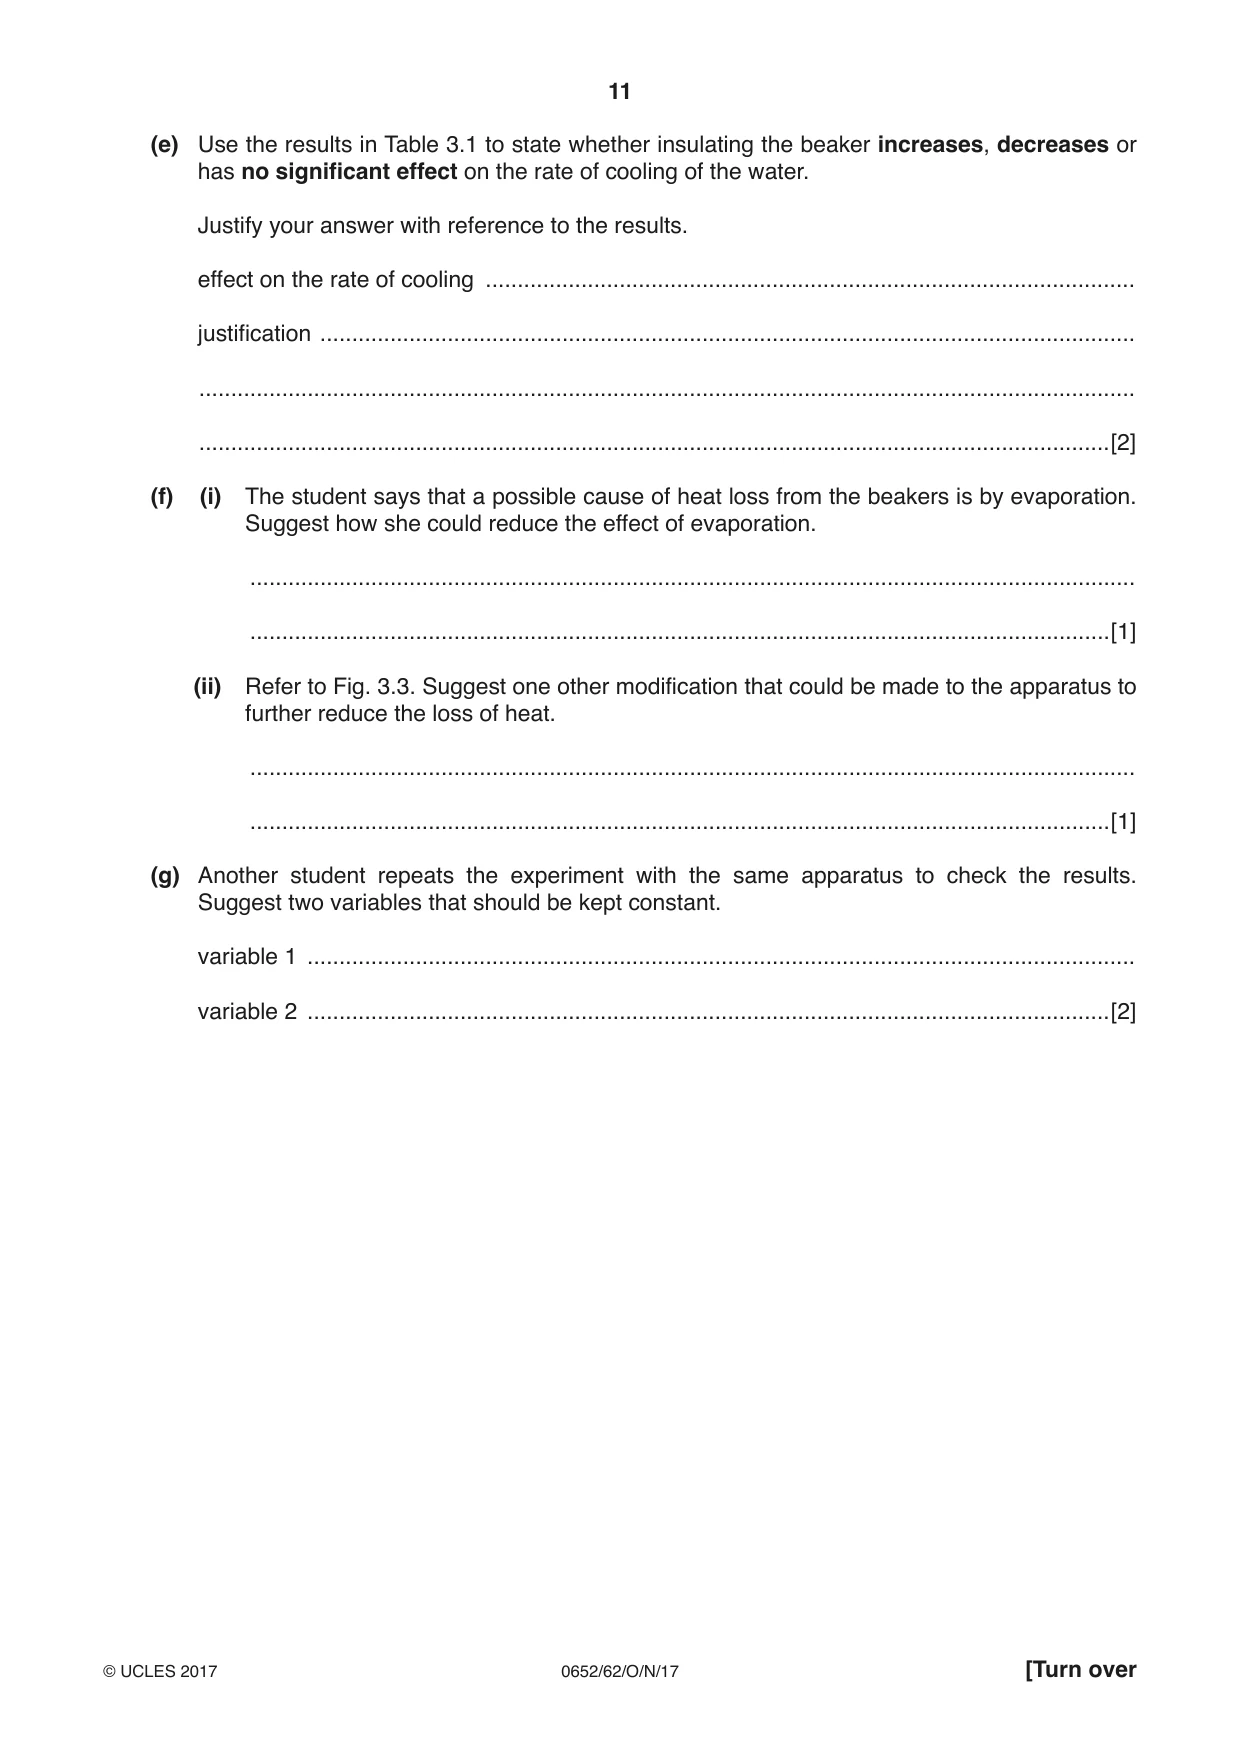
3 A student investigates the cooling of two beakers of hot water, P and Q. Beaker P is not insulated (unlagged), and beaker Q is insulated (lagged). She pours 200 cm3 of hot water into beaker P. She places a thermometer in the hot water, as shown in Fig. 3.1. beaker P water Fig. 3.1 She waits for 1 minute and starts the stopclock. She measures and records in Table 3.1 the temperature θ of the hot water at time t = 0. (a) Complete the column headings in Table 3.1 on page 9 with the correct unit symbols. [1] (b) Fig. 3.2 shows the thermometer at time t = 0. 90 80 70 Fig. 3.2 Read the thermometer and record the value in Table 3.1 for time t = 0. [1] Table 3.1 beaker P beaker Q time t / .............. temperature θ / .............. temperature θ / .............. 0 82 30 81 60 78 76 90 76 74 120 74 72 150 72 71 180 71 70 She continues recording the temperature every 30 seconds for a total of 3 minutes and records her results in Table 3.1. (c) The student then pours 200 cm3 of hot water into beaker Q. She places the thermometer in the hot water, as shown in Fig. 3.3. beaker Q insulation water Fig. 3.3 Fig. 3.4 shows the thermometer at time t = 30 seconds. 90 80 70 Fig. 3.4 Read the thermometer and record the value in Table 3.1 on page 9 for time t = 30. [1] (d) Explain why the student waited for 1 minute before measuring the temperature of the hot water at time t = 0. ................................................................................................................................................... ...............................................................................................................................................[1] (e) Use the results in Table 3.1 to state whether insulating the beaker increases, decreases or has no significant effect on the rate of cooling of the water. Justify your answer with reference to the results. effect on the rate of cooling ...................................................................................................... justification ................................................................................................................................ ................................................................................................................................................... ...............................................................................................................................................[2] (f) (i) The student says that a possible cause of heat loss from the beakers is by evaporation. Suggest how she could reduce the effect of evaporation. ........................................................................................................................................... .......................................................................................................................................[1] (ii) Refer to Fig. 3.3. Suggest one other modification that could be made to the apparatus to further reduce the loss of heat. ........................................................................................................................................... .......................................................................................................................................[1] (g) Another student repeats the experiment with the same apparatus to check the results. Suggest two variables that should be kept constant. variable 1 .................................................................................................................................. variable 2 ..............................................................................................................................[2]
Mark scheme: 3(a)(i) 1 3(b) 84 ; 1 3(c) 79 ; 1 3(d) to allow thermometer reading to attain maximum temperature / wtte ; 1 3(e) (No significant effect ) as very similar / same drop in temp. ; in same time ; OR (Decreases) as smaller drop in temp. ; in same time ; 1 1 3(f)(i) use a lid ; 1 3(f)(ii) lag the bottom of the beaker / thicker insulation / avp ; 1 3(g) Any 2 from: room temperature ; initial hot water temperature ; volume / amount of water ; 2
Q4 · A student investigates the relationship between the object distance u and the related…
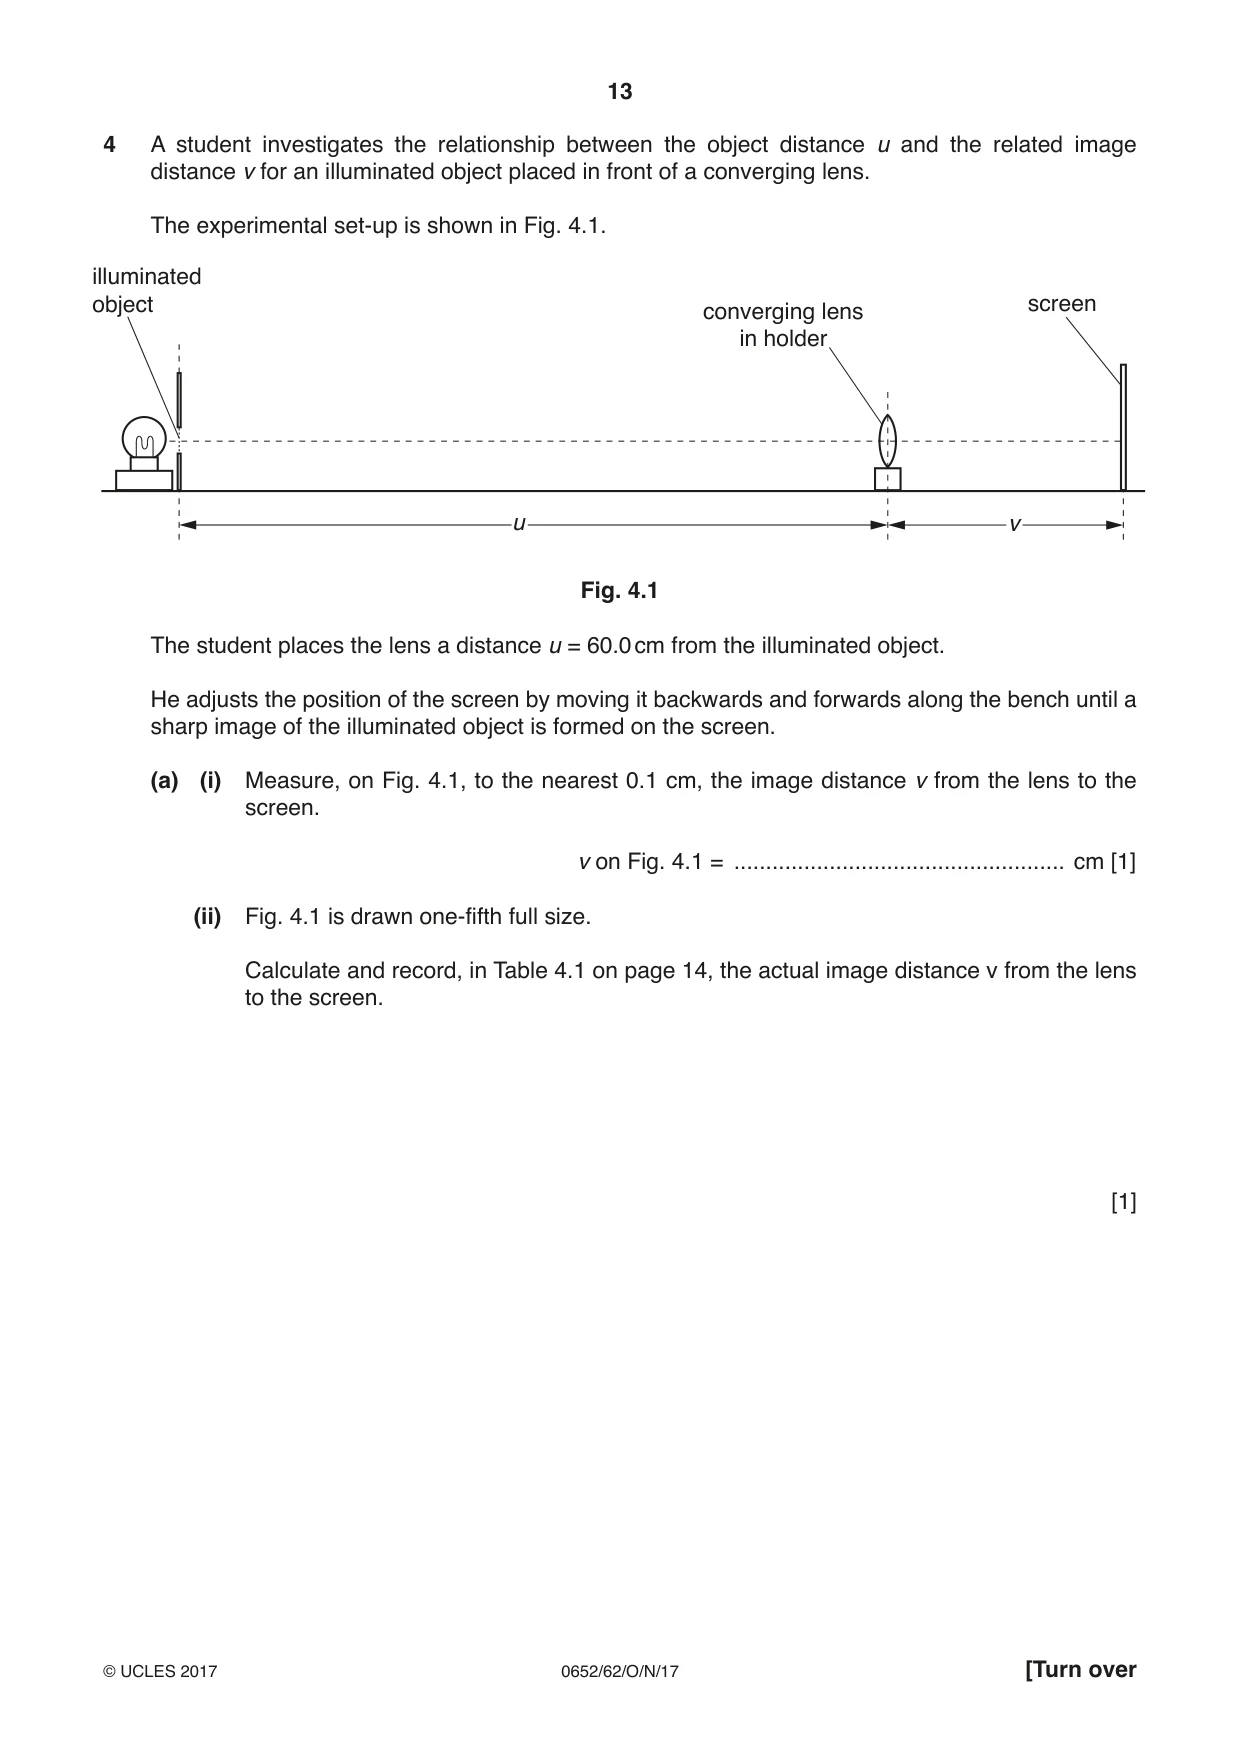
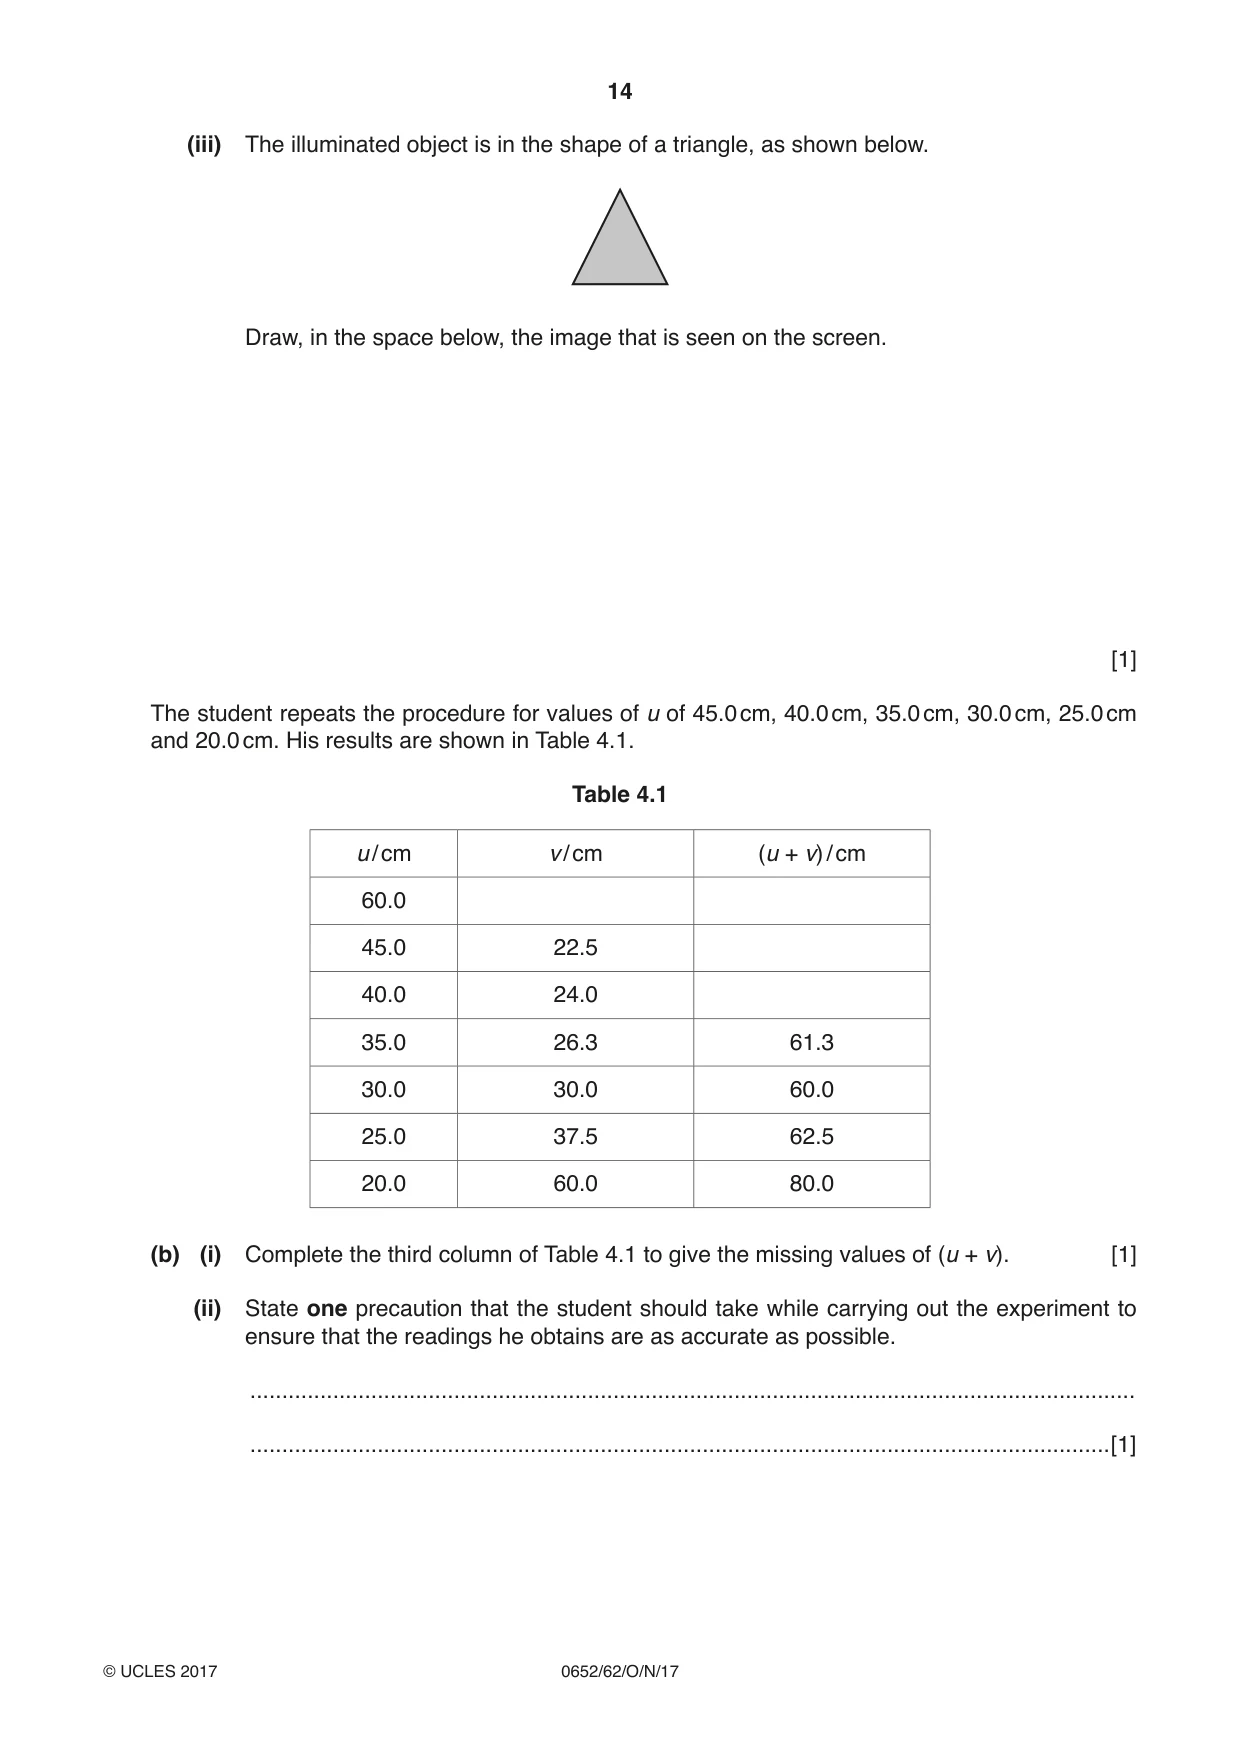
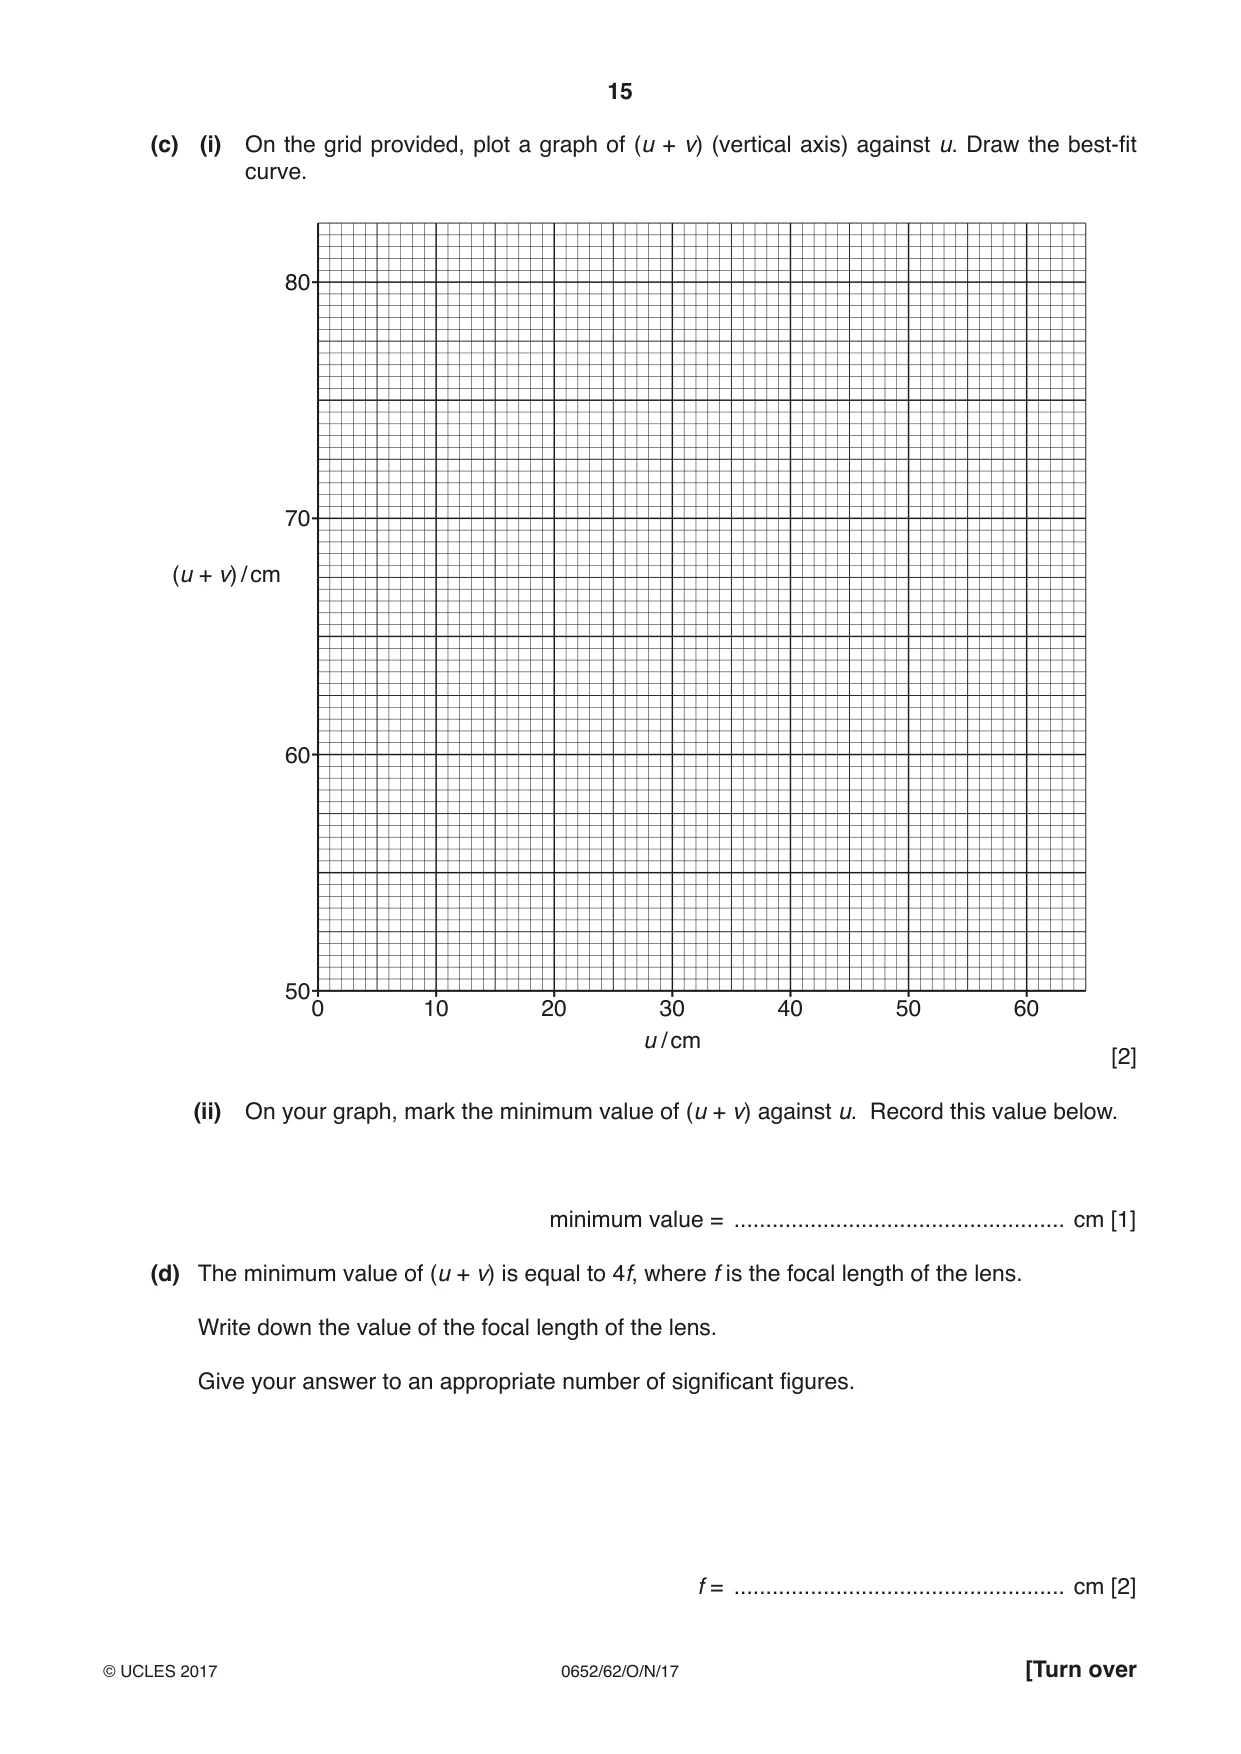
4 A student investigates the relationship between the object distance u and the related image distance v for an illuminated object placed in front of a converging lens. The experimental set-up is shown in Fig. 4.1. illuminated object screen converging lens in holder u v Fig. 4.1 The student places the lens a distance u = 60.0 cm from the illuminated object. He adjusts the position of the screen by moving it backwards and forwards along the bench until a sharp image of the illuminated object is formed on the screen. (a) (i) Measure, on Fig. 4.1, to the nearest 0.1 cm, the image distance v from the lens to the screen. v on Fig. 4.1 = .................................................... cm [1] (ii) Fig. 4.1 is drawn one-fifth full size. Calculate and record, in Table 4.1 on page 14, the actual image distance v from the lens to the screen. [1] (iii) The illuminated object is in the shape of a triangle, as shown below. Draw, in the space below, the image that is seen on the screen. [1] The student repeats the procedure for values of u of 45.0 cm, 40.0 cm, 35.0 cm, 30.0 cm, 25.0 cm and 20.0 cm. His results are shown in Table 4.1. Table 4.1 u / cm v / cm (u + v) / cm 60.0 45.0 22.5 40.0 24.0 35.0 26.3 61.3 30.0 30.0 60.0 25.0 37.5 62.5 20.0 60.0 80.0 (b) (i) Complete the third column of Table 4.1 to give the missing values of (u + v). [1] (ii) State one precaution that the student should take while carrying out the experiment to ensure that the readings he obtains are as accurate as possible. ........................................................................................................................................... .......................................................................................................................................[1] (c) (i) On the grid provided, plot a graph of (u + v) (vertical axis) against u. Draw the best-fit curve. 80 70 (u + v) / cm 60 50 0 10 20 30 40 50 60 u / cm [2] (ii) On your graph, mark the minimum value of (u + v) against u. Record this value below. minimum value = .................................................... cm [1] (d) The minimum value of (u + v) is equal to 4f, where f is the focal length of the lens. Write down the value of the focal length of the lens. Give your answer to an appropriate number of significant figures. f = .................................................... cm [2]
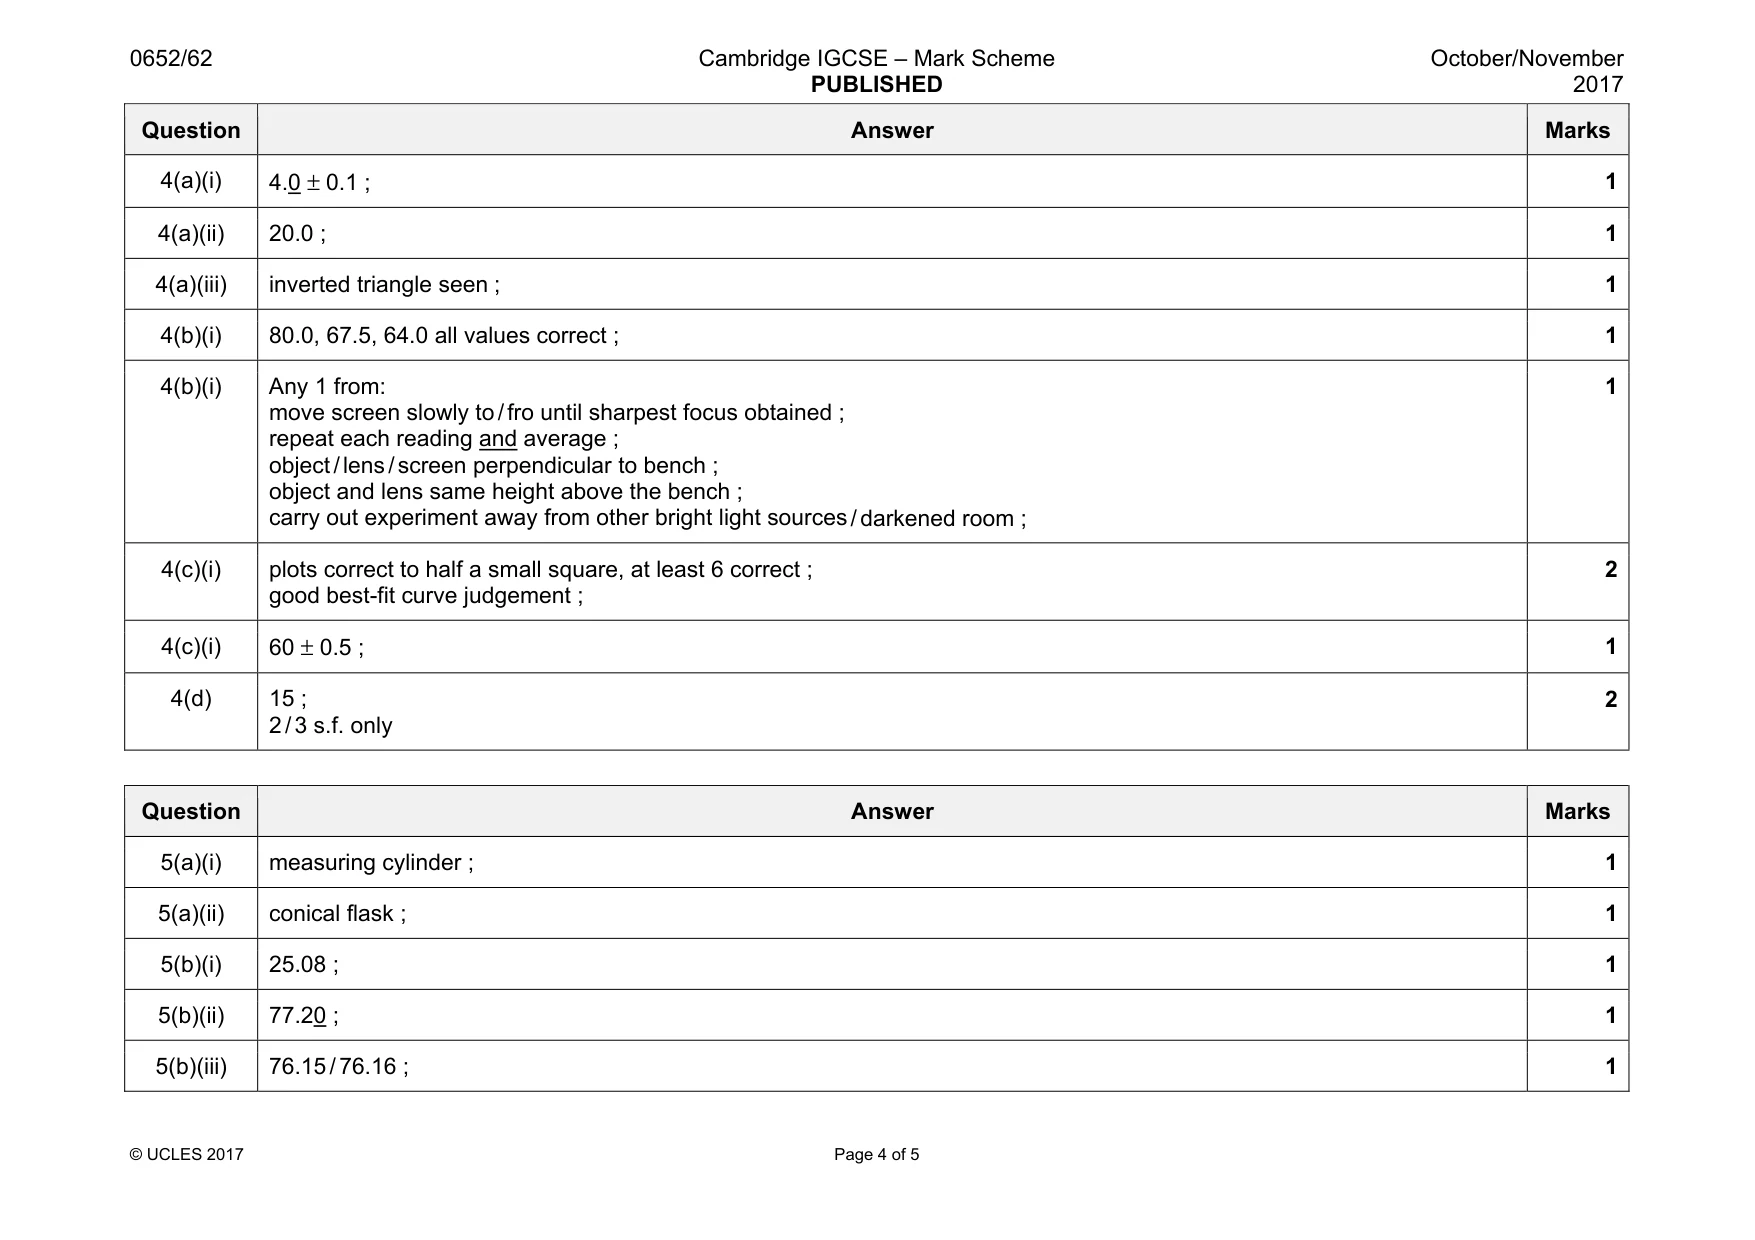
Mark scheme: 4(a)(i) 1 4(a)(ii) 20.0 ; 1 4(a)(iii) inverted triangle seen ; 1 4(b)(i) 80.0, 67.5, 64.0 all values correct ; 1 4(b)(i) Any 1 from: move screen slowly to / fro until sharpest focus obtained ; repeat each reading and average ; object / lens / screen perpendicular to bench ; object and lens same height above the bench ; carry out experiment away from other bright light sources / darkened room ; 1 4(c)(i) plots correct to half a small square, at least 6 correct ; good best-fit curve judgement ; 2 4(c)(i) 60 ± 0.5 ; 1 4(d) 15 ; 2 / 3 s.f. only 2
Q5 · A student investigates the effect of concentration on the rate of the reaction between…
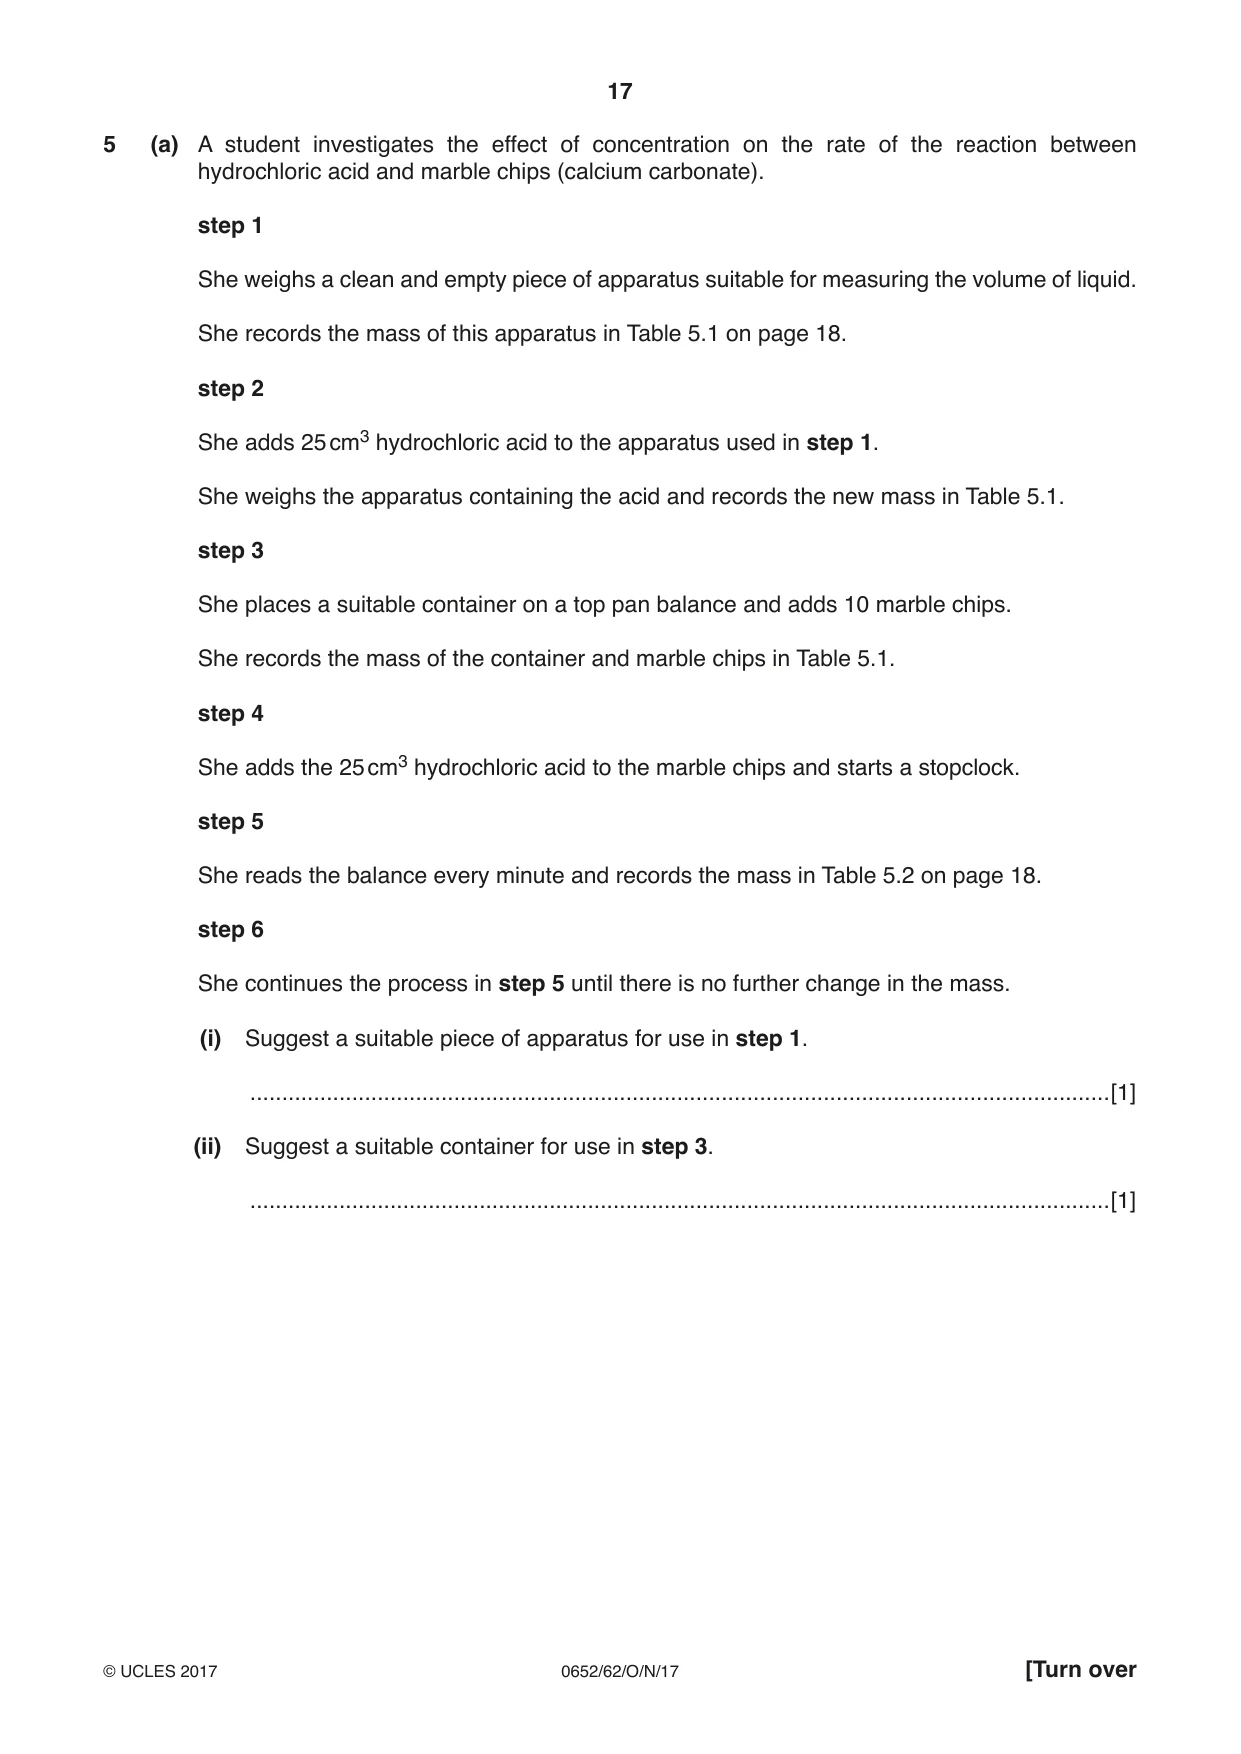
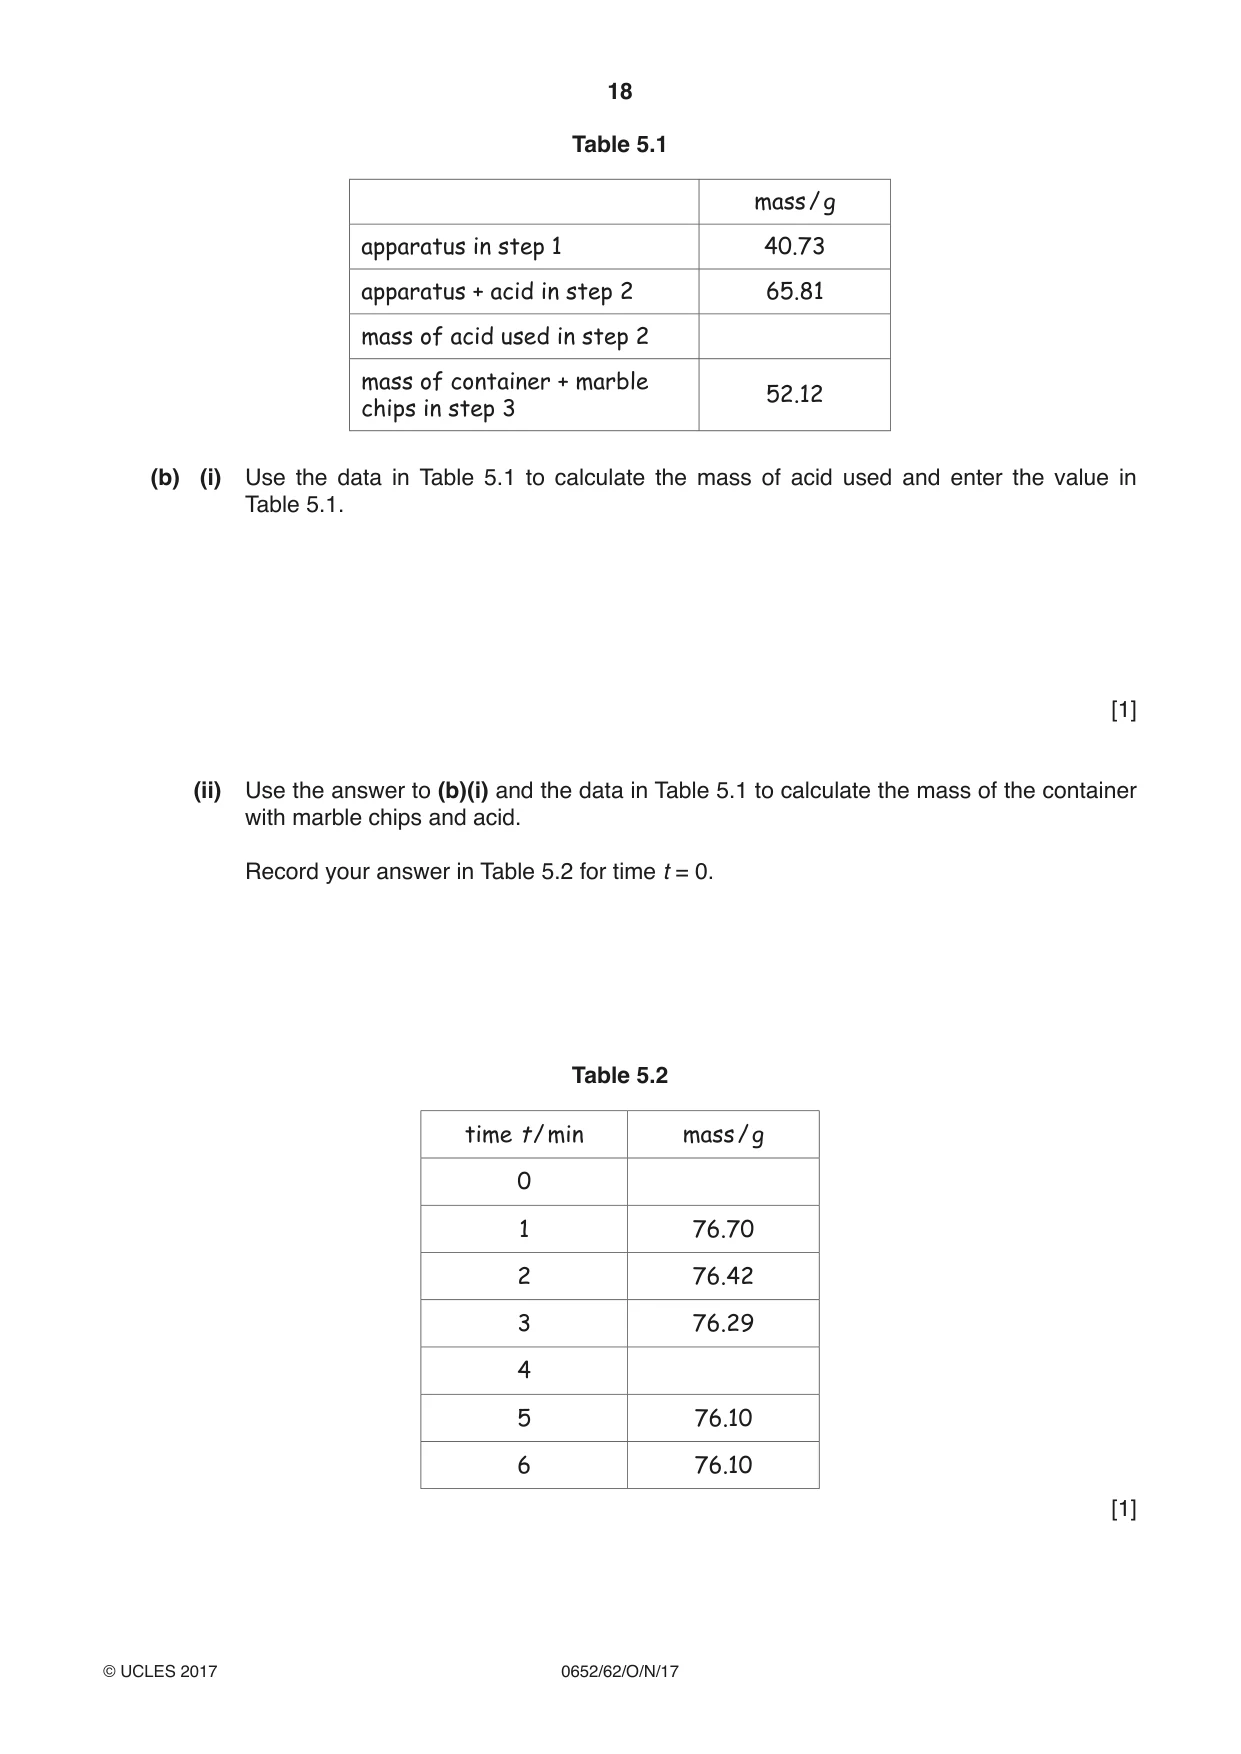
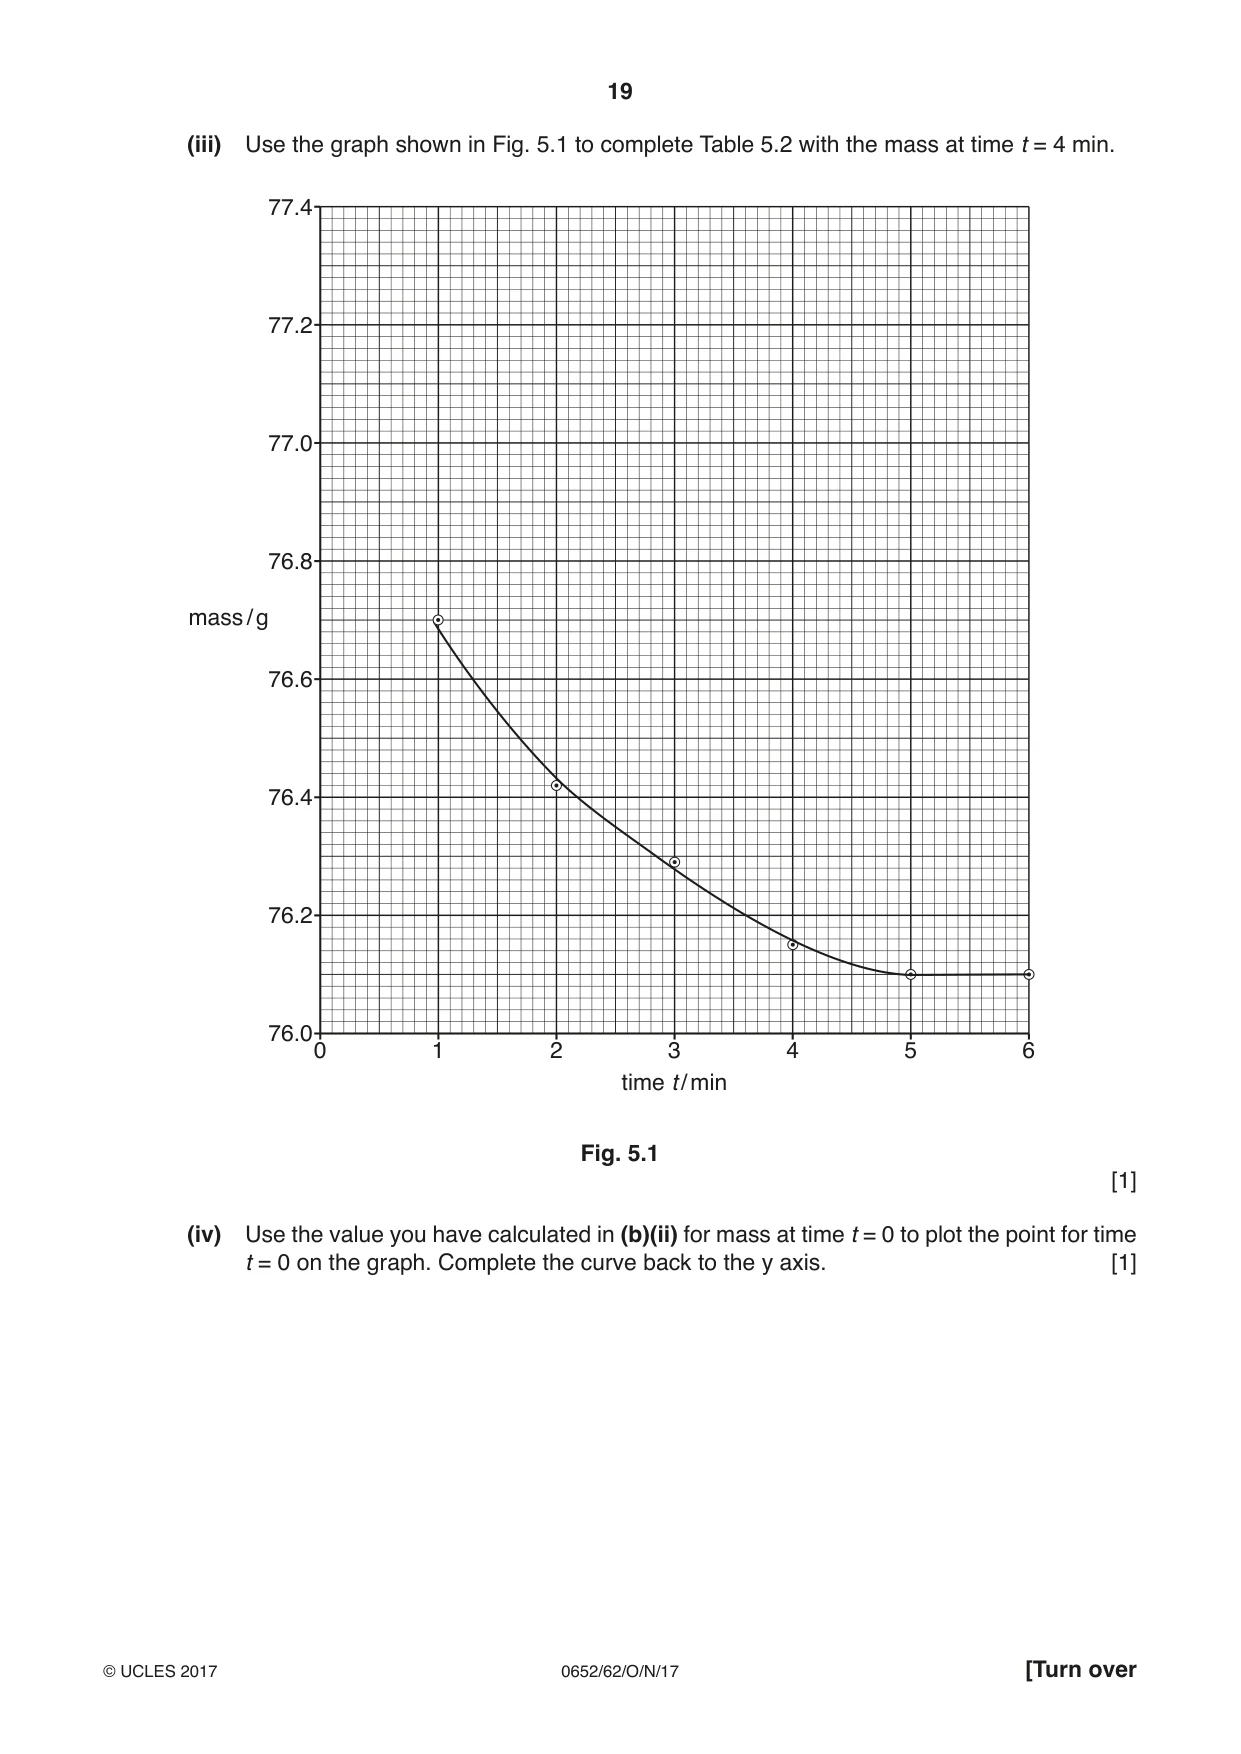
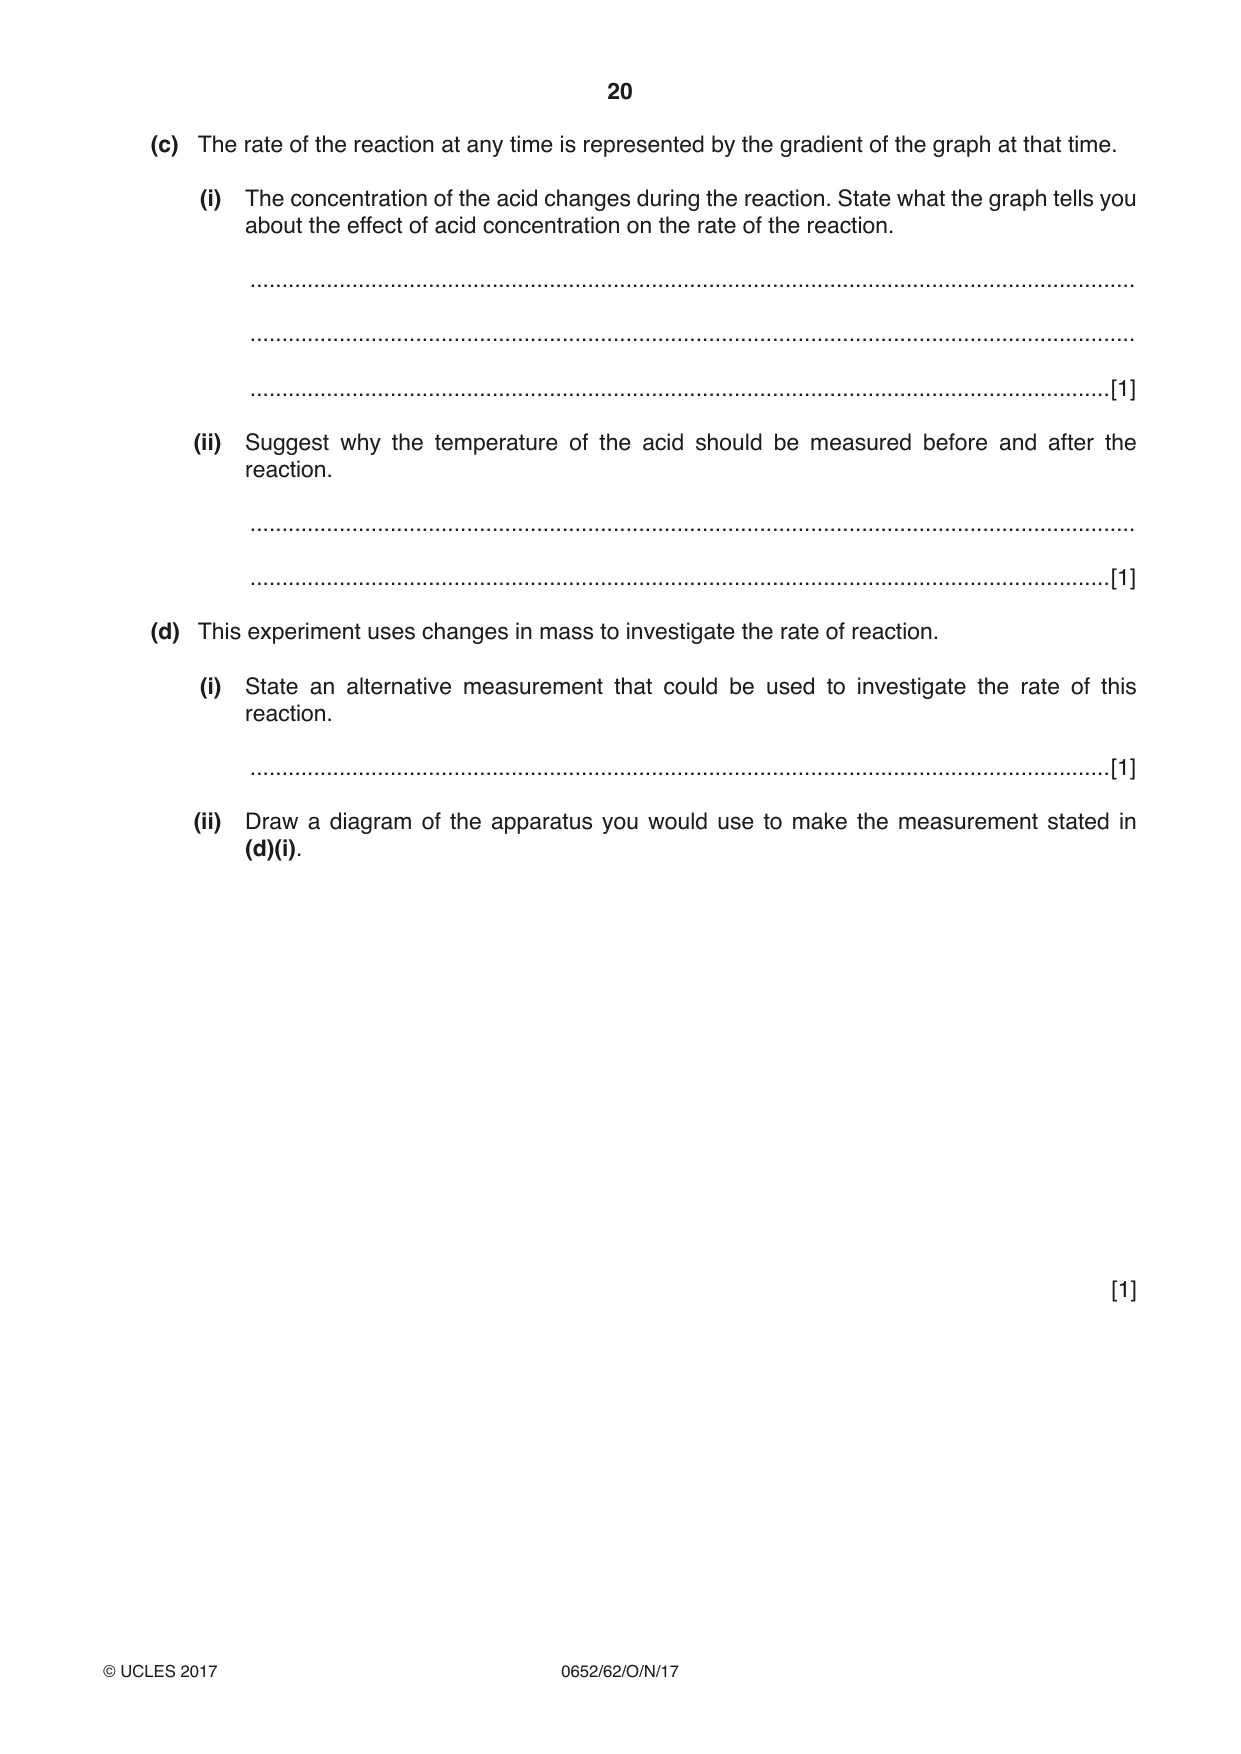
5 (a) A student investigates the effect of concentration on the rate of the reaction between hydrochloric acid and marble chips (calcium carbonate). step 1 She weighs a clean and empty piece of apparatus suitable for measuring the volume of liquid. She records the mass of this apparatus in Table 5.1 on page 18. step 2 She adds 25 cm3 hydrochloric acid to the apparatus used in step 1. She weighs the apparatus containing the acid and records the new mass in Table 5.1. step 3 She places a suitable container on a top pan balance and adds 10 marble chips. She records the mass of the container and marble chips in Table 5.1. step 4 She adds the 25 cm3 hydrochloric acid to the marble chips and starts a stopclock. step 5 She reads the balance every minute and records the mass in Table 5.2 on page 18. step 6 She continues the process in step 5 until there is no further change in the mass. (i) Suggest a suitable piece of apparatus for use in step 1. .......................................................................................................................................[1] (ii) Suggest a suitable container for use in step 3. .......................................................................................................................................[1] Table 5.1 mass / g apparatus in step 1 40.73 apparatus + acid in step 2 65.81 mass of acid used in step 2 mass of container + marble 52.12 chips in step 3 (b) (i) Use the data in Table 5.1 to calculate the mass of acid used and enter the value in Table 5.1. [1] (ii) Use the answer to (b)(i) and the data in Table 5.1 to calculate the mass of the container with marble chips and acid. Record your answer in Table 5.2 for time t = 0. Table 5.2 time t/ min mass / g 0 1 76.70 2 76.42 3 76.29 4 5 76.10 6 76.10 [1] (iii) Use the graph shown in Fig. 5.1 to complete Table 5.2 with the mass at time t = 4 min. 77.4 77.2 77.0 76.8 mass / g 76.6 76.4 76.2 76.0 0 1 2 3 4 5 6 time t / min Fig. 5.1 [1] (iv) Use the value you have calculated in (b)(ii) for mass at time t = 0 to plot the point for time t = 0 on the graph. Complete the curve back to the y axis. [1] (c) The rate of the reaction at any time is represented by the gradient of the graph at that time. (i) The concentration of the acid changes during the reaction. State what the graph tells you about the effect of acid concentration on the rate of the reaction. ........................................................................................................................................... ........................................................................................................................................... .......................................................................................................................................[1] (ii) Suggest why the temperature of the acid should be measured before and after the reaction. ........................................................................................................................................... .......................................................................................................................................[1] (d) This experiment uses changes in mass to investigate the rate of reaction. (i) State an alternative measurement that could be used to investigate the rate of this reaction. .......................................................................................................................................[1] (ii) Draw a diagram of the apparatus you would use to make the measurement stated in (d)(i). [1]
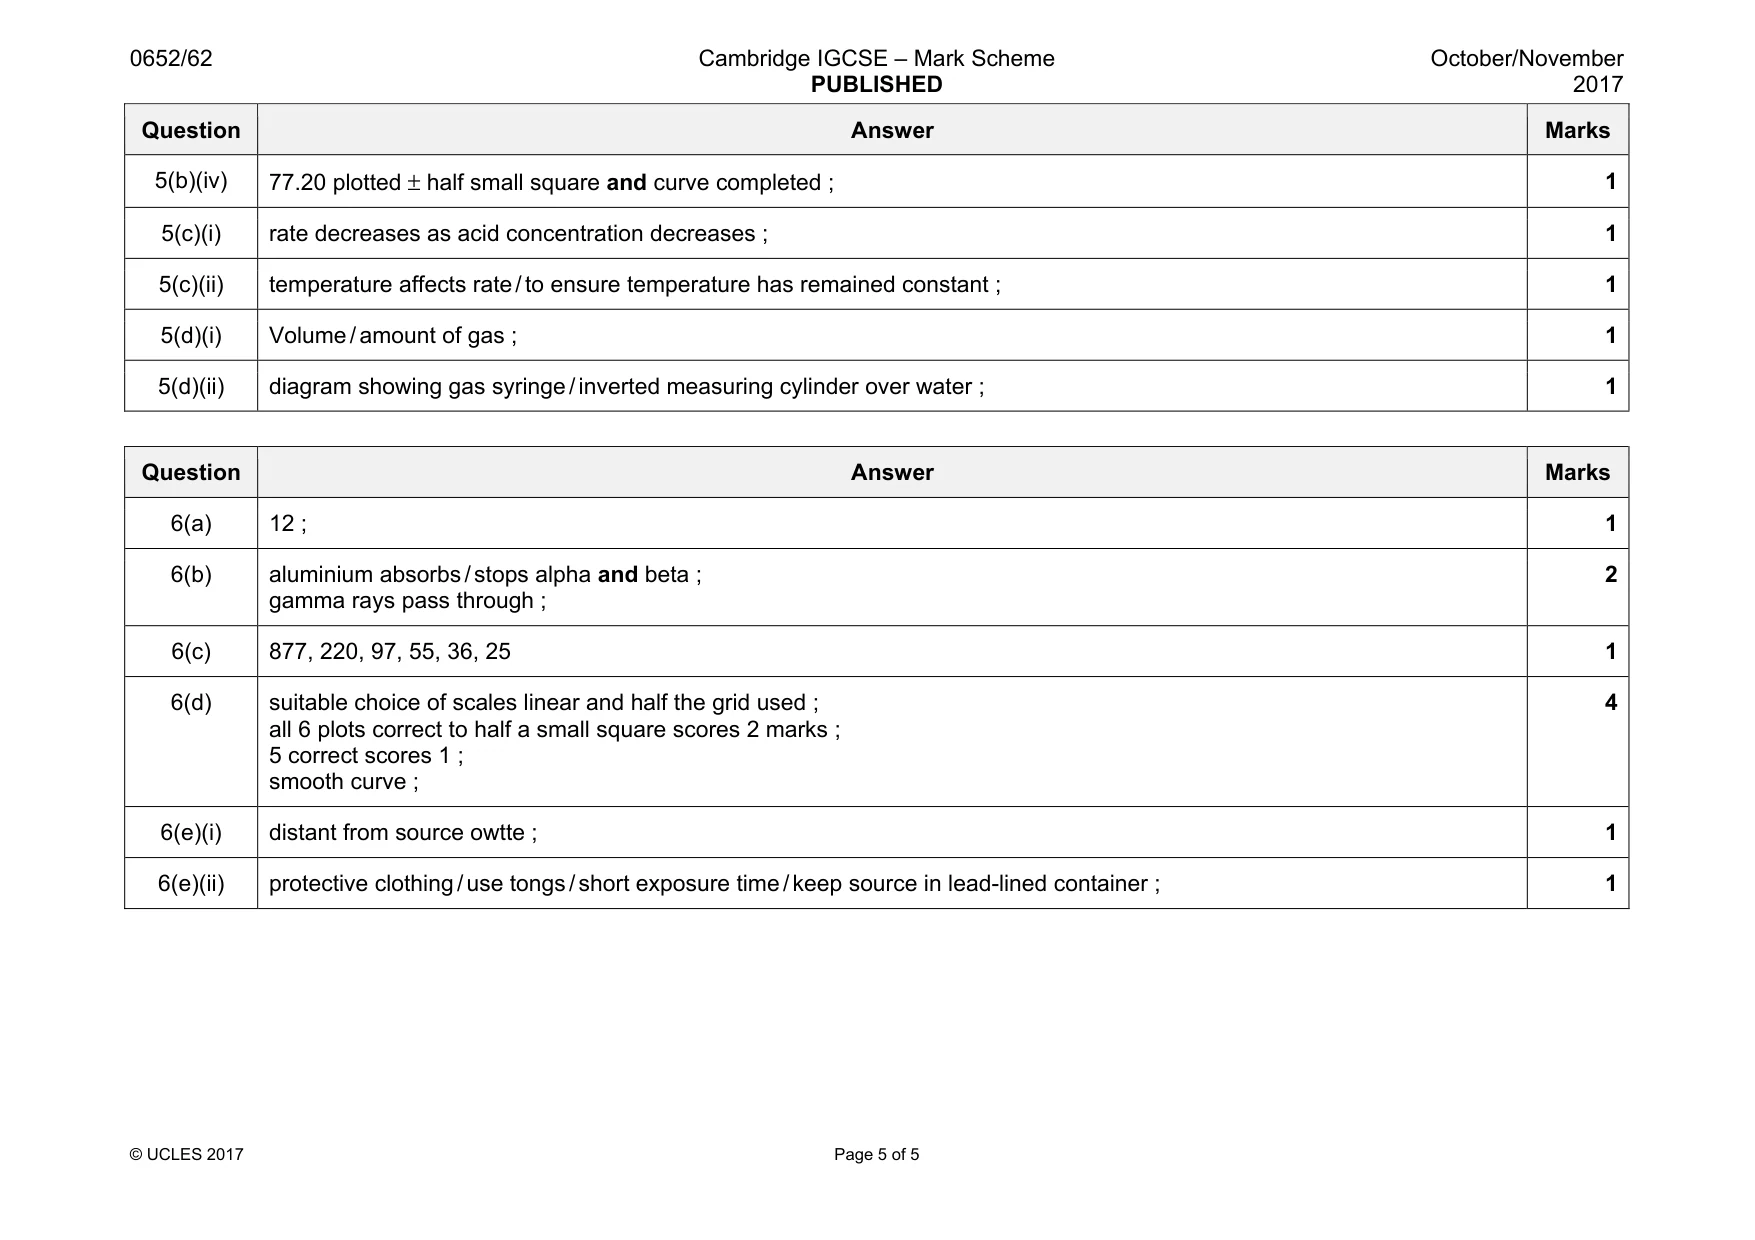
Mark scheme: 5(a)(i) measuring cylinder ; 1 5(a)(ii) conical flask ; 1 5(b)(i) 25.08 ; 1 5(b)(ii) 77.20 ; 1 5(b)(iii) 76.15 / 76.16 ; 1 Question Answer Marks 5(b)(iv) 77.20 plotted ± half small square and curve completed ; 1 5(c)(i) rate decreases as acid concentration decreases ; 1 5(c)(ii) temperature affects rate / to ensure temperature has remained constant ; 1 5(d)(i) Volume / amount of gas ; 1 5(d)(ii) diagram showing gas syringe / inverted measuring cylinder over water ; 1
Q6 · A teacher demonstrates to a class how the gamma radiation emitted by a radioactive source…
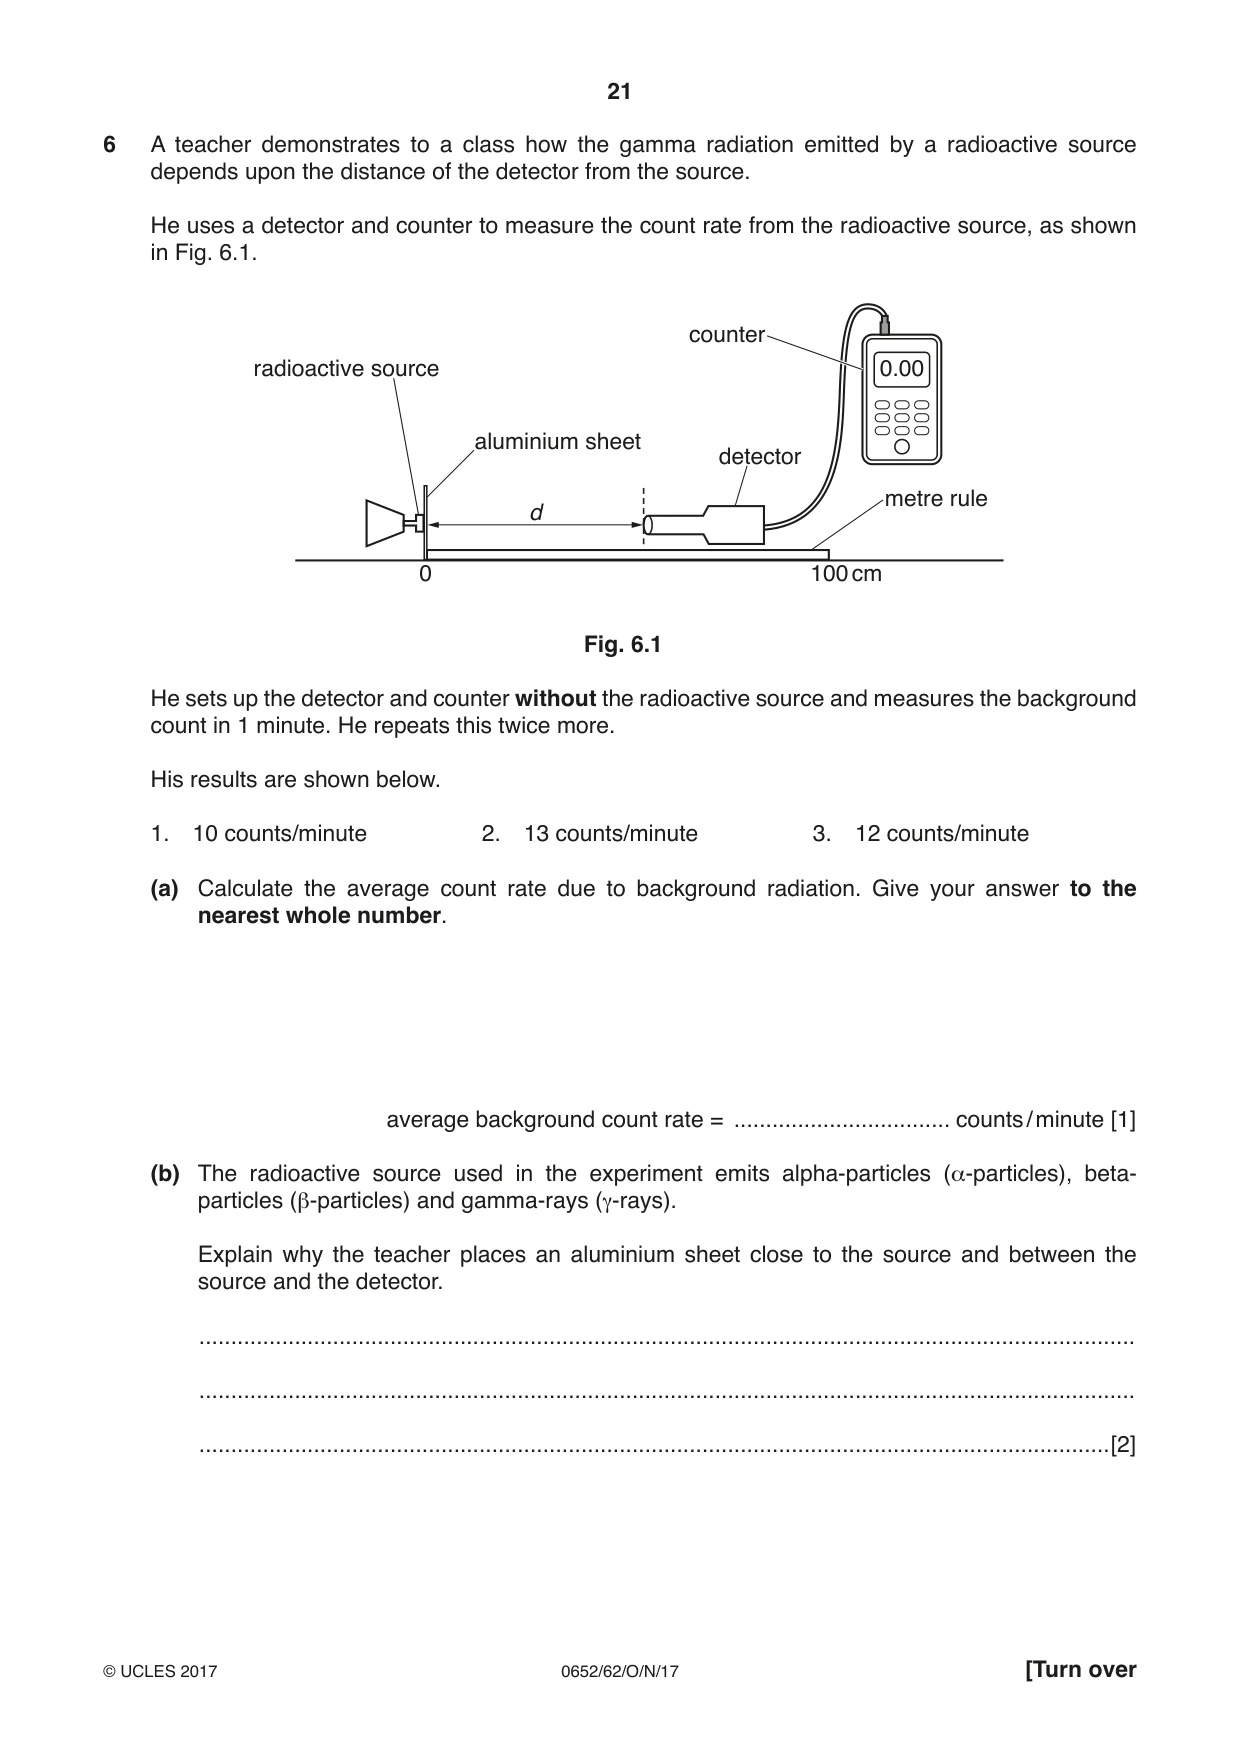
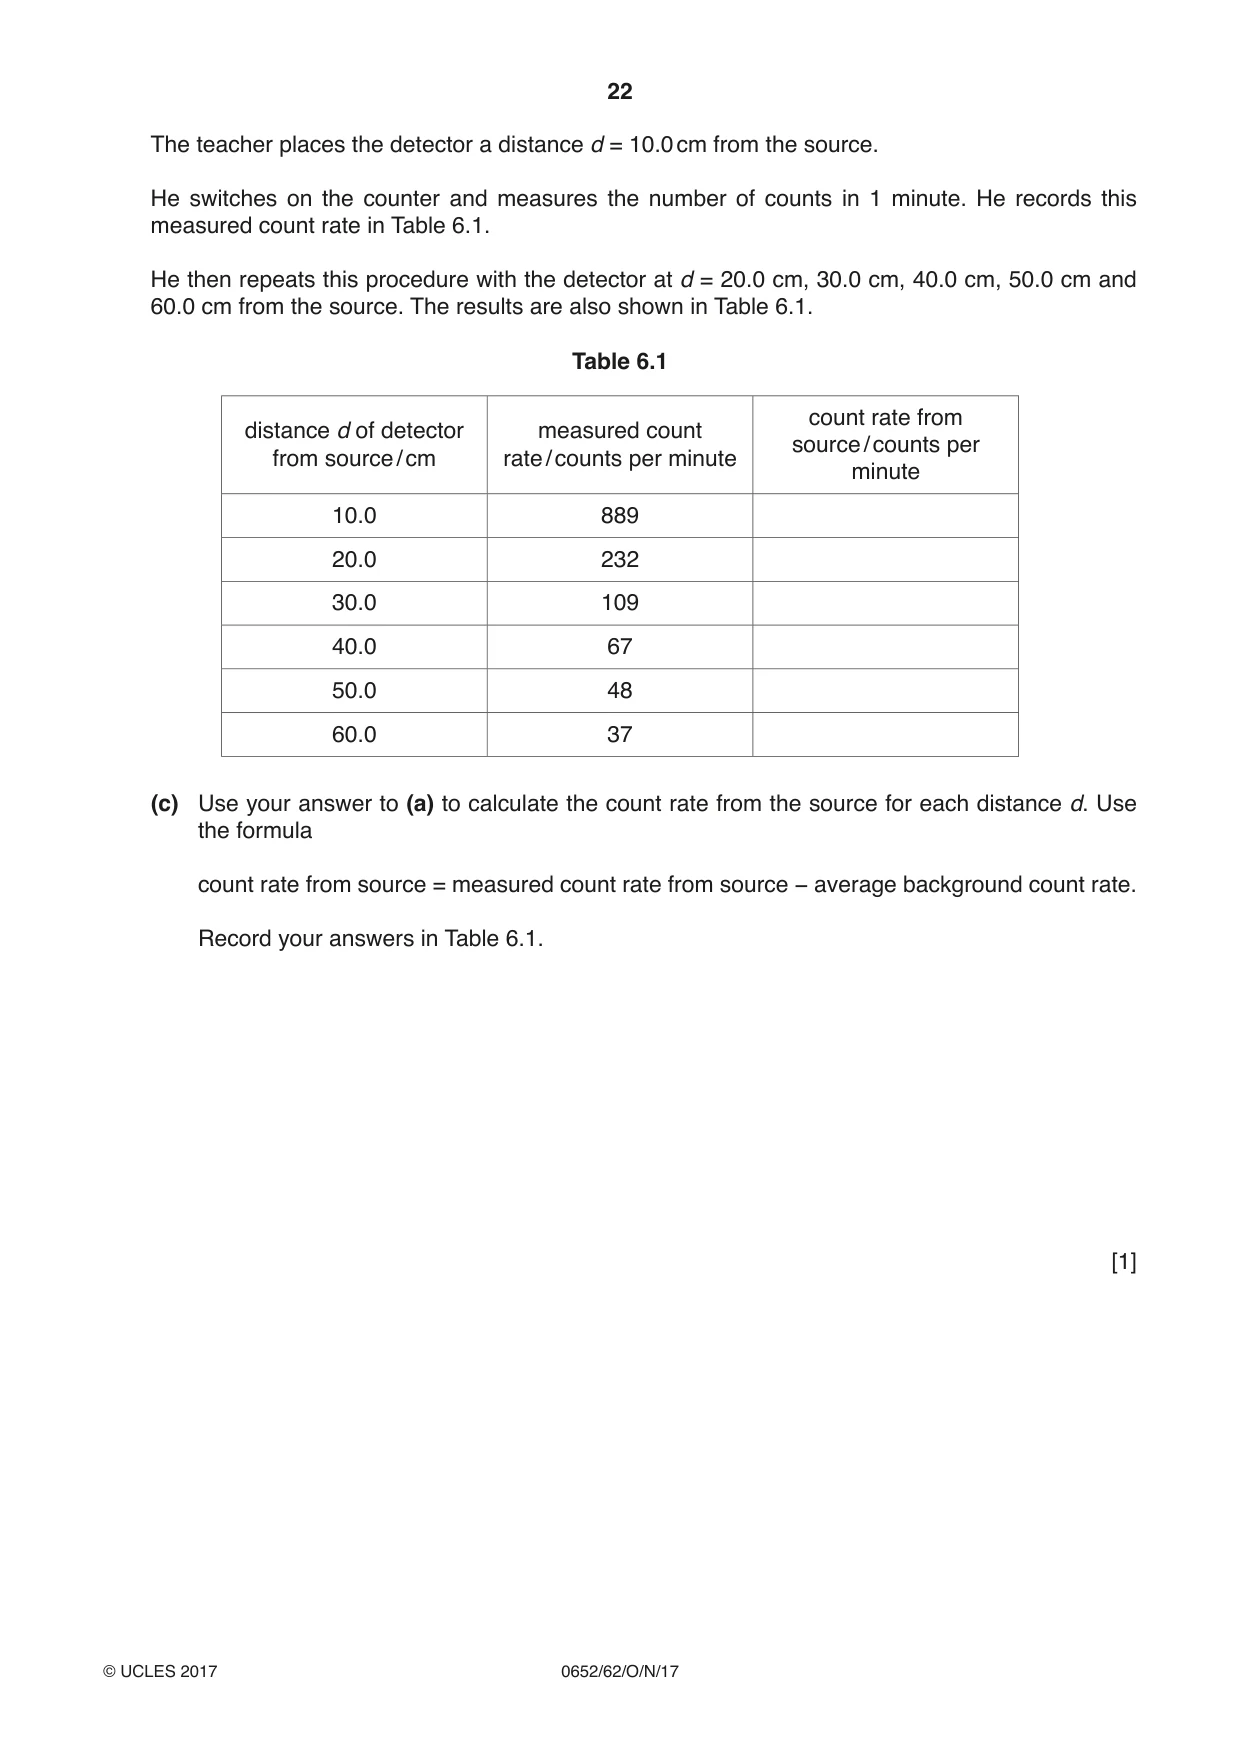
6 A teacher demonstrates to a class how the gamma radiation emitted by a radioactive source depends upon the distance of the detector from the source. He uses a detector and counter to measure the count rate from the radioactive source, as shown in Fig. 6.1. counter radioactive source 0.00 aluminium sheet detector metre rule d 0 100 cm Fig. 6.1 He sets up the detector and counter without the radioactive source and measures the background count in 1 minute. He repeats this twice more. His results are shown below. 1. 10 counts/minute 2. 13 counts/minute 3. 12 counts/minute (a) Calculate the average count rate due to background radiation. Give your answer to the nearest whole number. average background count rate = .................................. counts / minute [1] (b) The radioactive source used in the experiment emits alpha-particles (α-particles), beta- particles (β-particles) and gamma-rays (γ-rays). Explain why the teacher places an aluminium sheet close to the source and between the source and the detector. ................................................................................................................................................... ................................................................................................................................................... ...............................................................................................................................................[2] The teacher places the detector a distance d = 10.0 cm from the source. He switches on the counter and measures the number of counts in 1 minute. He records this measured count rate in Table 6.1. He then repeats this procedure with the detector at d = 20.0 cm, 30.0 cm, 40.0 cm, 50.0 cm and 60.0 cm from the source. The results are also shown in Table 6.1. Table 6.1 count rate from distance d of detector measured count source / counts per from source / cm rate / counts per minute minute 10.0 889 20.0 232 30.0 109 40.0 67 50.0 48 60.0 37 (c) Use your answer to (a) to calculate the count rate from the source for each distance d. Use the formula count rate from source = measured count rate from source − average background count rate. Record your answers in Table 6.1. [1] (d) Plot a graph of count rate from source (vertical axis) against distance d from the source. Start your axes from the origin (0,0). Draw a best-fit curve. count rate / counts per minute distance from source / cm [4] (e) (i) Use your graph to suggest one safety precaution that a person working with a source of gamma-rays should take. ........................................................................................................................................... .......................................................................................................................................[1] (ii) State one other precaution that a person working with a source of radioactive radiation should take. ........................................................................................................................................... .......................................................................................................................................[1]
Mark scheme: 6(a) 12 ; 1 6(b) aluminium absorbs / stops alpha and beta ; gamma rays pass through ; 2 6(c) 877, 220, 97, 55, 36, 25 1 6(d) suitable choice of scales linear and half the grid used ; all 6 plots correct to half a small square scores 2 marks ; 5 correct scores 1 ; smooth curve ; 4 6(e)(i) distant from source owtte ; 1 6(e)(ii) protective clothing / use tongs / short exposure time / keep source in lead-lined container ; 1
What was in this paper
The subtopics covered by these 6 questions, and how many questions each got. Open one in a new tab to see every Cambridge question on it.
What you needed in this session
Cambridge’s own grade thresholds for 2017 Oct/Nov, Paper 6 · Variant 2. A higher threshold means an easier paper — the bar moves with how the cohort did.