Cambridge IGCSE Physical Science 0652 — 2019 Oct/Nov Paper 6 · Variant 2
0652/62/O/N/19 · 4 questions · 40 marks · ≈45 min
The question paper and its mark scheme, free to read here and free to download. This is Cambridge’s own paper, exactly as it was sat.
Question paper16 pages



Mark scheme7 pages
Answers below. Sit the paper first if you are practising.
Questions as text
Q1 · A student investigates the thermal energy produced when a neutralisation reaction occurs
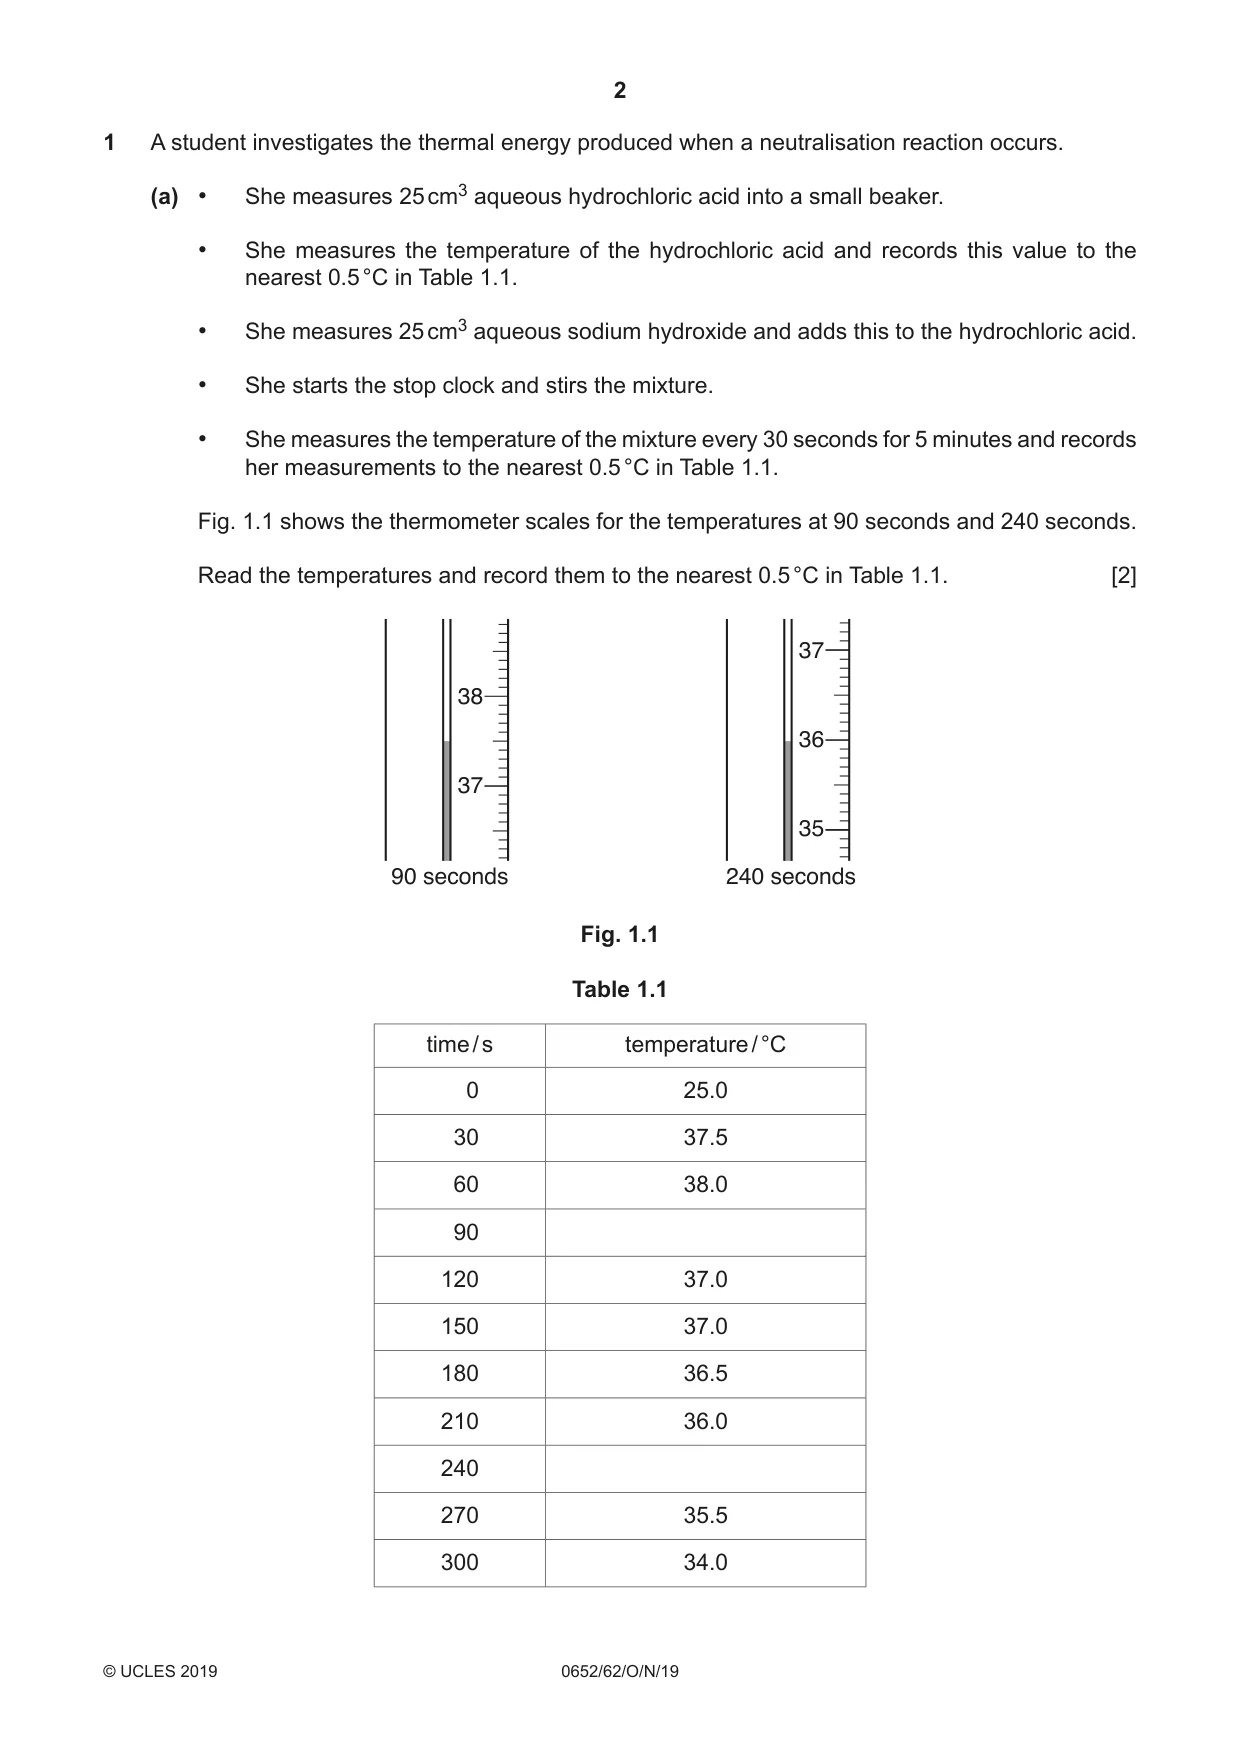
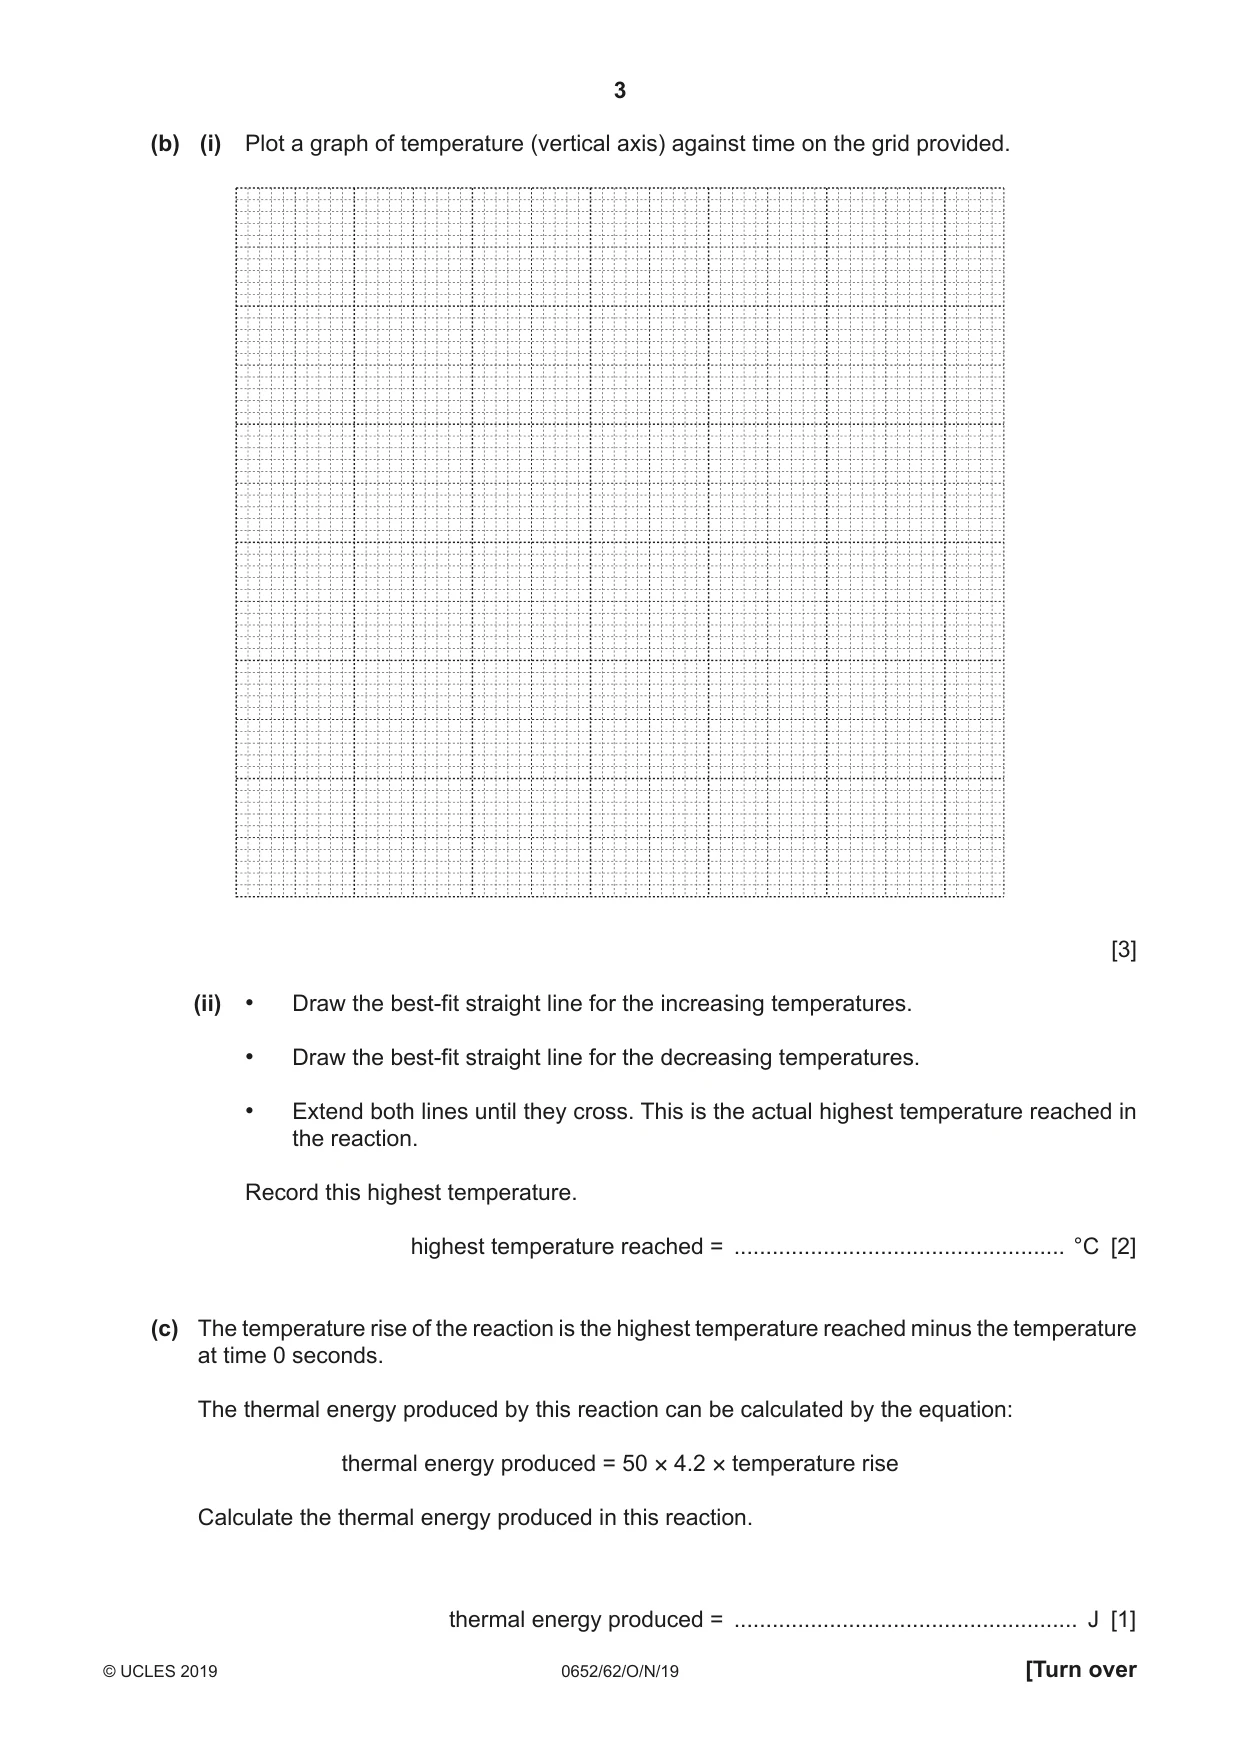
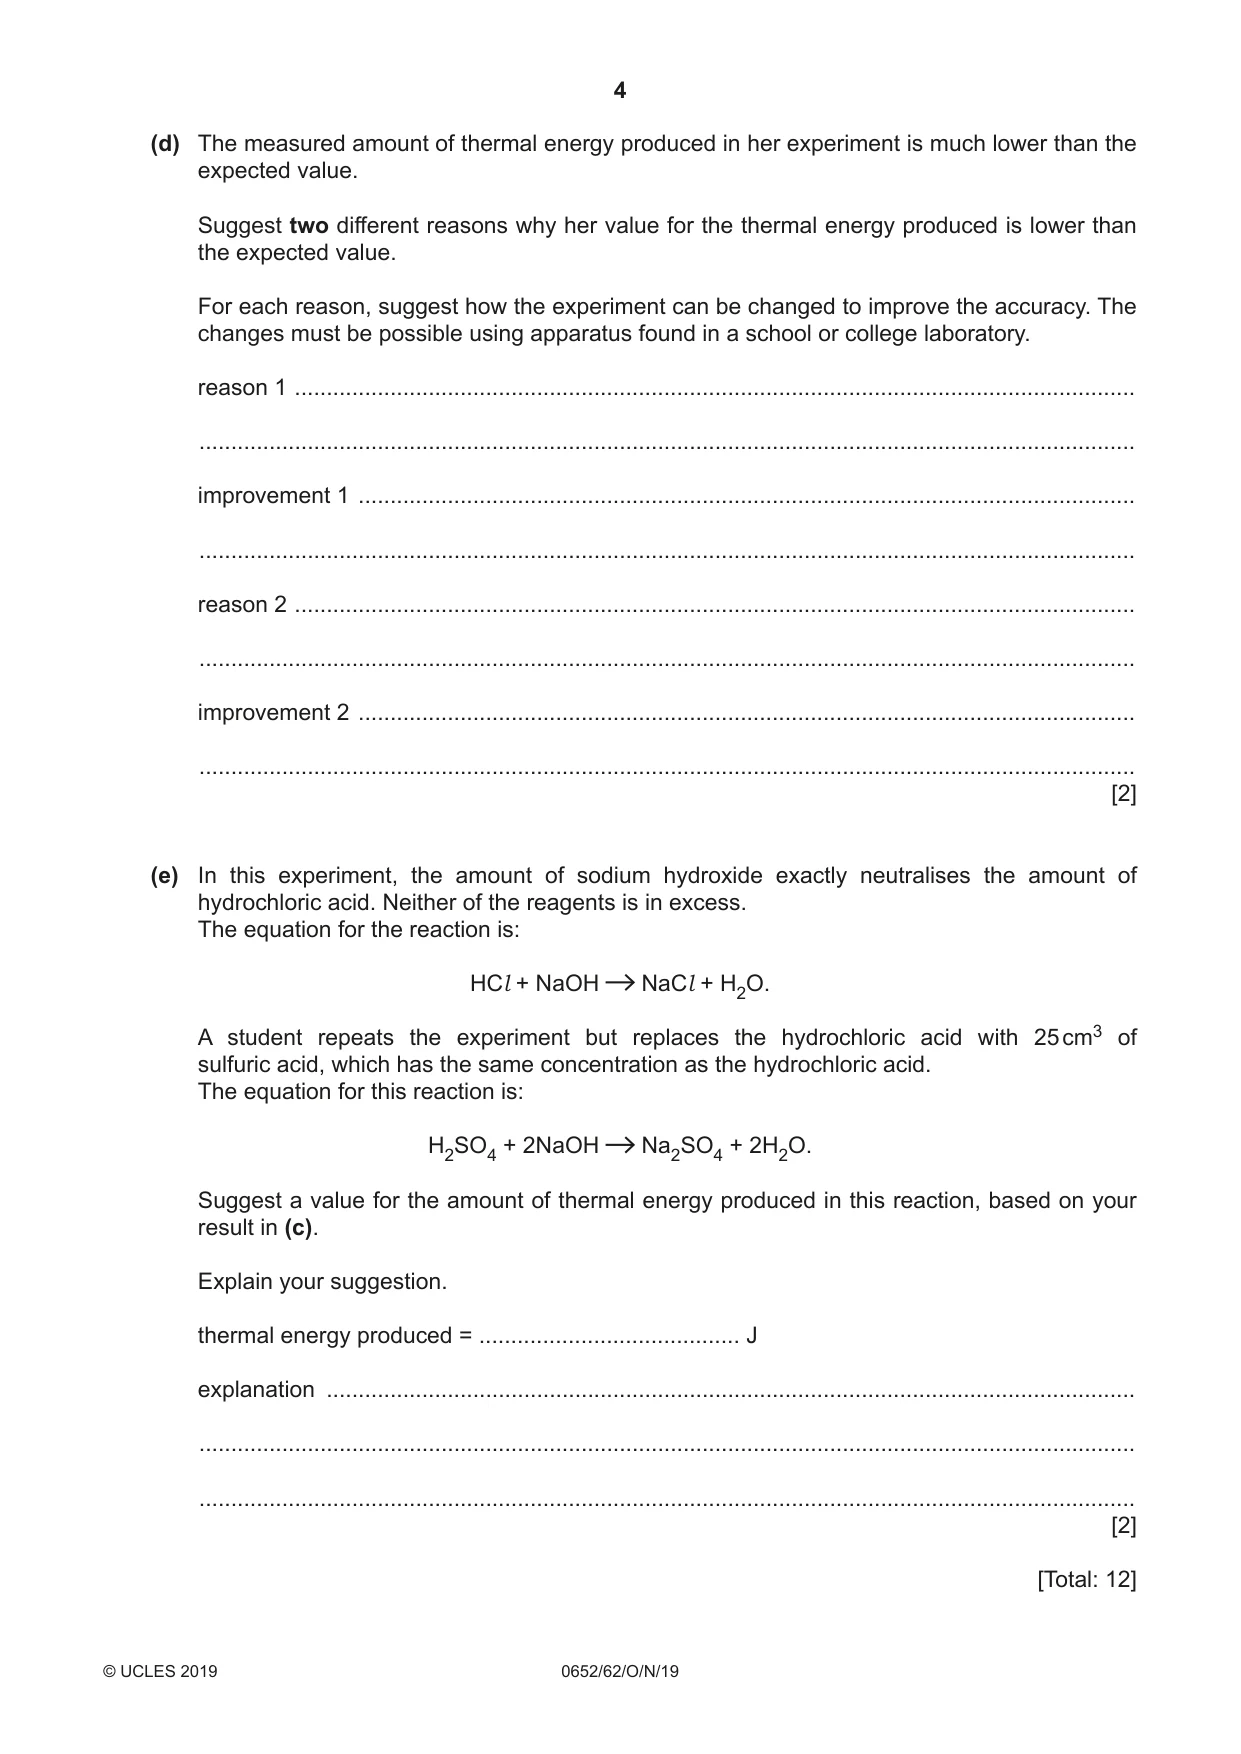
1 A student investigates the thermal energy produced when a neutralisation reaction occurs. (a) • She measures 25 cm3 aqueous hydrochloric acid into a small beaker. • She measures the temperature of the hydrochloric acid and records this value to the nearest 0.5 °C in Table 1.1. • She measures 25 cm3 aqueous sodium hydroxide and adds this to the hydrochloric acid. • She starts the stop clock and stirs the mixture. • She measures the temperature of the mixture every 30 seconds for 5 minutes and records her measurements to the nearest 0.5 °C in Table 1.1. Fig. 1.1 shows the thermometer scales for the temperatures at 90 seconds and 240 seconds. Read the temperatures and record them to the nearest 0.5 °C in Table 1.1. [2] 37 38 36 37 35 90 seconds 240 seconds Fig. 1.1 Table 1.1 time / s temperature / °C 0 25.0 30 37.5 60 38.0 90 120 37.0 150 37.0 180 36.5 210 36.0 240 270 35.5 300 34.0 (b) (i) Plot a graph of temperature (vertical axis) against time on the grid provided. [3] (ii) • Draw the best-fit straight line for the increasing temperatures. • Draw the best-fit straight line for the decreasing temperatures. • Extend both lines until they cross. This is the actual highest temperature reached in the reaction. Record this highest temperature. highest temperature reached = .................................................... °C [2] (c) The temperature rise of the reaction is the highest temperature reached minus the temperature at time 0 seconds. The thermal energy produced by this reaction can be calculated by the equation: thermal energy produced = 50 × 4.2 × temperature rise Calculate the thermal energy produced in this reaction. thermal energy produced = ...................................................... J [1] (d) The measured amount of thermal energy produced in her experiment is much lower than the expected value. Suggest two different reasons why her value for the thermal energy produced is lower than the expected value. For each reason, suggest how the experiment can be changed to improve the accuracy. The changes must be possible using apparatus found in a school or college laboratory. reason 1 .................................................................................................................................... ................................................................................................................................................... improvement 1 .......................................................................................................................... ................................................................................................................................................... reason 2 .................................................................................................................................... ................................................................................................................................................... improvement 2 .......................................................................................................................... ................................................................................................................................................... [2] (e) In this experiment, the amount of sodium hydroxide exactly neutralises the amount of hydrochloric acid. Neither of the reagents is in excess. The equation for the reaction is: HCl + NaOH NaCl + H2O. A student repeats the experiment but replaces the hydrochloric acid with 25 cm3 of sulfuric acid, which has the same concentration as the hydrochloric acid. The equation for this reaction is: H2SO4 + 2NaOH Na2SO4 + 2H2O. Suggest a value for the amount of thermal energy produced in this reaction, based on your result in (c). Explain your suggestion. thermal energy produced = ......................................... J explanation ............................................................................................................................... ................................................................................................................................................... ................................................................................................................................................... [2] [Total: 12] Question 2 begins over the page
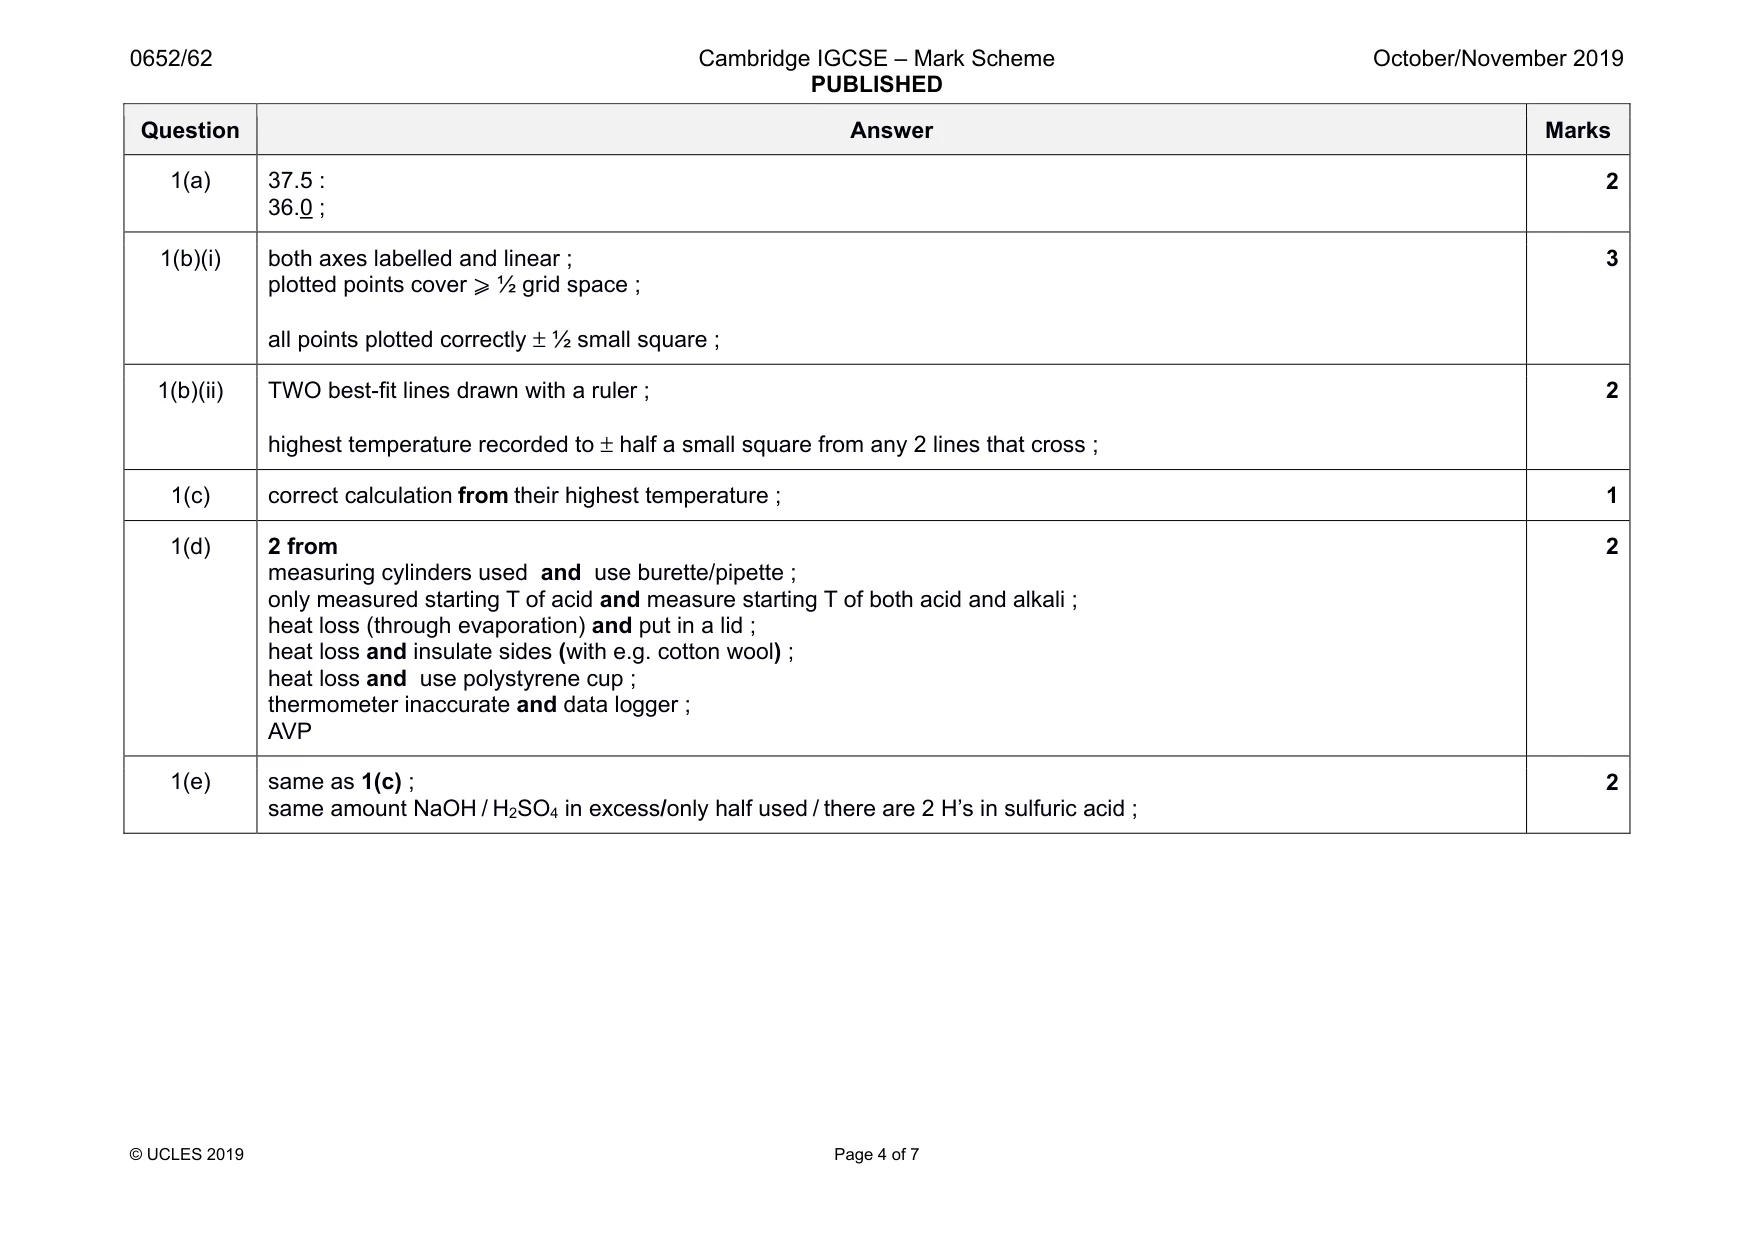
Mark scheme: 1(a) 37.5 : 36.0 ; 2 1(b)(i) both axes labelled and linear ; plotted points cover ⩾ ½ grid space ; all points plotted correctly ± ½ small square ; 3 1(b)(ii) TWO best-fit lines drawn with a ruler ; highest temperature recorded to ± half a small square from any 2 lines that cross ; 2 1(c) correct calculation from their highest temperature ; 1 1(d) 2 from measuring cylinders used and use burette/pipette ; only measured starting T of acid and measure starting T of both acid and alkali ; heat loss (through evaporation) and put in a lid ; heat loss and insulate sides (with e.g. cotton wool) ; heat loss and use polystyrene cup ; thermometer inaccurate and data logger ; AVP 2 1(e) same as 1(c) ; same amount NaOH / H2SO4 in excess/only half used / there are 2 H’s in sulfuric acid ; 2
Q2 · A student is given two substances, solid compound A and solution B
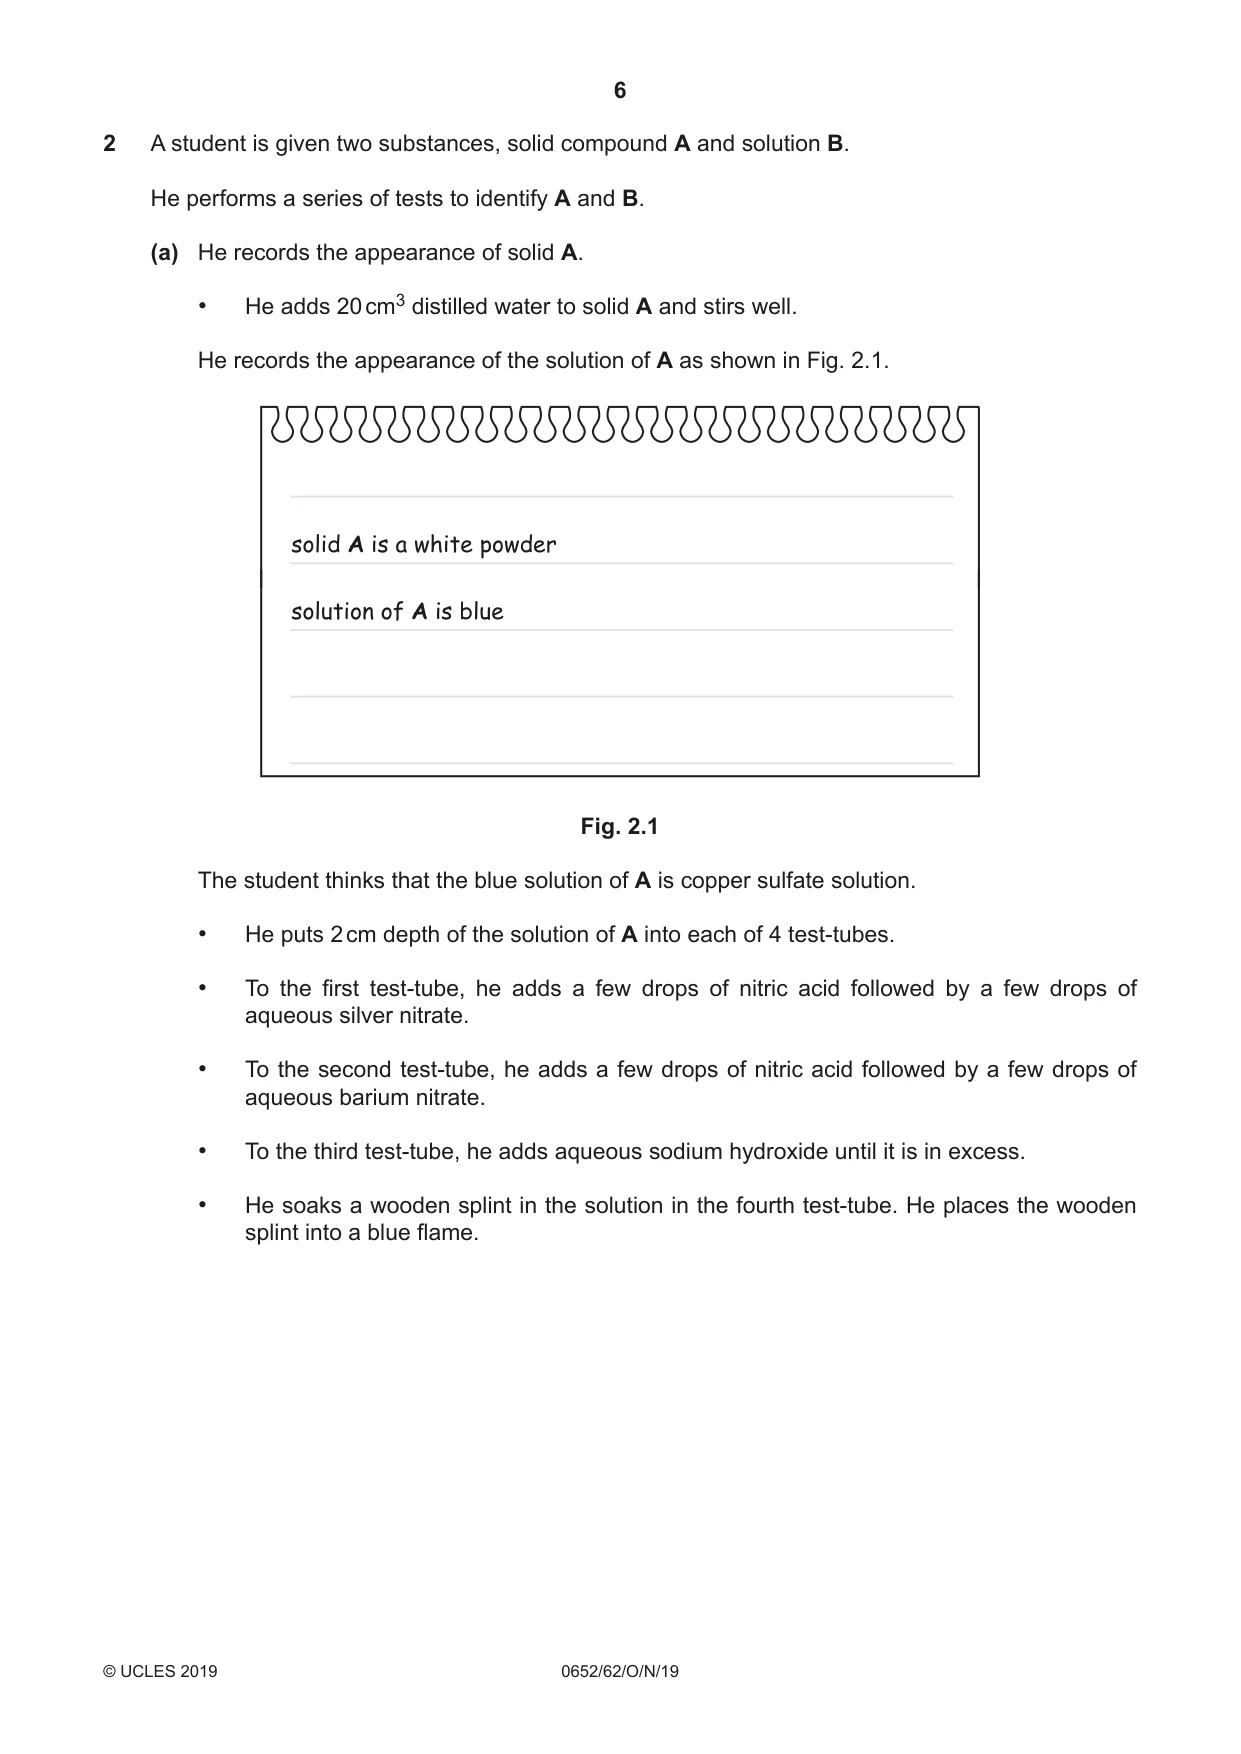
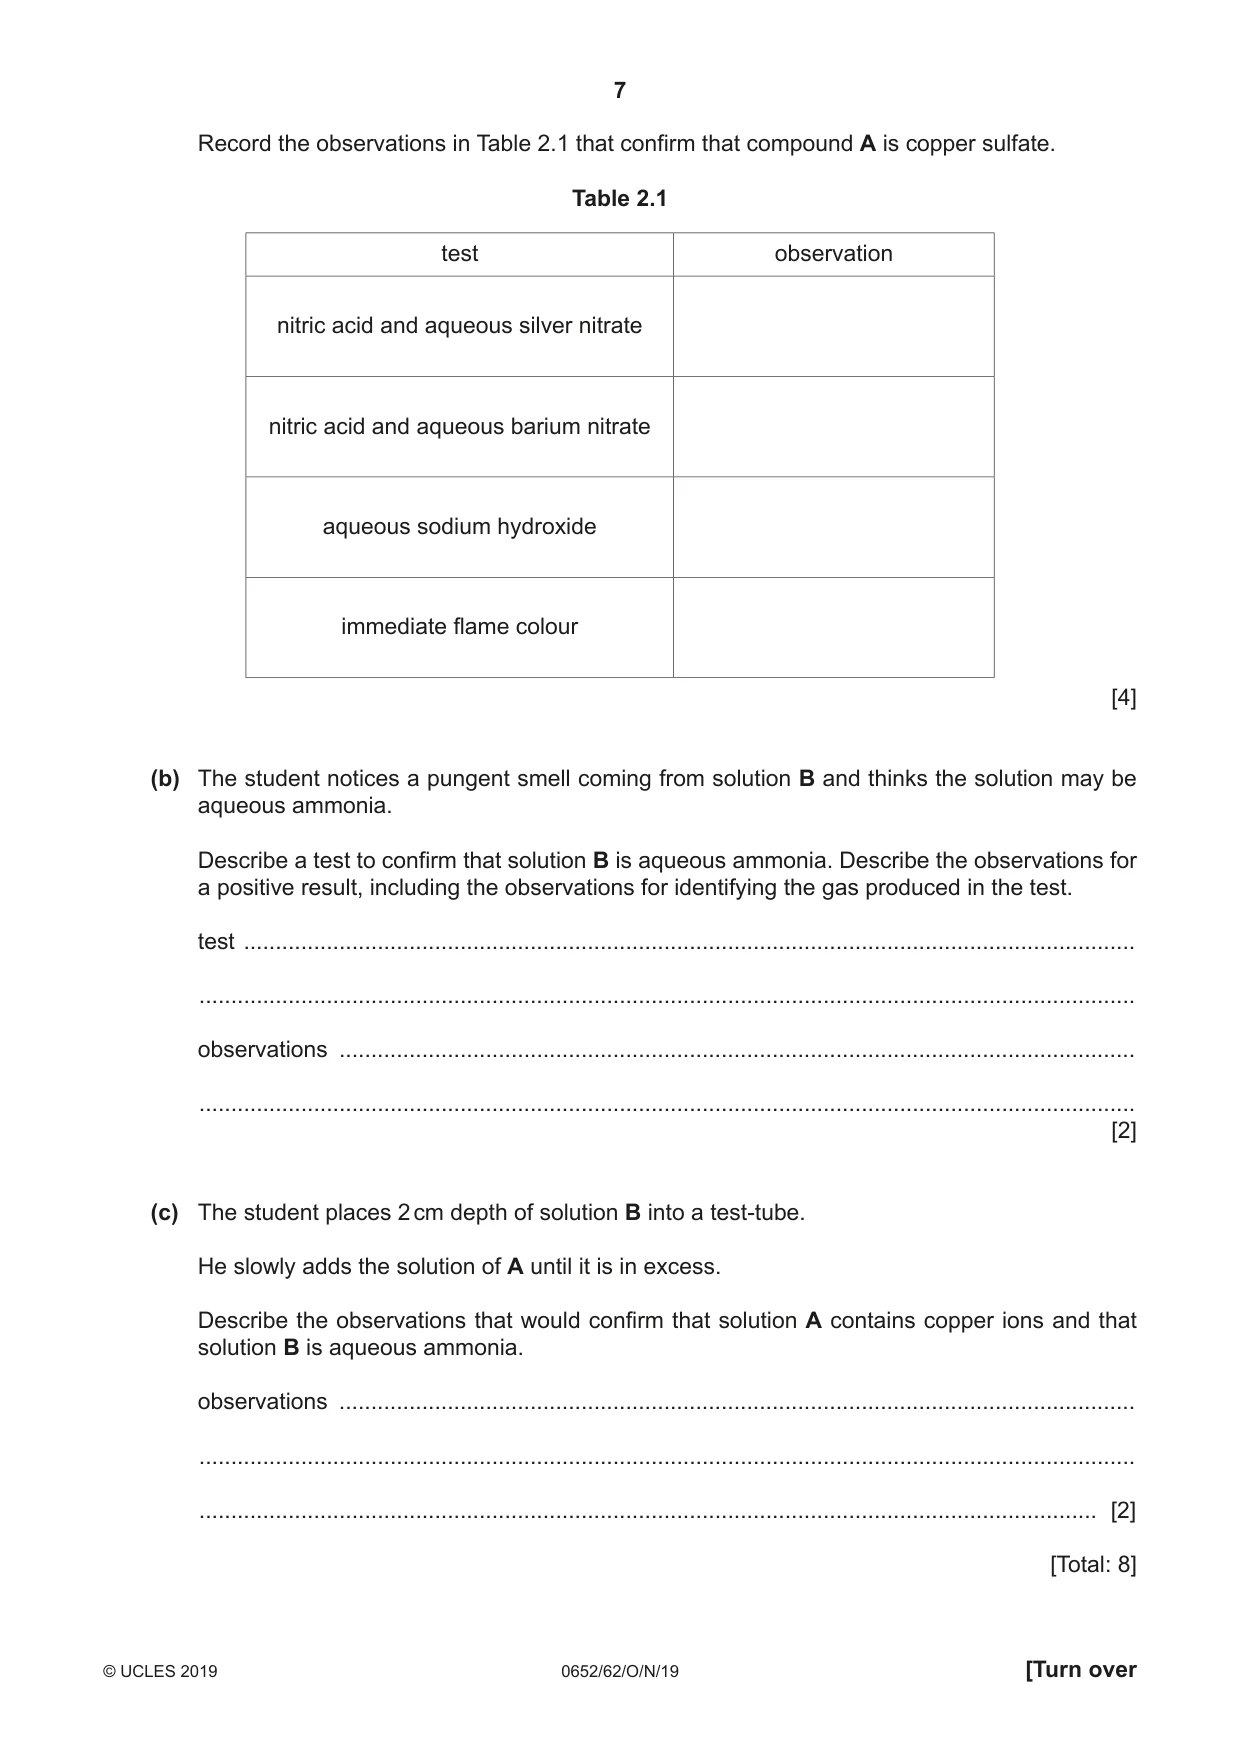
2 A student is given two substances, solid compound A and solution B. He performs a series of tests to identify A and B. (a) He records the appearance of solid A. • He adds 20 cm3 distilled water to solid A and stirs well. He records the appearance of the solution of A as shown in Fig. 2.1. solid A is a white powder solution of A is blue Fig. 2.1 The student thinks that the blue solution of A is copper sulfate solution. • He puts 2 cm depth of the solution of A into each of 4 test-tubes. • To the first test-tube, he adds a few drops of nitric acid followed by a few drops of aqueous silver nitrate. • To the second test-tube, he adds a few drops of nitric acid followed by a few drops of aqueous barium nitrate. • To the third test-tube, he adds aqueous sodium hydroxide until it is in excess. • He soaks a wooden splint in the solution in the fourth test-tube. He places the wooden splint into a blue flame. Record the observations in Table 2.1 that confirm that compound A is copper sulfate. Table 2.1 test observation nitric acid and aqueous silver nitrate nitric acid and aqueous barium nitrate aqueous sodium hydroxide immediate flame colour [4] (b) The student notices a pungent smell coming from solution B and thinks the solution may be aqueous ammonia. Describe a test to confirm that solution B is aqueous ammonia. Describe the observations for a positive result, including the observations for identifying the gas produced in the test. test ............................................................................................................................................ ................................................................................................................................................... observations ............................................................................................................................. ................................................................................................................................................... [2] (c) The student places 2 cm depth of solution B into a test-tube. He slowly adds the solution of A until it is in excess. Describe the observations that would confirm that solution A contains copper ions and that solution B is aqueous ammonia. observations ............................................................................................................................. ................................................................................................................................................... ............................................................................................................................................. [2] [Total: 8]
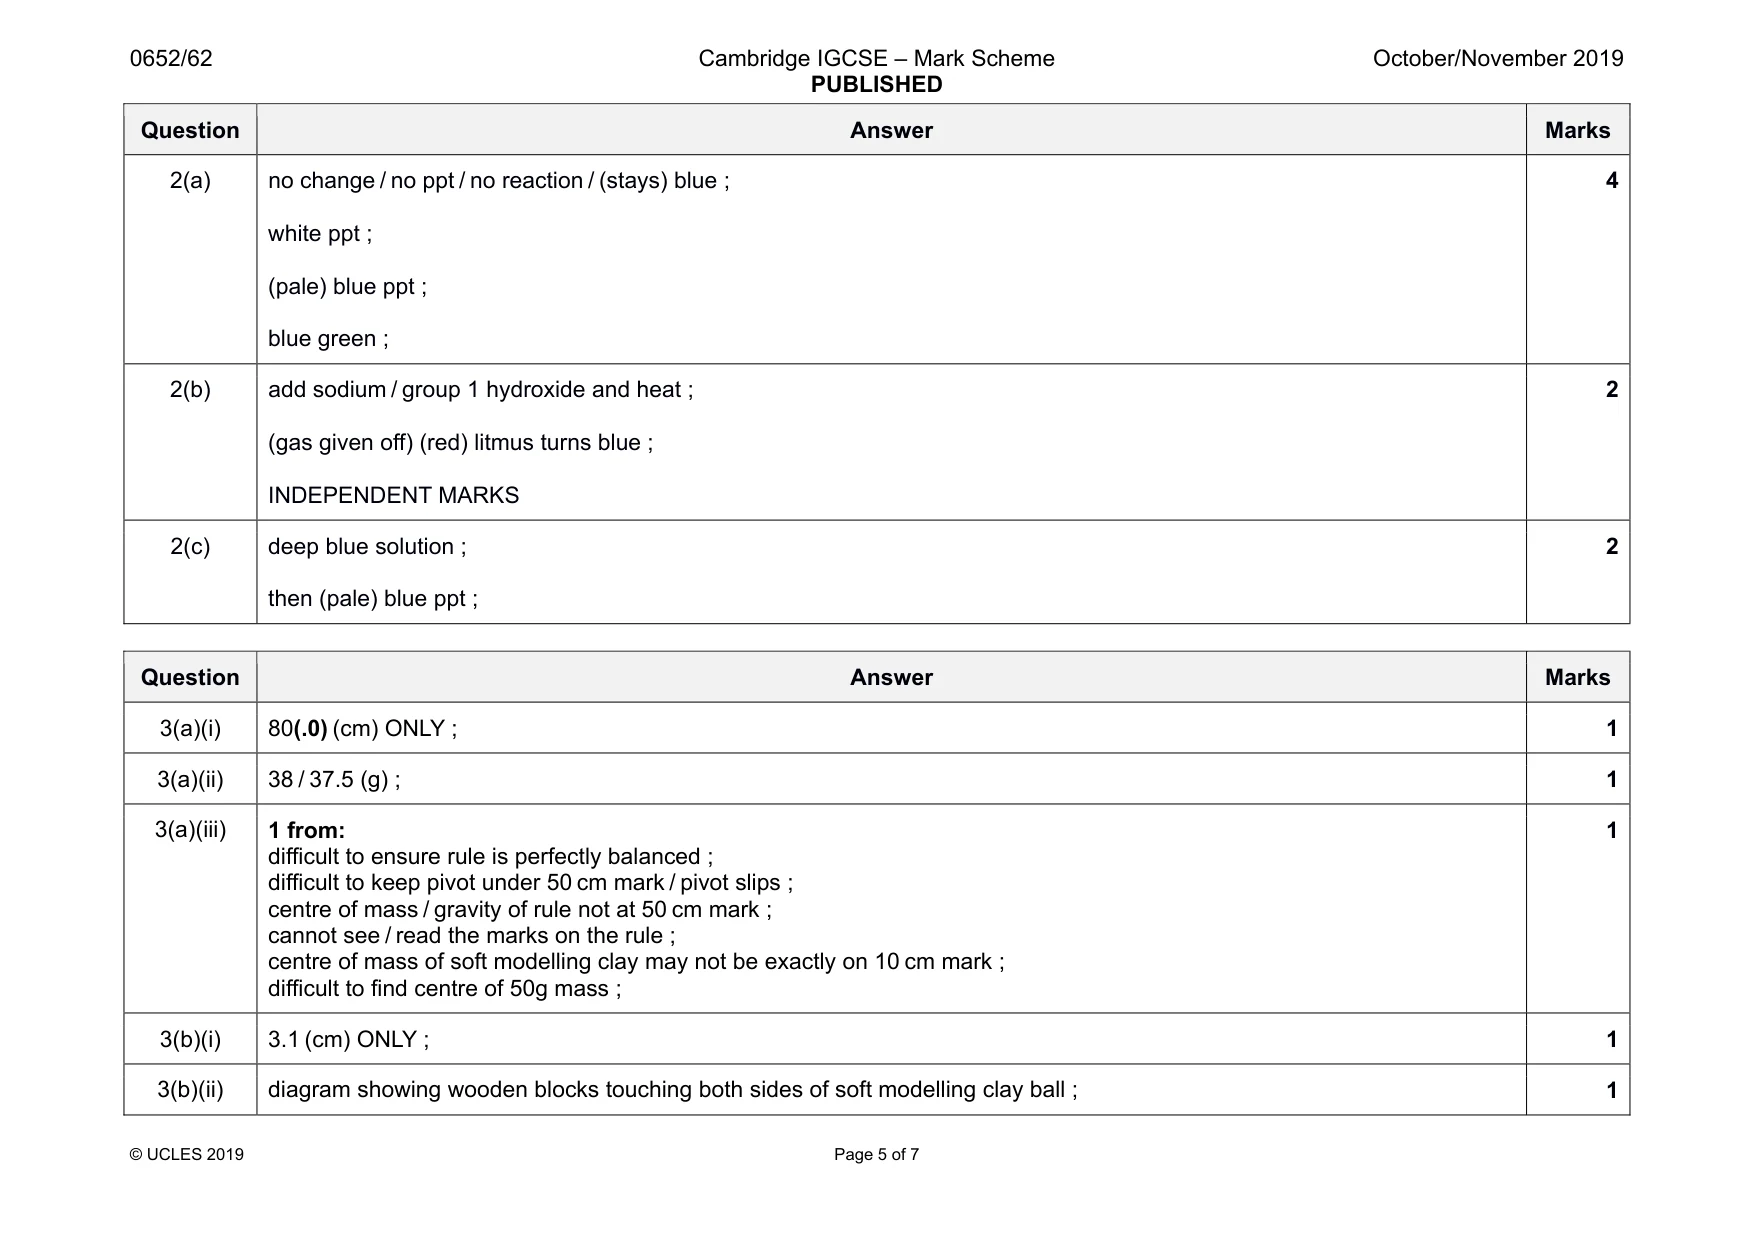
Mark scheme: 2(a) no change / no ppt / no reaction / (stays) blue ; white ppt ; (pale) blue ppt ; blue green ; 4 2(b) add sodium / group 1 hydroxide and heat ; (gas given off) (red) litmus turns blue ; INDEPENDENT MARKS 2 2(c) deep blue solution ; then (pale) blue ppt ; 2
Q3 · A student calculates the density of soft modelling clay
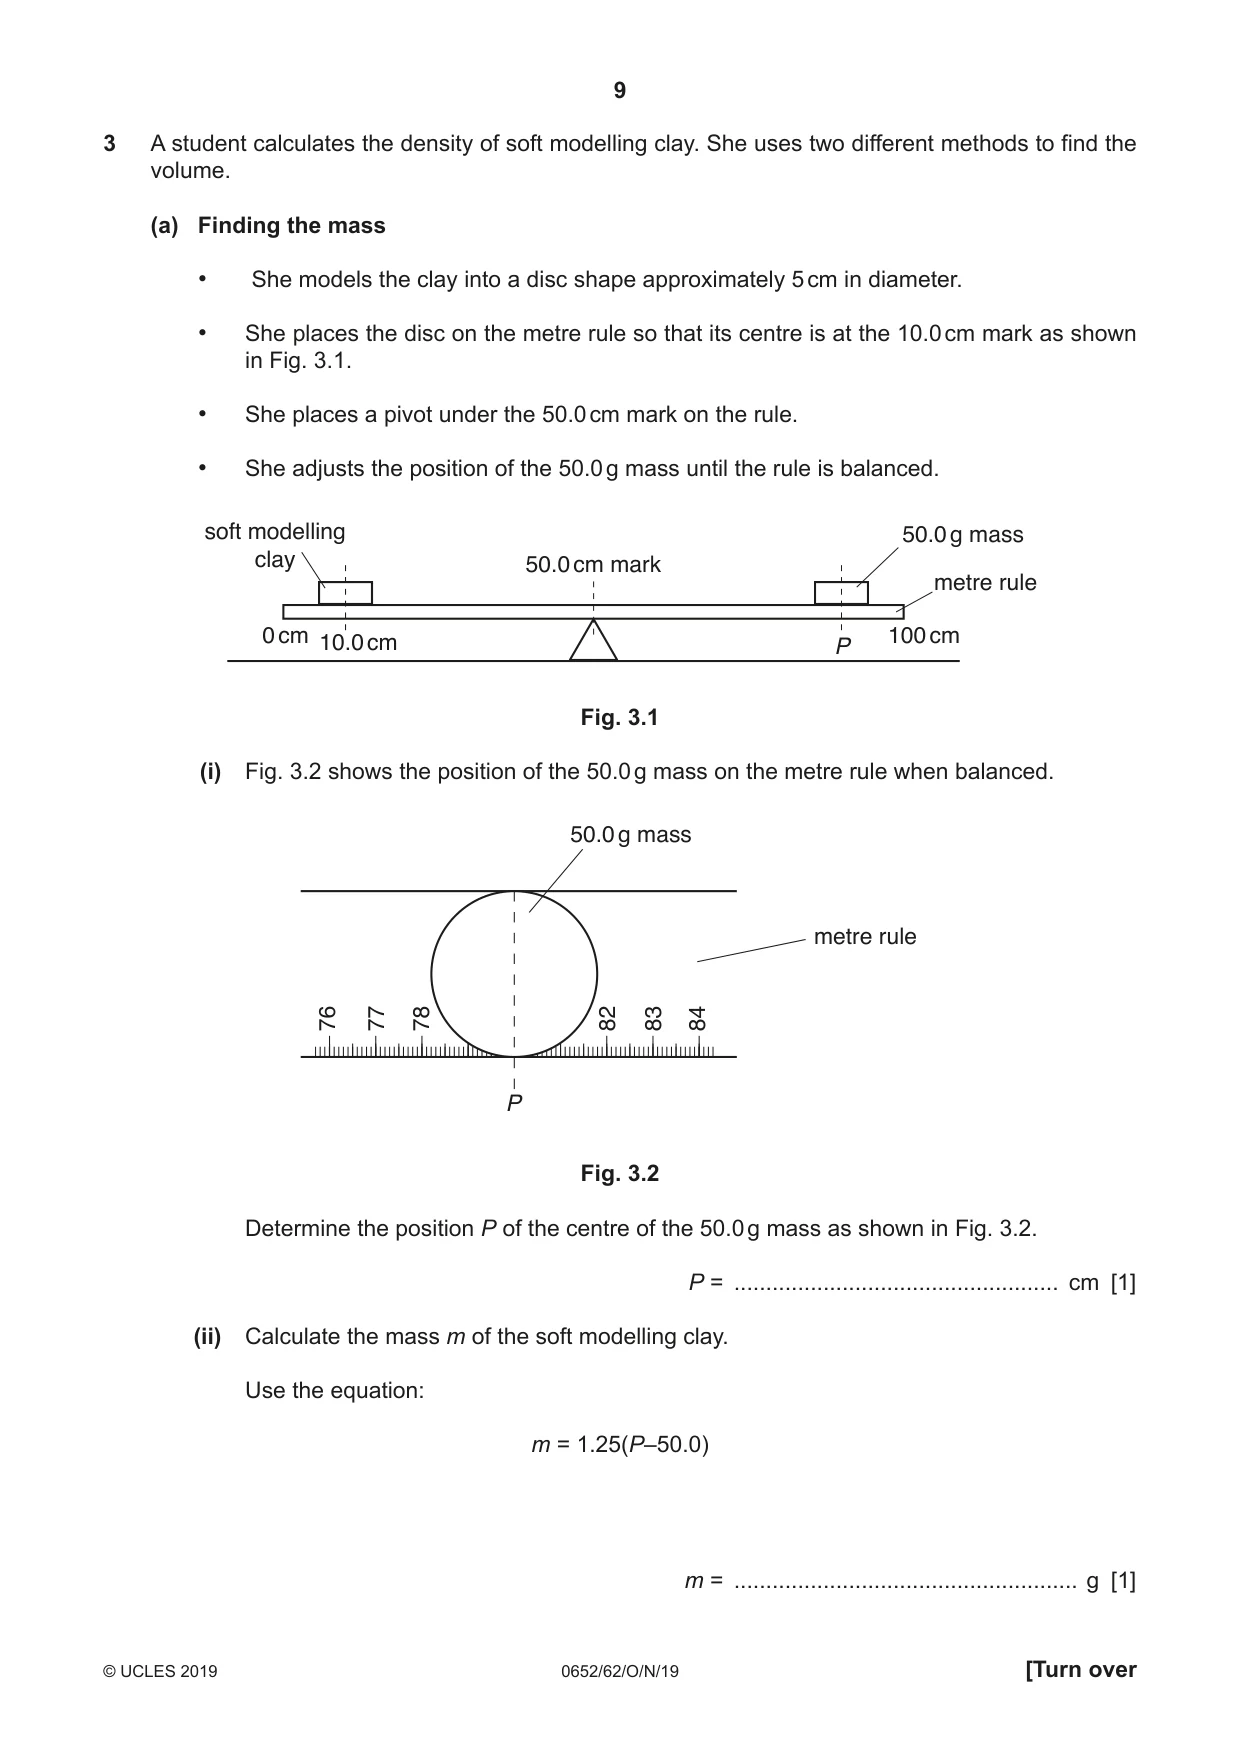
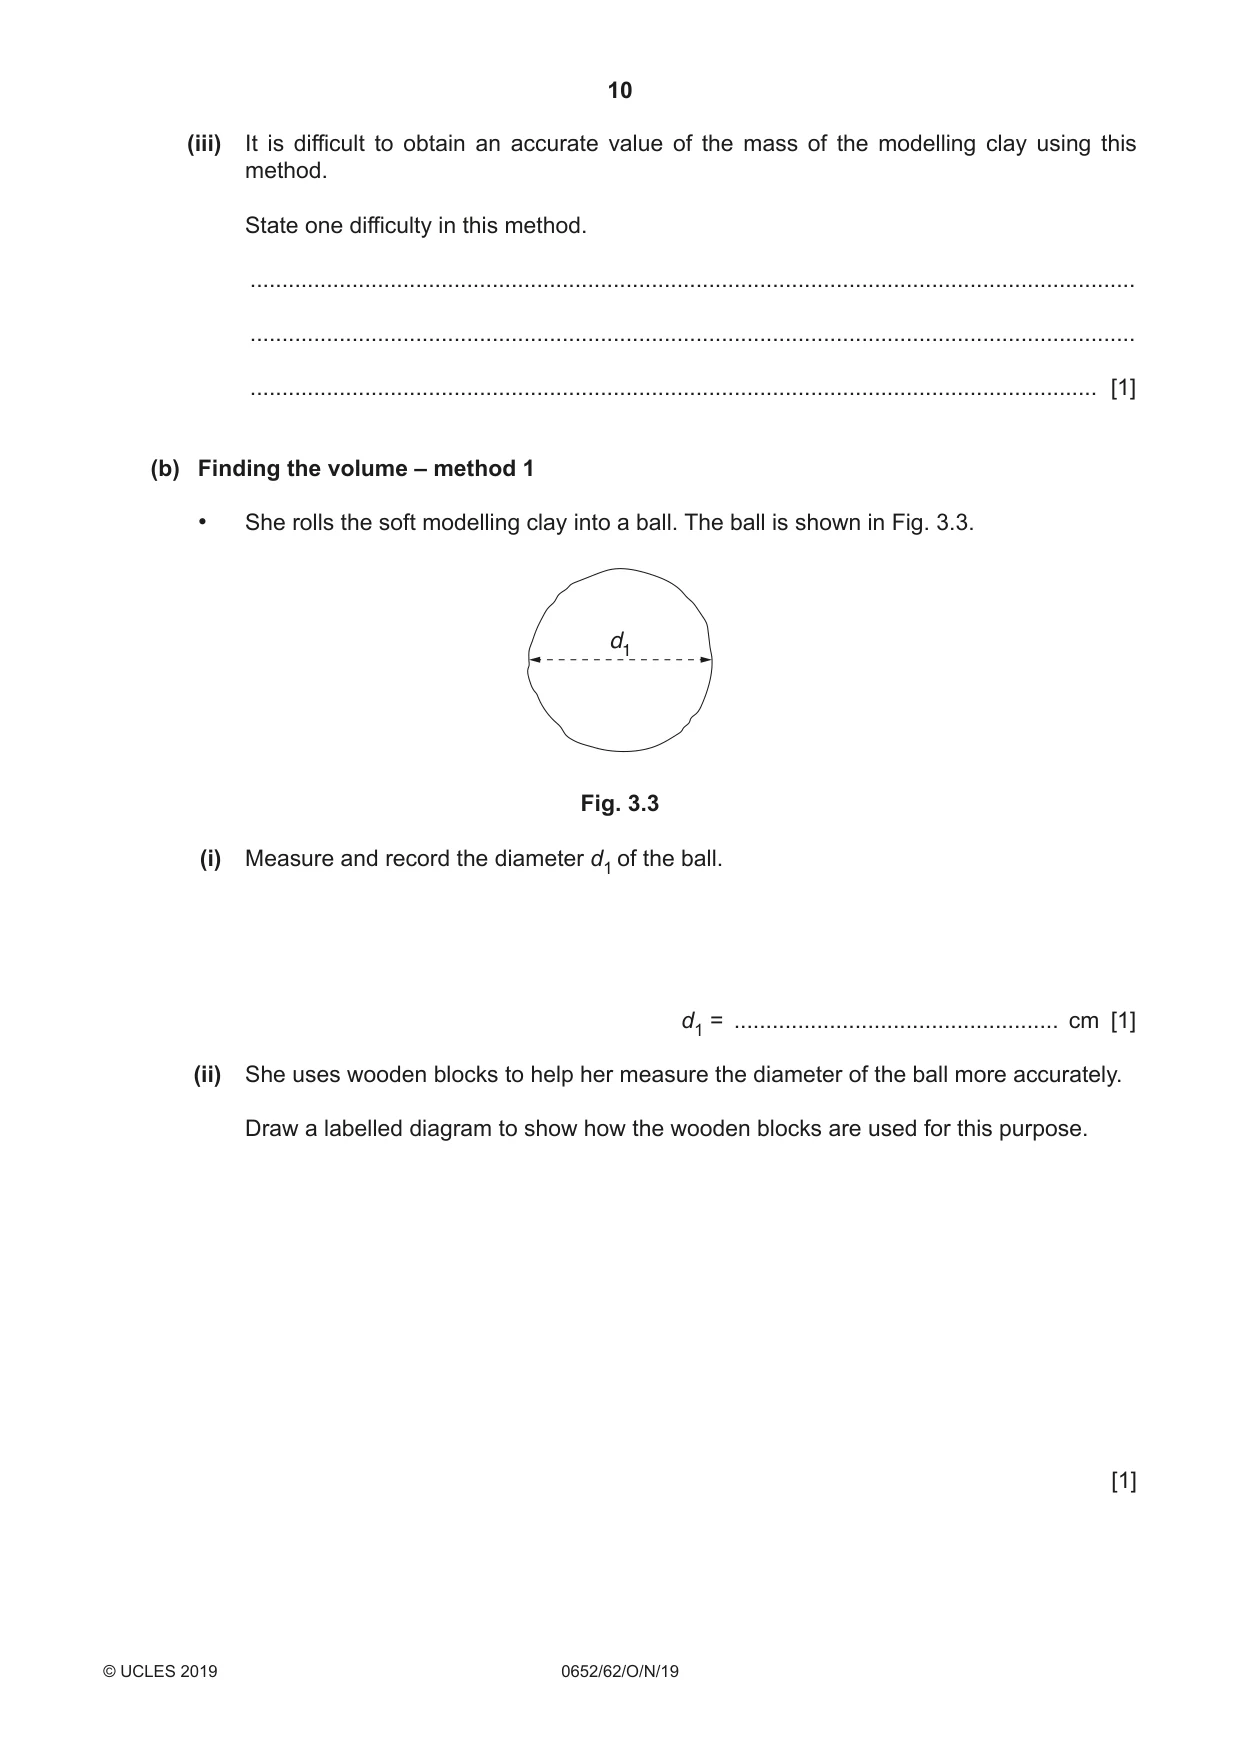
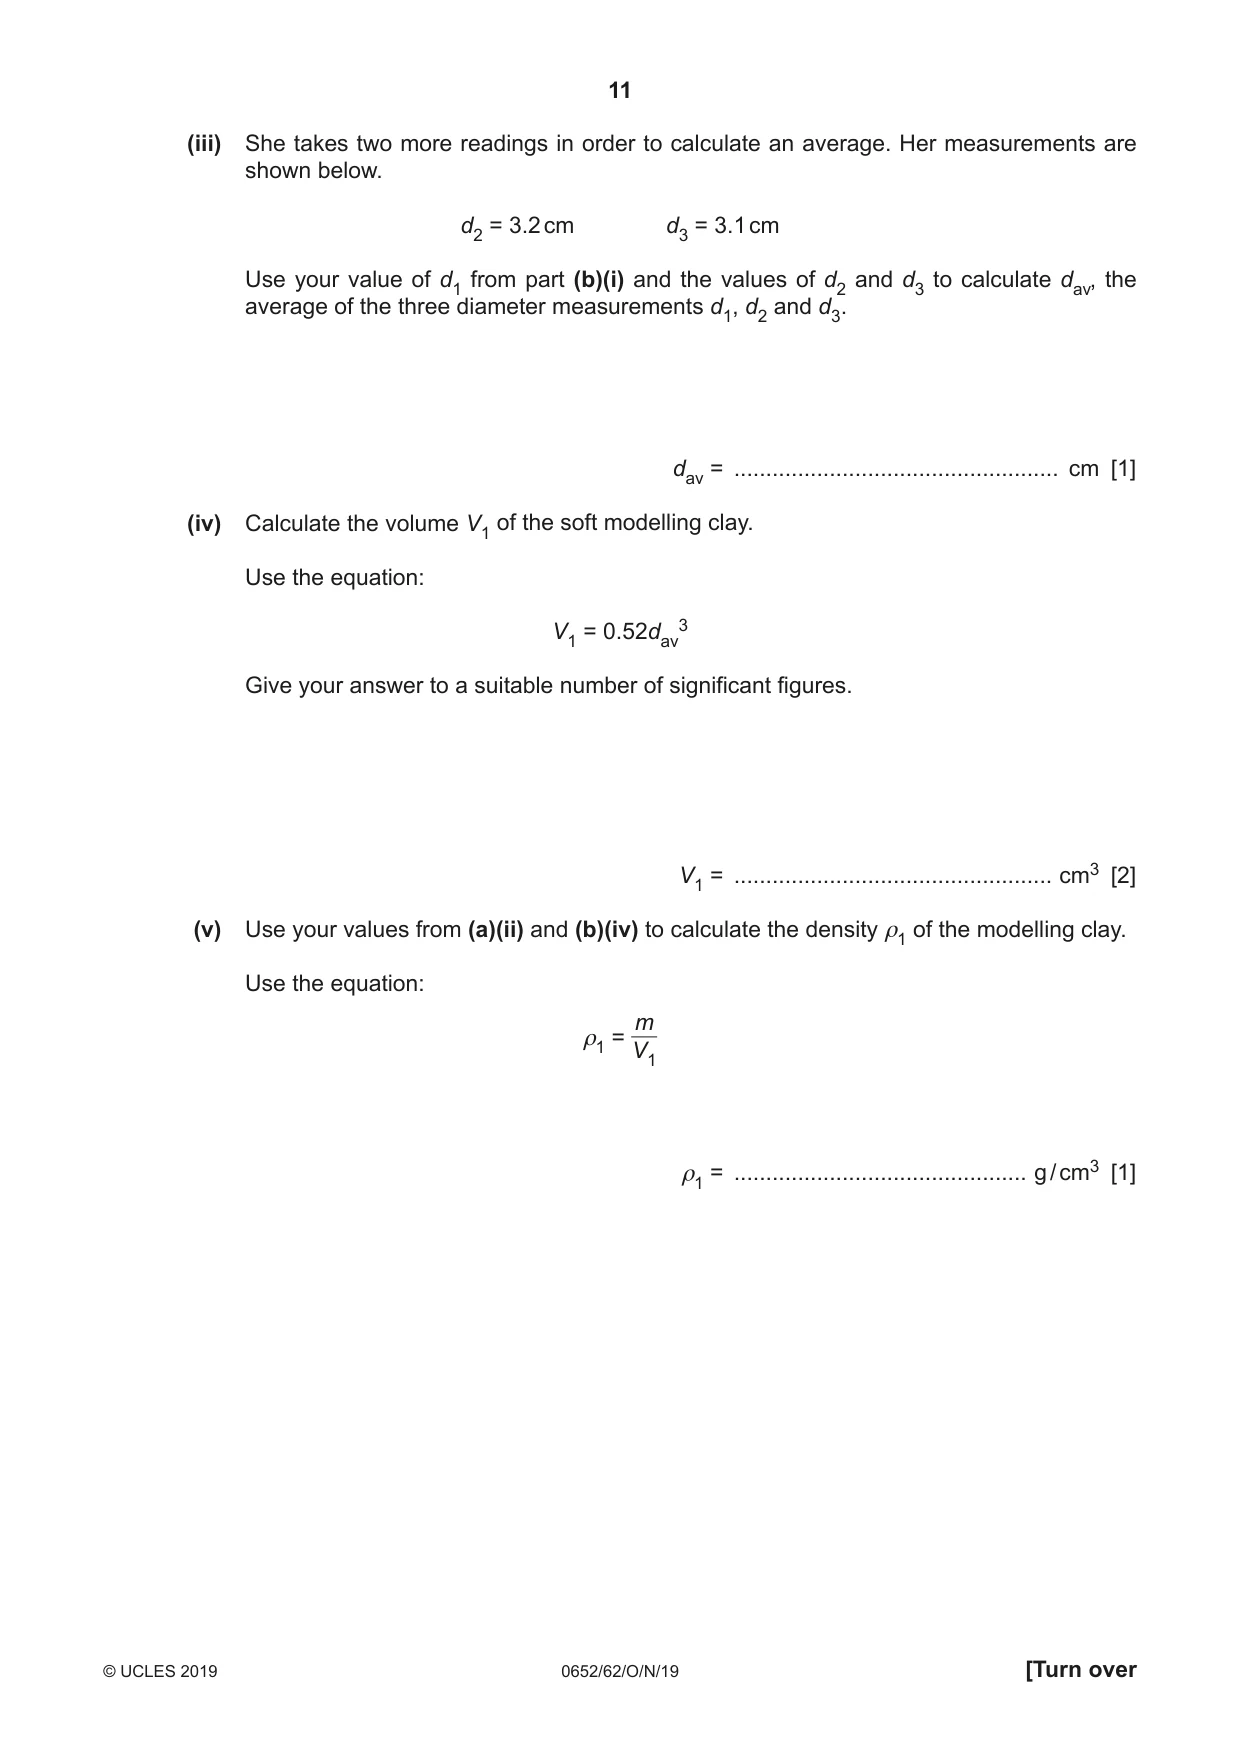
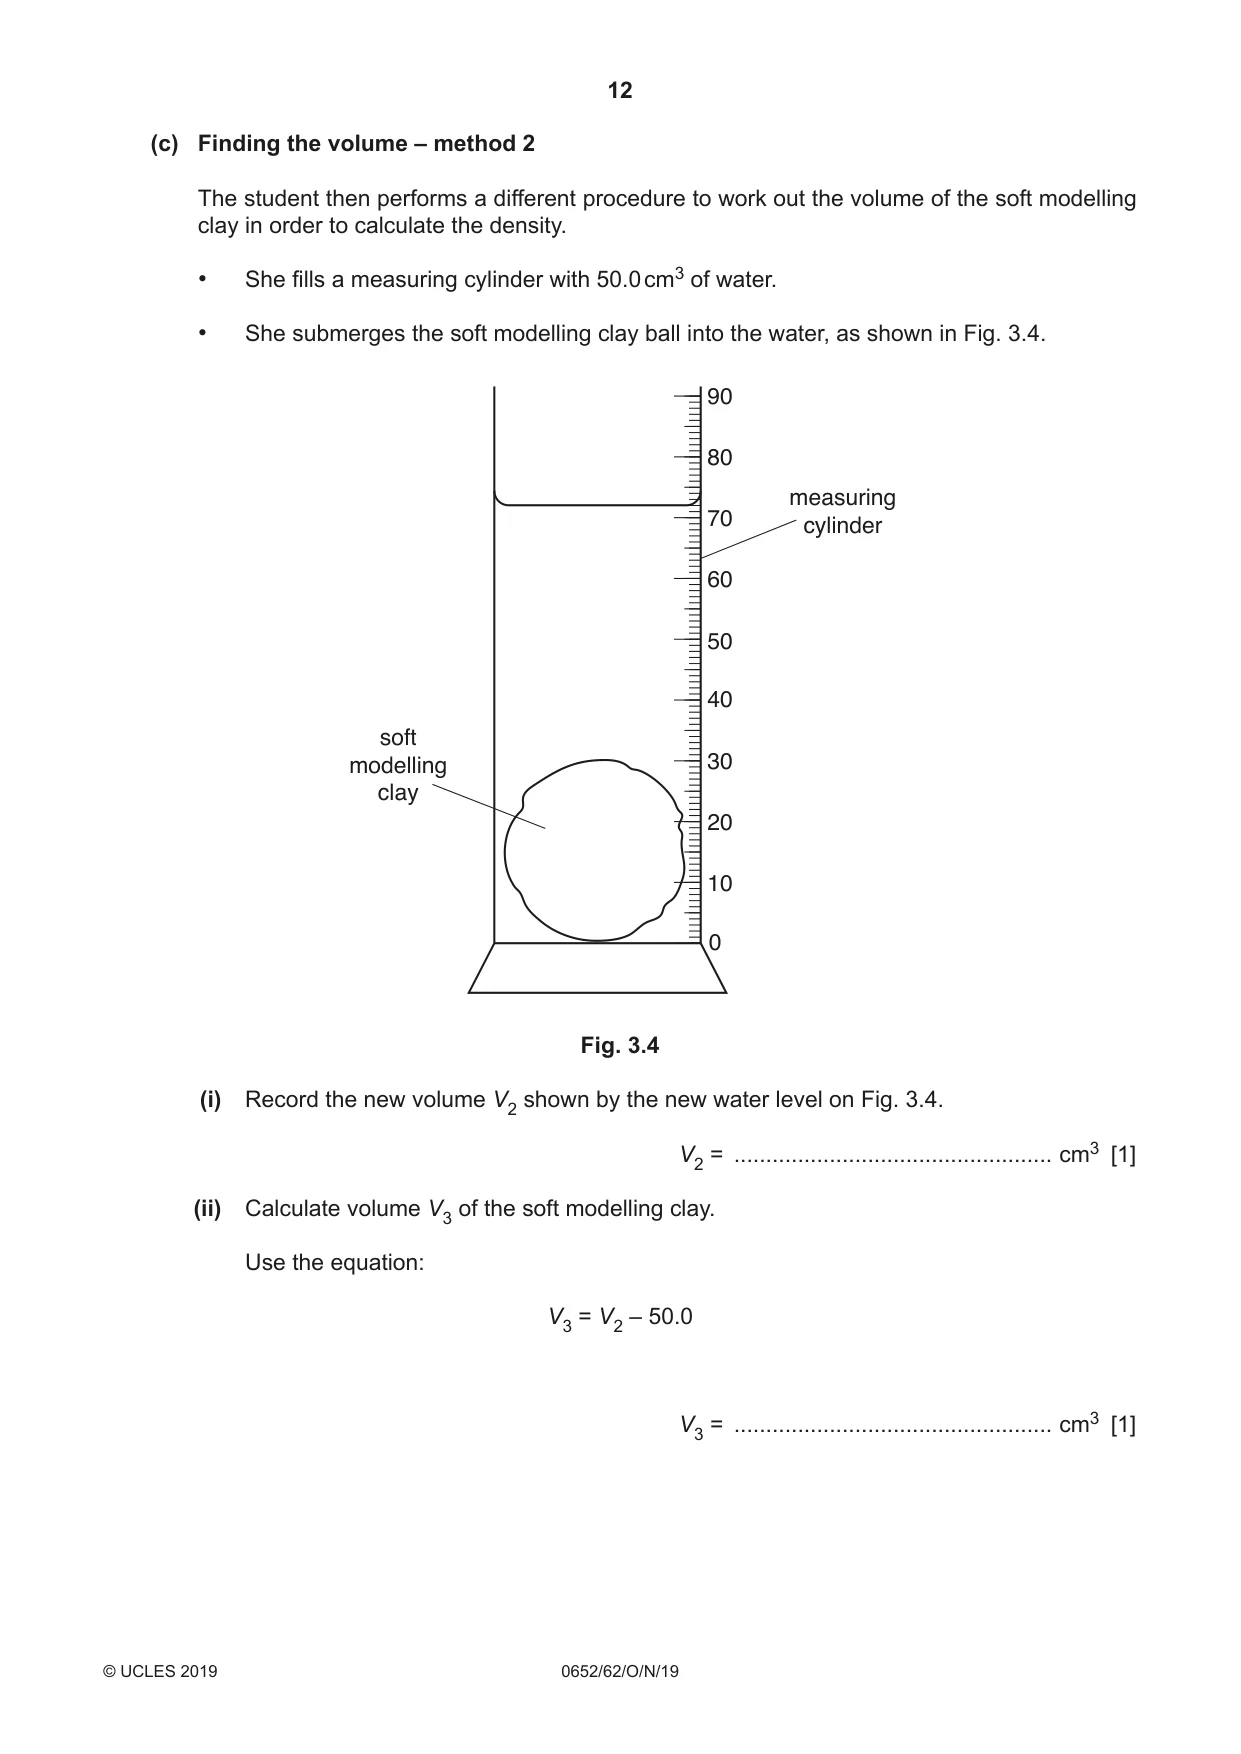
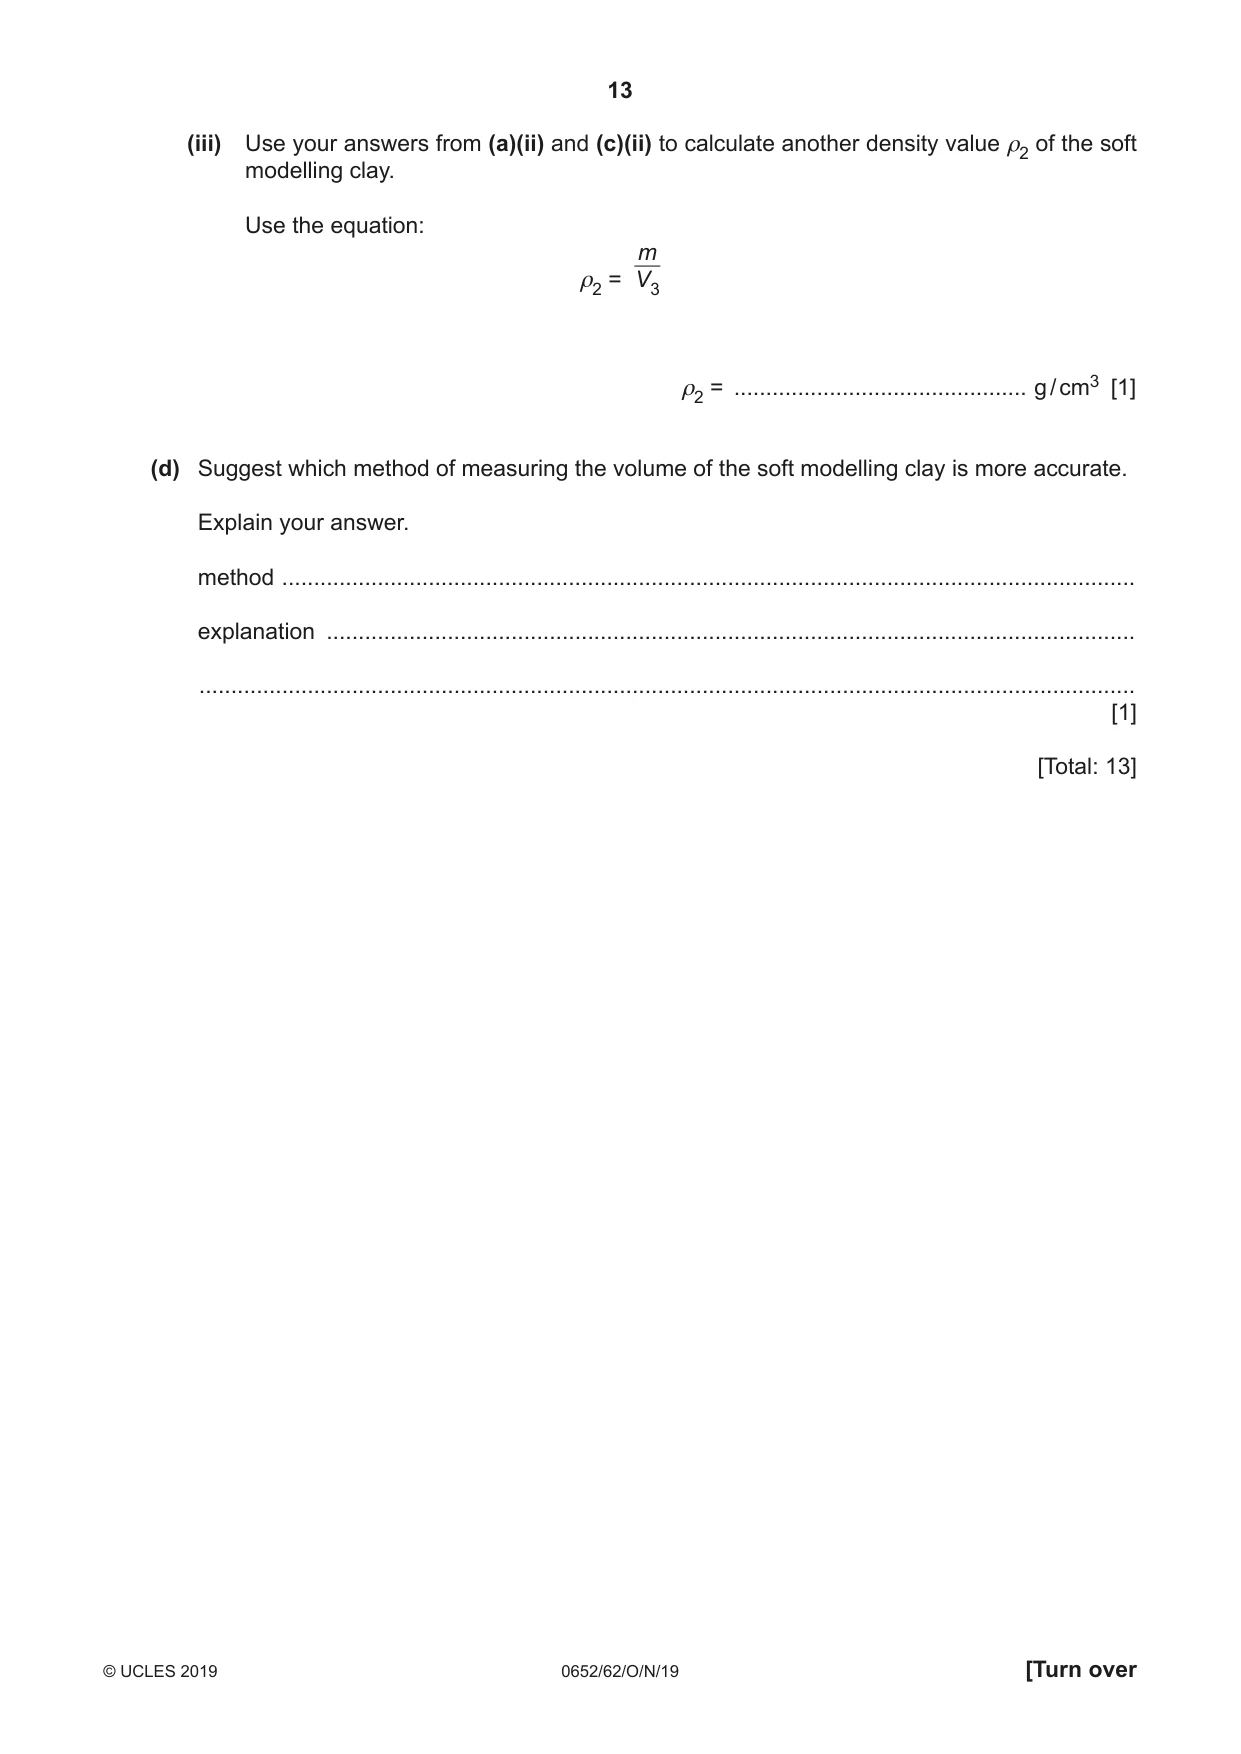
3 A student calculates the density of soft modelling clay. She uses two different methods to find the volume. (a) Finding the mass • She models the clay into a disc shape approximately 5 cm in diameter. • She places the disc on the metre rule so that its centre is at the 10.0 cm mark as shown in Fig. 3.1. • She places a pivot under the 50.0 cm mark on the rule. • She adjusts the position of the 50.0 g mass until the rule is balanced. soft modelling 50.0 g mass clay 50.0 cm mark metre rule 0 cm 100 cm 10.0 cm P Fig. 3.1 (i) Fig. 3.2 shows the position of the 50.0 g mass on the metre rule when balanced. 50.0 g mass metre rule 76 77 78 79 80 8182 83 84 P Fig. 3.2 Determine the position P of the centre of the 50.0 g mass as shown in Fig. 3.2. P = ................................................... cm [1] (ii) Calculate the mass m of the soft modelling clay. Use the equation: m = 1.25(P–50.0) m = ...................................................... g [1] (iii) It is difficult to obtain an accurate value of the mass of the modelling clay using this method. State one difficulty in this method. ........................................................................................................................................... ........................................................................................................................................... ..................................................................................................................................... [1] (b) Finding the volume – method 1 • She rolls the soft modelling clay into a ball. The ball is shown in Fig. 3.3. d1 Fig. 3.3 (i) Measure and record the diameter d1 of the ball. d1 = ................................................... cm [1] (ii) She uses wooden blocks to help her measure the diameter of the ball more accurately. Draw a labelled diagram to show how the wooden blocks are used for this purpose. [1] (iii) She takes two more readings in order to calculate an average. Her measurements are shown below. d2 = 3.2 cm d3 = 3.1 cm Use your value of d1 from part (b)(i) and the values of d2 and d3 to calculate dav, the average of the three diameter measurements d1, d2 and d3. dav = ................................................... cm [1] (iv) Calculate the volume V1 of the soft modelling clay. Use the equation: V1 = 0.52dav3 Give your answer to a suitable number of significant figures. V1 = .................................................. cm3 [2] (v) Use your values from (a)(ii) and (b)(iv) to calculate the density ρ1 of the modelling clay. Use the equation: m ρ1 = V1 ρ1 = .............................................. g / cm3 [1] (c) Finding the volume – method 2 The student then performs a different procedure to work out the volume of the soft modelling clay in order to calculate the density. • She fills a measuring cylinder with 50.0 cm3 of water. • She submerges the soft modelling clay ball into the water, as shown in Fig. 3.4. 90 80 measuring 70 cylinder 60 50 40 soft modelling 30 clay 20 10 0 Fig. 3.4 (i) Record the new volume V2 shown by the new water level on Fig. 3.4. V2 = .................................................. cm3 [1] (ii) Calculate volume V3 of the soft modelling clay. Use the equation: V3 = V2 – 50.0 V3 = .................................................. cm3 [1] (iii) Use your answers from (a)(ii) and (c)(ii) to calculate another density value ρ2 of the soft modelling clay. Use the equation: m ρ2 = V3 ρ2 = .............................................. g / cm3 [1] (d) Suggest which method of measuring the volume of the soft modelling clay is more accurate. Explain your answer. method ...................................................................................................................................... explanation ............................................................................................................................... ................................................................................................................................................... [1] [Total: 13]
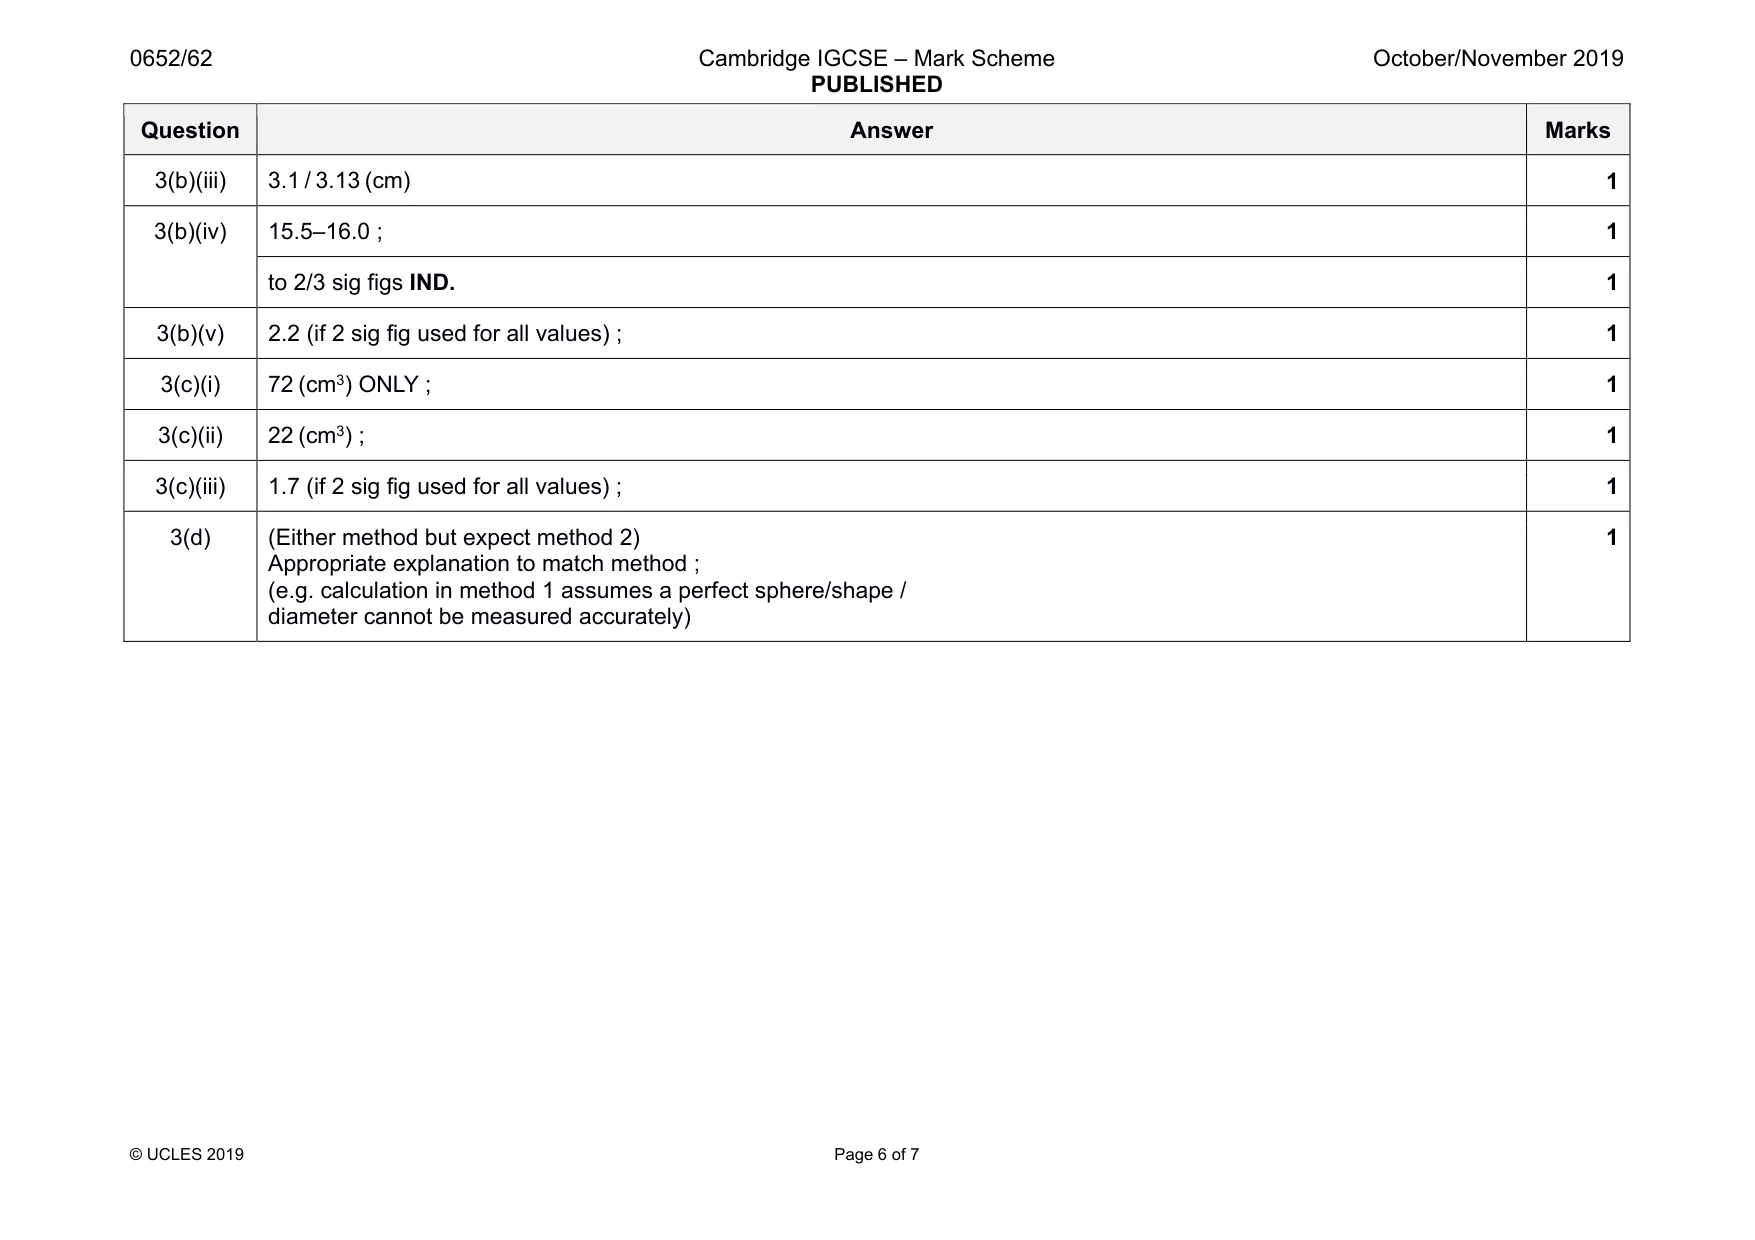
Mark scheme: 3(a)(i) 80(.0) (cm) ONLY ; 1 3(a)(ii) 38 / 37.5 (g) ; 1 3(a)(iii) 1 from: difficult to ensure rule is perfectly balanced ; difficult to keep pivot under 50 cm mark / pivot slips ; centre of mass / gravity of rule not at 50 cm mark ; cannot see / read the marks on the rule ; centre of mass of soft modelling clay may not be exactly on 10 cm mark ; difficult to find centre of 50g mass ; 1 3(b)(i) 3.1 (cm) ONLY ; 1 3(b)(ii) diagram showing wooden blocks touching both sides of soft modelling clay ball ; 1 Question Answer Marks 3(b)(iii) 3.1 / 3.13 (cm) 1 3(b)(iv) 15.5–16.0 ; 1 to 2/3 sig figs IND. 1 3(b)(v) 2.2 (if 2 sig fig used for all values) ; 1 3(c)(i) 72 (cm3) ONLY ; 1 3(c)(ii) 22 (cm3) ; 1 3(c)(iii) 1.7 (if 2 sig fig used for all values) ; 1 3(d) (Either method but expect method 2) Appropriate explanation to match method ; (e.g. calculation in method 1 assumes a perfect sphere/shape / diameter cannot be measured accurately) 1
Q4 · A student investigates how the length of a pendulum affects its period
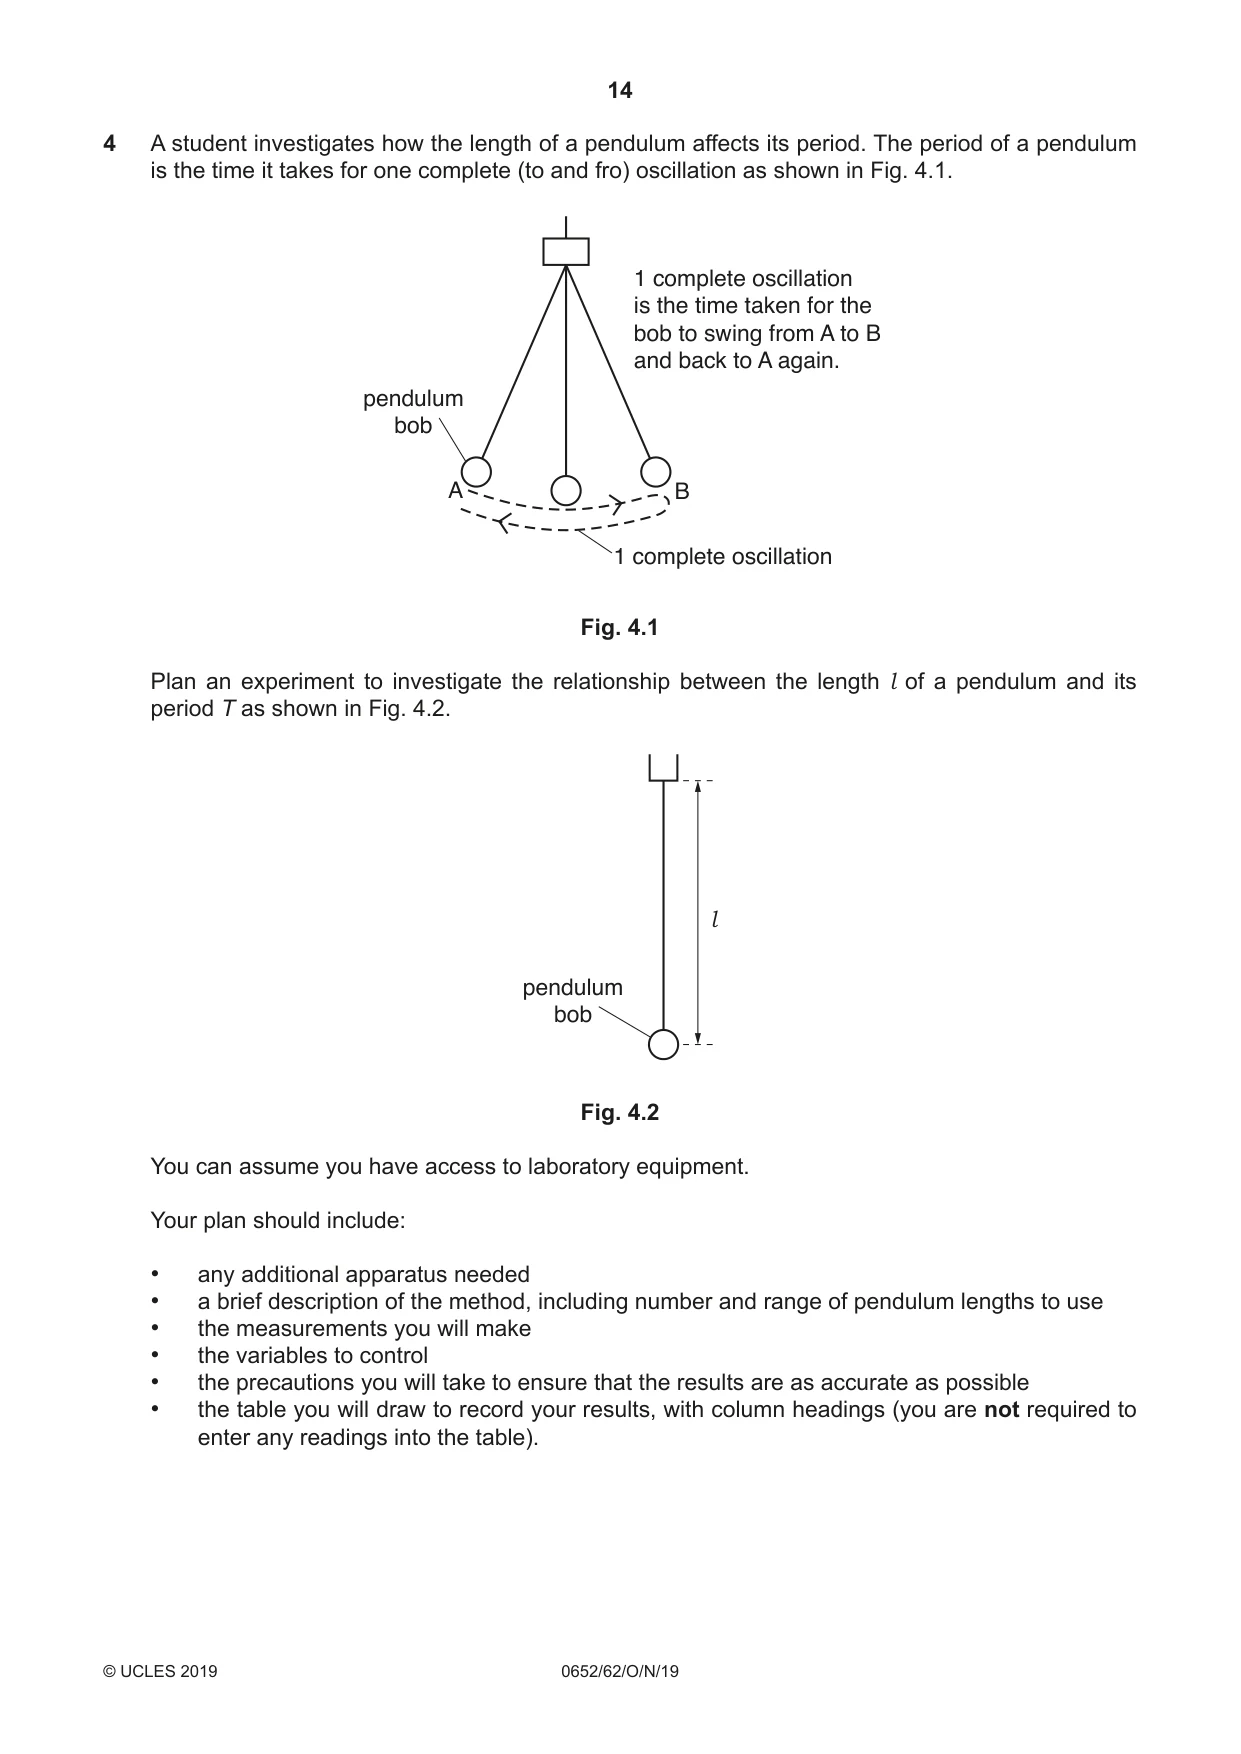
4 A student investigates how the length of a pendulum affects its period. The period of a pendulum is the time it takes for one complete (to and fro) oscillation as shown in Fig. 4.1. 1 complete oscillation is the time taken for the bob to swing from A to B and back to A again. pendulum bob A B 1 complete oscillation Fig. 4.1 Plan an experiment to investigate the relationship between the length l of a pendulum and its period T as shown in Fig. 4.2. l pendulum bob Fig. 4.2 You can assume you have access to laboratory equipment. Your plan should include: • any additional apparatus needed • a brief description of the method, including number and range of pendulum lengths to use • the measurements you will make • the variables to control • the precautions you will take to ensure that the results are as accurate as possible • the table you will draw to record your results, with column headings (you are not required to enter any readings into the table). A diagram is not required but you may draw one if it helps to explain your plan. .......................................................................................................................................................... .......................................................................................................................................................... .......................................................................................................................................................... .......................................................................................................................................................... .......................................................................................................................................................... .......................................................................................................................................................... .......................................................................................................................................................... .......................................................................................................................................................... .......................................................................................................................................................... .......................................................................................................................................................... .......................................................................................................................................................... .......................................................................................................................................................... .......................................................................................................................................................... .......................................................................................................................................................... .......................................................................................................................................................... .......................................................................................................................................................... .......................................................................................................................................................... .......................................................................................................................................................... .......................................................................................................................................................... .......................................................................................................................................................... .......................................................................................................................................................... .......................................................................................................................................................... .......................................................................................................................................................... .......................................................................................................................................................... .......................................................................................................................................................... .......................................................................................................................................................... .......................................................................................................................................................... .......................................................................................................................................................... .......................................................................................................................................................... .......................................................................................................................................................... .......................................................................................................................................................... .......................................................................................................................................................... .......................................................................................................................................................... .......................................................................................................................................................... .......................................................................................................................................................... .......................................................................................................................................................... .......................................................................................................................................................... .......................................................................................................................................................... .......................................................................................................................................................... .................................................................................................................................................... [7]
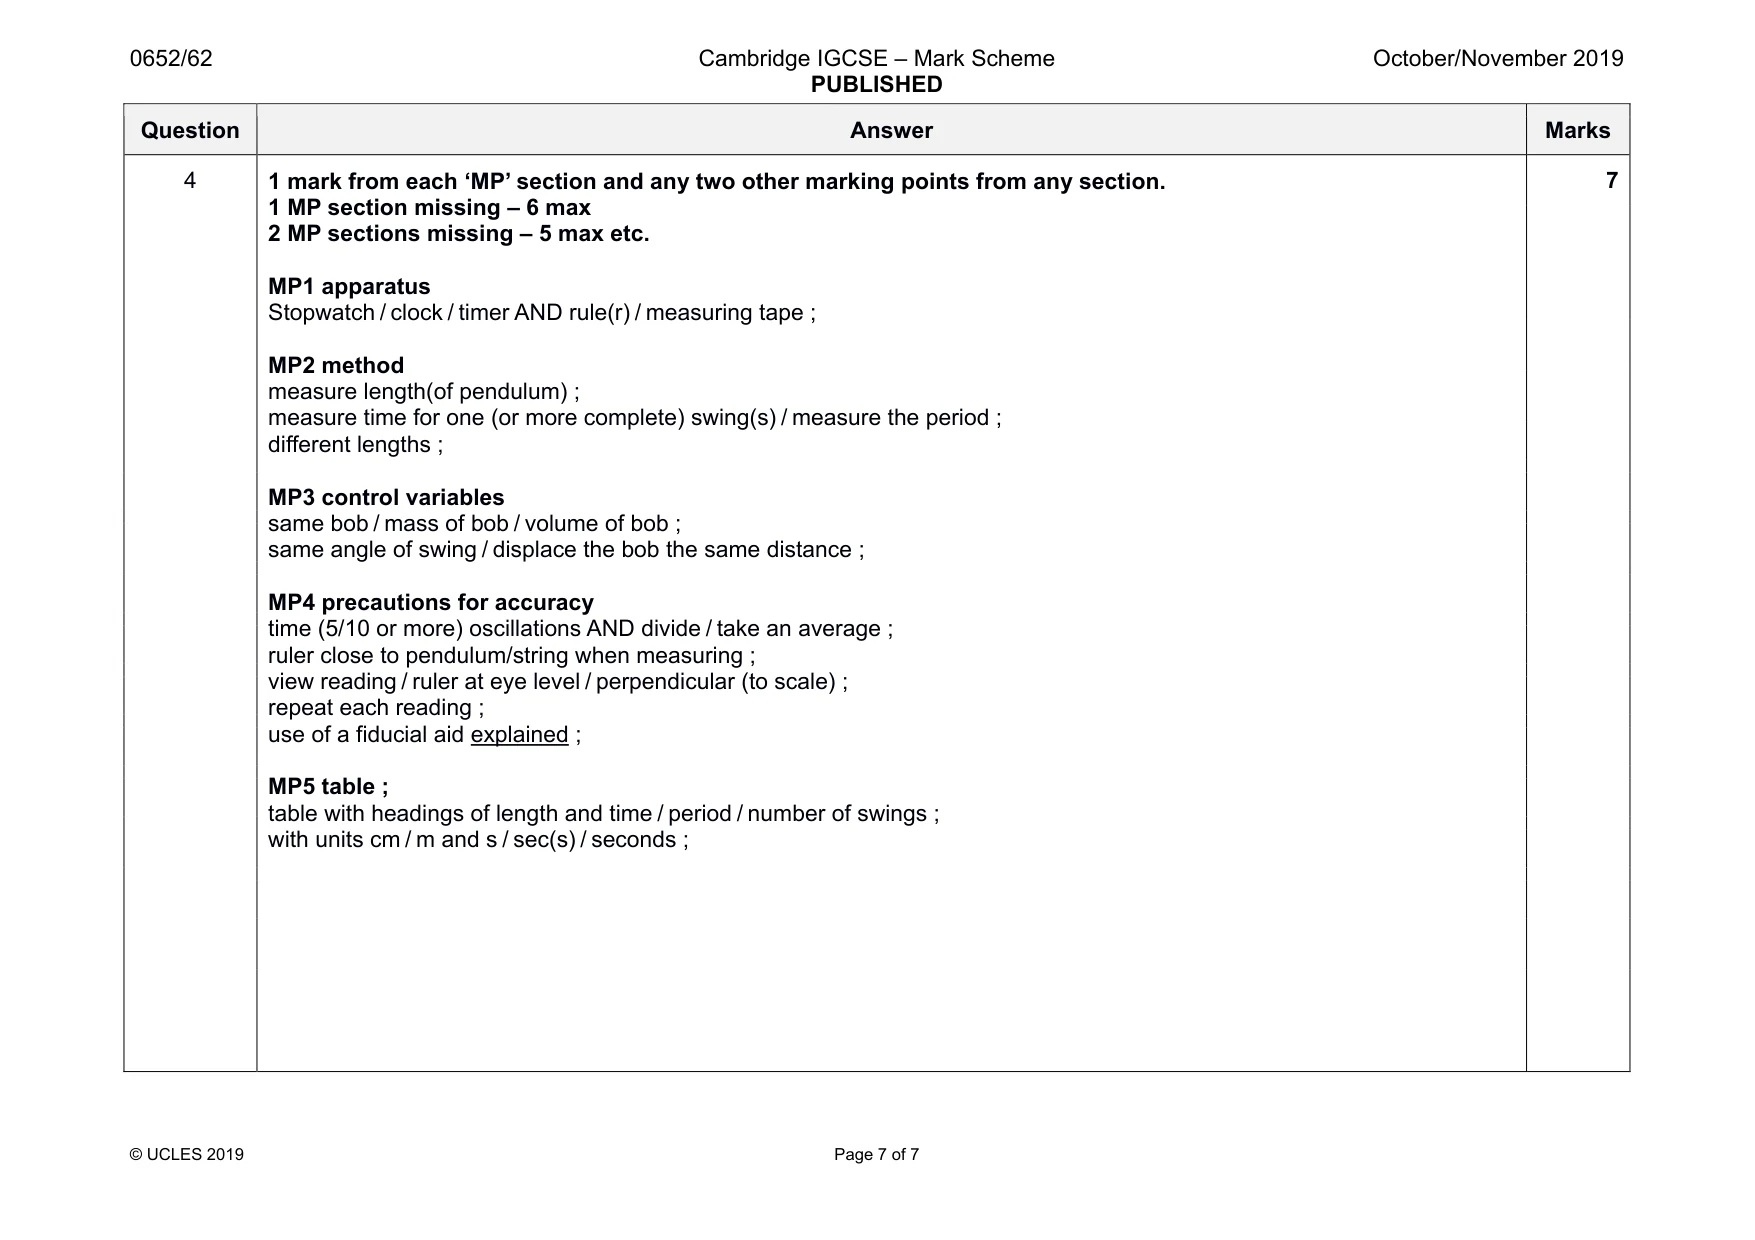
Mark scheme: 4 1 mark from each ‘MP’ section and any two other marking points from any section. 1 MP section missing – 6 max 2 MP sections missing – 5 max etc. MP1 apparatus Stopwatch / clock / timer AND rule(r) / measuring tape ; MP2 method measure length(of pendulum) ; measure time for one (or more complete) swing(s) / measure the period ; different lengths ; MP3 control variables same bob / mass of bob / volume of bob ; same angle of swing / displace the bob the same distance ; MP4 precautions for accuracy time (5/10 or more) oscillations AND divide / take an average ; ruler close to pendulum/string when measuring ; view reading / ruler at eye level / perpendicular (to scale) ; repeat each reading ; use of a fiducial aid explained ; MP5 table ; table with headings of length and time / period / number of swings ; with units cm / m and s / sec(s) / seconds ; 7
What was in this paper
The subtopics covered by these 4 questions, and how many questions each got. Open one in a new tab to see every Cambridge question on it.
What you needed in this session
Cambridge’s own grade thresholds for 2019 Oct/Nov, Paper 6 · Variant 2. A higher threshold means an easier paper — the bar moves with how the cohort did.