Cambridge IGCSE Physical Science 0652 — 2023 Oct/Nov Paper 6 · Variant 2
0652/62/O/N/23 · 4 questions · 40 marks · ≈45 min
The question paper and its mark scheme, free to read here and free to download. This is Cambridge’s own paper, exactly as it was sat.
Question paper16 pages




Mark scheme8 pages
Answers below. Sit the paper first if you are practising.
Questions as text
Q1 · A student investigates the amount of precipitate formed when aqueous sodium carbonate…
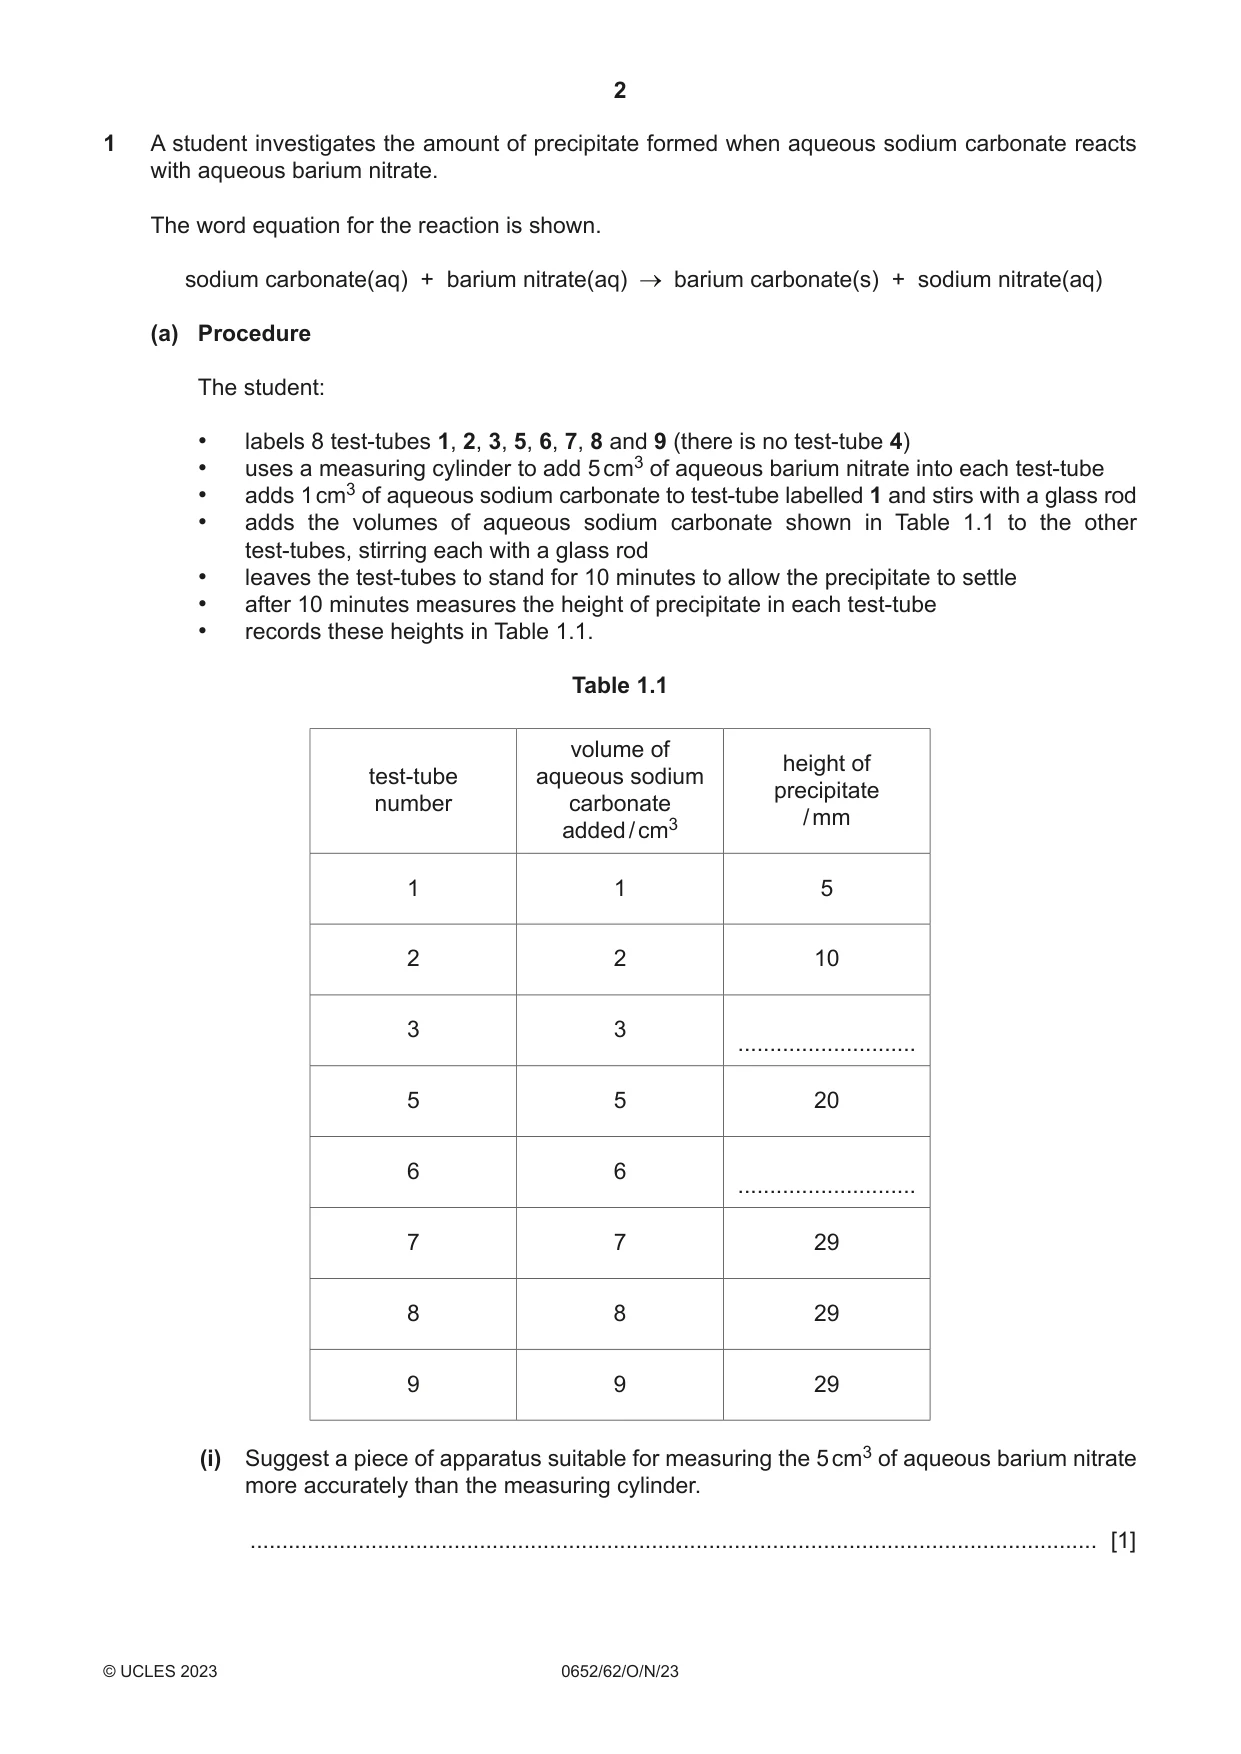
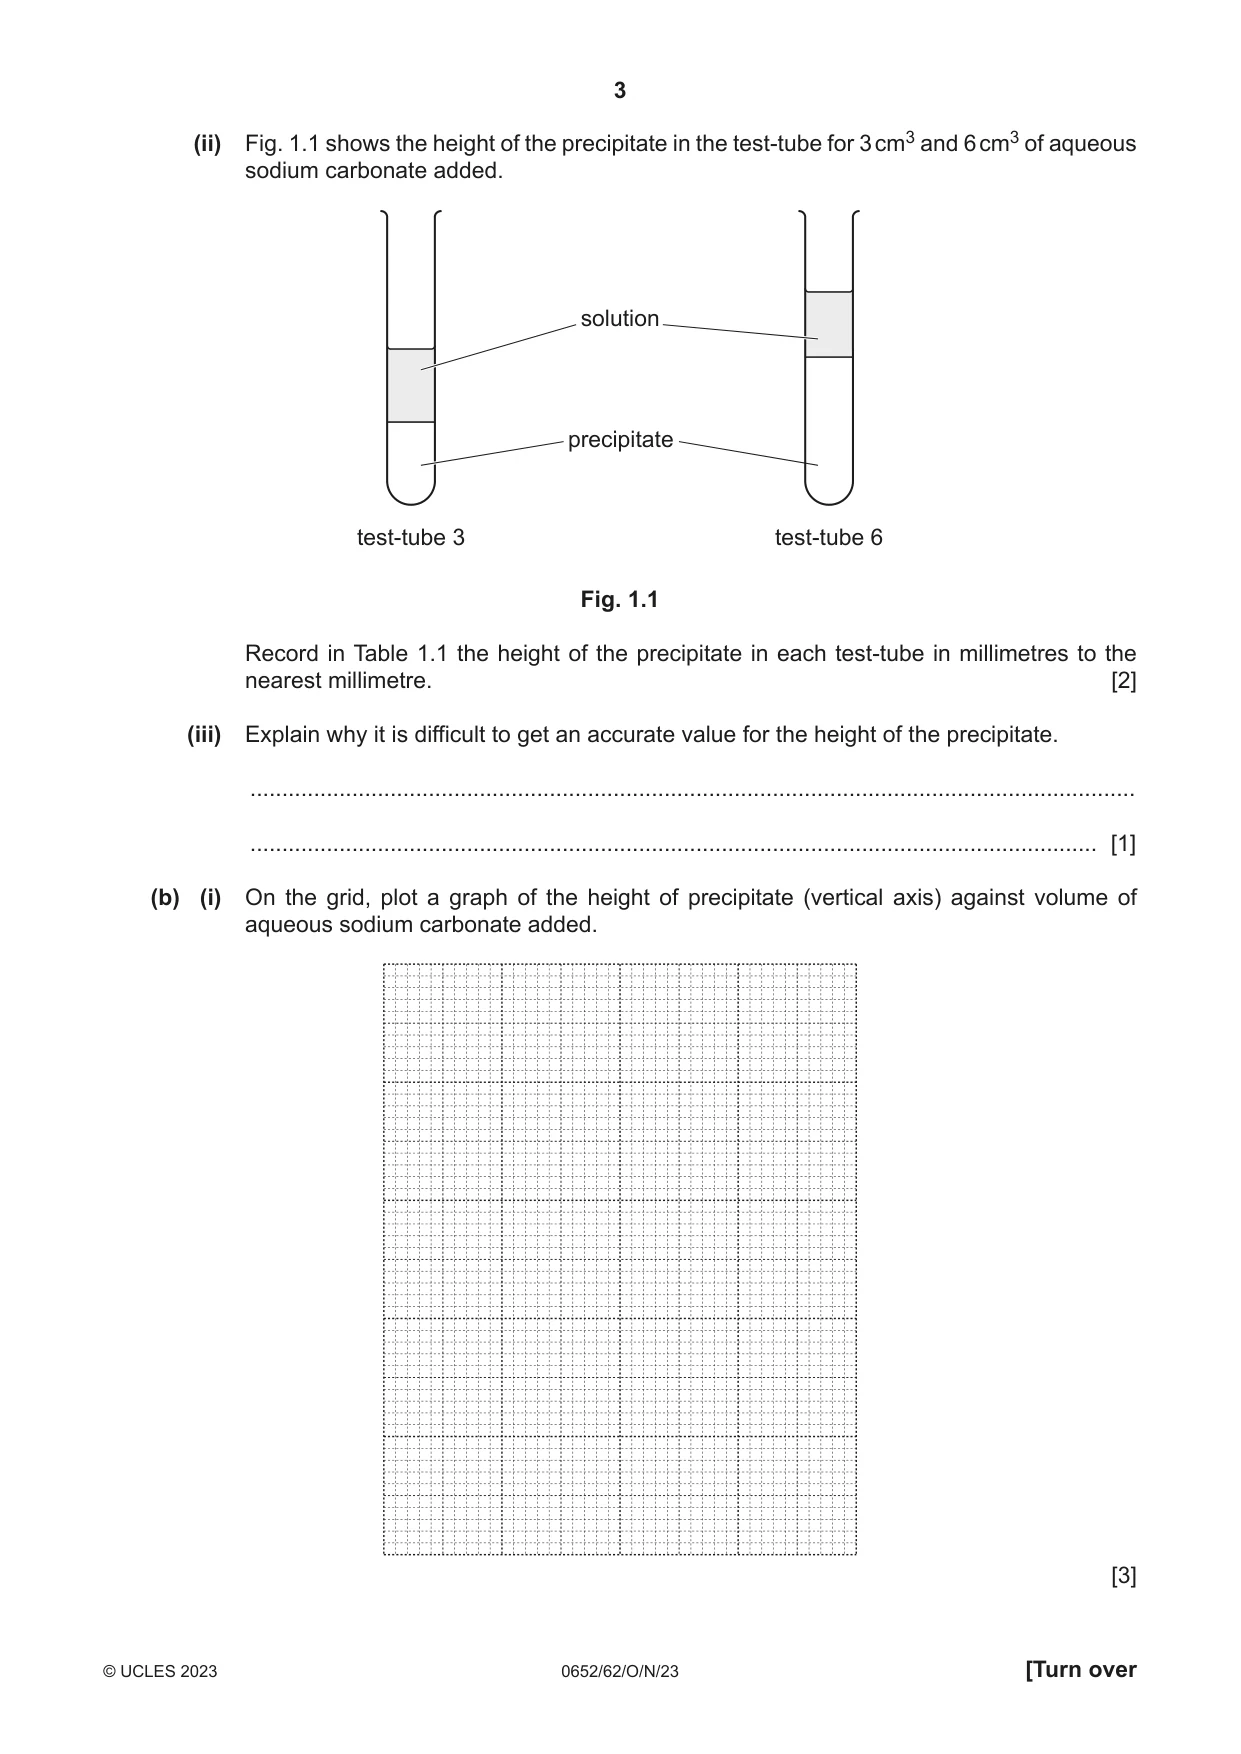
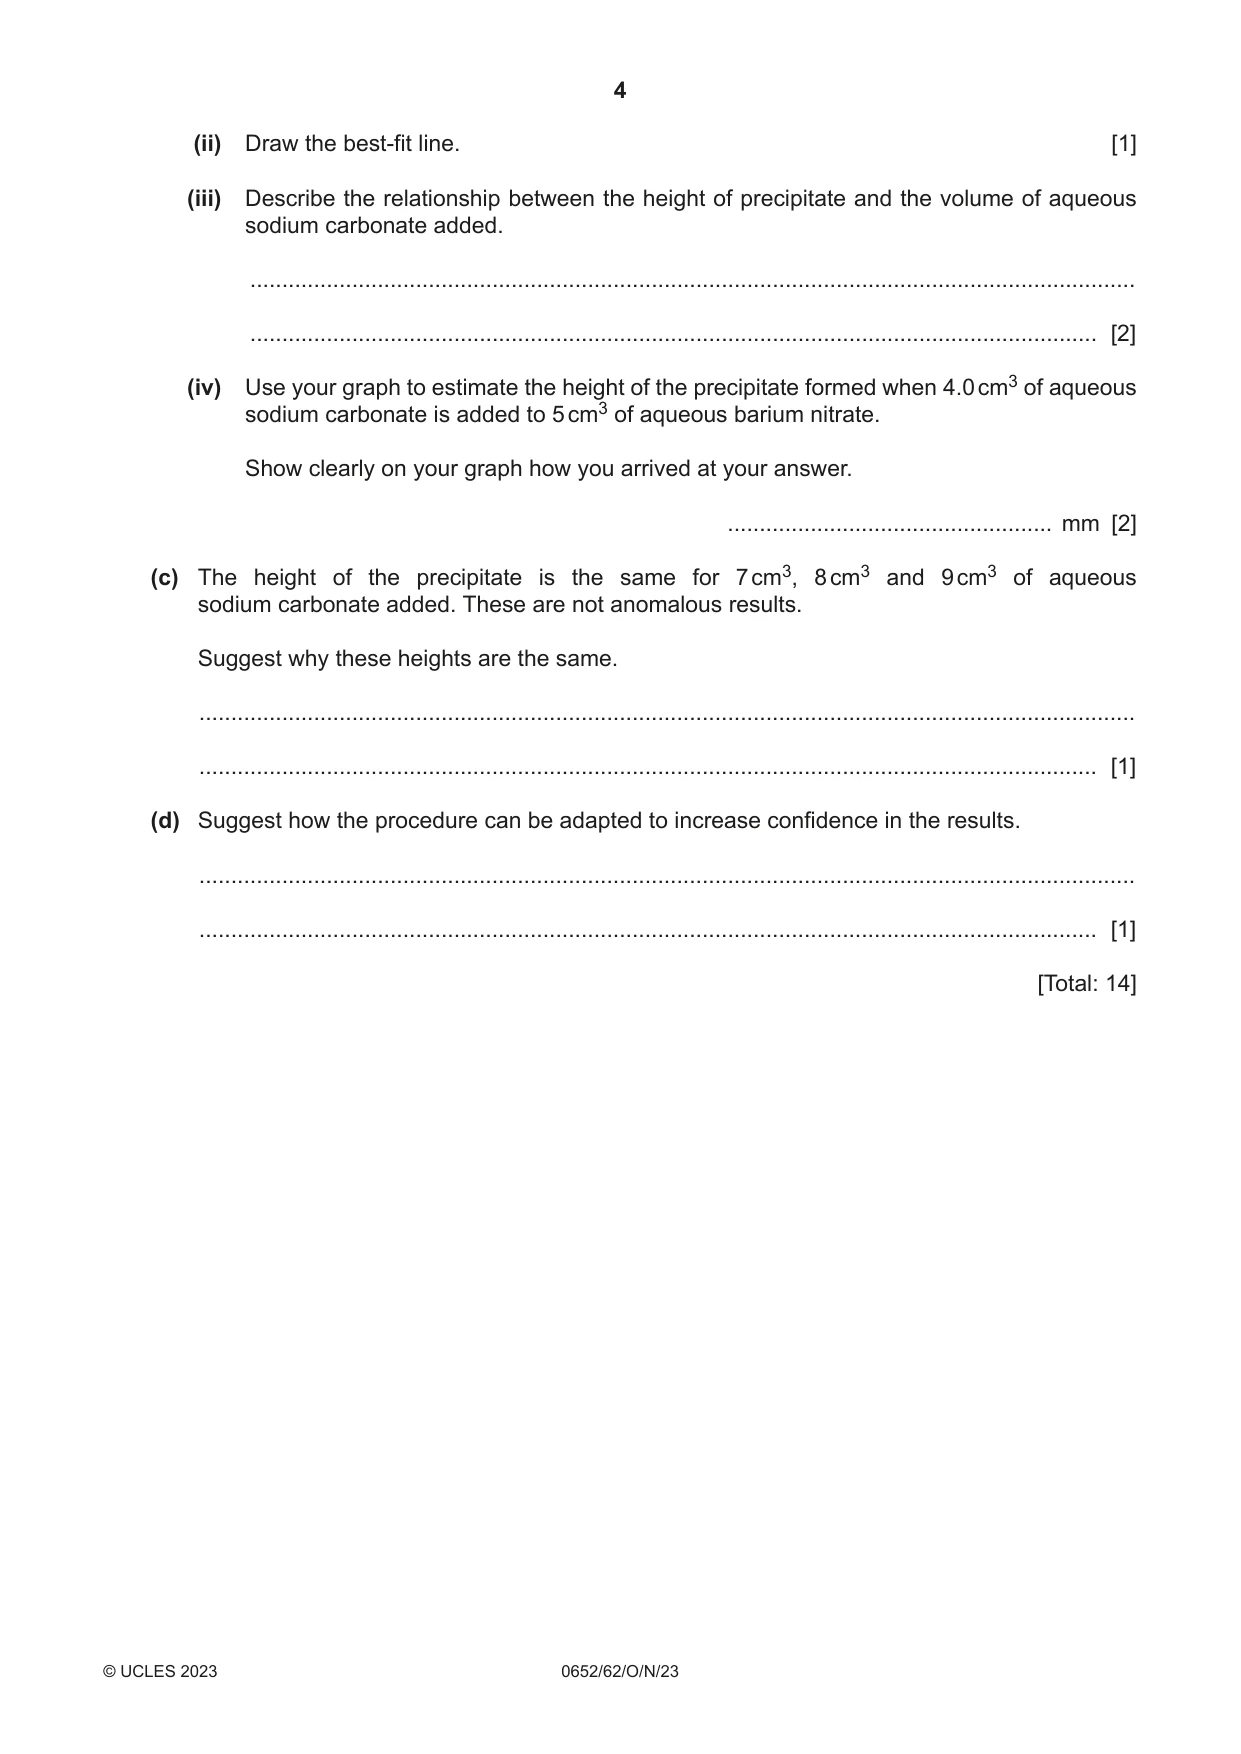
1 A student investigates the amount of precipitate formed when aqueous sodium carbonate reacts with aqueous barium nitrate. The word equation for the reaction is shown. sodium carbonate(aq) + barium nitrate(aq) barium carbonate(s) + sodium nitrate(aq) (a) Procedure The student: • labels 8 test-tubes 1, 2, 3, 5, 6, 7, 8 and 9 (there is no test-tube 4) • uses a measuring cylinder to add 5 cm3 of aqueous barium nitrate into each test-tube • adds 1 cm3 of aqueous sodium carbonate to test-tube labelled 1 and stirs with a glass rod • adds the volumes of aqueous sodium carbonate shown in Table 1.1 to the other test-tubes, stirring each with a glass rod • leaves the test-tubes to stand for 10 minutes to allow the precipitate to settle • after 10 minutes measures the height of precipitate in each test-tube • records these heights in Table 1.1. Table 1.1 volume of height of test-tube aqueous sodium precipitate number carbonate / mm added / cm3 1 1 5 2 2 10 3 3 ............................ 5 5 20 6 6 ............................ 7 7 29 8 8 29 9 9 29 (i) Suggest a piece of apparatus suitable for measuring the 5 cm3 of aqueous barium nitrate more accurately than the measuring cylinder. ..................................................................................................................................... [1] (ii) Fig. 1.1 shows the height of the precipitate in the test-tube for 3 cm3 and 6 cm3 of aqueous sodium carbonate added. solution precipitate test-tube 3 test-tube 6 Fig. 1.1 Record in Table 1.1 the height of the precipitate in each test-tube in millimetres to the nearest millimetre. [2] (iii) Explain why it is difficult to get an accurate value for the height of the precipitate. ........................................................................................................................................... ..................................................................................................................................... [1] (b) (i) On the grid, plot a graph of the height of precipitate (vertical axis) against volume of aqueous sodium carbonate added. [3] (ii) Draw the best-fit line. [1] (iii) Describe the relationship between the height of precipitate and the volume of aqueous sodium carbonate added. ........................................................................................................................................... ..................................................................................................................................... [2] (iv) Use your graph to estimate the height of the precipitate formed when 4.0 cm3 of aqueous sodium carbonate is added to 5 cm3 of aqueous barium nitrate. Show clearly on your graph how you arrived at your answer. ................................................... mm [2] (c) The height of the precipitate is the same for 7 cm3, 8 cm3 and 9 cm3 of aqueous sodium carbonate added. These are not anomalous results. Suggest why these heights are the same. ................................................................................................................................................... ............................................................................................................................................. [1] (d) Suggest how the procedure can be adapted to increase confidence in the results. ................................................................................................................................................... ............................................................................................................................................. [1] [Total: 14]
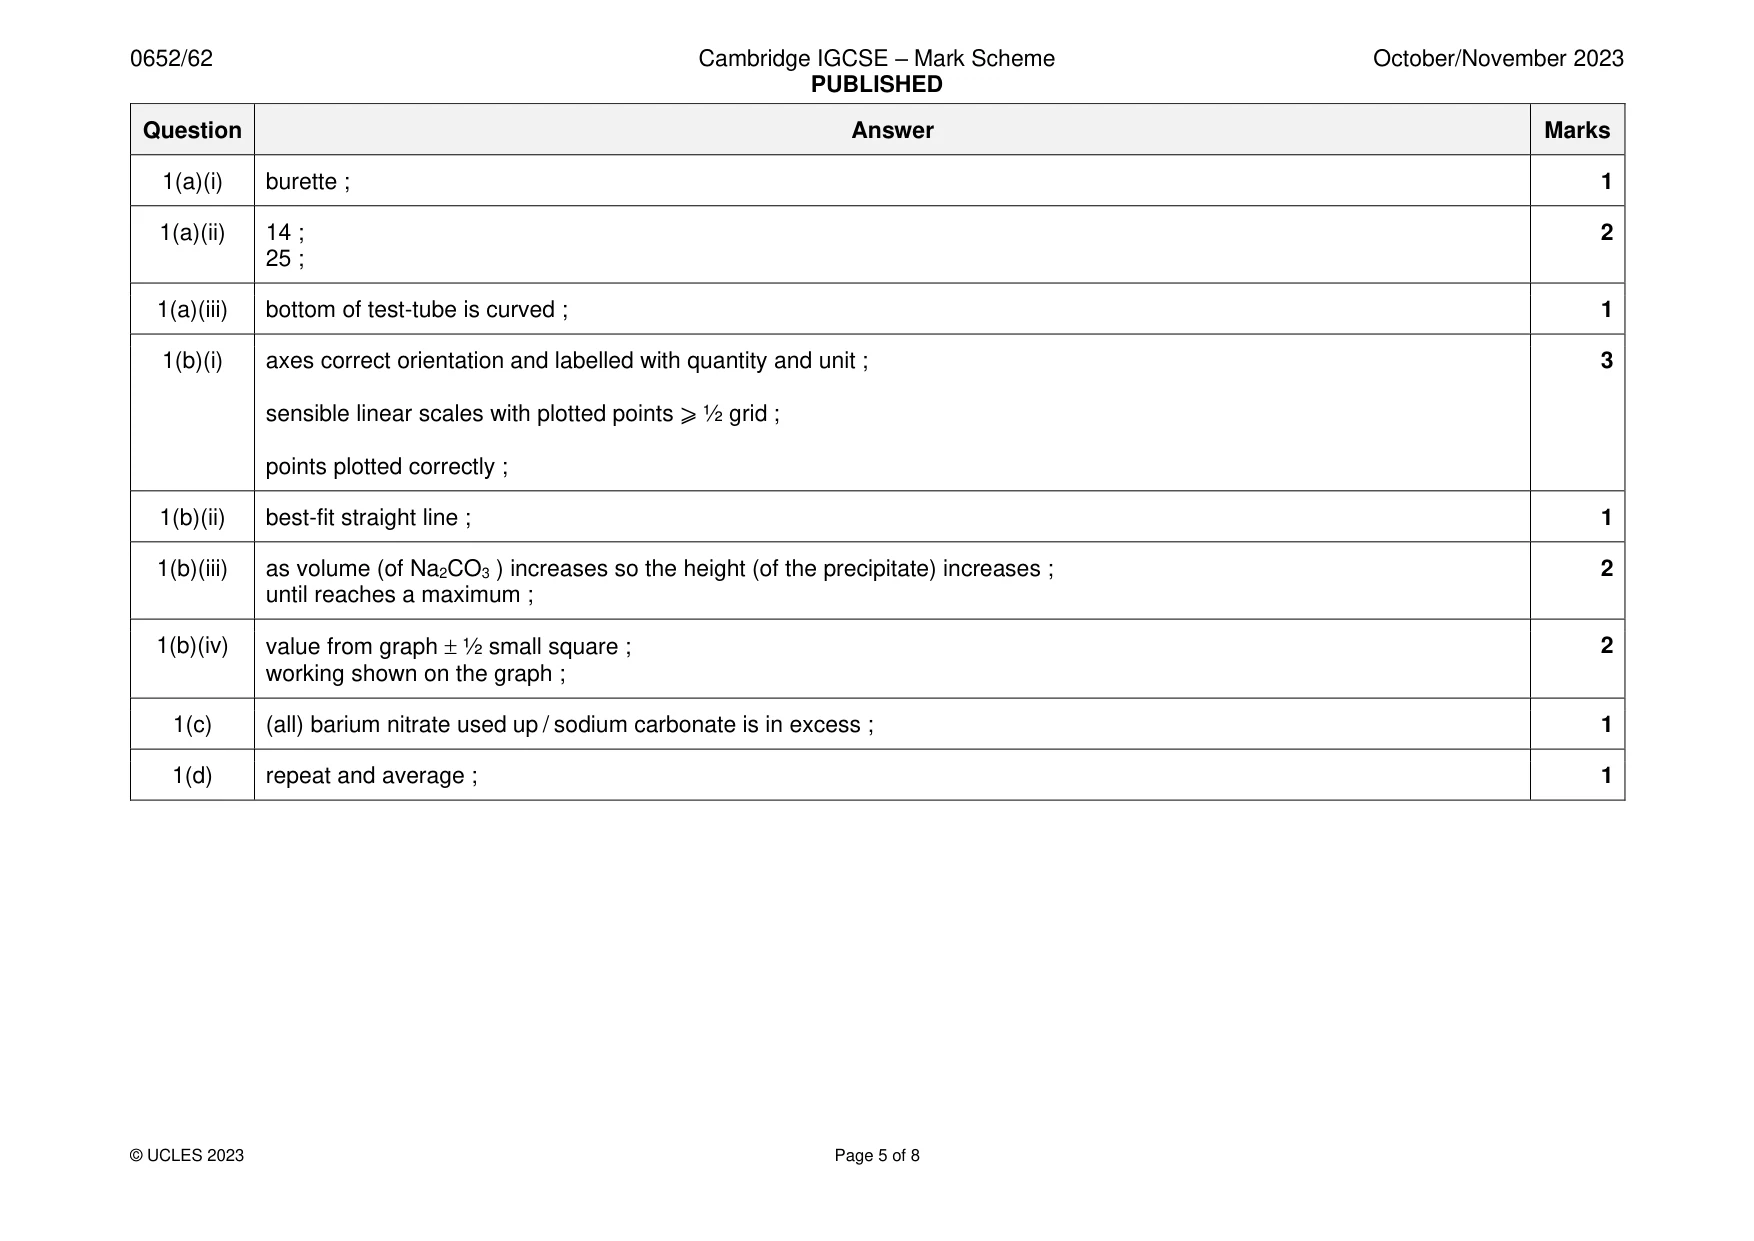
Mark scheme: Question Answer Marks 1(a)(i) burette ; 1 1(a)(ii) 14 ; 2 25 ; 1(a)(iii) bottom of test-tube is curved ; 1 1(b)(i) axes correct orientation and labelled with quantity and unit ; 3 sensible linear scales with plotted points ⩾ ½ grid ; points plotted correctly ; 1(b)(ii) best-fit straight line ; 1 1(b)(iii) as volume (of Na2CO3 ) increases so the height (of the precipitate) increases ; 2 until reaches a maximum ; 1(b)(iv) value from graph ½ small square ; 2 working shown on the graph ; 1(c) (all) barium nitrate used up / sodium carbonate is in excess ; 1 1(d) repeat and average ; 1
Q2 · The student investigates further the reaction in Question 1
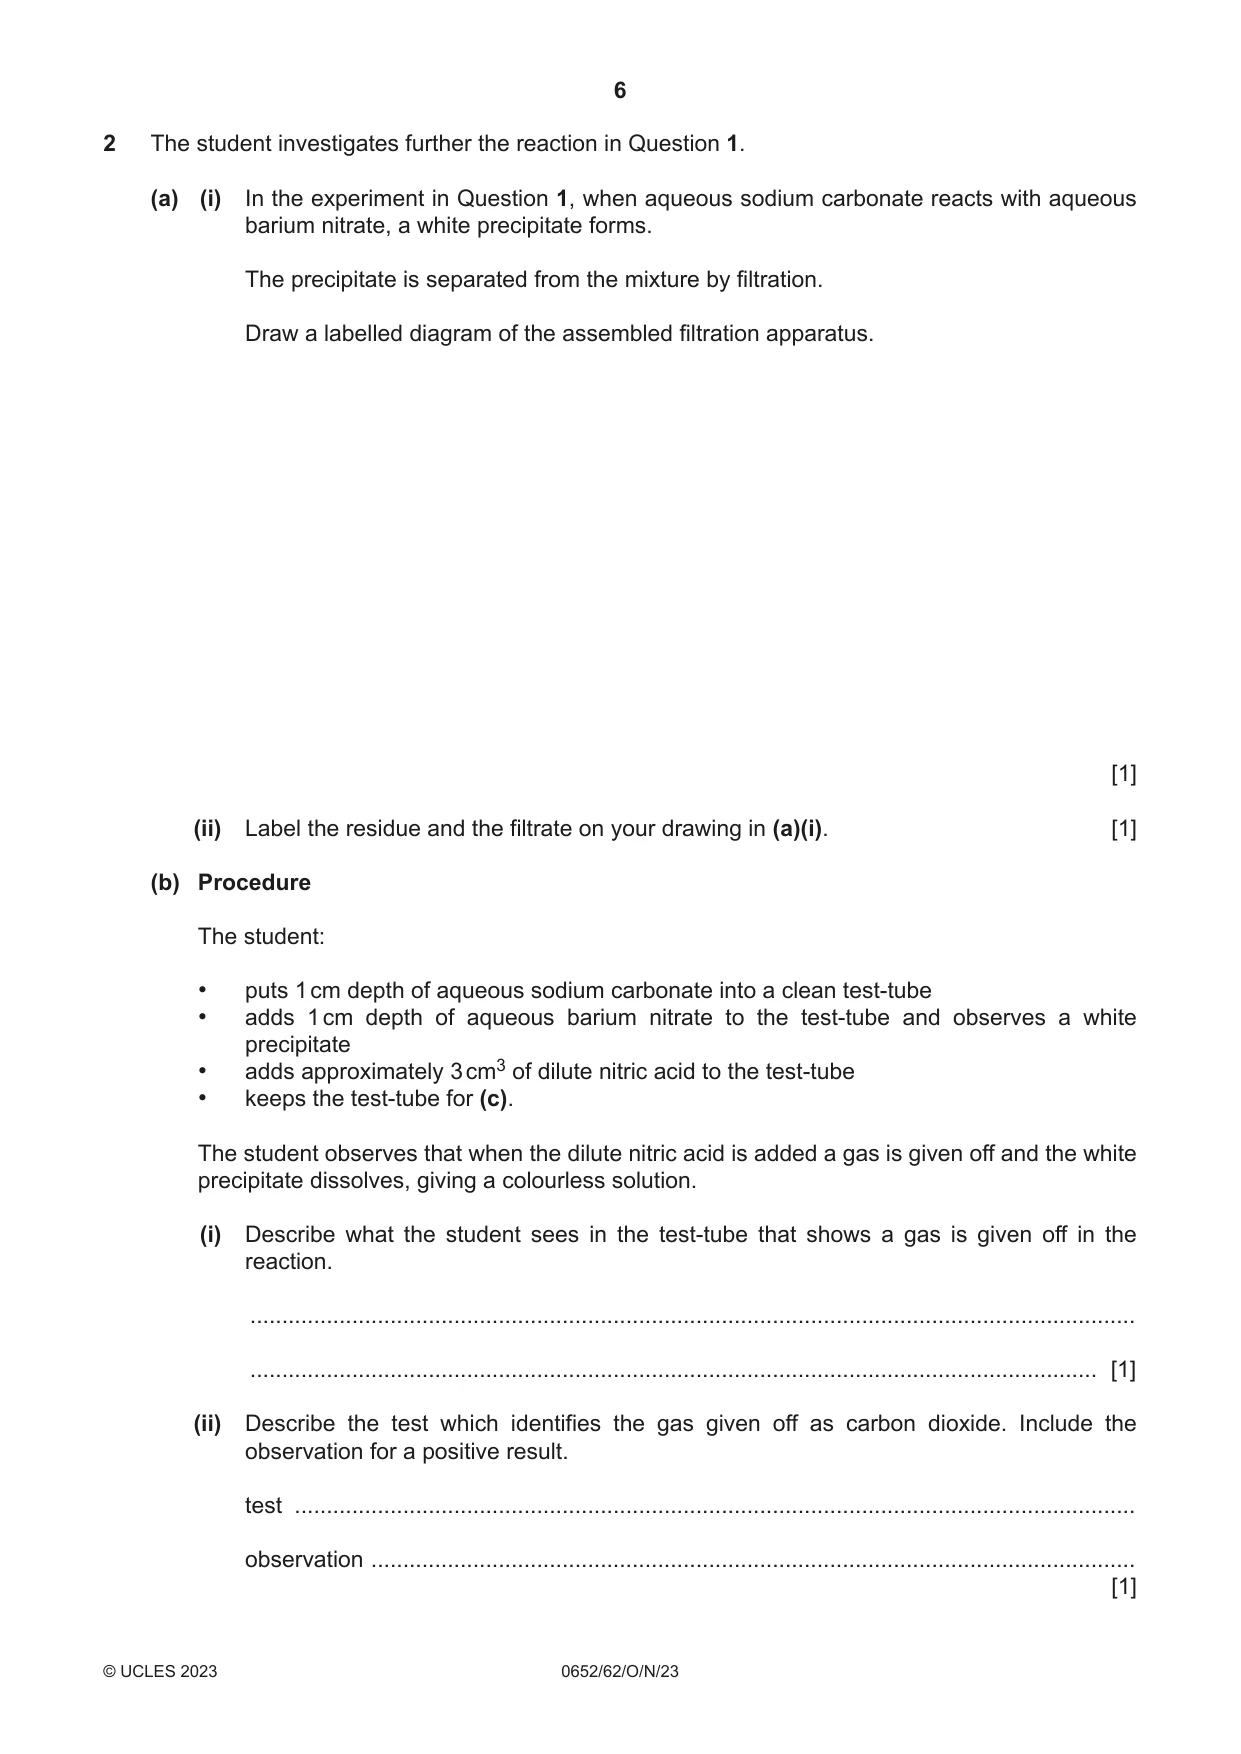
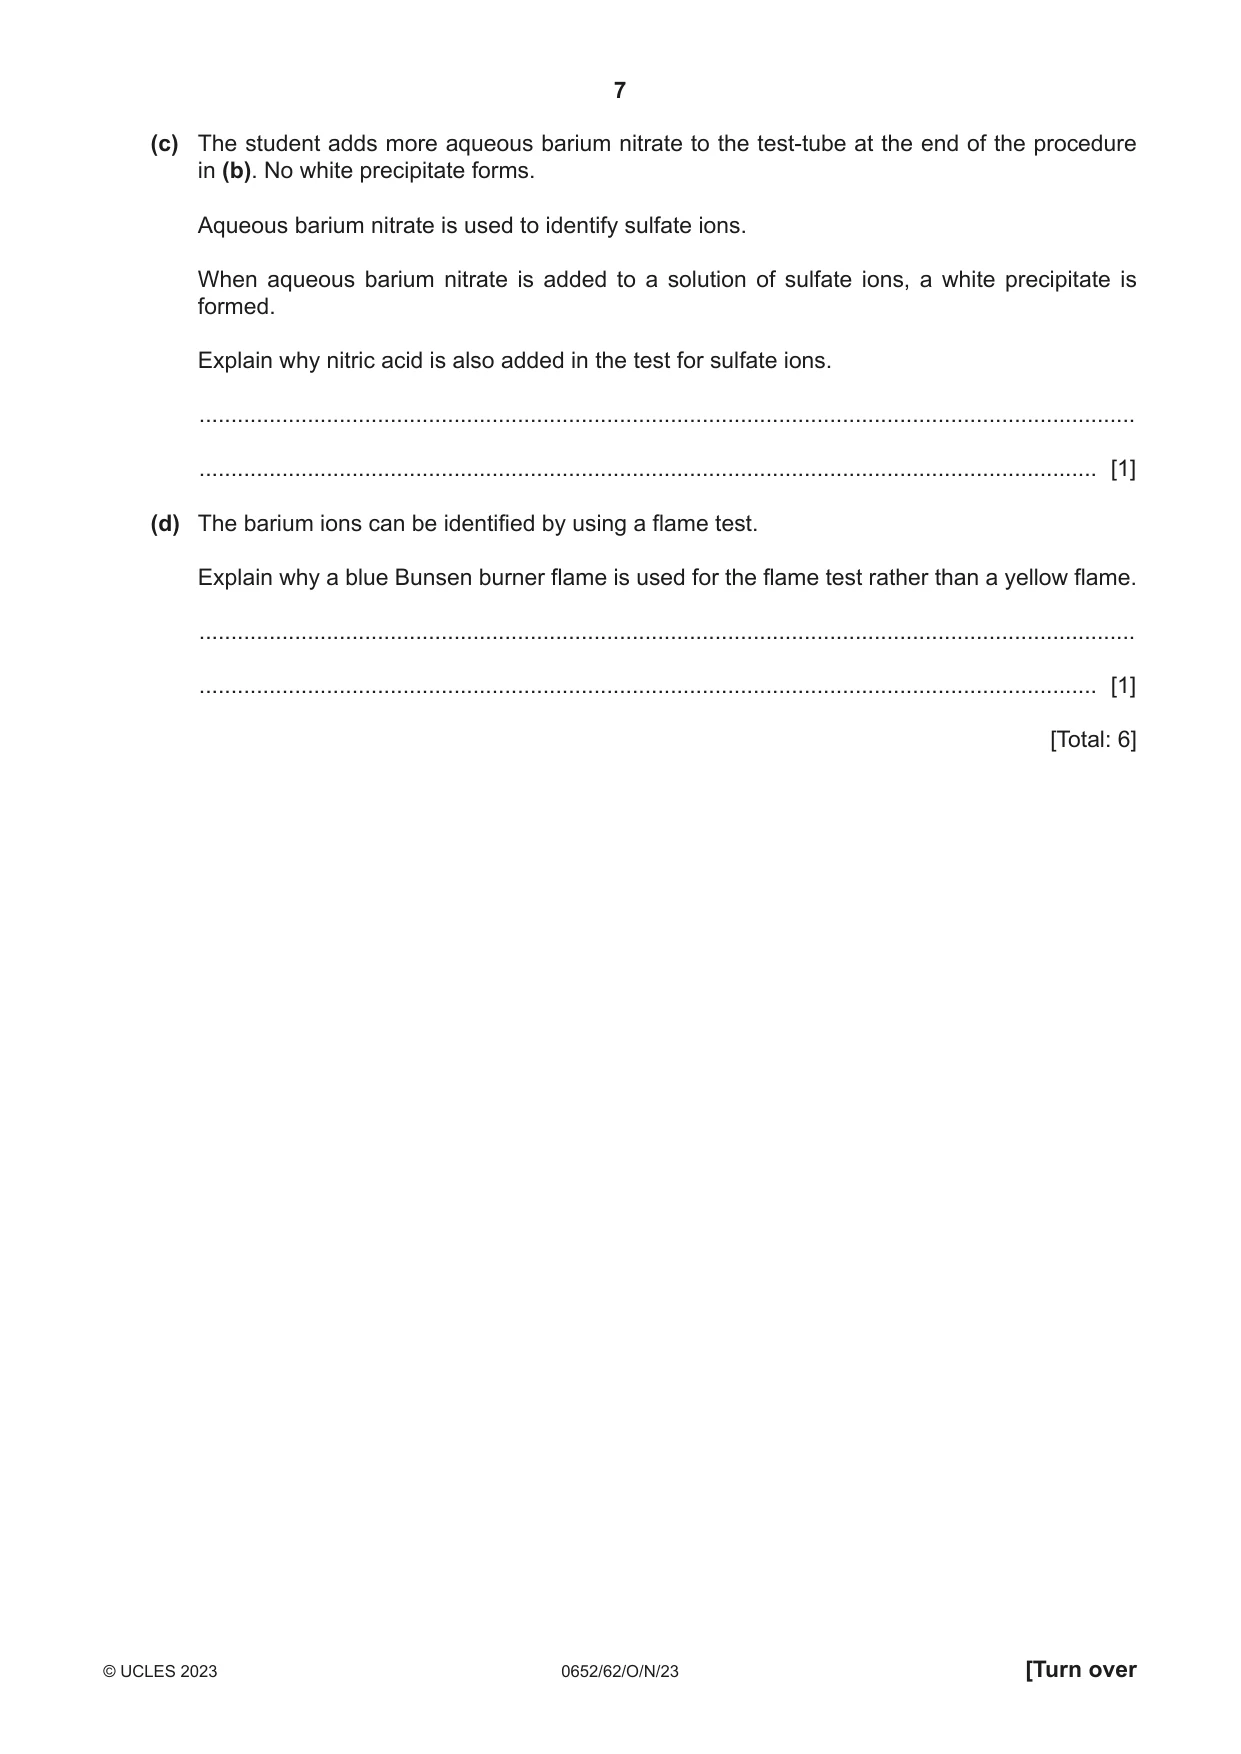
2 The student investigates further the reaction in Question 1. (a) (i) In the experiment in Question 1, when aqueous sodium carbonate reacts with aqueous barium nitrate, a white precipitate forms. The precipitate is separated from the mixture by filtration. Draw a labelled diagram of the assembled filtration apparatus. [1] (ii) Label the residue and the filtrate on your drawing in (a)(i). [1] (b) Procedure The student: • puts 1 cm depth of aqueous sodium carbonate into a clean test-tube • adds 1 cm depth of aqueous barium nitrate to the test-tube and observes a white precipitate • adds approximately 3 cm3 of dilute nitric acid to the test-tube • keeps the test-tube for (c). The student observes that when the dilute nitric acid is added a gas is given off and the white precipitate dissolves, giving a colourless solution. (i) Describe what the student sees in the test-tube that shows a gas is given off in the reaction. ........................................................................................................................................... ..................................................................................................................................... [1] (ii) Describe the test which identifies the gas given off as carbon dioxide. Include the observation for a positive result. test .................................................................................................................................... observation ........................................................................................................................ [1] (c) The student adds more aqueous barium nitrate to the test-tube at the end of the procedure in (b). No white precipitate forms. Aqueous barium nitrate is used to identify sulfate ions. When aqueous barium nitrate is added to a solution of sulfate ions, a white precipitate is formed. Explain why nitric acid is also added in the test for sulfate ions. ................................................................................................................................................... ............................................................................................................................................. [1] (d) The barium ions can be identified by using a flame test. Explain why a blue Bunsen burner flame is used for the flame test rather than a yellow flame. ................................................................................................................................................... ............................................................................................................................................. [1] [Total: 6]
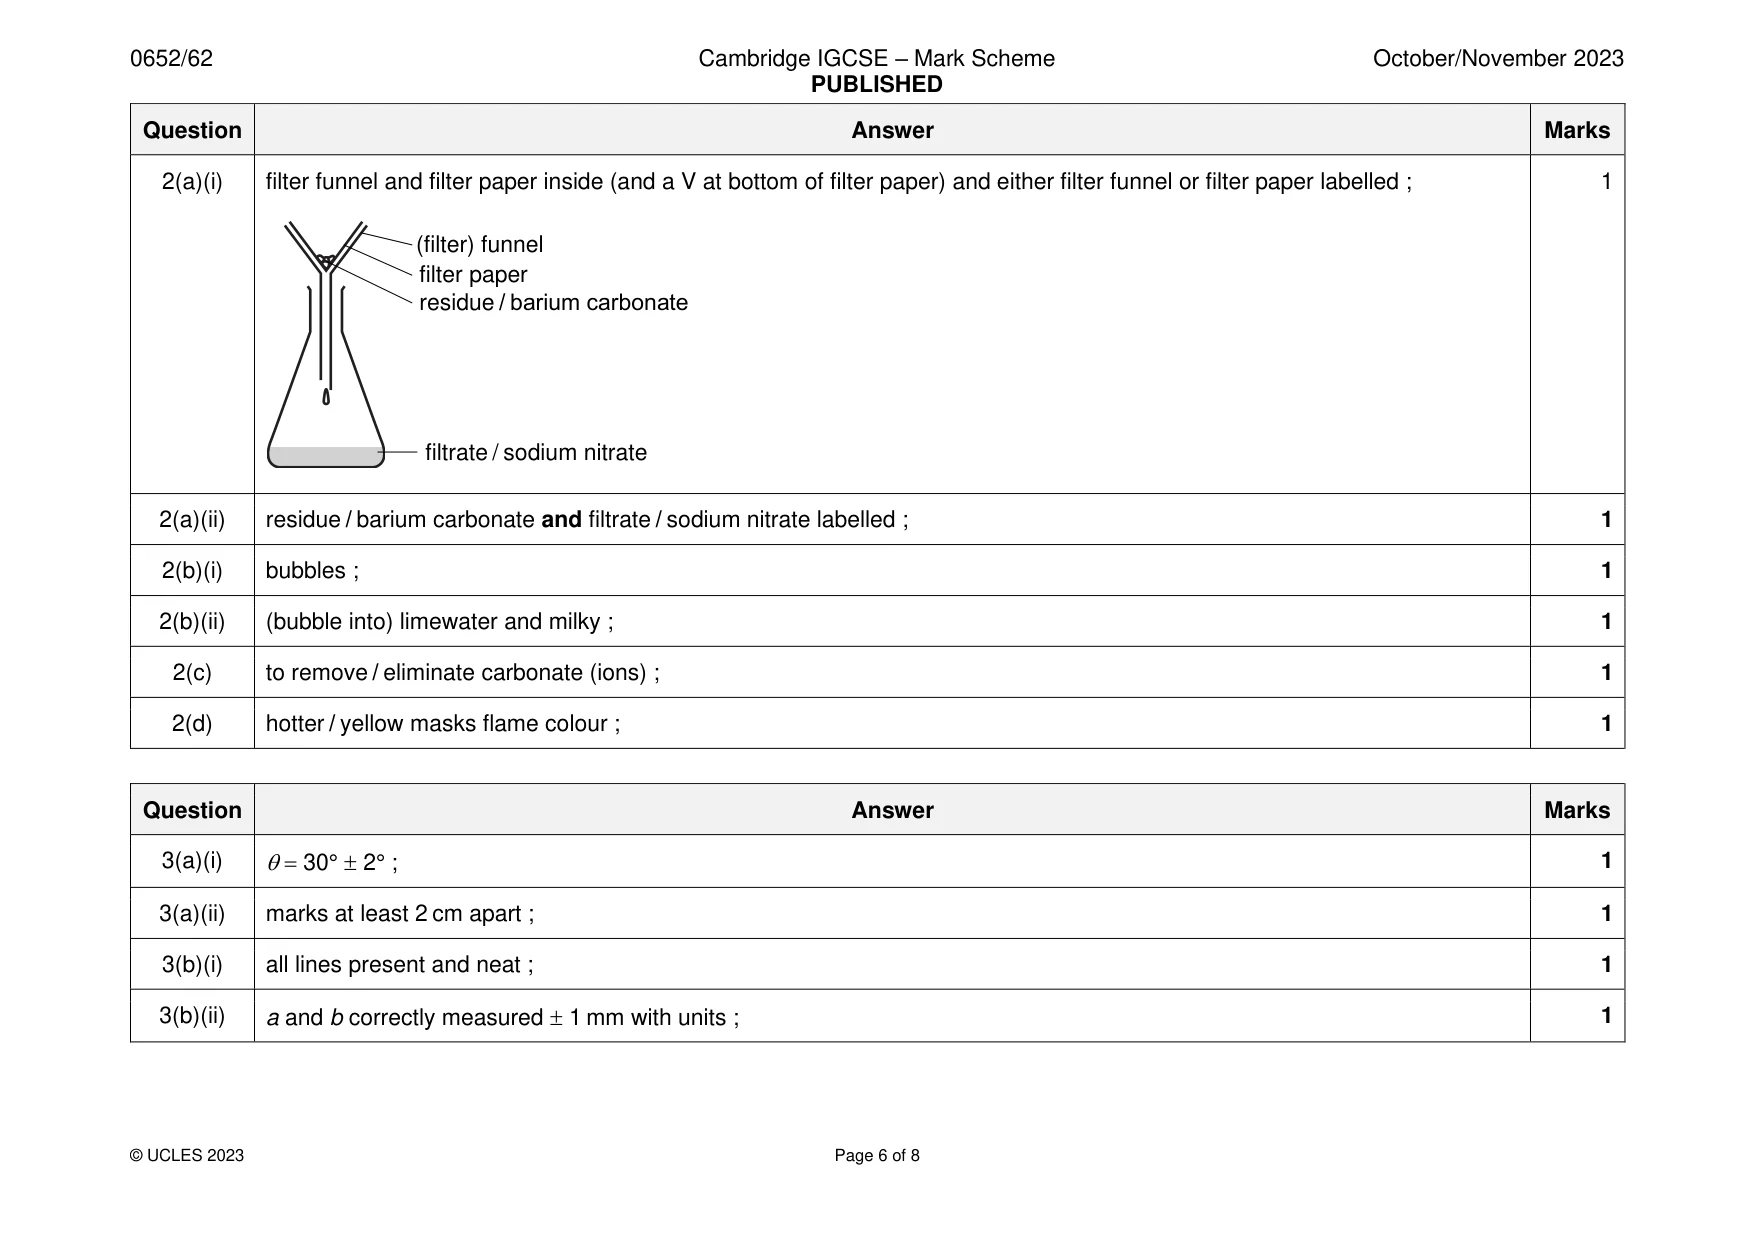
Mark scheme: 2(a)(i) filter funnel and filter paper inside (and a V at bottom of filter paper) and either filter funnel or filter paper labelled ; 1 (filter) funnel filter paper residue / barium carbonate filtrate / sodium nitrate 2(a)(ii) residue / barium carbonate and filtrate / sodium nitrate labelled ; 1 2(b)(i) bubbles ; 1 2(b)(ii) (bubble into) limewater and milky ; 1 2(c) to remove / eliminate carbonate (ions) ; 1 2(d) hotter / yellow masks flame colour ; 1
Q3 · Ht by a transparent block
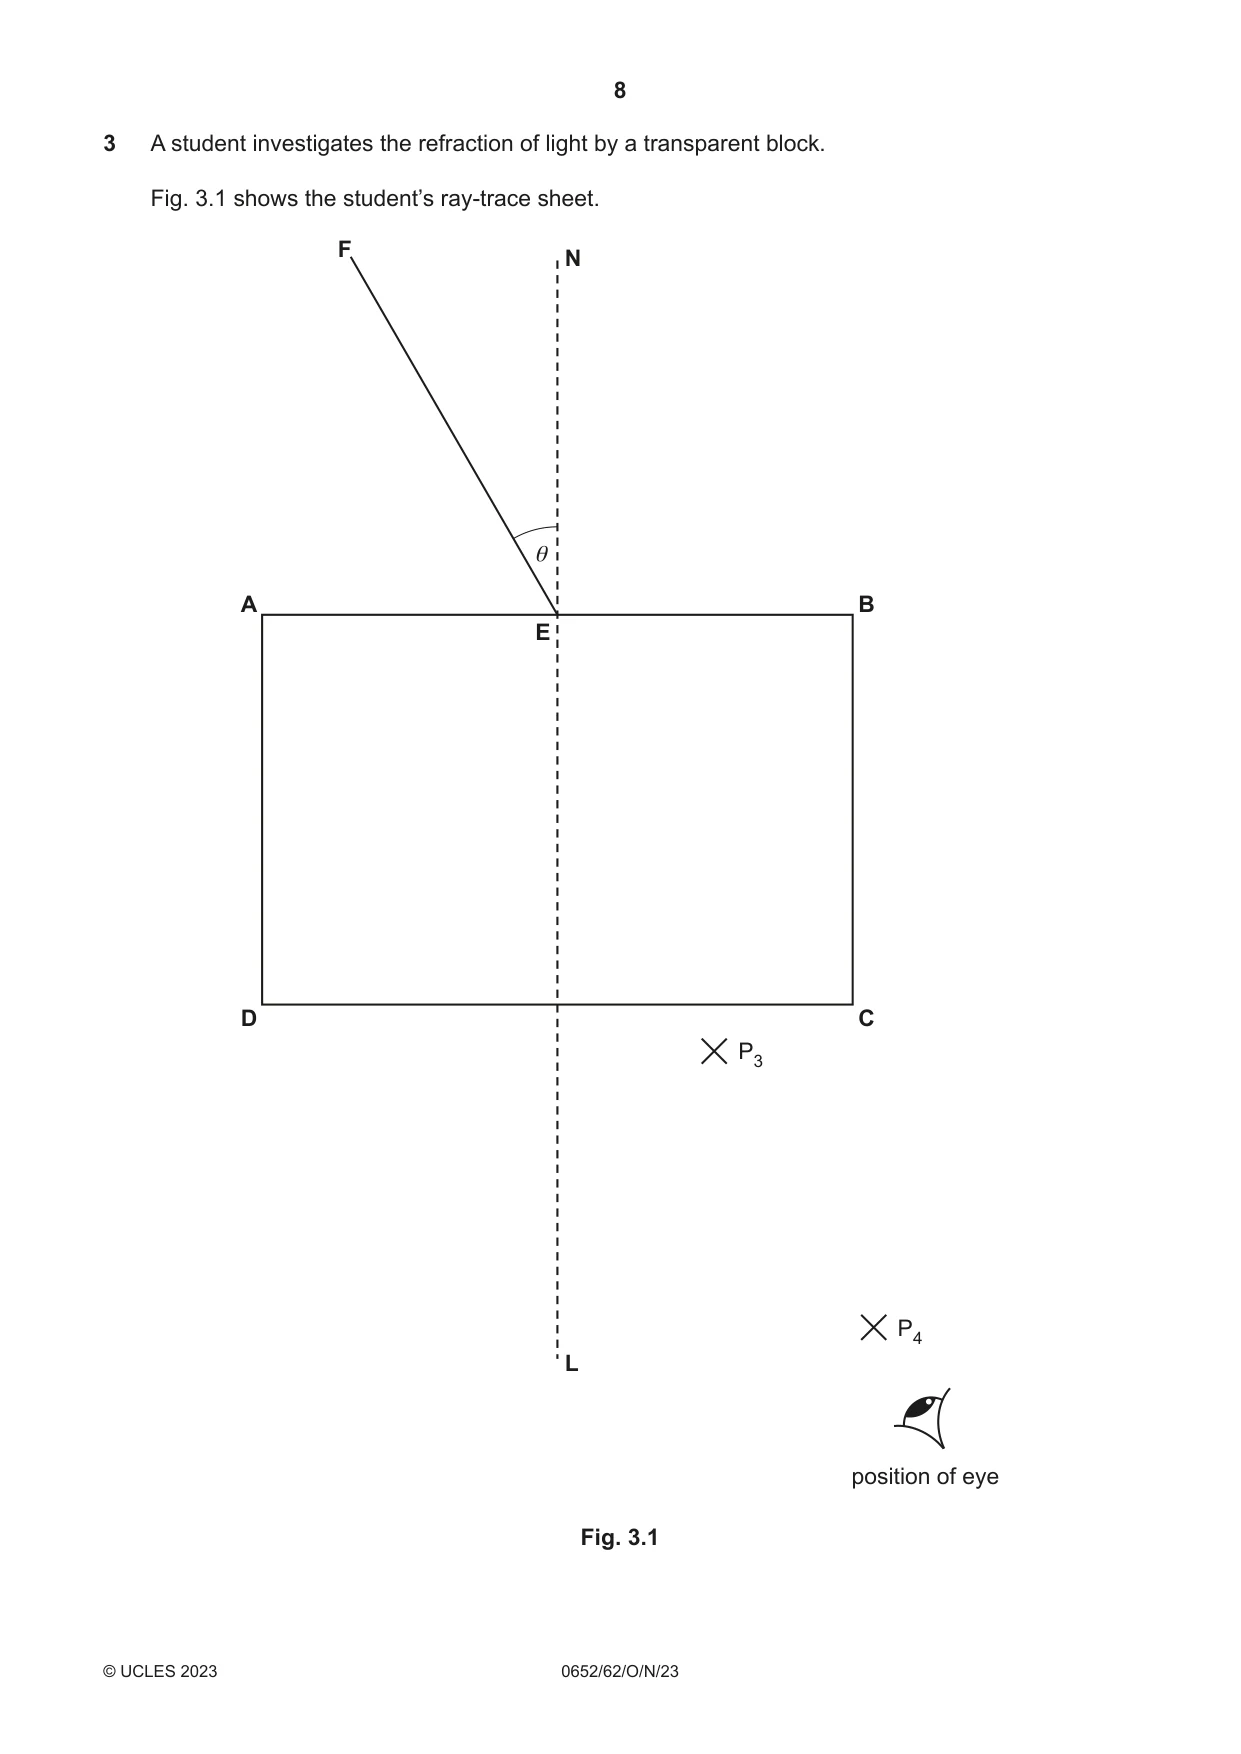
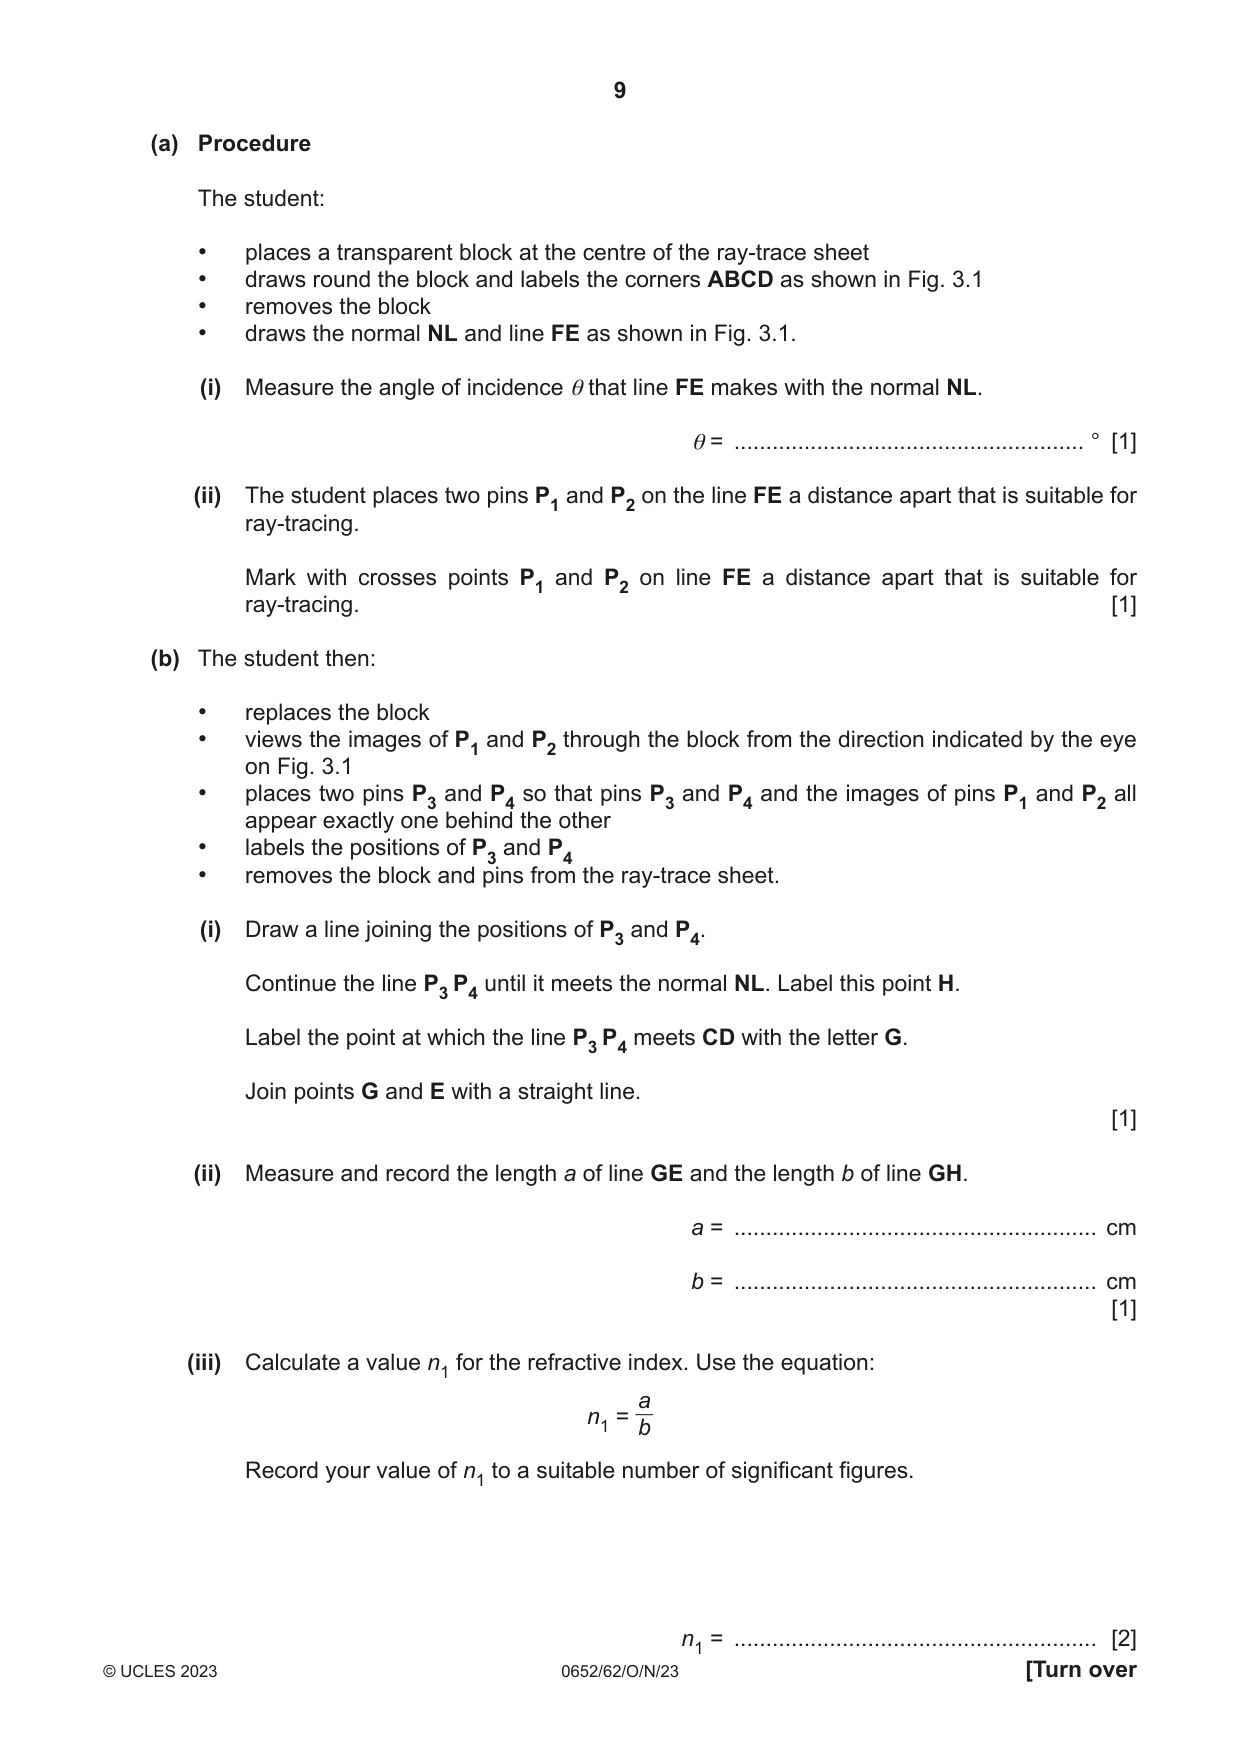
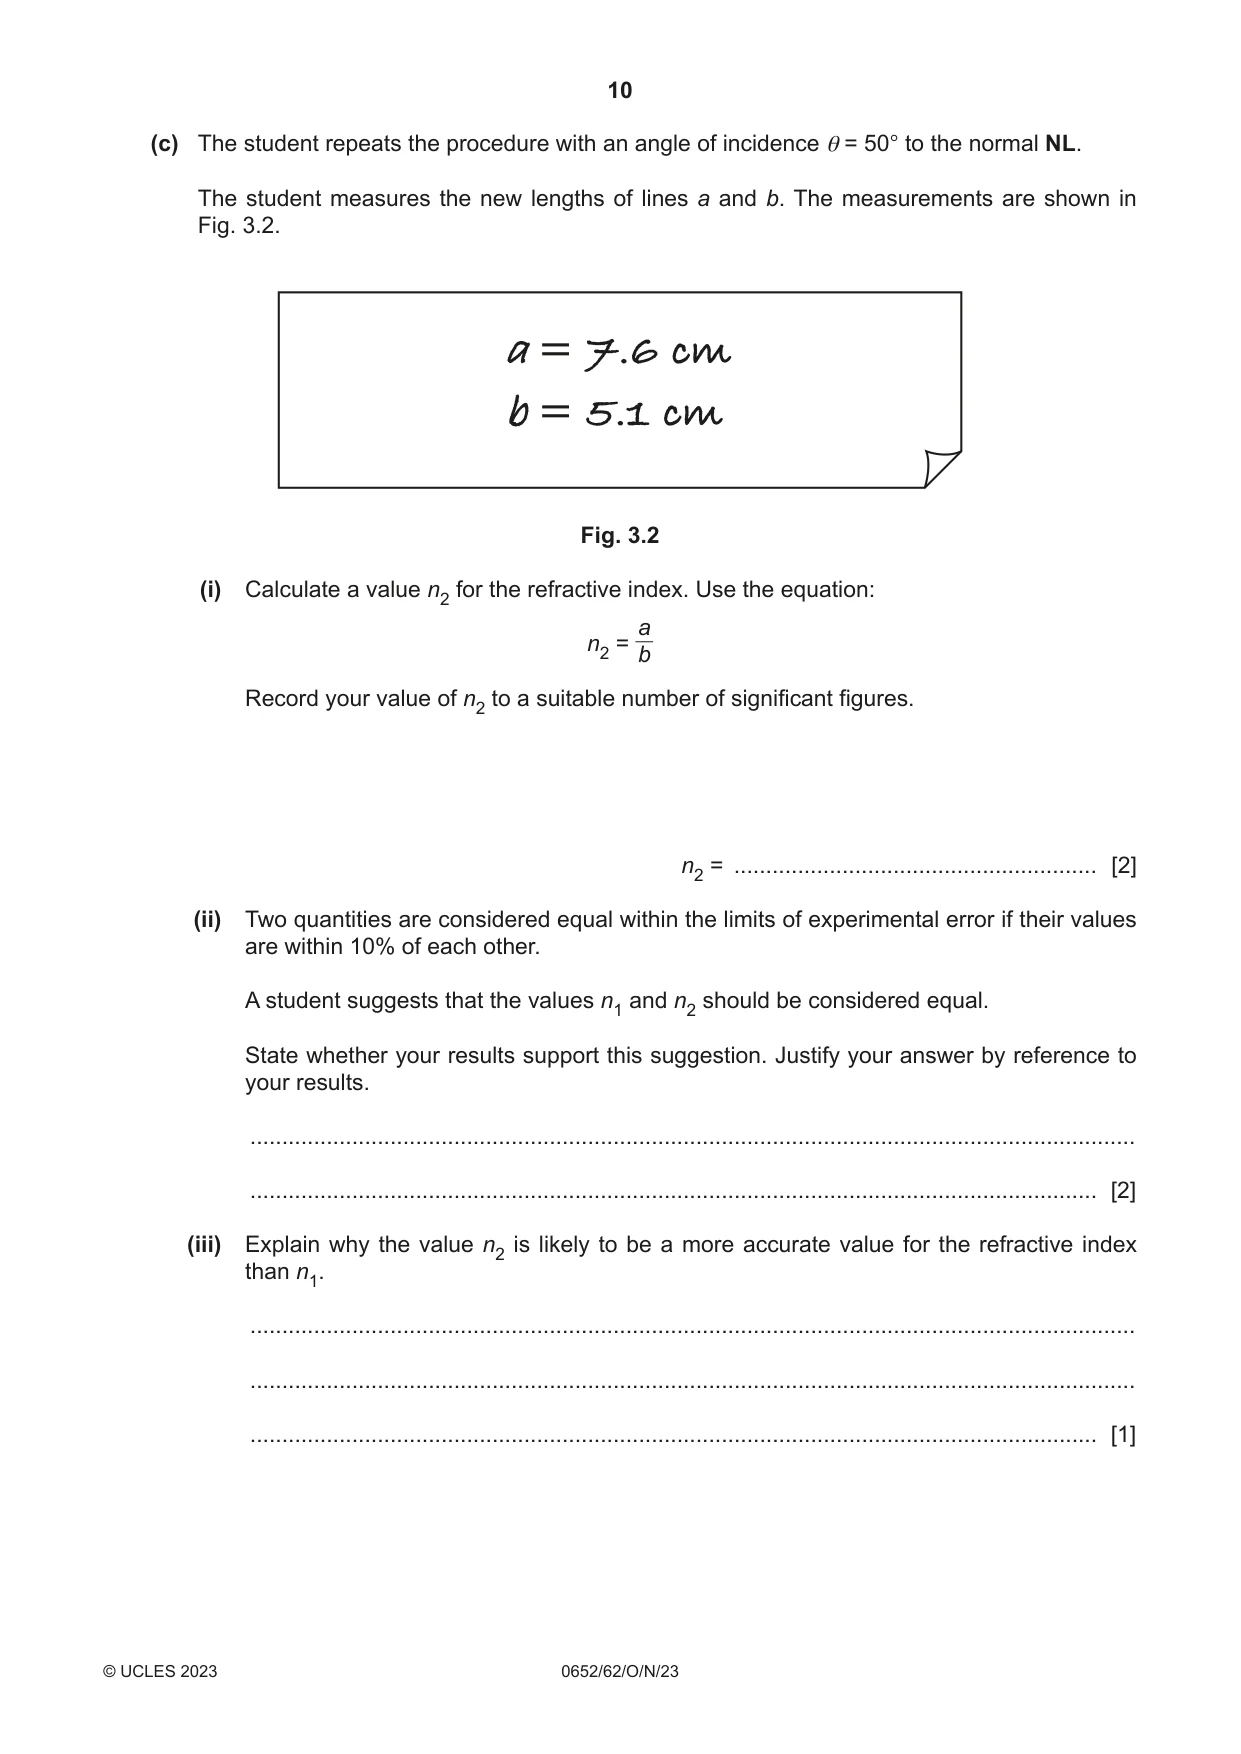
ht by a transparent block. eet. N B C P3 P4 L position of eye Fig. 3.1 (a) Procedure The student: • places a transparent block at the centre of the ray-trace sheet • draws round the block and labels the corners ABCD as shown in Fig. 3.1 • removes the block • draws the normal NL and line FE as shown in Fig. 3.1. (i) Measure the angle of incidence θ that line FE makes with the normal NL. θ = ....................................................... ° [1] (ii) The student places two pins P1 and P2 on the line FE a distance apart that is suitable for ray-tracing. Mark with crosses points P1 and P2 on line FE a distance apart that is suitable for ray-tracing. [1] (b) The student then: • replaces the block • views the images of P1 and P2 through the block from the direction indicated by the eye on Fig. 3.1 • places two pins P3 and P4 so that pins P3 and P4 and the images of pins P1 and P2 all appear exactly one behind the other • labels the positions of P3 and P4 • removes the block and pins from the ray-trace sheet. (i) Draw a line joining the positions of P3 and P4. Continue the line P3 P4 until it meets the normal NL. Label this point H. Label the point at which the line P3 P4 meets CD with the letter G. Join points G and E with a straight line. [1] (ii) Measure and record the length a of line GE and the length b of line GH. a = ......................................................... cm b = ......................................................... cm [1] (iii) Calculate a value n1 for the refractive index. Use the equation: a n1 = b Record your value of n1 to a suitable number of significant figures. (c) The student repeats the procedure with an angle of incidence θ = 50° to the normal NL. The student measures the new lengths of lines a and b. The measurements are shown in Fig. 3.2. a= 7.6 cm b= 5.1 cm Fig. 3.2 (i) Calculate a value n2 for the refractive index. Use the equation: a n2 = b Record your value of n2 to a suitable number of significant figures. n2 = ......................................................... [2] (ii) Two quantities are considered equal within the limits of experimental error if their values are within 10% of each other. A student suggests that the values n1 and n2 should be considered equal. State whether your results support this suggestion. Justify your answer by reference to your results. ........................................................................................................................................... ..................................................................................................................................... [2] (iii) Explain why the value n2 is likely to be a more accurate value for the refractive index than n1. ........................................................................................................................................... ........................................................................................................................................... ..................................................................................................................................... [1]
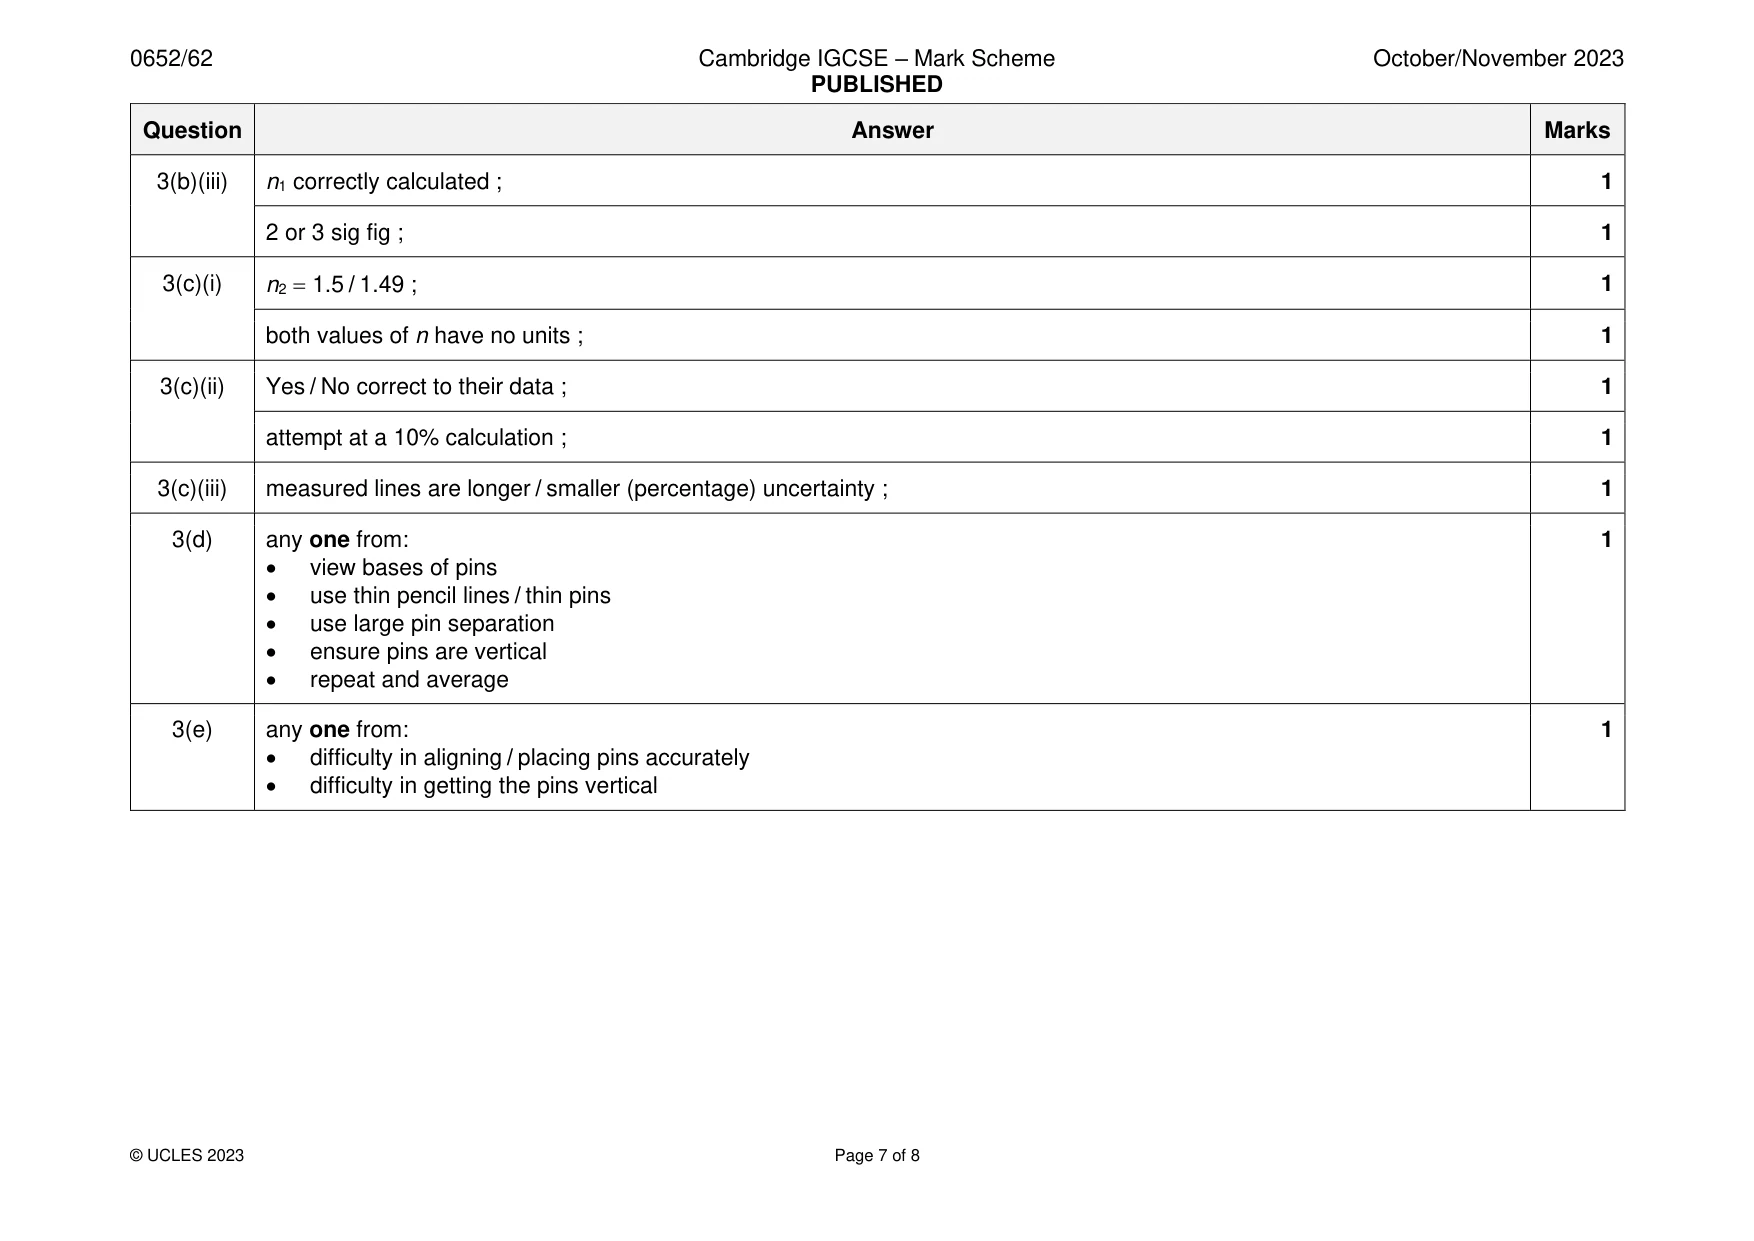
Mark scheme: 3(a)(i) = 30° 2° ; 1 3(a)(ii) marks at least 2 cm apart ; 1 3(b)(i) all lines present and neat ; 1 3(b)(ii) a and b correctly measured 1 mm with units ; 1 3(b)(iii) n1 correctly calculated ; 1 2 or 3 sig fig ; 1 3(c)(i) n2 = 1.5 / 1.49 ; 1 both values of n have no units ; 1 3(c)(ii) Yes / No correct to their data ; 1 attempt at a 10% calculation ; 1 3(c)(iii) measured lines are longer / smaller (percentage) uncertainty ; 1 3(d) any one from: 1 • view bases of pins • use thin pencil lines / thin pins • use large pin separation • ensure pins are vertical • repeat and average 3(e) any one from: 1 • difficulty in aligning / placing pins accurately • difficulty in getting the pins vertical
Q4 · Conducting putty is modelling clay that conducts electrical current
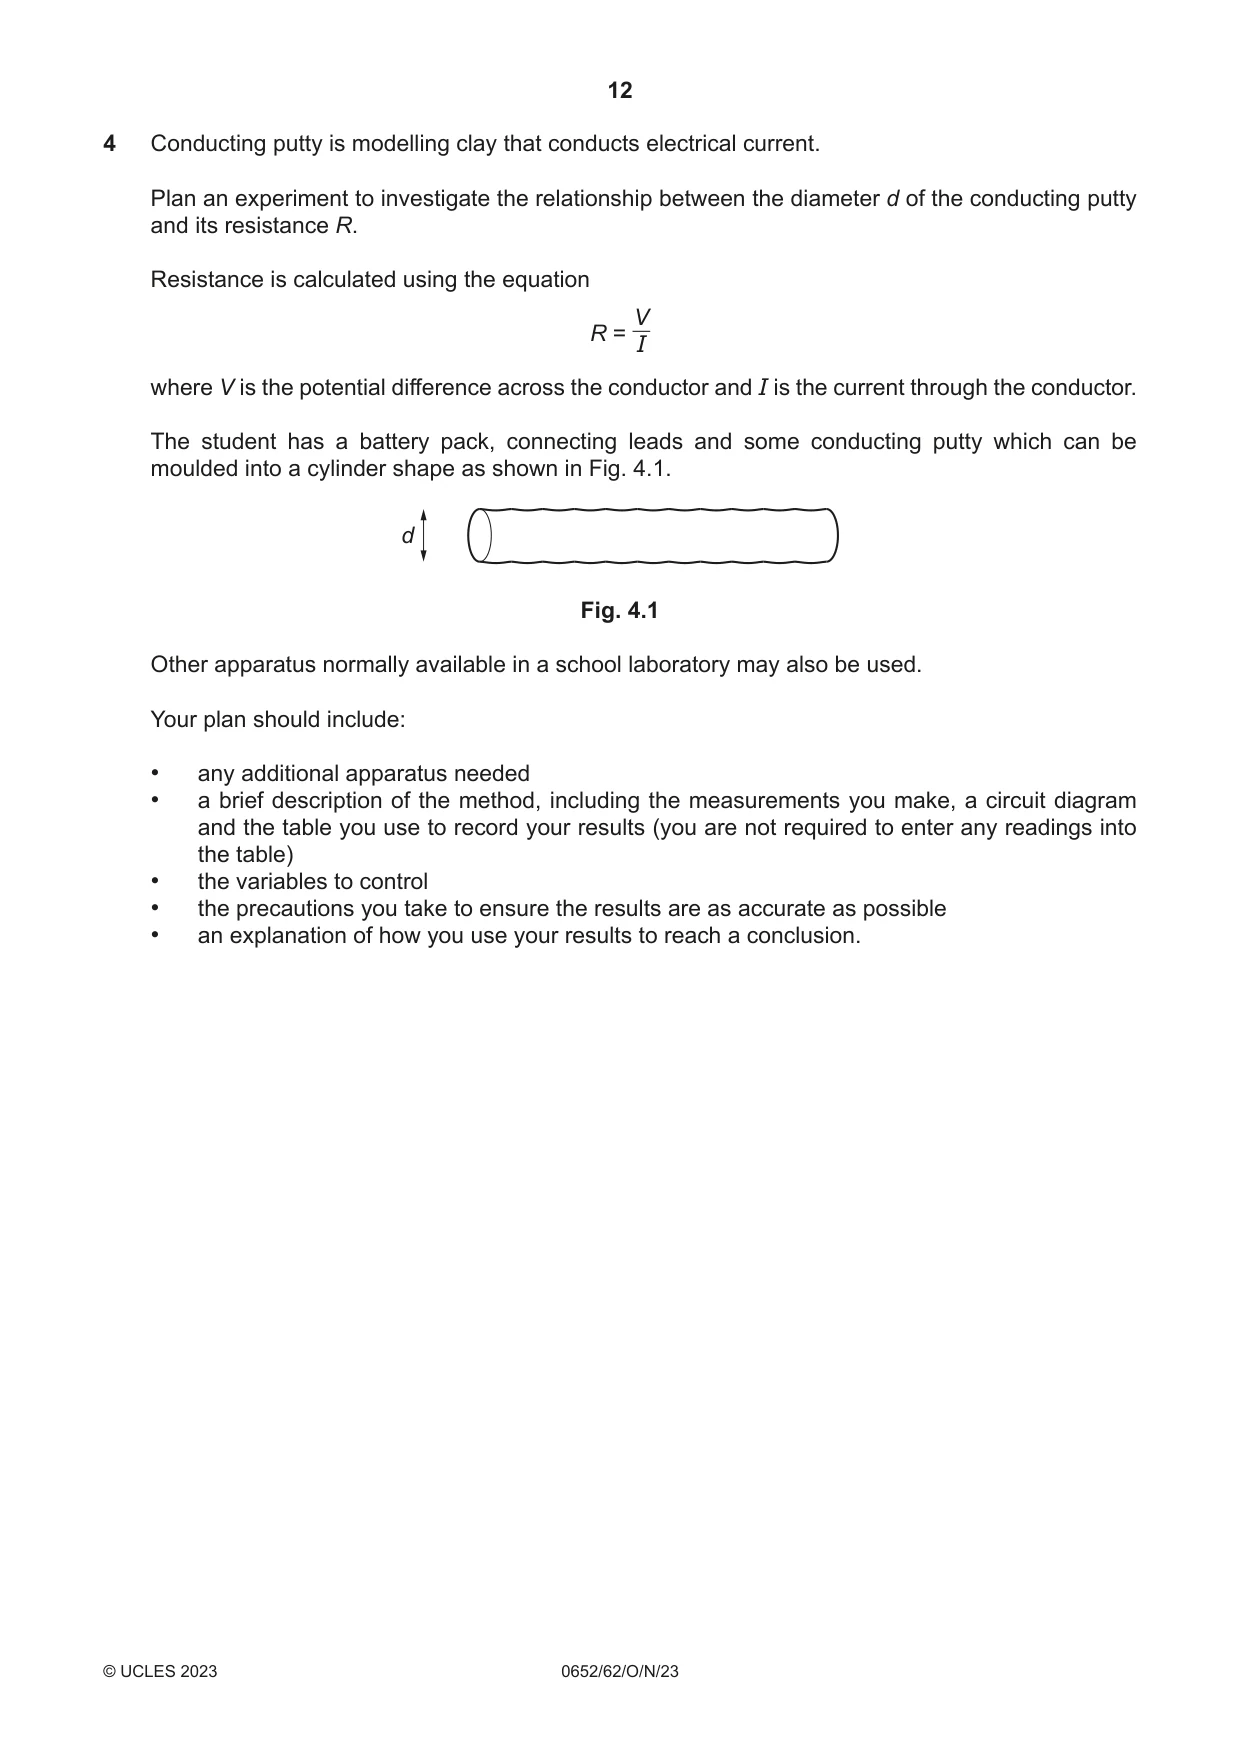
4 Conducting putty is modelling clay that conducts electrical current. Plan an experiment to investigate the relationship between the diameter d of the conducting putty and its resistance R. Resistance is calculated using the equation V R = I where V is the potential difference across the conductor and I is the current through the conductor. The student has a battery pack, connecting leads and some conducting putty which can be moulded into a cylinder shape as shown in Fig. 4.1. d Fig. 4.1 Other apparatus normally available in a school laboratory may also be used. Your plan should include: • any additional apparatus needed • a brief description of the method, including the measurements you make, a circuit diagram and the table you use to record your results (you are not required to enter any readings into the table) • the variables to control • the precautions you take to ensure the results are as accurate as possible • an explanation of how you use your results to reach a conclusion. .......................................................................................................................................................... .......................................................................................................................................................... .......................................................................................................................................................... .......................................................................................................................................................... .......................................................................................................................................................... .......................................................................................................................................................... .......................................................................................................................................................... .......................................................................................................................................................... .......................................................................................................................................................... .......................................................................................................................................................... .......................................................................................................................................................... .......................................................................................................................................................... .......................................................................................................................................................... .......................................................................................................................................................... .......................................................................................................................................................... .......................................................................................................................................................... .......................................................................................................................................................... .......................................................................................................................................................... .......................................................................................................................................................... .......................................................................................................................................................... .......................................................................................................................................................... .......................................................................................................................................................... .......................................................................................................................................................... .......................................................................................................................................................... .......................................................................................................................................................... .......................................................................................................................................................... ..........................................................................................................................................................
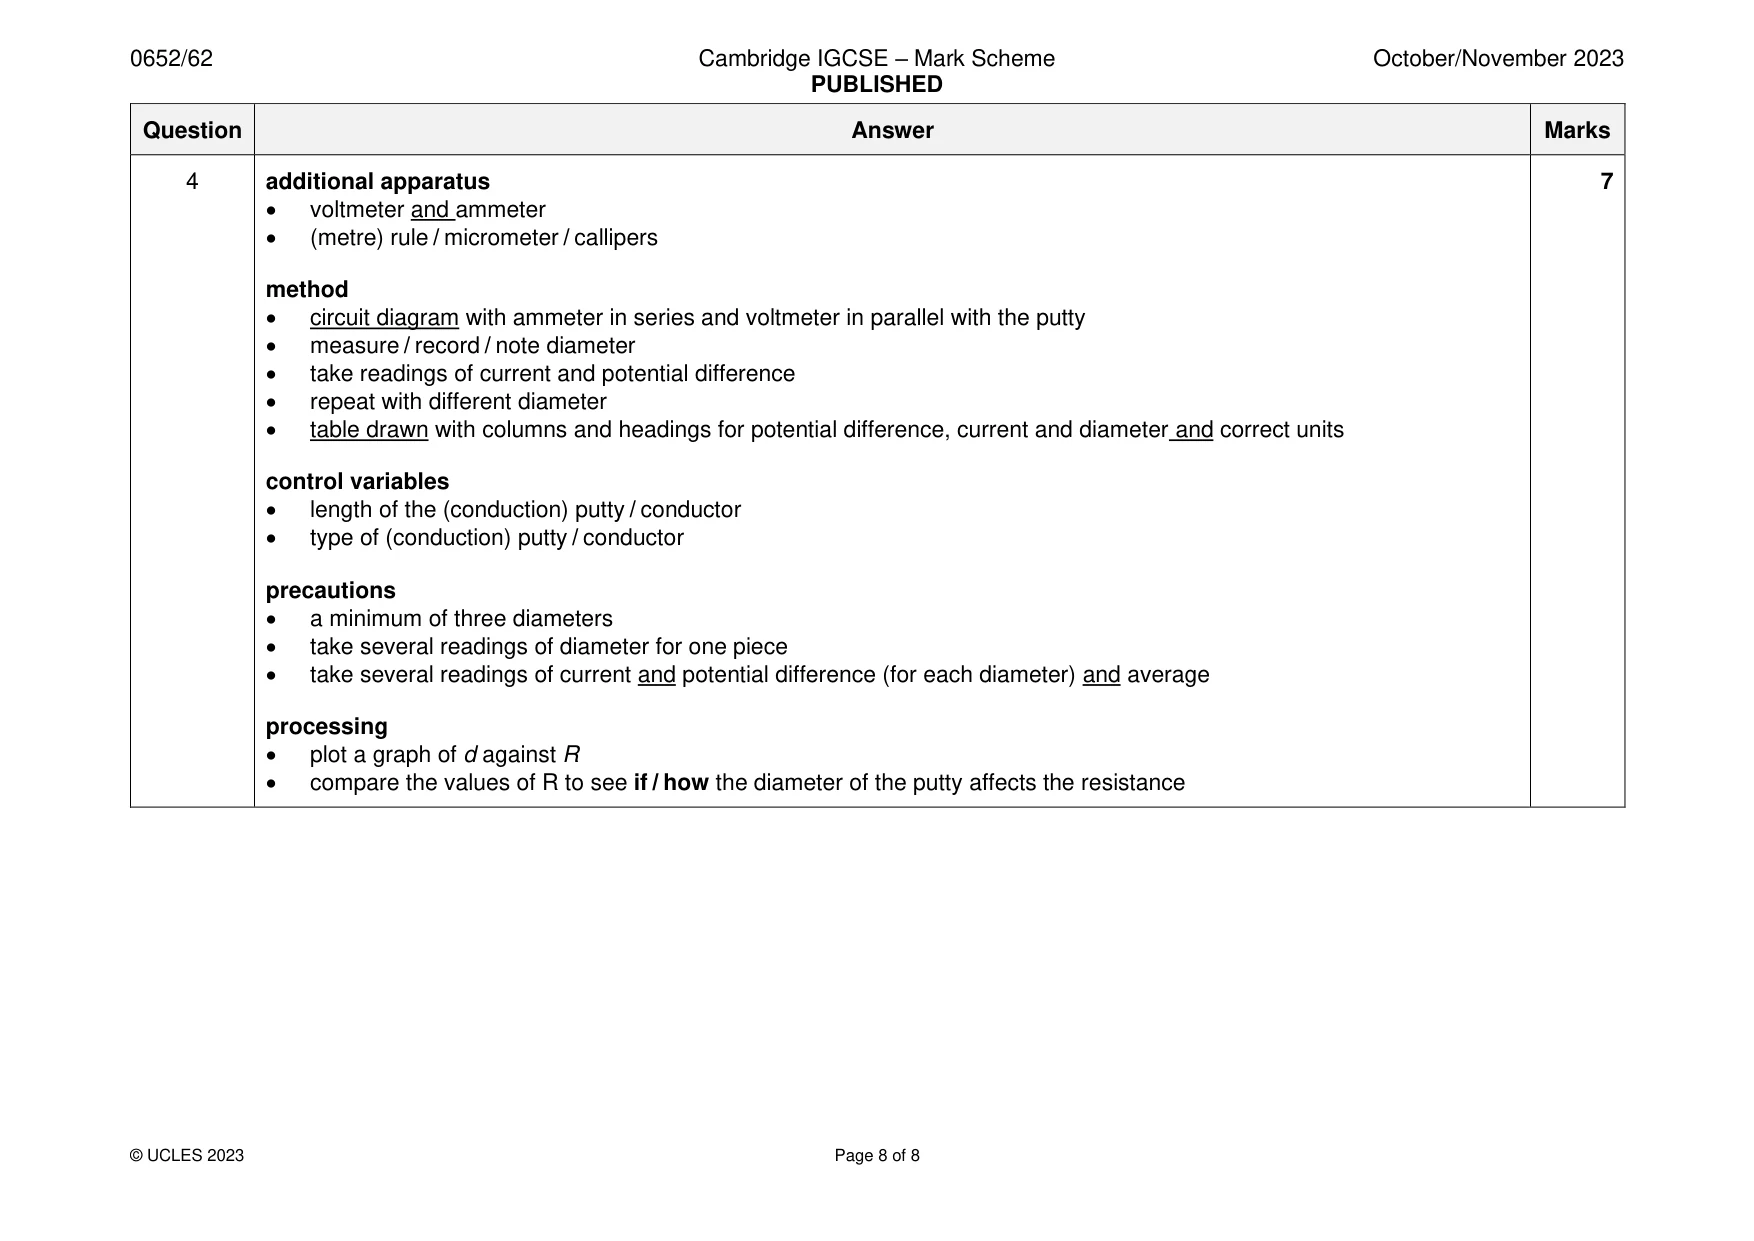
Mark scheme: Question Answer Marks 4 additional apparatus 7 • voltmeter and ammeter • (metre) rule / micrometer / callipers method • circuit diagram with ammeter in series and voltmeter in parallel with the putty • measure / record / note diameter • take readings of current and potential difference • repeat with different diameter • table drawn with columns and headings for potential difference, current and diameter and correct units control variables • length of the (conduction) putty / conductor • type of (conduction) putty / conductor precautions • a minimum of three diameters • take several readings of diameter for one piece • take several readings of current and potential difference (for each diameter) and average processing • plot a graph of d against R • compare the values of R to see if / how the diameter of the putty affects the resistance
What was in this paper
The subtopics covered by these 4 questions, and how many questions each got. Open one in a new tab to see every Cambridge question on it.
What you needed in this session
Cambridge’s own grade thresholds for 2023 Oct/Nov, Paper 6 · Variant 2. A higher threshold means an easier paper — the bar moves with how the cohort did.