Cambridge IGCSE Pakistan Studies 0448 — 2024 May/June Paper 2 · Variant 0
0448/20/M/J/24 · 5 questions · 115 marks · ≈129 min
The question paper and its mark scheme, free to read here and free to download. This is Cambridge’s own paper, exactly as it was sat.
Question paper28 pages
Mark scheme
No mark scheme is in the library for this paper.
Questions as text
Question 1
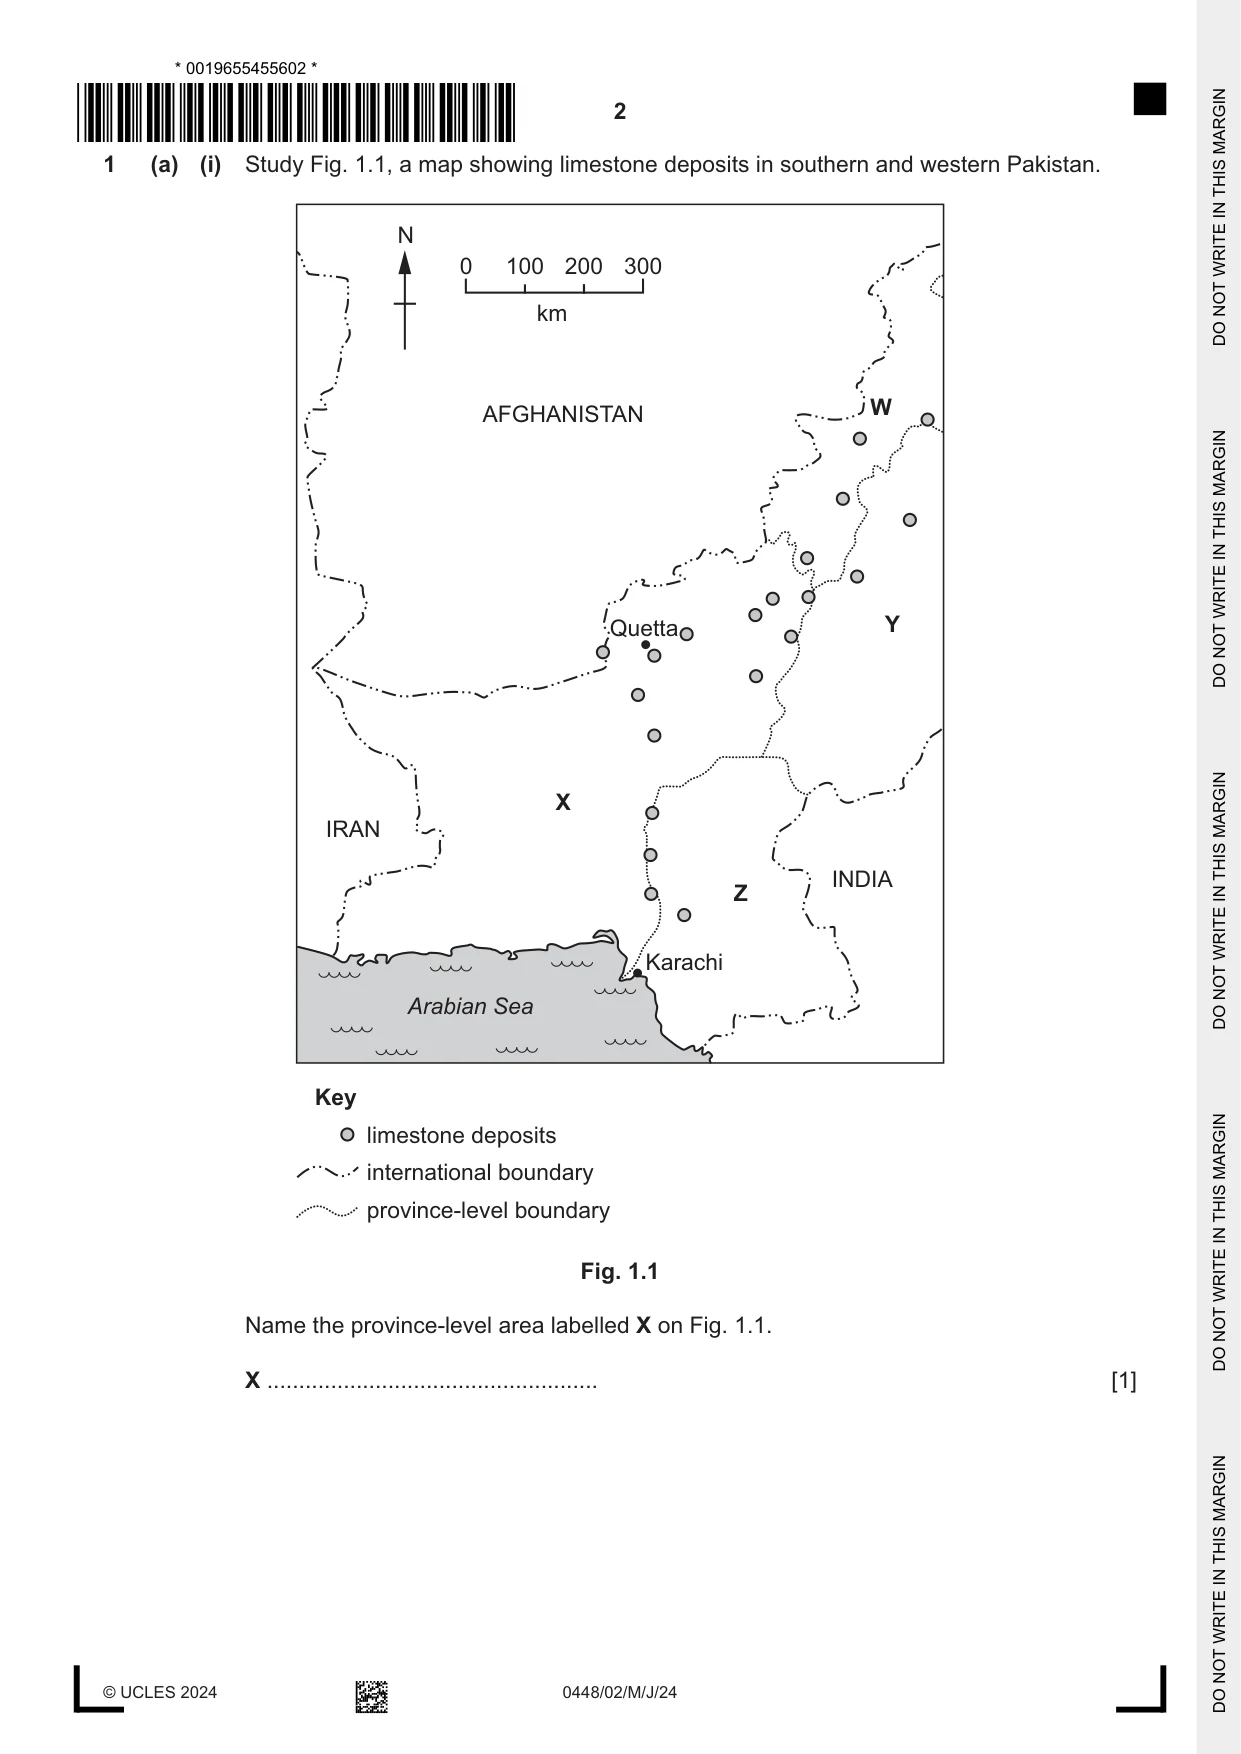
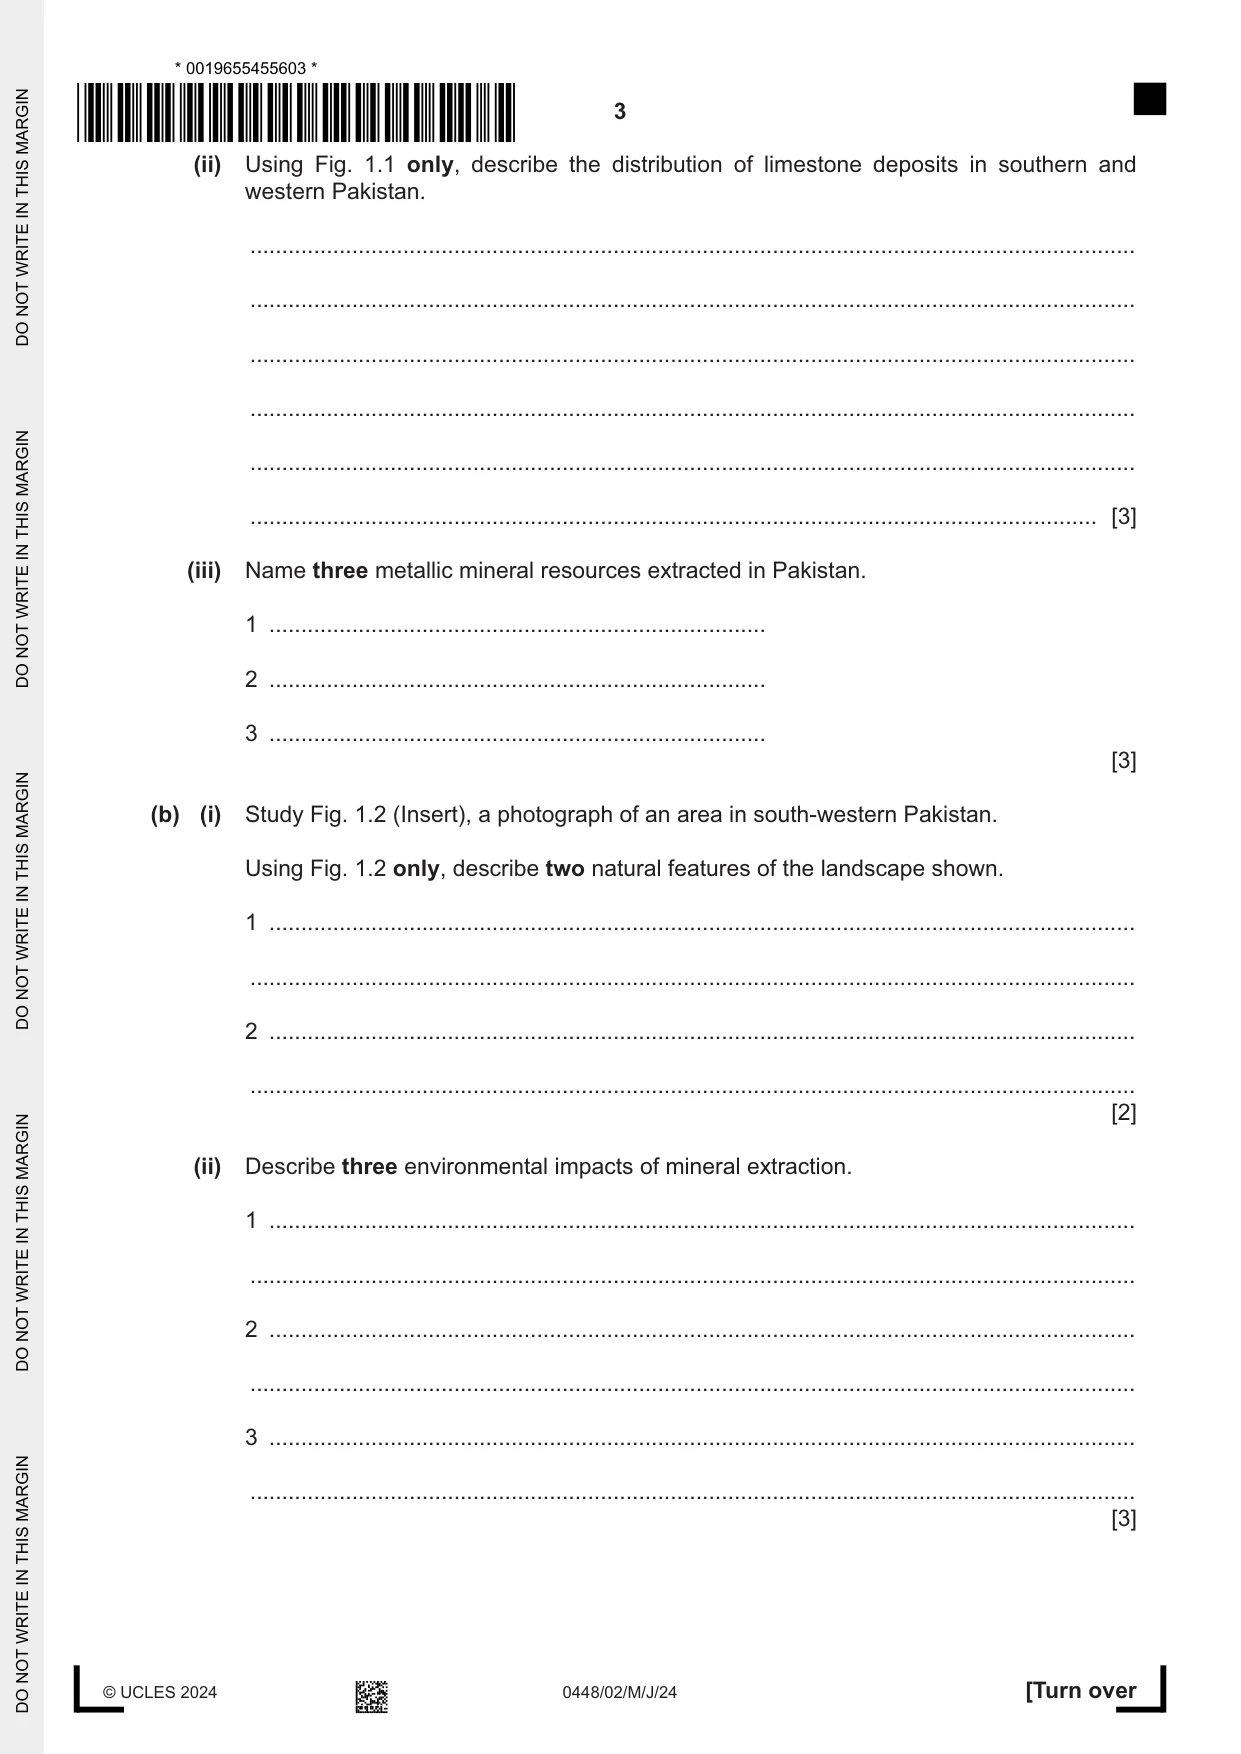
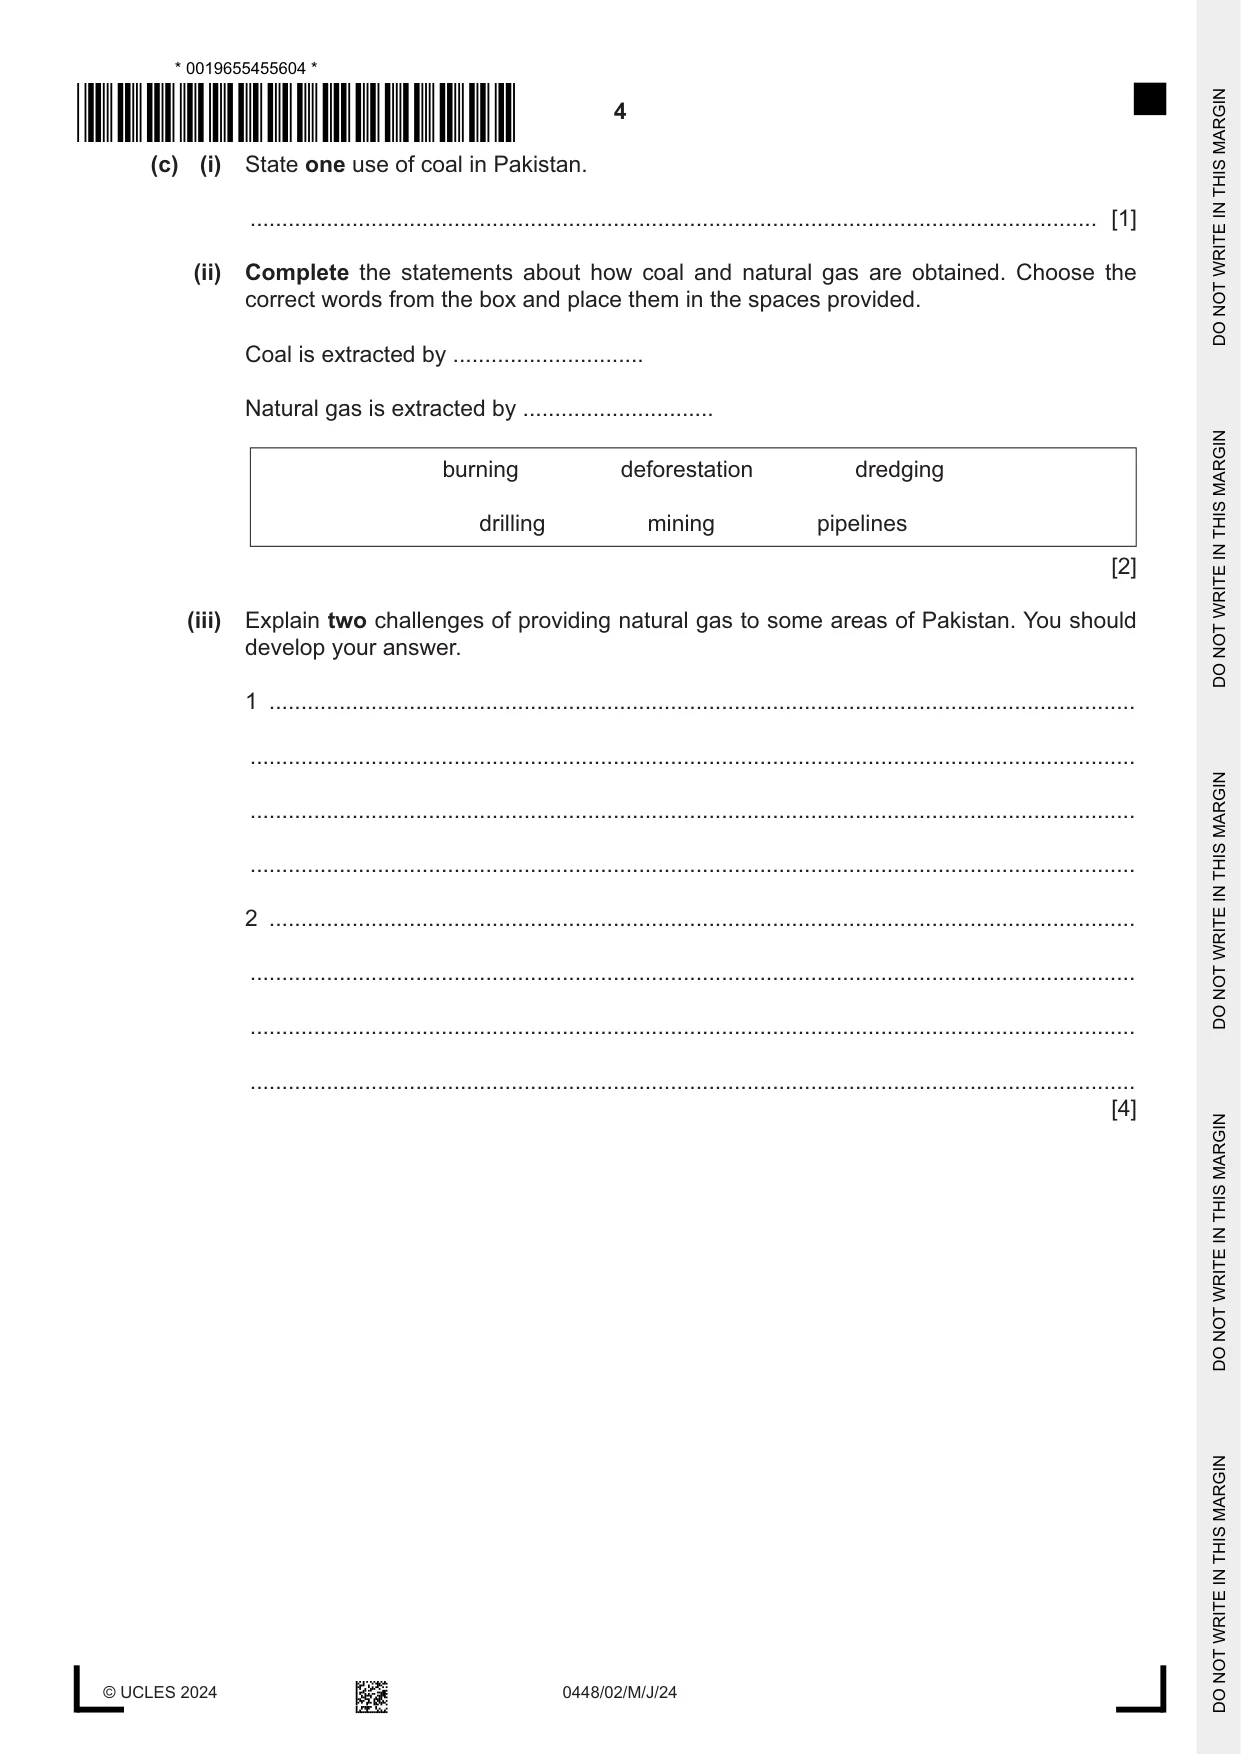
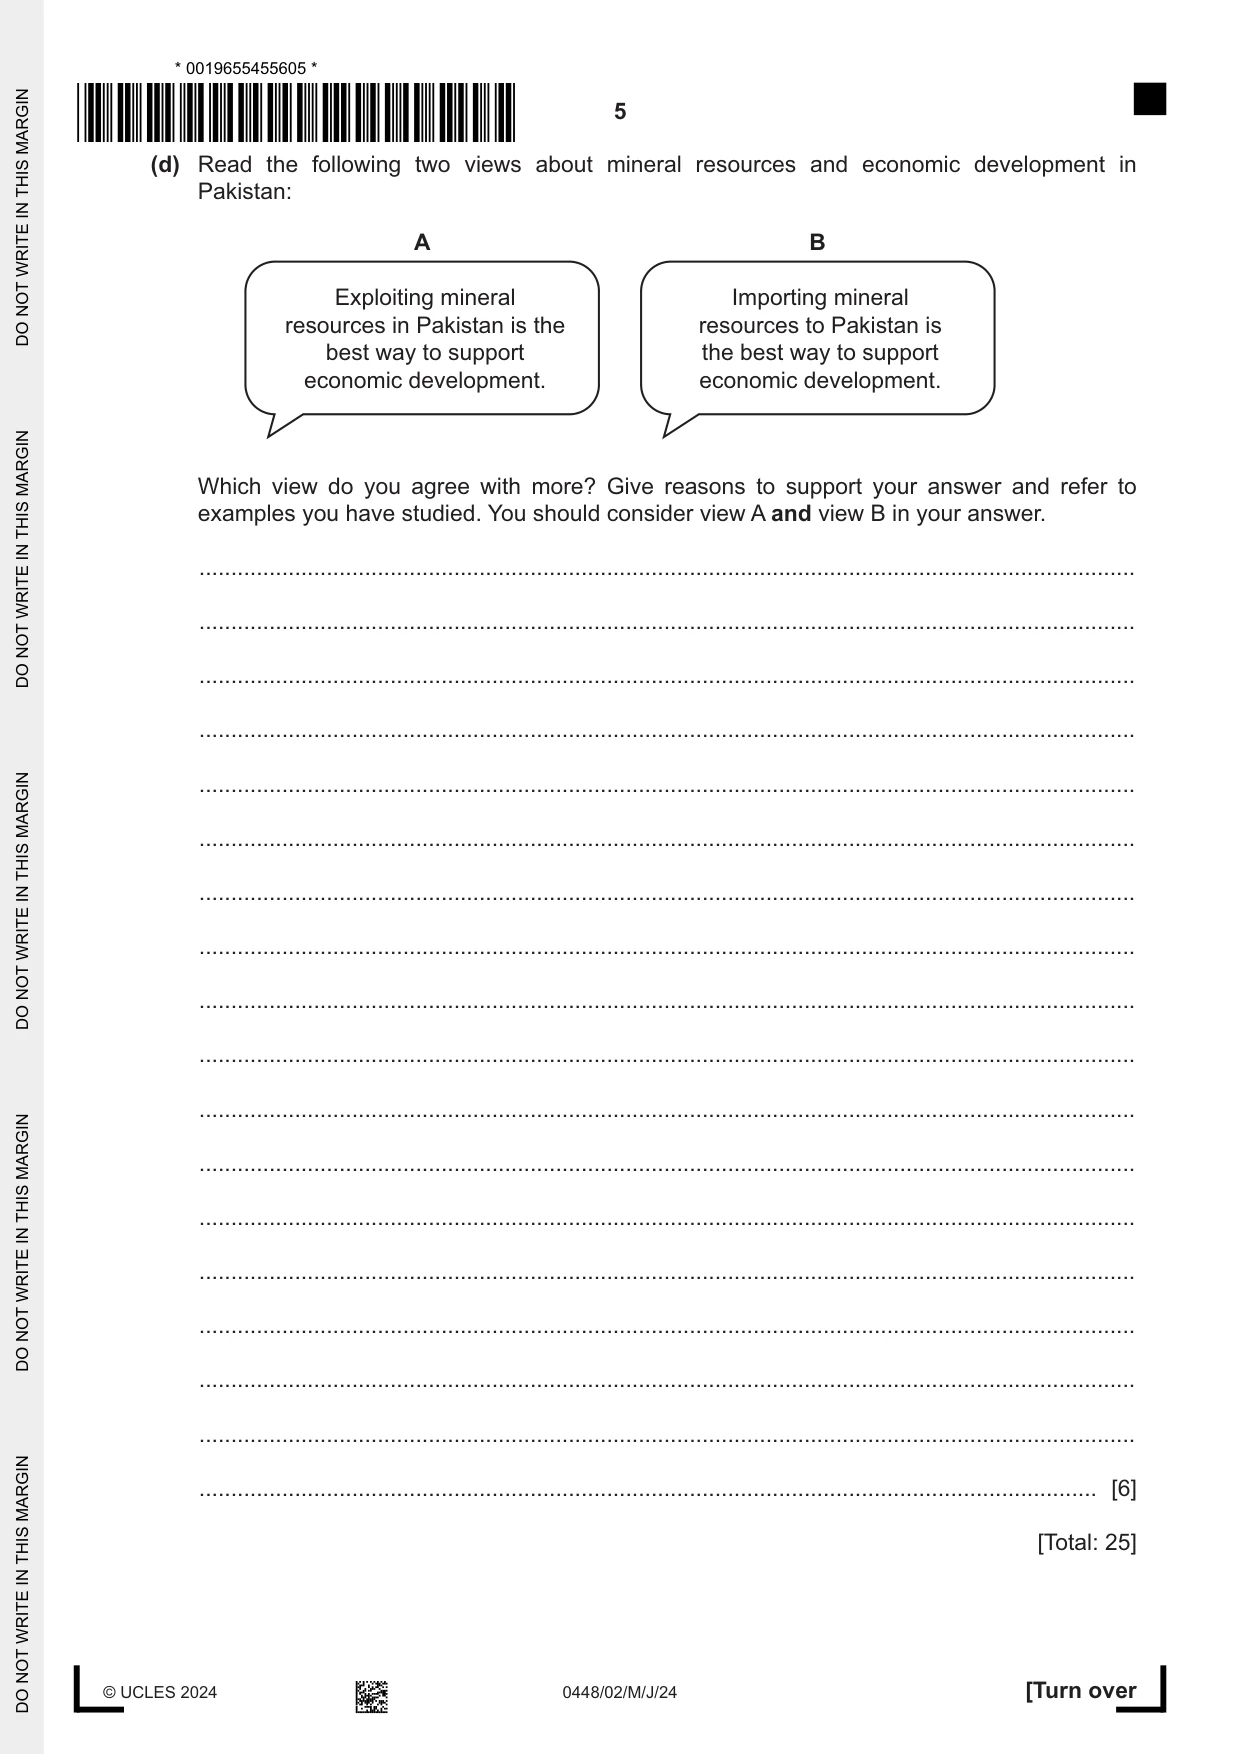
1 (a) (i) Study Fig. 1.1, a map showing limestone deposits in southern and western Pakistan. N 0 100 200 300 km W AFGHANISTAN Quetta Y X IRAN INDIA Z Karachi Arabian Sea Key limestone deposits international boundary province-level boundary Fig. 1.1 Name the province-level area labelled X on Fig. 1.1. X .................................................... [1] (ii) Using Fig. 1.1 only, describe the distribution of limestone deposits in southern and western Pakistan. ........................................................................................................................................... ........................................................................................................................................... ........................................................................................................................................... ........................................................................................................................................... ........................................................................................................................................... ..................................................................................................................................... [3] (iii) Name three metallic mineral resources extracted in Pakistan. 1 .............................................................................. 2 .............................................................................. 3 .............................................................................. [3] (b) (i) Study Fig. 1.2 (Insert), a photograph of an area in south-western Pakistan. Using Fig. 1.2 only, describe two natural features of the landscape shown. 1 ........................................................................................................................................ ........................................................................................................................................... 2 ........................................................................................................................................ ........................................................................................................................................... [2] (ii) Describe three environmental impacts of mineral extraction. 1 ........................................................................................................................................ ........................................................................................................................................... 2 ........................................................................................................................................ ........................................................................................................................................... 3 ........................................................................................................................................ ........................................................................................................................................... [3] (c) (i) State one use of coal in Pakistan. ..................................................................................................................................... [1] (ii) Complete the statements about how coal and natural gas are obtained. Choose the correct words from the box and place them in the spaces provided. Coal is extracted by .............................. Natural gas is extracted by .............................. burning deforestation dredging drilling mining pipelines [2] (iii) Explain two challenges of providing natural gas to some areas of Pakistan. You should develop your answer. 1 ........................................................................................................................................ ........................................................................................................................................... ........................................................................................................................................... ........................................................................................................................................... 2 ........................................................................................................................................ ........................................................................................................................................... ........................................................................................................................................... ........................................................................................................................................... [4] (d) Read the following two views about mineral resources and economic development in Pakistan: A B Exploiting mineral Importing mineral resources in Pakistan is the resources to Pakistan is best way to support the best way to support economic development. economic development. Which view do you agree with more? Give reasons to support your answer and refer to examples you have studied. You should consider view A and view B in your answer. ................................................................................................................................................... ................................................................................................................................................... ................................................................................................................................................... ................................................................................................................................................... ................................................................................................................................................... ................................................................................................................................................... ................................................................................................................................................... ................................................................................................................................................... ................................................................................................................................................... ................................................................................................................................................... ................................................................................................................................................... ................................................................................................................................................... ................................................................................................................................................... ................................................................................................................................................... ................................................................................................................................................... ................................................................................................................................................... ................................................................................................................................................... ............................................................................................................................................. [6] [Total: 25]
Question 2
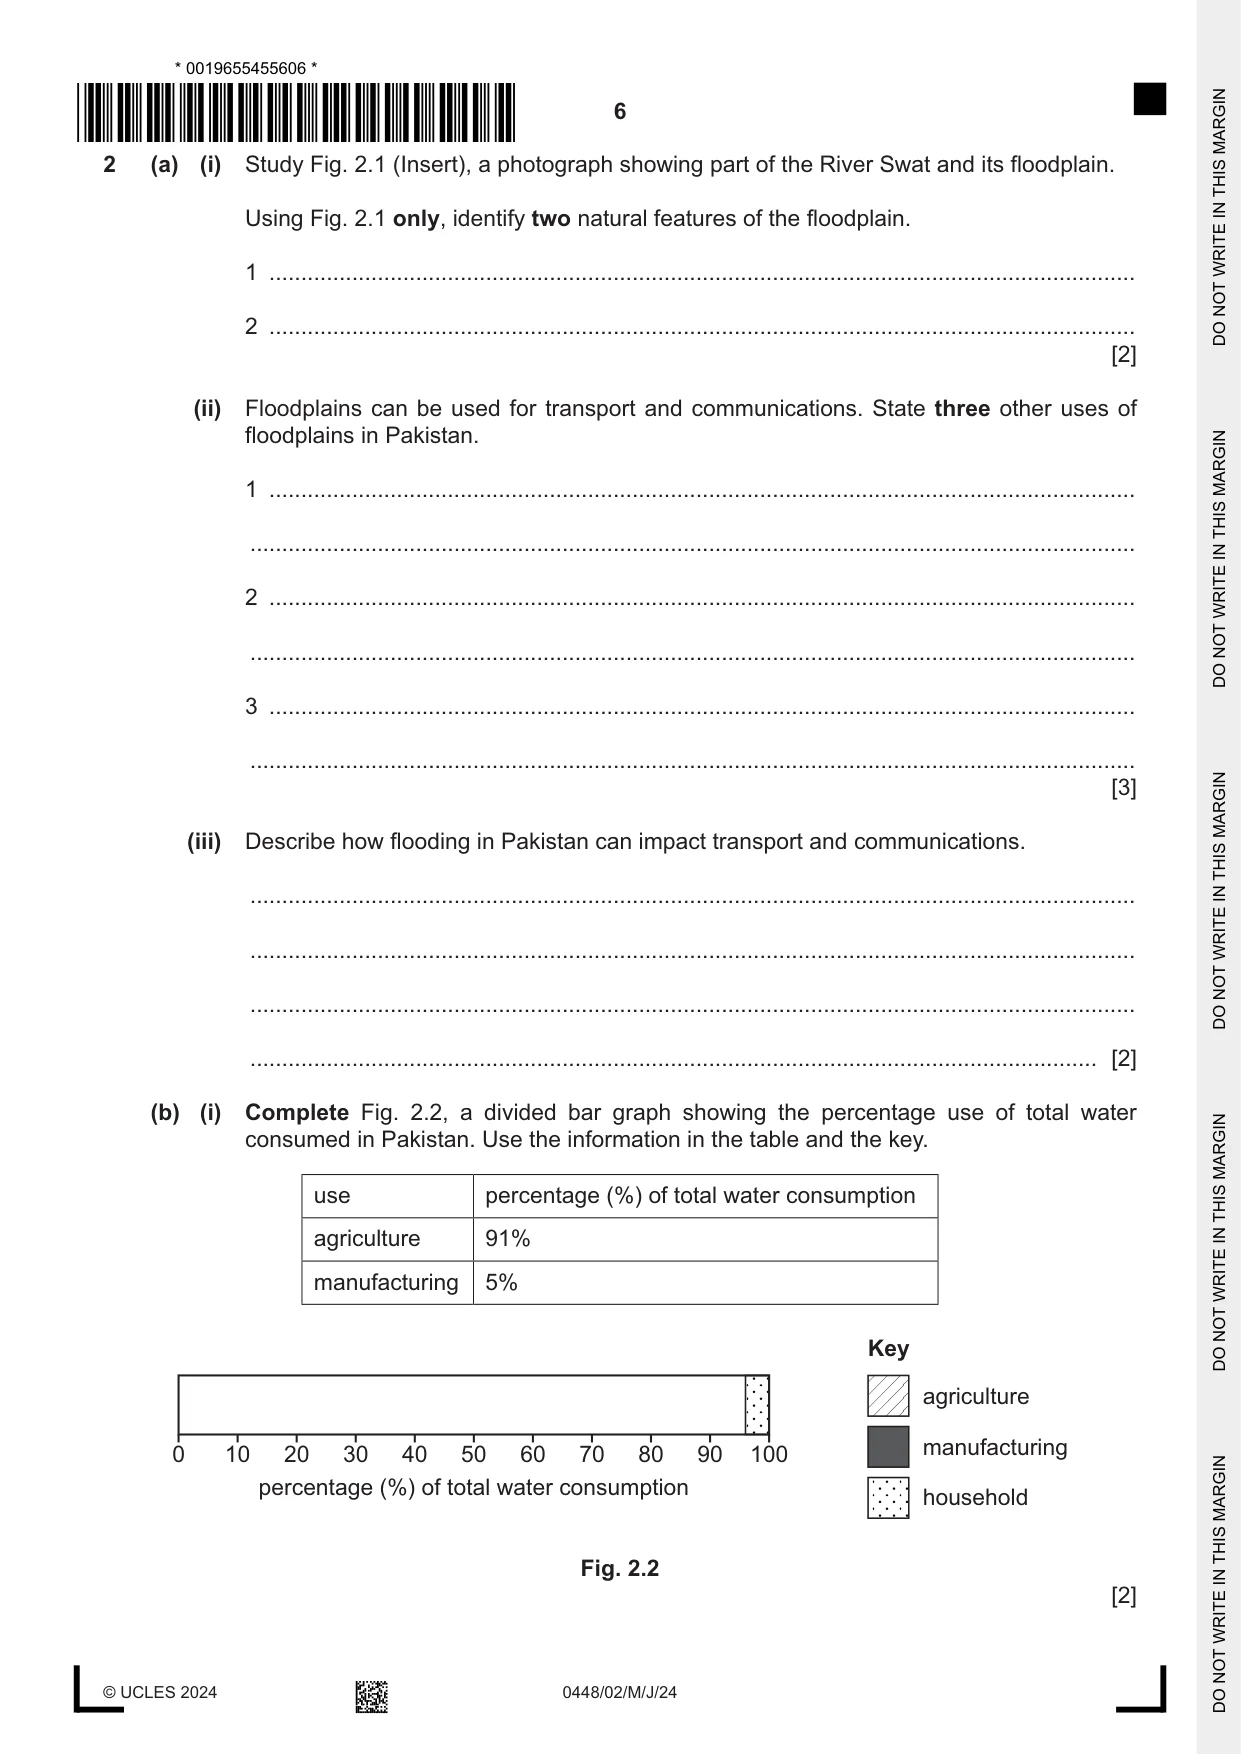
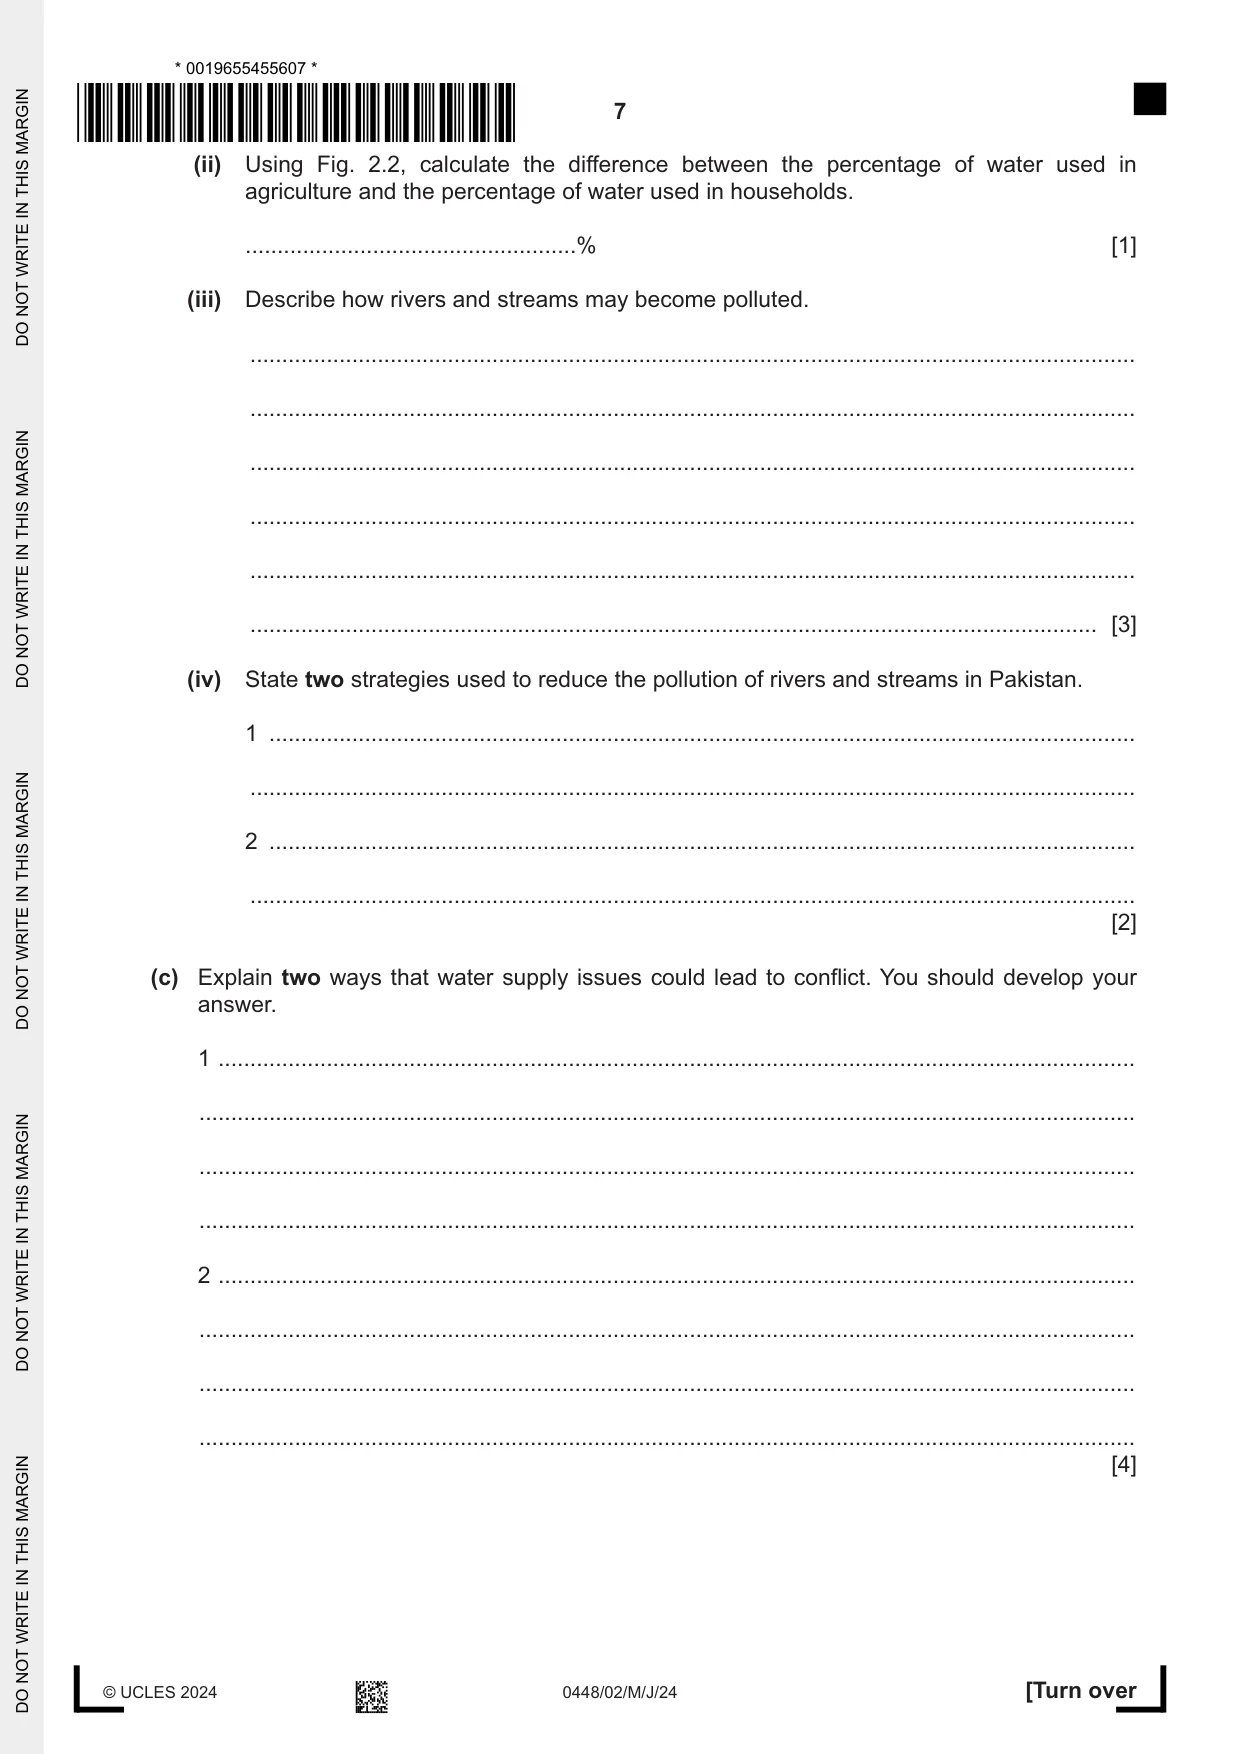
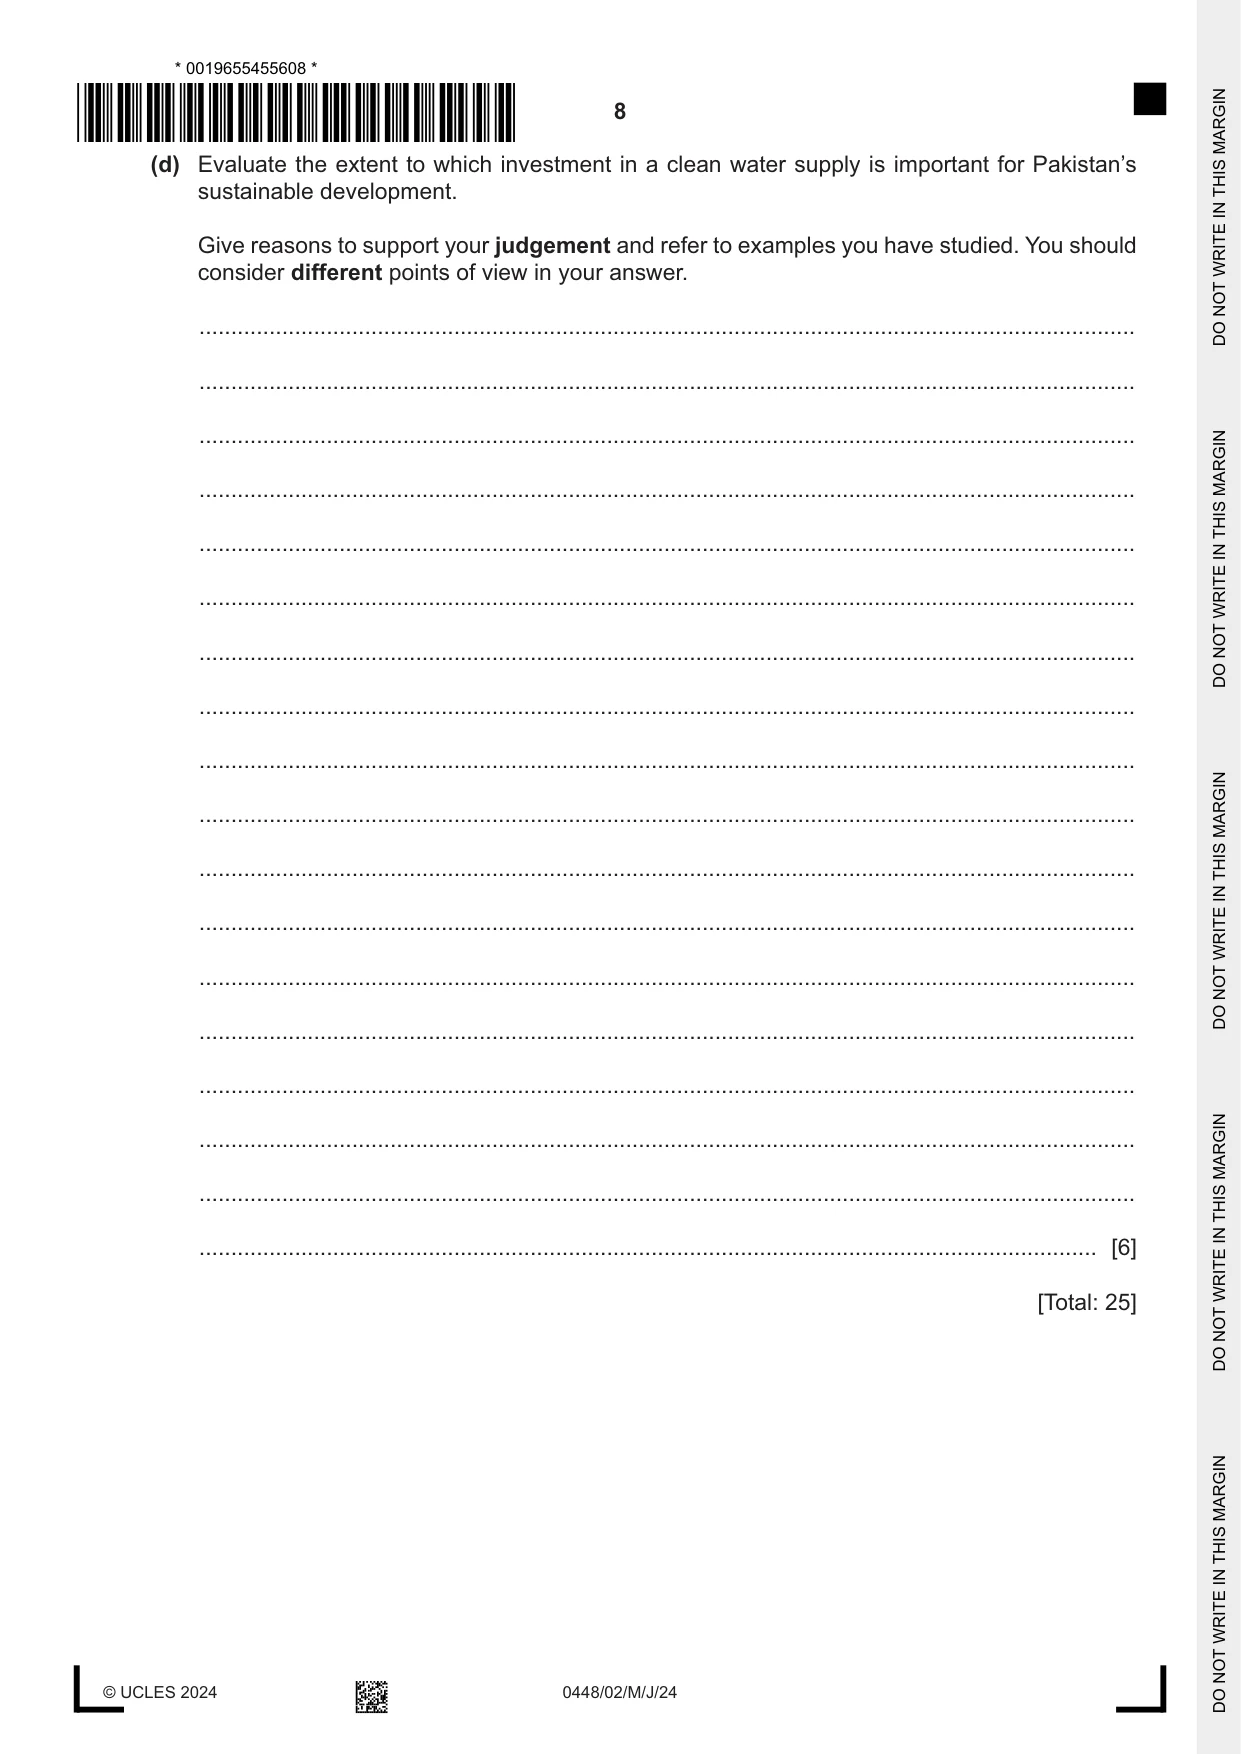
2 (a) (i) Study Fig. 2.1 (Insert), a photograph showing part of the River Swat and its floodplain. Using Fig. 2.1 only, identify two natural features of the floodplain. 1 ........................................................................................................................................ 2 ........................................................................................................................................ [2] (ii) Floodplains can be used for transport and communications. State three other uses of floodplains in Pakistan. 1 ........................................................................................................................................ ........................................................................................................................................... 2 ........................................................................................................................................ ........................................................................................................................................... 3 ........................................................................................................................................ ........................................................................................................................................... [3] (iii) Describe how flooding in Pakistan can impact transport and communications. ........................................................................................................................................... ........................................................................................................................................... ........................................................................................................................................... ..................................................................................................................................... [2] (b) (i) Complete Fig. 2.2, a divided bar graph showing the percentage use of total water consumed in Pakistan. Use the information in the table and the key. use percentage (%) of total water consumption agriculture 91% manufacturing 5% Key agriculture manufacturing 0 10 20 30 40 50 60 70 80 90 100 percentage (%) of total water consumption household Fig. 2.2 [2] (ii) Using Fig. 2.2, calculate the difference between the percentage of water used in agriculture and the percentage of water used in households. ....................................................% [1] (iii) Describe how rivers and streams may become polluted. ........................................................................................................................................... ........................................................................................................................................... ........................................................................................................................................... ........................................................................................................................................... ........................................................................................................................................... ..................................................................................................................................... [3] (iv) State two strategies used to reduce the pollution of rivers and streams in Pakistan. 1 ........................................................................................................................................ ........................................................................................................................................... 2 ........................................................................................................................................ ........................................................................................................................................... [2] (c) Explain two ways that water supply issues could lead to conflict. You should develop your answer. 1 ................................................................................................................................................ ................................................................................................................................................... ................................................................................................................................................... ................................................................................................................................................... 2 ................................................................................................................................................ ................................................................................................................................................... ................................................................................................................................................... ................................................................................................................................................... [4] (d) Evaluate the extent to which investment in a clean water supply is important for Pakistan’s sustainable development. Give reasons to support your judgement and refer to examples you have studied. You should consider different points of view in your answer. ................................................................................................................................................... ................................................................................................................................................... ................................................................................................................................................... ................................................................................................................................................... ................................................................................................................................................... ................................................................................................................................................... ................................................................................................................................................... ................................................................................................................................................... ................................................................................................................................................... ................................................................................................................................................... ................................................................................................................................................... ................................................................................................................................................... ................................................................................................................................................... ................................................................................................................................................... ................................................................................................................................................... ................................................................................................................................................... ................................................................................................................................................... ............................................................................................................................................. [6] [Total: 25]
Question 3
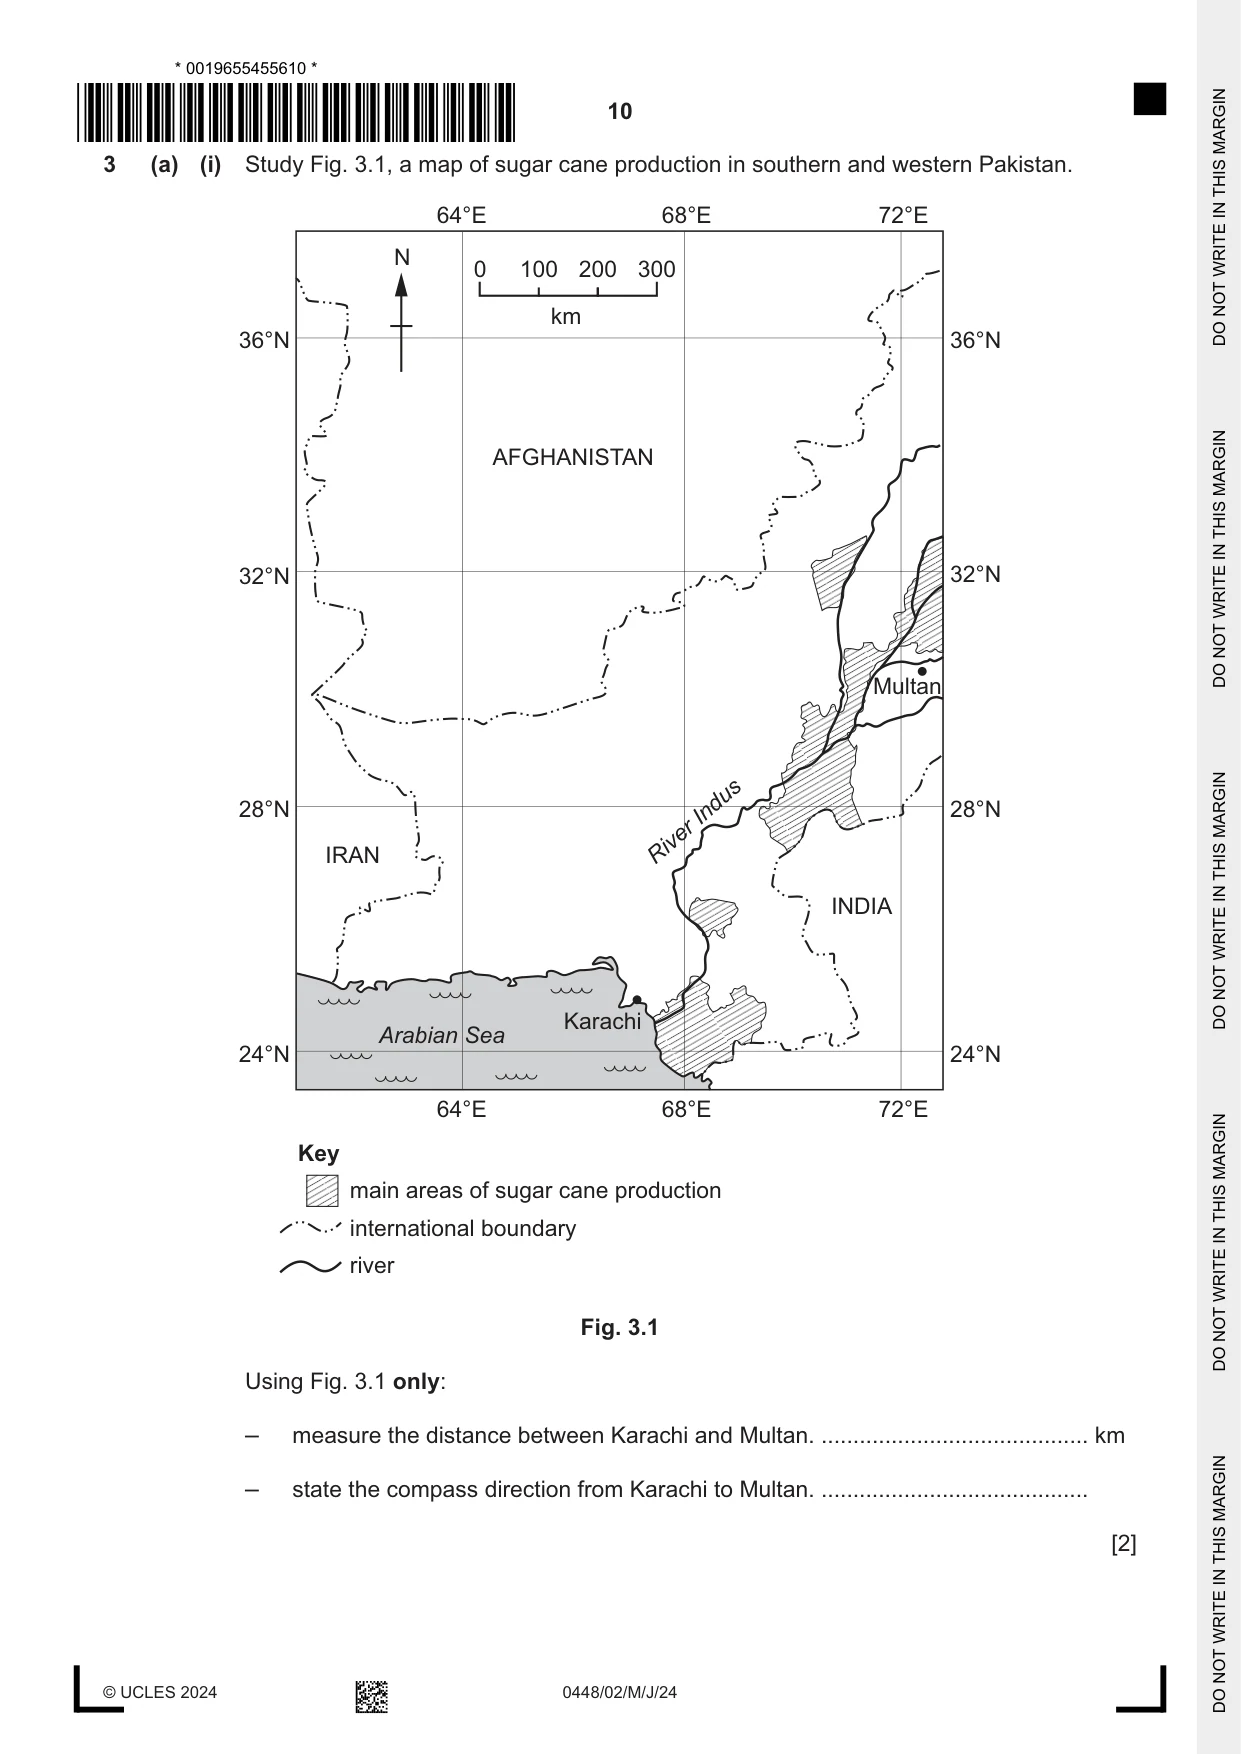
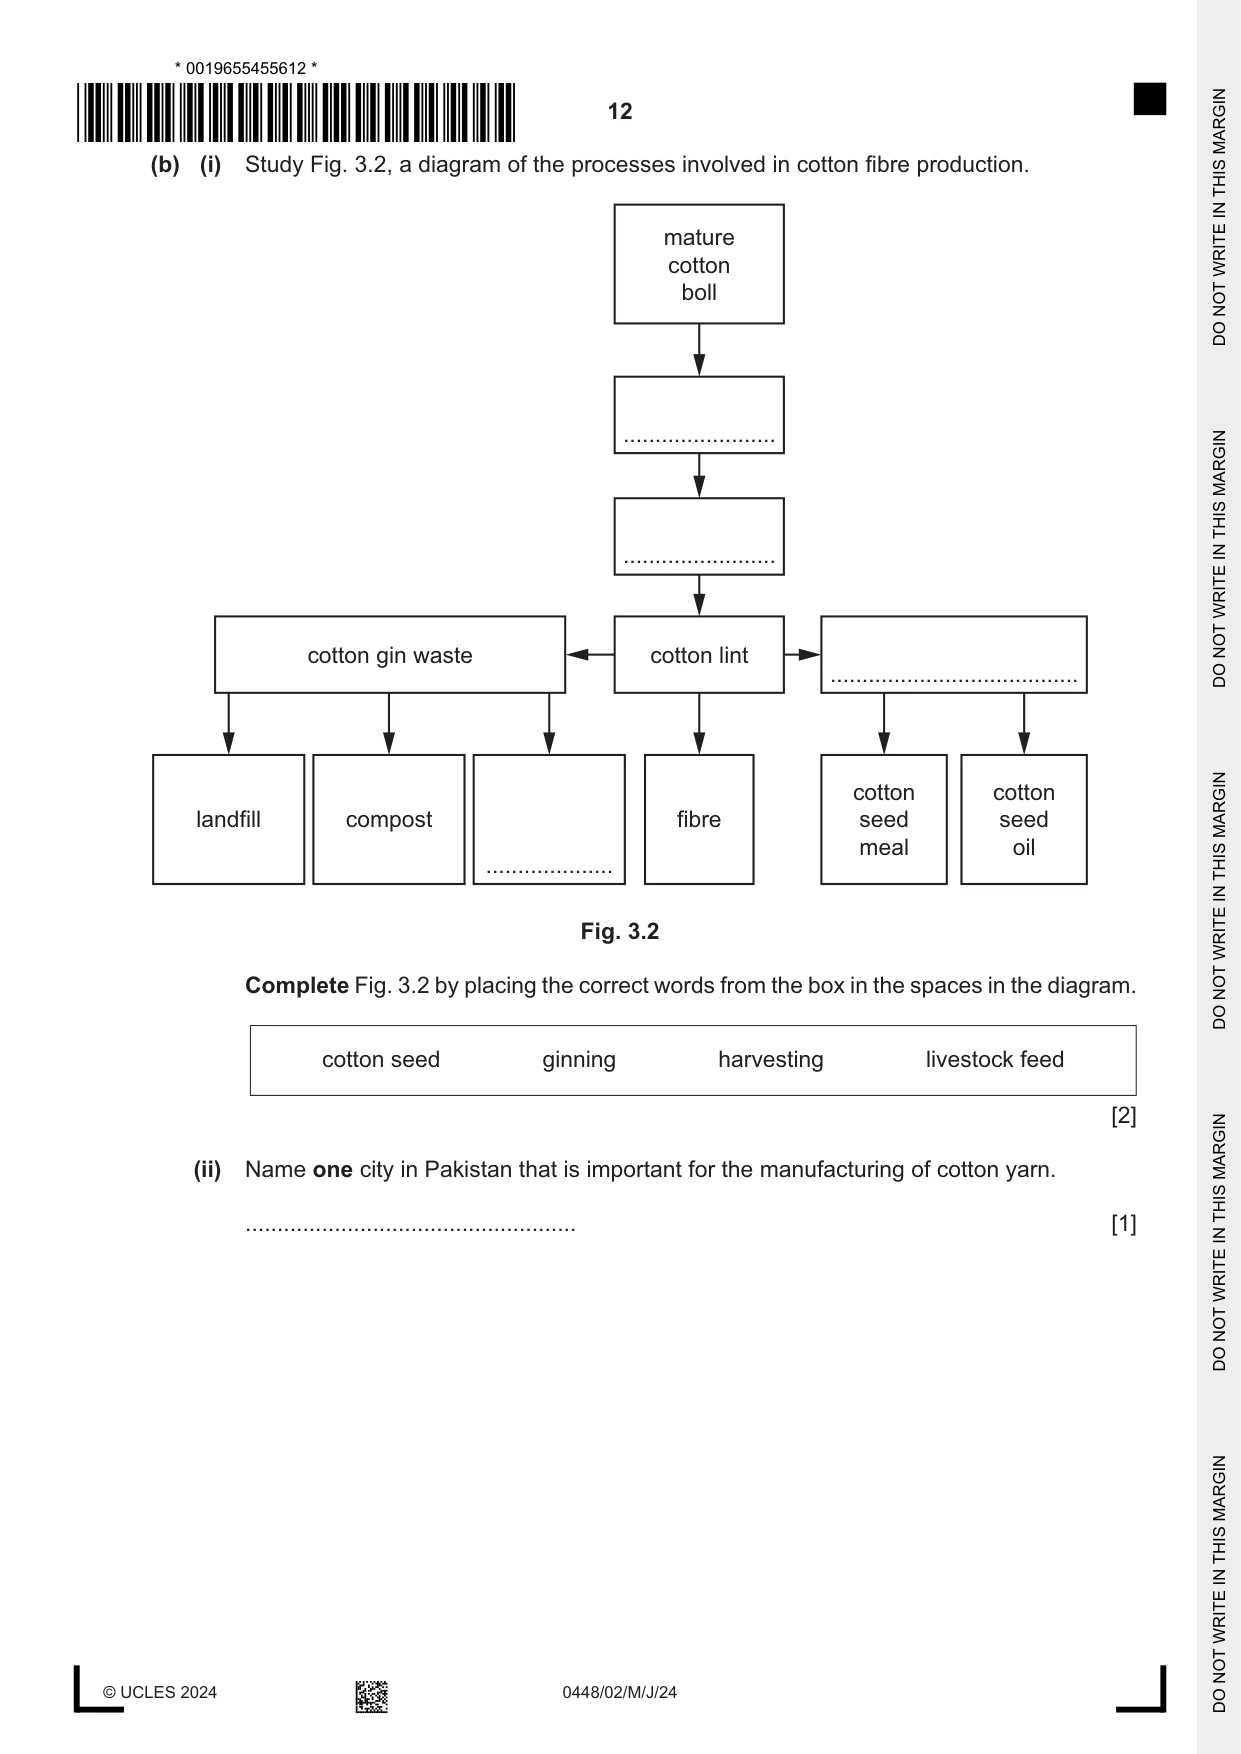
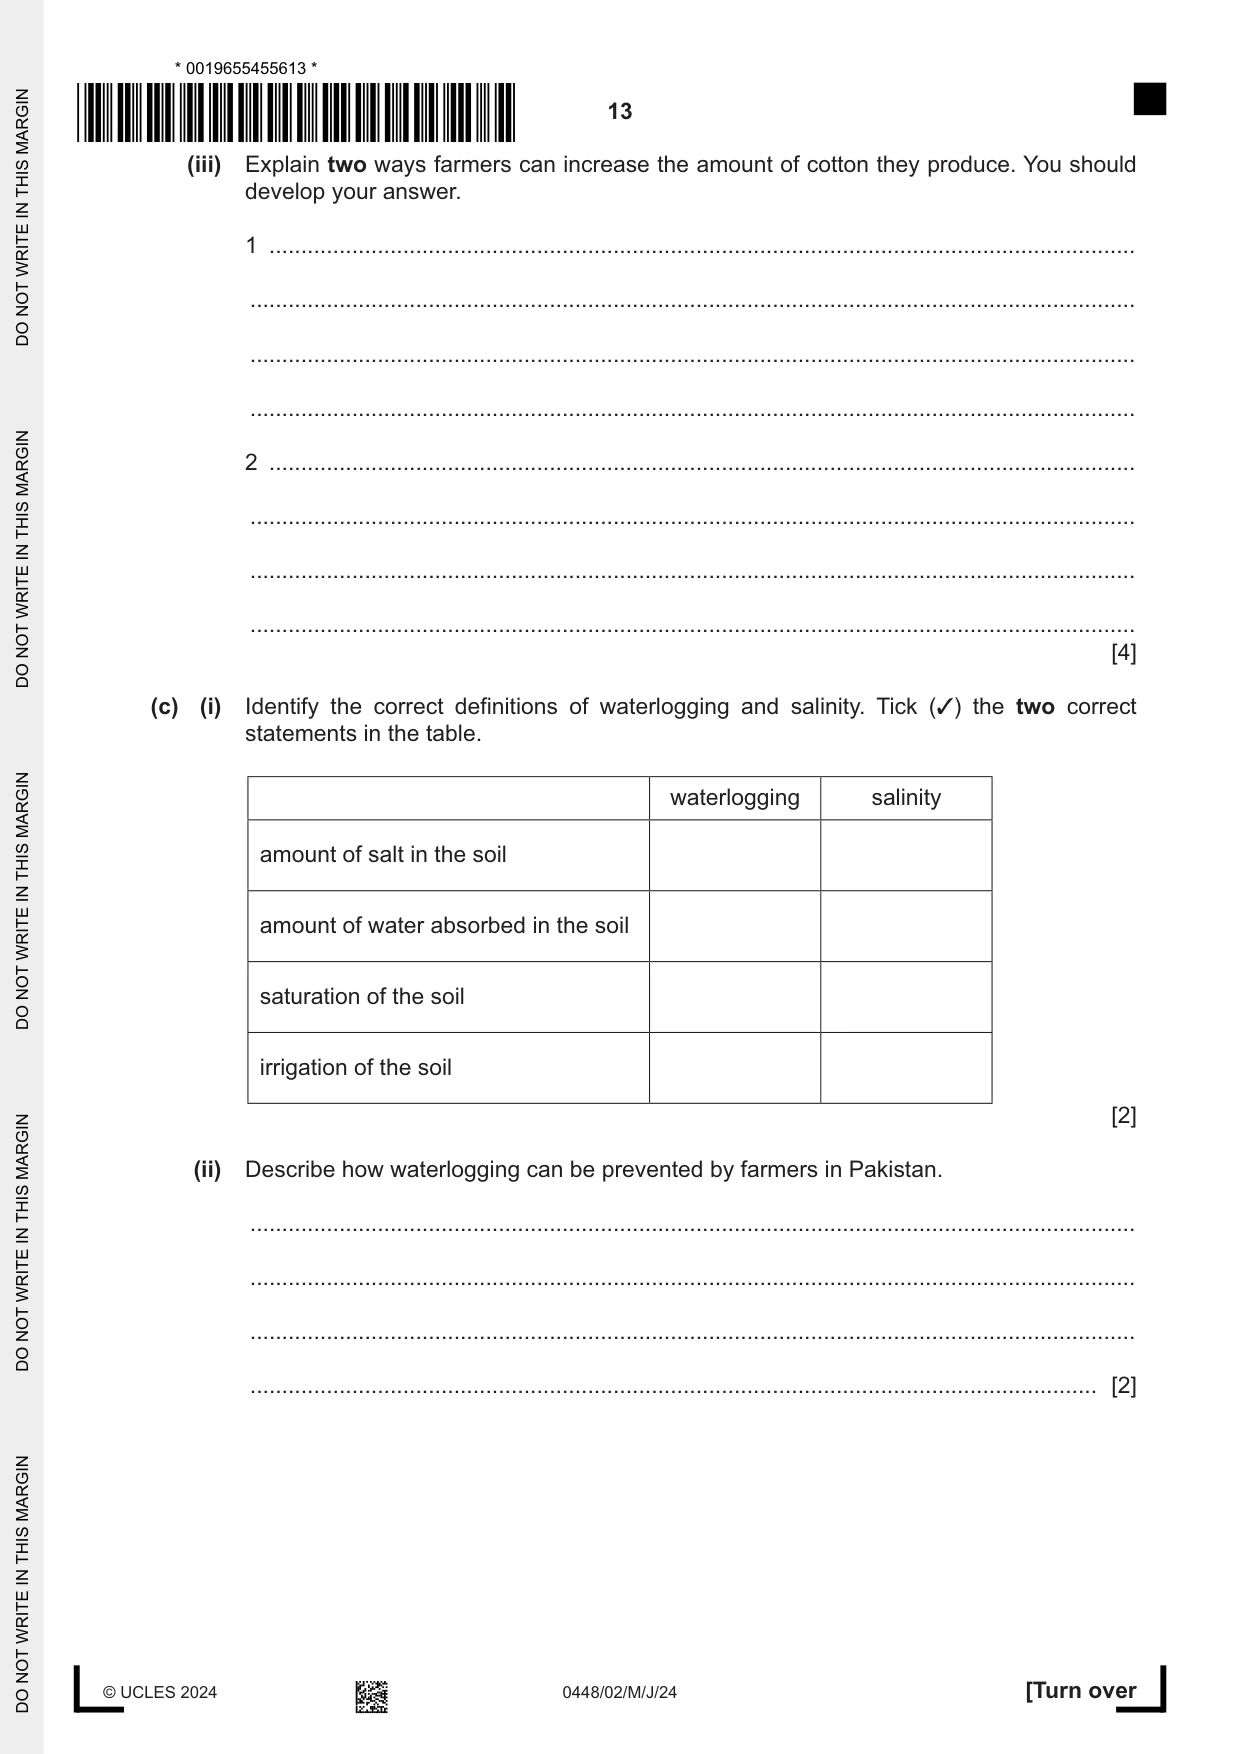
3 (a) (i) Study Fig. 3.1, a map of sugar cane production in southern and western Pakistan. 64°E 68°E 72°E N 0 100 200 300 km 36°N 36°N AFGHANISTAN 32°N 32°N Multan 28°N 28°N Indus IRAN River INDIA Karachi Arabian Sea 24°N 24°N 64°E 68°E 72°E Key main areas of sugar cane production international boundary river Fig. 3.1 Using Fig. 3.1 only: – measure the distance between Karachi and Multan. .......................................... km – state the compass direction from Karachi to Multan. .......................................... [2] (ii) Using Fig. 3.1 only, describe the distribution of the main areas of sugar cane production in Pakistan. ........................................................................................................................................... ........................................................................................................................................... ........................................................................................................................................... ........................................................................................................................................... ........................................................................................................................................... ..................................................................................................................................... [3] (iii) State three natural factors which promote the growth of sugar cane. 1 ........................................................................................................................................ 2 ........................................................................................................................................ 3 ........................................................................................................................................ [3] (b) (i) Study Fig. 3.2, a diagram of the processes involved in cotton fibre production. mature cotton boll ........................ ........................ cotton gin waste cotton lint ....................................... cotton cotton landfill compost fibre seed seed meal oil .................... Fig. 3.2 Complete Fig. 3.2 by placing the correct words from the box in the spaces in the diagram. cotton seed ginning harvesting livestock feed [2] (ii) Name one city in Pakistan that is important for the manufacturing of cotton yarn. .................................................... [1] (iii) Explain two ways farmers can increase the amount of cotton they produce. You should develop your answer. 1 ........................................................................................................................................ ........................................................................................................................................... ........................................................................................................................................... ........................................................................................................................................... 2 ........................................................................................................................................ ........................................................................................................................................... ........................................................................................................................................... ........................................................................................................................................... [4] (c) (i) Identify the correct definitions of waterlogging and salinity. Tick (✓) the two correct statements in the table. waterlogging salinity amount of salt in the soil amount of water absorbed in the soil saturation of the soil irrigation of the soil [2] (ii) Describe how waterlogging can be prevented by farmers in Pakistan. ........................................................................................................................................... ........................................................................................................................................... ........................................................................................................................................... ..................................................................................................................................... [2] (d) Evaluate the importance of increasing agricultural output for the people and economy of Pakistan. Give reasons to support your judgement and refer to examples you have studied. You should consider different points of view in your answer. ................................................................................................................................................... ................................................................................................................................................... ................................................................................................................................................... ................................................................................................................................................... ................................................................................................................................................... ................................................................................................................................................... ................................................................................................................................................... ................................................................................................................................................... ................................................................................................................................................... ................................................................................................................................................... ................................................................................................................................................... ................................................................................................................................................... ................................................................................................................................................... ................................................................................................................................................... ................................................................................................................................................... ................................................................................................................................................... ................................................................................................................................................... ............................................................................................................................................. [6] [Total: 25]
Question 4
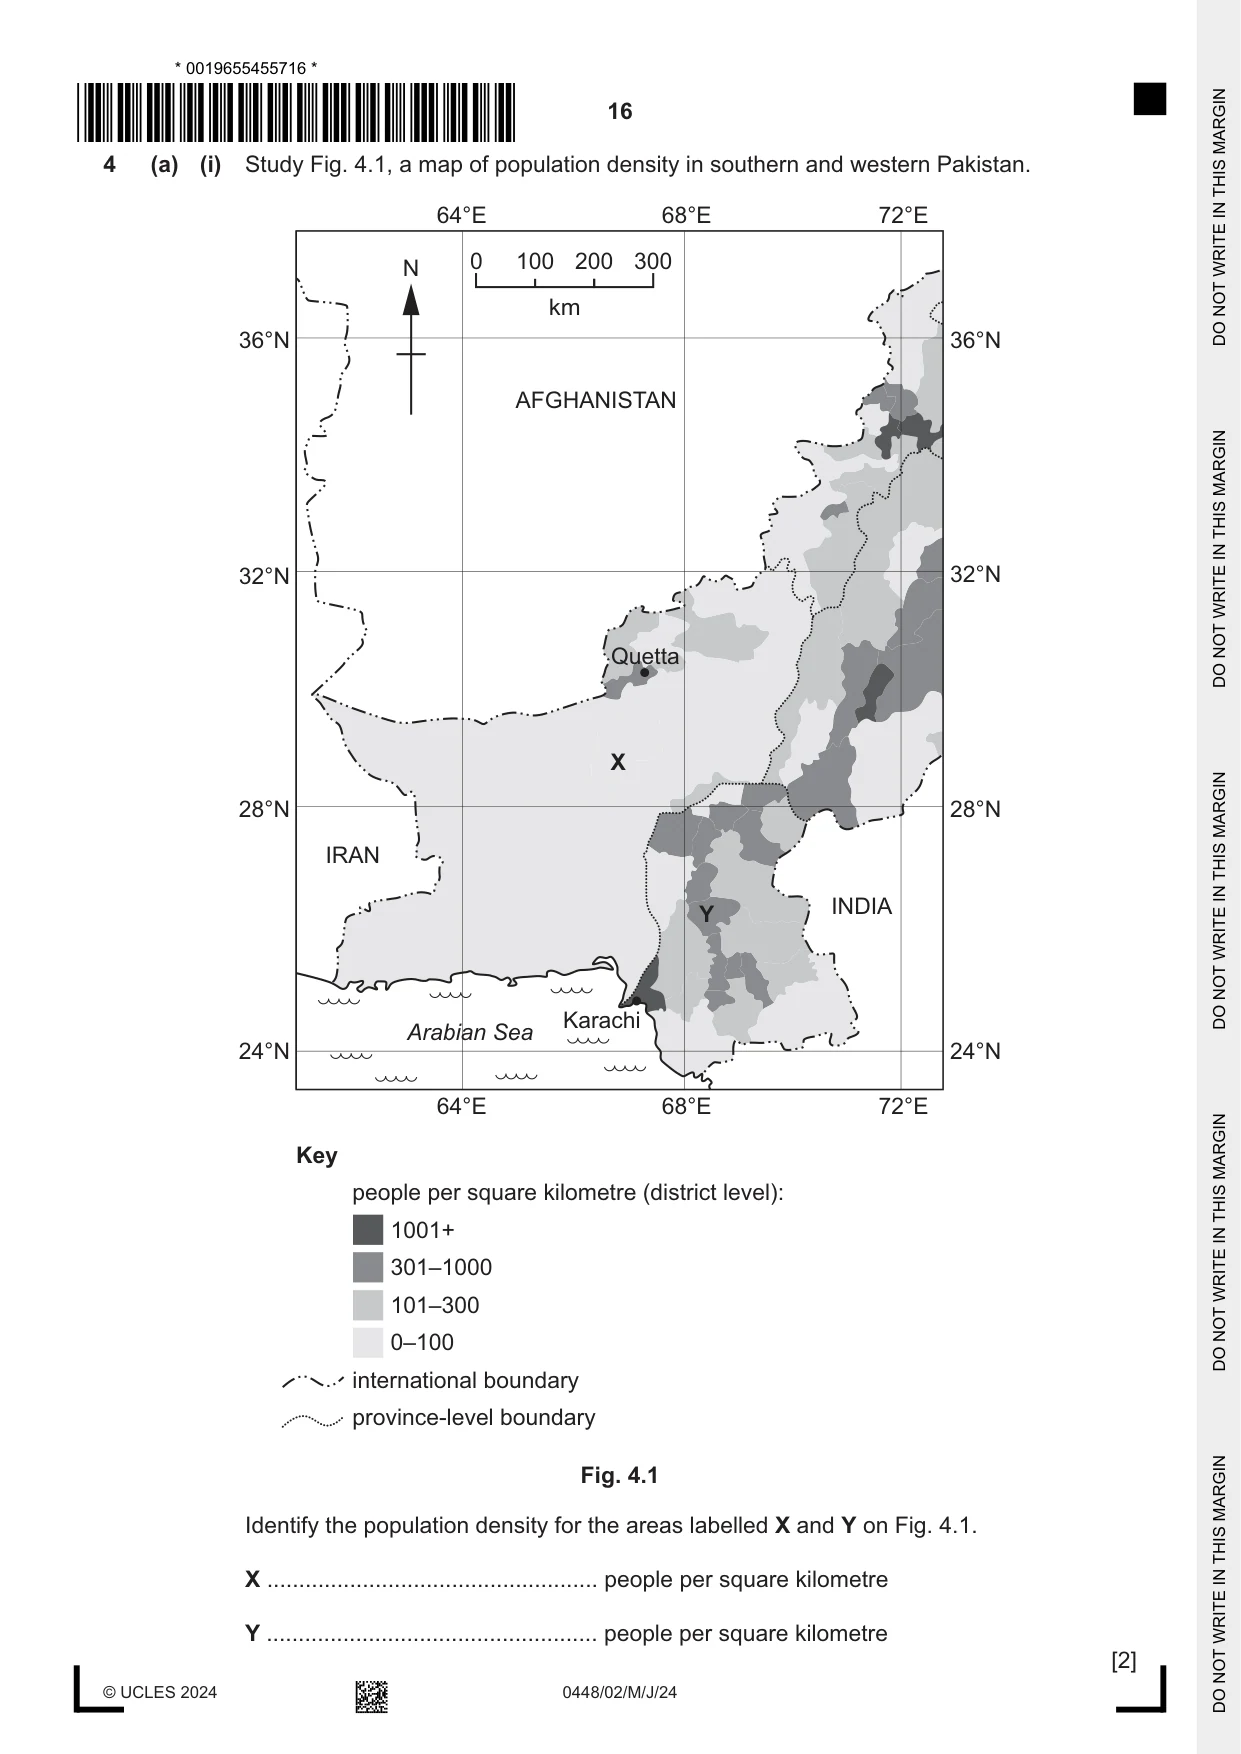
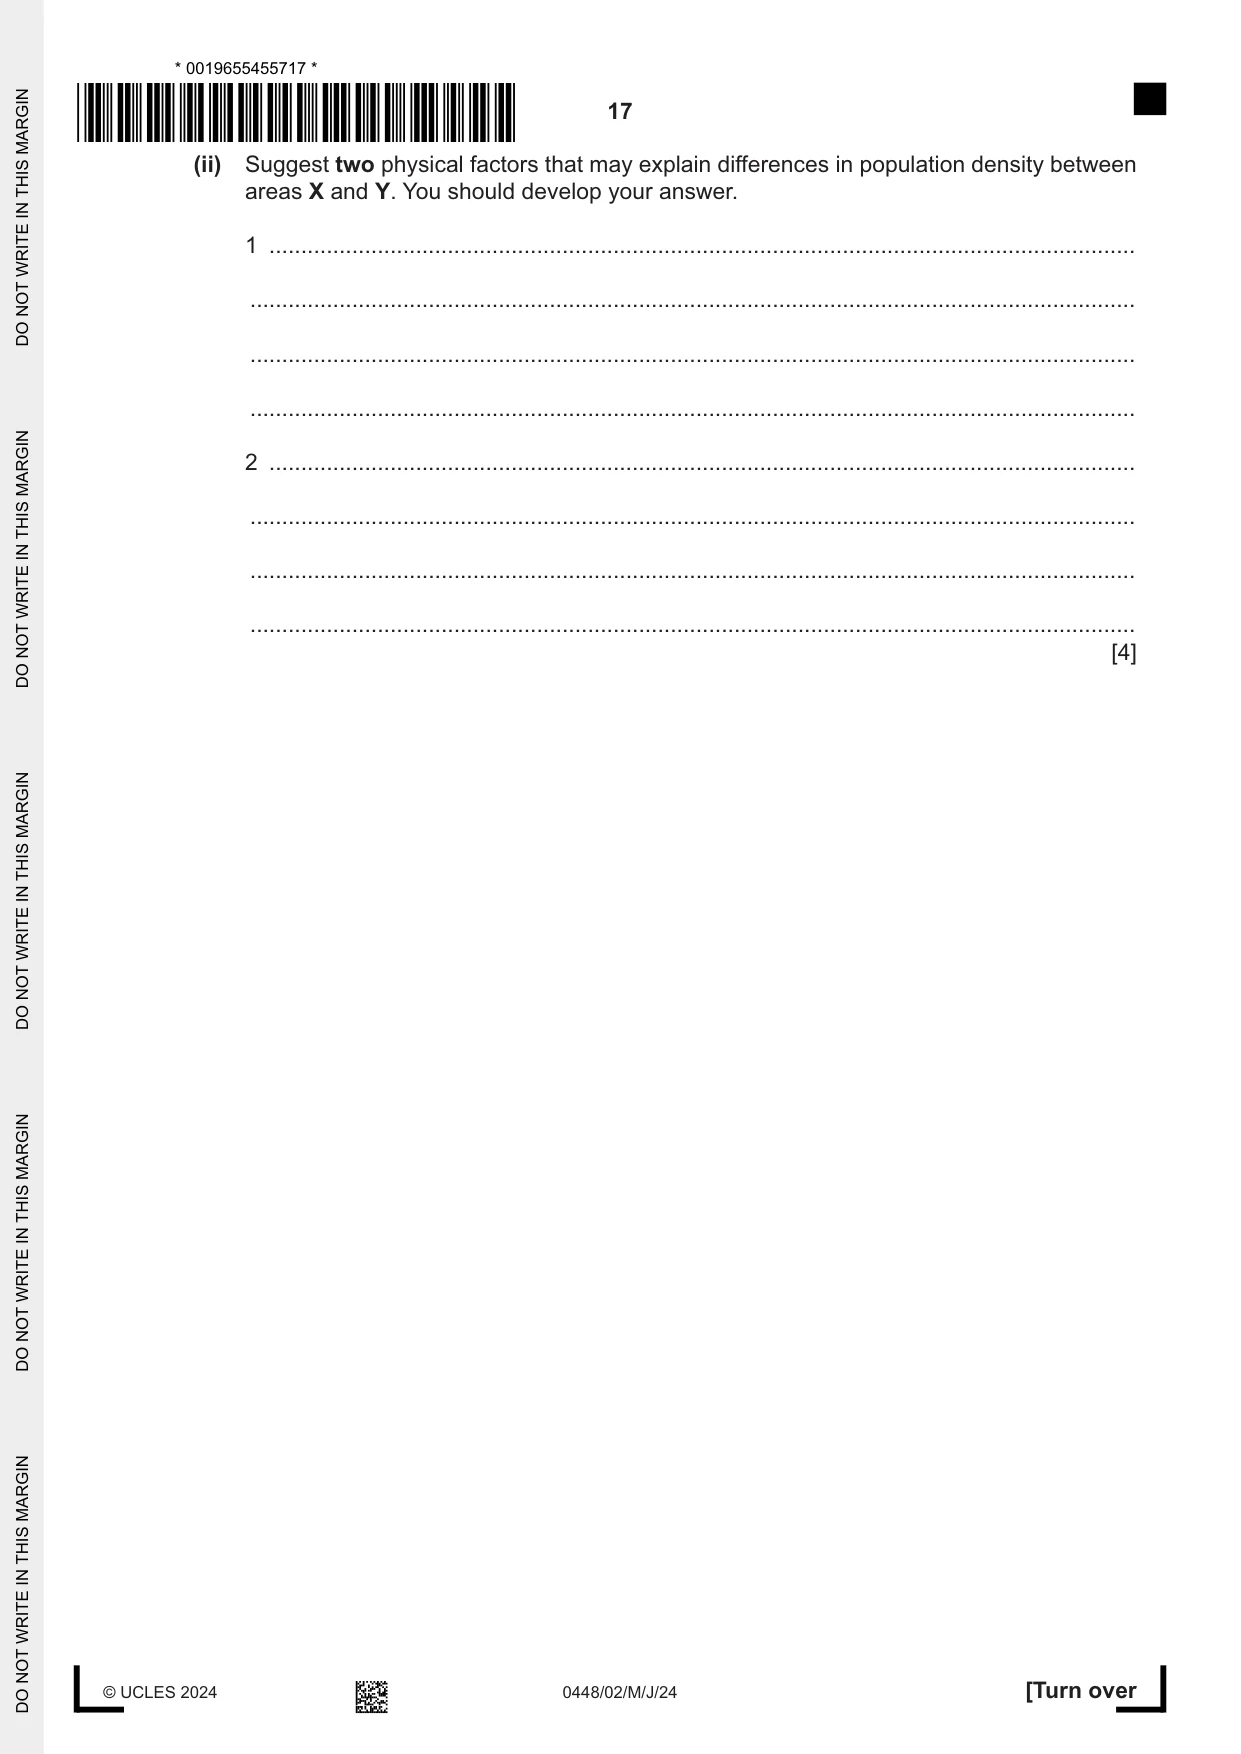
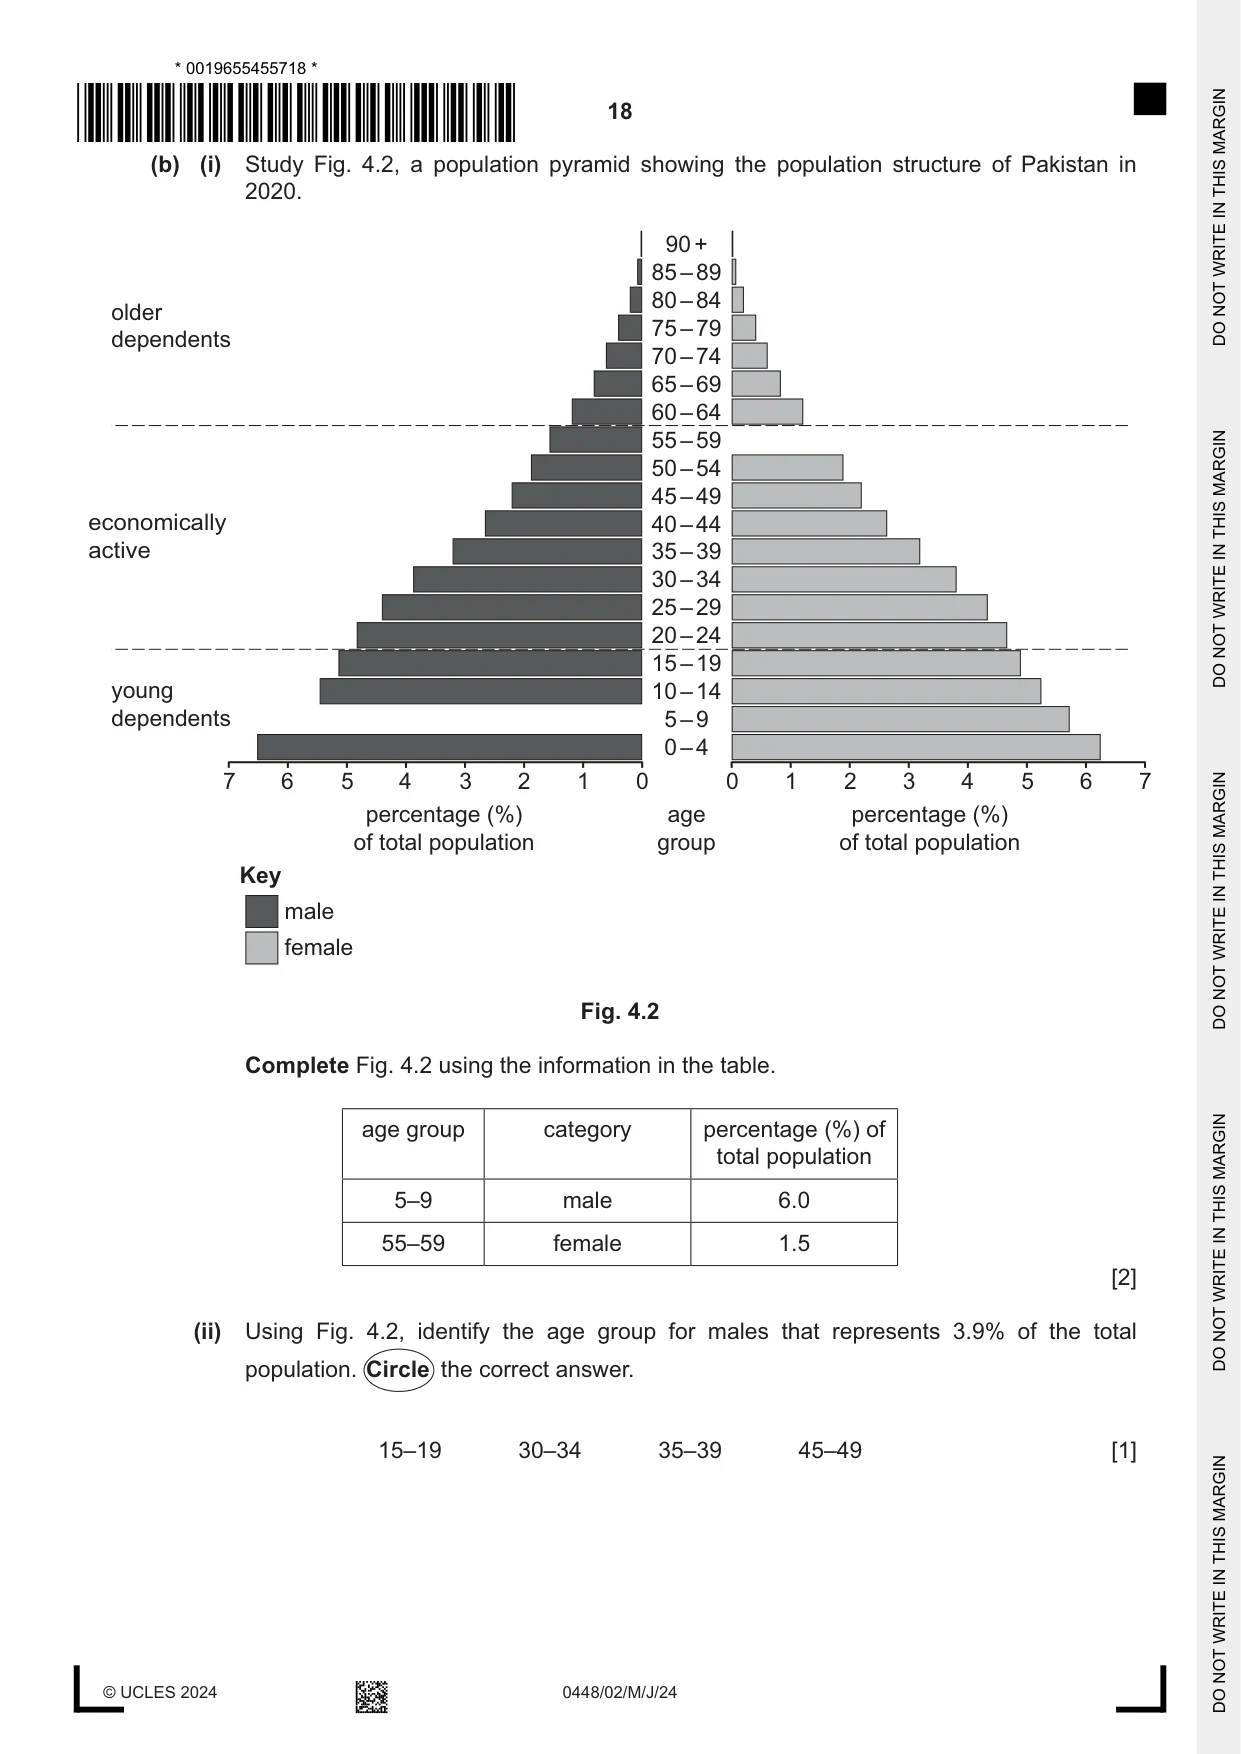
4 (a) (i) Study Fig. 4.1, a map of population density in southern and western Pakistan. 64°E 68°E 72°E 0 100 200 300 N km 36°N 36°N AFGHANISTAN 32°N 32°N Quetta X 28°N 28°N IRAN INDIA Y Karachi Arabian Sea 24°N 24°N 64°E 68°E 72°E Key people per square kilometre (district level): 1001+ 301–1000 101–300 0–100 international boundary province-level boundary Fig. 4.1 Identify the population density for the areas labelled X and Y on Fig. 4.1. X .................................................... people per square kilometre Y .................................................... people per square kilometre [2] (ii) Suggest two physical factors that may explain differences in population density between areas X and Y. You should develop your answer. 1 ........................................................................................................................................ ........................................................................................................................................... ........................................................................................................................................... ........................................................................................................................................... 2 ........................................................................................................................................ ........................................................................................................................................... ........................................................................................................................................... ........................................................................................................................................... [4] (b) (i) Study Fig. 4.2, a population pyramid showing the population structure of Pakistan in 2020. 90 + 85 – 89 80 – 84 older 75 – 79 dependents 70 – 74 65 – 69 60 – 64 55 – 59 50 – 54 45 – 49 economically 40 – 44 active 35 – 39 30 – 34 25 – 29 20 – 24 15 – 19 young 10 – 14 dependents 5 – 9 0 – 4 7 6 5 4 3 2 1 0 0 1 2 3 4 5 6 7 percentage (%) age percentage (%) of total population group of total population Key male female Fig. 4.2 Complete Fig. 4.2 using the information in the table. age group category percentage (%) of total population 5–9 male 6.0 55–59 female 1.5 [2] (ii) Using Fig. 4.2, identify the age group for males that represents 3.9% of the total population. Circle the correct answer. 15–19 30–34 35–39 45–49 [1] (iii) State three impacts of a high percentage of young dependents (people aged 0–19) in Pakistan’s population structure. 1 ........................................................................................................................................ ........................................................................................................................................... 2 ........................................................................................................................................ ........................................................................................................................................... 3 ........................................................................................................................................ ........................................................................................................................................... [3] (iv) Give two reasons for an increasing percentage of older dependents (people aged 60 or over) in Pakistan’s population structure. 1 ........................................................................................................................................ ........................................................................................................................................... 2 ........................................................................................................................................ ........................................................................................................................................... [2] (c) (i) Define ‘seasonal migration’. ........................................................................................................................................... ..................................................................................................................................... [1] (ii) Describe four causes of population migration to urban areas in Pakistan. 1 ........................................................................................................................................ ........................................................................................................................................... 2 ........................................................................................................................................ ........................................................................................................................................... 3 ........................................................................................................................................ ........................................................................................................................................... 4 ........................................................................................................................................ ........................................................................................................................................... [4] (d) Rural-urban migration can create problems in urban areas. To what extent have measures used to improve housing and services in urban areas solved these problems in Pakistan? Give reasons to support your judgement and refer to examples you have studied. You should consider different points of view in your answer. ................................................................................................................................................... ................................................................................................................................................... ................................................................................................................................................... ................................................................................................................................................... ................................................................................................................................................... ................................................................................................................................................... ................................................................................................................................................... ................................................................................................................................................... ................................................................................................................................................... ................................................................................................................................................... ................................................................................................................................................... ................................................................................................................................................... ................................................................................................................................................... ................................................................................................................................................... ................................................................................................................................................... ................................................................................................................................................... ................................................................................................................................................... ............................................................................................................................................. [6] [Total: 25]
Question 5
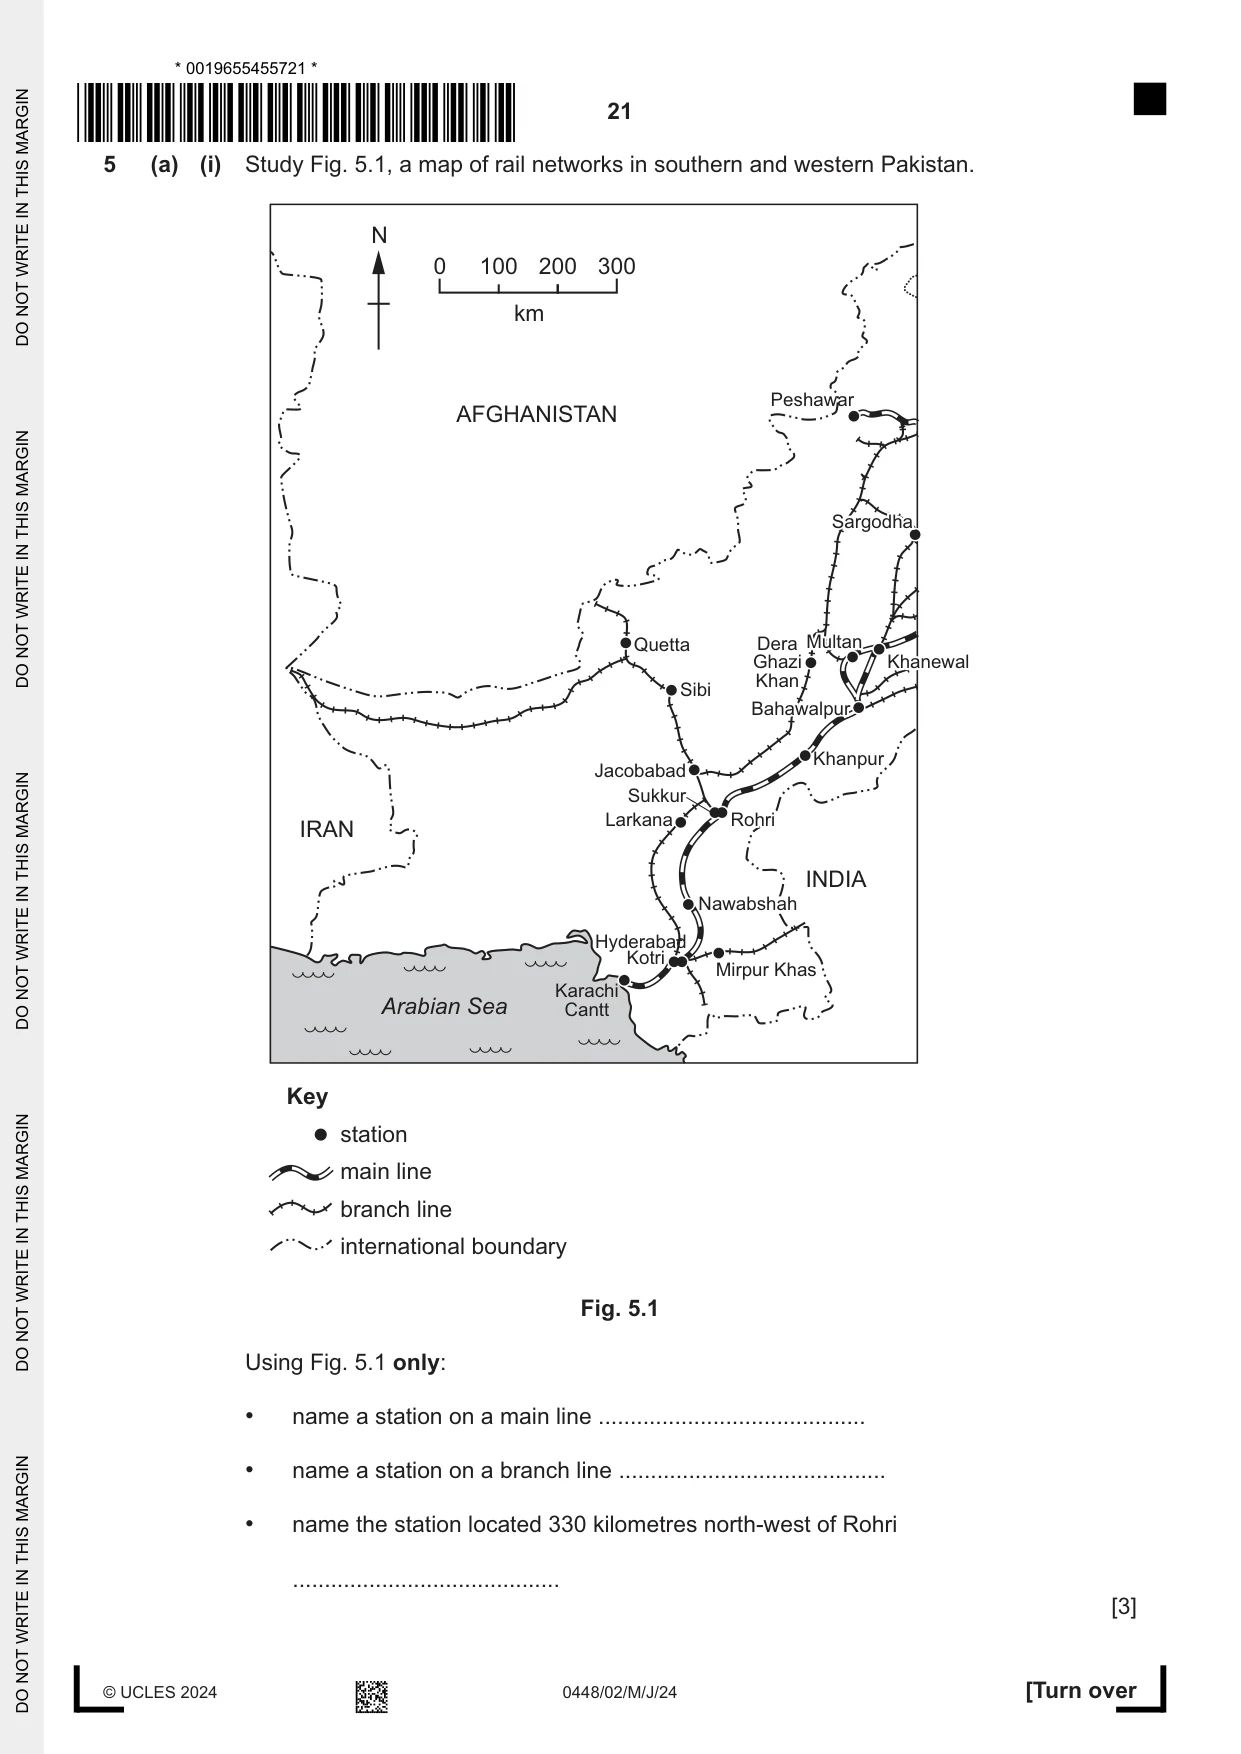
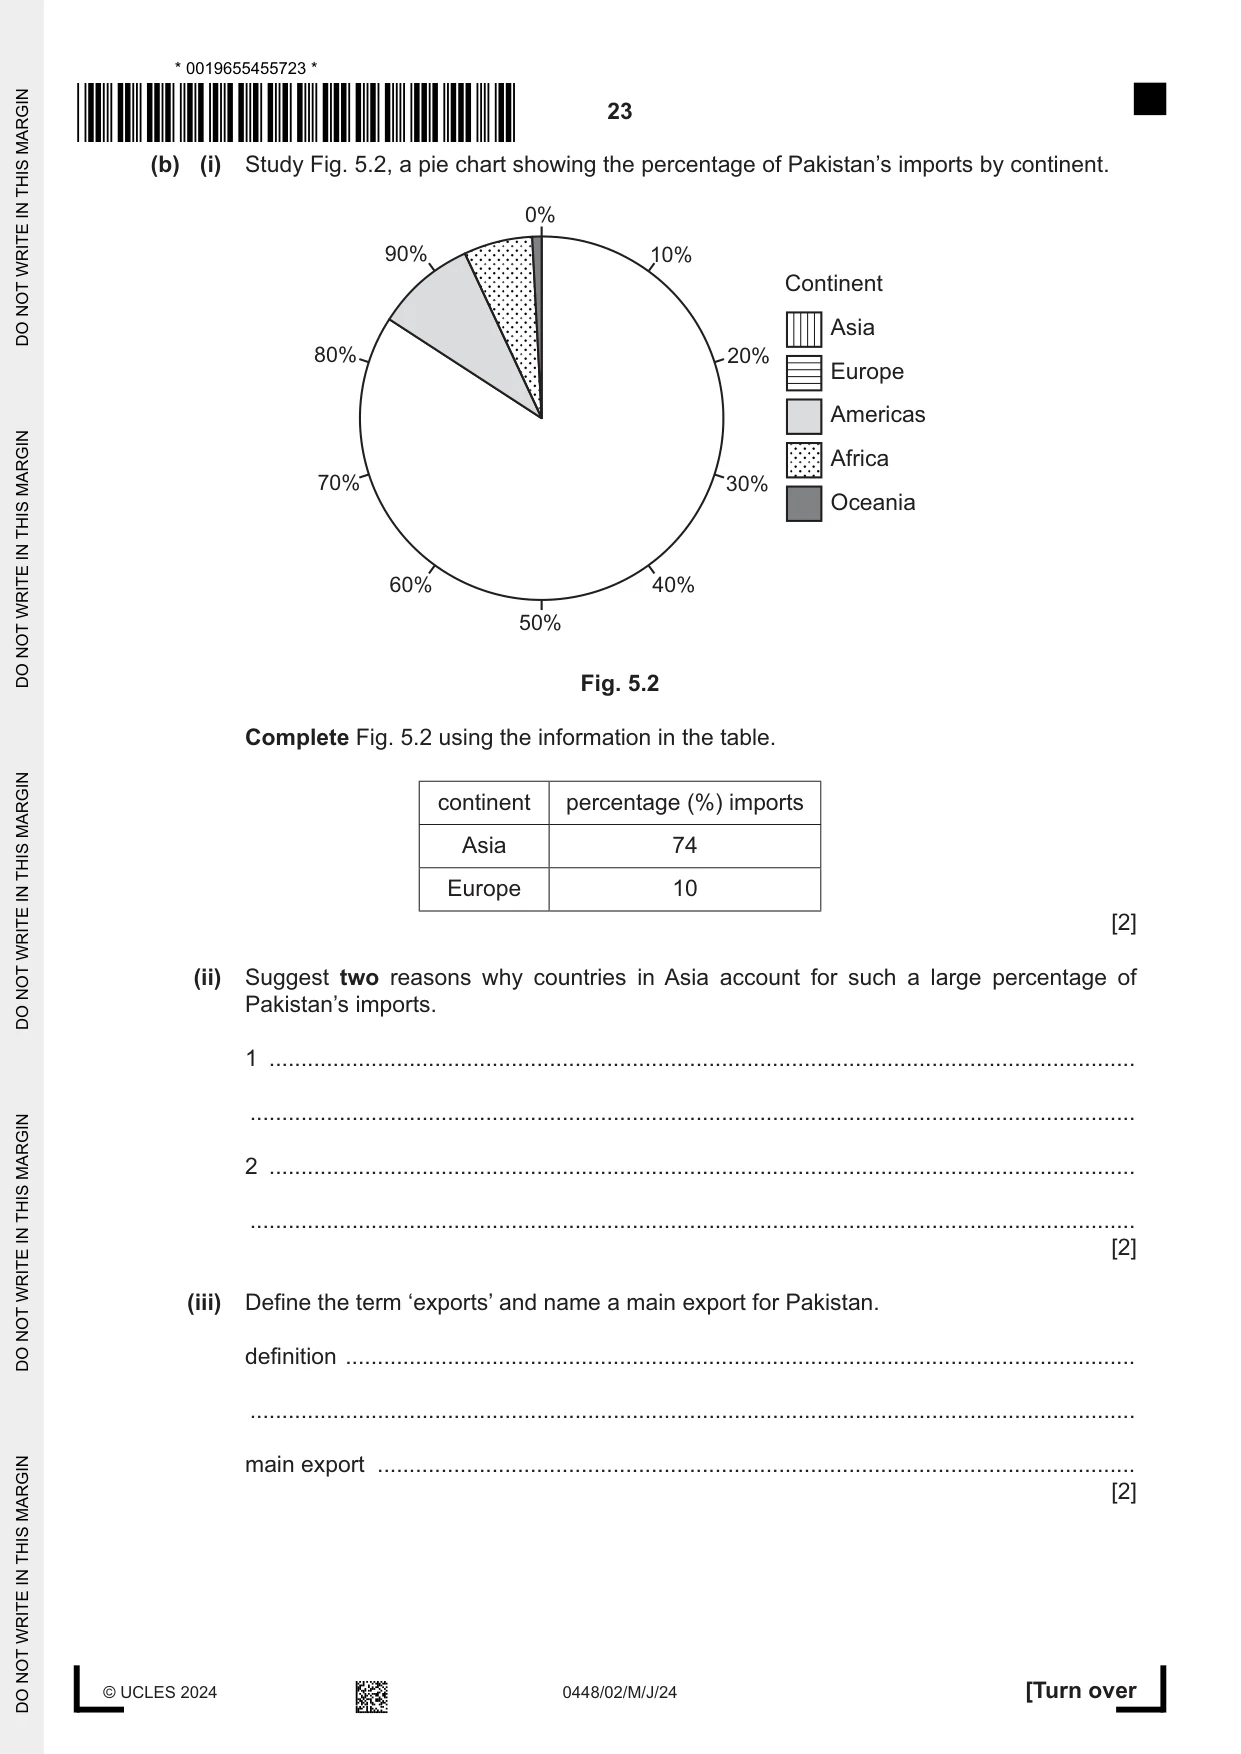
5 (a) (i) Study Fig. 5.1, a map of rail networks in southern and western Pakistan. N 0 100 200 300 km Peshawar AFGHANISTAN SargodhaSargodha Quetta Dera MultanMultan Ghazi KhanewalKhanewal Khan Sibi BahawalpurBahawalpur Khanpur Jacobabad Sukkur Larkana RohriRohri IRAN INDIA Nawabshah Hyderabad Kotri Mirpur Khas Karachi Arabian Sea Cantt Key station main line branch line international boundary Fig. 5.1 Using Fig. 5.1 only: • name a station on a main line .......................................... • name a station on a branch line .......................................... • name the station located 330 kilometres north-west of Rohri .......................................... [3] (ii) State two reasons why railway lines are unevenly distributed in Pakistan. 1 ........................................................................................................................................ ........................................................................................................................................... 2 ........................................................................................................................................ ........................................................................................................................................... [2] (iii) Describe one advantage and one disadvantage of rail transport for people in Pakistan. advantage ......................................................................................................................... ........................................................................................................................................... disadvantage ..................................................................................................................... ........................................................................................................................................... [2] (iv) Describe how rail transport in Pakistan has recently been improved. ........................................................................................................................................... ........................................................................................................................................... ........................................................................................................................................... ..................................................................................................................................... [2] (b) (i) Study Fig. 5.2, a pie chart showing the percentage of Pakistan’s imports by continent. 0% 90% 10% Continent Asia 80% 20% Europe Americas Africa 70% 30% Oceania 60% 40% 50% Fig. 5.2 Complete Fig. 5.2 using the information in the table. continent percentage (%) imports Asia 74 Europe 10 [2] (ii) Suggest two reasons why countries in Asia account for such a large percentage of Pakistan’s imports. 1 ........................................................................................................................................ ........................................................................................................................................... 2 ........................................................................................................................................ ........................................................................................................................................... [2] (iii) Define the term ‘exports’ and name a main export for Pakistan. definition ............................................................................................................................ ........................................................................................................................................... main export ....................................................................................................................... [2]