Cambridge IGCSE Pakistan Studies 0448 — 2013 May/June Paper 2 · Variant 1
0448/21/M/J/13 · 5 questions · 75 marks · ≈84 min
The question paper and its mark scheme, free to read here and free to download. This is Cambridge’s own paper, exactly as it was sat.
Question paper25 pages



Mark scheme12 pages
Answers below. Sit the paper first if you are practising.
Questions as text
Question 1
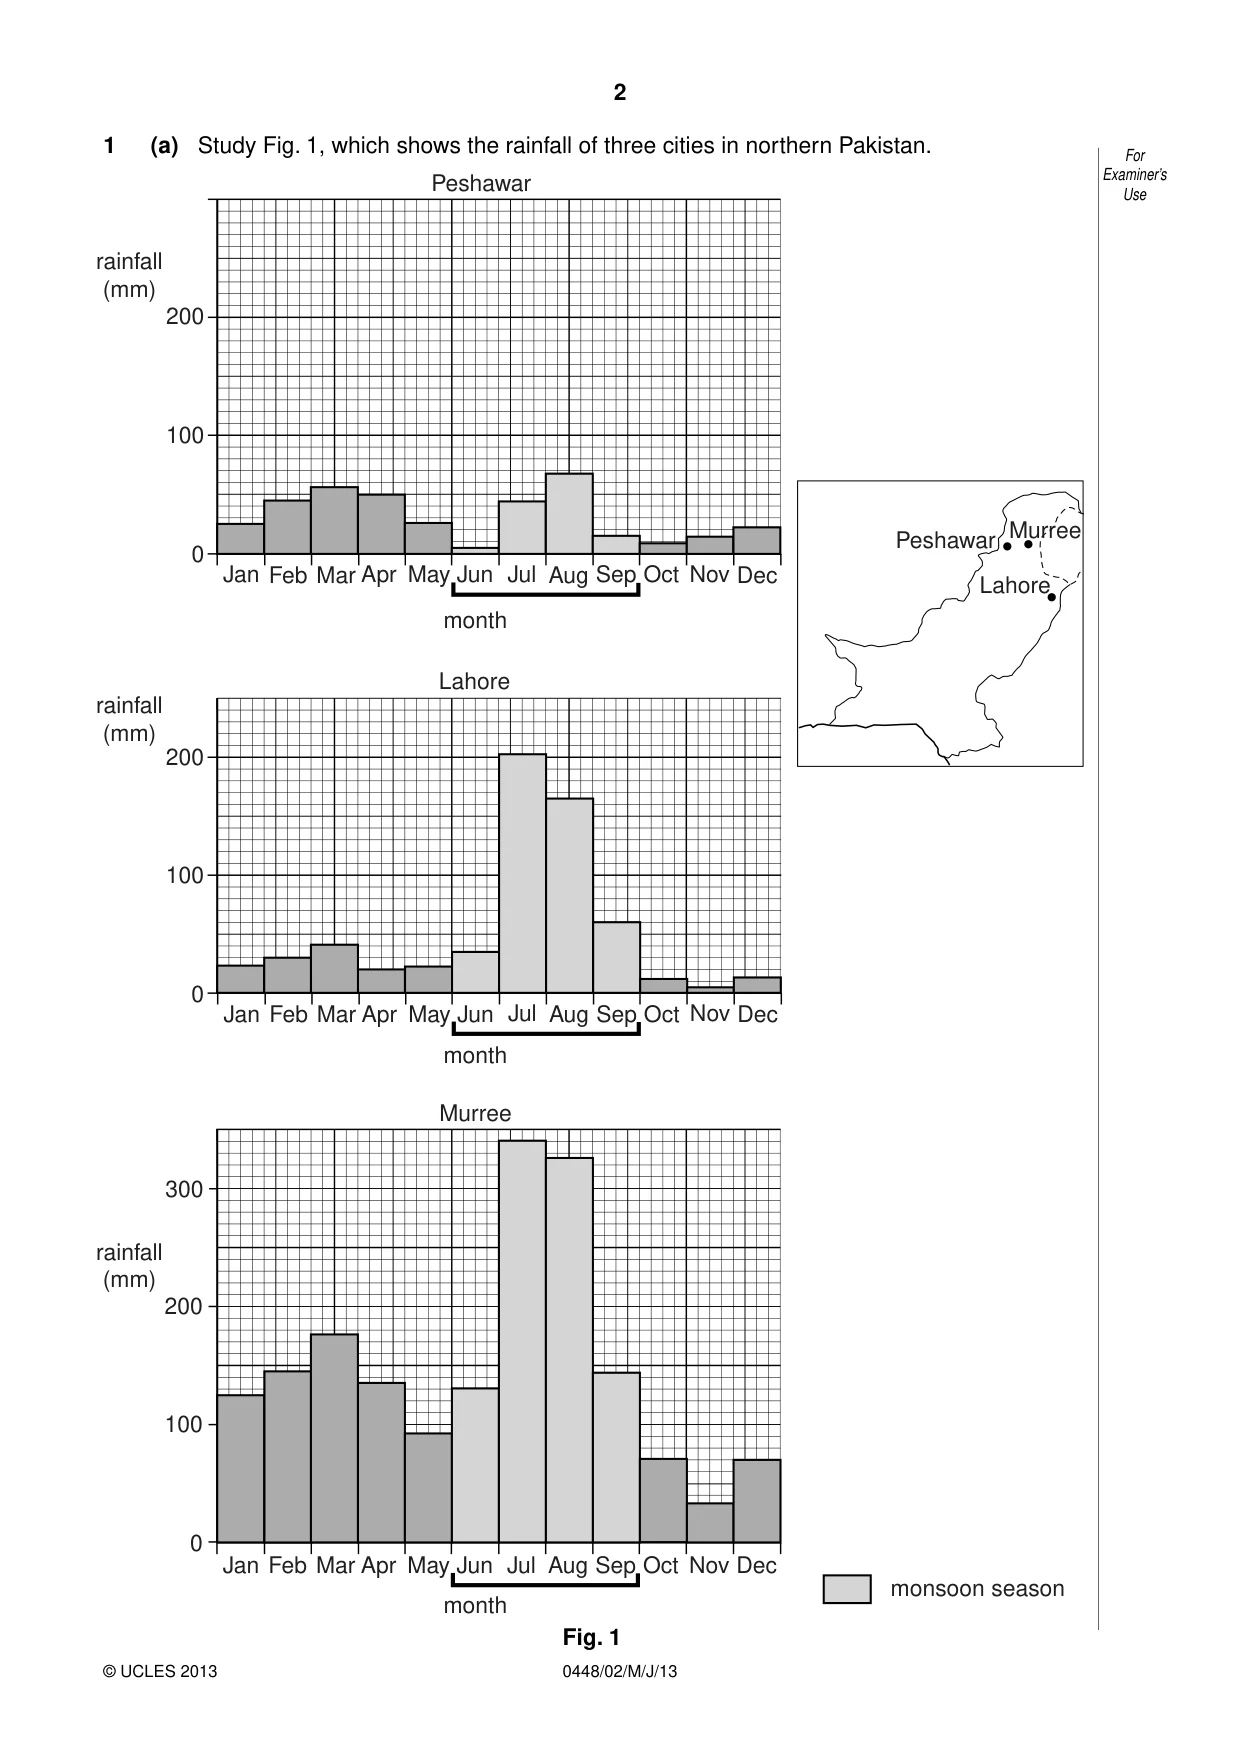
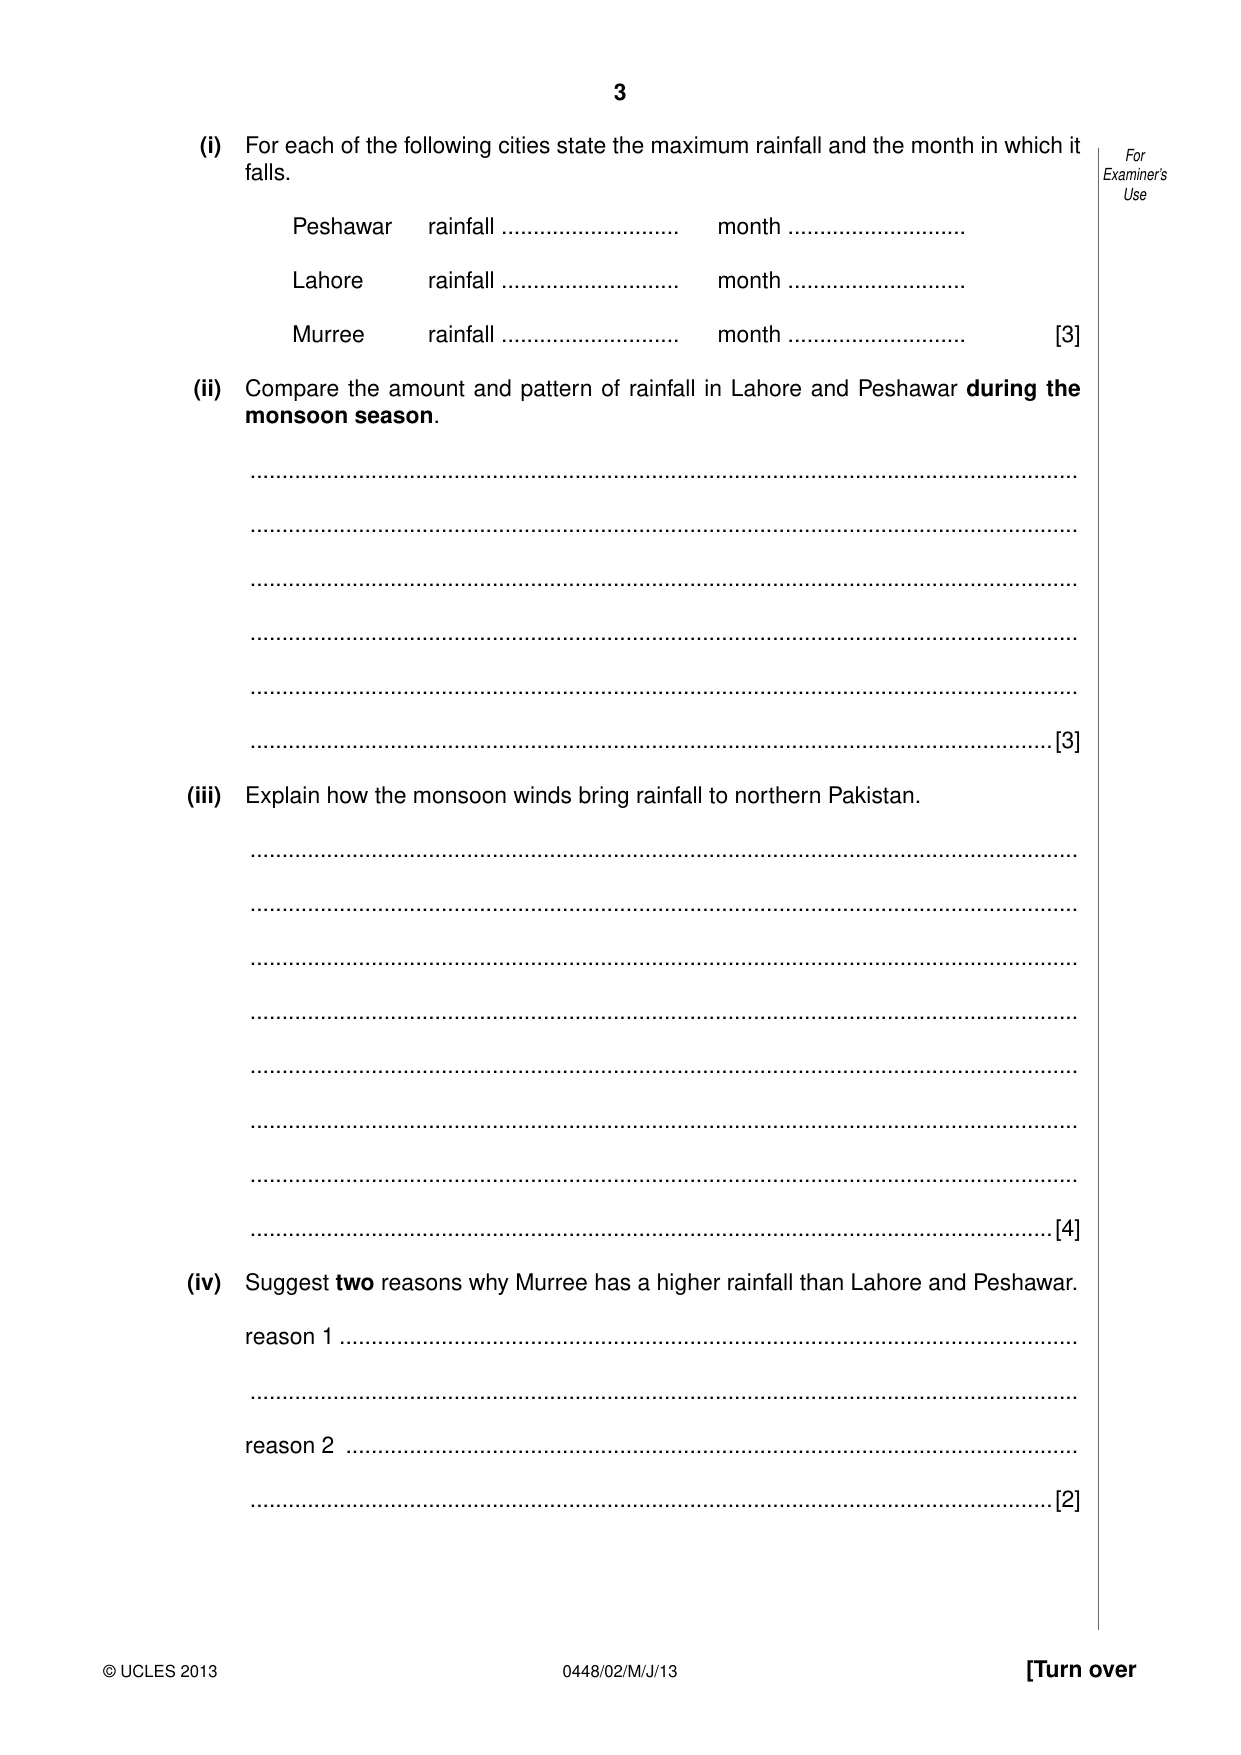
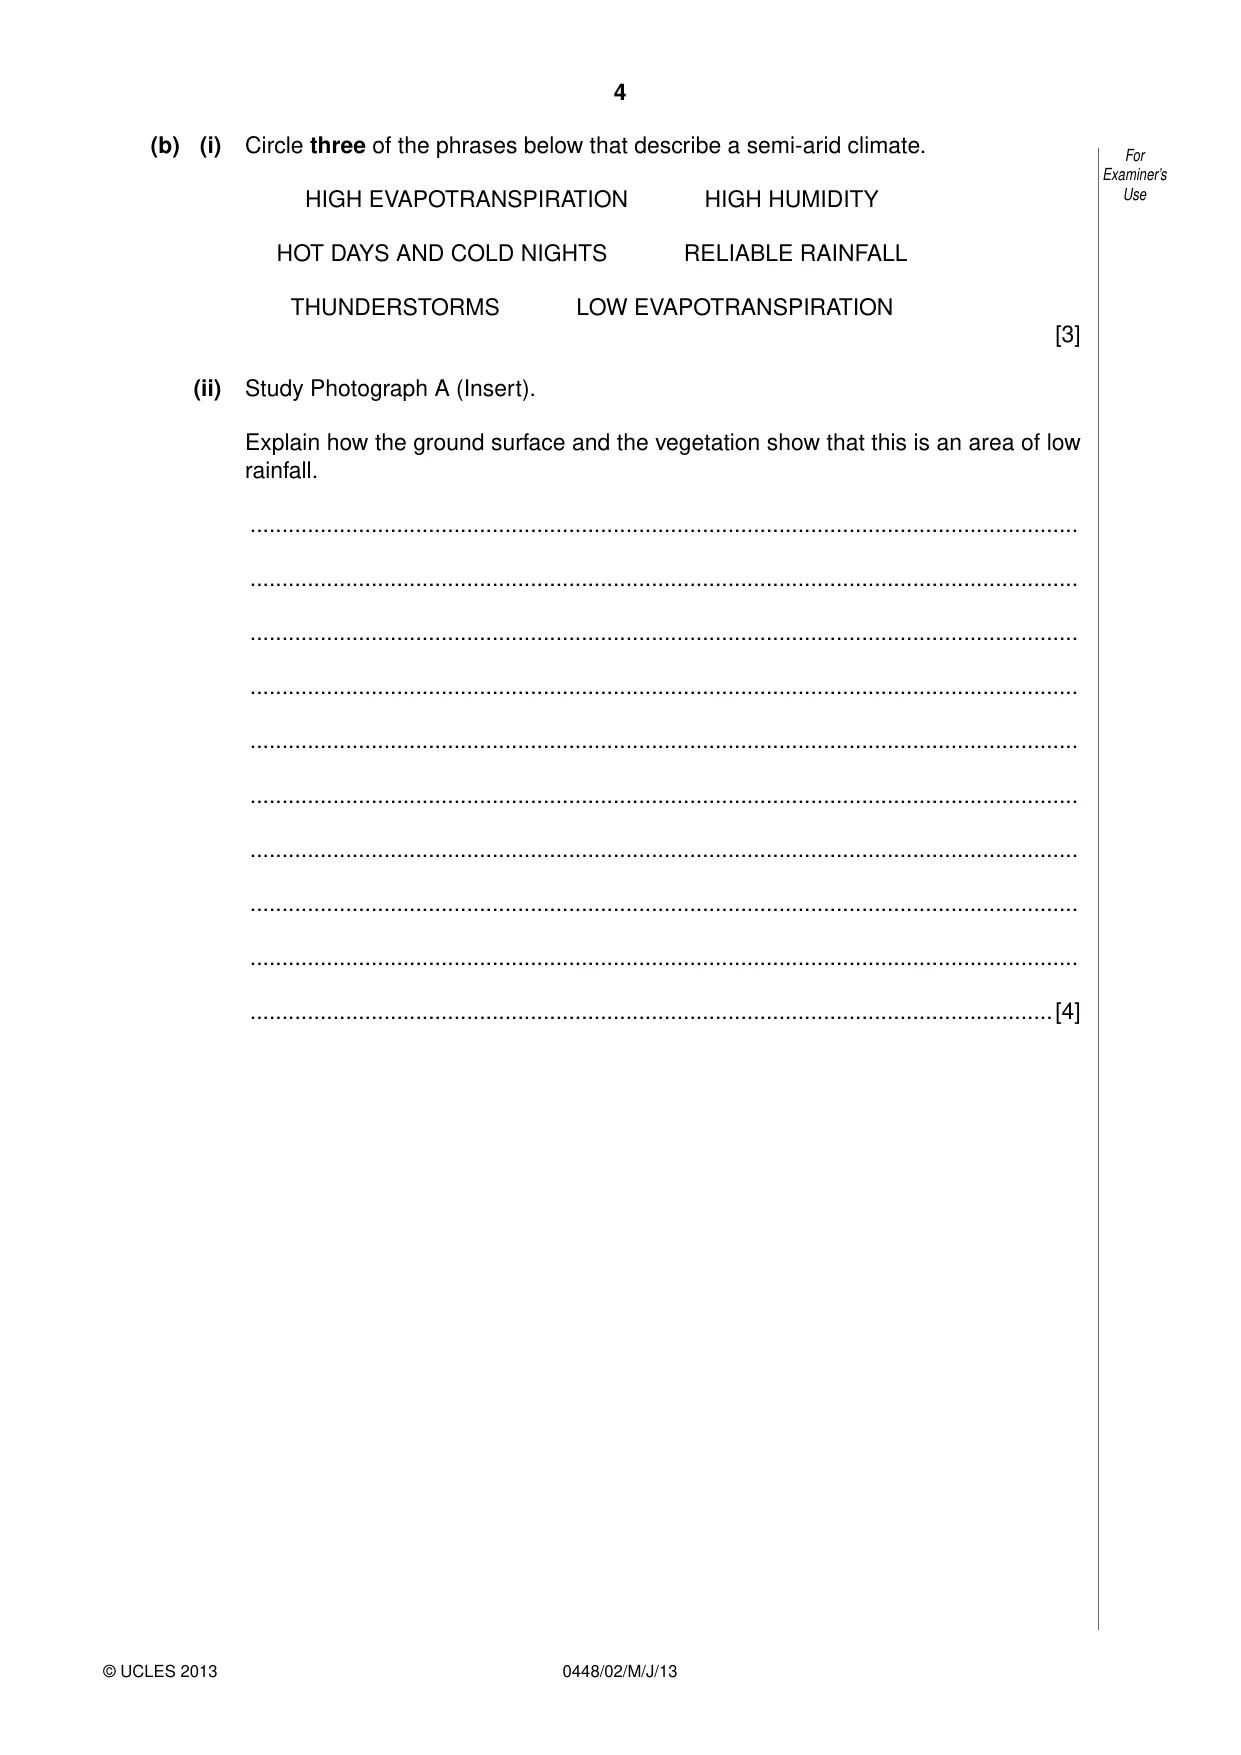
1 (a) Study Fig. 1, which shows the rainfall of three cities in northern Pakistan. Peshawar rainfall (mm) 200 100 Murree Peshawar 0 Jan Feb Mar Apr May Jun Jul Aug Sep Oct Nov Dec Lahore month Lahore rainfall (mm) 200 100 0 Jan Feb Mar Apr May Jun Jul Aug Sep Oct Nov Dec month Murree 300 rainfall (mm) 200 100 0 Jan Feb Mar Apr May Jun Jul Aug Sep Oct Nov Dec monsoon season month Fig. 1 (i) For each of the following cities state the maximum rainfall and the month in which it falls. Peshawar rainfall ............................ month ............................ Lahore rainfall ............................ month ............................ Murree rainfall ............................ month ............................ [3] (ii) Compare the amount and pattern of rainfall in Lahore and Peshawar during the monsoon season. .................................................................................................................................. .................................................................................................................................. .................................................................................................................................. .................................................................................................................................. .................................................................................................................................. ..............................................................................................................................[3] (iii) Explain how the monsoon winds bring rainfall to northern Pakistan. .................................................................................................................................. .................................................................................................................................. .................................................................................................................................. .................................................................................................................................. .................................................................................................................................. .................................................................................................................................. .................................................................................................................................. ..............................................................................................................................[4] (iv) Suggest two reasons why Murree has a higher rainfall than Lahore and Peshawar. reason 1 .................................................................................................................... .................................................................................................................................. reason 2 ................................................................................................................... ..............................................................................................................................[2] (b) (i) Circle three of the phrases below that describe a semi-arid climate. HIGH EVAPOTRANSPIRATION HIGH HUMIDITY HOT DAYS AND COLD NIGHTS RELIABLE RAINFALL THUNDERSTORMS LOW EVAPOTRANSPIRATION [3] (ii) Study Photograph A (Insert). Explain how the ground surface and the vegetation show that this is an area of low rainfall. .................................................................................................................................. .................................................................................................................................. .................................................................................................................................. .................................................................................................................................. .................................................................................................................................. .................................................................................................................................. .................................................................................................................................. .................................................................................................................................. .................................................................................................................................. ..............................................................................................................................[4] (c) Explain the benefits and problems of high rainfall on either farming or road travel. Circle your choice. FARMING ROAD TRAVEL benefits ............................................................................................................................ .......................................................................................................................................... .......................................................................................................................................... .......................................................................................................................................... .......................................................................................................................................... .......................................................................................................................................... .......................................................................................................................................... .......................................................................................................................................... problems .......................................................................................................................... .......................................................................................................................................... .......................................................................................................................................... .......................................................................................................................................... .......................................................................................................................................... .......................................................................................................................................... .......................................................................................................................................... ......................................................................................................................................[6] [Total: 25]
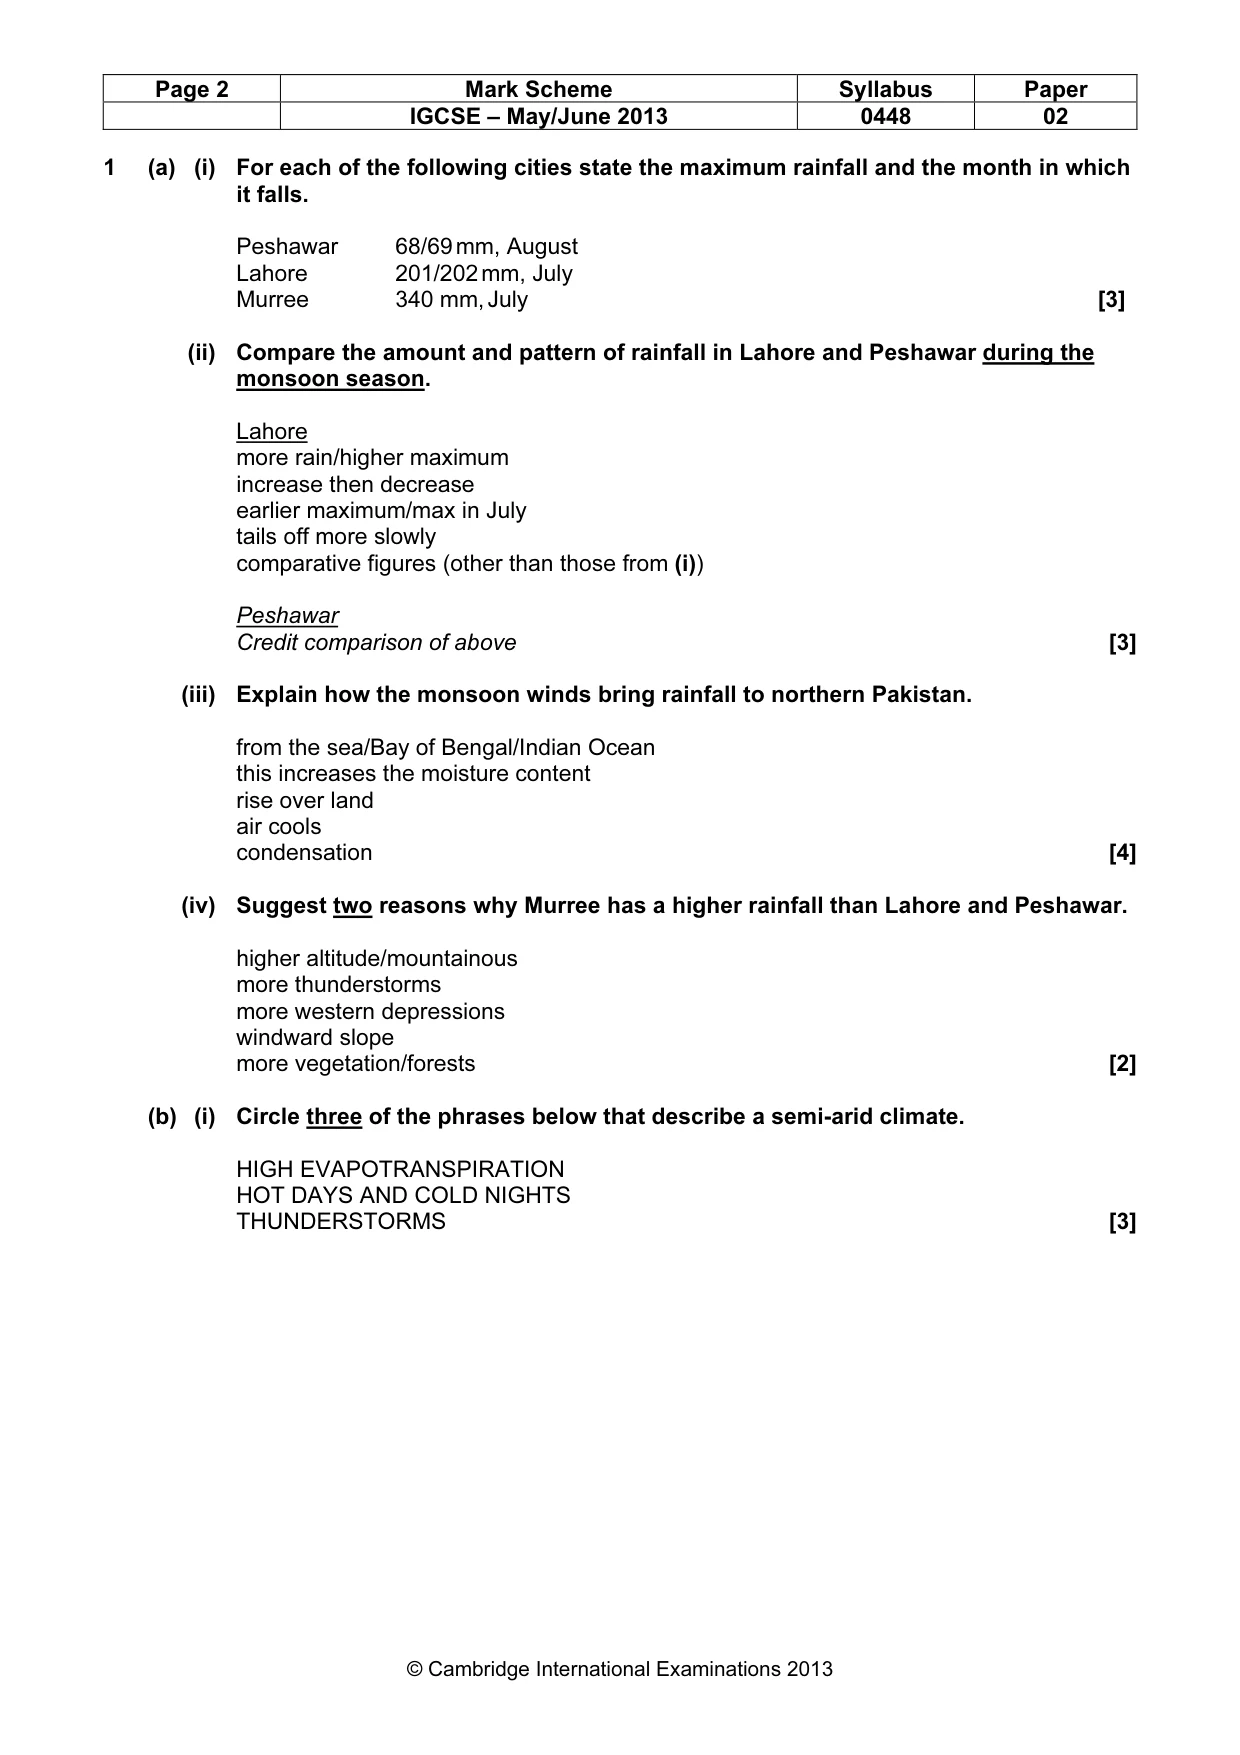
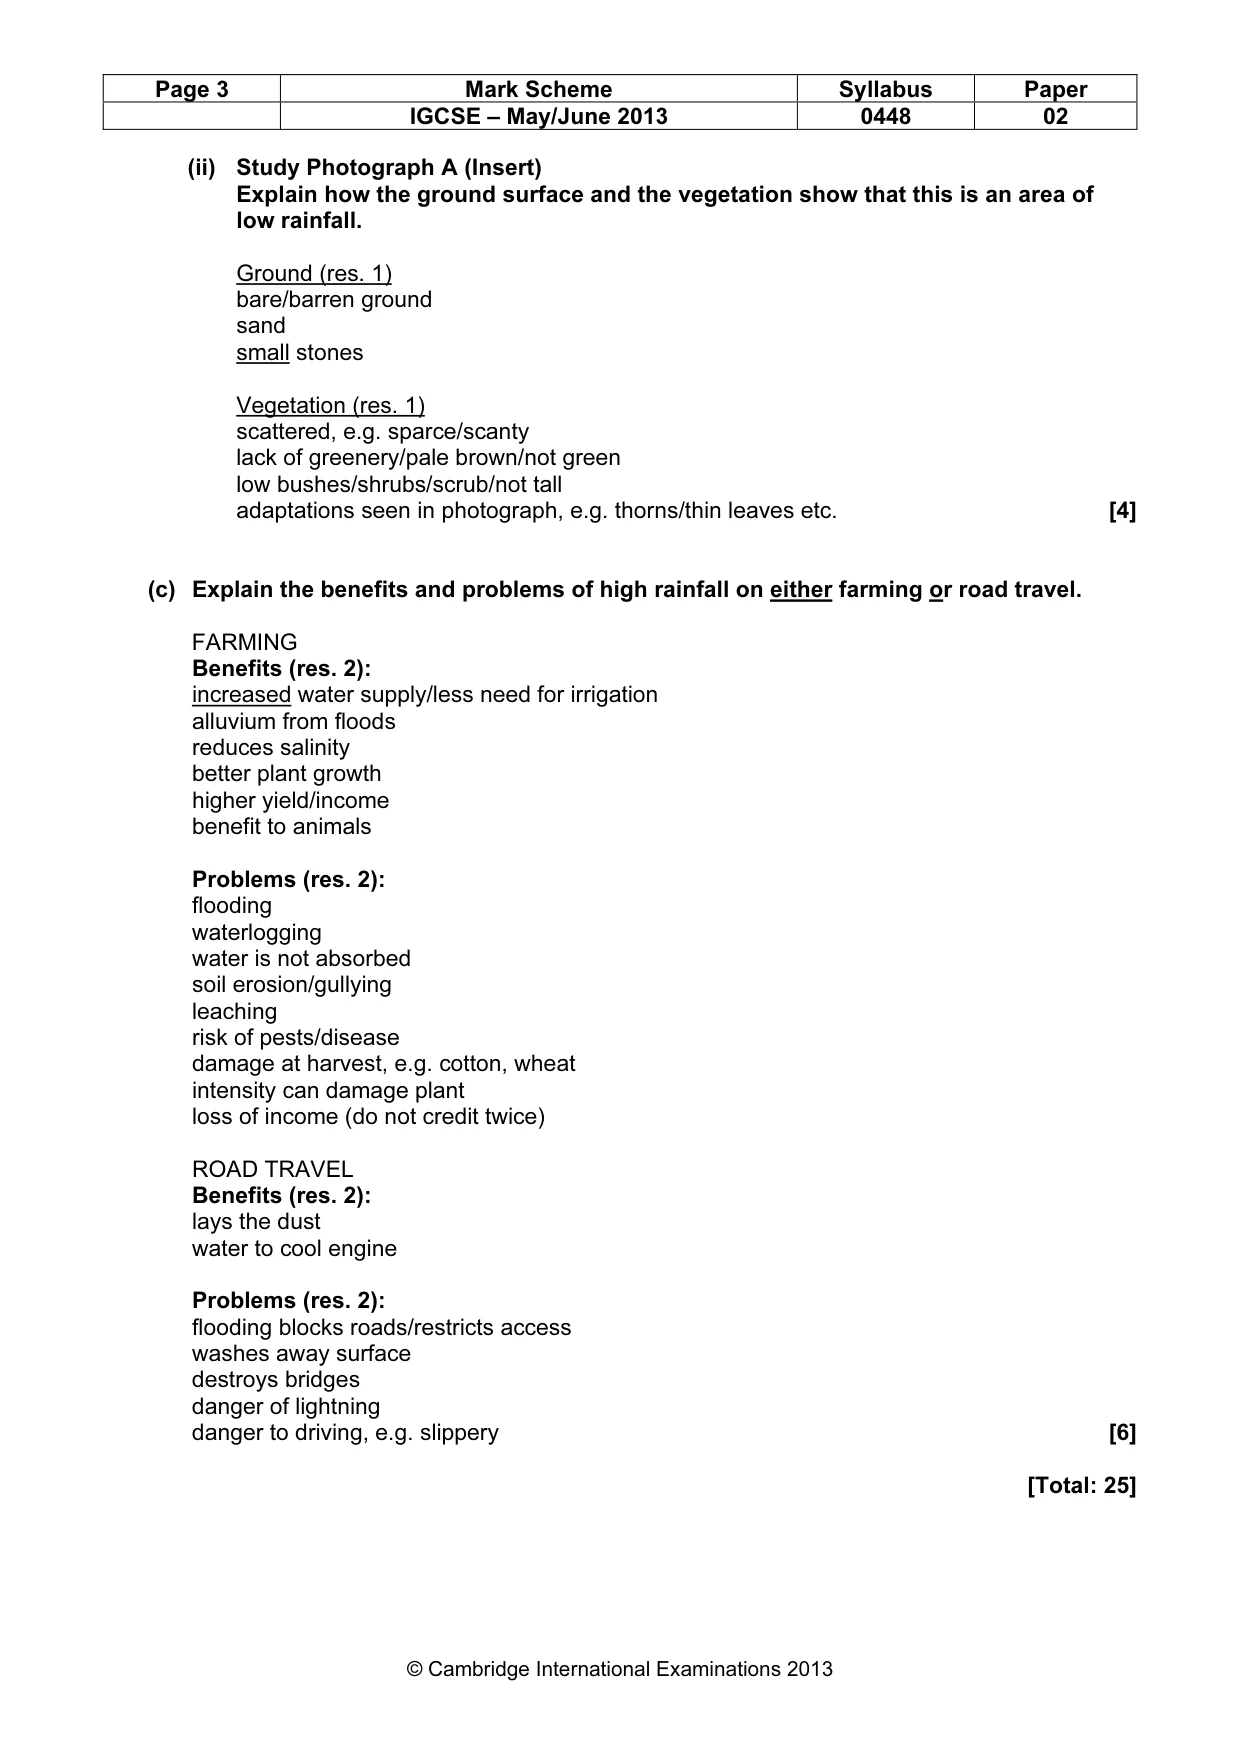
Mark scheme: 1 (a) (i) For each of the following cities state the maximum rainfall and the month in which it falls. Peshawar 68/69 mm, August Lahore 201/202 mm, July Murree 340 mm, July [3] (ii) Compare the amount and pattern of rainfall in Lahore and Peshawar during the monsoon season. Lahore more rain/higher maximum increase then decrease earlier maximum/max in July tails off more slowly comparative figures (other than those from (i)) Peshawar Credit comparison of above [3] (iii) Explain how the monsoon winds bring rainfall to northern Pakistan. from the sea/Bay of Bengal/Indian Ocean this increases the moisture content rise over land air cools condensation [4] (iv) Suggest two reasons why Murree has a higher rainfall than Lahore and Peshawar. higher altitude/mountainous more thunderstorms more western depressions windward slope more vegetation/forests [2] (b) (i) Circle three of the phrases below that describe a semi-arid climate. HIGH EVAPOTRANSPIRATION HOT DAYS AND COLD NIGHTS THUNDERSTORMS [3] IGCSE – May/June 2013 0448 02 (ii) Study Photograph A (Insert) Explain how the ground surface and the vegetation show that this is an area of low rainfall. Ground (res. 1) bare/barren ground sand small stones Vegetation (res. 1) scattered, e.g. sparce/scanty lack of greenery/pale brown/not green low bushes/shrubs/scrub/not tall adaptations seen in photograph, e.g. thorns/thin leaves etc. [4] (c) Explain the benefits and problems of high rainfall on either farming or road travel. FARMING Benefits (res. 2): increased water supply/less need for irrigation alluvium from floods reduces salinity better plant growth higher yield/income benefit to animals Problems (res. 2): flooding waterlogging water is not absorbed soil erosion/gullying leaching risk of pests/disease damage at harvest, e.g. cotton, wheat intensity can damage plant loss of income (do not credit twice) ROAD TRAVEL Benefits (res. 2): lays the dust water to cool engine Problems (res. 2): flooding blocks roads/restricts access washes away surface destroys bridges danger of lightning danger to driving, e.g. slippery [6] [Total: 25] IGCSE – May/June 2013 0448 02
Question 2
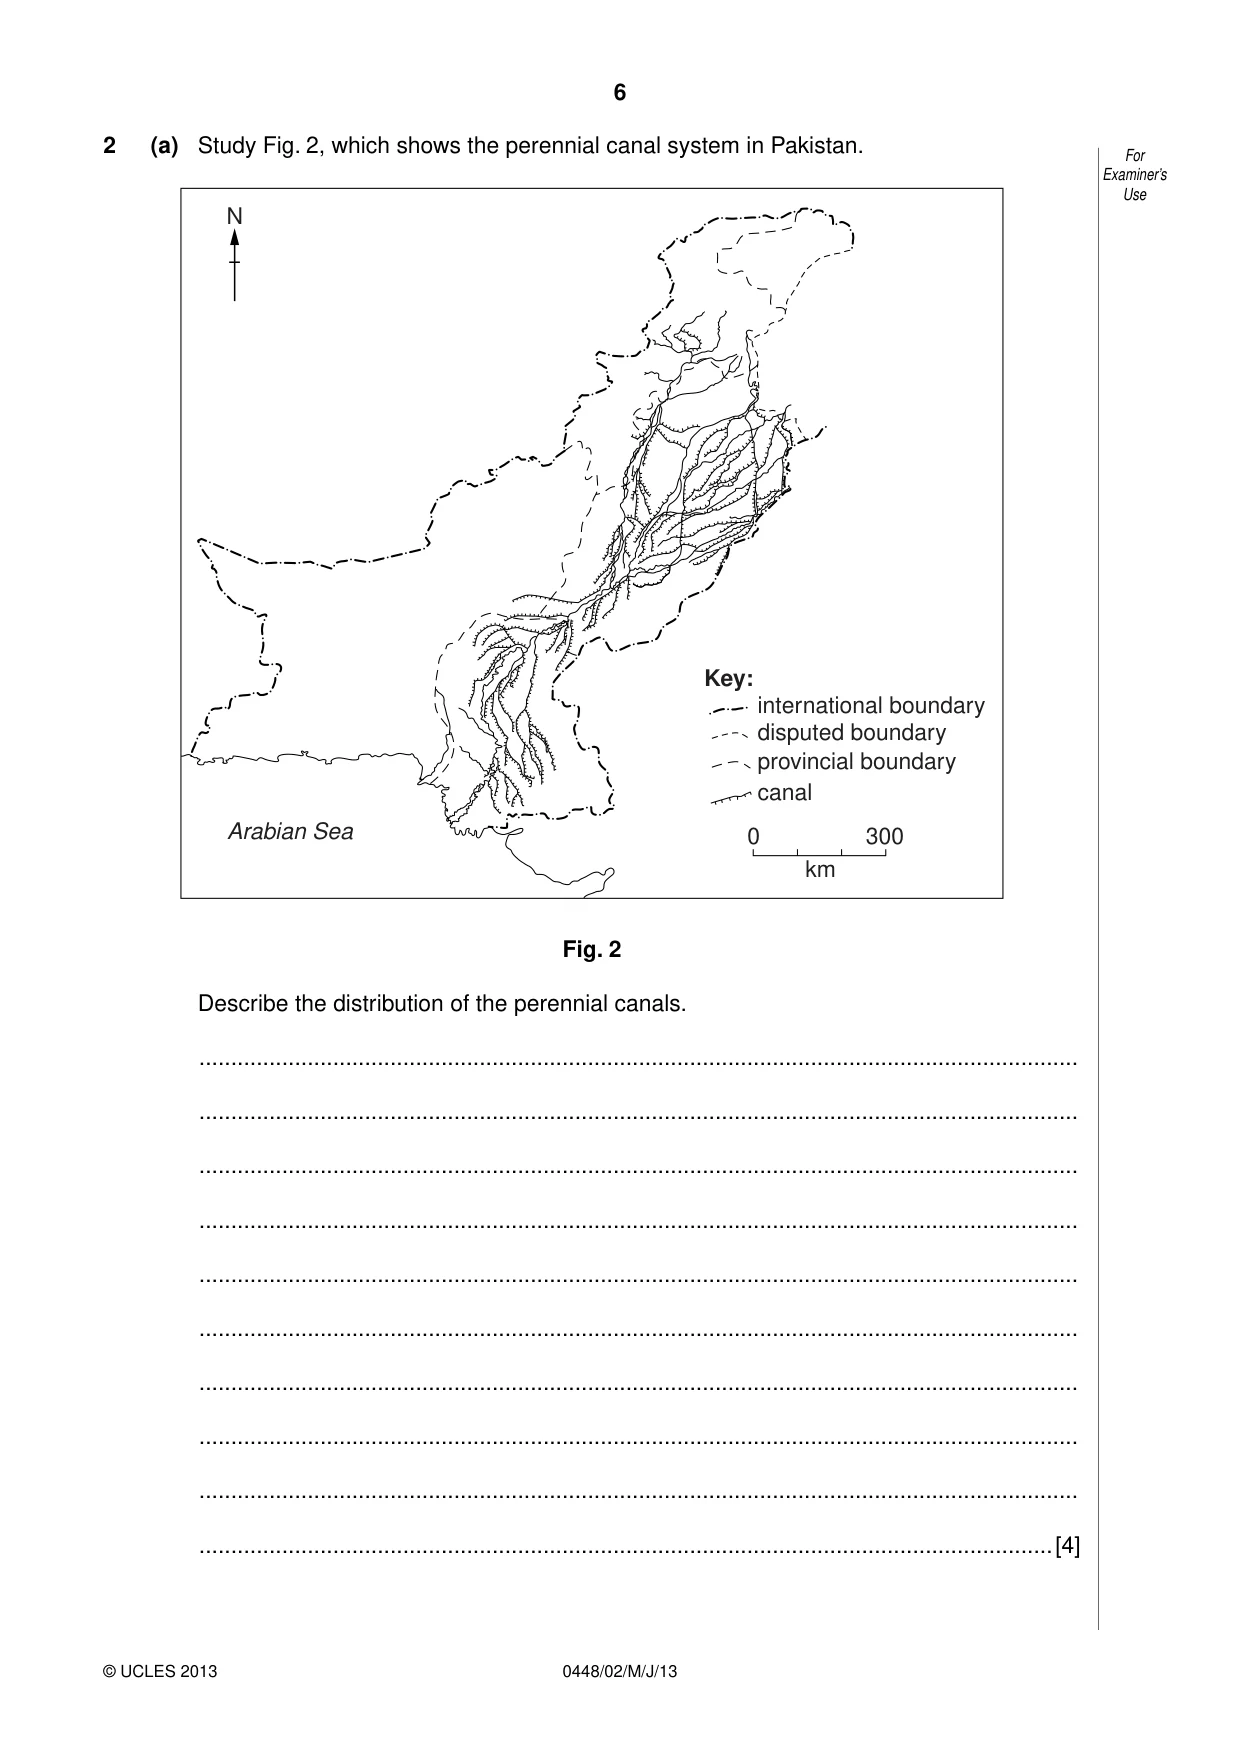
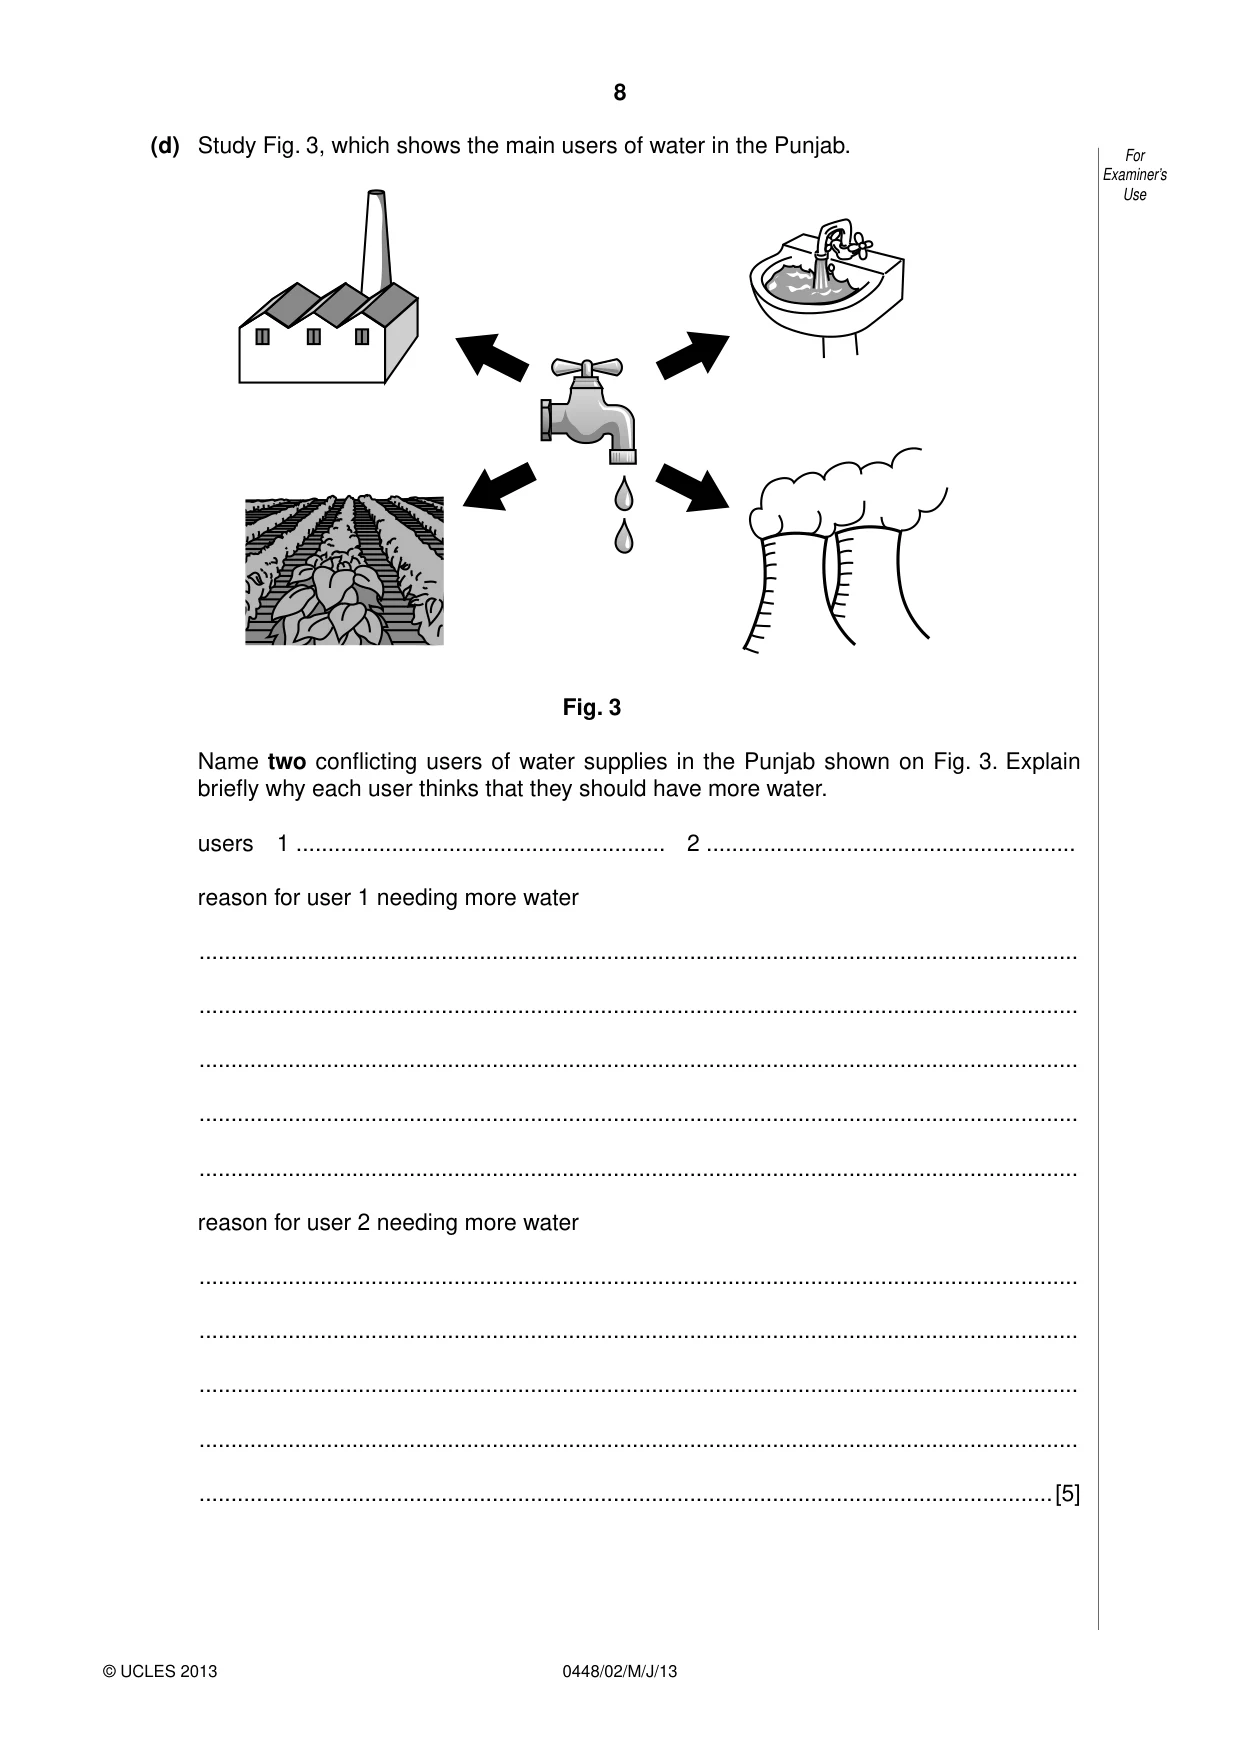
2 (a) Study Fig. 2, which shows the perennial canal system in Pakistan. N Key: international boundary disputed boundary provincial boundary canal Arabian Sea 0 300 km Fig. 2 Describe the distribution of the perennial canals. .......................................................................................................................................... .......................................................................................................................................... .......................................................................................................................................... .......................................................................................................................................... .......................................................................................................................................... .......................................................................................................................................... .......................................................................................................................................... .......................................................................................................................................... .......................................................................................................................................... ......................................................................................................................................[4] (b) Name three types of irrigation, other than perennial canals, used in Pakistan. Explain briefly how each type works. 1 ....................................................................................................................................... .......................................................................................................................................... .......................................................................................................................................... 2 ....................................................................................................................................... .......................................................................................................................................... .......................................................................................................................................... 3 ....................................................................................................................................... .......................................................................................................................................... ......................................................................................................................................[6] (c) Explain how a perennial supply of water can damage farmland. .......................................................................................................................................... .......................................................................................................................................... .......................................................................................................................................... .......................................................................................................................................... .......................................................................................................................................... .......................................................................................................................................... .......................................................................................................................................... .......................................................................................................................................... .......................................................................................................................................... ......................................................................................................................................[4] (d) Study Fig. 3, which shows the main users of water in the Punjab. Fig. 3 Name two conflicting users of water supplies in the Punjab shown on Fig. 3. Explain briefly why each user thinks that they should have more water. users 1 .......................................................... 2 .......................................................... reason for user 1 needing more water .......................................................................................................................................... .......................................................................................................................................... .......................................................................................................................................... .......................................................................................................................................... .......................................................................................................................................... reason for user 2 needing more water .......................................................................................................................................... .......................................................................................................................................... .......................................................................................................................................... .......................................................................................................................................... ......................................................................................................................................[5] (e) To what extent is it possible to increase water supply in Pakistan? .......................................................................................................................................... .......................................................................................................................................... .......................................................................................................................................... .......................................................................................................................................... .......................................................................................................................................... .......................................................................................................................................... .......................................................................................................................................... .......................................................................................................................................... .......................................................................................................................................... .......................................................................................................................................... .......................................................................................................................................... .......................................................................................................................................... .......................................................................................................................................... .......................................................................................................................................... .......................................................................................................................................... ......................................................................................................................................[6] [Total: 25]
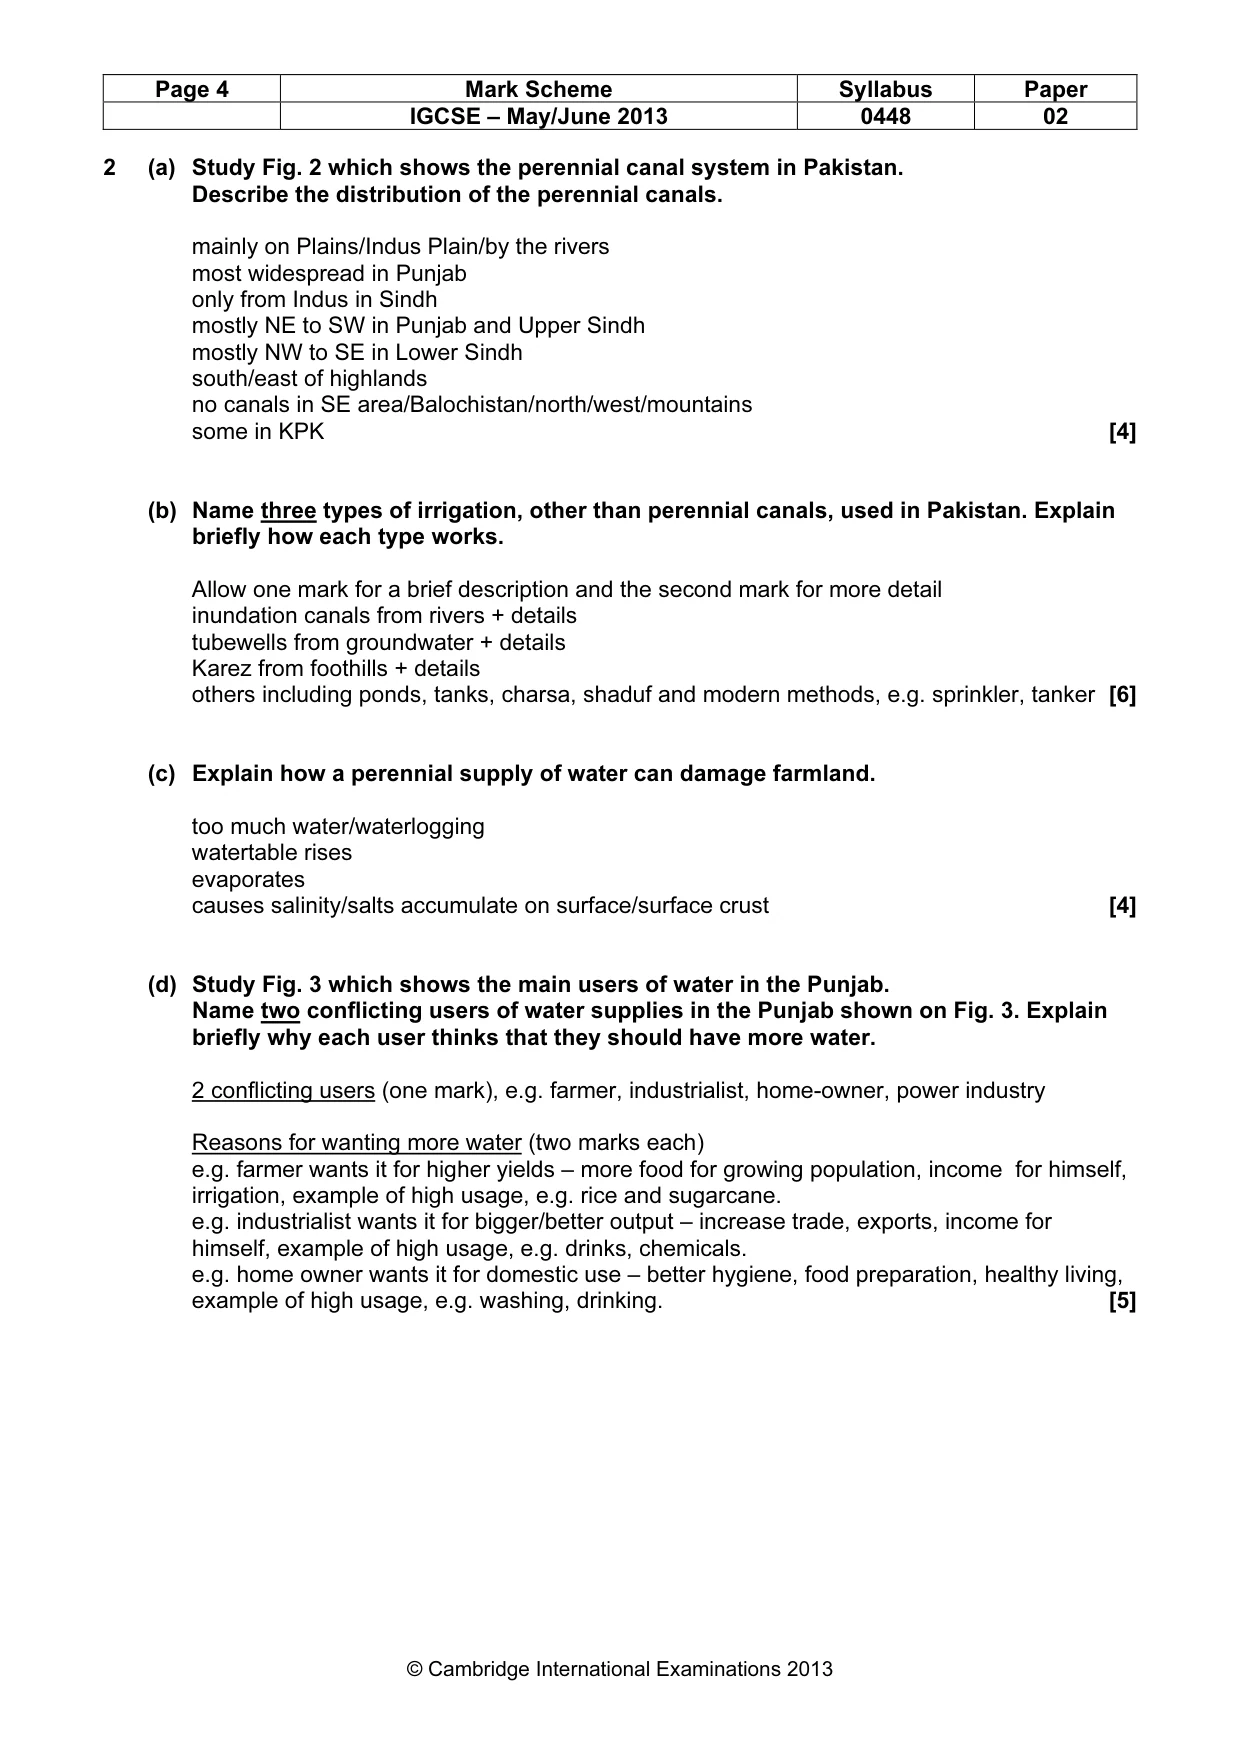
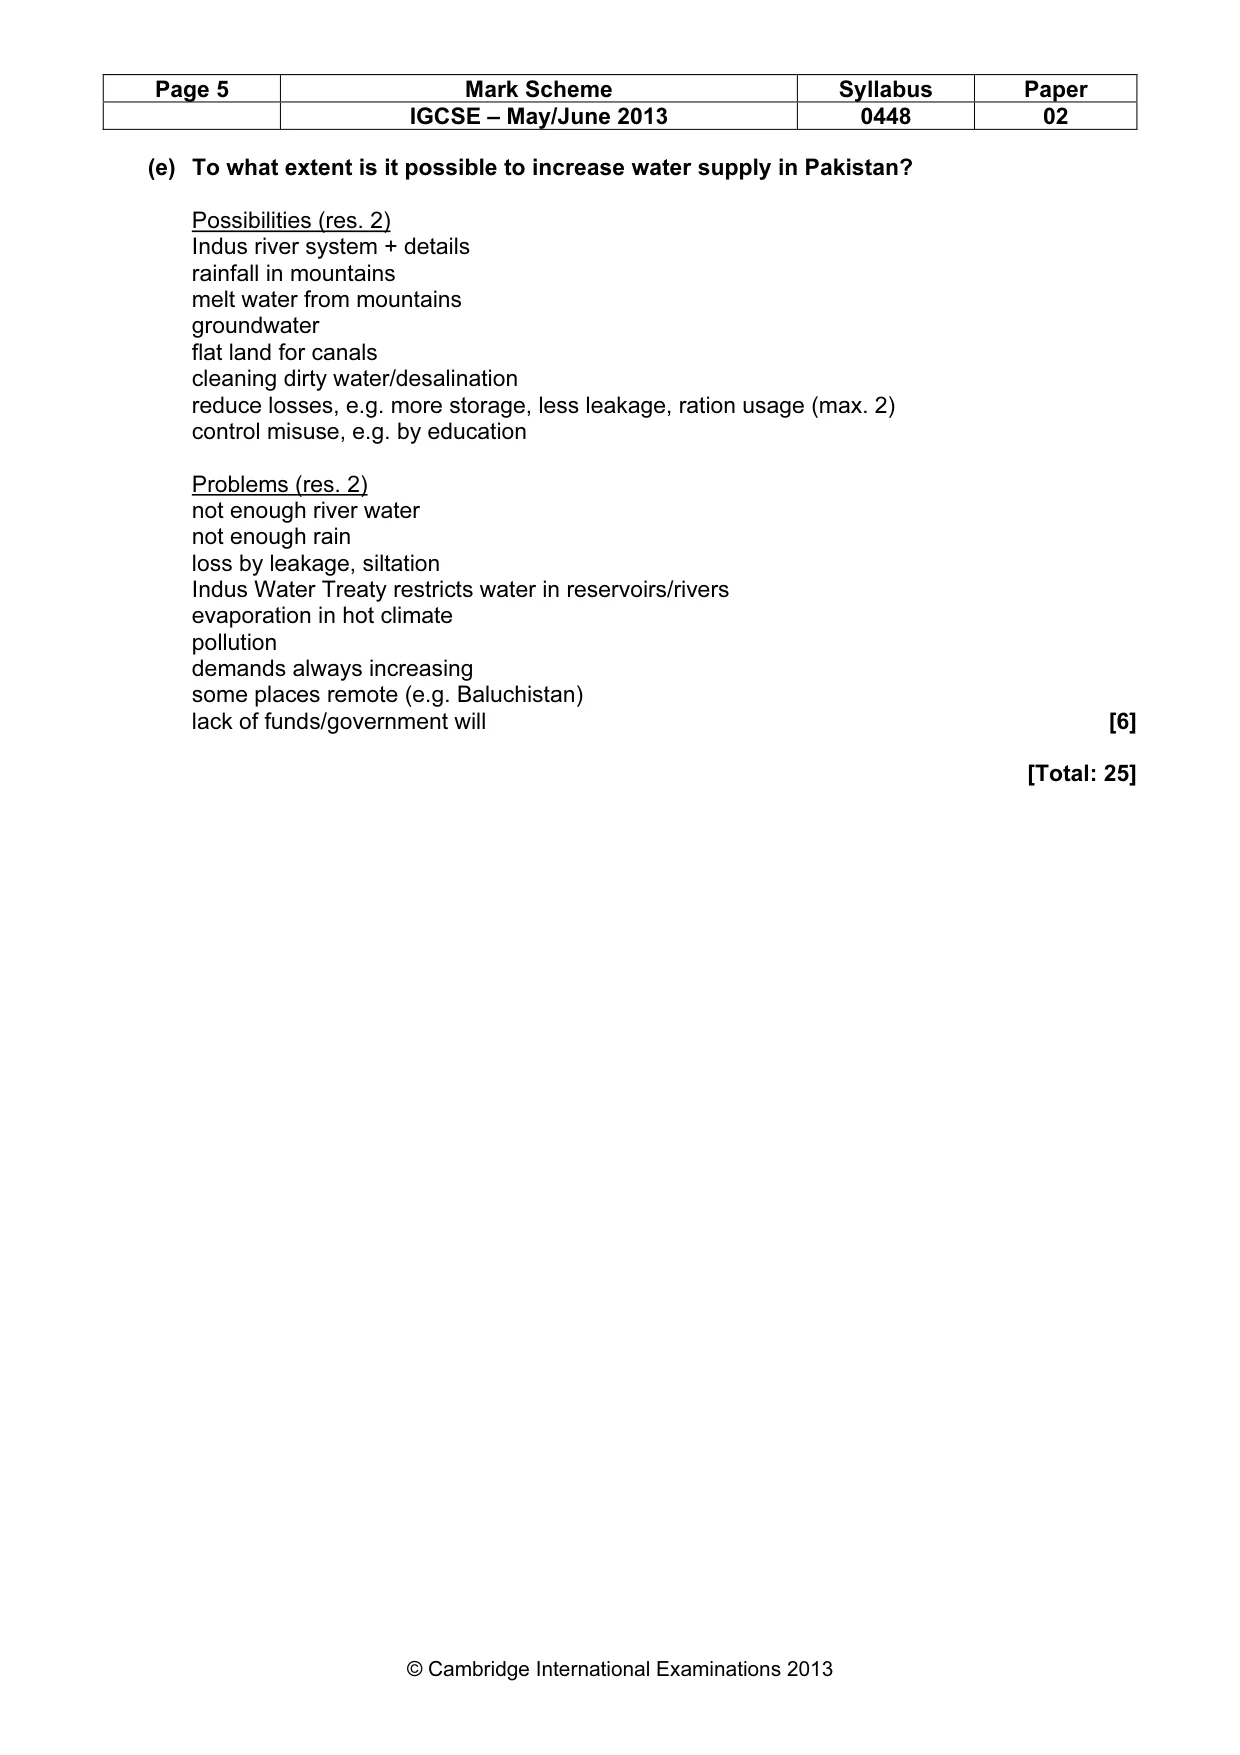
Mark scheme: 2 (a) Study Fig. 2 which shows the perennial canal system in Pakistan. Describe the distribution of the perennial canals. mainly on Plains/Indus Plain/by the rivers most widespread in Punjab only from Indus in Sindh mostly NE to SW in Punjab and Upper Sindh mostly NW to SE in Lower Sindh south/east of highlands no canals in SE area/Balochistan/north/west/mountains some in KPK [4] (b) Name three types of irrigation, other than perennial canals, used in Pakistan. Explain briefly how each type works. Allow one mark for a brief description and the second mark for more detail inundation canals from rivers + details tubewells from groundwater + details Karez from foothills + details others including ponds, tanks, charsa, shaduf and modern methods, e.g. sprinkler, tanker [6] (c) Explain how a perennial supply of water can damage farmland. too much water/waterlogging watertable rises evaporates causes salinity/salts accumulate on surface/surface crust [4] (d) Study Fig. 3 which shows the main users of water in the Punjab. Name two conflicting users of water supplies in the Punjab shown on Fig. 3. Explain briefly why each user thinks that they should have more water. 2 conflicting users (one mark), e.g. farmer, industrialist, home-owner, power industry Reasons for wanting more water (two marks each) e.g. farmer wants it for higher yields – more food for growing population, income for himself, irrigation, example of high usage, e.g. rice and sugarcane. e.g. industrialist wants it for bigger/better output – increase trade, exports, income for himself, example of high usage, e.g. drinks, chemicals. e.g. home owner wants it for domestic use – better hygiene, food preparation, healthy living, example of high usage, e.g. washing, drinking. [5] IGCSE – May/June 2013 0448 02 (e) To what extent is it possible to increase water supply in Pakistan? Possibilities (res. 2) Indus river system + details rainfall in mountains melt water from mountains groundwater flat land for canals cleaning dirty water/desalination reduce losses, e.g. more storage, less leakage, ration usage (max. 2) control misuse, e.g. by education Problems (res. 2) not enough river water not enough rain loss by leakage, siltation Indus Water Treaty restricts water in reservoirs/rivers evaporation in hot climate pollution demands always increasing some places remote (e.g. Baluchistan) lack of funds/government will [6] [Total: 25] IGCSE – May/June 2013 0448 02
Q3 · Study Photographs B, C and D (Insert)
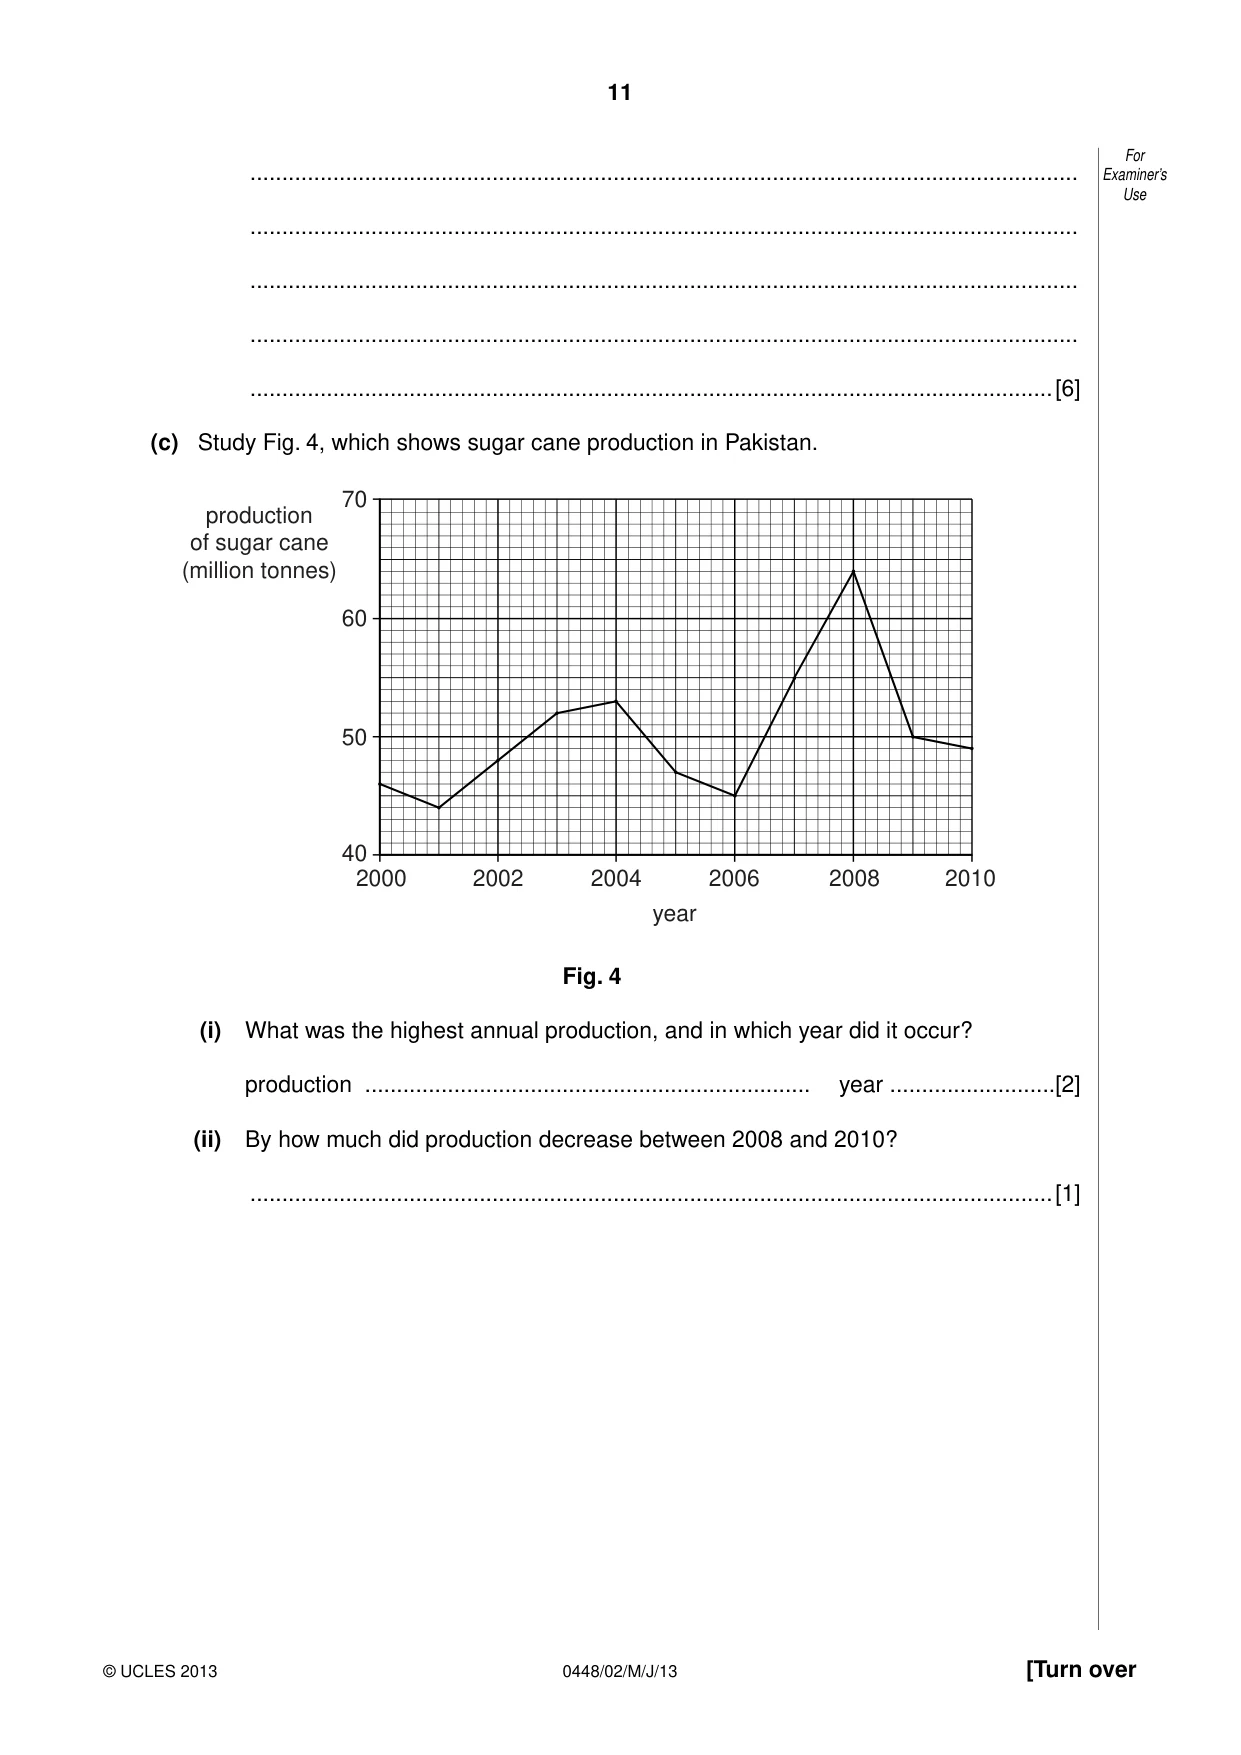
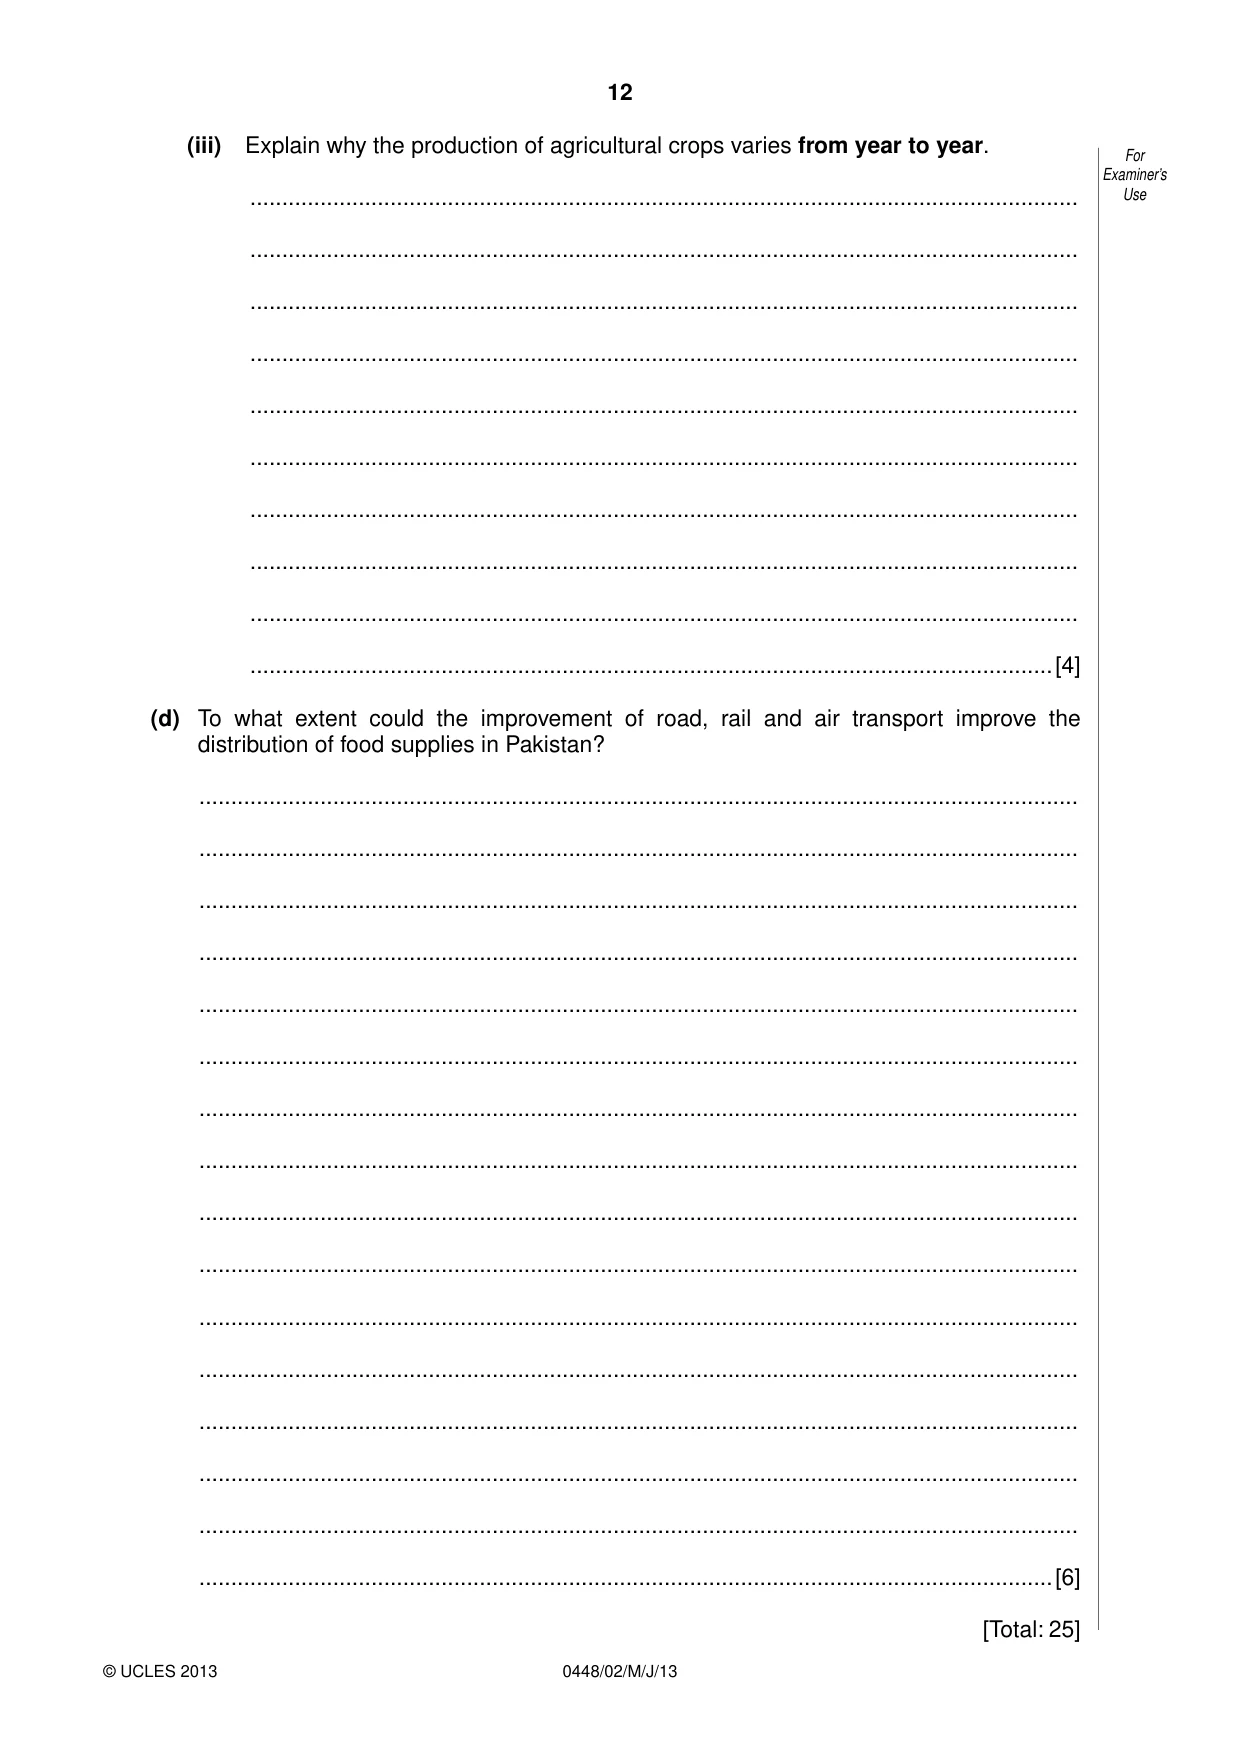
3 (a) (i) Study Photographs B, C and D (Insert). Name the crops shown in each photograph and give a use of each within Pakistan. Name Use B ................................................ ................................................ C ................................................ ................................................ D ................................................ ................................................ [3] (ii) With reference to one of the crops named in (a)(i), explain the meaning of the term cash crop farming. crop .......................................................................................................................... .................................................................................................................................. .................................................................................................................................. ..............................................................................................................................[2] (b) (i) Place the following processes in the correct order. SOWING SEEDS PLOUGHING HARVEST WEEDING .............................. .............................. .............................. .............................. [1] (ii) With reference to your answer to (b)(i) explain how rice is grown on small-scale farms in Pakistan. .................................................................................................................................. .................................................................................................................................. .................................................................................................................................. .................................................................................................................................. .................................................................................................................................. .................................................................................................................................. .................................................................................................................................. .................................................................................................................................. .................................................................................................................................. .................................................................................................................................. .................................................................................................................................. .................................................................................................................................. .................................................................................................................................. .................................................................................................................................. .................................................................................................................................. ..............................................................................................................................[6] (c) Study Fig. 4, which shows sugar cane production in Pakistan. 70 production of sugar cane (million tonnes) 60 50 40 2000 2002 2004 2006 2008 2010 year Fig. 4 (i) What was the highest annual production, and in which year did it occur? production ...................................................................... year ..........................[2] (ii) By how much did production decrease between 2008 and 2010? ..............................................................................................................................[1] (iii) Explain why the production of agricultural crops varies from year to year. .................................................................................................................................. .................................................................................................................................. .................................................................................................................................. .................................................................................................................................. .................................................................................................................................. .................................................................................................................................. .................................................................................................................................. .................................................................................................................................. .................................................................................................................................. ..............................................................................................................................[4] (d) To what extent could the improvement of road, rail and air transport improve the distribution of food supplies in Pakistan? .......................................................................................................................................... .......................................................................................................................................... .......................................................................................................................................... .......................................................................................................................................... .......................................................................................................................................... .......................................................................................................................................... .......................................................................................................................................... .......................................................................................................................................... .......................................................................................................................................... .......................................................................................................................................... .......................................................................................................................................... .......................................................................................................................................... .......................................................................................................................................... .......................................................................................................................................... .......................................................................................................................................... ......................................................................................................................................[6] [Total: 25] Question 4 begins on page 14.
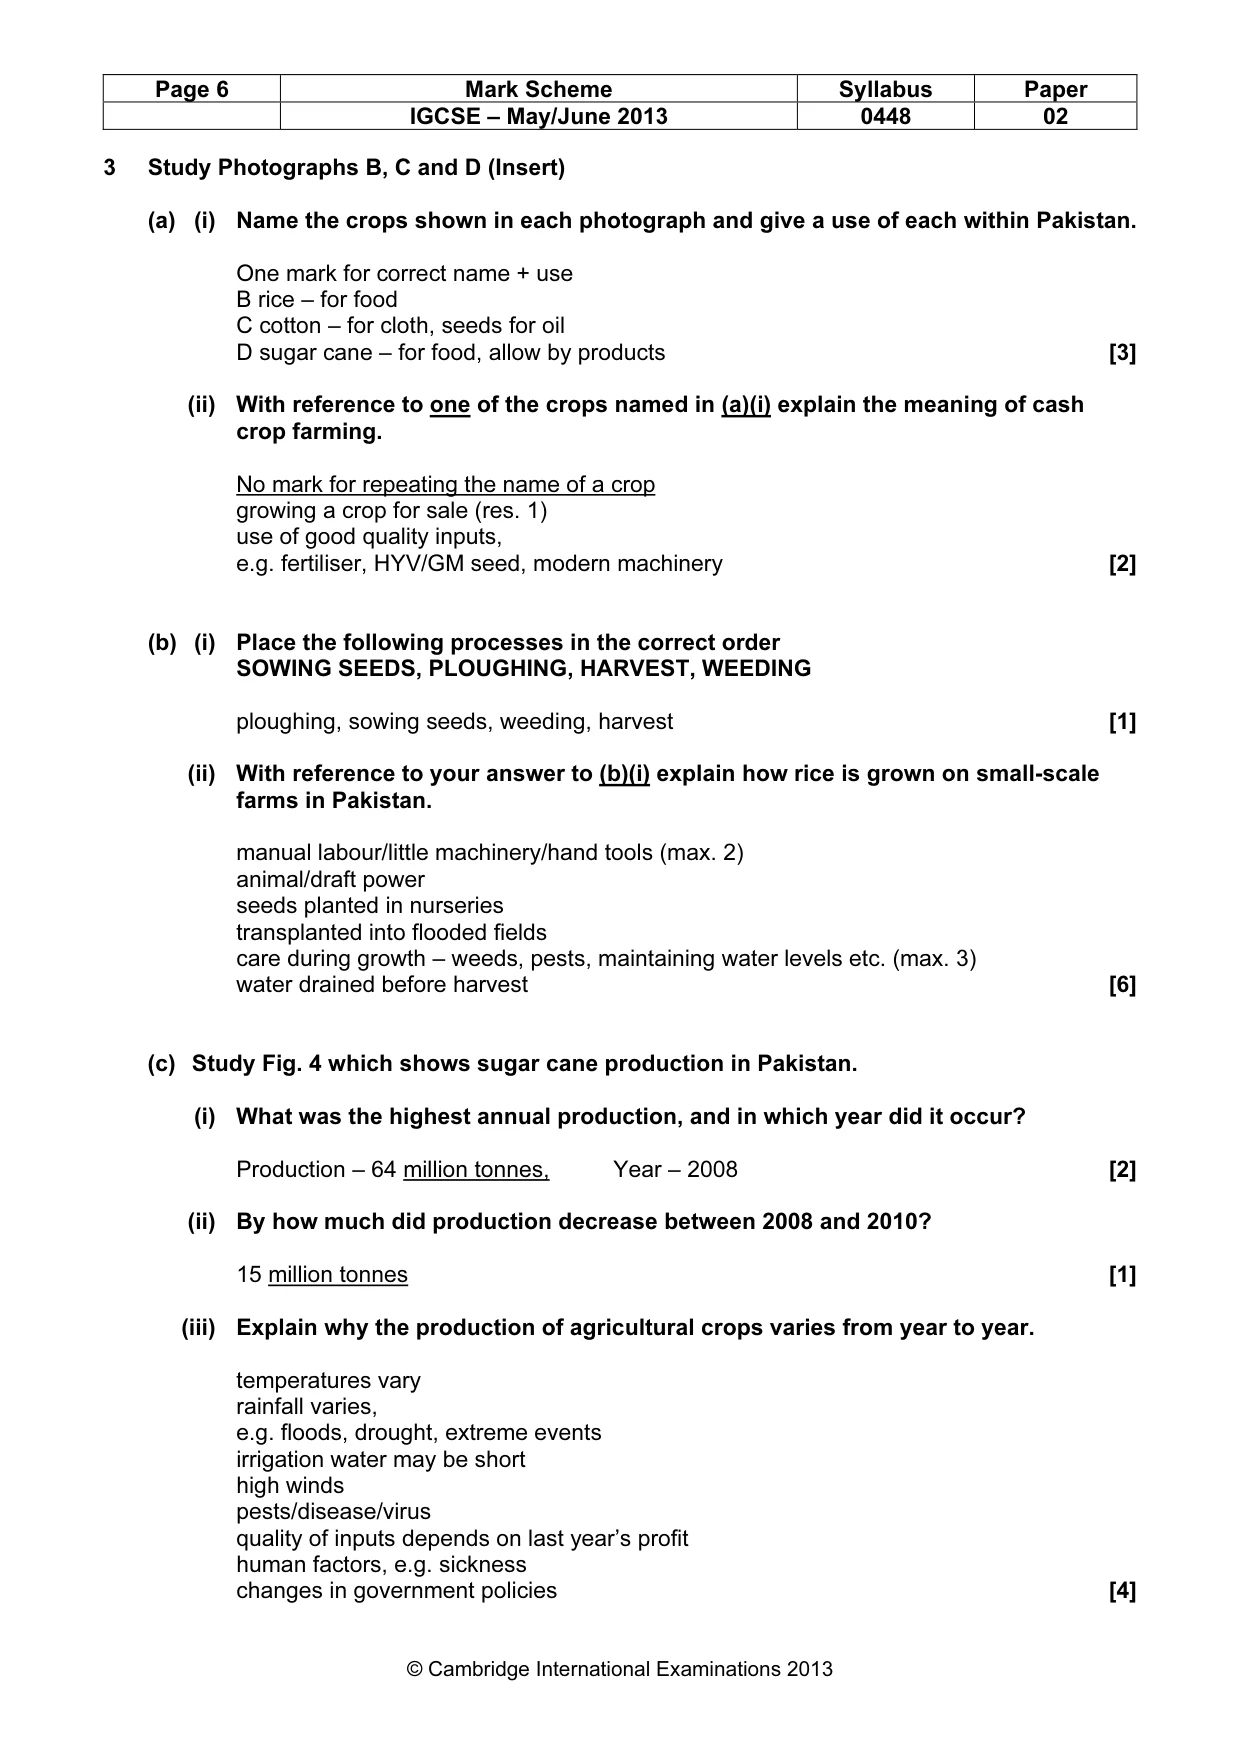
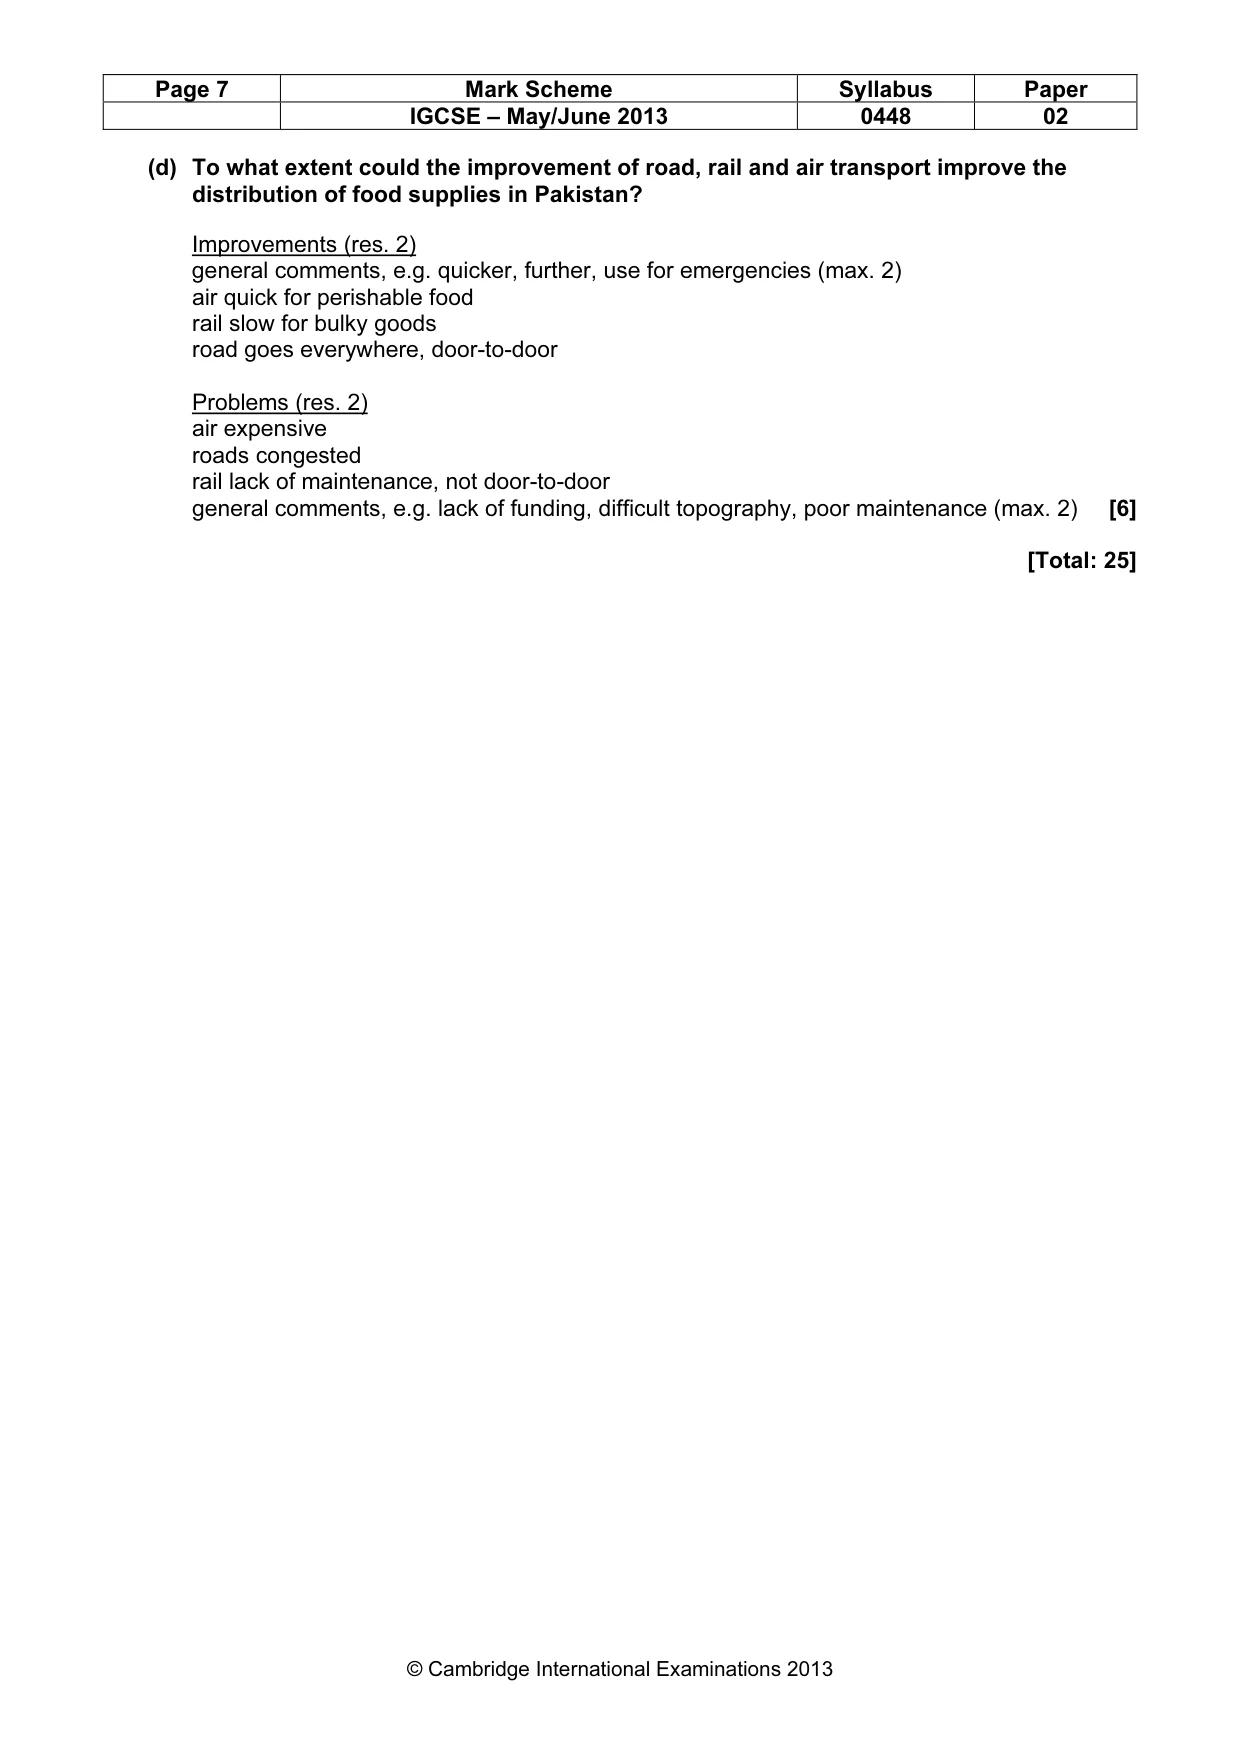
Mark scheme: 3 Study Photographs B, C and D (Insert) (a) (i) Name the crops shown in each photograph and give a use of each within Pakistan. One mark for correct name + use B rice – for food C cotton – for cloth, seeds for oil D sugar cane – for food, allow by products [3] (ii) With reference to one of the crops named in (a)(i) explain the meaning of cash crop farming. No mark for repeating the name of a crop growing a crop for sale (res. 1) use of good quality inputs, e.g. fertiliser, HYV/GM seed, modern machinery [2] (b) (i) Place the following processes in the correct order SOWING SEEDS, PLOUGHING, HARVEST, WEEDING ploughing, sowing seeds, weeding, harvest [1] (ii) With reference to your answer to (b)(i) explain how rice is grown on small-scale farms in Pakistan. manual labour/little machinery/hand tools (max. 2) animal/draft power seeds planted in nurseries transplanted into flooded fields care during growth – weeds, pests, maintaining water levels etc. (max. 3) water drained before harvest [6] (c) Study Fig. 4 which shows sugar cane production in Pakistan. (i) What was the highest annual production, and in which year did it occur? Production – 64 million tonnes, Year – 2008 [2] (ii) By how much did production decrease between 2008 and 2010? 15 million tonnes [1] (iii) Explain why the production of agricultural crops varies from year to year. temperatures vary rainfall varies, e.g. floods, drought, extreme events irrigation water may be short high winds pests/disease/virus quality of inputs depends on last year’s profit human factors, e.g. sickness changes in government policies [4] IGCSE – May/June 2013 0448 02 (d) To what extent could the improvement of road, rail and air transport improve the distribution of food supplies in Pakistan? Improvements (res. 2) general comments, e.g. quicker, further, use for emergencies (max. 2) air quick for perishable food rail slow for bulky goods road goes everywhere, door-to-door Problems (res. 2) air expensive roads congested rail lack of maintenance, not door-to-door general comments, e.g. lack of funding, difficult topography, poor maintenance (max. 2) [6] [Total: 25] IGCSE – May/June 2013 0448 02
Question 4
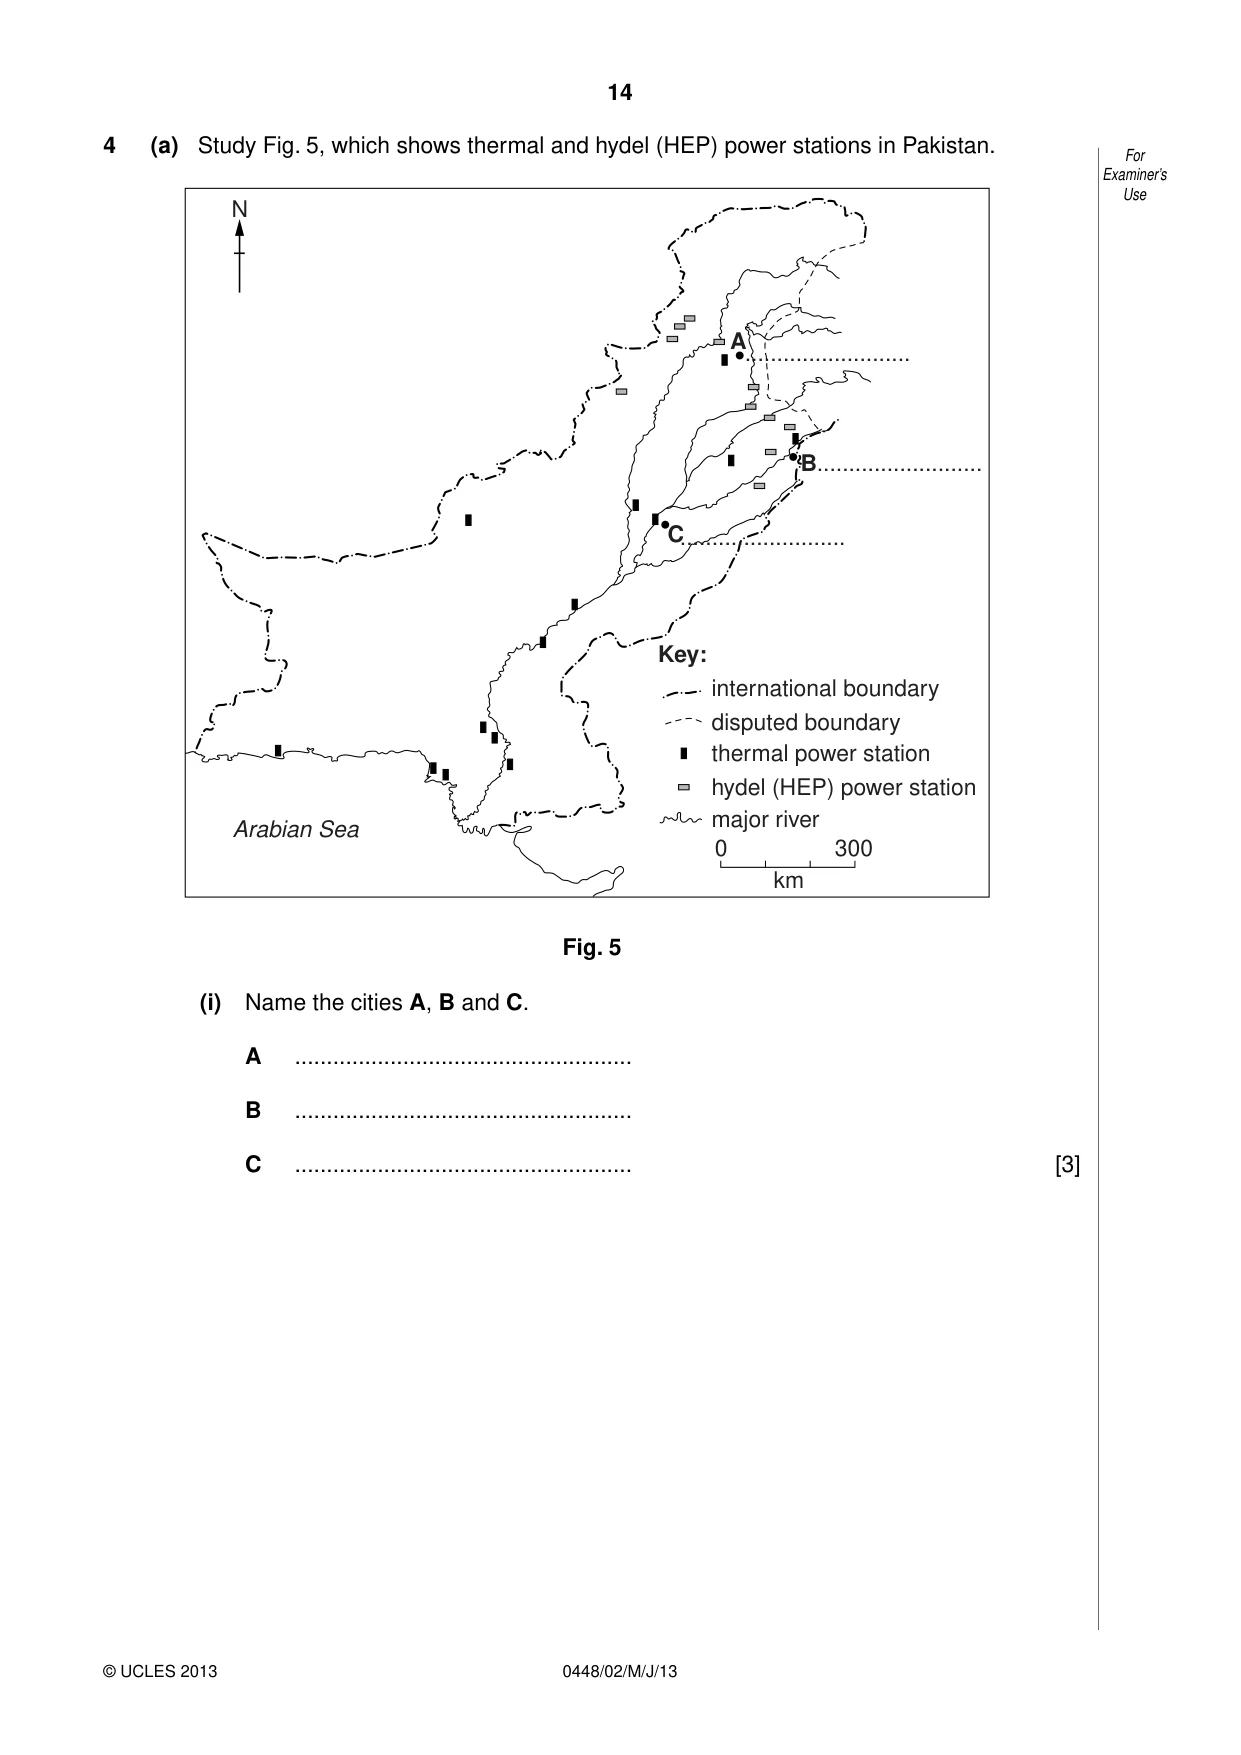
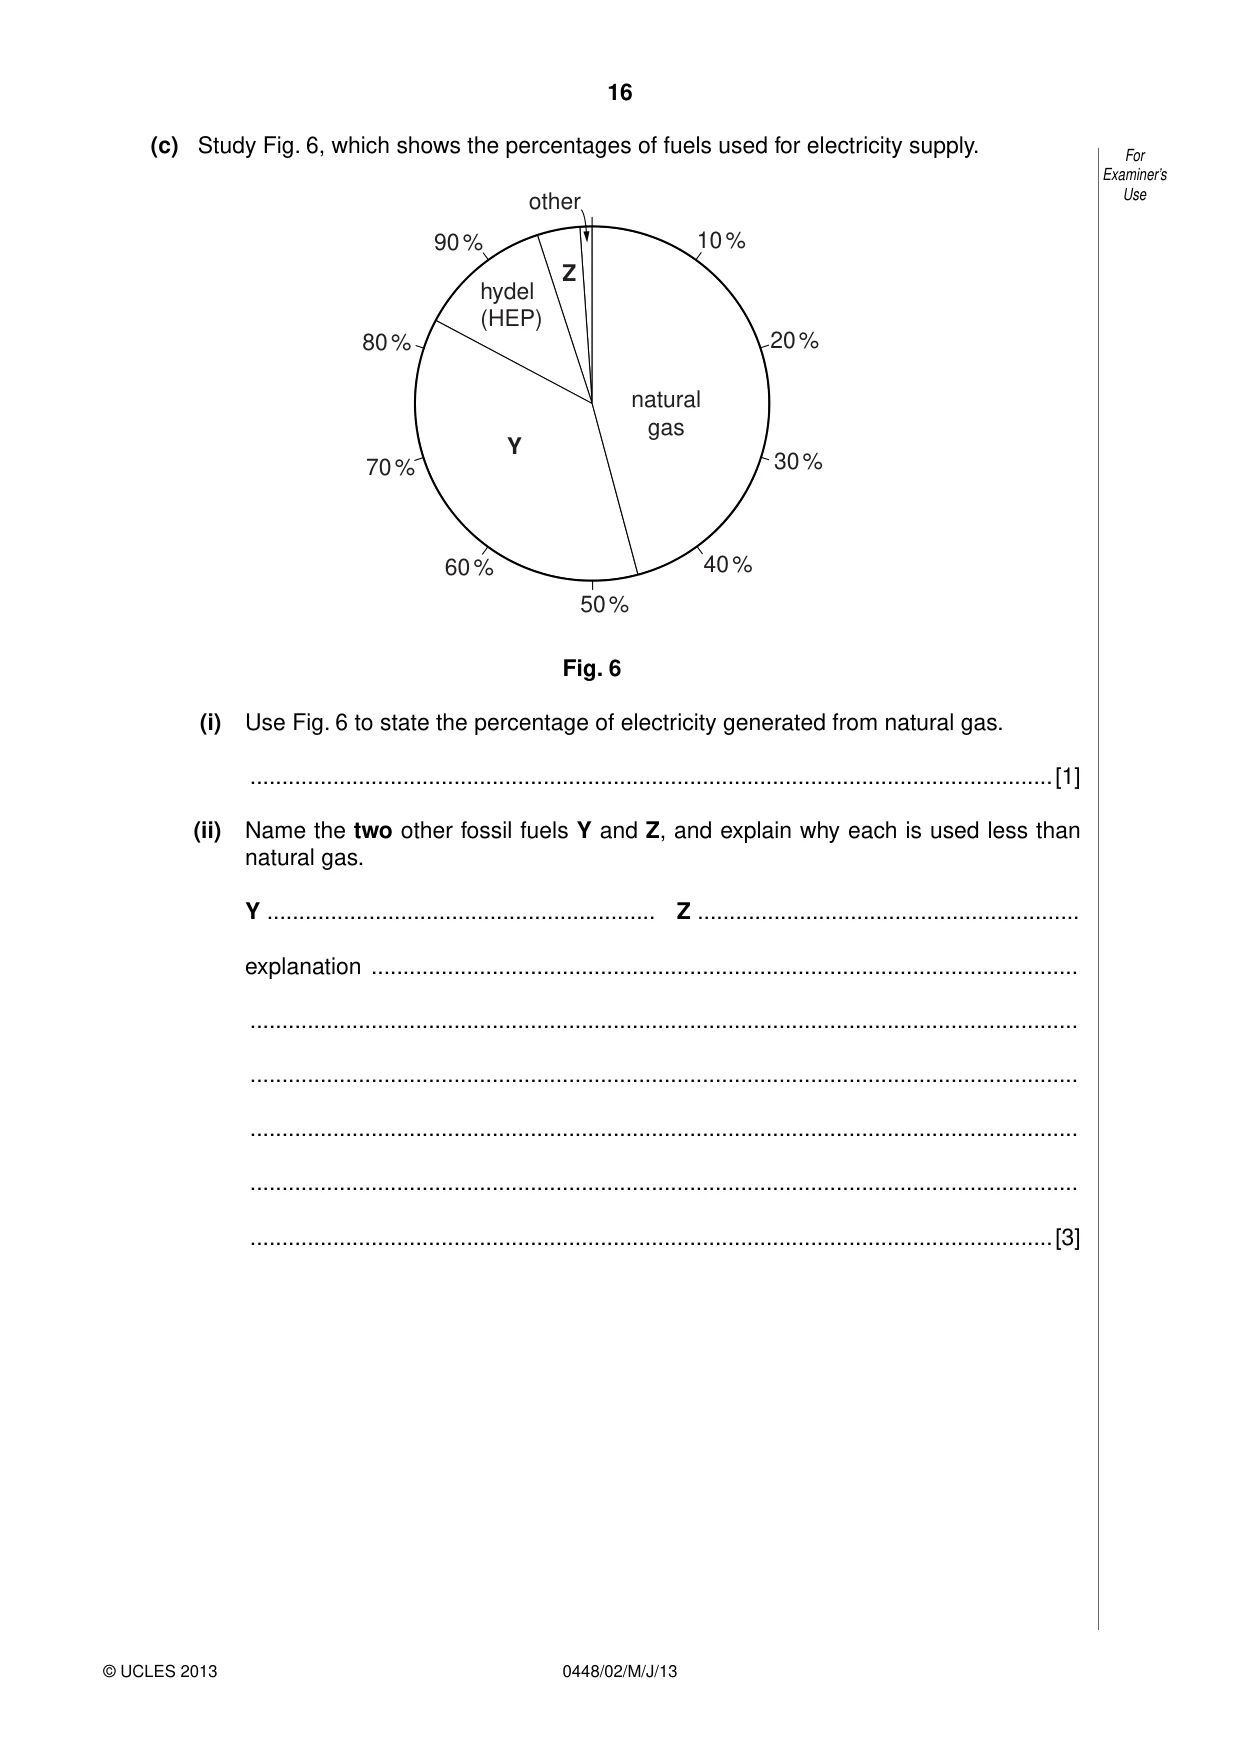
4 (a) Study Fig. 5, which shows thermal and hydel (HEP) power stations in Pakistan. N A .......................... B.......................... C.......................... Key: international boundary disputed boundary thermal power station hydel (HEP) power station major river Arabian Sea 0 300 km Fig. 5 (i) Name the cities A, B and C. A ..................................................... B ..................................................... C ..................................................... [3] (ii) Compare the distribution of thermal and hydel (HEP) power stations. .................................................................................................................................. .................................................................................................................................. .................................................................................................................................. .................................................................................................................................. .................................................................................................................................. .................................................................................................................................. .................................................................................................................................. ..............................................................................................................................[4] (iii) Explain why these two different types of power station are built in different areas in Pakistan. .................................................................................................................................. .................................................................................................................................. .................................................................................................................................. .................................................................................................................................. .................................................................................................................................. .................................................................................................................................. .................................................................................................................................. .................................................................................................................................. .................................................................................................................................. ..............................................................................................................................[4] (b) Explain why the supply of electricity is not reliable in many parts of Pakistan. .......................................................................................................................................... .......................................................................................................................................... .......................................................................................................................................... .......................................................................................................................................... .......................................................................................................................................... .......................................................................................................................................... .......................................................................................................................................... .......................................................................................................................................... .......................................................................................................................................... ......................................................................................................................................[4] (c) Study Fig. 6, which shows the percentages of fuels used for electricity supply. other 90 % 10 % Z hydel (HEP) 80 % 20 % natural gas Y 30 % 70 % 60 % 40 % 50 % Fig. 6 (i) Use Fig. 6 to state the percentage of electricity generated from natural gas. ..............................................................................................................................[1] (ii) Name the two other fossil fuels Y and Z, and explain why each is used less than natural gas. Y ............................................................. Z ............................................................ explanation ............................................................................................................... .................................................................................................................................. .................................................................................................................................. .................................................................................................................................. .................................................................................................................................. ..............................................................................................................................[3] (d) To what extent can the development of renewable energy resources improve the reliability of electricity supply in Pakistan? .......................................................................................................................................... .......................................................................................................................................... .......................................................................................................................................... .......................................................................................................................................... .......................................................................................................................................... .......................................................................................................................................... .......................................................................................................................................... .......................................................................................................................................... .......................................................................................................................................... .......................................................................................................................................... .......................................................................................................................................... .......................................................................................................................................... .......................................................................................................................................... .......................................................................................................................................... .......................................................................................................................................... ......................................................................................................................................[6] [Total: 25]
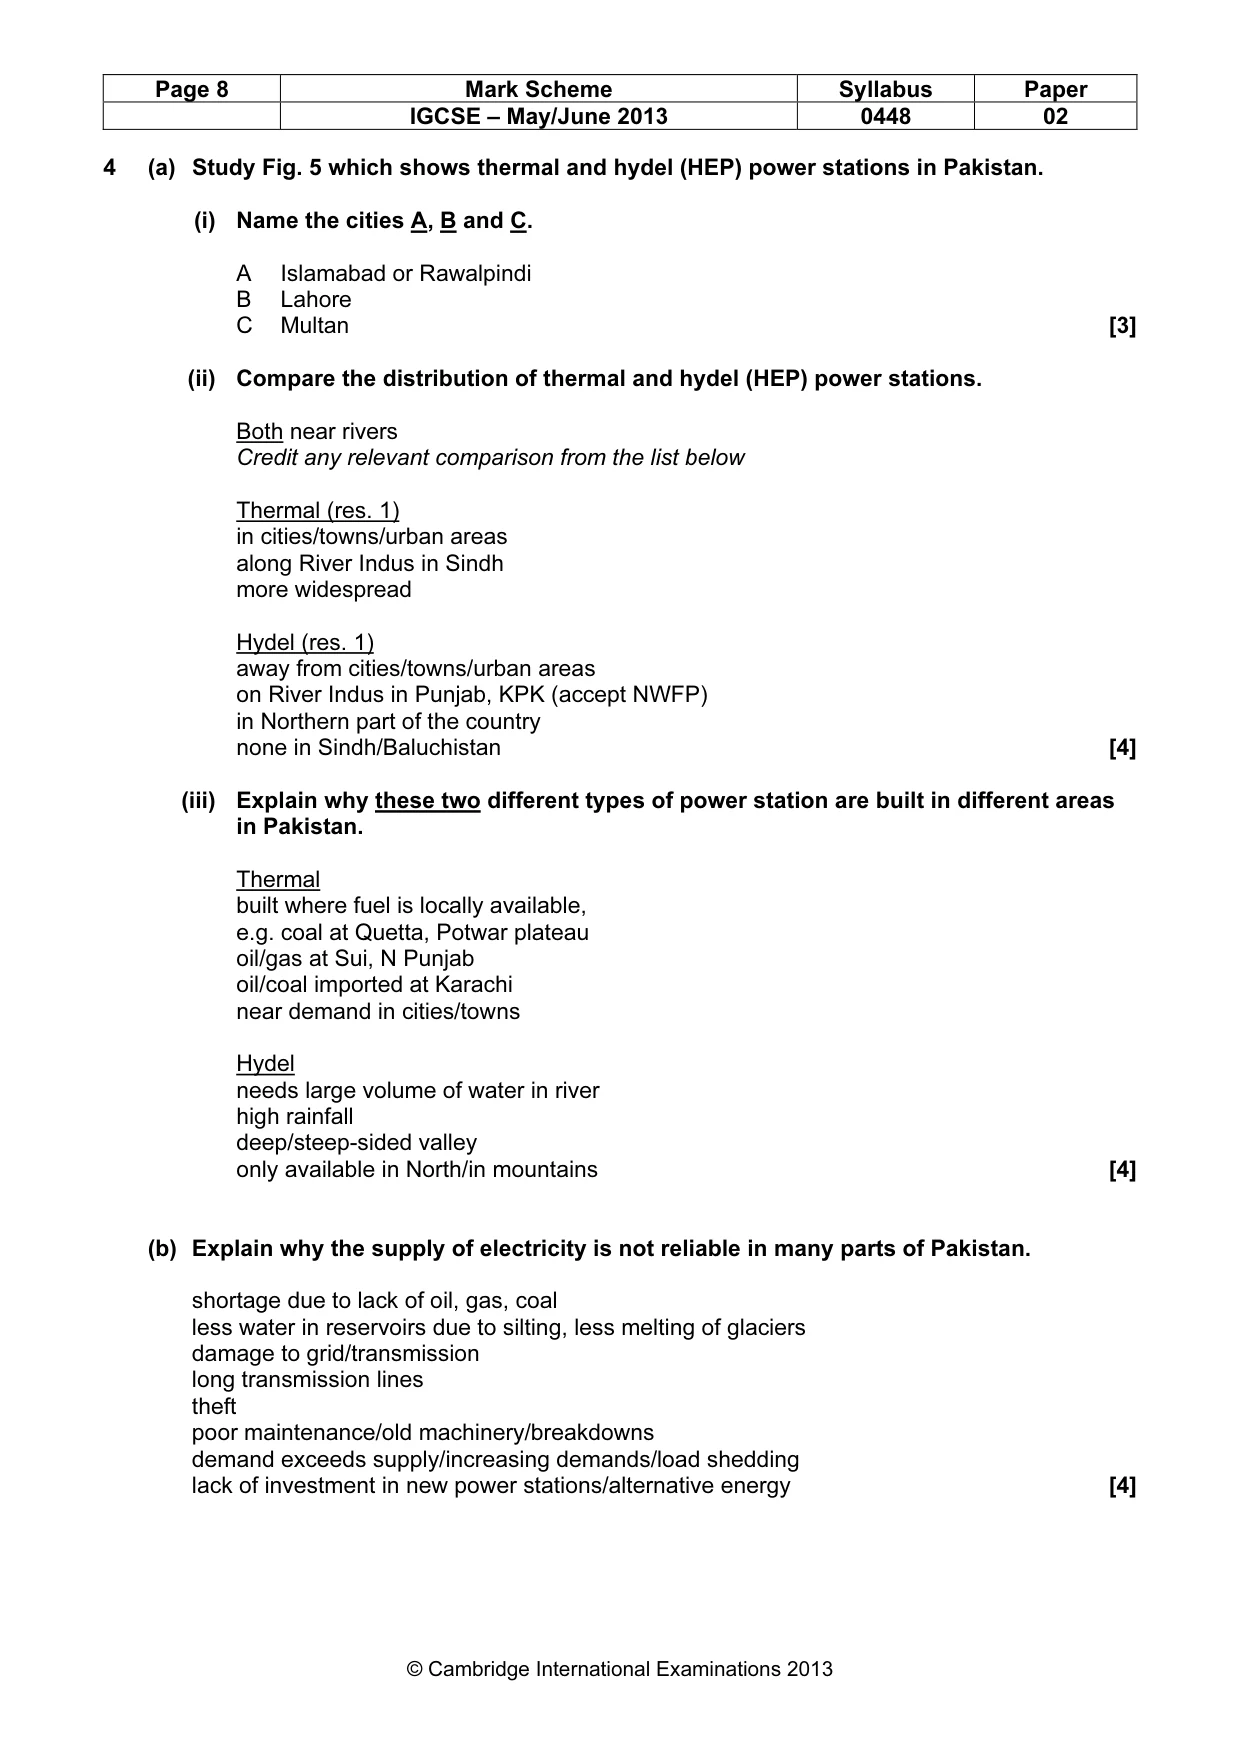
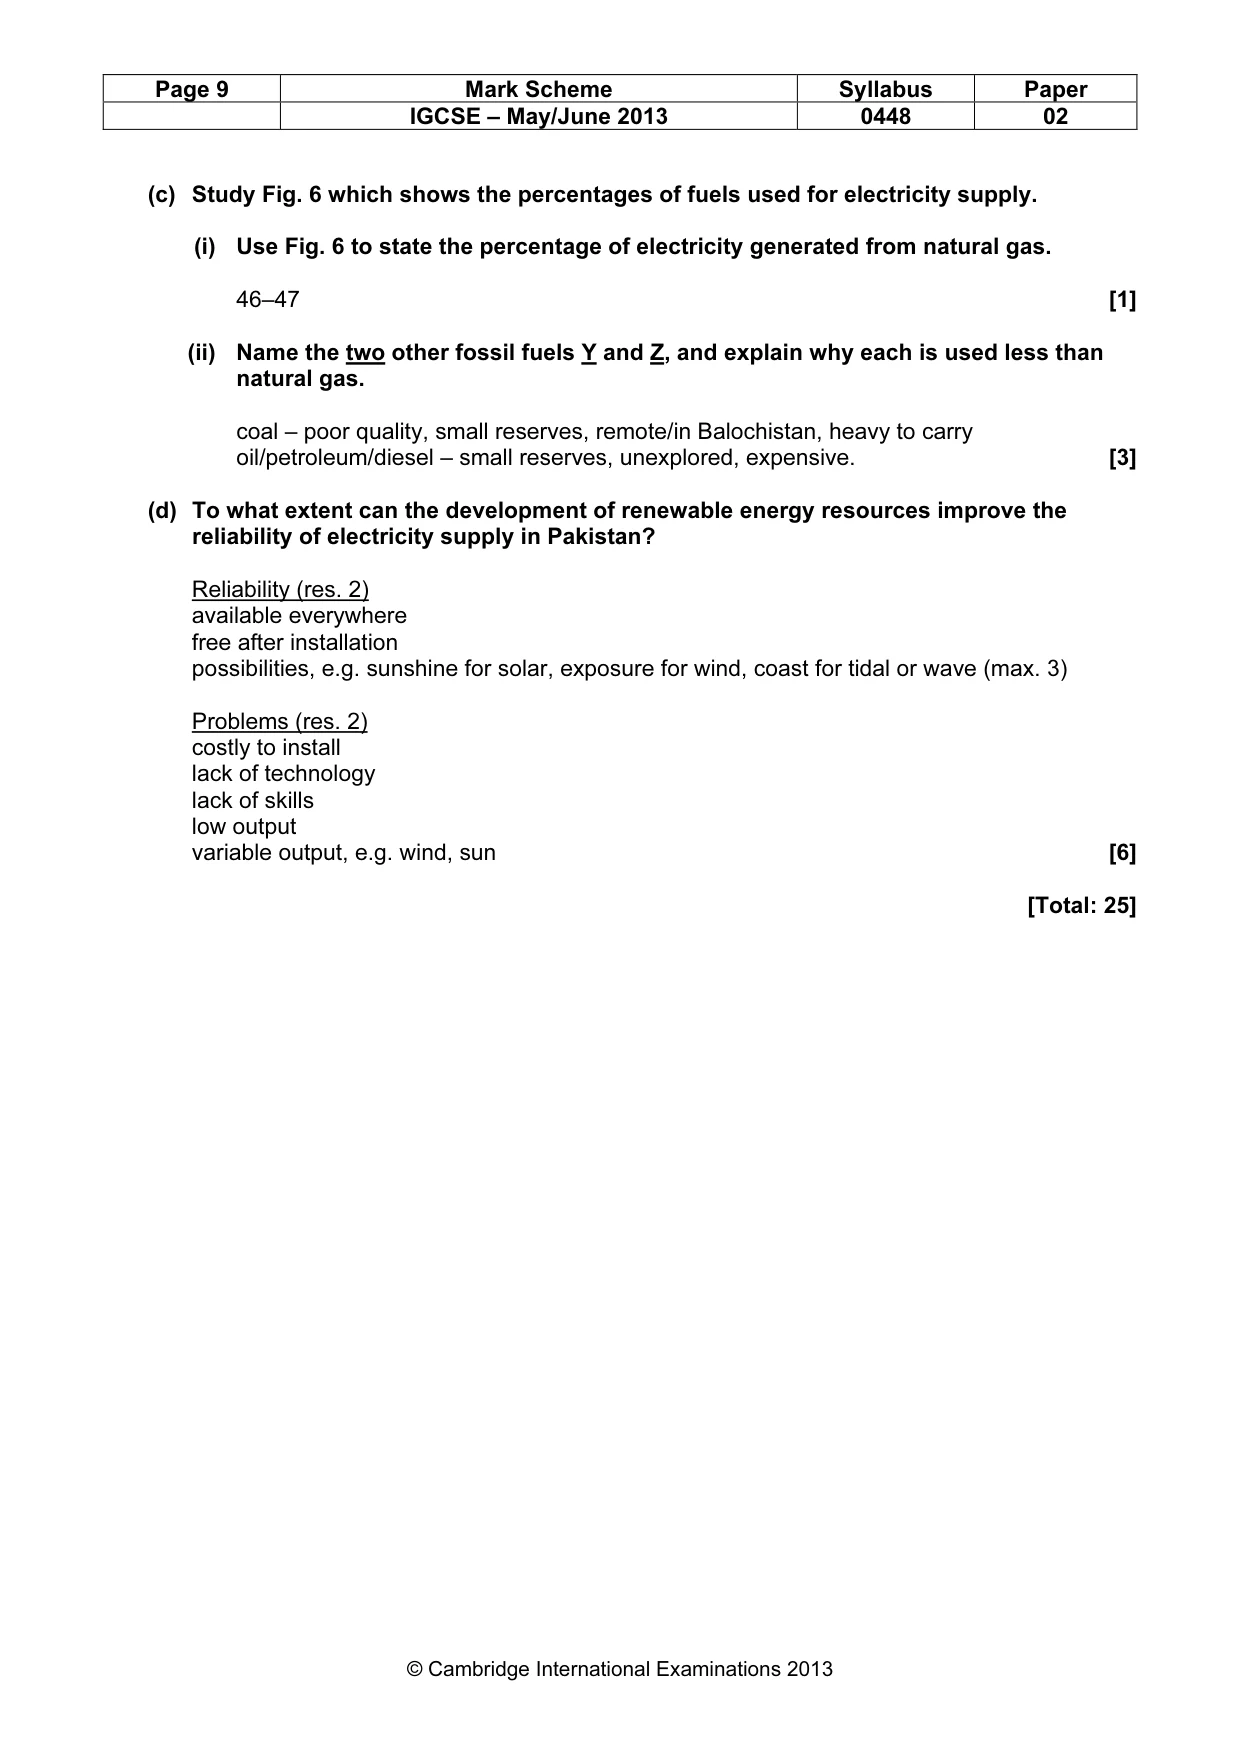
Mark scheme: 4 (a) Study Fig. 5 which shows thermal and hydel (HEP) power stations in Pakistan. (i) Name the cities A, B and C. A Islamabad or Rawalpindi B Lahore C Multan [3] (ii) Compare the distribution of thermal and hydel (HEP) power stations. Both near rivers Credit any relevant comparison from the list below Thermal (res. 1) in cities/towns/urban areas along River Indus in Sindh more widespread Hydel (res. 1) away from cities/towns/urban areas on River Indus in Punjab, KPK (accept NWFP) in Northern part of the country none in Sindh/Baluchistan [4] (iii) Explain why these two different types of power station are built in different areas in Pakistan. Thermal built where fuel is locally available, e.g. coal at Quetta, Potwar plateau oil/gas at Sui, N Punjab oil/coal imported at Karachi near demand in cities/towns Hydel needs large volume of water in river high rainfall deep/steep-sided valley only available in North/in mountains [4] (b) Explain why the supply of electricity is not reliable in many parts of Pakistan. shortage due to lack of oil, gas, coal less water in reservoirs due to silting, less melting of glaciers damage to grid/transmission long transmission lines theft poor maintenance/old machinery/breakdowns demand exceeds supply/increasing demands/load shedding lack of investment in new power stations/alternative energy [4] IGCSE – May/June 2013 0448 02 (c) Study Fig. 6 which shows the percentages of fuels used for electricity supply. (i) Use Fig. 6 to state the percentage of electricity generated from natural gas. 46–47 [1] (ii) Name the two other fossil fuels Y and Z, and explain why each is used less than natural gas. coal – poor quality, small reserves, remote/in Balochistan, heavy to carry oil/petroleum/diesel – small reserves, unexplored, expensive. [3] (d) To what extent can the development of renewable energy resources improve the reliability of electricity supply in Pakistan? Reliability (res. 2) available everywhere free after installation possibilities, e.g. sunshine for solar, exposure for wind, coast for tidal or wave (max. 3) Problems (res. 2) costly to install lack of technology lack of skills low output variable output, e.g. wind, sun [6] [Total: 25] IGCSE – May/June 2013 0448 02
Question 5
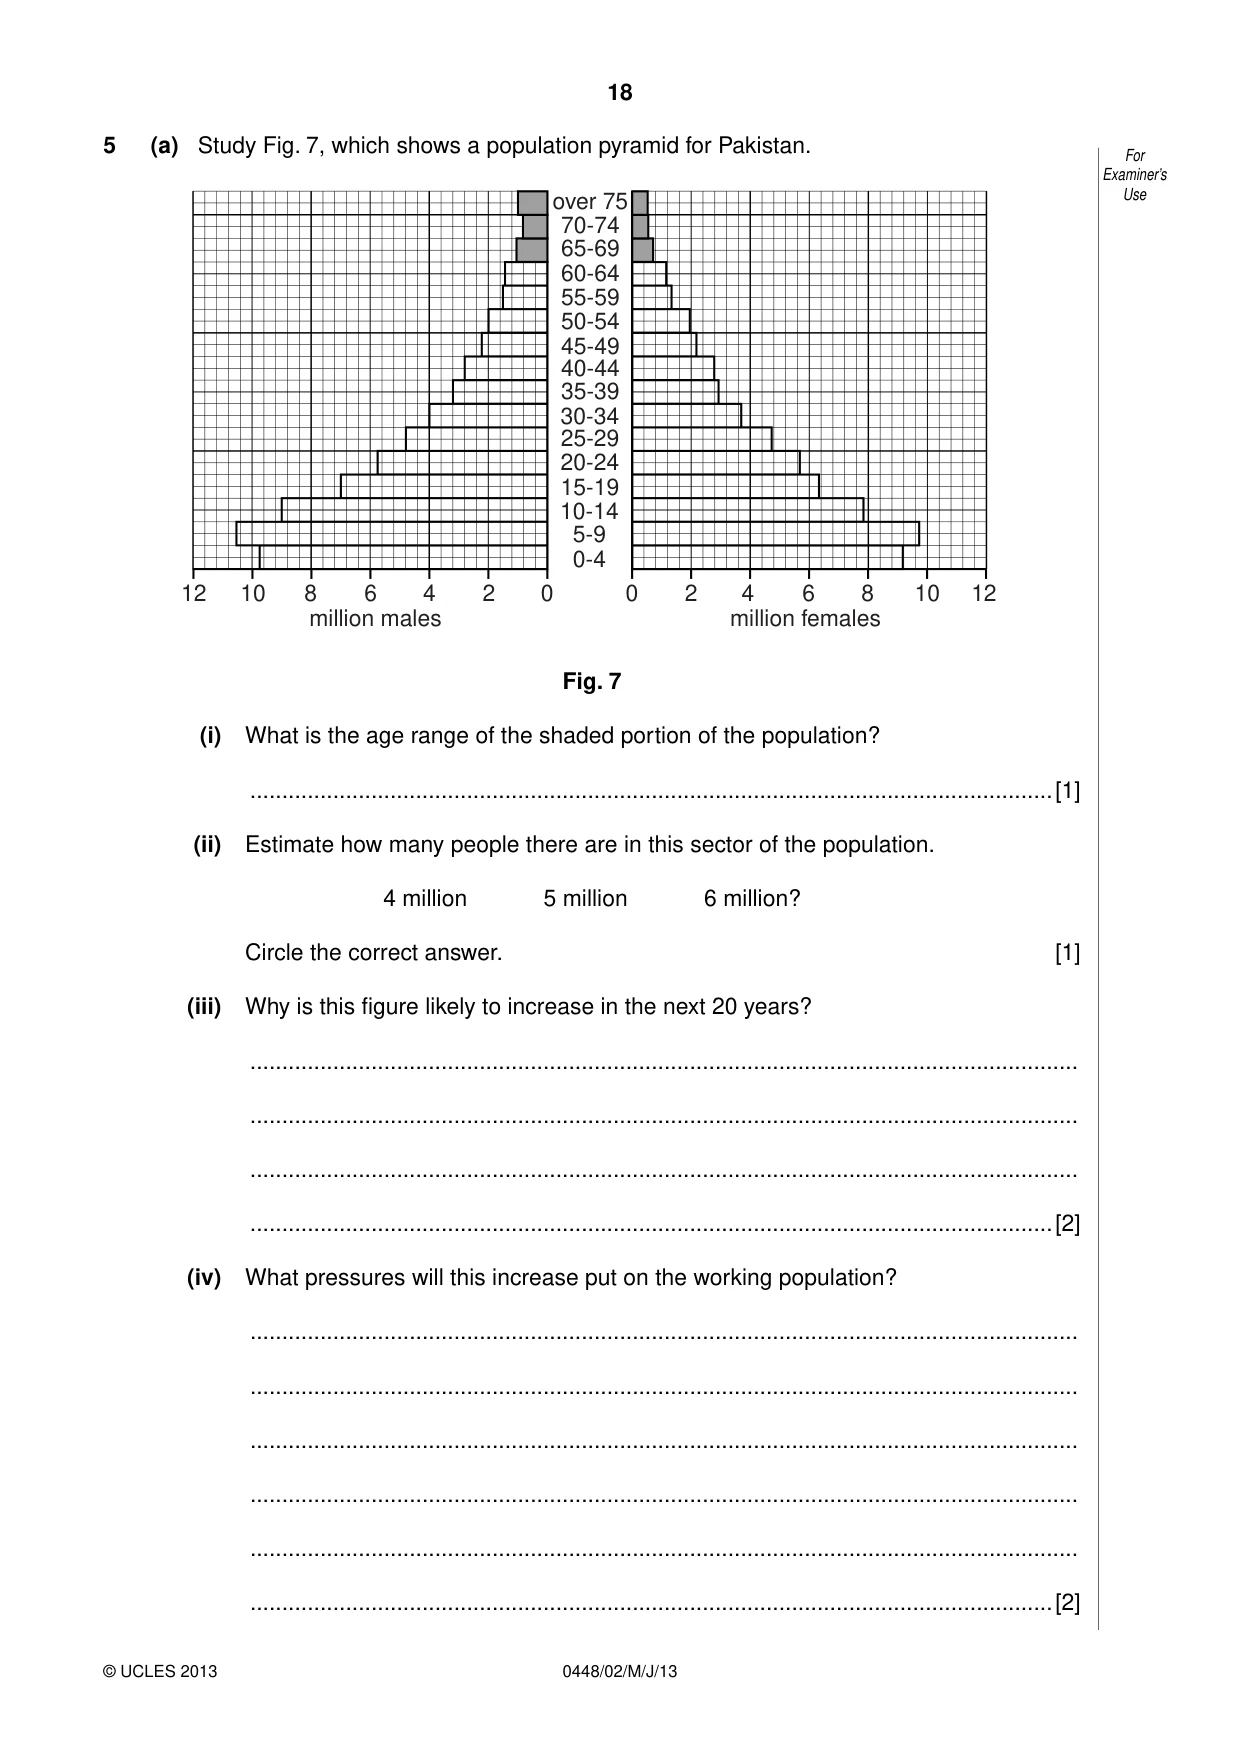
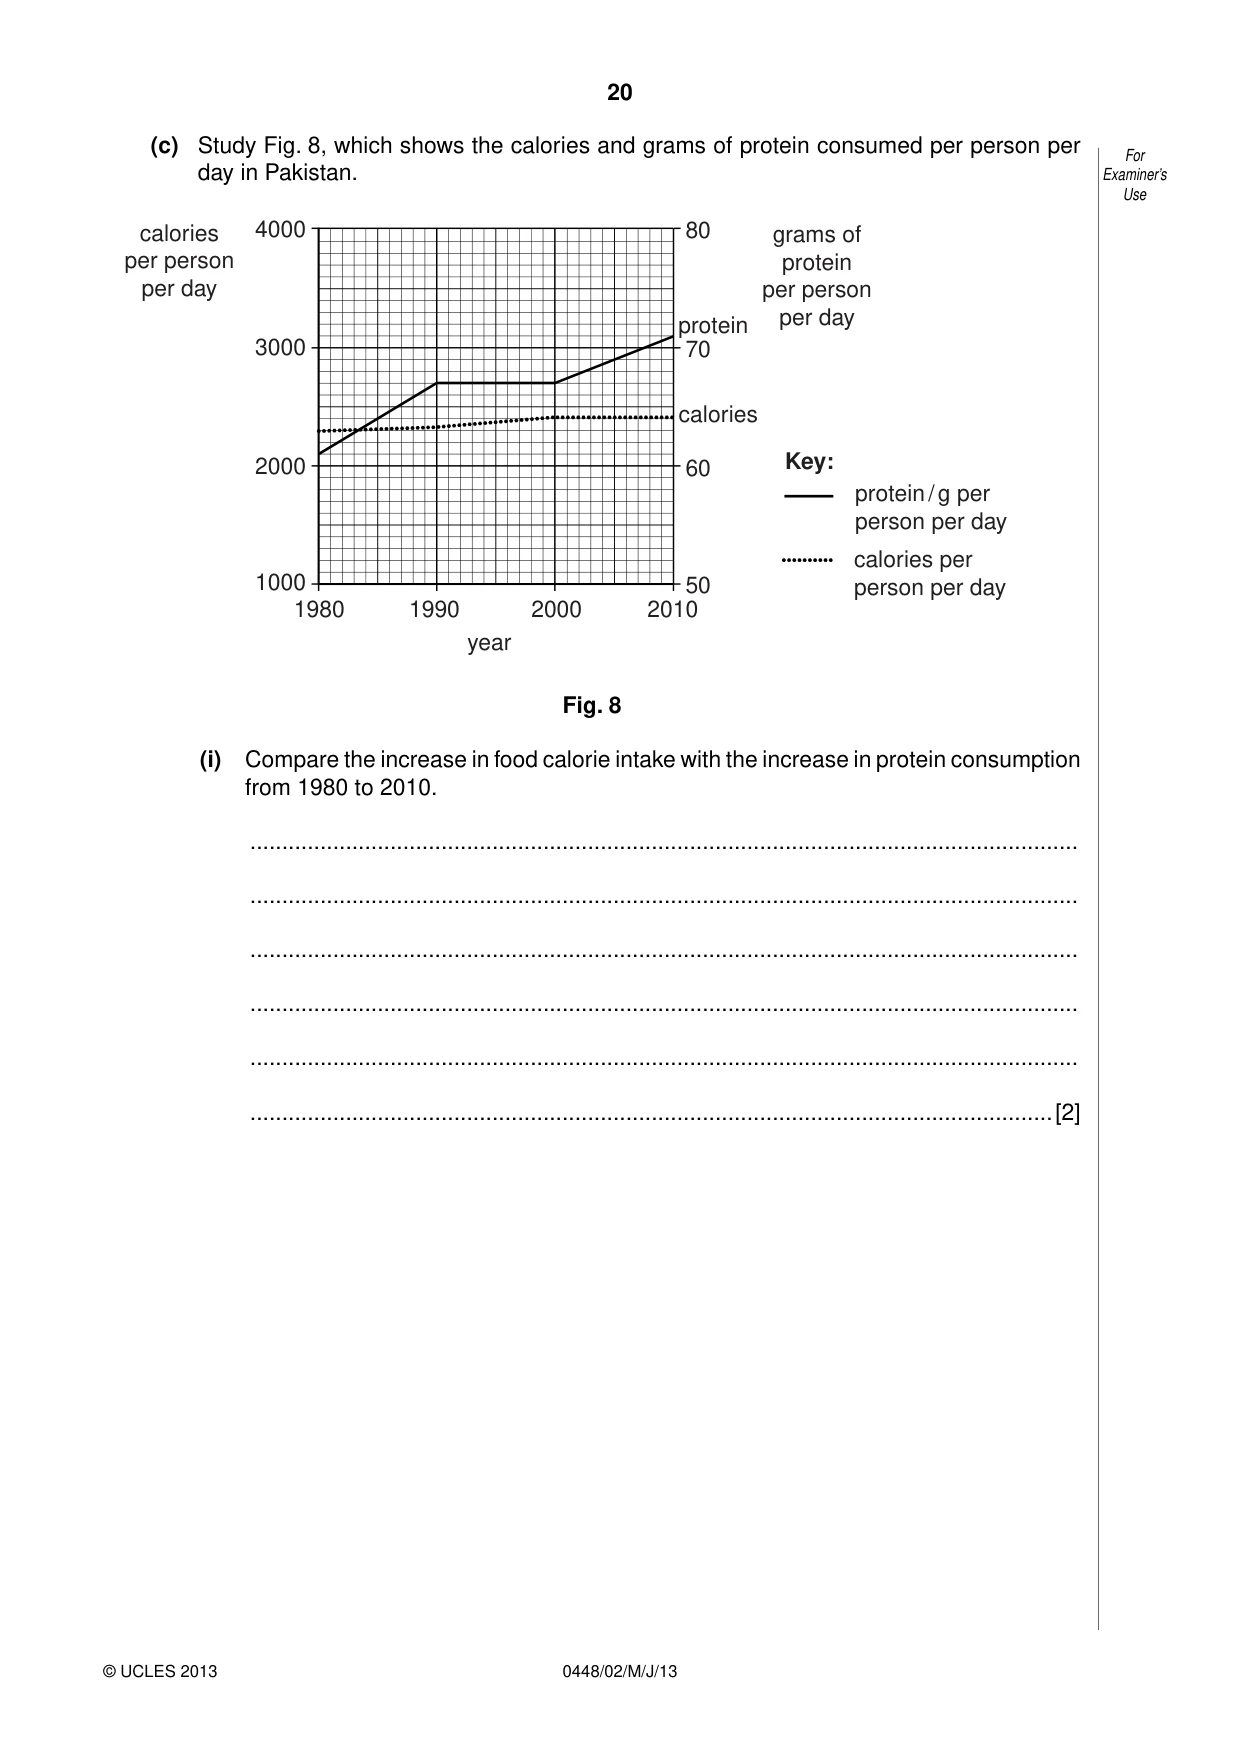
5 (a) Study Fig. 7, which shows a population pyramid for Pakistan. over 75 70-74 65-69 60-64 55-59 50-54 45-49 40-44 35-39 30-34 25-29 20-24 15-19 10-14 5-9 0-4 12 10 8 6 4 2 0 0 2 4 6 8 10 12 million males million females Fig. 7 (i) What is the age range of the shaded portion of the population? ..............................................................................................................................[1] (ii) Estimate how many people there are in this sector of the population. 4 million 5 million 6 million? Circle the correct answer. [1] (iii) Why is this figure likely to increase in the next 20 years? .................................................................................................................................. .................................................................................................................................. .................................................................................................................................. ..............................................................................................................................[2] (iv) What pressures will this increase put on the working population? .................................................................................................................................. .................................................................................................................................. .................................................................................................................................. .................................................................................................................................. .................................................................................................................................. ..............................................................................................................................[2] (b) (i) Estimate how many children aged under 5 are shown on Fig. 6. ..............................................................................................................................[1] (ii) Explain why the birth rate of Pakistan is very high. .................................................................................................................................. .................................................................................................................................. .................................................................................................................................. .................................................................................................................................. .................................................................................................................................. .................................................................................................................................. .................................................................................................................................. ..............................................................................................................................[4] (iii) Explain how better health and education provision can reduce the birth rate in Pakistan. .................................................................................................................................. .................................................................................................................................. .................................................................................................................................. .................................................................................................................................. .................................................................................................................................. .................................................................................................................................. .................................................................................................................................. .................................................................................................................................. .................................................................................................................................. .................................................................................................................................. .................................................................................................................................. .................................................................................................................................. .................................................................................................................................. ..............................................................................................................................[6] (c) Study Fig. 8, which shows the calories and grams of protein consumed per person per day in Pakistan. calories 4000 80 grams of per person protein per day per person per day protein 3000 70 calories 2000 60 Key: protein / g per person per day calories per 1000 50 person per day 1980 1990 2000 2010 year Fig. 8 (i) Compare the increase in food calorie intake with the increase in protein consumption from 1980 to 2010. .................................................................................................................................. .................................................................................................................................. .................................................................................................................................. .................................................................................................................................. .................................................................................................................................. ..............................................................................................................................[2]
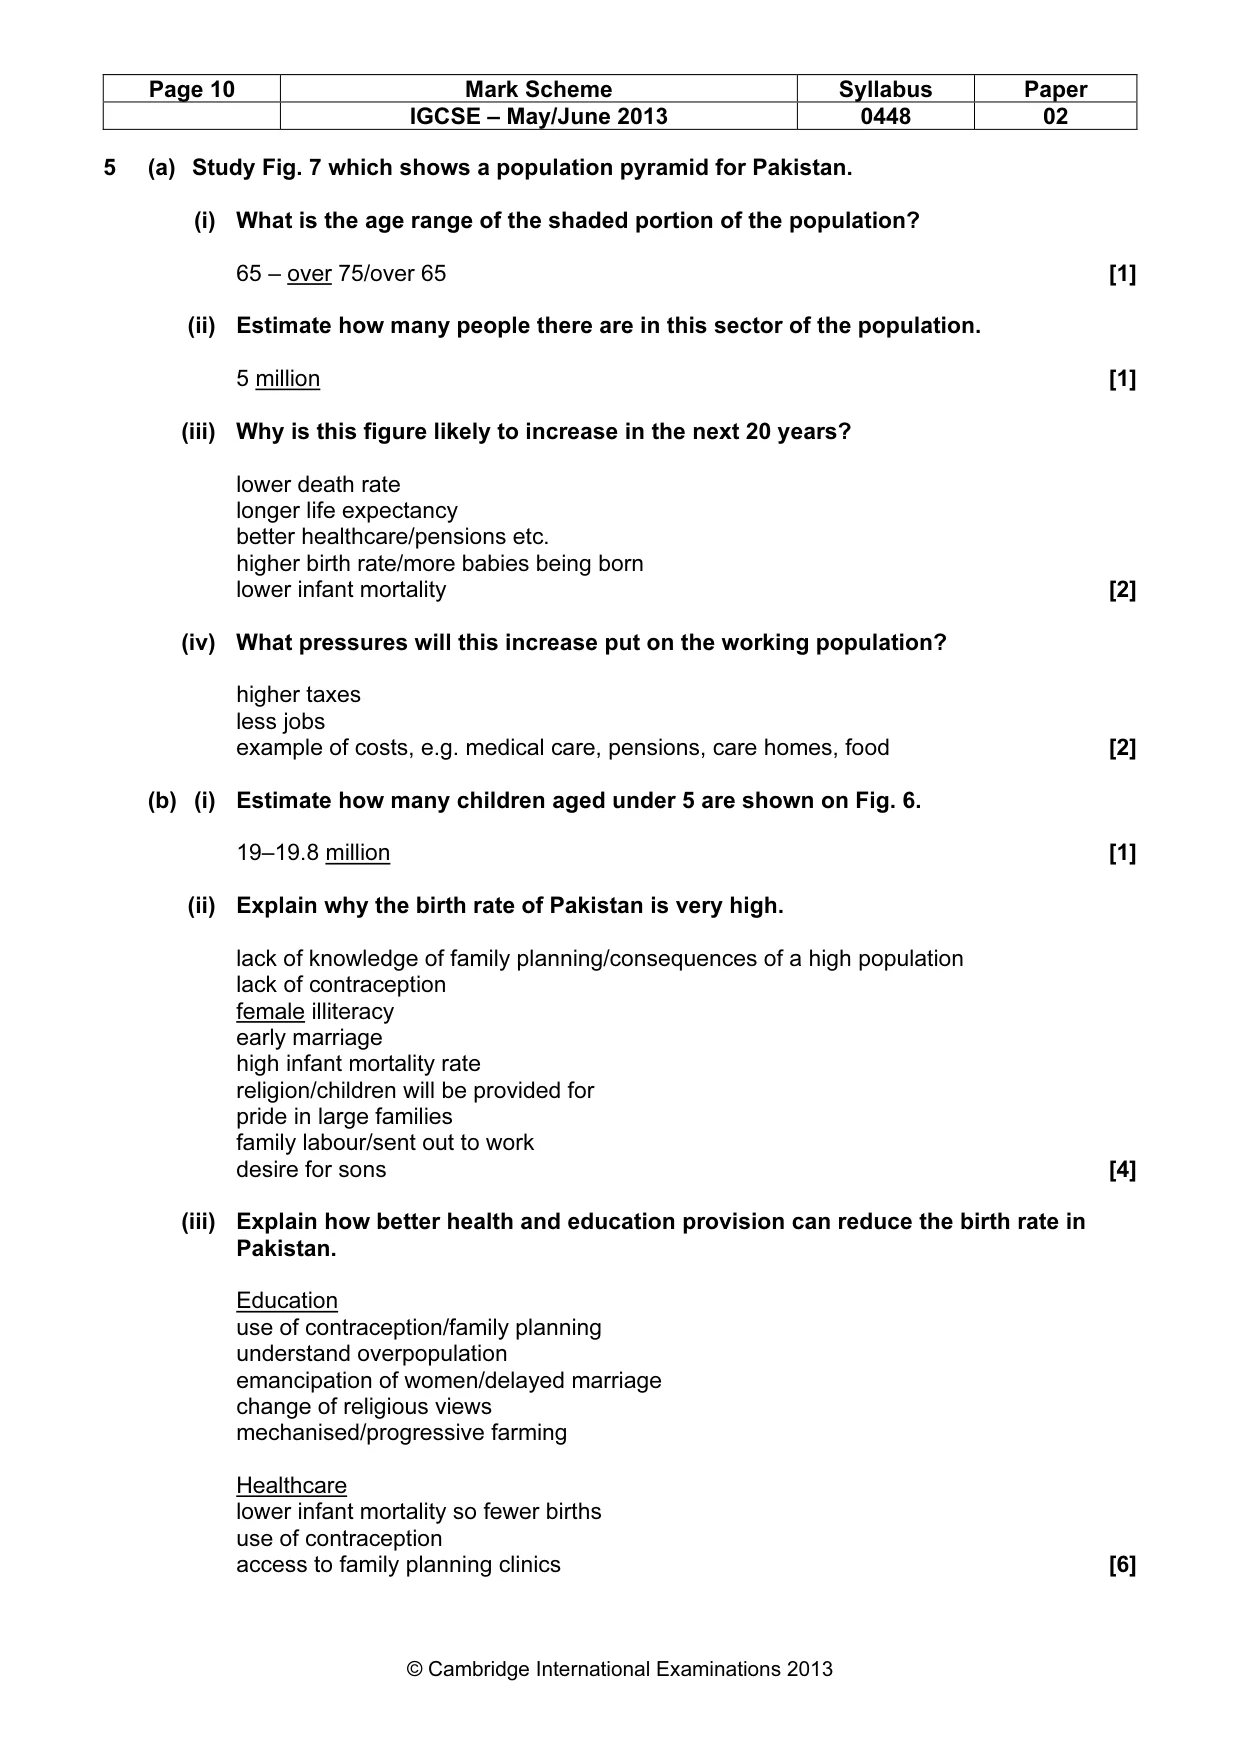
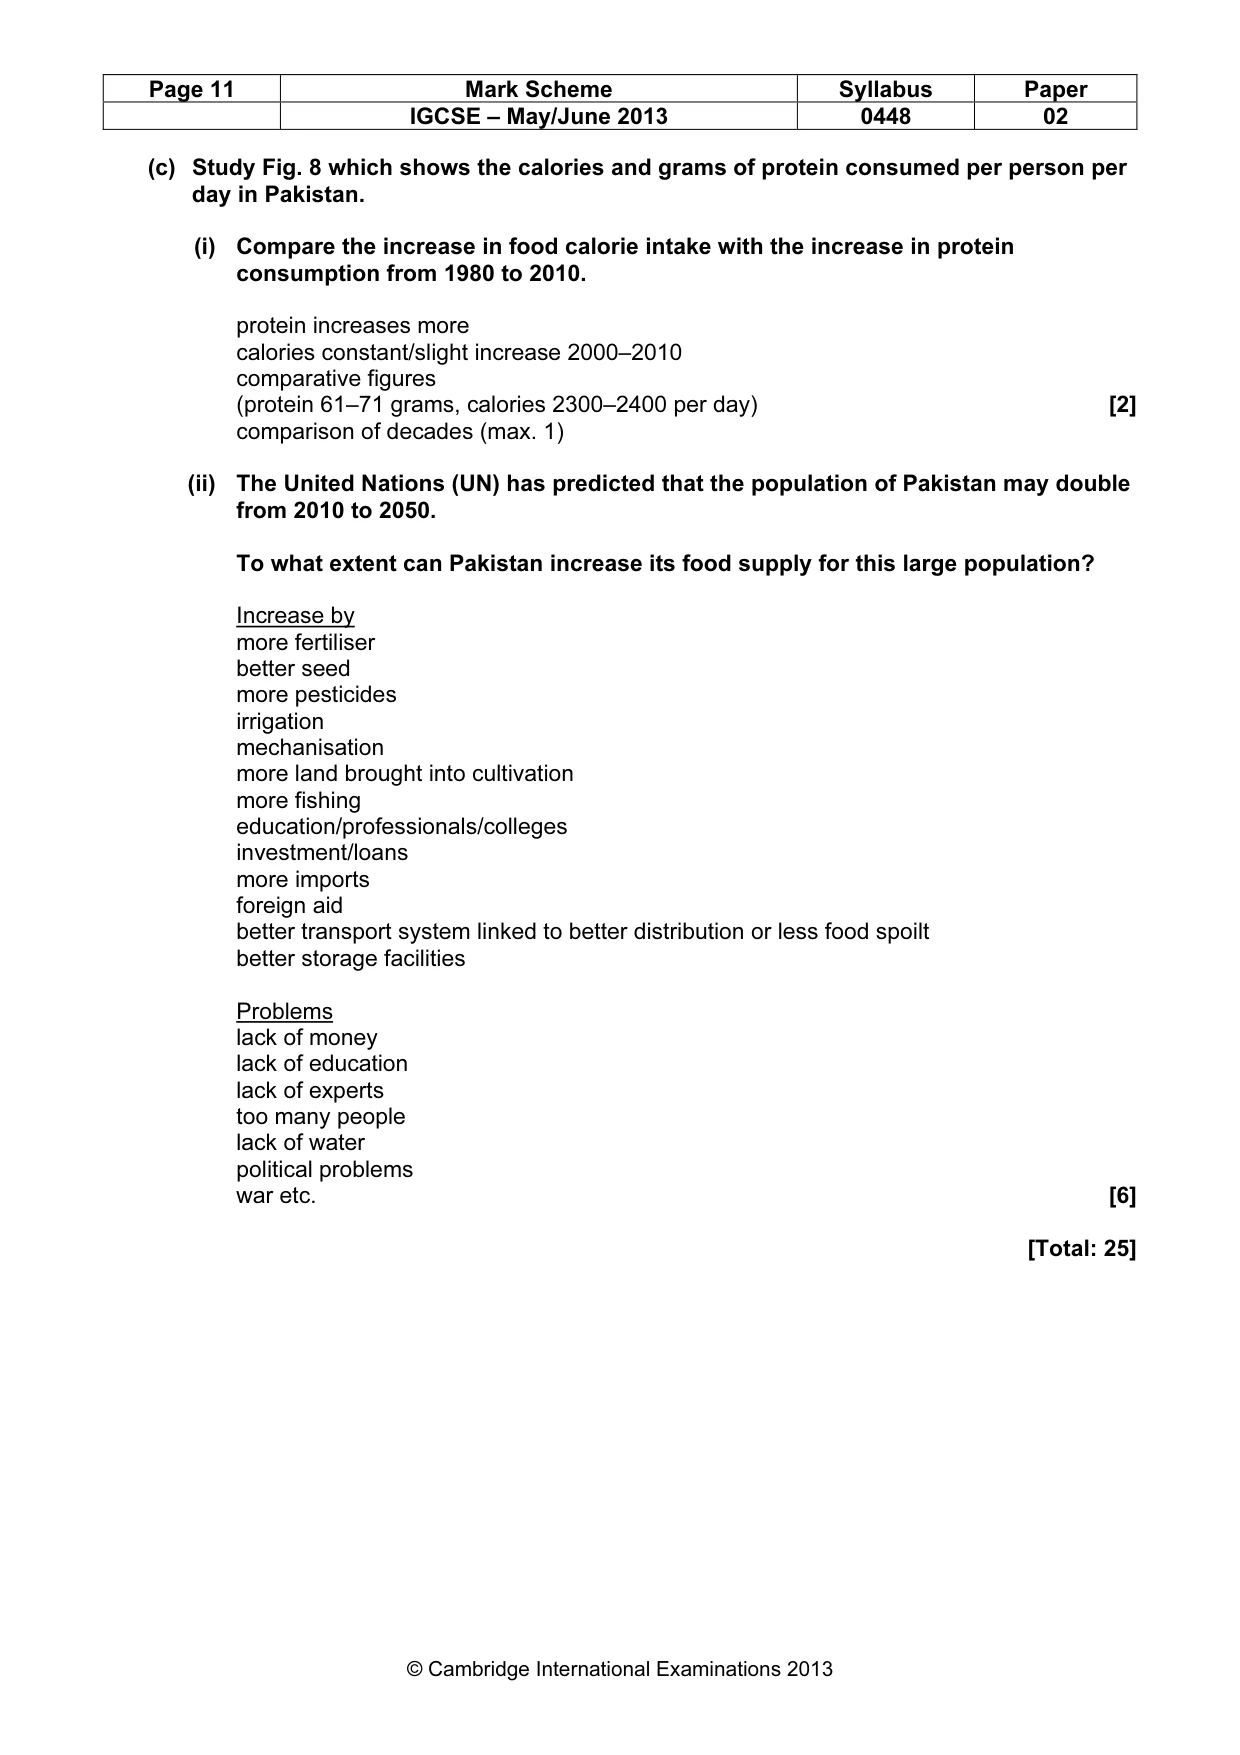
Mark scheme: 5 (a) Study Fig. 7 which shows a population pyramid for Pakistan. (i) What is the age range of the shaded portion of the population? 65 – over 75/over 65 [1] (ii) Estimate how many people there are in this sector of the population. 5 million [1] (iii) Why is this figure likely to increase in the next 20 years? lower death rate longer life expectancy better healthcare/pensions etc. higher birth rate/more babies being born lower infant mortality [2] (iv) What pressures will this increase put on the working population? higher taxes less jobs example of costs, e.g. medical care, pensions, care homes, food [2] (b) (i) Estimate how many children aged under 5 are shown on Fig. 6. 19–19.8 million [1] (ii) Explain why the birth rate of Pakistan is very high. lack of knowledge of family planning/consequences of a high population lack of contraception female illiteracy early marriage high infant mortality rate religion/children will be provided for pride in large families family labour/sent out to work desire for sons [4] (iii) Explain how better health and education provision can reduce the birth rate in Pakistan. Education use of contraception/family planning understand overpopulation emancipation of women/delayed marriage change of religious views mechanised/progressive farming Healthcare lower infant mortality so fewer births use of contraception access to family planning clinics [6] IGCSE – May/June 2013 0448 02 (c) Study Fig. 8 which shows the calories and grams of protein consumed per person per day in Pakistan. (i) Compare the increase in food calorie intake with the increase in protein consumption from 1980 to 2010. protein increases more calories constant/slight increase 2000–2010 comparative figures (protein 61–71 grams, calories 2300–2400 per day) [2] comparison of decades (max. 1) (ii) The United Nations (UN) has predicted that the population of Pakistan may double from 2010 to 2050. To what extent can Pakistan increase its food supply for this large population? Increase by more fertiliser better seed more pesticides irrigation mechanisation more land brought into cultivation more fishing education/professionals/colleges investment/loans more imports foreign aid better transport system linked to better distribution or less food spoilt better storage facilities Problems lack of money lack of education lack of experts too many people lack of water political problems war etc. [6] [Total: 25]
What you needed in this session
Cambridge’s own grade thresholds for 2013 May/June, Paper 2 · Variant 1. A higher threshold means an easier paper — the bar moves with how the cohort did.