Cambridge IGCSE Pakistan Studies 0448 — 2009 May/June Paper 2 · Variant 1
0448/21/M/J/09 · 75 marks · ≈84 min
The question paper and its mark scheme, free to read here and free to download. This is Cambridge’s own paper, exactly as it was sat.
Question paper8 pages
Mark scheme10 pages
Answers below. Sit the paper first if you are practising.
Paper as text
Question paper, page 1
This document consists of 8 printed pages and 1 insert. SPA (SHW 00232 4/08) T74522/3 © UCLES 2009 [Turn over UNIVERSITY OF CAMBRIDGE INTERNATIONAL EXAMINATIONS General Certificate of Education Ordinary Level International General Certificate of Secondary Education READ THESE INSTRUCTIONS FIRST If you have been given an Answer Booklet, follow the instructions on the front cover of the Booklet. Write your Centre number, candidate number and name on all the work you hand in. Write in dark blue or black pen. Do not use staples, paper clips, highlighters, glue or correction fluid. Answer any three questions. Sketch maps and diagrams may be drawn wherever they serve to illustrate an answer. The Insert contains Photographs A and B for Question 1 and Photographs C, D and E for Question 4. At the end of the examination, fasten all your work securely together. Write the number of each question attempted in the grid on the front cover of your Answer Booklet. The number of marks is given in brackets [ ] at the end of each question or part question. * 0 3 7 1 0 6 2 9 4 4 * PAKISTAN STUDIES 0448/02 2059/02 Paper 2 May/June 2009 1 hour 30 minutes Additional Materials: Answer Booklet/Paper www.XtremePapers.com
Question paper, page 2
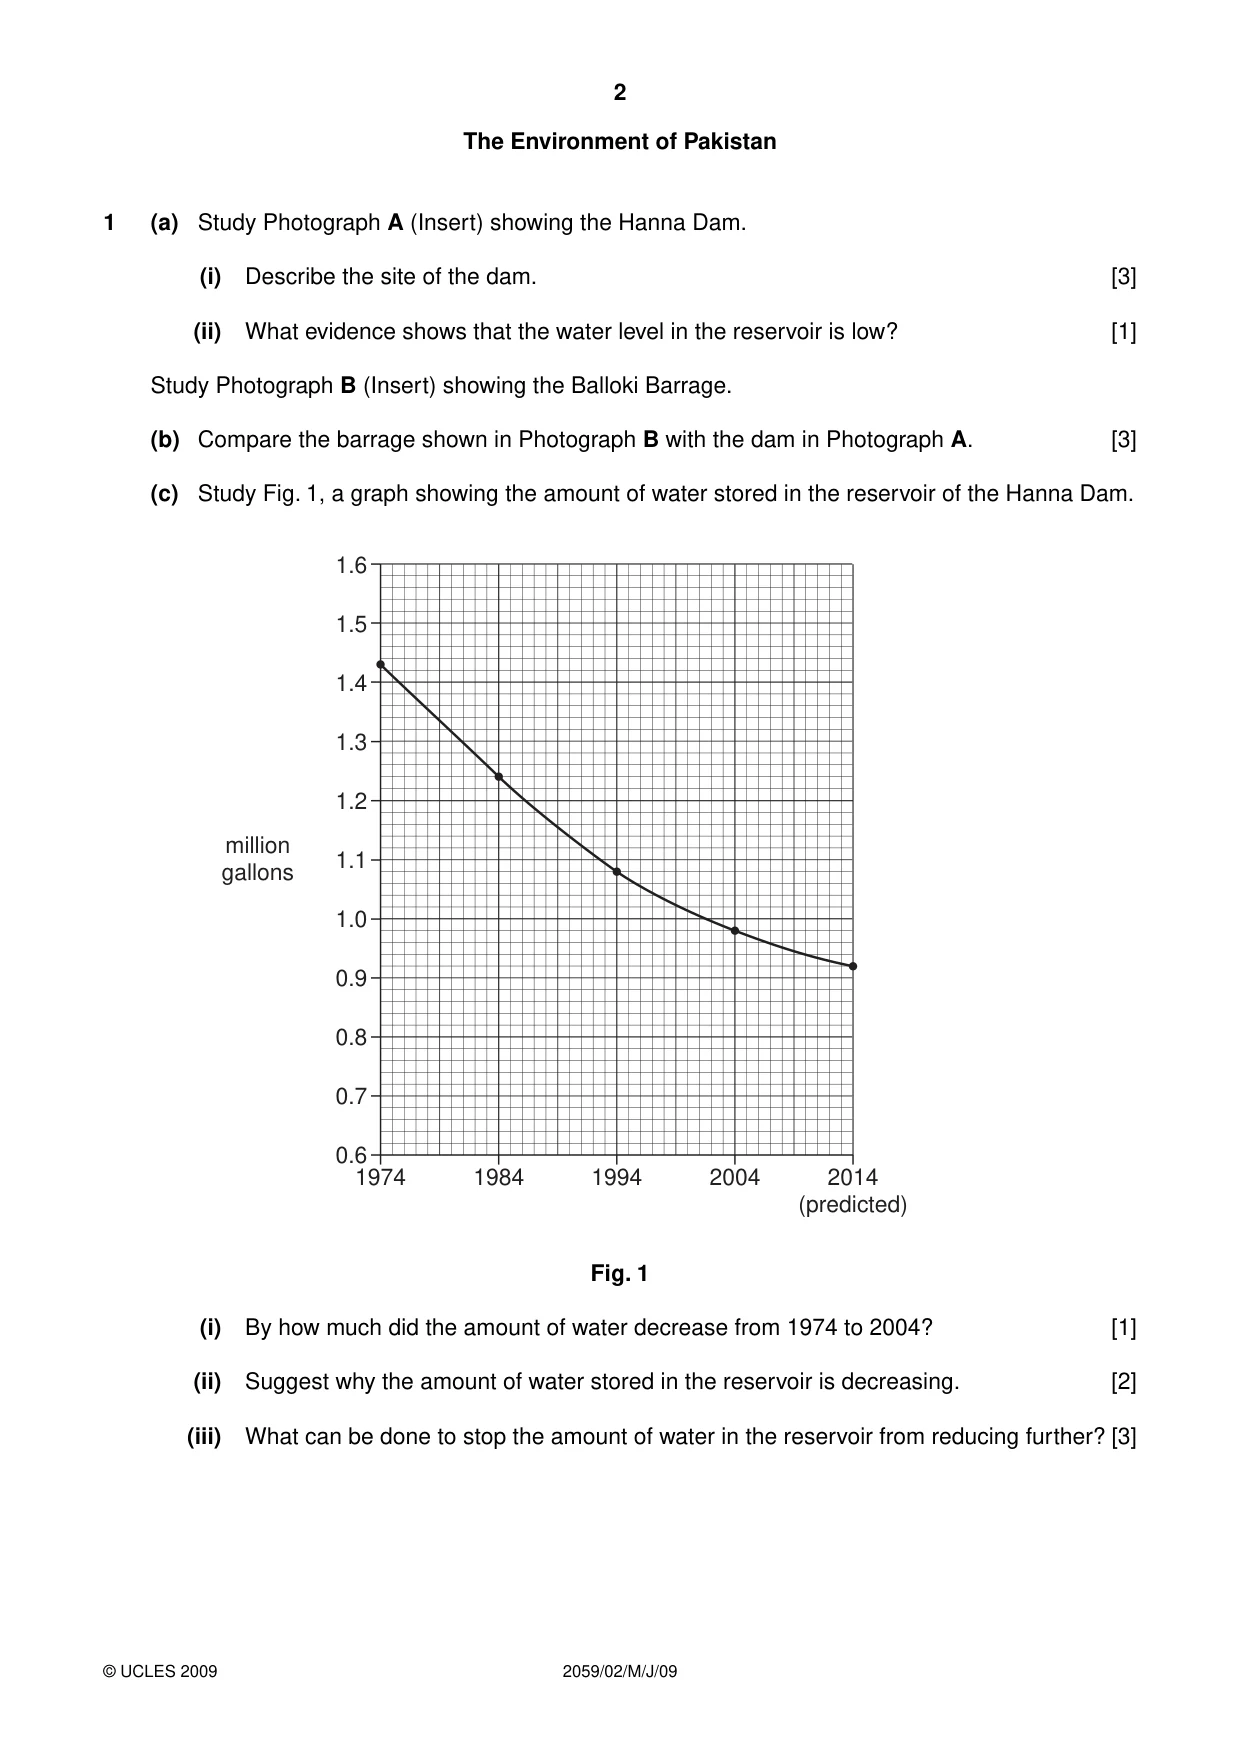
2 2059/02/M/J/09 © UCLES 2009 The Environment of Pakistan 1 (a) Study Photograph A (Insert) showing the Hanna Dam. (i) Describe the site of the dam. [3] (ii) What evidence shows that the water level in the reservoir is low? [1] Study Photograph B (Insert) showing the Balloki Barrage. (b) Compare the barrage shown in Photograph B with the dam in Photograph A. [3] (c) Study Fig. 1, a graph showing the amount of water stored in the reservoir of the Hanna Dam. 0.6 1974 million gallons 1984 1994 2004 2014 (predicted) 0.8 1.0 1.2 1.4 0.7 0.9 1.1 1.3 1.5 1.6 Fig. 1 (i) By how much did the amount of water decrease from 1974 to 2004? [1] (ii) Suggest why the amount of water stored in the reservoir is decreasing. [2] (iii) What can be done to stop the amount of water in the reservoir from reducing further? [3]
Question paper, page 3
3 2059/02/M/J/09 © UCLES 2009 [Turn over (d) (i) Why is HEP (hydel) a cheap source of electricity? [2] (ii) What problems occur when supplying electricity from reservoirs to areas of high population? [3] (e) Photograph A shows a chair lift. This shows that tourists may visit the area. (i) List some other tourist attractions in mountain areas. [2] (ii) Explain how tourism could help to develop some mountain areas. You may use examples in your answer. [5] [Total: 25]
Question paper, page 4
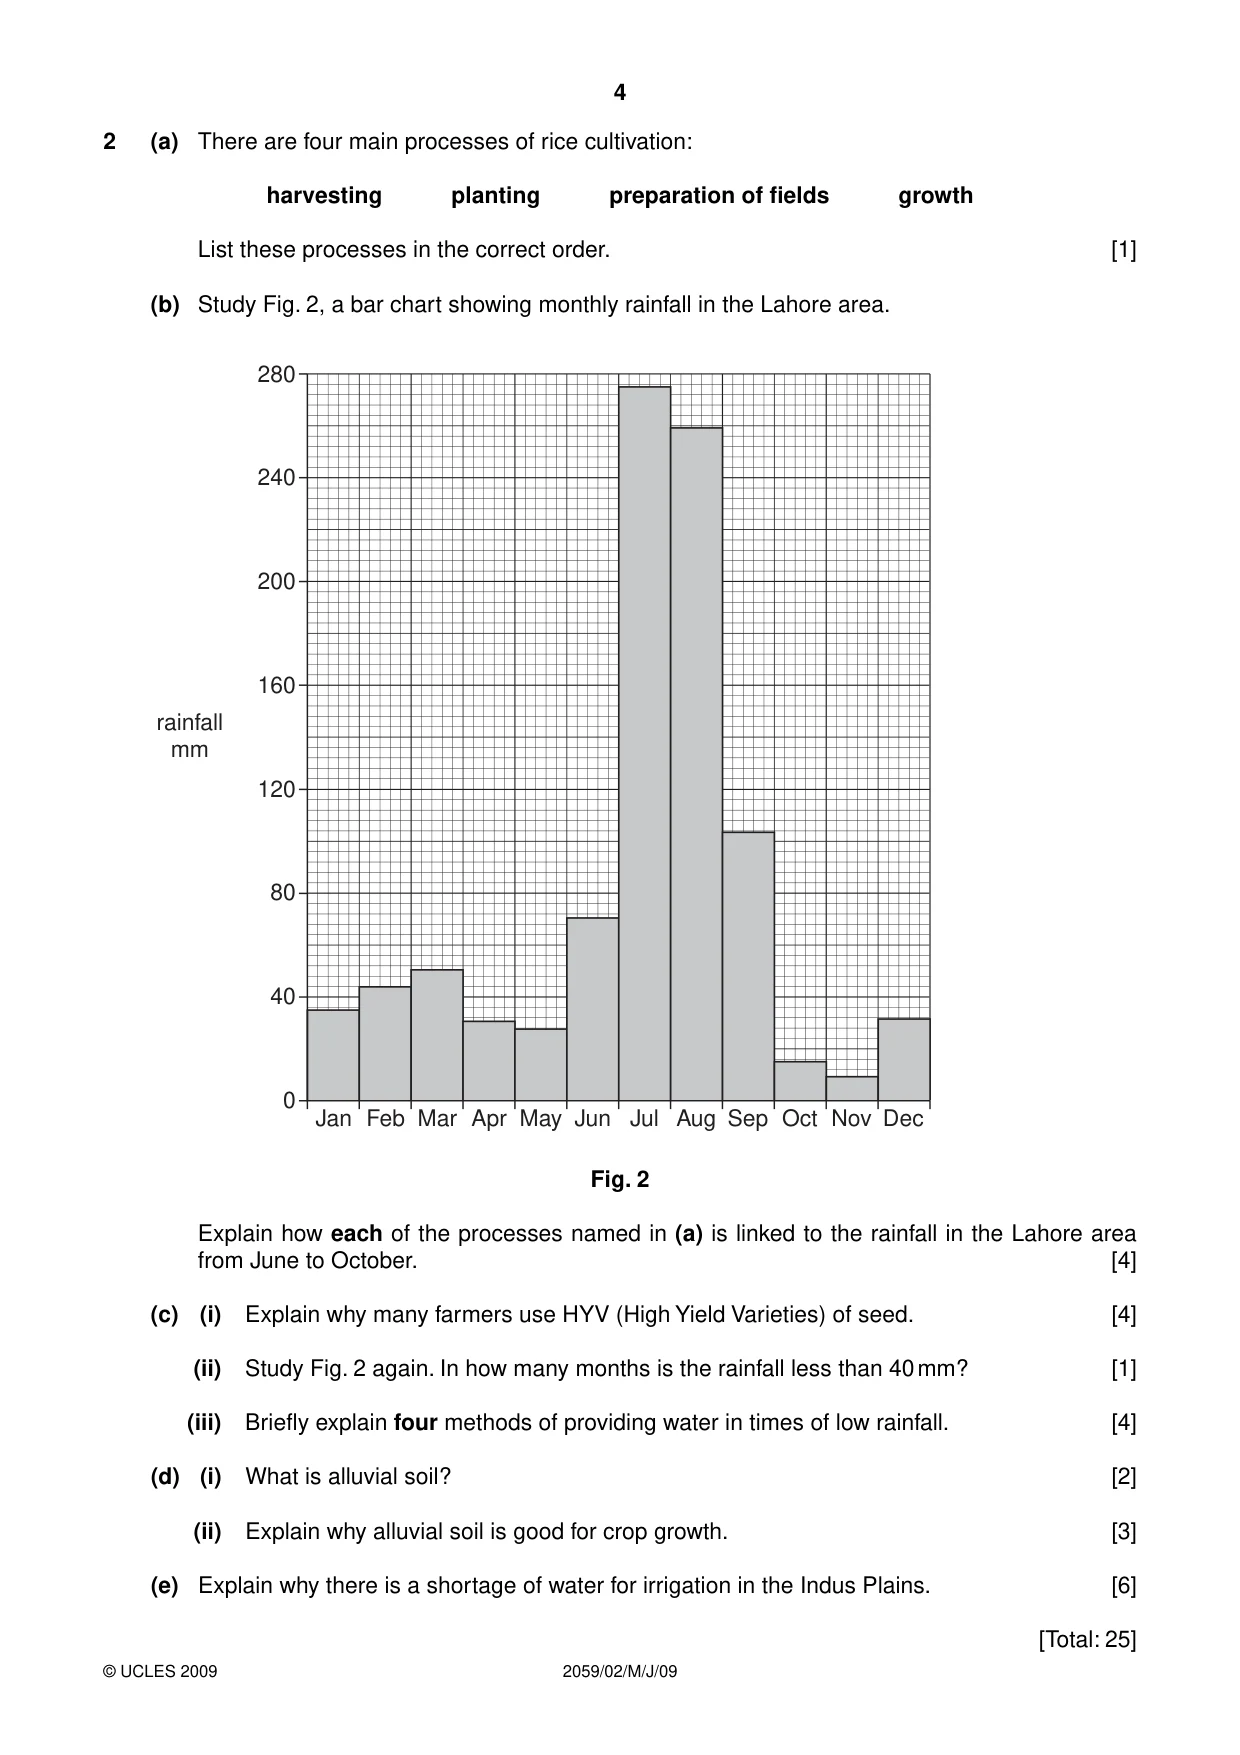
4 2059/02/M/J/09 © UCLES 2009 2 (a) There are four main processes of rice cultivation: harvesting planting preparation of fields growth List these processes in the correct order. [1] (b) Study Fig. 2, a bar chart showing monthly rainfall in the Lahore area. 0 rainfall mm Jan Feb Mar Apr May Jun Jul Aug Sep Oct Nov Dec 40 80 120 160 200 240 280 Fig. 2 Explain how each of the processes named in (a) is linked to the rainfall in the Lahore area from June to October. [4] (c) (i) Explain why many farmers use HYV (High Yield Varieties) of seed. [4] (ii) Study Fig. 2 again. In how many months is the rainfall less than 40 mm? [1] (iii) Briefly explain four methods of providing water in times of low rainfall. [4] (d) (i) What is alluvial soil? [2] (ii) Explain why alluvial soil is good for crop growth. [3] (e) Explain why there is a shortage of water for irrigation in the Indus Plains. [6] [Total: 25]
Question paper, page 5
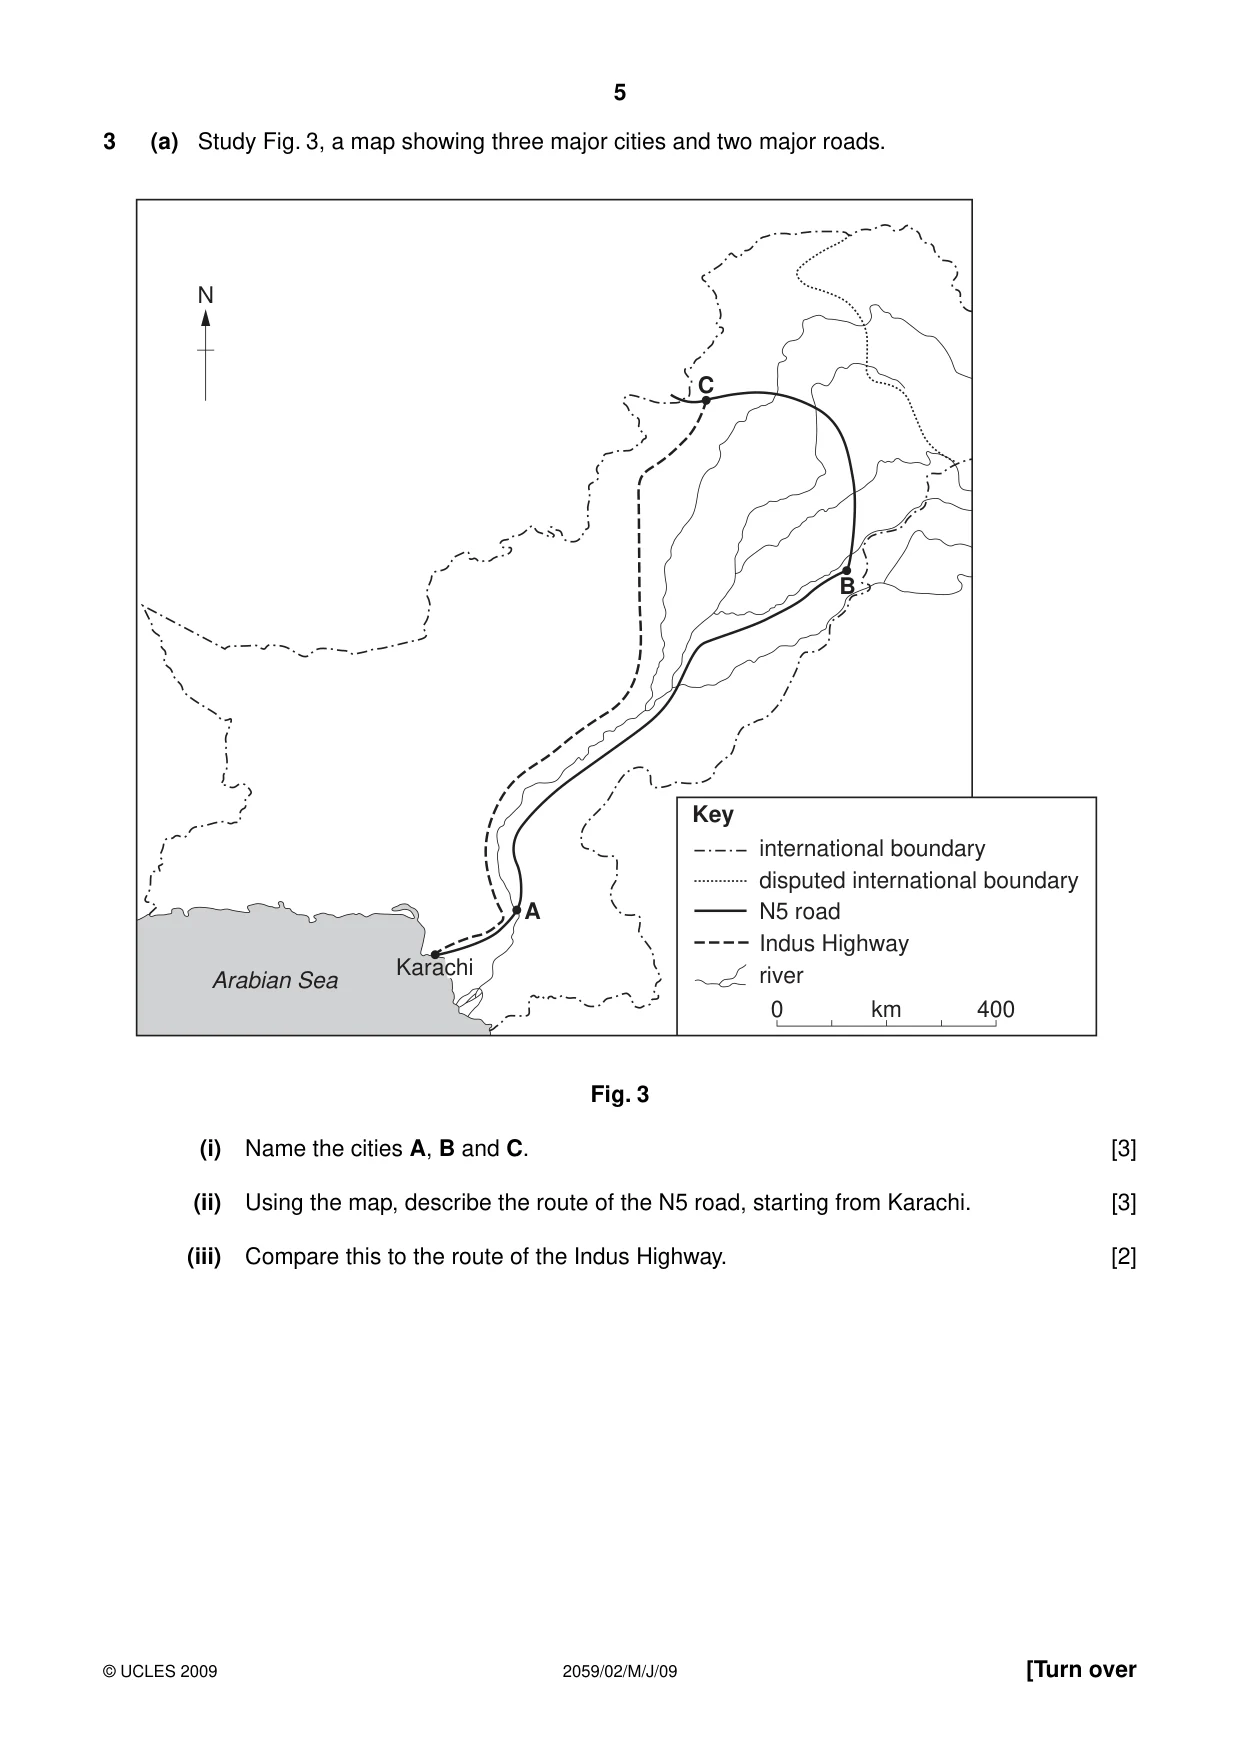
5 2059/02/M/J/09 © UCLES 2009 [Turn over 3 (a) Study Fig. 3, a map showing three major cities and two major roads. Arabian Sea N A B C Key international boundary disputed international boundary N5 road Indus Highway river 0 km 400 Karachi Fig. 3 (i) Name the cities A, B and C. [3] (ii) Using the map, describe the route of the N5 road, starting from Karachi. [3] (iii) Compare this to the route of the Indus Highway. [2]
Question paper, page 6
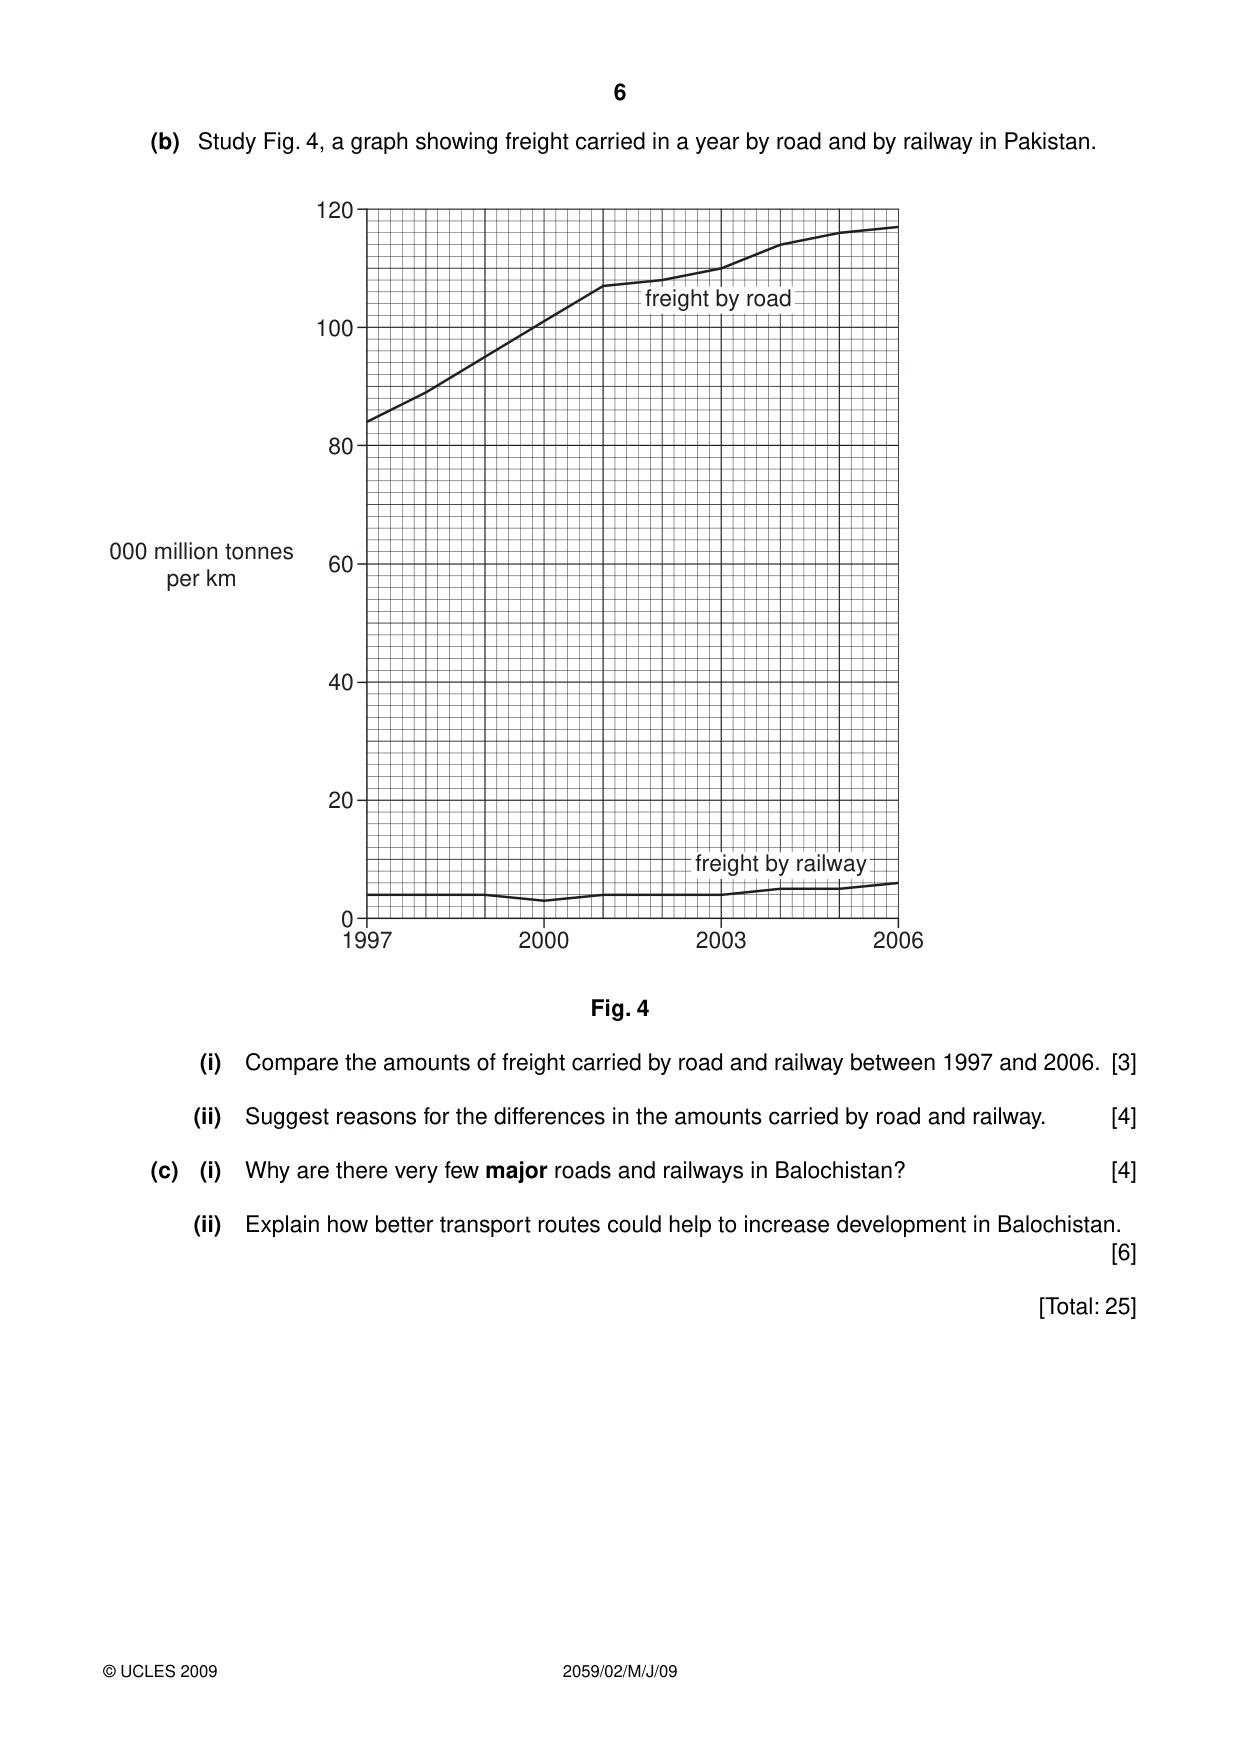
6 2059/02/M/J/09 © UCLES 2009 (b) Study Fig. 4, a graph showing freight carried in a year by road and by railway in Pakistan. 0 1997 000 million tonnes per km 2000 2003 2006 20 40 60 80 100 120 freight by road freight by railway Fig. 4 (i) Compare the amounts of freight carried by road and railway between 1997 and 2006. [3] (ii) Suggest reasons for the differences in the amounts carried by road and railway. [4] (c) (i) Why are there very few major roads and railways in Balochistan? [4] (ii) Explain how better transport routes could help to increase development in Balochistan. [6] [Total: 25]
Question paper, page 7
7 2059/02/M/J/09 © UCLES 2009 [Turn over 4 Study Photographs C, D and E (Insert) showing the stockyard at Pakistan Steel Mills, Pipri. (a) (i) Name three raw materials used in the Pakistan Steel Mills. [3] (ii) Why are most of the raw materials imported? [2] (iii) Name the two outputs from the steel mills shown on Photographs D and E. [2] (b) (i) Name two human inputs to the steel mills. [2] (ii) Explain how human inputs such as those named in (b)(i) can improve production. [4] (c) (i) What is an Export Processing Zone (EPZ)? [2] (ii) Explain how the building of industrial estates could help to increase industrial production in Pakistan. [5] (d) Describe the characteristics of an industry in the formal sector of employment. [5] [Total: 25]
Question paper, page 8
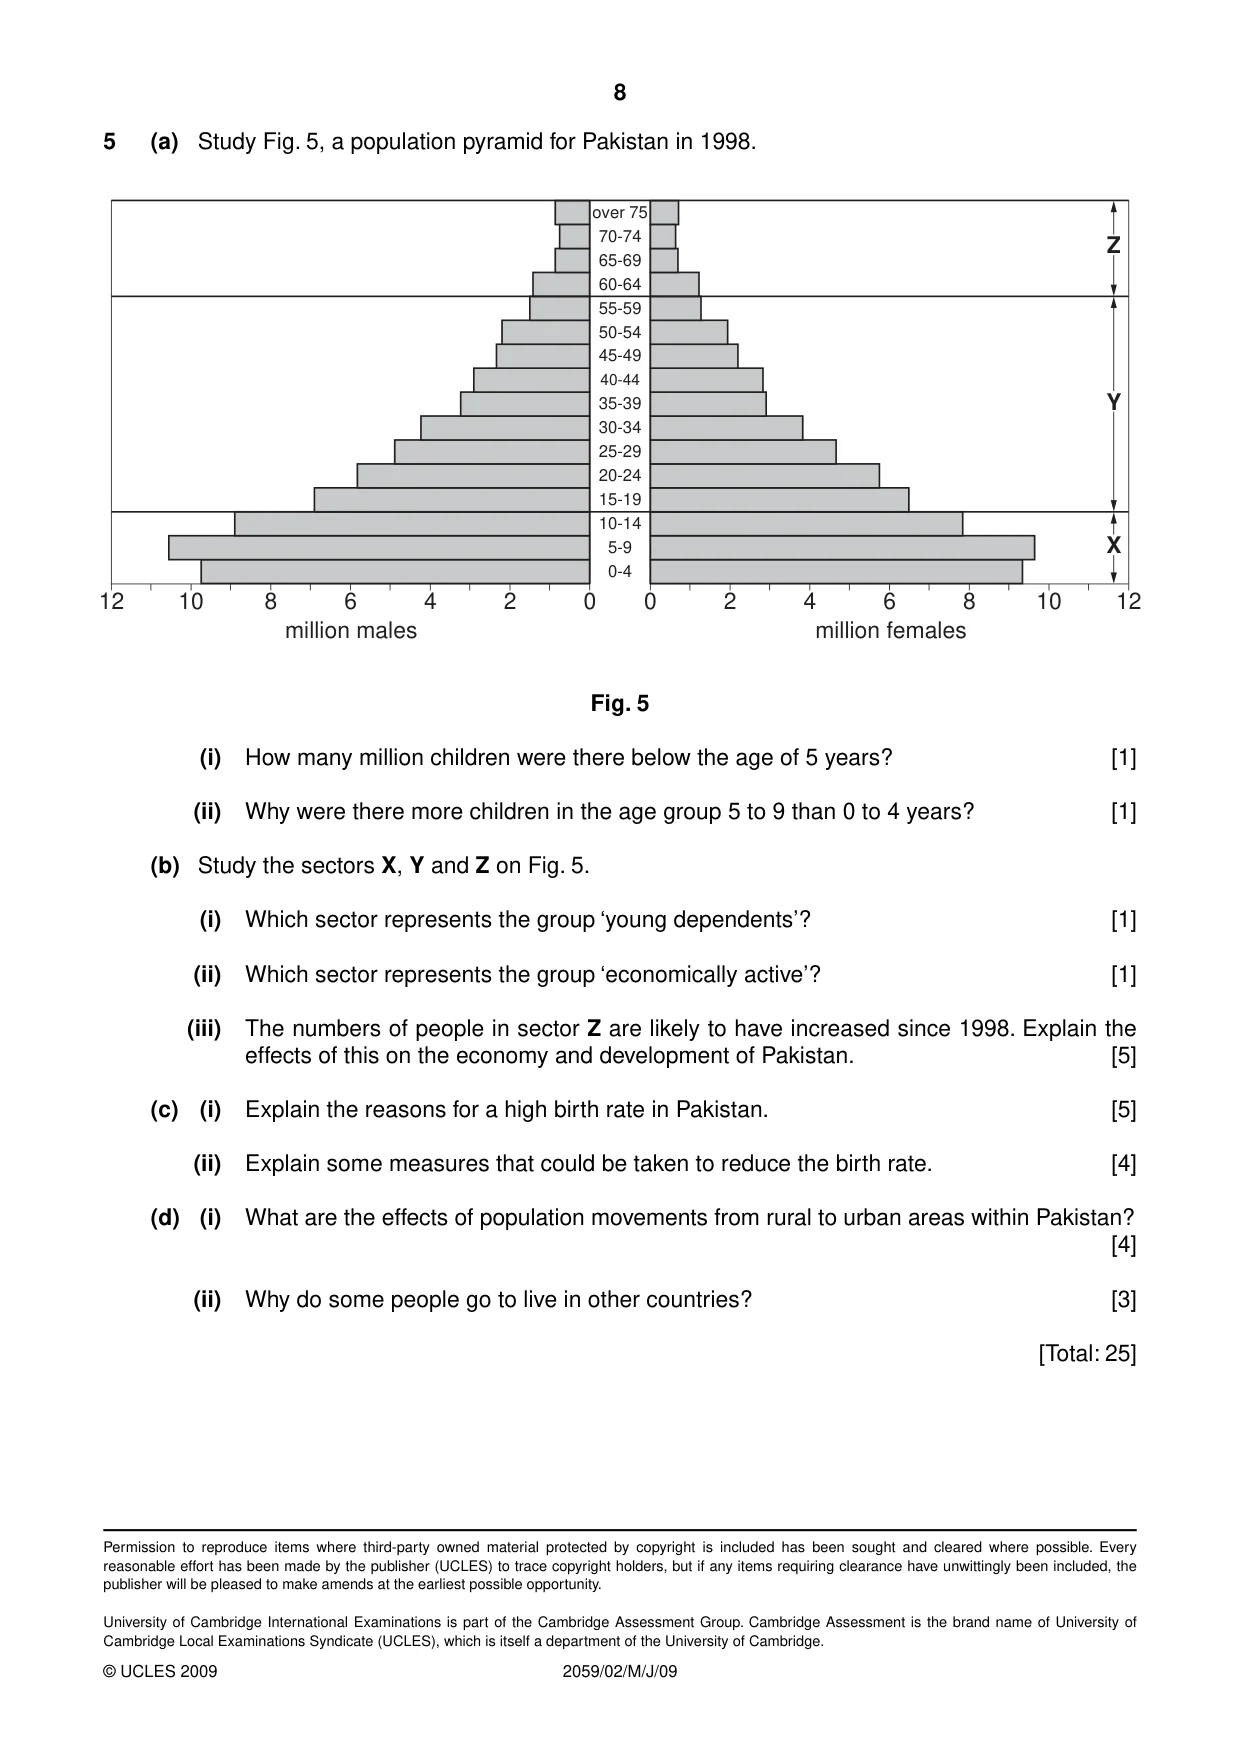
8 2059/02/M/J/09 © UCLES 2009 5 (a) Study Fig. 5, a population pyramid for Pakistan in 1998. 12 million males million females 10 8 6 4 2 0 0 2 4 6 8 10 12 0-4 5-9 10-14 15-19 20-24 25-29 30-34 35-39 40-44 45-49 50-54 55-59 60-64 65-69 70-74 over 75 Z Y X Fig. 5 (i) How many million children were there below the age of 5 years? [1] (ii) Why were there more children in the age group 5 to 9 than 0 to 4 years? [1] (b) Study the sectors X, Y and Z on Fig. 5. (i) Which sector represents the group ‘young dependents’? [1] (ii) Which sector represents the group ‘economically active’? [1] (iii) The numbers of people in sector Z are likely to have increased since 1998. Explain the effects of this on the economy and development of Pakistan. [5] (c) (i) Explain the reasons for a high birth rate in Pakistan. [5] (ii) Explain some measures that could be taken to reduce the birth rate. [4] (d) (i) What are the effects of population movements from rural to urban areas within Pakistan? [4] (ii) Why do some people go to live in other countries? [3] [Total: 25] Permission to reproduce items where third-party owned material protected by copyright is included has been sought and cleared where possible. Every reasonable effort has been made by the publisher (UCLES) to trace copyright holders, but if any items requiring clearance have unwittingly been included, the publisher will be pleased to make amends at the earliest possible opportunity. University of Cambridge International Examinations is part of the Cambridge Assessment Group. Cambridge Assessment is the brand name of University of Cambridge Local Examinations Syndicate (UCLES), which is itself a department of the University of Cambridge.
Mark scheme, page 1
UNIVERSITY OF CAMBRIDGE INTERNATIONAL EXAMINATIONS International General Certificate of Secondary Education MARK SCHEME for the May/June 2009 question paper for the guidance of teachers 0448 PAKISTAN STUDIES 0448/02 Paper 2 (Environment of Pakistan), maximum raw mark 75 This mark scheme is published as an aid to teachers and candidates, to indicate the requirements of the examination. It shows the basis on which Examiners were instructed to award marks. It does not indicate the details of the discussions that took place at an Examiners’ meeting before marking began, which would have considered the acceptability of alternative answers. Mark schemes must be read in conjunction with the question papers and the report on the examination. • CIE will not enter into discussions or correspondence in connection with these mark schemes. CIE is publishing the mark schemes for the May/June 2009 question papers for most IGCSE, GCE Advanced Level and Advanced Subsidiary Level syllabuses and some Ordinary Level syllabuses. www.XtremePapers.com
Mark scheme, page 2
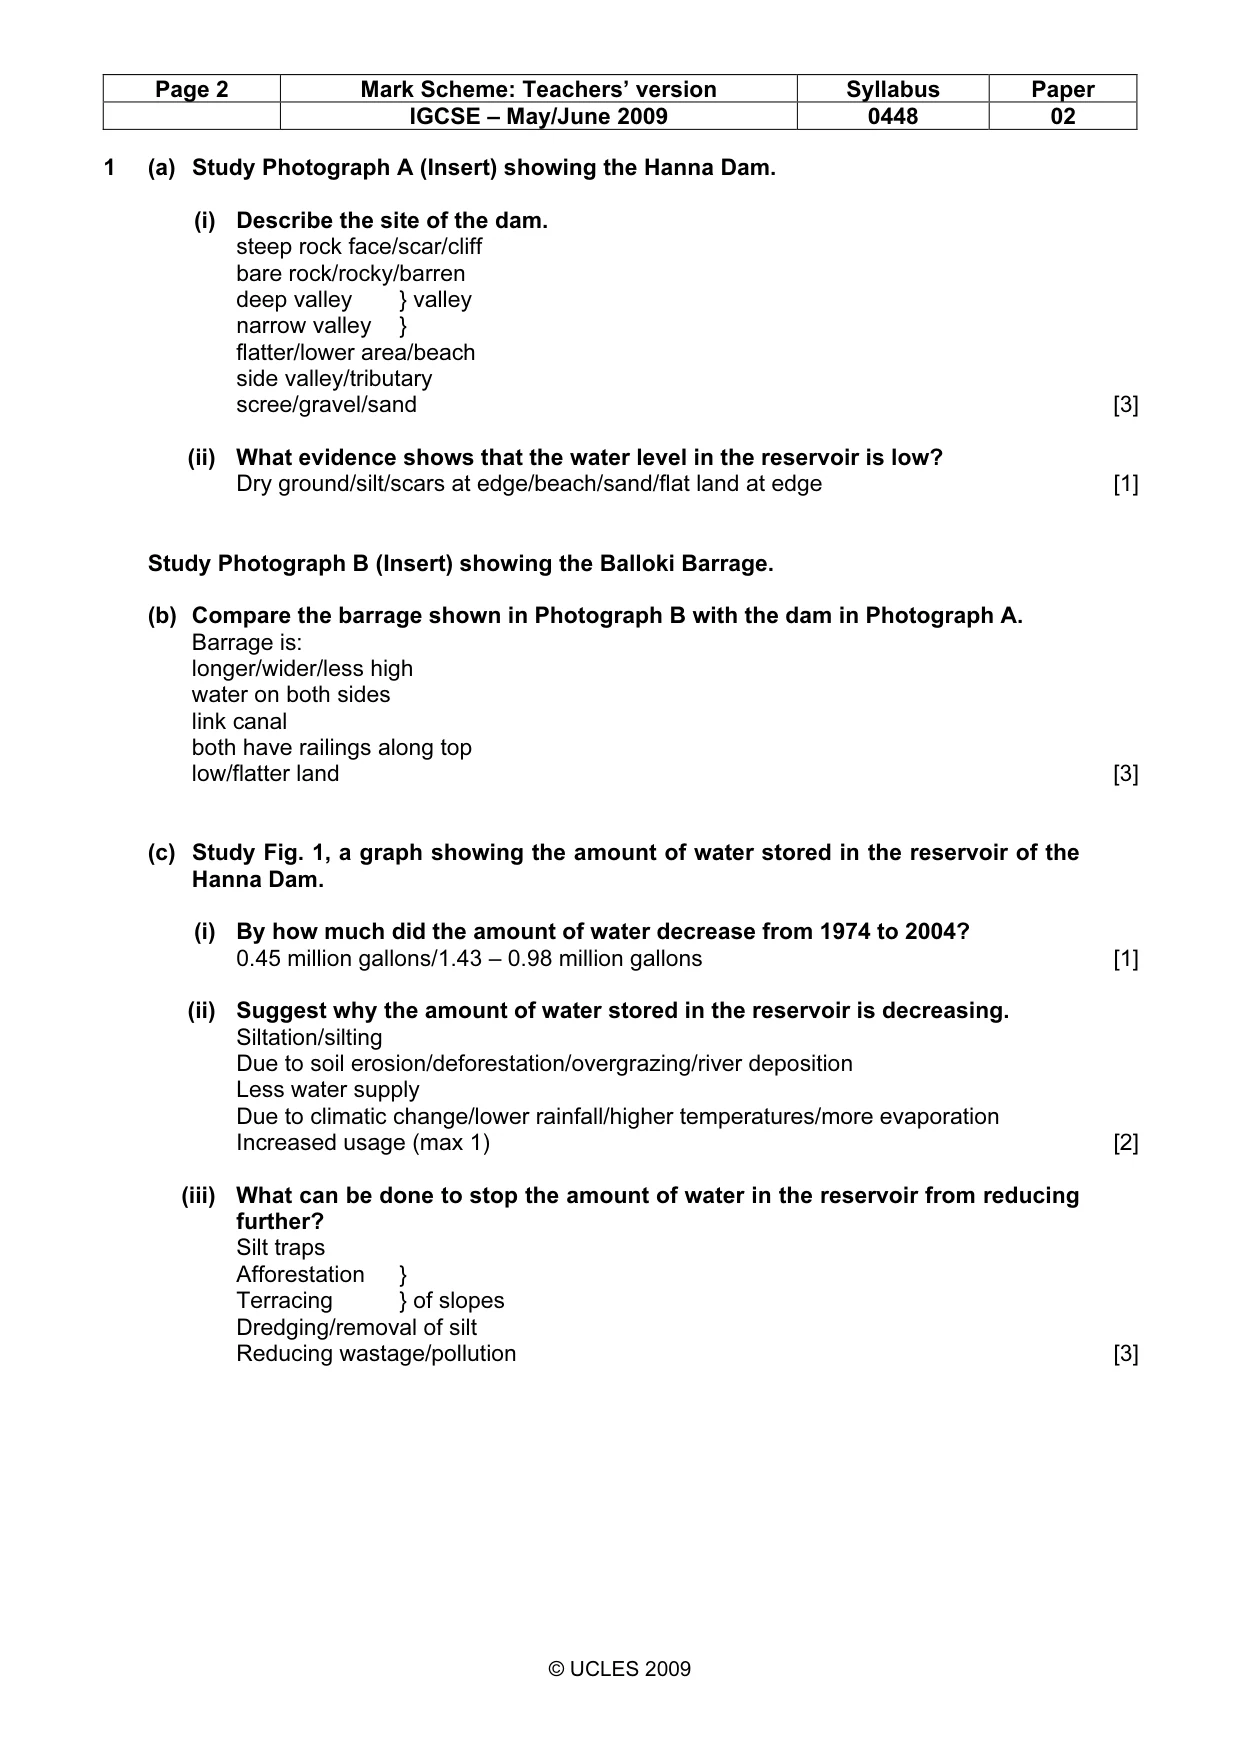
Page 2 Mark Scheme: Teachers’ version Syllabus Paper IGCSE – May/June 2009 0448 02 © UCLES 2009 1 (a) Study Photograph A (Insert) showing the Hanna Dam. (i) Describe the site of the dam. steep rock face/scar/cliff bare rock/rocky/barren deep valley } valley narrow valley } flatter/lower area/beach side valley/tributary scree/gravel/sand [3] (ii) What evidence shows that the water level in the reservoir is low? Dry ground/silt/scars at edge/beach/sand/flat land at edge [1] Study Photograph B (Insert) showing the Balloki Barrage. (b) Compare the barrage shown in Photograph B with the dam in Photograph A. Barrage is: longer/wider/less high water on both sides link canal both have railings along top low/flatter land [3] (c) Study Fig. 1, a graph showing the amount of water stored in the reservoir of the Hanna Dam. (i) By how much did the amount of water decrease from 1974 to 2004? 0.45 million gallons/1.43 – 0.98 million gallons [1] (ii) Suggest why the amount of water stored in the reservoir is decreasing. Siltation/silting Due to soil erosion/deforestation/overgrazing/river deposition Less water supply Due to climatic change/lower rainfall/higher temperatures/more evaporation Increased usage (max 1) [2] (iii) What can be done to stop the amount of water in the reservoir from reducing further? Silt traps Afforestation } Terracing } of slopes Dredging/removal of silt Reducing wastage/pollution [3]
Mark scheme, page 3
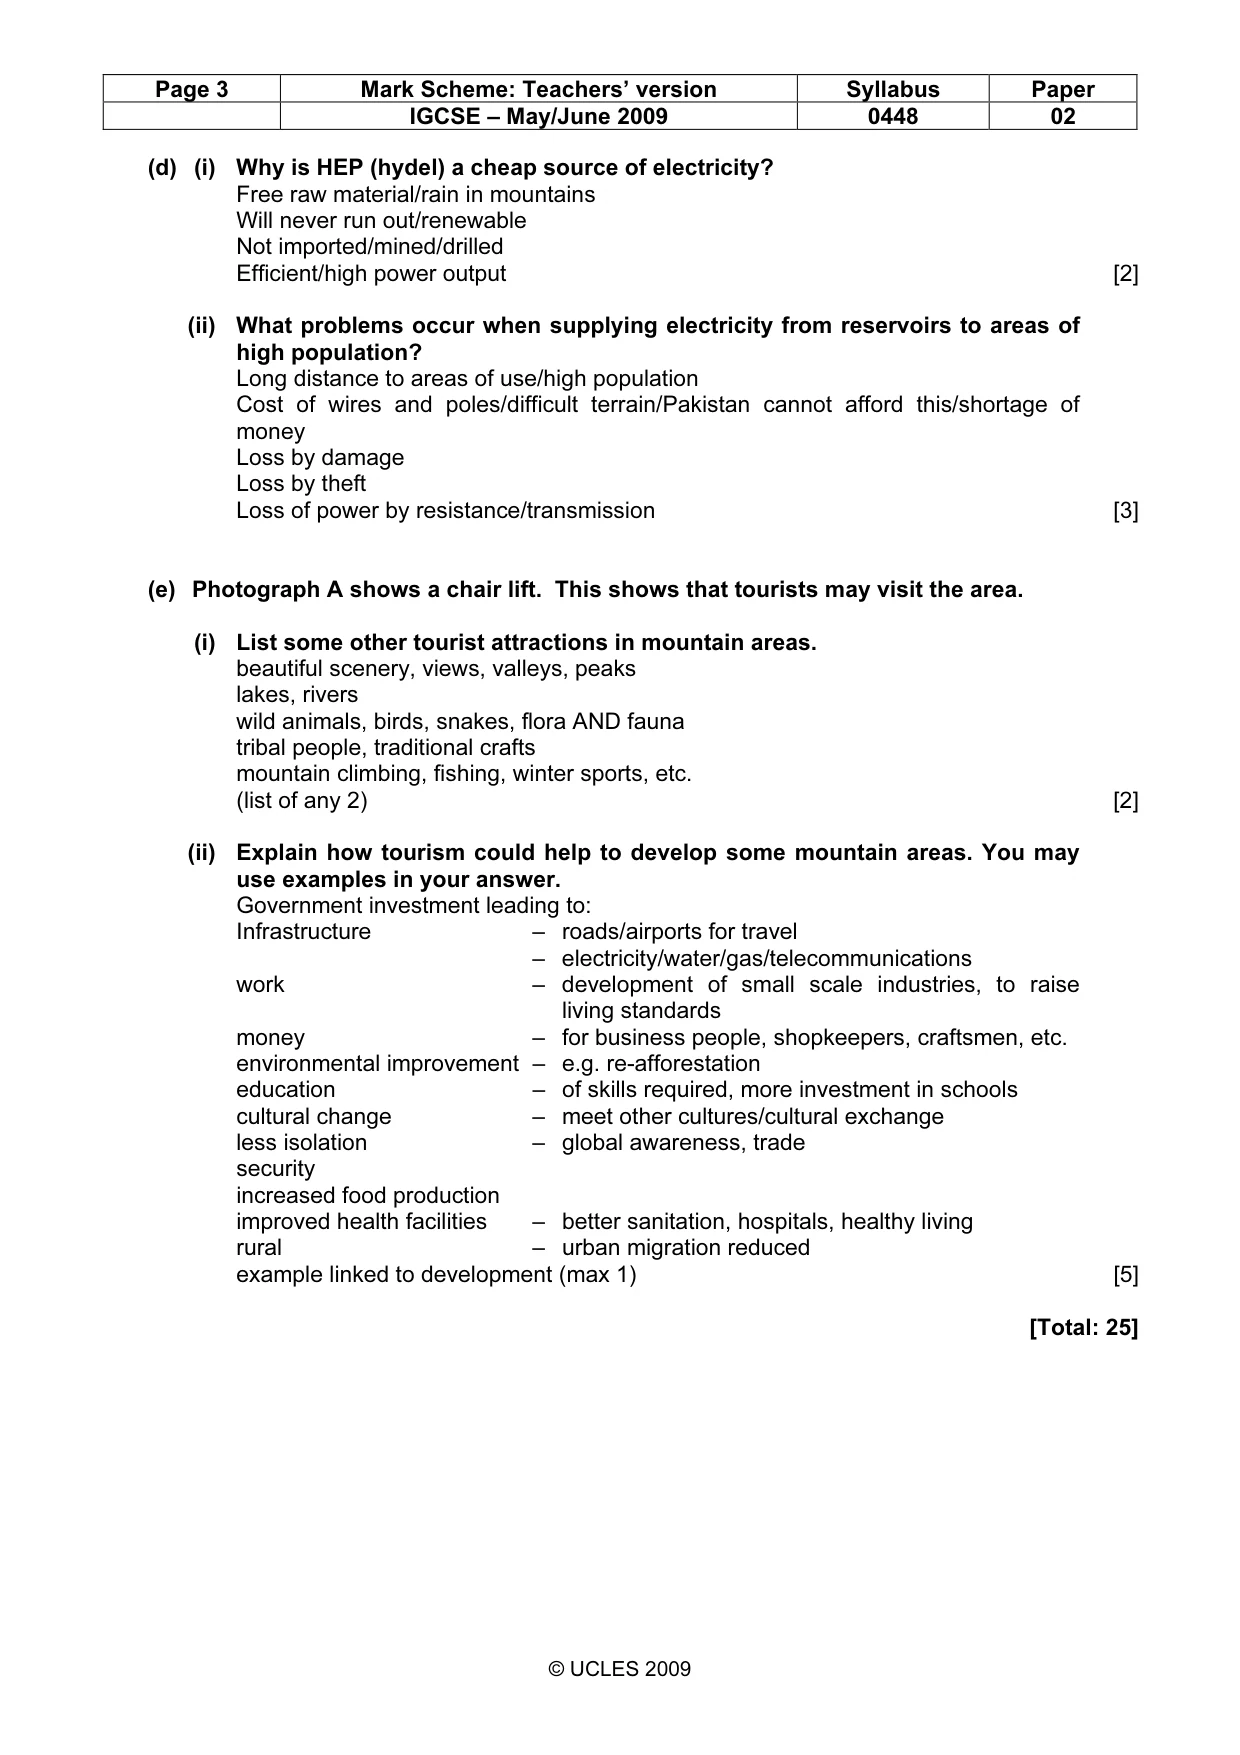
Page 3 Mark Scheme: Teachers’ version Syllabus Paper IGCSE – May/June 2009 0448 02 © UCLES 2009 (d) (i) Why is HEP (hydel) a cheap source of electricity? Free raw material/rain in mountains Will never run out/renewable Not imported/mined/drilled Efficient/high power output [2] (ii) What problems occur when supplying electricity from reservoirs to areas of high population? Long distance to areas of use/high population Cost of wires and poles/difficult terrain/Pakistan cannot afford this/shortage of money Loss by damage Loss by theft Loss of power by resistance/transmission [3] (e) Photograph A shows a chair lift. This shows that tourists may visit the area. (i) List some other tourist attractions in mountain areas. beautiful scenery, views, valleys, peaks lakes, rivers wild animals, birds, snakes, flora AND fauna tribal people, traditional crafts mountain climbing, fishing, winter sports, etc. (list of any 2) [2] (ii) Explain how tourism could help to develop some mountain areas. You may use examples in your answer. Government investment leading to: Infrastructure – roads/airports for travel – electricity/water/gas/telecommunications work – development of small scale industries, to raise living standards money – for business people, shopkeepers, craftsmen, etc. environmental improvement – e.g. re-afforestation education – of skills required, more investment in schools cultural change – meet other cultures/cultural exchange less isolation – global awareness, trade security increased food production improved health facilities – better sanitation, hospitals, healthy living rural – urban migration reduced example linked to development (max 1) [5] [Total: 25]
Mark scheme, page 4
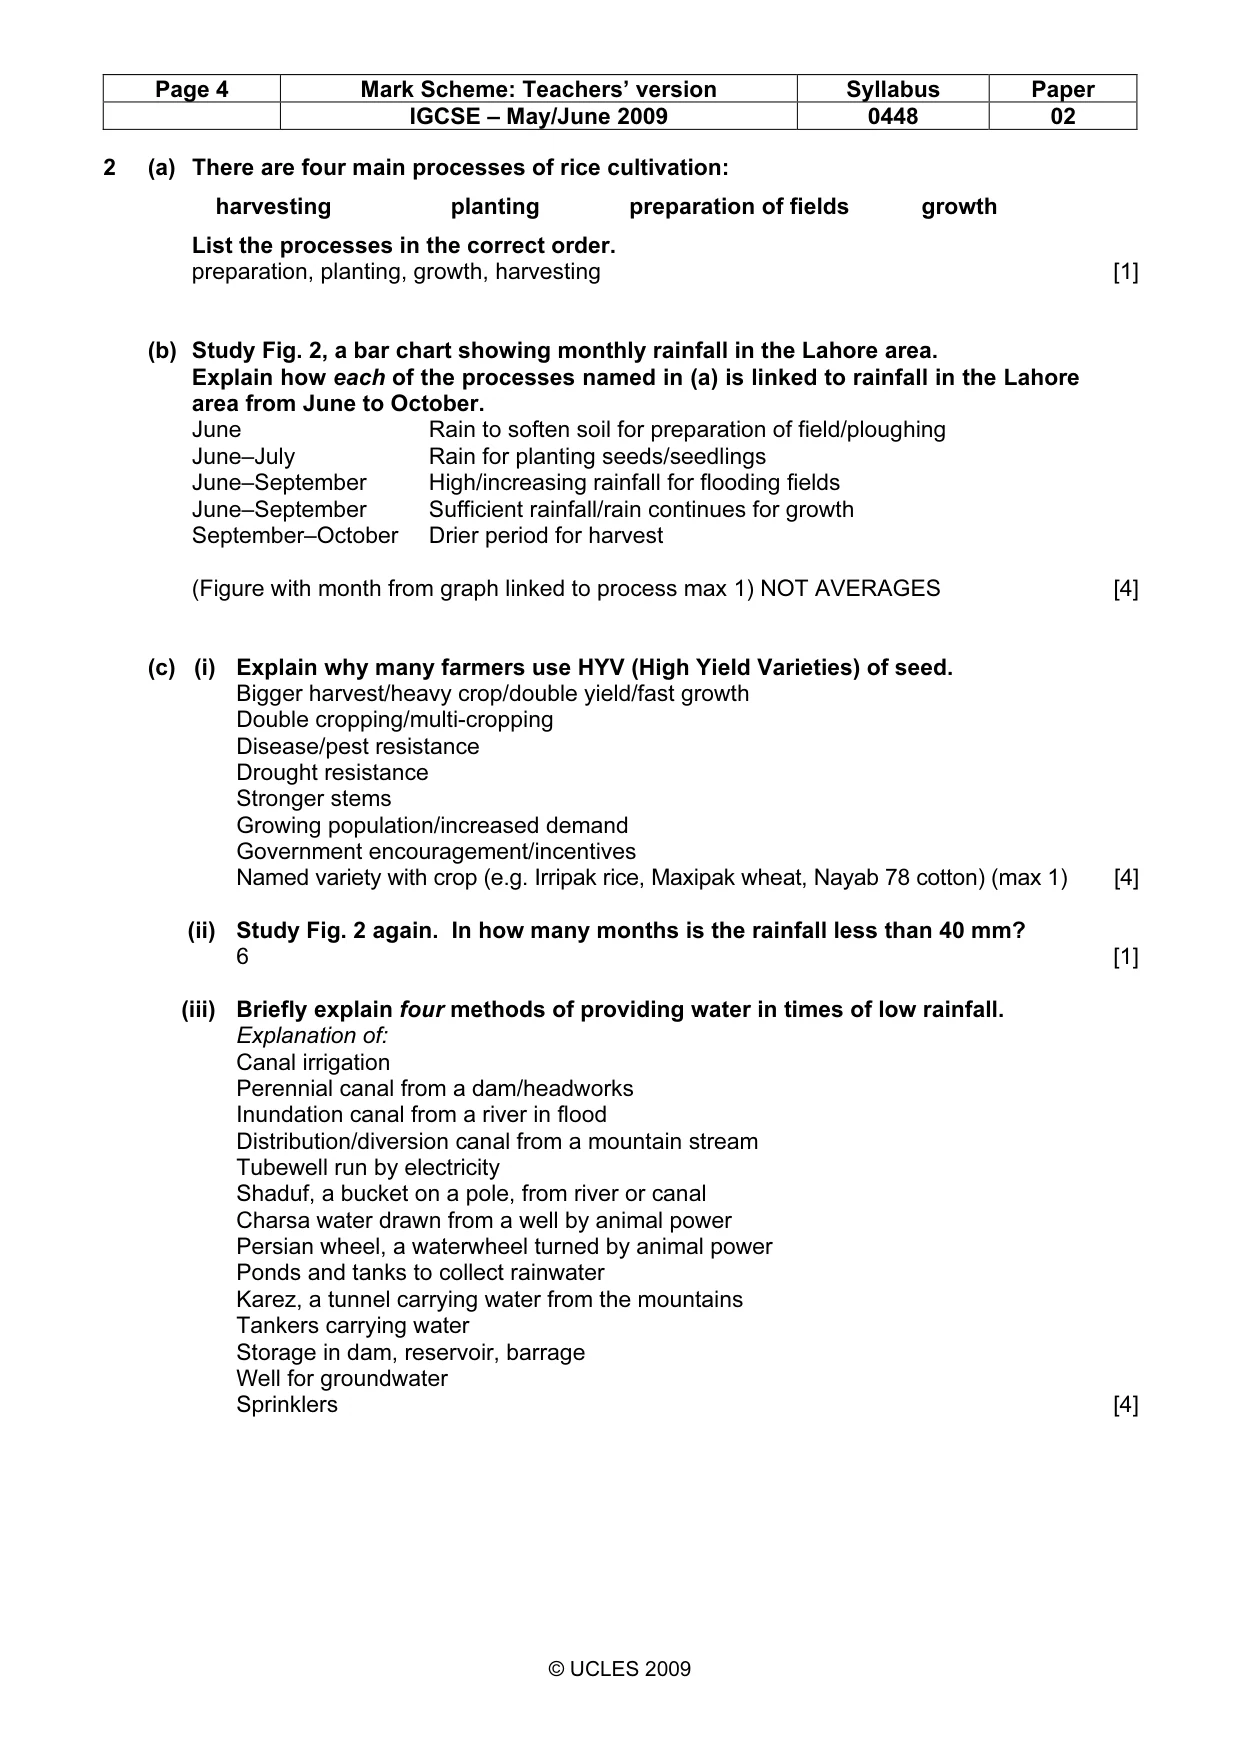
Page 4 Mark Scheme: Teachers’ version Syllabus Paper IGCSE – May/June 2009 0448 02 © UCLES 2009 2 (a) There are four main processes of rice cultivation: harvesting planting preparation of fields growth List the processes in the correct order. preparation, planting, growth, harvesting [1] (b) Study Fig. 2, a bar chart showing monthly rainfall in the Lahore area. Explain how each of the processes named in (a) is linked to rainfall in the Lahore area from June to October. June Rain to soften soil for preparation of field/ploughing June–July Rain for planting seeds/seedlings June–September High/increasing rainfall for flooding fields June–September Sufficient rainfall/rain continues for growth September–October Drier period for harvest (Figure with month from graph linked to process max 1) NOT AVERAGES [4] (c) (i) Explain why many farmers use HYV (High Yield Varieties) of seed. Bigger harvest/heavy crop/double yield/fast growth Double cropping/multi-cropping Disease/pest resistance Drought resistance Stronger stems Growing population/increased demand Government encouragement/incentives Named variety with crop (e.g. Irripak rice, Maxipak wheat, Nayab 78 cotton) (max 1) [4] (ii) Study Fig. 2 again. In how many months is the rainfall less than 40 mm? 6 [1] (iii) Briefly explain four methods of providing water in times of low rainfall. Explanation of: Canal irrigation Perennial canal from a dam/headworks Inundation canal from a river in flood Distribution/diversion canal from a mountain stream Tubewell run by electricity Shaduf, a bucket on a pole, from river or canal Charsa water drawn from a well by animal power Persian wheel, a waterwheel turned by animal power Ponds and tanks to collect rainwater Karez, a tunnel carrying water from the mountains Tankers carrying water Storage in dam, reservoir, barrage Well for groundwater Sprinklers [4]
Mark scheme, page 5
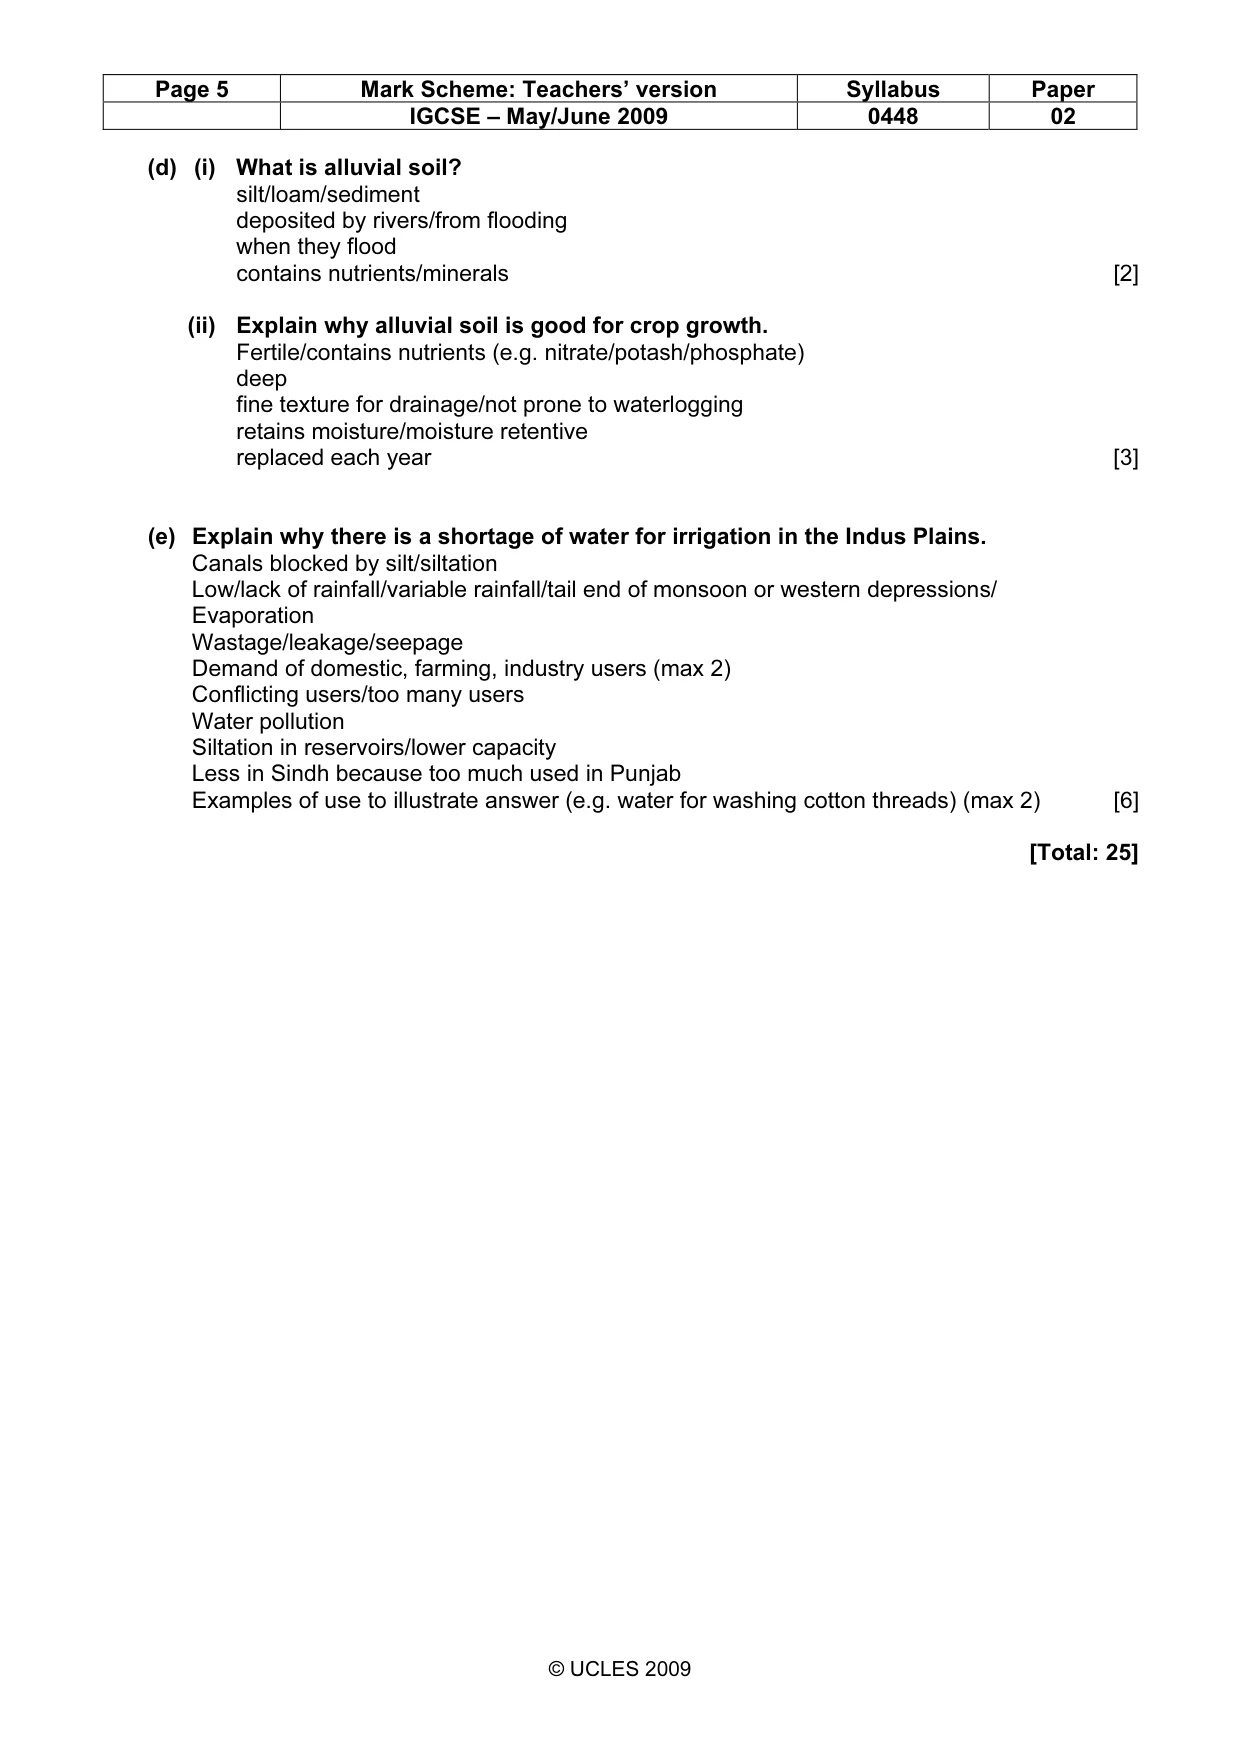
Page 5 Mark Scheme: Teachers’ version Syllabus Paper IGCSE – May/June 2009 0448 02 © UCLES 2009 (d) (i) What is alluvial soil? silt/loam/sediment deposited by rivers/from flooding when they flood contains nutrients/minerals [2] (ii) Explain why alluvial soil is good for crop growth. Fertile/contains nutrients (e.g. nitrate/potash/phosphate) deep fine texture for drainage/not prone to waterlogging retains moisture/moisture retentive replaced each year [3] (e) Explain why there is a shortage of water for irrigation in the Indus Plains. Canals blocked by silt/siltation Low/lack of rainfall/variable rainfall/tail end of monsoon or western depressions/ Evaporation Wastage/leakage/seepage Demand of domestic, farming, industry users (max 2) Conflicting users/too many users Water pollution Siltation in reservoirs/lower capacity Less in Sindh because too much used in Punjab Examples of use to illustrate answer (e.g. water for washing cotton threads) (max 2) [6] [Total: 25]
Mark scheme, page 6
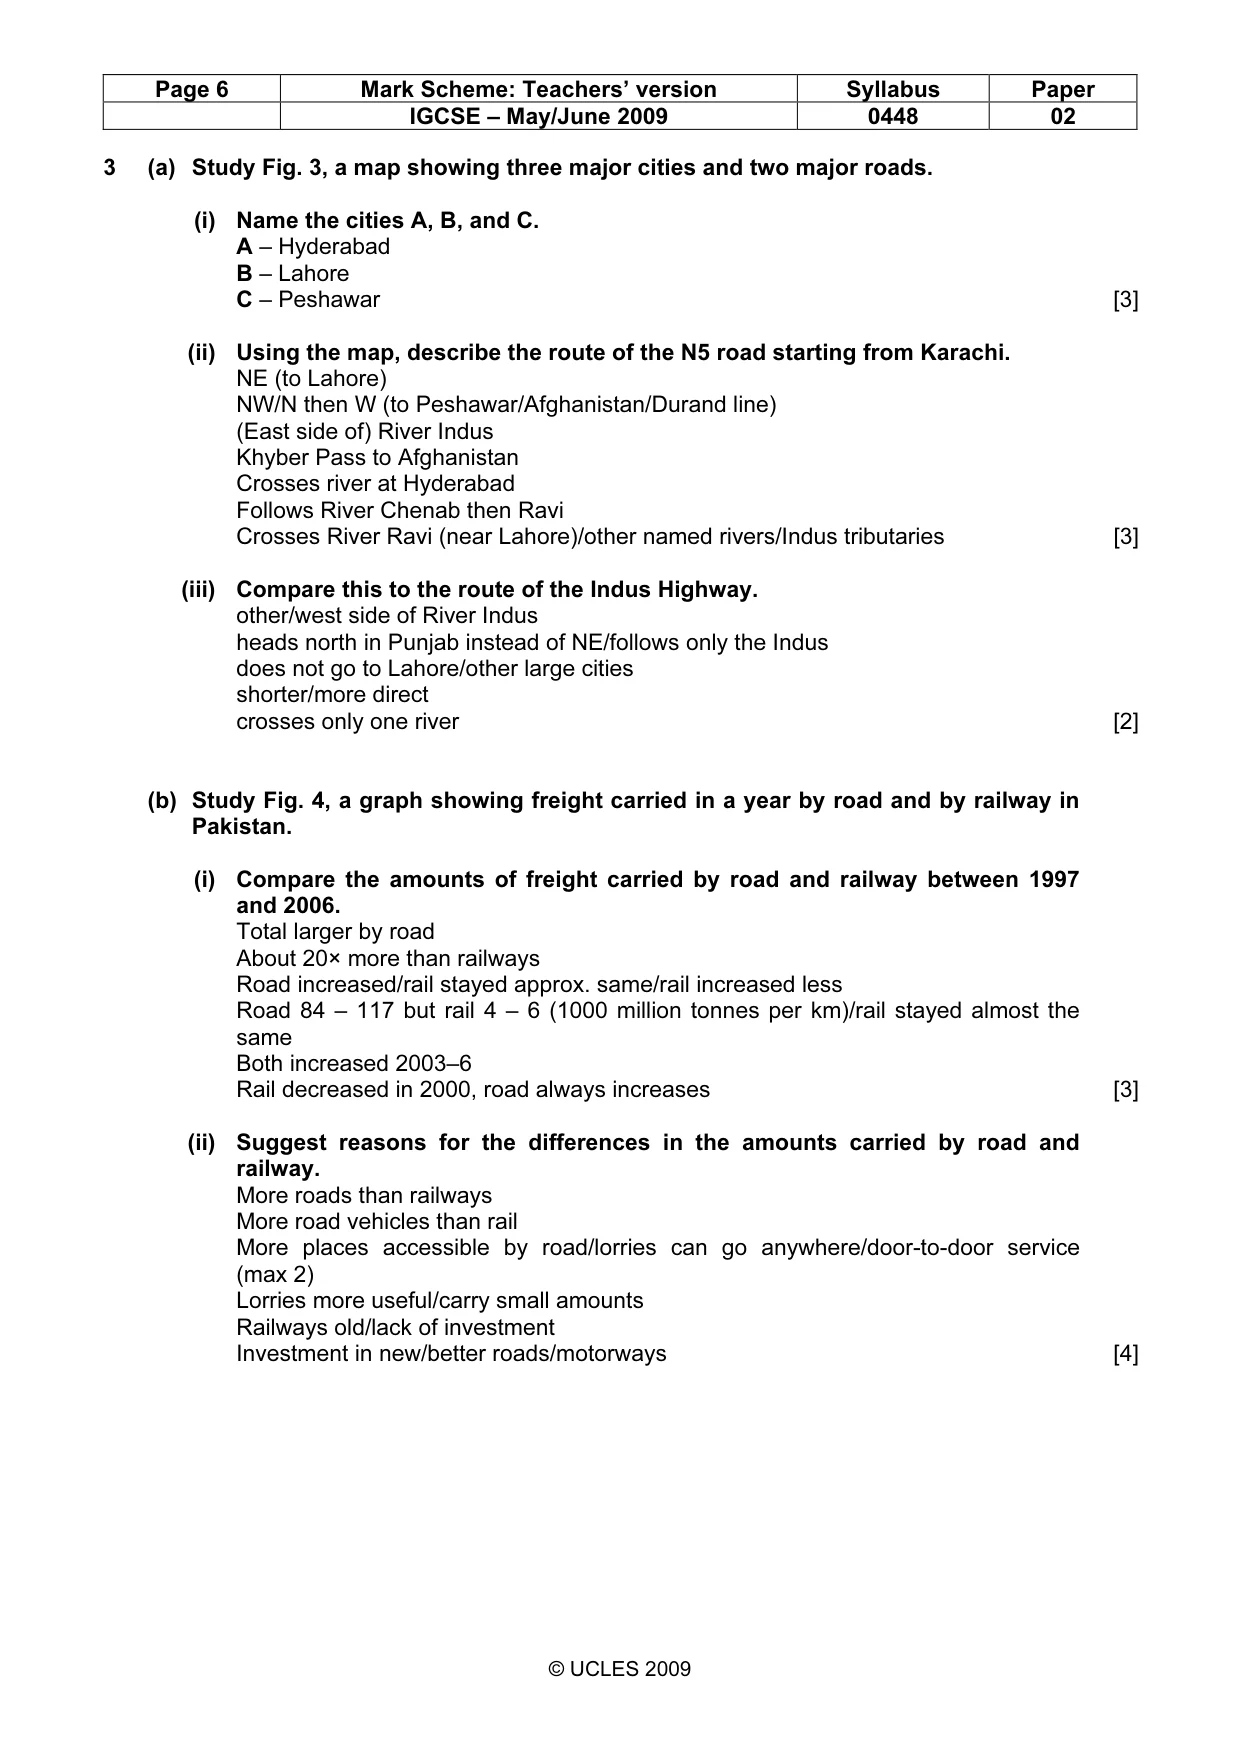
Page 6 Mark Scheme: Teachers’ version Syllabus Paper IGCSE – May/June 2009 0448 02 © UCLES 2009 3 (a) Study Fig. 3, a map showing three major cities and two major roads. (i) Name the cities A, B, and C. A – Hyderabad B – Lahore C – Peshawar [3] (ii) Using the map, describe the route of the N5 road starting from Karachi. NE (to Lahore) NW/N then W (to Peshawar/Afghanistan/Durand line) (East side of) River Indus Khyber Pass to Afghanistan Crosses river at Hyderabad Follows River Chenab then Ravi Crosses River Ravi (near Lahore)/other named rivers/Indus tributaries [3] (iii) Compare this to the route of the Indus Highway. other/west side of River Indus heads north in Punjab instead of NE/follows only the Indus does not go to Lahore/other large cities shorter/more direct crosses only one river [2] (b) Study Fig. 4, a graph showing freight carried in a year by road and by railway in Pakistan. (i) Compare the amounts of freight carried by road and railway between 1997 and 2006. Total larger by road About 20× more than railways Road increased/rail stayed approx. same/rail increased less Road 84 – 117 but rail 4 – 6 (1000 million tonnes per km)/rail stayed almost the same Both increased 2003–6 Rail decreased in 2000, road always increases [3] (ii) Suggest reasons for the differences in the amounts carried by road and railway. More roads than railways More road vehicles than rail More places accessible by road/lorries can go anywhere/door-to-door service (max 2) Lorries more useful/carry small amounts Railways old/lack of investment Investment in new/better roads/motorways [4]
Mark scheme, page 7
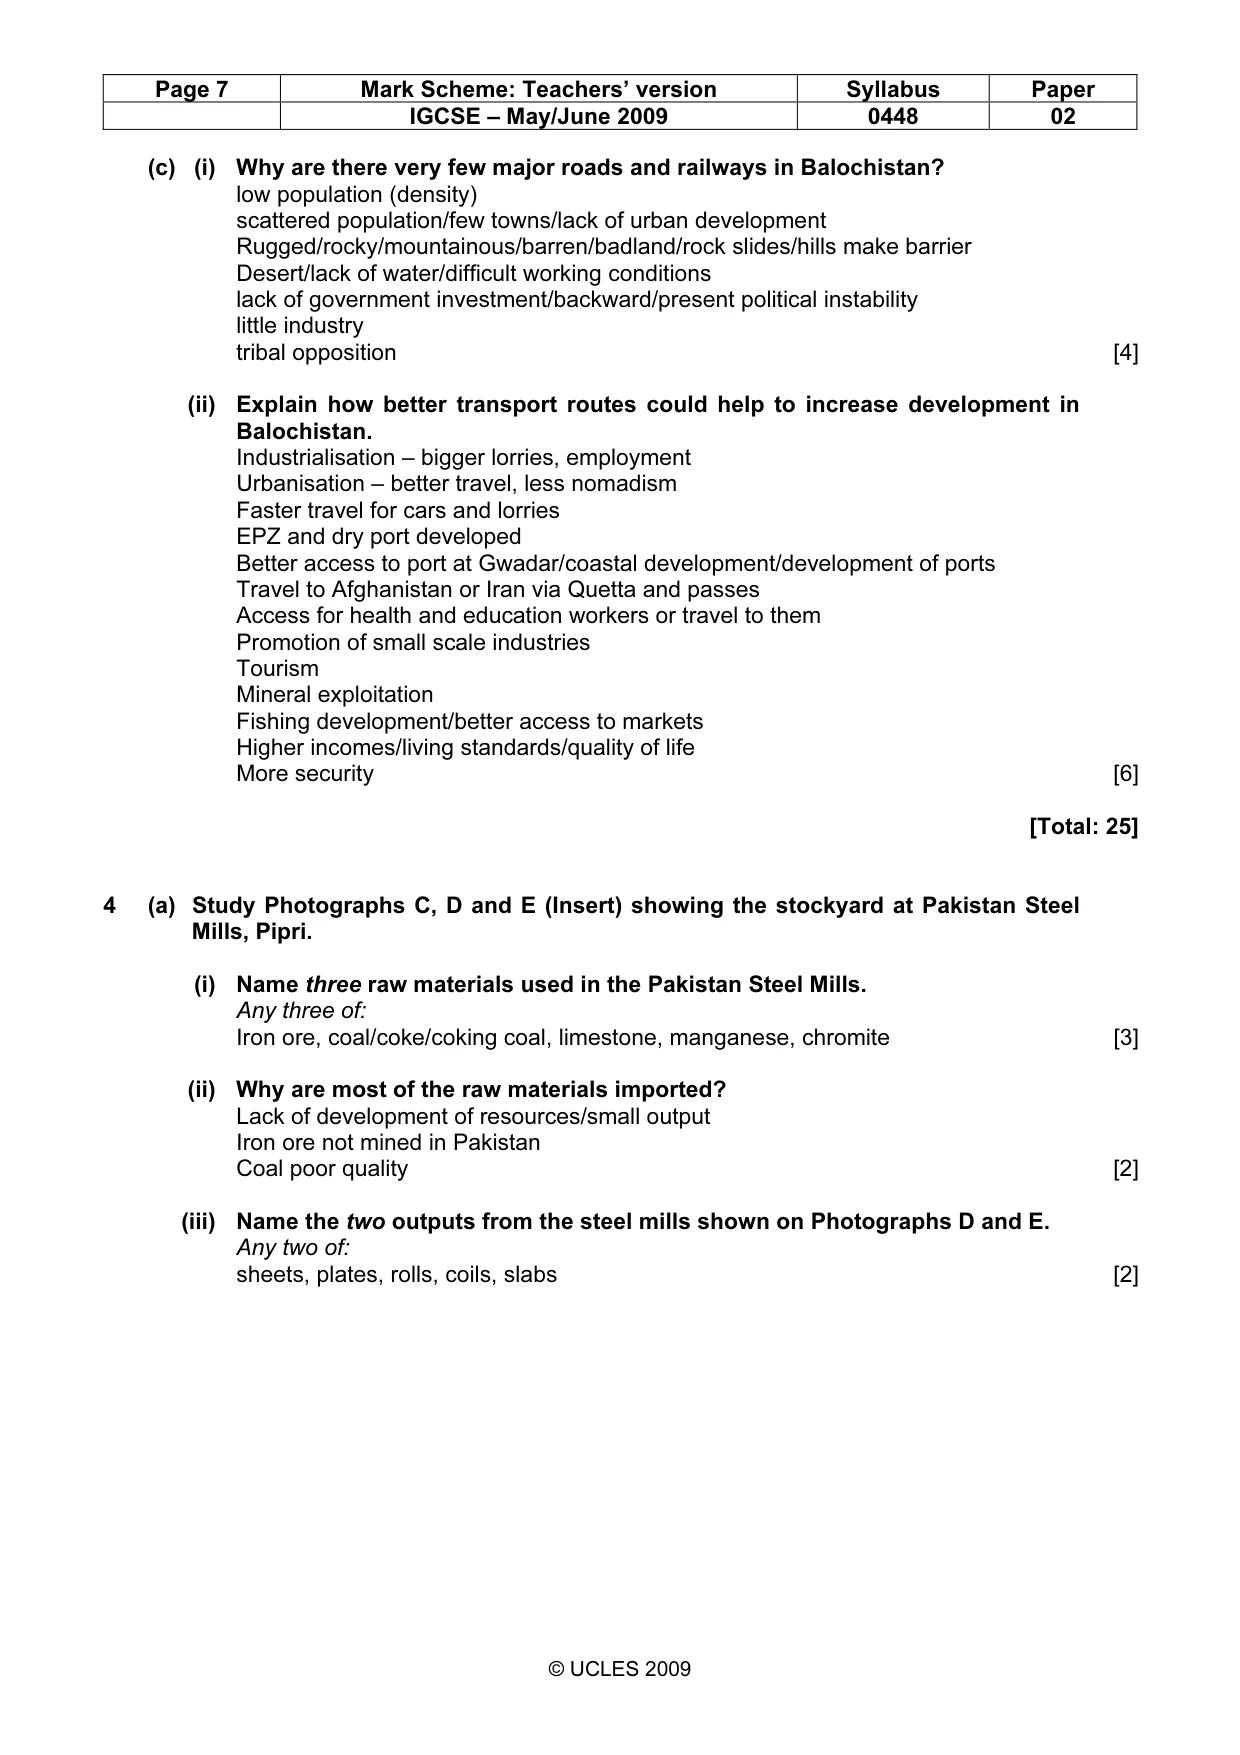
Page 7 Mark Scheme: Teachers’ version Syllabus Paper IGCSE – May/June 2009 0448 02 © UCLES 2009 (c) (i) Why are there very few major roads and railways in Balochistan? low population (density) scattered population/few towns/lack of urban development Rugged/rocky/mountainous/barren/badland/rock slides/hills make barrier Desert/lack of water/difficult working conditions lack of government investment/backward/present political instability little industry tribal opposition [4] (ii) Explain how better transport routes could help to increase development in Balochistan. Industrialisation – bigger lorries, employment Urbanisation – better travel, less nomadism Faster travel for cars and lorries EPZ and dry port developed Better access to port at Gwadar/coastal development/development of ports Travel to Afghanistan or Iran via Quetta and passes Access for health and education workers or travel to them Promotion of small scale industries Tourism Mineral exploitation Fishing development/better access to markets Higher incomes/living standards/quality of life More security [6] [Total: 25] 4 (a) Study Photographs C, D and E (Insert) showing the stockyard at Pakistan Steel Mills, Pipri. (i) Name three raw materials used in the Pakistan Steel Mills. Any three of: Iron ore, coal/coke/coking coal, limestone, manganese, chromite [3] (ii) Why are most of the raw materials imported? Lack of development of resources/small output Iron ore not mined in Pakistan Coal poor quality [2] (iii) Name the two outputs from the steel mills shown on Photographs D and E. Any two of: sheets, plates, rolls, coils, slabs [2]
Mark scheme, page 8
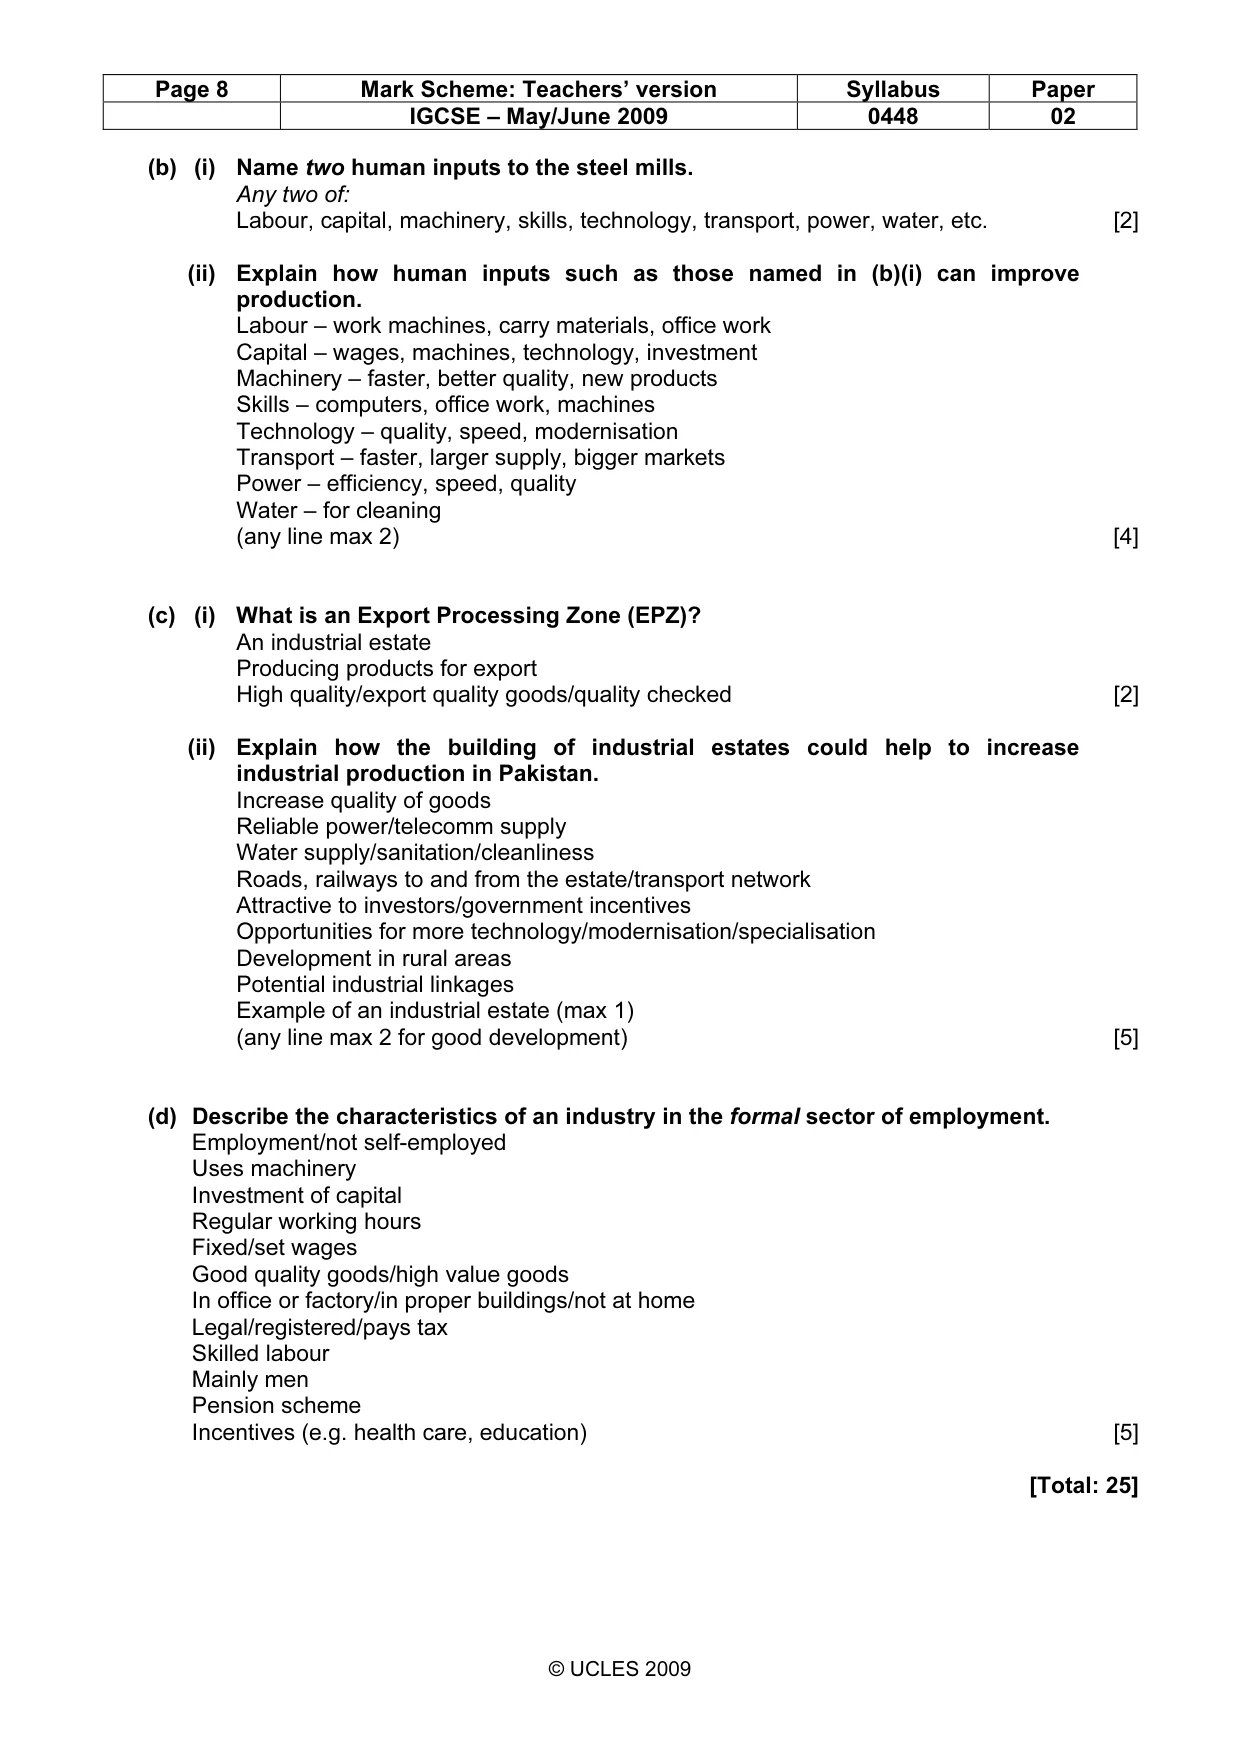
Page 8 Mark Scheme: Teachers’ version Syllabus Paper IGCSE – May/June 2009 0448 02 © UCLES 2009 (b) (i) Name two human inputs to the steel mills. Any two of: Labour, capital, machinery, skills, technology, transport, power, water, etc. [2] (ii) Explain how human inputs such as those named in (b)(i) can improve production. Labour – work machines, carry materials, office work Capital – wages, machines, technology, investment Machinery – faster, better quality, new products Skills – computers, office work, machines Technology – quality, speed, modernisation Transport – faster, larger supply, bigger markets Power – efficiency, speed, quality Water – for cleaning (any line max 2) [4] (c) (i) What is an Export Processing Zone (EPZ)? An industrial estate Producing products for export High quality/export quality goods/quality checked [2] (ii) Explain how the building of industrial estates could help to increase industrial production in Pakistan. Increase quality of goods Reliable power/telecomm supply Water supply/sanitation/cleanliness Roads, railways to and from the estate/transport network Attractive to investors/government incentives Opportunities for more technology/modernisation/specialisation Development in rural areas Potential industrial linkages Example of an industrial estate (max 1) (any line max 2 for good development) [5] (d) Describe the characteristics of an industry in the formal sector of employment. Employment/not self-employed Uses machinery Investment of capital Regular working hours Fixed/set wages Good quality goods/high value goods In office or factory/in proper buildings/not at home Legal/registered/pays tax Skilled labour Mainly men Pension scheme Incentives (e.g. health care, education) [5] [Total: 25]
Mark scheme, page 9
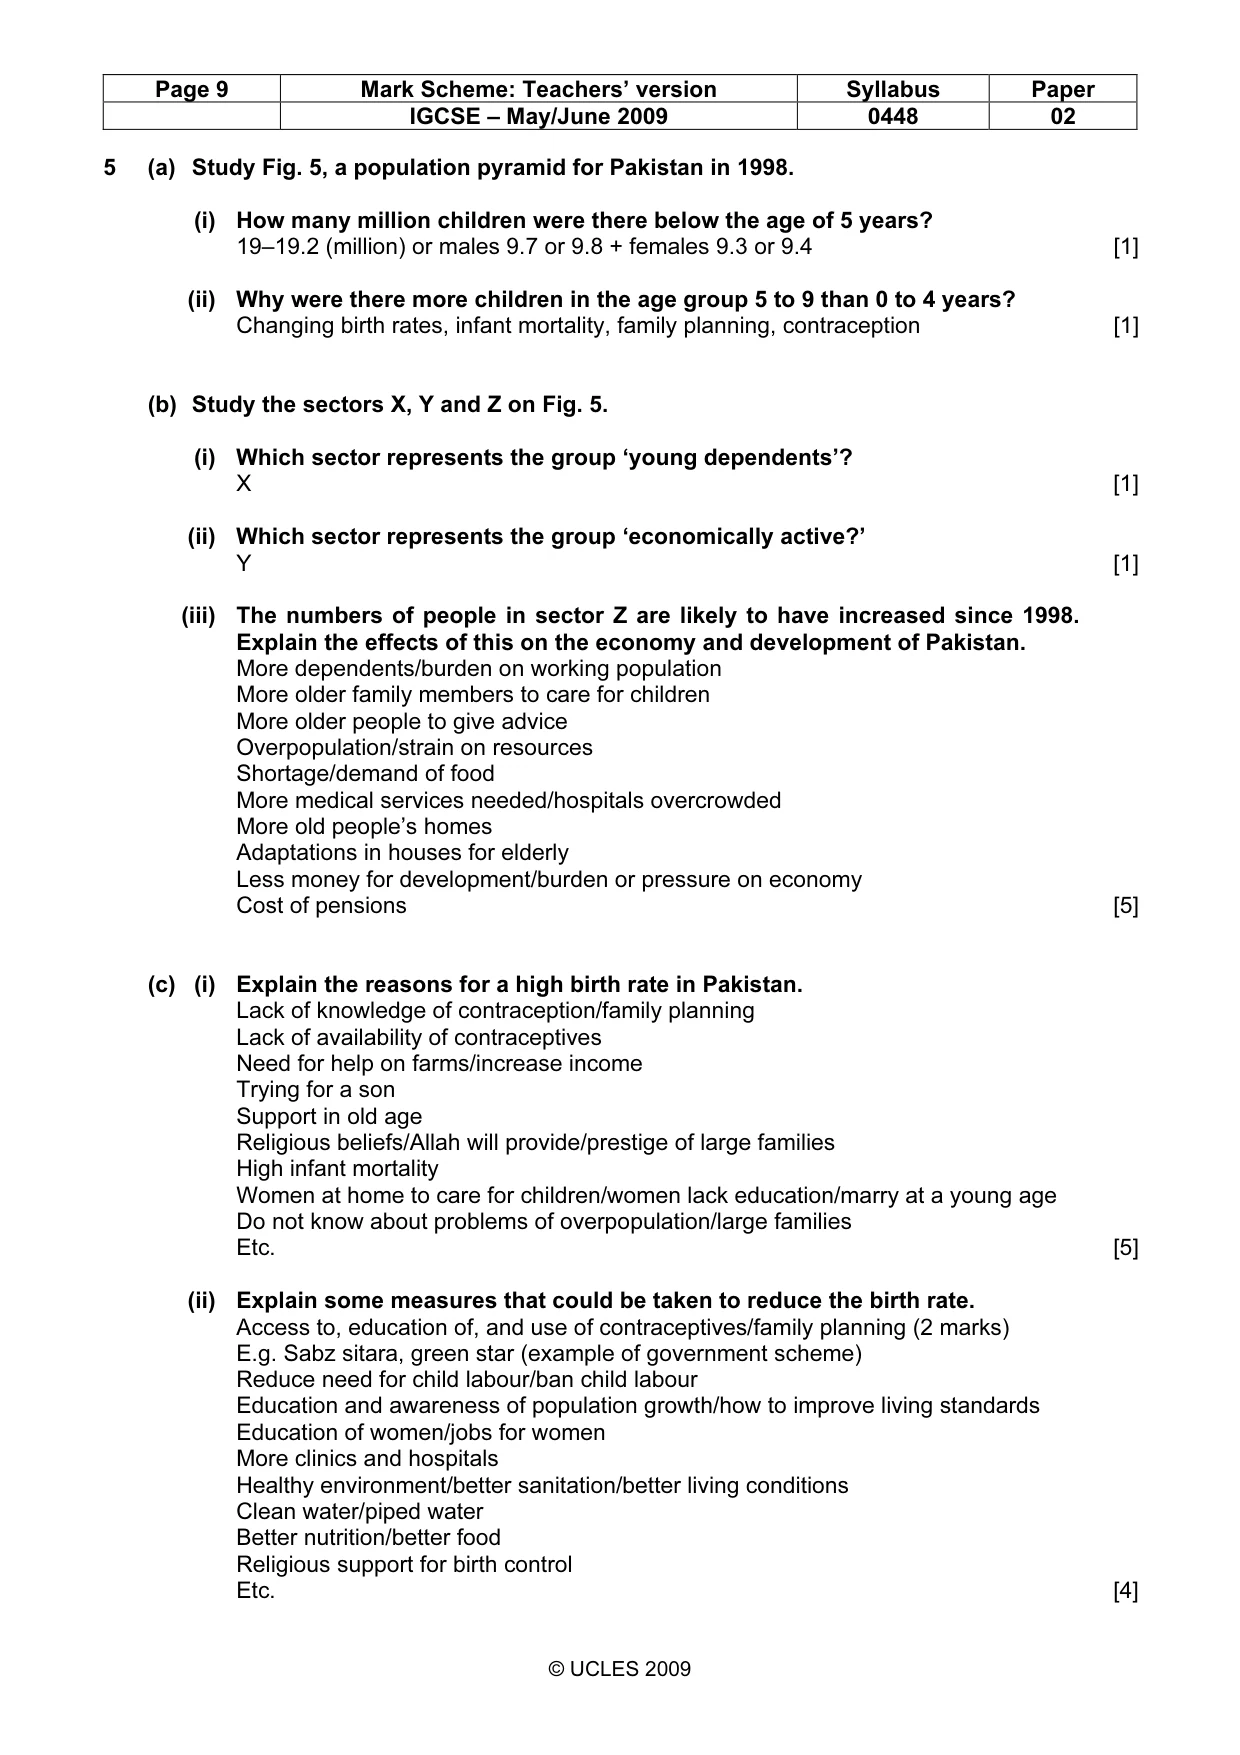
Page 9 Mark Scheme: Teachers’ version Syllabus Paper IGCSE – May/June 2009 0448 02 © UCLES 2009 5 (a) Study Fig. 5, a population pyramid for Pakistan in 1998. (i) How many million children were there below the age of 5 years? 19–19.2 (million) or males 9.7 or 9.8 + females 9.3 or 9.4 [1] (ii) Why were there more children in the age group 5 to 9 than 0 to 4 years? Changing birth rates, infant mortality, family planning, contraception [1] (b) Study the sectors X, Y and Z on Fig. 5. (i) Which sector represents the group ‘young dependents’? X [1] (ii) Which sector represents the group ‘economically active?’ Y [1] (iii) The numbers of people in sector Z are likely to have increased since 1998. Explain the effects of this on the economy and development of Pakistan. More dependents/burden on working population More older family members to care for children More older people to give advice Overpopulation/strain on resources Shortage/demand of food More medical services needed/hospitals overcrowded More old people’s homes Adaptations in houses for elderly Less money for development/burden or pressure on economy Cost of pensions [5] (c) (i) Explain the reasons for a high birth rate in Pakistan. Lack of knowledge of contraception/family planning Lack of availability of contraceptives Need for help on farms/increase income Trying for a son Support in old age Religious beliefs/Allah will provide/prestige of large families High infant mortality Women at home to care for children/women lack education/marry at a young age Do not know about problems of overpopulation/large families Etc. [5] (ii) Explain some measures that could be taken to reduce the birth rate. Access to, education of, and use of contraceptives/family planning (2 marks) E.g. Sabz sitara, green star (example of government scheme) Reduce need for child labour/ban child labour Education and awareness of population growth/how to improve living standards Education of women/jobs for women More clinics and hospitals Healthy environment/better sanitation/better living conditions Clean water/piped water Better nutrition/better food Religious support for birth control Etc. [4]
Mark scheme, page 10
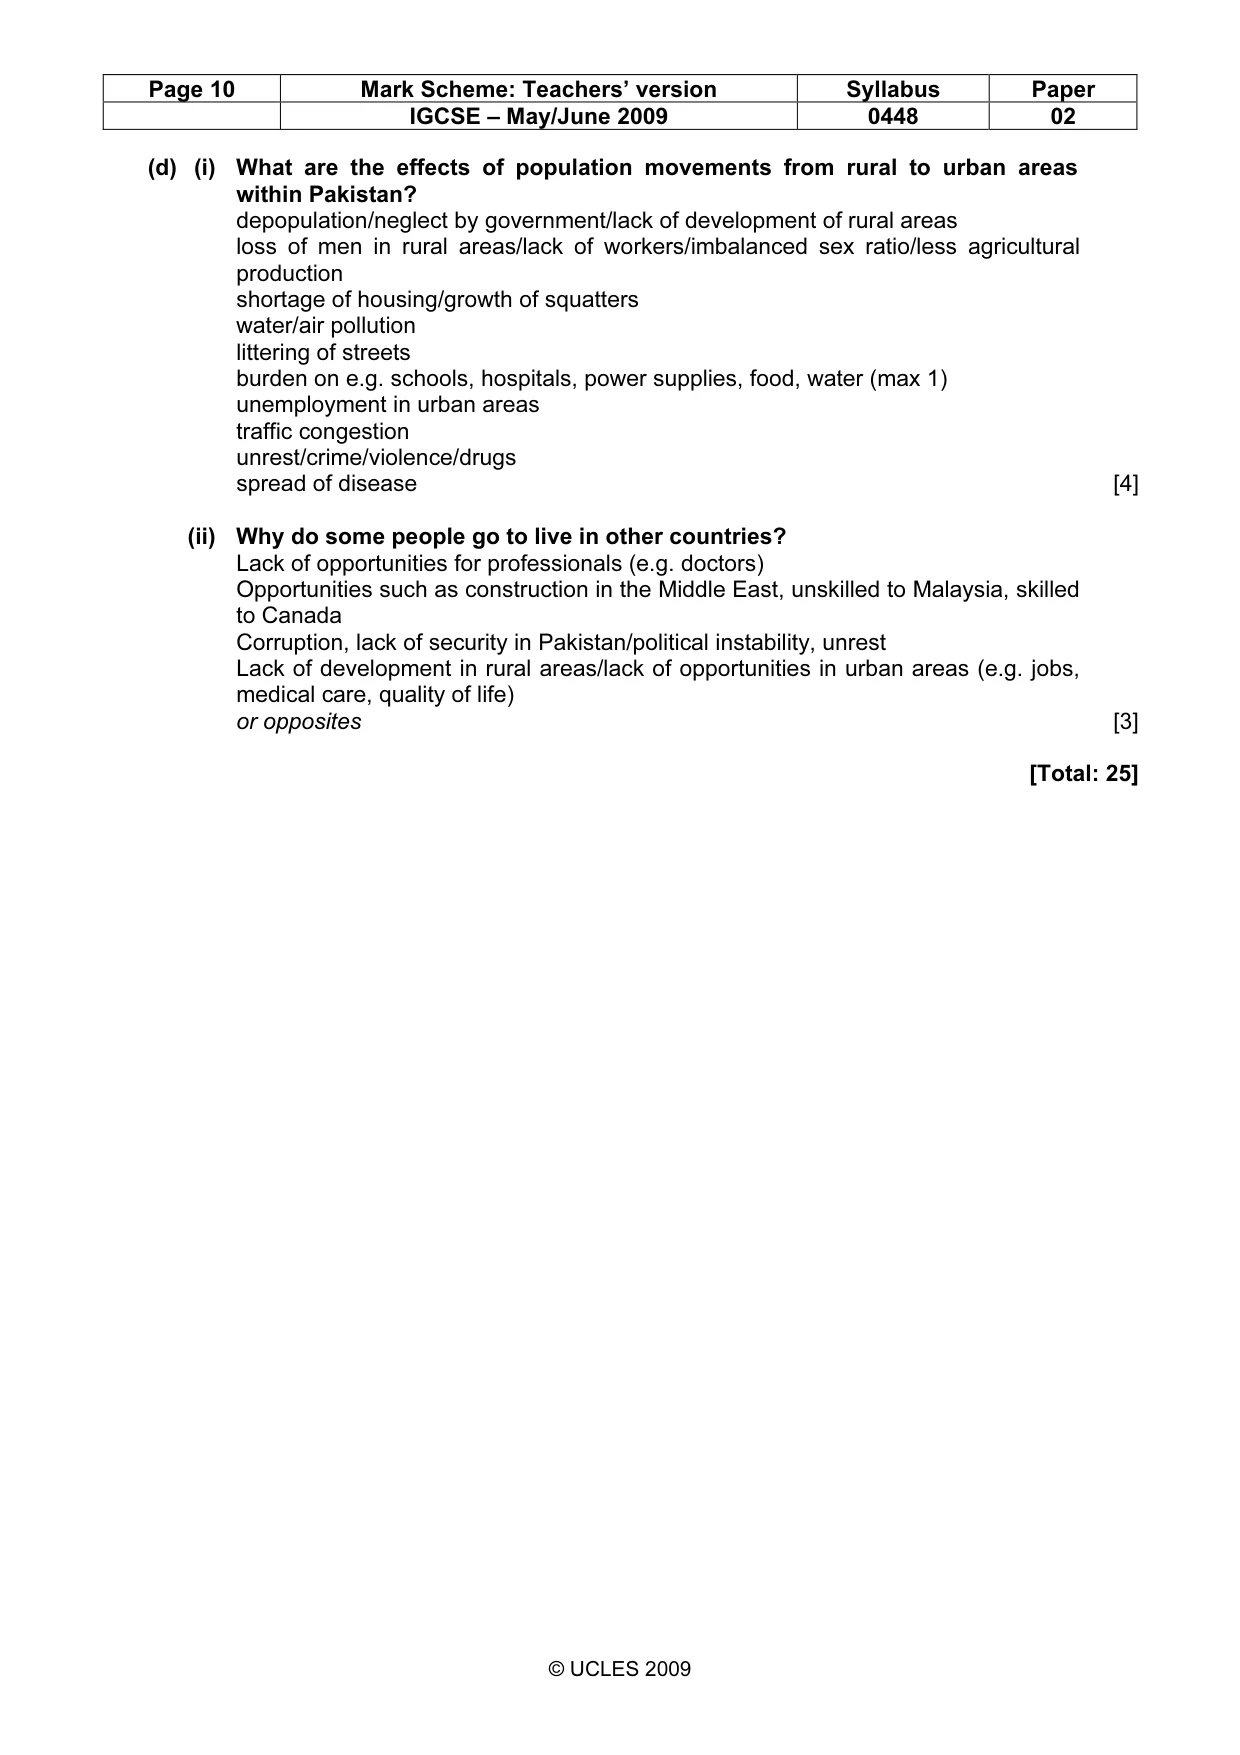
Page 10 Mark Scheme: Teachers’ version Syllabus Paper IGCSE – May/June 2009 0448 02 © UCLES 2009 (d) (i) What are the effects of population movements from rural to urban areas within Pakistan? depopulation/neglect by government/lack of development of rural areas loss of men in rural areas/lack of workers/imbalanced sex ratio/less agricultural production shortage of housing/growth of squatters water/air pollution littering of streets burden on e.g. schools, hospitals, power supplies, food, water (max 1) unemployment in urban areas traffic congestion unrest/crime/violence/drugs spread of disease [4] (ii) Why do some people go to live in other countries? Lack of opportunities for professionals (e.g. doctors) Opportunities such as construction in the Middle East, unskilled to Malaysia, skilled to Canada Corruption, lack of security in Pakistan/political instability, unrest Lack of development in rural areas/lack of opportunities in urban areas (e.g. jobs, medical care, quality of life) or opposites [3] [Total: 25]
What you needed in this session
Cambridge’s own grade thresholds for 2009 May/June, Paper 2 · Variant 1. A higher threshold means an easier paper — the bar moves with how the cohort did.