Cambridge IGCSE Geography 0460 — 2022 Feb/March Paper 4 · Variant 2
0460/42/F/M/22 · 2 questions · 60 marks · ≈68 min
The question paper and its mark scheme, free to read here and free to download. This is Cambridge’s own paper, exactly as it was sat.
Question paper16 pages




Mark scheme9 pages
Answers below. Sit the paper first if you are practising.

Questions as text
Q1 · Students did fieldwork to investigate tourism in Salina National Park in Malta
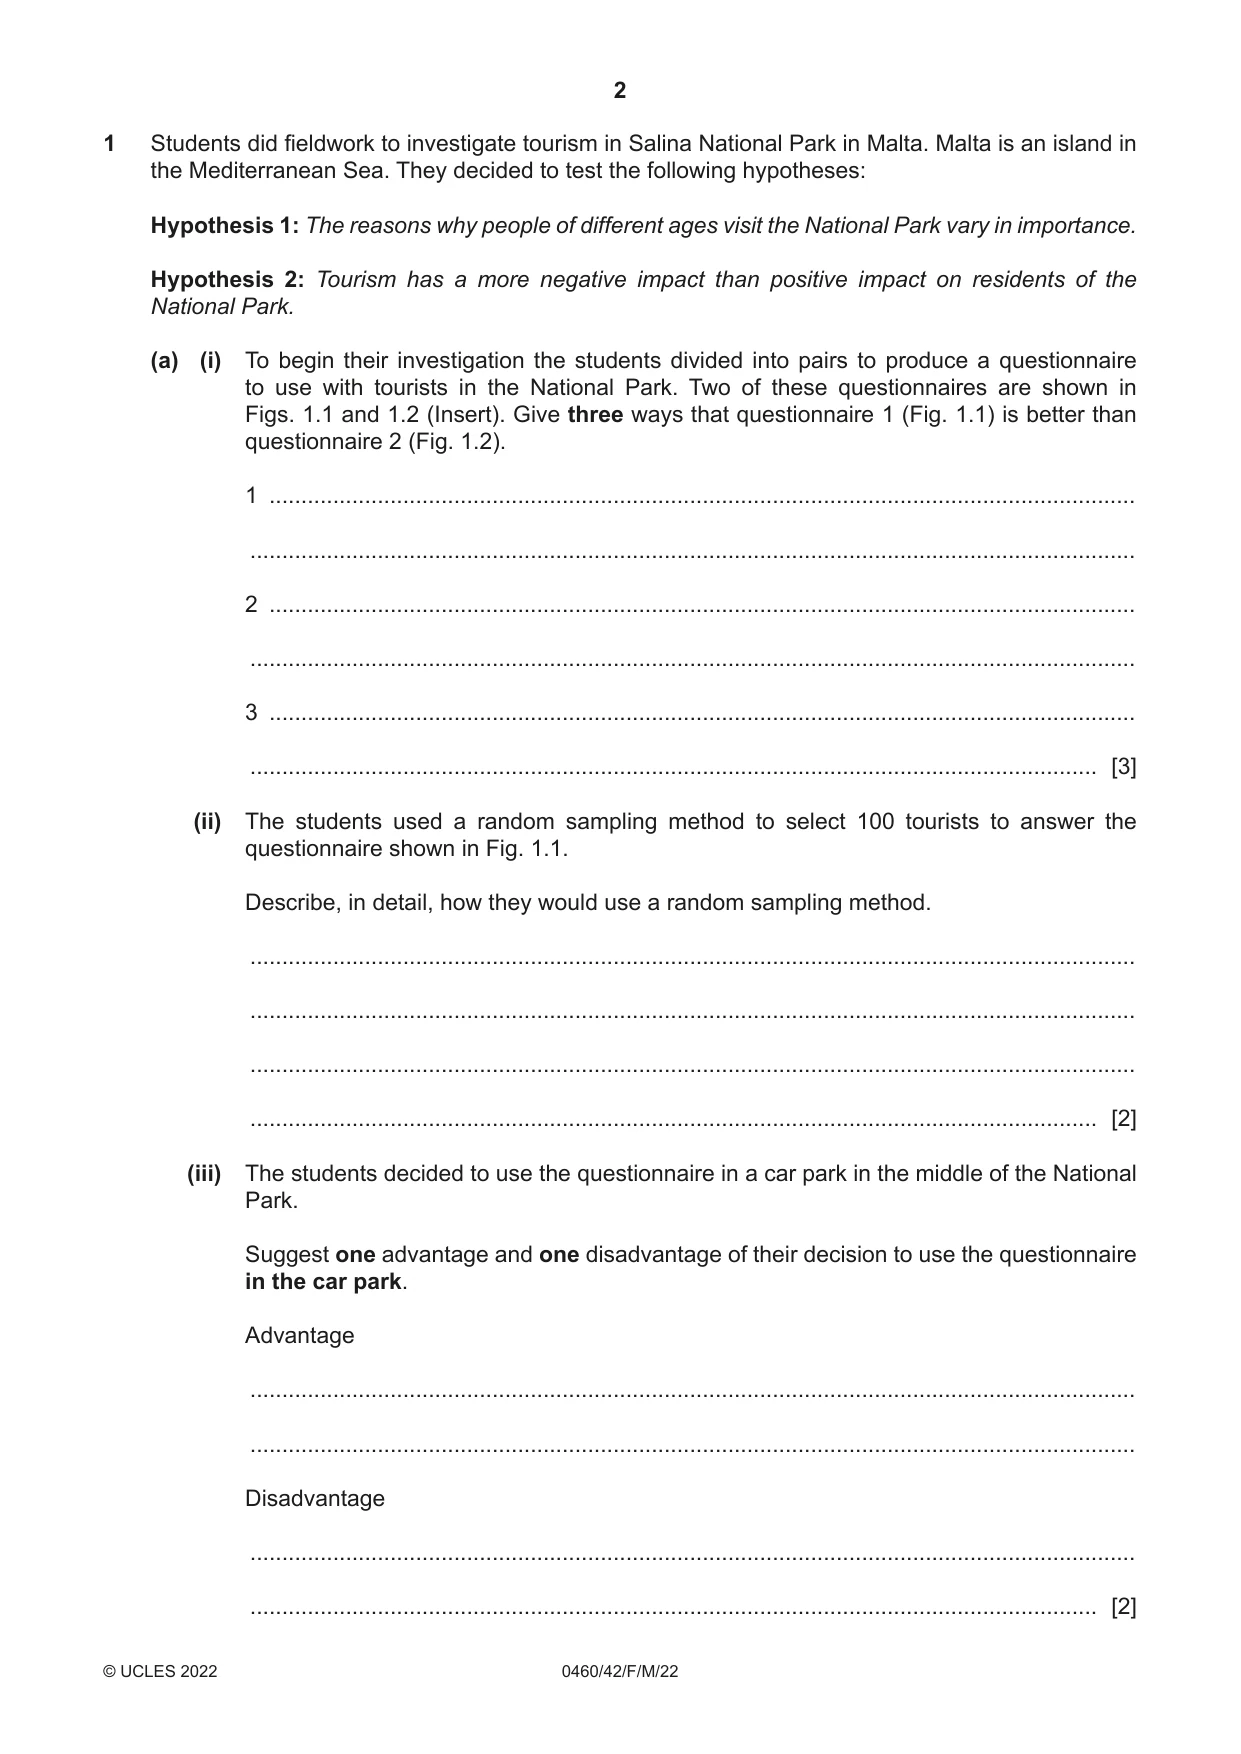
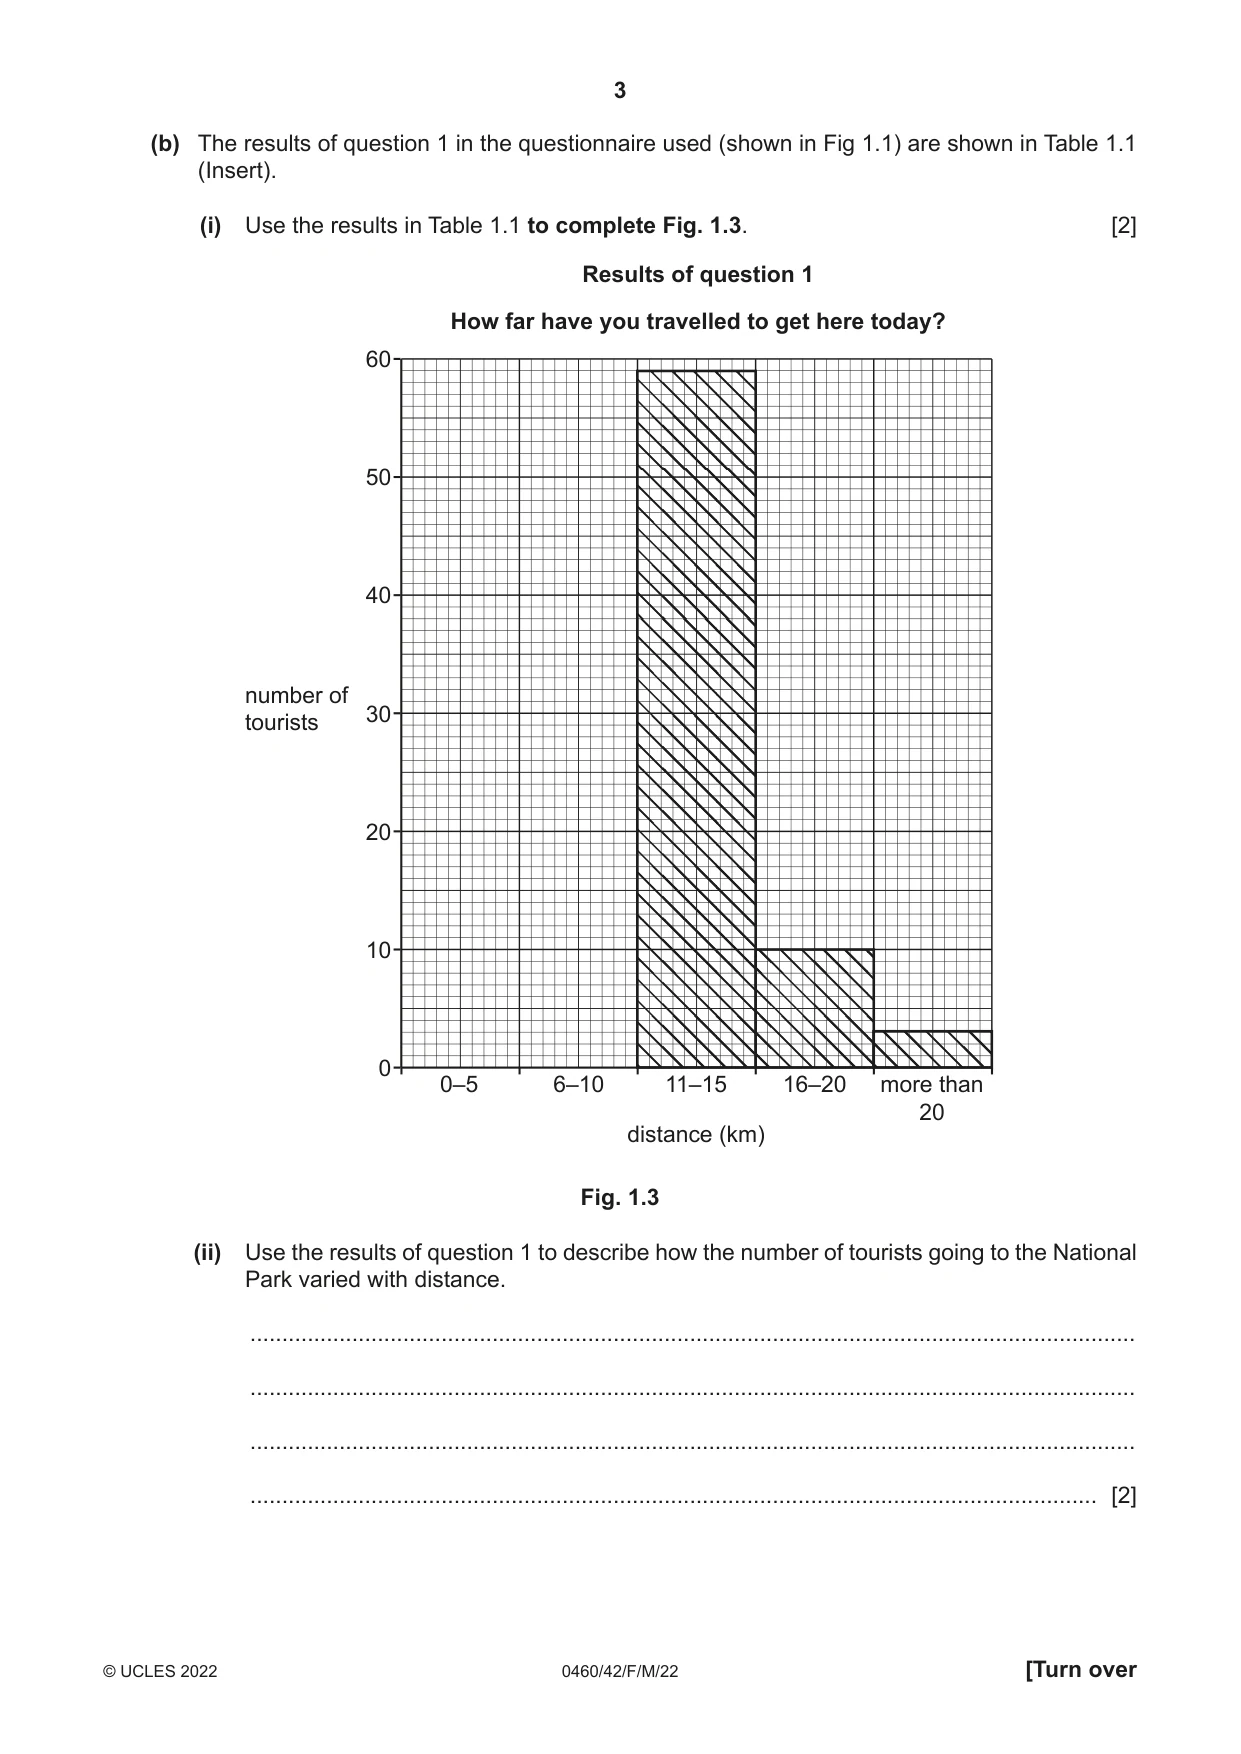
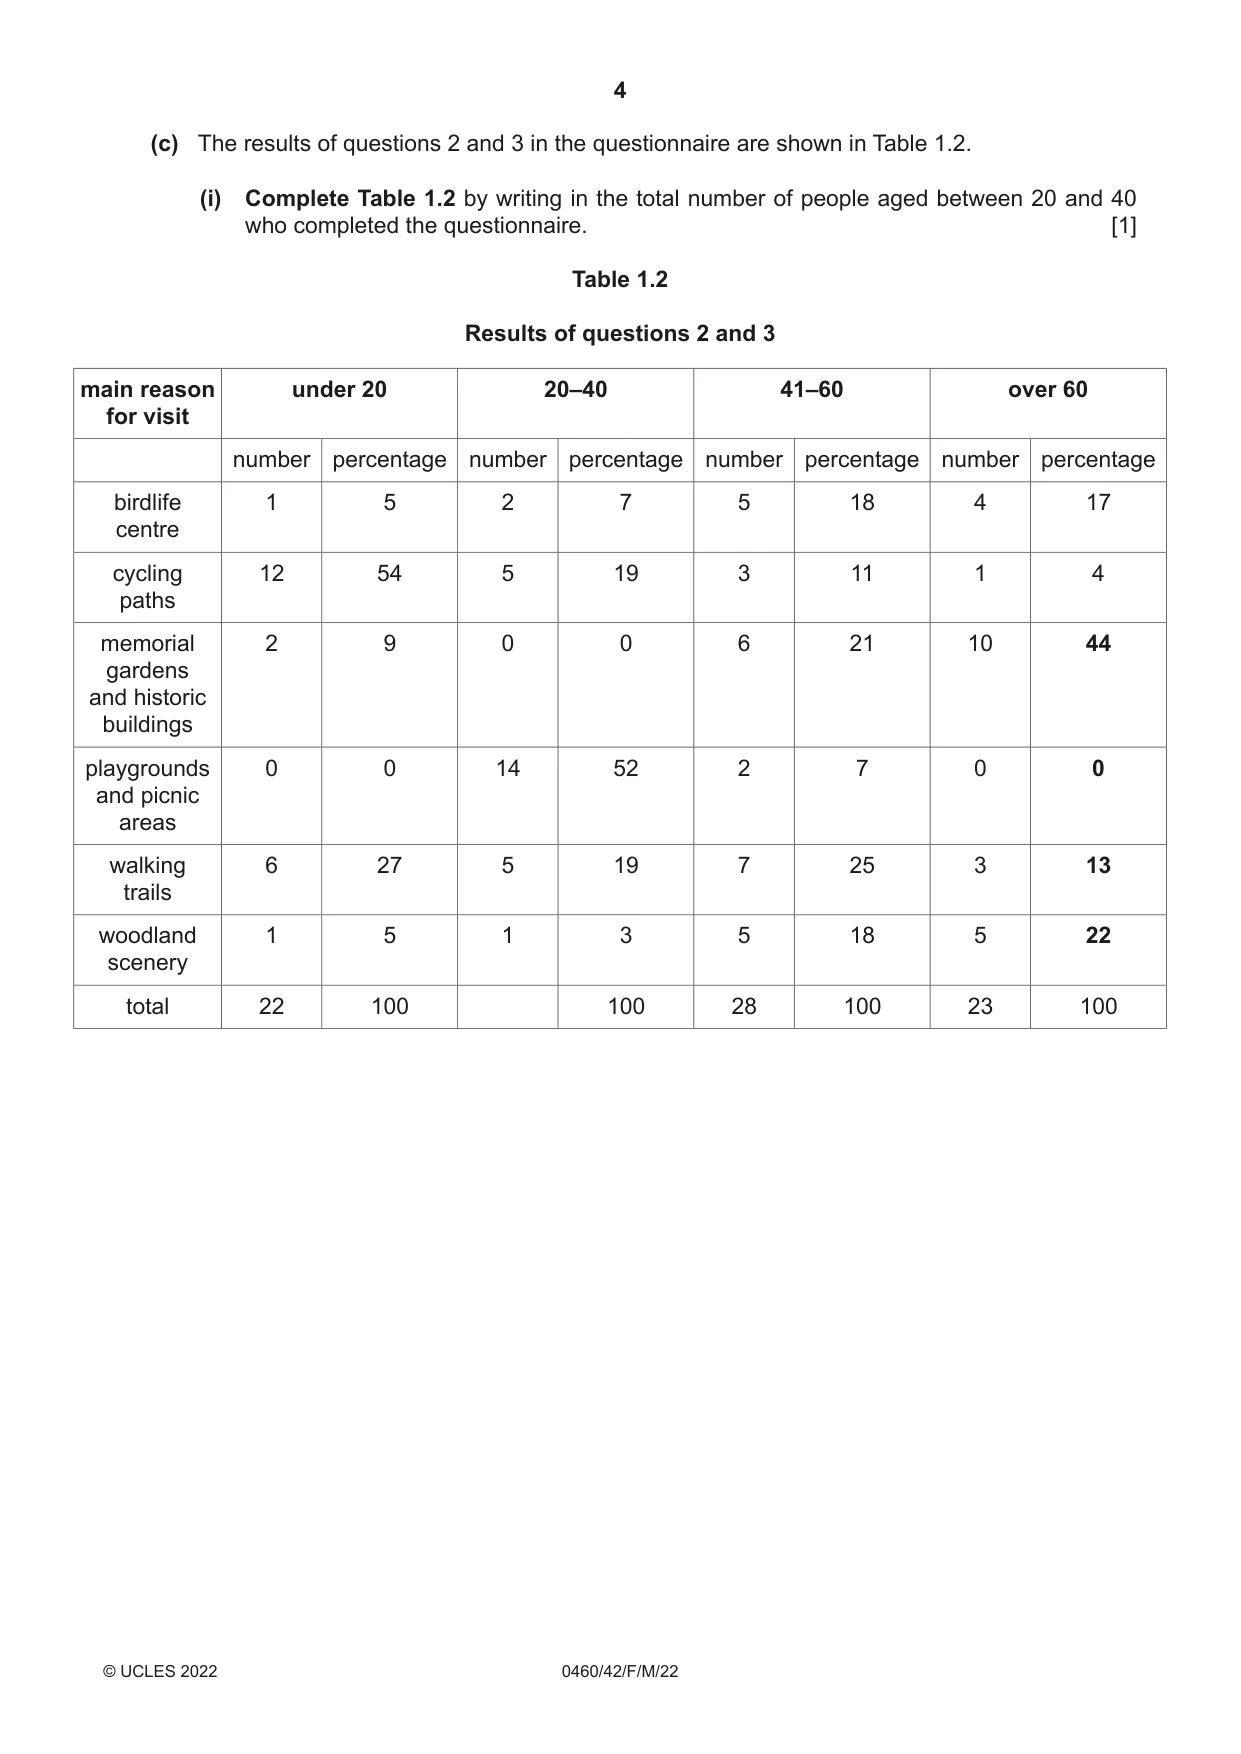
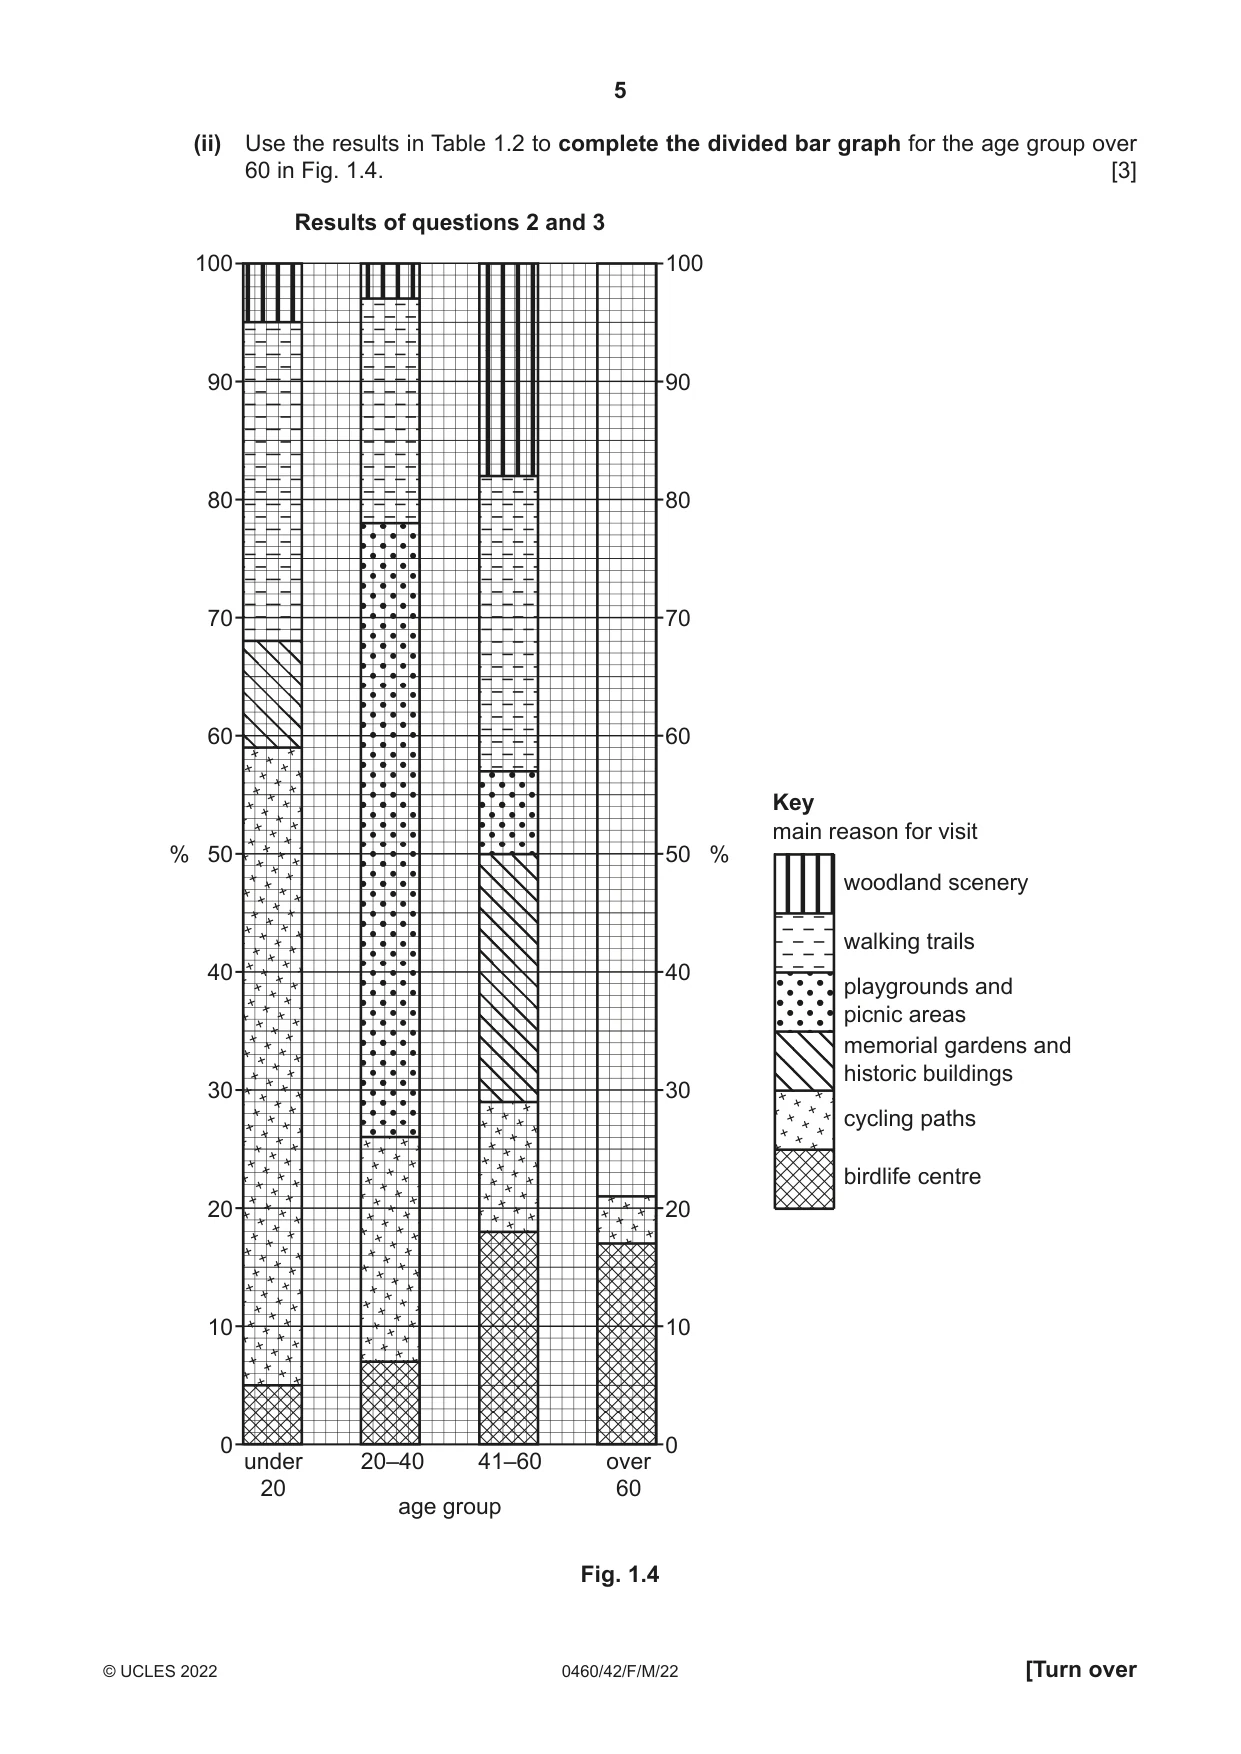
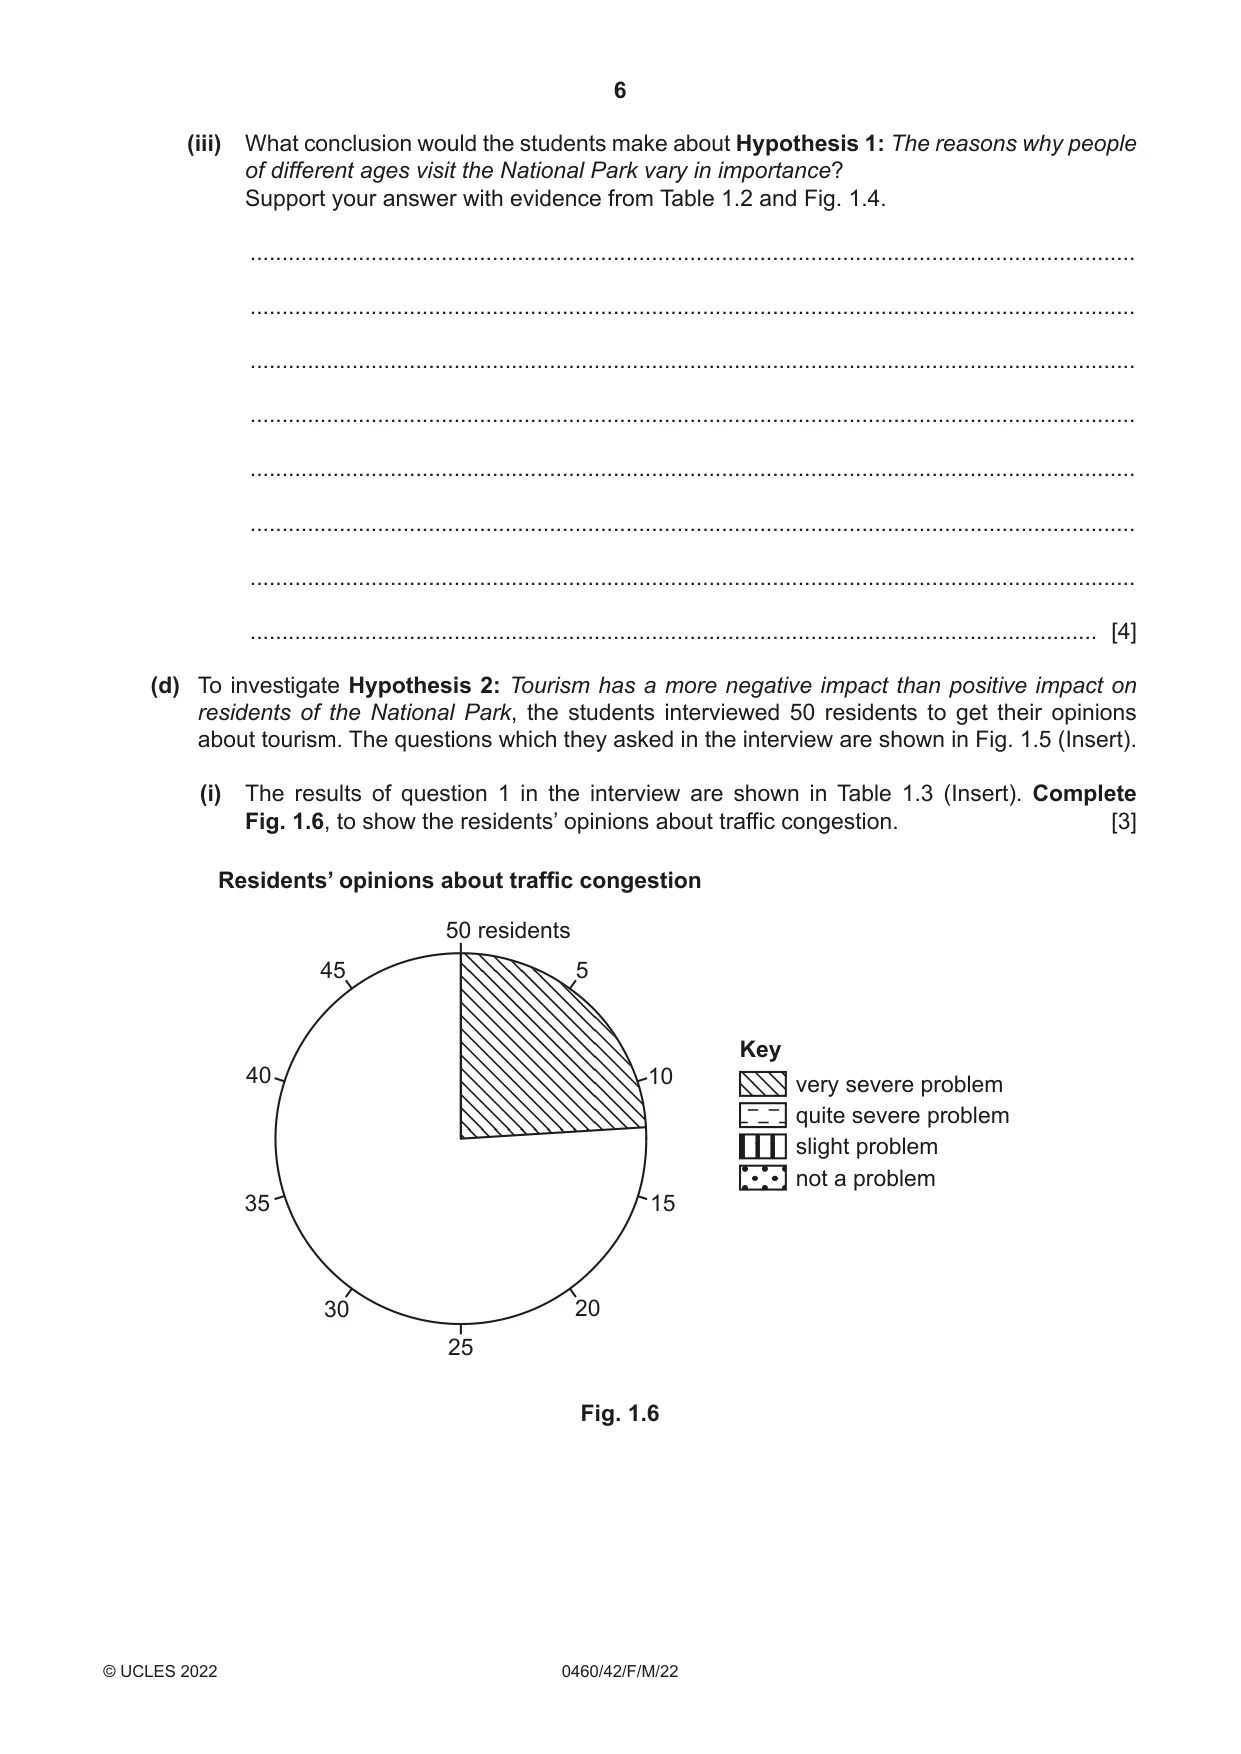
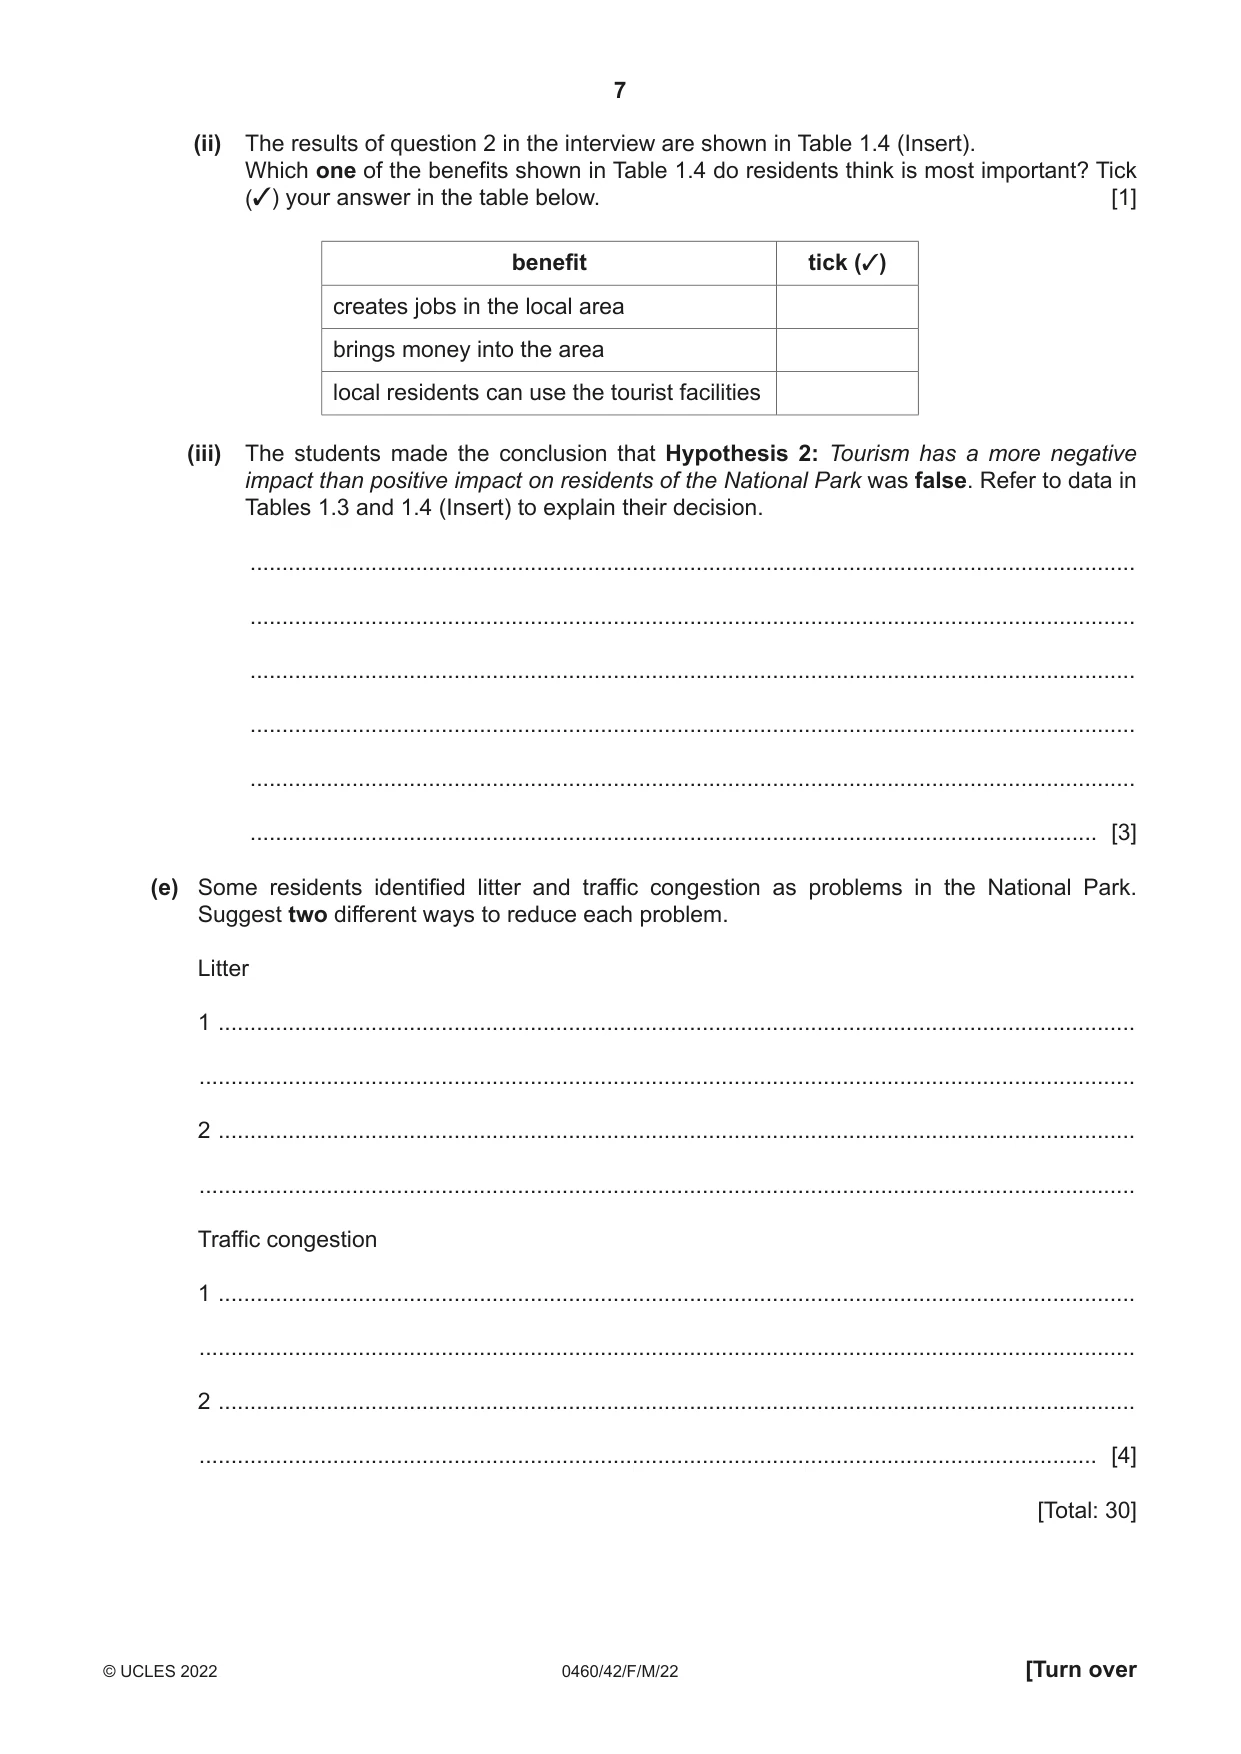
1 Students did fieldwork to investigate tourism in Salina National Park in Malta. Malta is an island in the Mediterranean Sea. They decided to test the following hypotheses: Hypothesis 1: The reasons why people of different ages visit the National Park vary in importance. Hypothesis 2: Tourism has a more negative impact than positive impact on residents of the National Park. (a) (i) To begin their investigation the students divided into pairs to produce a questionnaire to use with tourists in the National Park. Two of these questionnaires are shown in Figs. 1.1 and 1.2 (Insert). Give three ways that questionnaire 1 (Fig. 1.1) is better than questionnaire 2 (Fig. 1.2). 1 ........................................................................................................................................ ........................................................................................................................................... 2 ........................................................................................................................................ ........................................................................................................................................... 3 ........................................................................................................................................ ..................................................................................................................................... [3] (ii) The students used a random sampling method to select 100 tourists to answer the questionnaire shown in Fig. 1.1. Describe, in detail, how they would use a random sampling method. ........................................................................................................................................... ........................................................................................................................................... ........................................................................................................................................... ..................................................................................................................................... [2] (iii) The students decided to use the questionnaire in a car park in the middle of the National Park. Suggest one advantage and one disadvantage of their decision to use the questionnaire in the car park. Advantage ........................................................................................................................................... ........................................................................................................................................... Disadvantage ........................................................................................................................................... ..................................................................................................................................... [2] (b) The results of question 1 in the questionnaire used (shown in Fig 1.1) are shown in Table 1.1 (Insert). (i) Use the results in Table 1.1 to complete Fig. 1.3. [2] Results of question 1 How far have you travelled to get here today? 60 50 40 number of 30 tourists 20 10 0 0–5 6–10 11–15 16–20 more than 20 distance (km) Fig. 1.3 (ii) Use the results of question 1 to describe how the number of tourists going to the National Park varied with distance. ........................................................................................................................................... ........................................................................................................................................... ........................................................................................................................................... ..................................................................................................................................... [2] (c) The results of questions 2 and 3 in the questionnaire are shown in Table 1.2. (i) Complete Table 1.2 by writing in the total number of people aged between 20 and 40 who completed the questionnaire. [1] Table 1.2 Results of questions 2 and 3 main reason under 20 20–40 41–60 over 60 for visit number percentage number percentage number percentage number percentage birdlife 1 5 2 7 5 18 4 17 centre cycling 12 54 5 19 3 11 1 4 paths memorial 2 9 0 0 6 21 10 44 gardens and historic buildings playgrounds 0 0 14 52 2 7 0 0 and picnic areas walking 6 27 5 19 7 25 3 13 trails woodland 1 5 1 3 5 18 5 22 scenery total 22 100 100 28 100 23 100 (iii) What conclusion would the students make about Hypothesis 1: The reasons why people of different ages visit the National Park vary in importance? Support your answer with evidence from Table 1.2 and Fig. 1.4. ........................................................................................................................................... ........................................................................................................................................... ........................................................................................................................................... ........................................................................................................................................... ........................................................................................................................................... ........................................................................................................................................... ........................................................................................................................................... ..................................................................................................................................... [4] (d) To investigate Hypothesis 2: Tourism has a more negative impact than positive impact on residents of the National Park, the students interviewed 50 residents to get their opinions about tourism. The questions which they asked in the interview are shown in Fig. 1.5 (Insert). (i) The results of question 1 in the interview are shown in Table 1.3 (Insert). Complete Fig. 1.6, to show the residents’ opinions about traffic congestion. [3] Residents’ opinions about traffic congestion 50 residents 45 5 Key 40 10 very severe problem quite severe problem slight problem not a problem 35 15 30 20 25 Fig. 1.6 (ii) The results of question 2 in the interview are shown in Table 1.4 (Insert). Which one of the benefits shown in Table 1.4 do residents think is most important? Tick (3) your answer in the table below. [1] benefit tick (3) creates jobs in the local area brings money into the area local residents can use the tourist facilities (iii) The students made the conclusion that Hypothesis 2: Tourism has a more negative impact than positive impact on residents of the National Park was false. Refer to data in Tables 1.3 and 1.4 (Insert) to explain their decision. ........................................................................................................................................... ........................................................................................................................................... ........................................................................................................................................... ........................................................................................................................................... ........................................................................................................................................... ..................................................................................................................................... [3] (e) Some residents identified litter and traffic congestion as problems in the National Park. Suggest two different ways to reduce each problem. Litter 1 ................................................................................................................................................ ................................................................................................................................................... 2 ................................................................................................................................................ ................................................................................................................................................... Traffic congestion 1 ................................................................................................................................................ ................................................................................................................................................... 2 ................................................................................................................................................ ............................................................................................................................................. [4] [Total: 30]
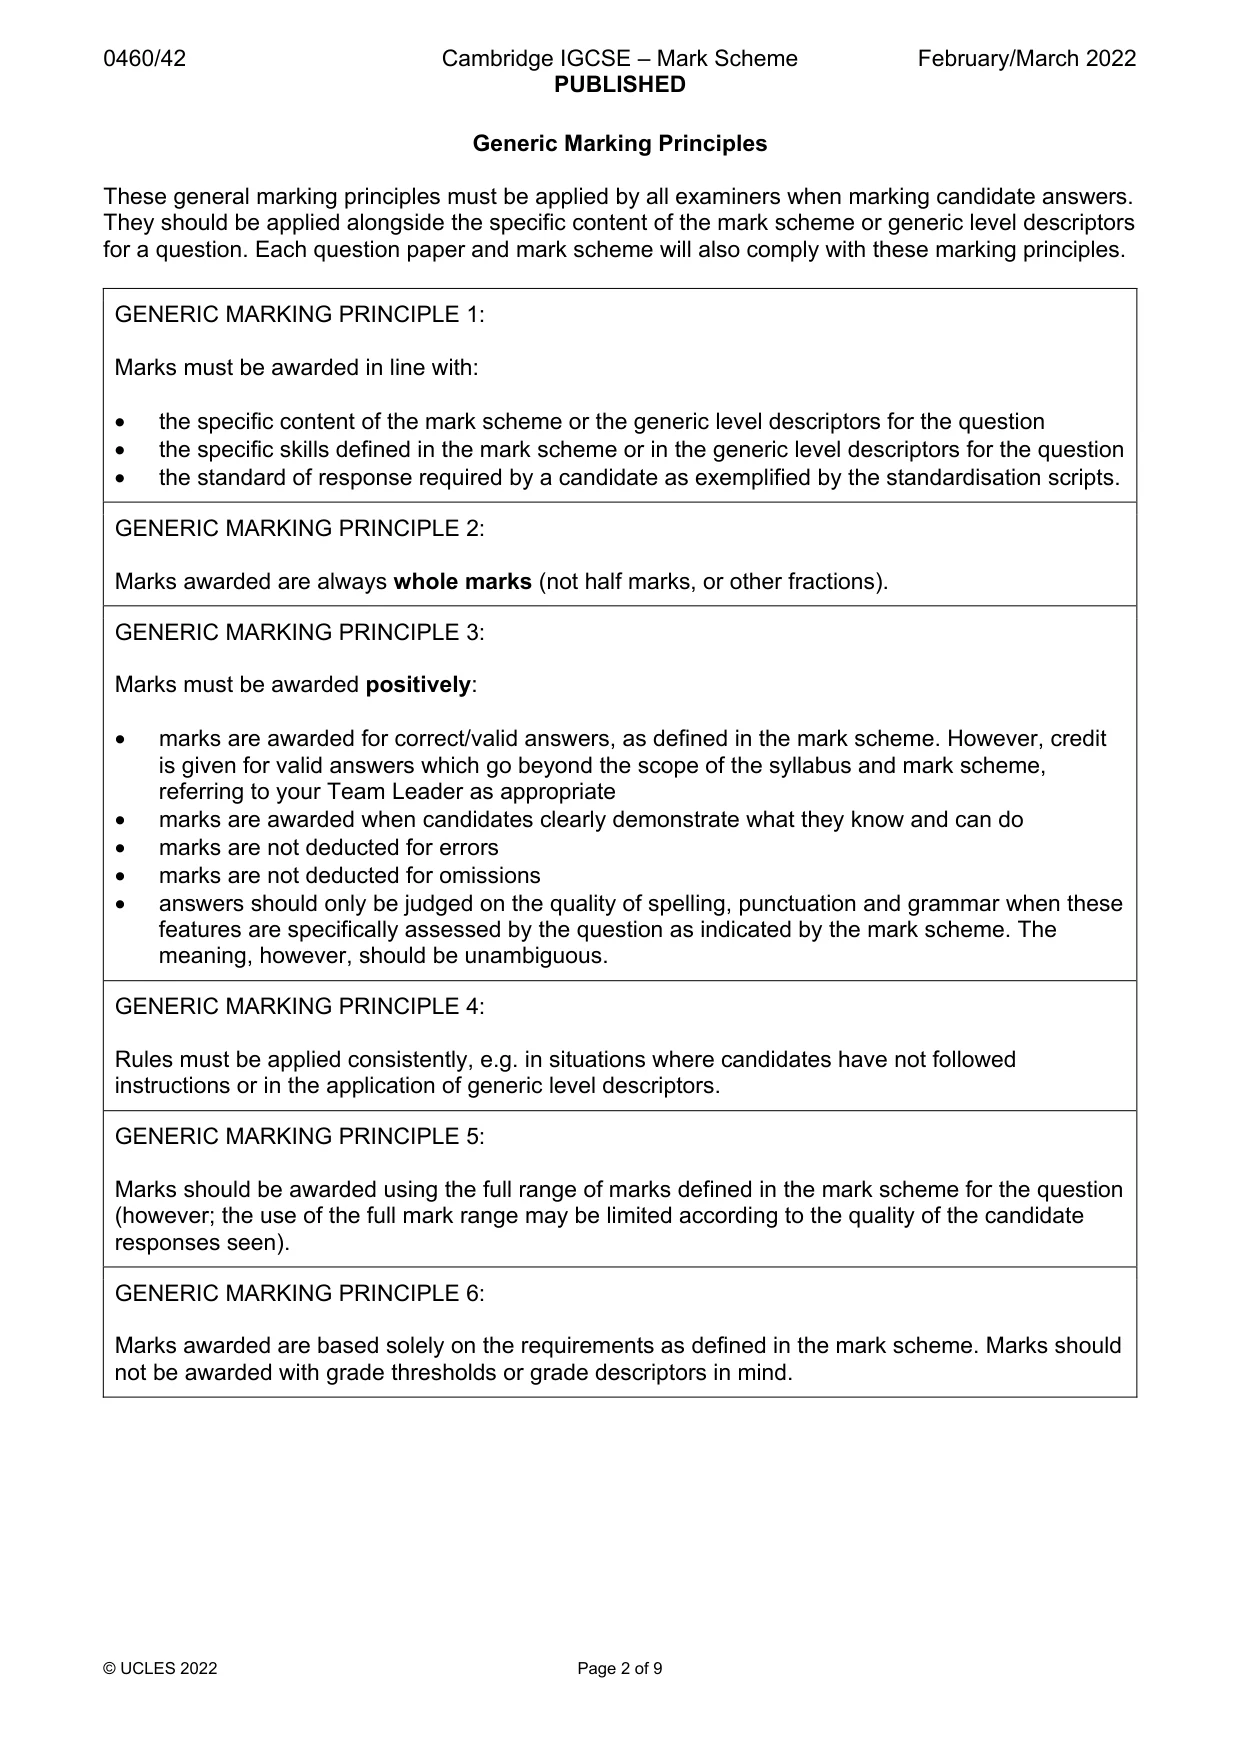
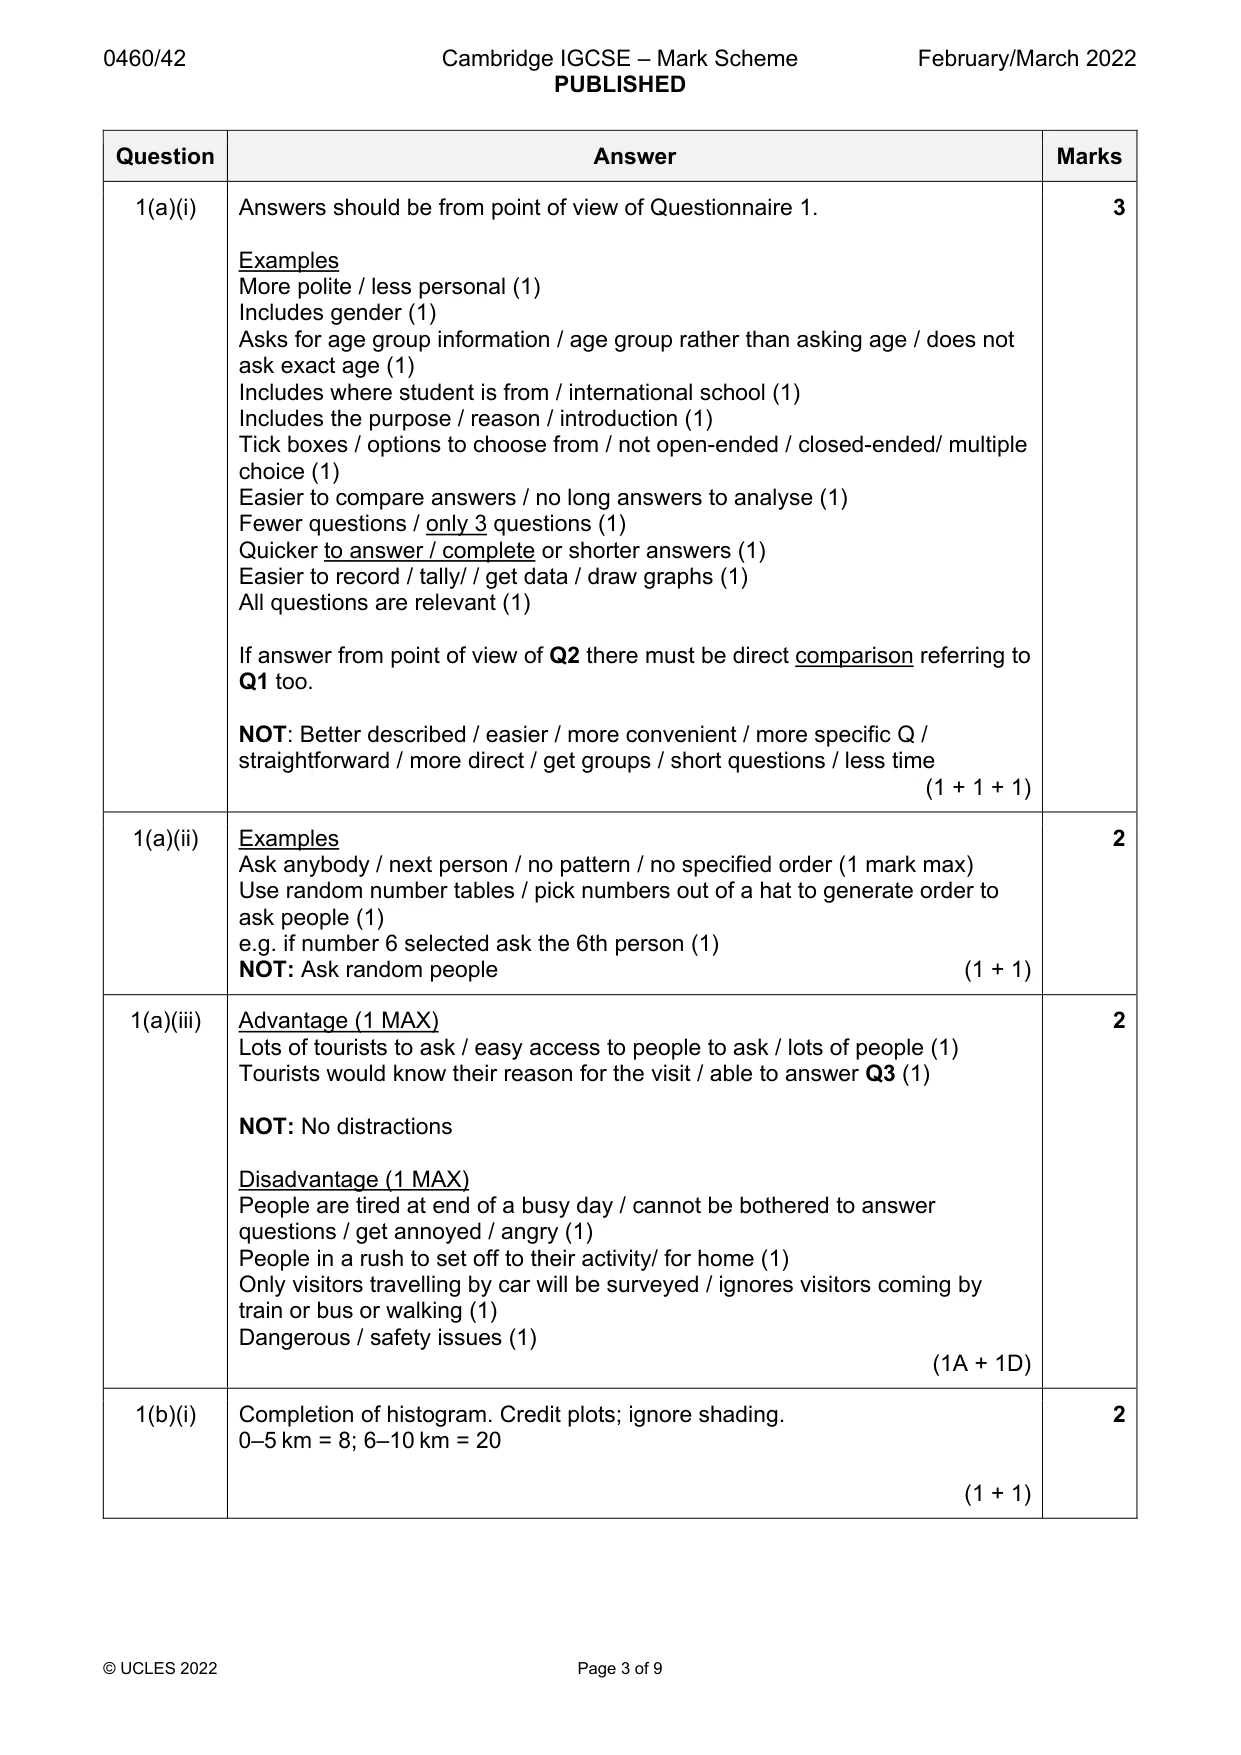
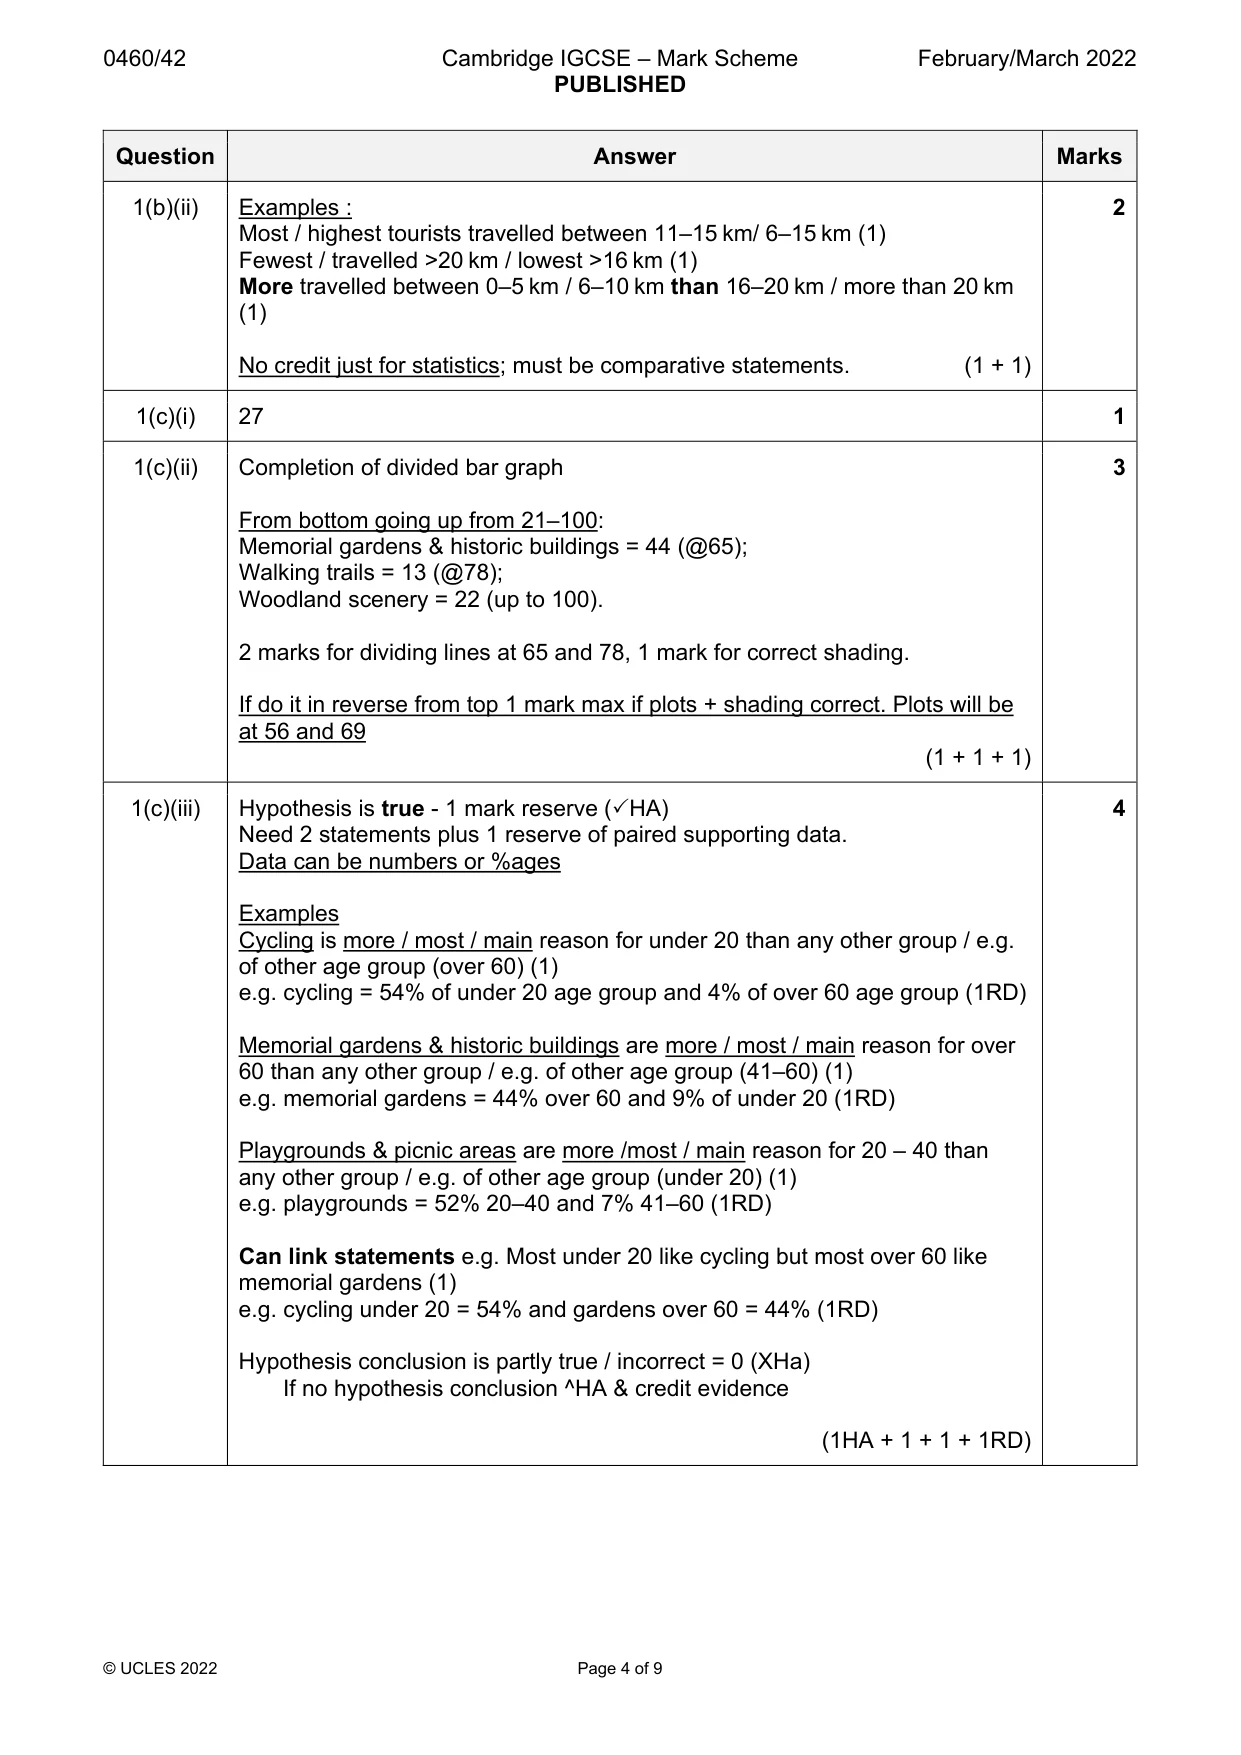
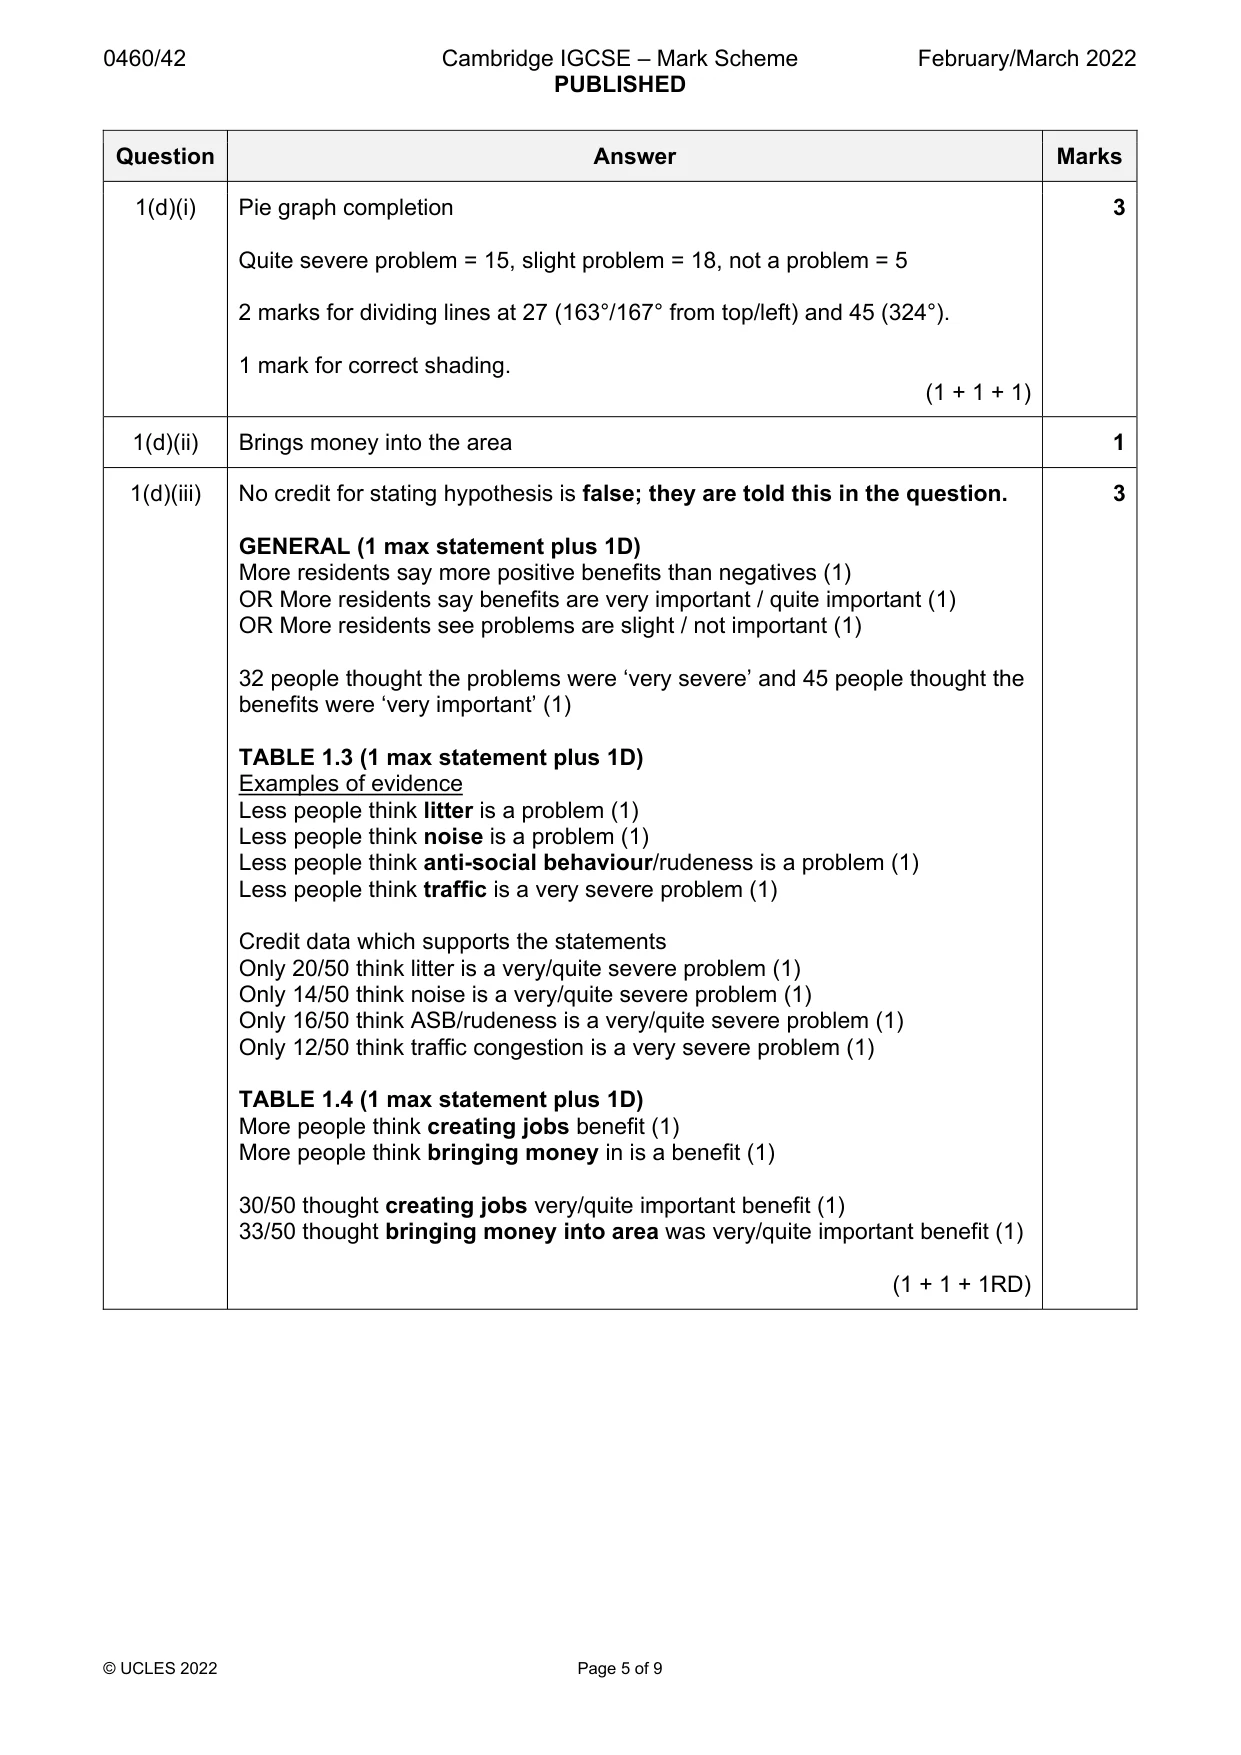
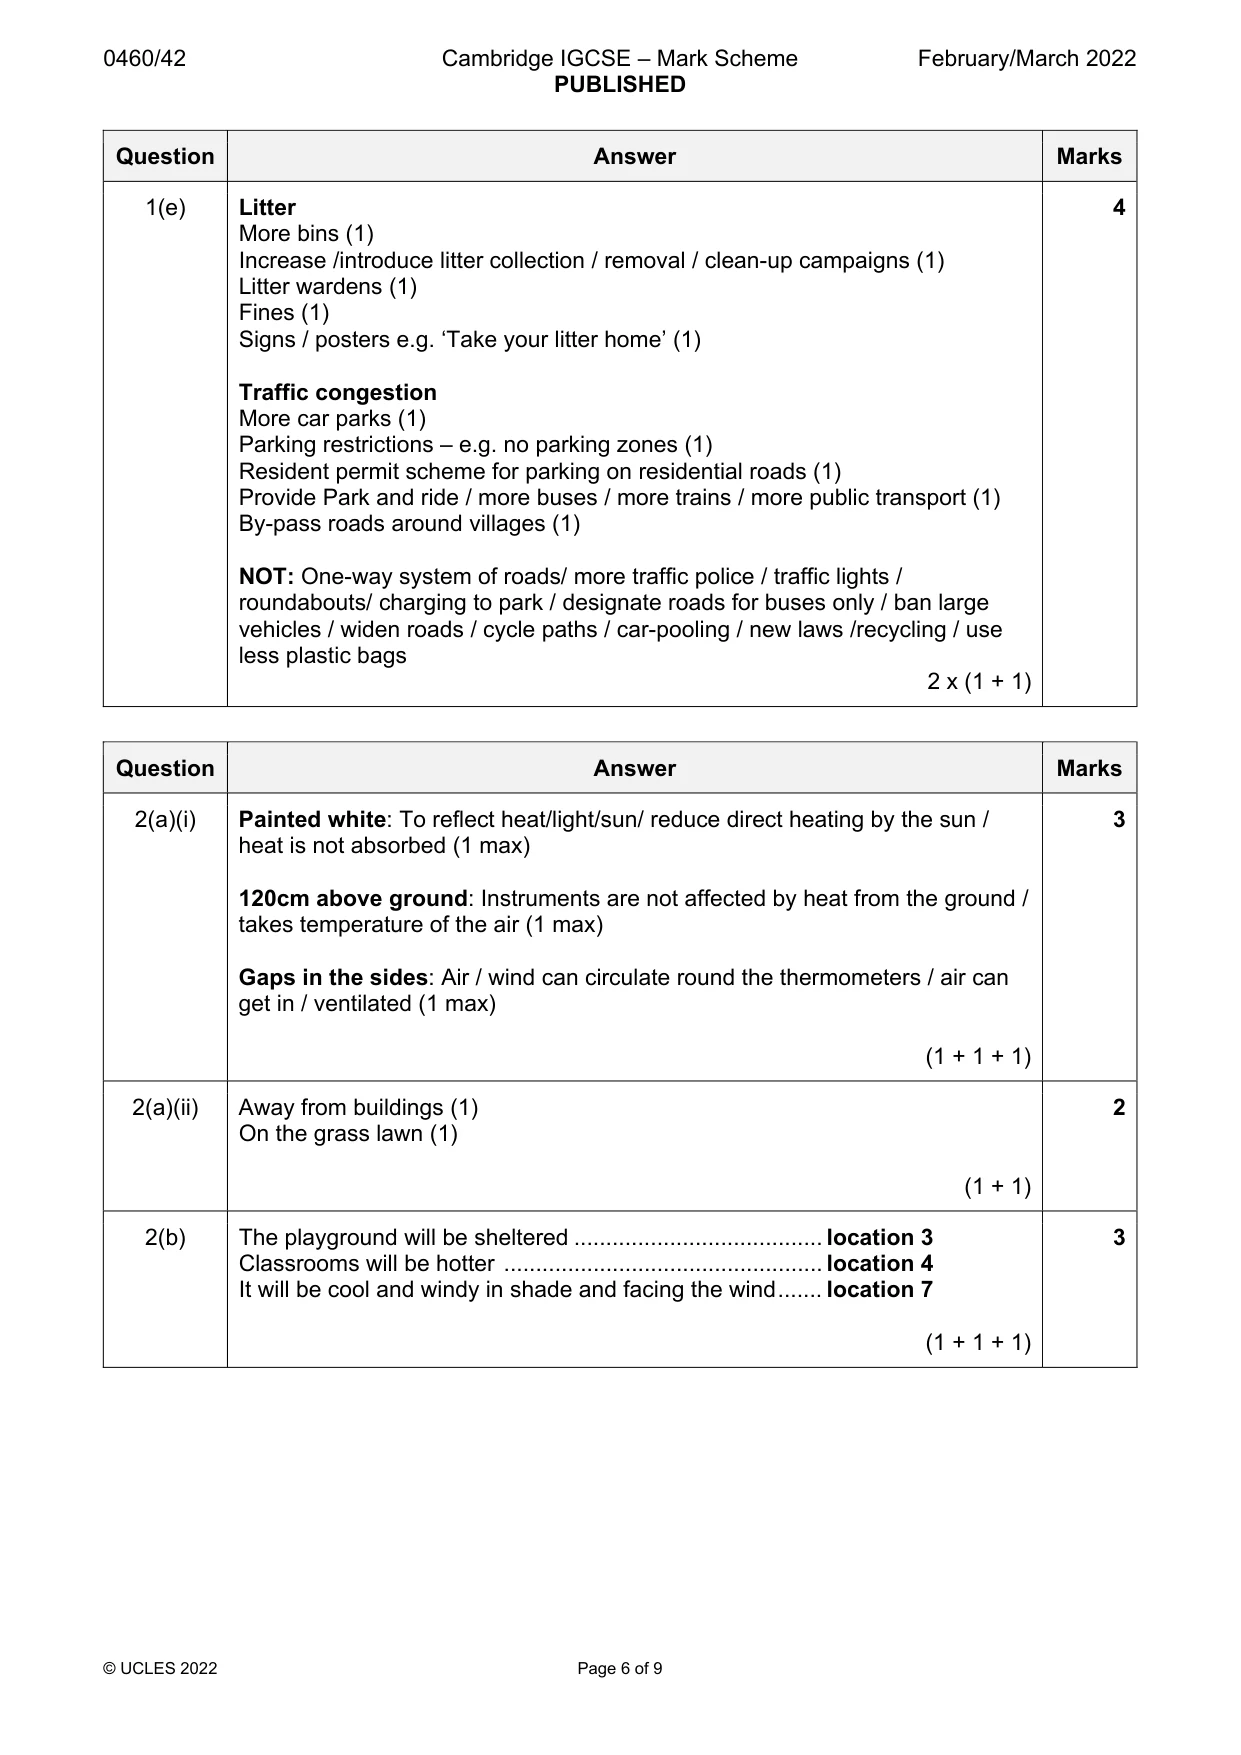
Mark scheme: Question Answer Marks 1(a)(i) Answers should be from point of view of Questionnaire 1. 3 Examples More polite / less personal (1) Includes gender (1) Asks for age group information / age group rather than asking age / does not ask exact age (1) Includes where student is from / international school (1) Includes the purpose / reason / introduction (1) Tick boxes / options to choose from / not open-ended / closed-ended/ multiple choice (1) Easier to compare answers / no long answers to analyse (1) Fewer questions / only 3 questions (1) Quicker to answer / complete or shorter answers (1) Easier to record / tally/ / get data / draw graphs (1) All questions are relevant (1) If answer from point of view of Q2 there must be direct comparison referring to Q1 too. NOT: Better described / easier / more convenient / more specific Q / straightforward / more direct / get groups / short questions / less time (1 + 1 + 1) 1(a)(ii) Examples 2 Ask anybody / next person / no pattern / no specified order (1 mark max) Use random number tables / pick numbers out of a hat to generate order to ask people (1) e.g. if number 6 selected ask the 6th person (1) NOT: Ask random people (1 + 1) 1(a)(iii) Advantage (1 MAX) 2 Lots of tourists to ask / easy access to people to ask / lots of people (1) Tourists would know their reason for the visit / able to answer Q3 (1) NOT: No distractions Disadvantage (1 MAX) People are tired at end of a busy day / cannot be bothered to answer questions / get annoyed / angry (1) People in a rush to set off to their activity/ for home (1) Only visitors travelling by car will be surveyed / ignores visitors coming by train or bus or walking (1) Dangerous / safety issues (1) (1A + 1D) 1(b)(i) Completion of histogram. Credit plots; ignore shading. 2 0–5 km = 8; 6–10 km = 20 (1 + 1) 1(b)(ii) Examples : 2 Most / highest tourists travelled between 11–15 km/ 6–15 km (1) Fewest / travelled >20 km / lowest >16 km (1) More travelled between 0–5 km / 6–10 km than 16–20 km / more than 20 km (1) No credit just for statistics; must be comparative statements. (1 + 1) 1(c)(i) 27 1 1(c)(ii) Completion of divided bar graph 3 From bottom going up from 21–100: Memorial gardens & historic buildings = 44 (@65); Walking trails = 13 (@78); Woodland scenery = 22 (up to 100). 2 marks for dividing lines at 65 and 78, 1 mark for correct shading. If do it in reverse from top 1 mark max if plots + shading correct. Plots will be at 56 and 69 (1 + 1 + 1) 1(c)(iii) Hypothesis is true - 1 mark reserve (HA) 4 Need 2 statements plus 1 reserve of paired supporting data. Data can be numbers or %ages Examples Cycling is more / most / main reason for under 20 than any other group / e.g. of other age group (over 60) (1) e.g. cycling = 54% of under 20 age group and 4% of over 60 age group (1RD) Memorial gardens & historic buildings are more / most / main reason for over 60 than any other group / e.g. of other age group (41–60) (1) e.g. memorial gardens = 44% over 60 and 9% of under 20 (1RD) Playgrounds & picnic areas are more /most / main reason for 20 – 40 than any other group / e.g. of other age group (under 20) (1) e.g. playgrounds = 52% 20–40 and 7% 41–60 (1RD) Can link statements e.g. Most under 20 like cycling but most over 60 like memorial gardens (1) e.g. cycling under 20 = 54% and gardens over 60 = 44% (1RD) Hypothesis conclusion is partly true / incorrect = 0 (XHa) If no hypothesis conclusion ^HA & credit evidence (1HA + 1 + 1 + 1RD) 1(d)(i) Pie graph completion 3 Quite severe problem = 15, slight problem = 18, not a problem = 5 2 marks for dividing lines at 27 (163°/167° from top/left) and 45 (324°). 1 mark for correct shading. (1 + 1 + 1) 1(d)(ii) Brings money into the area 1 1(d)(iii) No credit for stating hypothesis is false; they are told this in the question. 3 GENERAL (1 max statement plus 1D) More residents say more positive benefits than negatives (1) OR More residents say benefits are very important / quite important (1) OR More residents see problems are slight / not important (1) 32 people thought the problems were ‘very severe’ and 45 people thought the benefits were ‘very important’ (1) TABLE 1.3 (1 max statement plus 1D) Examples of evidence Less people think litter is a problem (1) Less people think noise is a problem (1) Less people think anti-social behaviour/rudeness is a problem (1) Less people think traffic is a very severe problem (1) Credit data which supports the statements Only 20/50 think litter is a very/quite severe problem (1) Only 14/50 think noise is a very/quite severe problem (1) Only 16/50 think ASB/rudeness is a very/quite severe problem (1) Only 12/50 think traffic congestion is a very severe problem (1) TABLE 1.4 (1 max statement plus 1D) More people think creating jobs benefit (1) More people think bringing money in is a benefit (1) 30/50 thought creating jobs very/quite important benefit (1) 33/50 thought bringing money into area was very/quite important benefit (1) (1 + 1 + 1RD) 1(e) Litter 4 More bins (1) Increase /introduce litter collection / removal / clean-up campaigns (1) Litter wardens (1) Fines (1) Signs / posters e.g. ‘Take your litter home’ (1) Traffic congestion More car parks (1) Parking restrictions – e.g. no parking zones (1) Resident permit scheme for parking on residential roads (1) Provide Park and ride / more buses / more trains / more public transport (1) By-pass roads around villages (1) NOT: One-way system of roads/ more traffic police / traffic lights / roundabouts/ charging to park / designate roads for buses only / ban large vehicles / widen roads / cycle paths / car-pooling / new laws /recycling / use less plastic bags 2 x (1 + 1)
Q2 · A class of students was studying how to collect weather data using a Stevenson Screen…
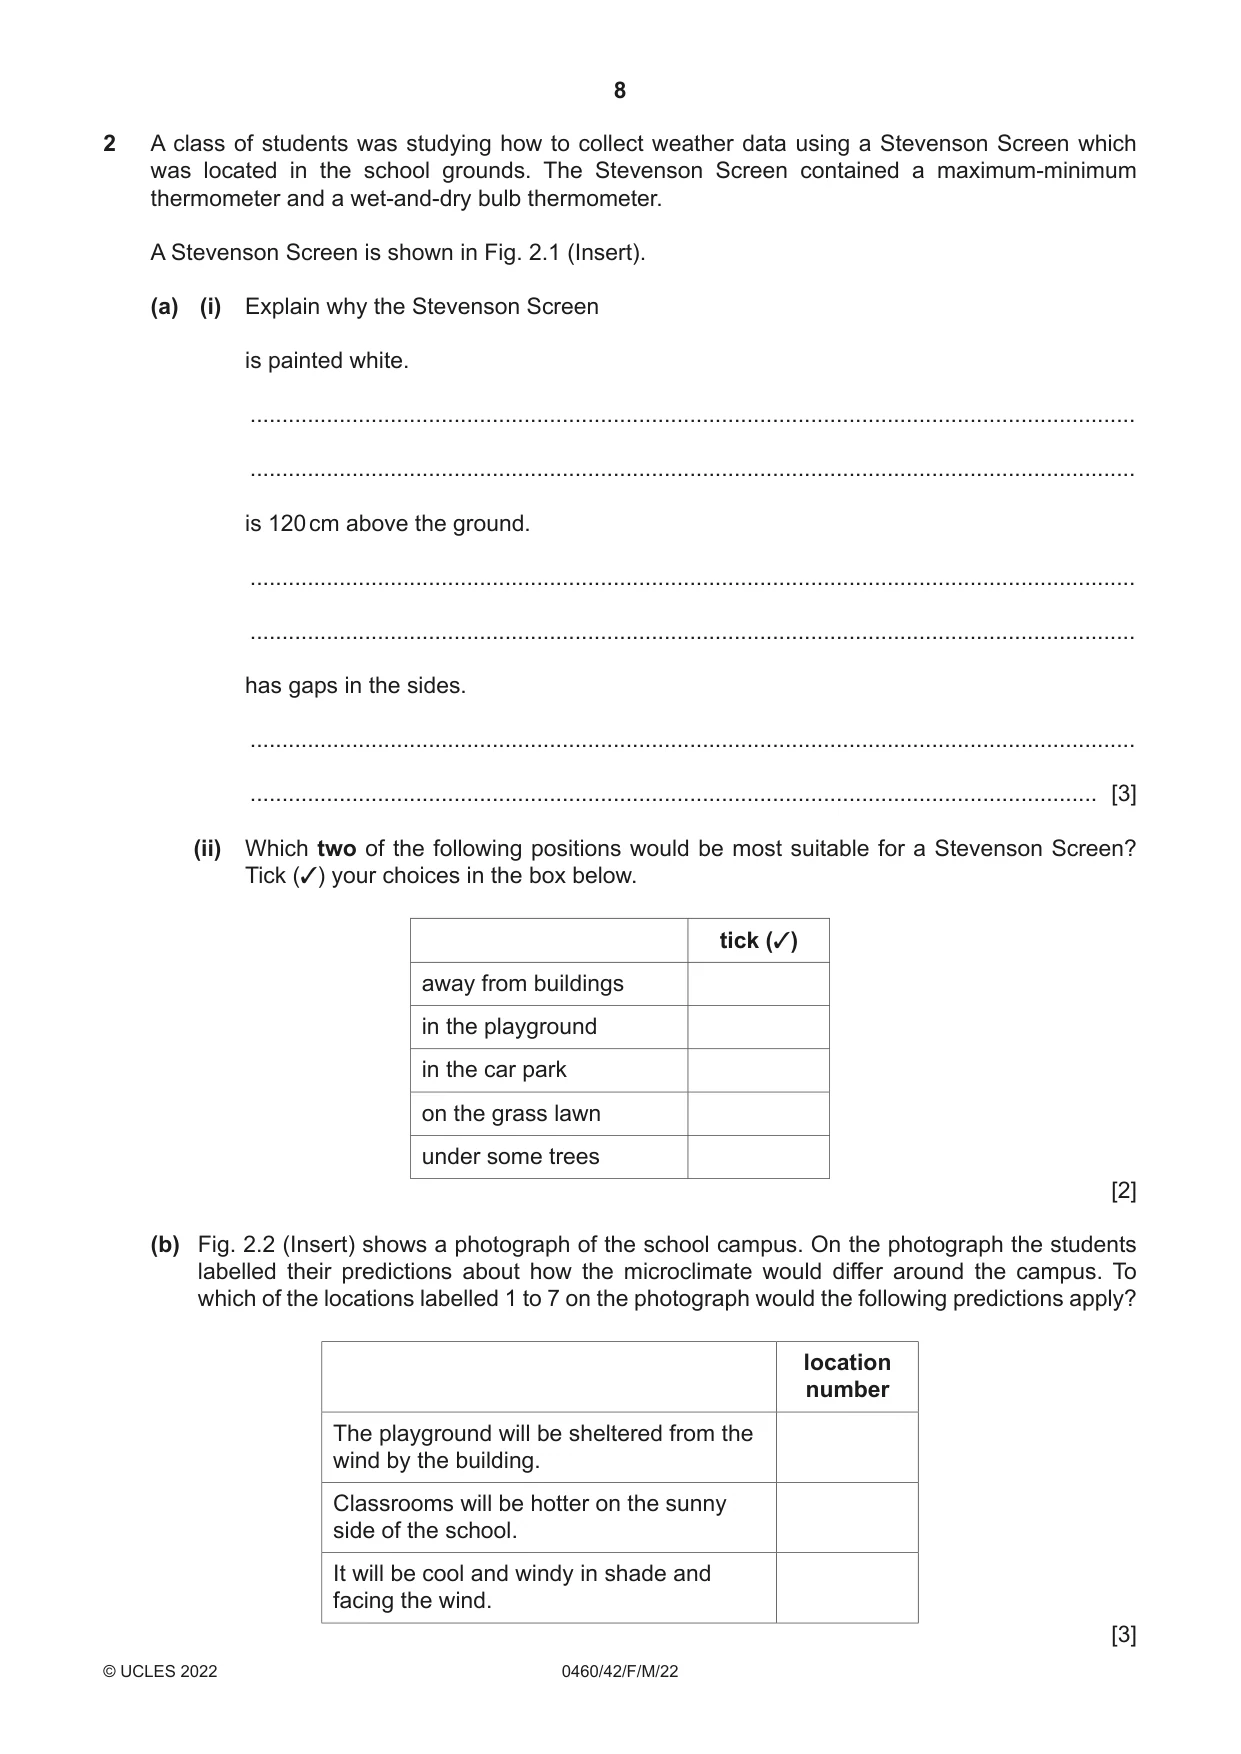
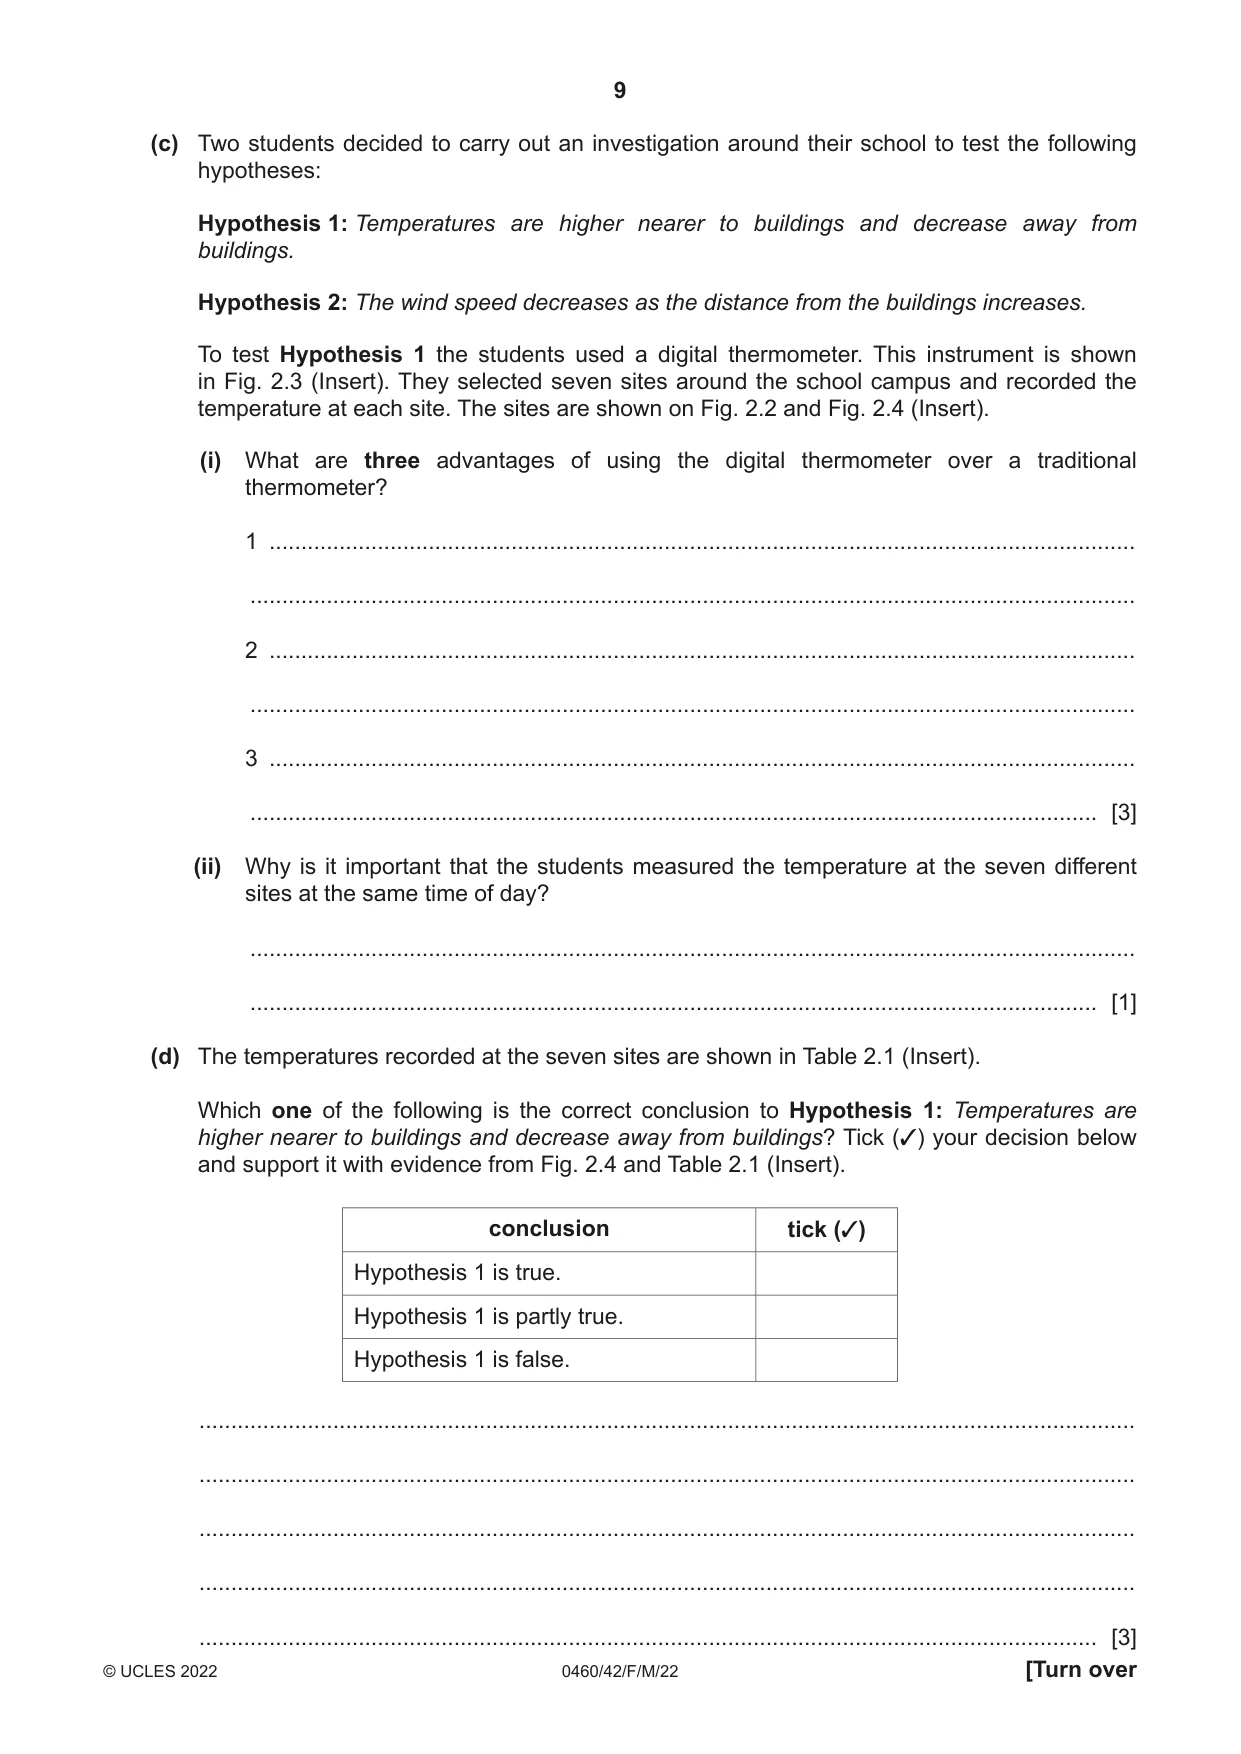
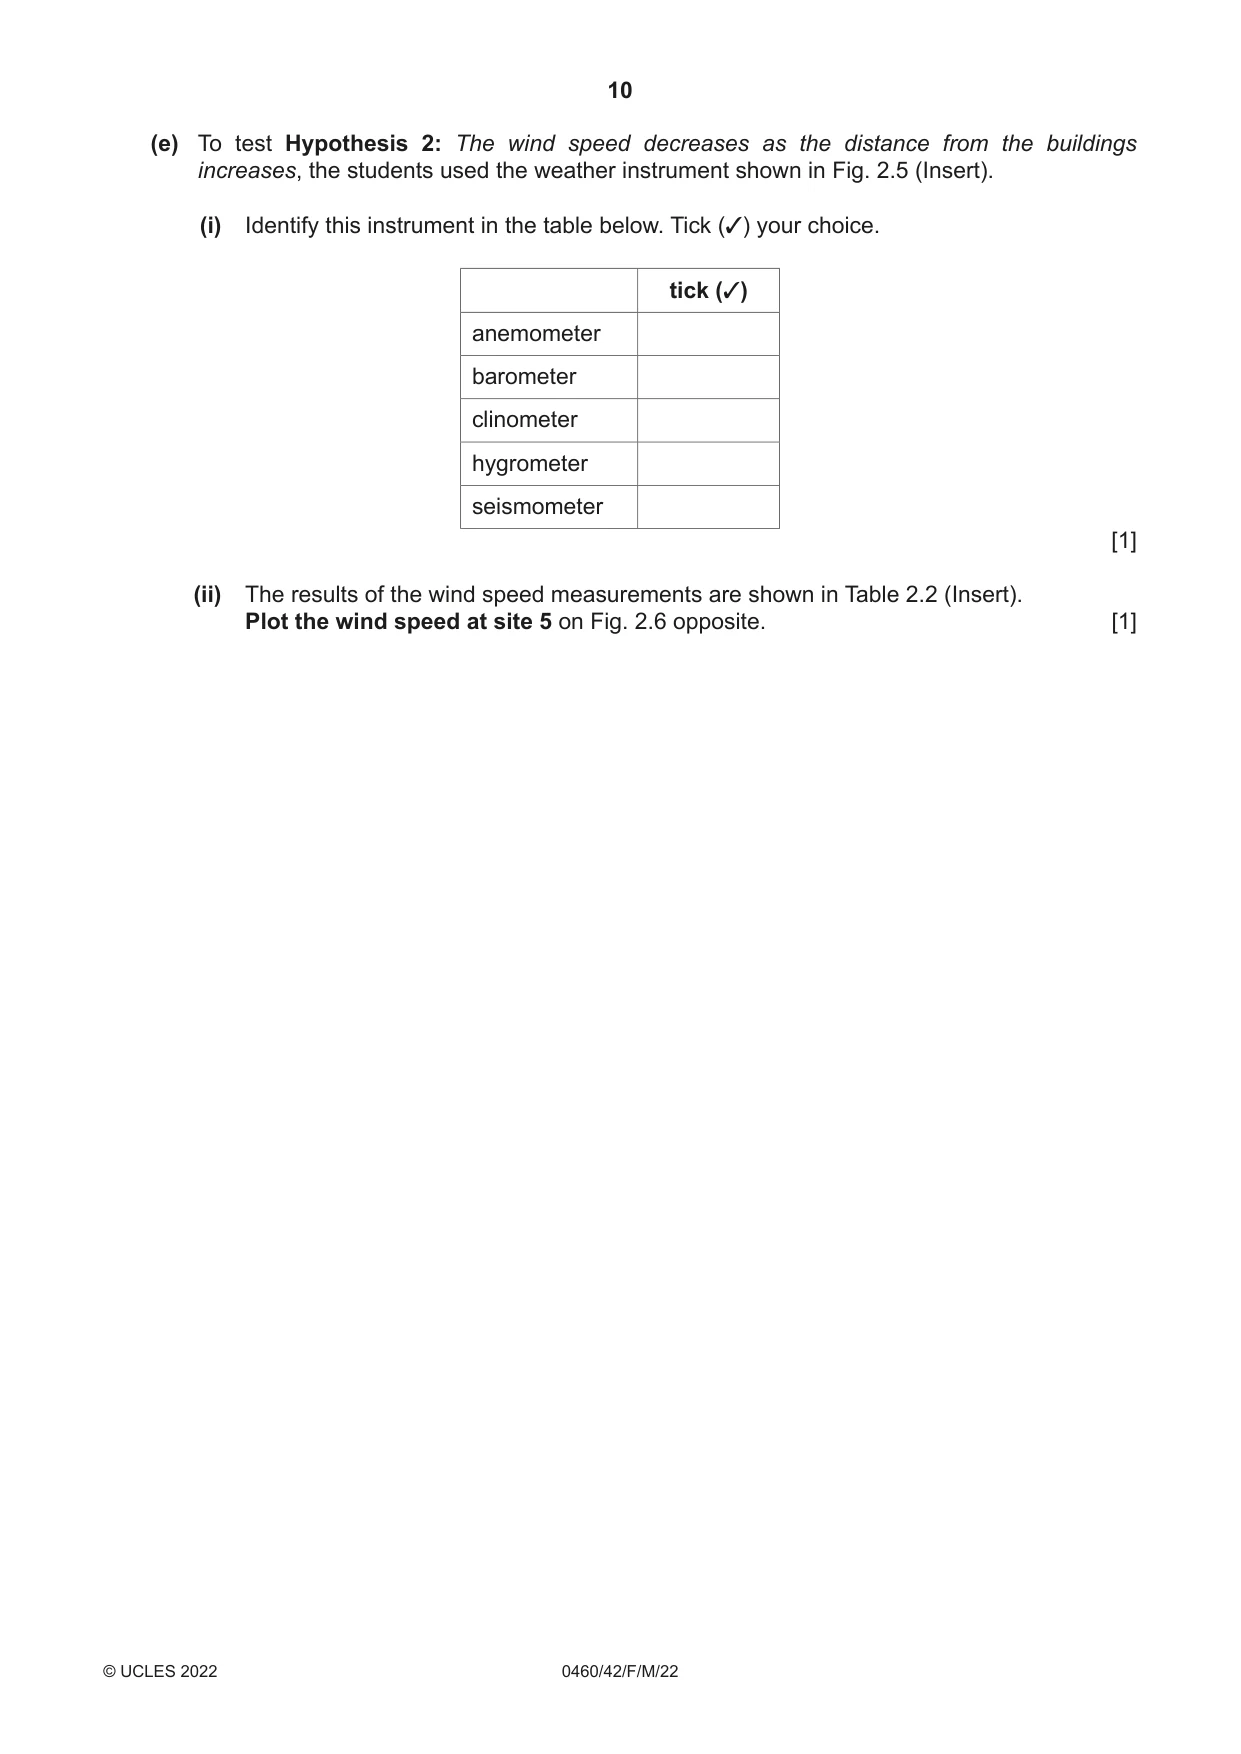
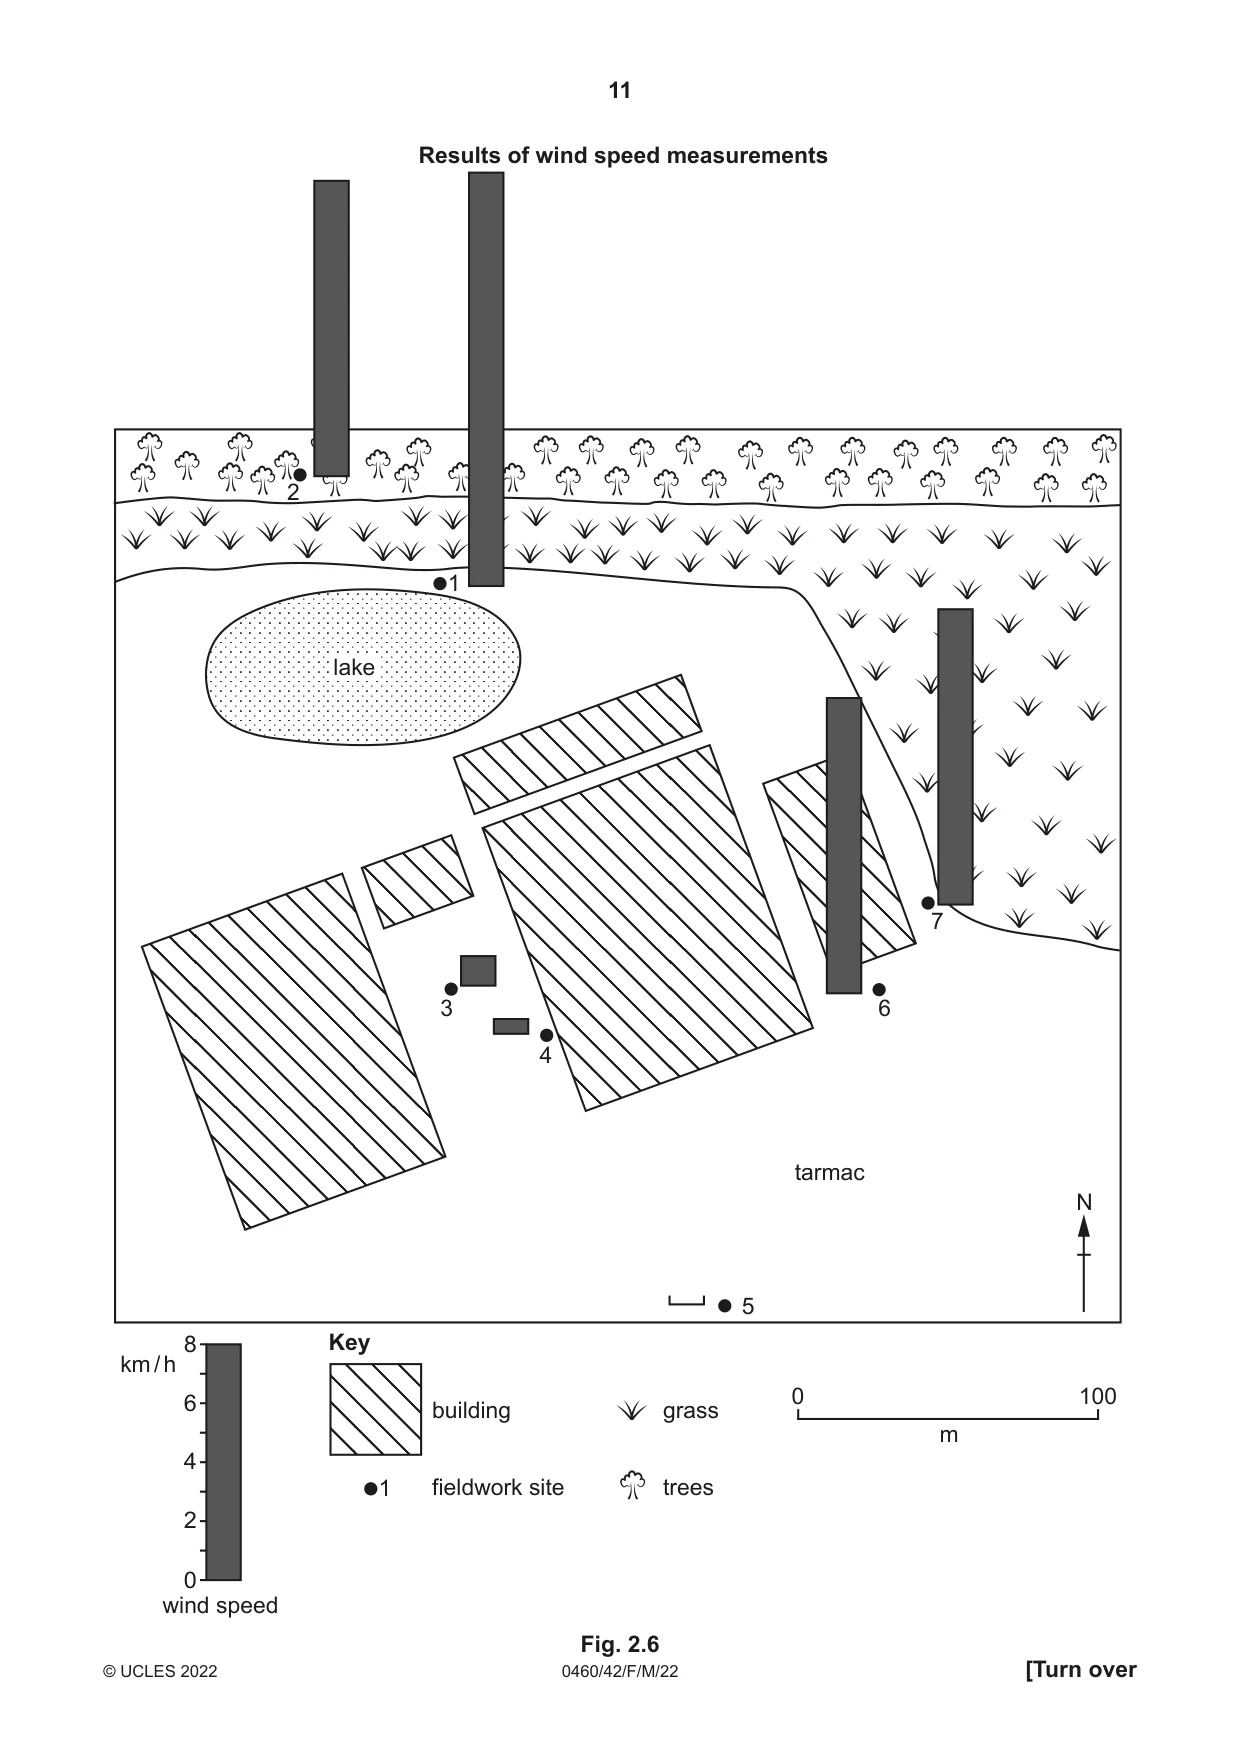
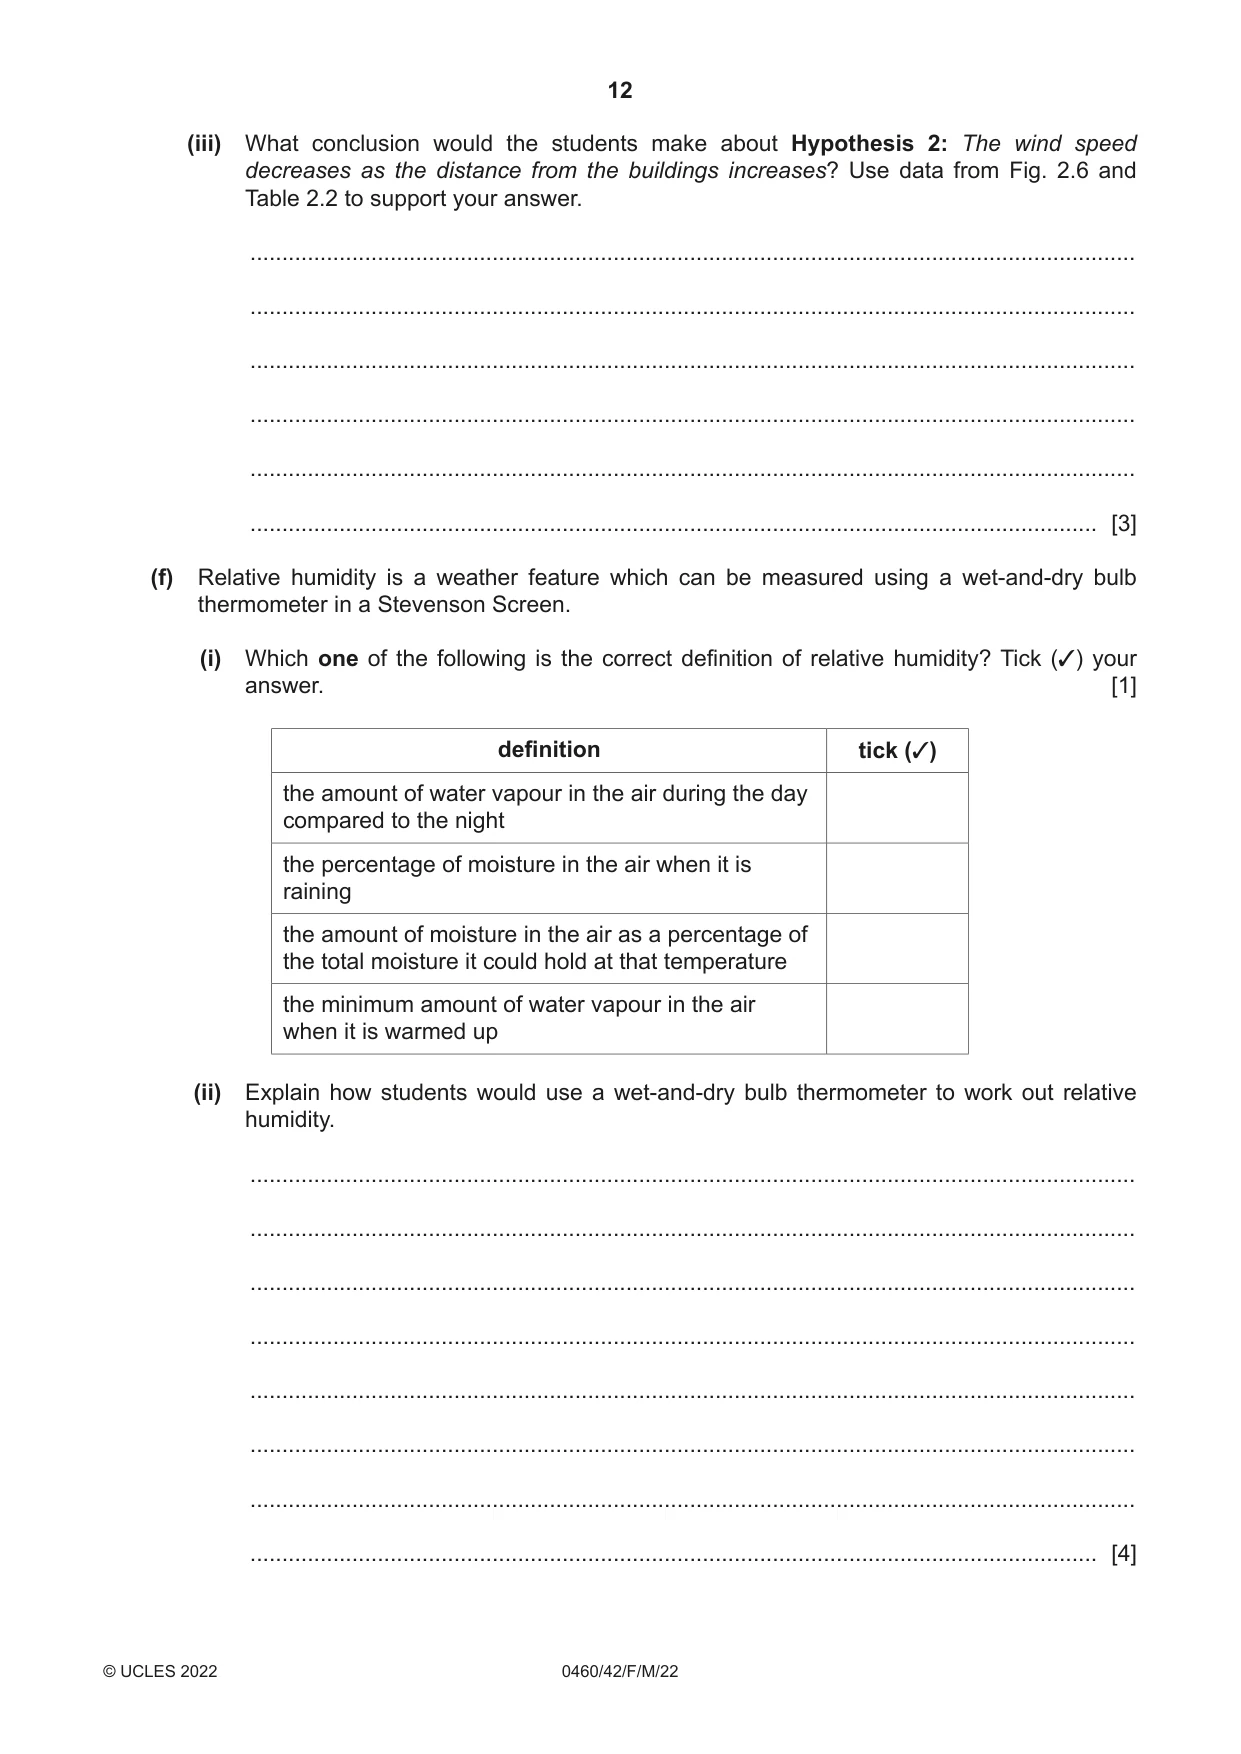
2 A class of students was studying how to collect weather data using a Stevenson Screen which was located in the school grounds. The Stevenson Screen contained a maximum-minimum thermometer and a wet-and-dry bulb thermometer. A Stevenson Screen is shown in Fig. 2.1 (Insert). (a) (i) Explain why the Stevenson Screen is painted white. ........................................................................................................................................... ........................................................................................................................................... is 120 cm above the ground. ........................................................................................................................................... ........................................................................................................................................... has gaps in the sides. ........................................................................................................................................... ..................................................................................................................................... [3] (ii) Which two of the following positions would be most suitable for a Stevenson Screen? Tick (3) your choices in the box below. tick (3) away from buildings in the playground in the car park on the grass lawn under some trees [2] (b) Fig. 2.2 (Insert) shows a photograph of the school campus. On the photograph the students labelled their predictions about how the microclimate would differ around the campus. To which of the locations labelled 1 to 7 on the photograph would the following predictions apply? location number The playground will be sheltered from the wind by the building. Classrooms will be hotter on the sunny side of the school. It will be cool and windy in shade and facing the wind. [3] (c) Two students decided to carry out an investigation around their school to test the following hypotheses: Hypothesis 1: Temperatures are higher nearer to buildings and decrease away from buildings. Hypothesis 2: The wind speed decreases as the distance from the buildings increases. To test Hypothesis 1 the students used a digital thermometer. This instrument is shown in Fig. 2.3 (Insert). They selected seven sites around the school campus and recorded the temperature at each site. The sites are shown on Fig. 2.2 and Fig. 2.4 (Insert). (i) What are three advantages of using the digital thermometer over a traditional thermometer? 1 ........................................................................................................................................ ........................................................................................................................................... 2 ........................................................................................................................................ ........................................................................................................................................... 3 ........................................................................................................................................ ..................................................................................................................................... [3] (ii) Why is it important that the students measured the temperature at the seven different sites at the same time of day? ........................................................................................................................................... ..................................................................................................................................... [1] (d) The temperatures recorded at the seven sites are shown in Table 2.1 (Insert). Which one of the following is the correct conclusion to Hypothesis 1: Temperatures are higher nearer to buildings and decrease away from buildings? Tick (3) your decision below and support it with evidence from Fig. 2.4 and Table 2.1 (Insert). conclusion tick (3) Hypothesis 1 is true. Hypothesis 1 is partly true. Hypothesis 1 is false. ................................................................................................................................................... ................................................................................................................................................... ................................................................................................................................................... ................................................................................................................................................... ............................................................................................................................................. [3] (e) To test Hypothesis 2: The wind speed decreases as the distance from the buildings increases, the students used the weather instrument shown in Fig. 2.5 (Insert). (i) Identify this instrument in the table below. Tick (3) your choice. tick (3) anemometer barometer clinometer hygrometer seismometer [1] (ii) The results of the wind speed measurements are shown in Table 2.2 (Insert). Plot the wind speed at site 5 on Fig. 2.6 opposite. [1]
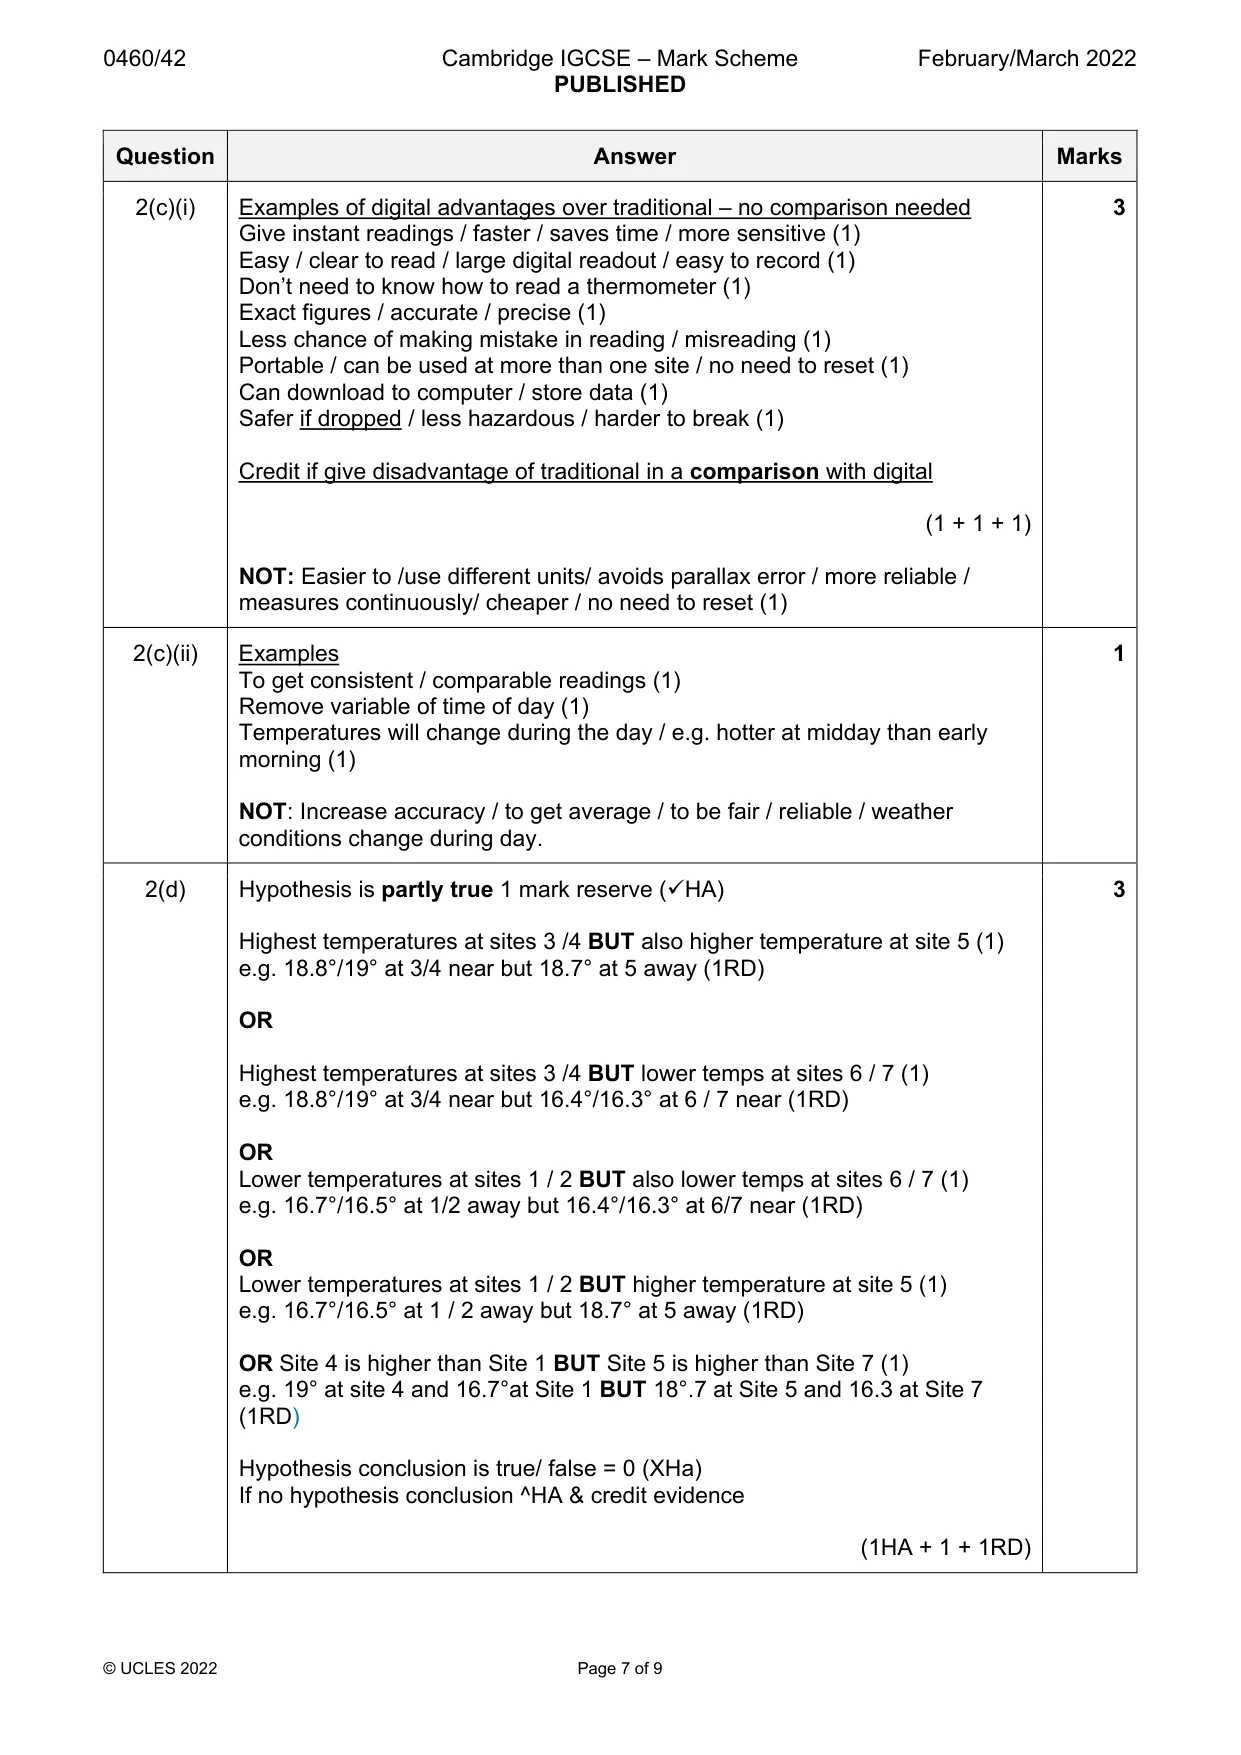
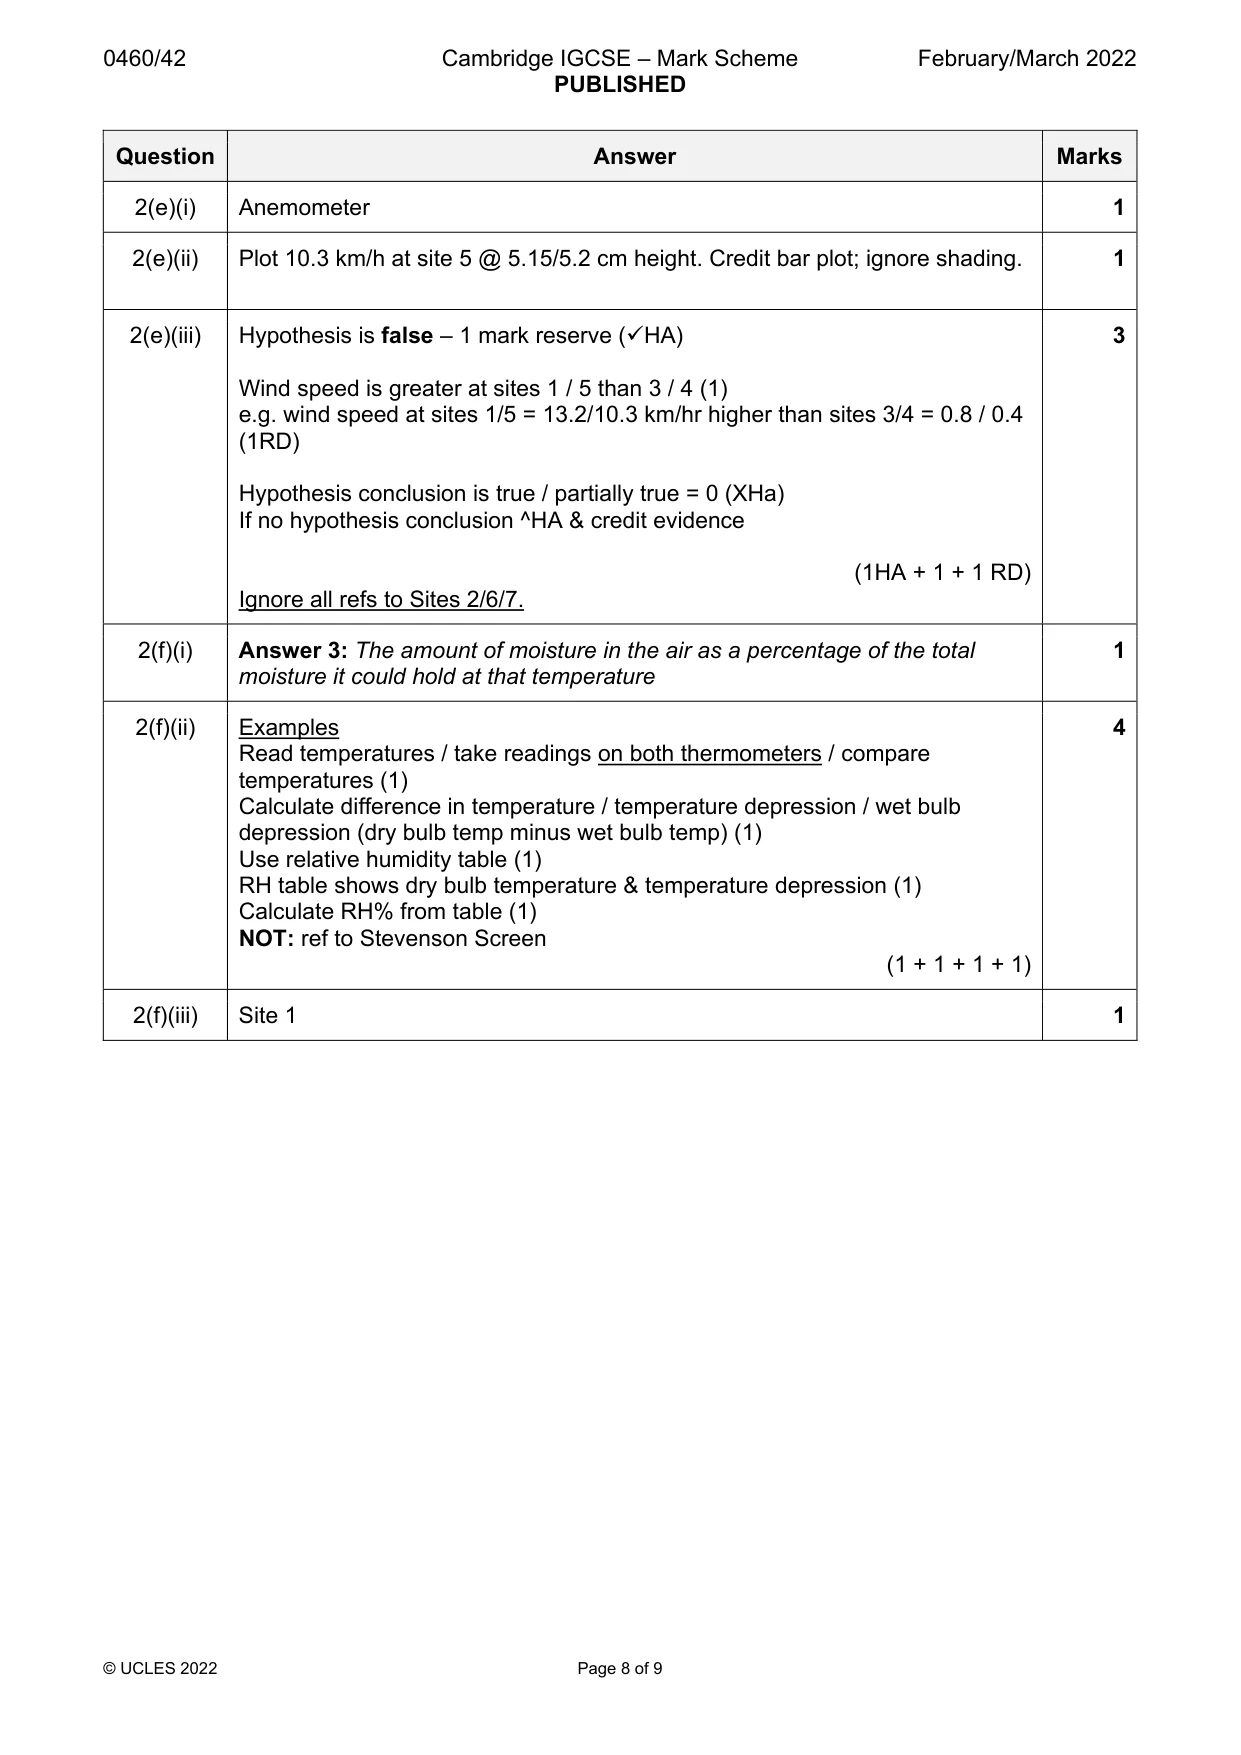
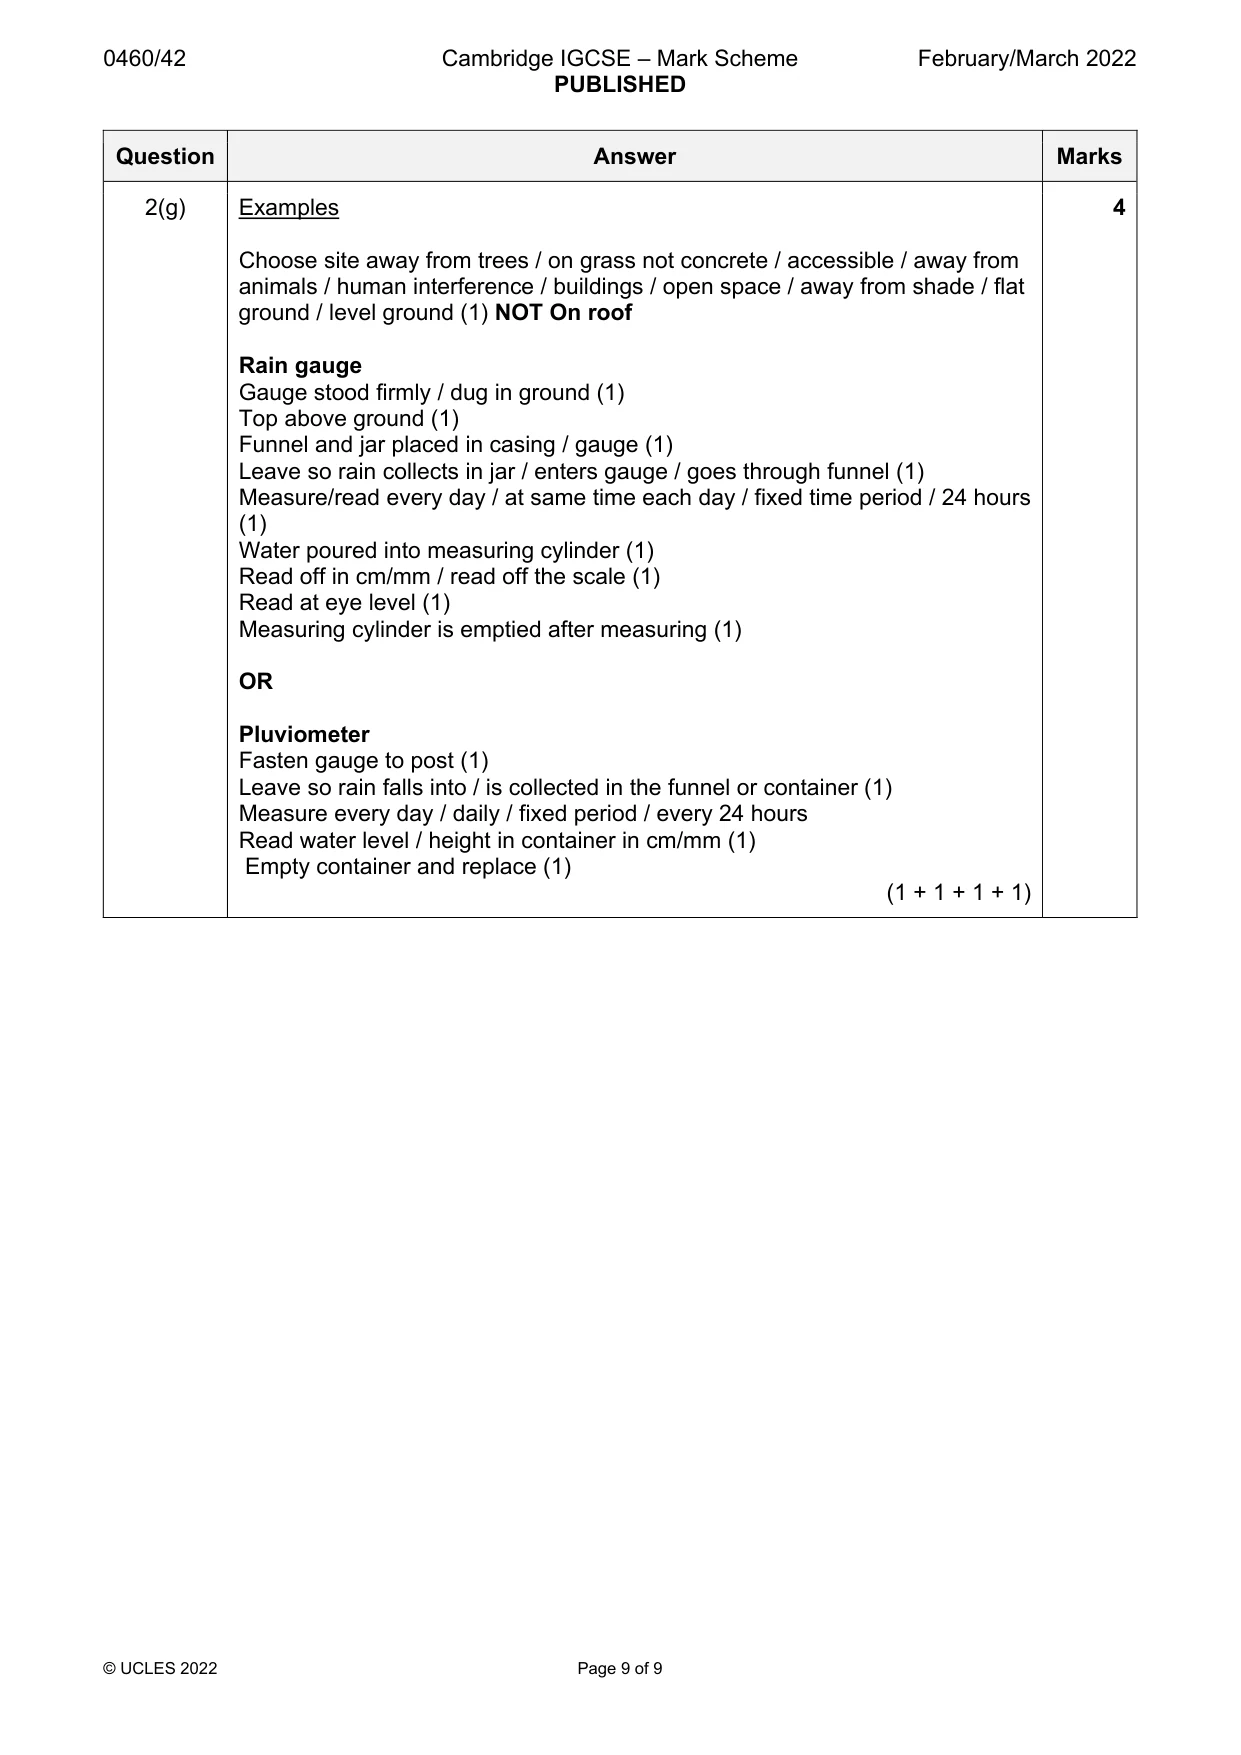
Mark scheme: 2(a)(i) Painted white: To reflect heat/light/sun/ reduce direct heating by the sun / 3 heat is not absorbed (1 max) 120cm above ground: Instruments are not affected by heat from the ground / takes temperature of the air (1 max) Gaps in the sides: Air / wind can circulate round the thermometers / air can get in / ventilated (1 max) (1 + 1 + 1) 2(a)(ii) Away from buildings (1) 2 On the grass lawn (1) (1 + 1) 2(b) The playground will be sheltered ....................................... location 3 3 Classrooms will be hotter .................................................. location 4 It will be cool and windy in shade and facing the wind ....... location 7 (1 + 1 + 1) 2(c)(i) Examples of digital advantages over traditional – no comparison needed 3 Give instant readings / faster / saves time / more sensitive (1) Easy / clear to read / large digital readout / easy to record (1) Don’t need to know how to read a thermometer (1) Exact figures / accurate / precise (1) Less chance of making mistake in reading / misreading (1) Portable / can be used at more than one site / no need to reset (1) Can download to computer / store data (1) Safer if dropped / less hazardous / harder to break (1) Credit if give disadvantage of traditional in a comparison with digital (1 + 1 + 1) NOT: Easier to /use different units/ avoids parallax error / more reliable / measures continuously/ cheaper / no need to reset (1) 2(c)(ii) Examples 1 To get consistent / comparable readings (1) Remove variable of time of day (1) Temperatures will change during the day / e.g. hotter at midday than early morning (1) NOT: Increase accuracy / to get average / to be fair / reliable / weather conditions change during day. 2(d) Hypothesis is partly true 1 mark reserve (HA) 3 Highest temperatures at sites 3 /4 BUT also higher temperature at site 5 (1) e.g. 18.8°/19° at 3/4 near but 18.7° at 5 away (1RD) OR Highest temperatures at sites 3 /4 BUT lower temps at sites 6 / 7 (1) e.g. 18.8°/19° at 3/4 near but 16.4°/16.3° at 6 / 7 near (1RD) OR Lower temperatures at sites 1 / 2 BUT also lower temps at sites 6 / 7 (1) e.g. 16.7°/16.5° at 1/2 away but 16.4°/16.3° at 6/7 near (1RD) OR Lower temperatures at sites 1 / 2 BUT higher temperature at site 5 (1) e.g. 16.7°/16.5° at 1 / 2 away but 18.7° at 5 away (1RD) OR Site 4 is higher than Site 1 BUT Site 5 is higher than Site 7 (1) e.g. 19° at site 4 and 16.7°at Site 1 BUT 18°.7 at Site 5 and 16.3 at Site 7 (1RD) Hypothesis conclusion is true/ false = 0 (XHa) If no hypothesis conclusion ^HA & credit evidence (1HA + 1 + 1RD) 2(e)(i) Anemometer 1 2(e)(ii) Plot 10.3 km/h at site 5 @ 5.15/5.2 cm height. Credit bar plot; ignore shading. 1 2(e)(iii) Hypothesis is false – 1 mark reserve (HA) 3 Wind speed is greater at sites 1 / 5 than 3 / 4 (1) e.g. wind speed at sites 1/5 = 13.2/10.3 km/hr higher than sites 3/4 = 0.8 / 0.4 (1RD) Hypothesis conclusion is true / partially true = 0 (XHa) If no hypothesis conclusion ^HA & credit evidence (1HA + 1 + 1 RD) Ignore all refs to Sites 2/6/7. 2(f)(i) Answer 3: The amount of moisture in the air as a percentage of the total 1 moisture it could hold at that temperature 2(f)(ii) Examples 4 Read temperatures / take readings on both thermometers / compare temperatures (1) Calculate difference in temperature / temperature depression / wet bulb depression (dry bulb temp minus wet bulb temp) (1) Use relative humidity table (1) RH table shows dry bulb temperature & temperature depression (1) Calculate RH% from table (1) NOT: ref to Stevenson Screen (1 + 1 + 1 + 1) 2(f)(iii) Site 1 1 2(g) Examples 4 Choose site away from trees / on grass not concrete / accessible / away from animals / human interference / buildings / open space / away from shade / flat ground / level ground (1) NOT On roof Rain gauge Gauge stood firmly / dug in ground (1) Top above ground (1) Funnel and jar placed in casing / gauge (1) Leave so rain collects in jar / enters gauge / goes through funnel (1) Measure/read every day / at same time each day / fixed time period / 24 hours (1) Water poured into measuring cylinder (1) Read off in cm/mm / read off the scale (1) Read at eye level (1) Measuring cylinder is emptied after measuring (1) OR Pluviometer Fasten gauge to post (1) Leave so rain falls into / is collected in the funnel or container (1) Measure every day / daily / fixed period / every 24 hours Read water level / height in container in cm/mm (1) Empty container and replace (1) (1 + 1 + 1 + 1)
What was in this paper
The subtopics covered by these 2 questions, and how many questions each got. Open one in a new tab to see every Cambridge question on it.
What you needed in this session
Cambridge’s own grade thresholds for 2022 Feb/March, Paper 4 · Variant 2. A higher threshold means an easier paper — the bar moves with how the cohort did.