Cambridge IGCSE Geography 0460 — 2021 May/June Paper 1 · Variant 1
0460/11/M/J/21 · 75 marks · ≈84 min
The question paper and its mark scheme, free to read here and free to download. This is Cambridge’s own paper, exactly as it was sat.
Question paper32 pages





Mark scheme19 pages
Answers below. Sit the paper first if you are practising.
Paper as text
Question paper, page 1
This document has 32 pages. Any blank pages are indicated. Cambridge IGCSE™ GEOGRAPHY 0460/11 Paper 1 Geographical Themes May/June 2021 1 hour 45 minutes You must answer on the question paper. You will need: Insert (enclosed) Calculator Ruler INSTRUCTIONS ● Answer three questions in total, one from each section. ● Use a black or dark blue pen. You may use an HB pencil for any diagrams or graphs. ● Write your name, centre number and candidate number in the boxes at the top of the page. ● Write your answer to each question in the space provided. ● Do not use an erasable pen or correction fluid. ● Do not write on any bar codes. ● If additional space is needed, you should use the lined pages at the end of this booklet; the question number or numbers must be clearly shown. INFORMATION ● The total mark for this paper is 75. ● The number of marks for each question or part question is shown in brackets [ ]. ● The insert contains additional resources referred to in the questions. Definitions MEDCs – More Economically Developed Countries LEDCs – Less Economically Developed Countries DC (ST/CT) 197854/6 © UCLES 2021 [Turn over * 9 1 7 0 7 0 3 3 4 7 *
Question paper, page 2
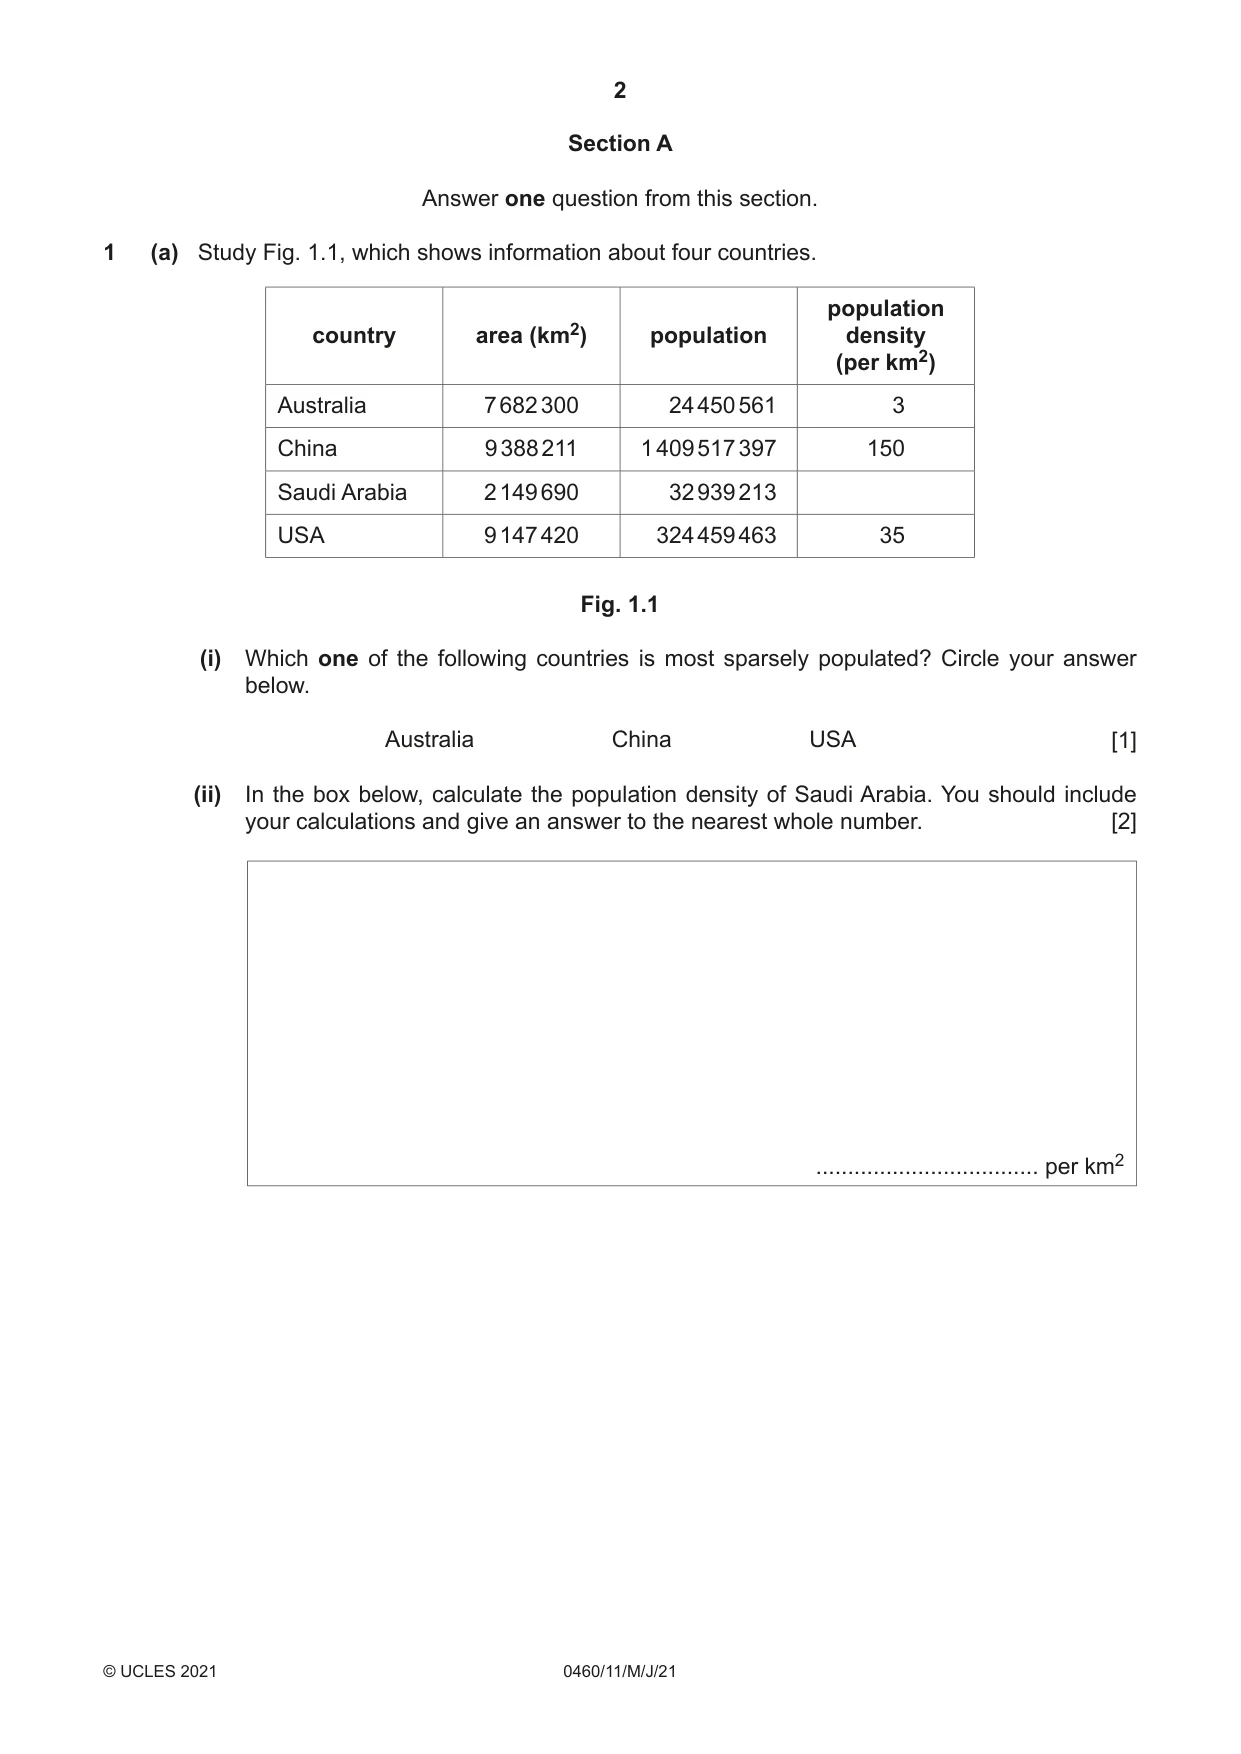
2 0460/11/M/J/21 © UCLES 2021 Section A Answer one question from this section. 1 (a) Study Fig. 1.1, which shows information about four countries. country area (km2) population population density (per km2) Australia 7 682 300 24 450 561 3 China 9 388 211 1 409 517 397 150 Saudi Arabia 2 149 690 32 939 213 USA 9 147 420 324 459 463 35 Fig. 1.1 (i) Which one of the following countries is most sparsely populated? Circle your answer below. Australia China USA [1] (ii) In the box below, calculate the population density of Saudi Arabia. You should include your calculations and give an answer to the nearest whole number. [2] … per km2
Question paper, page 3
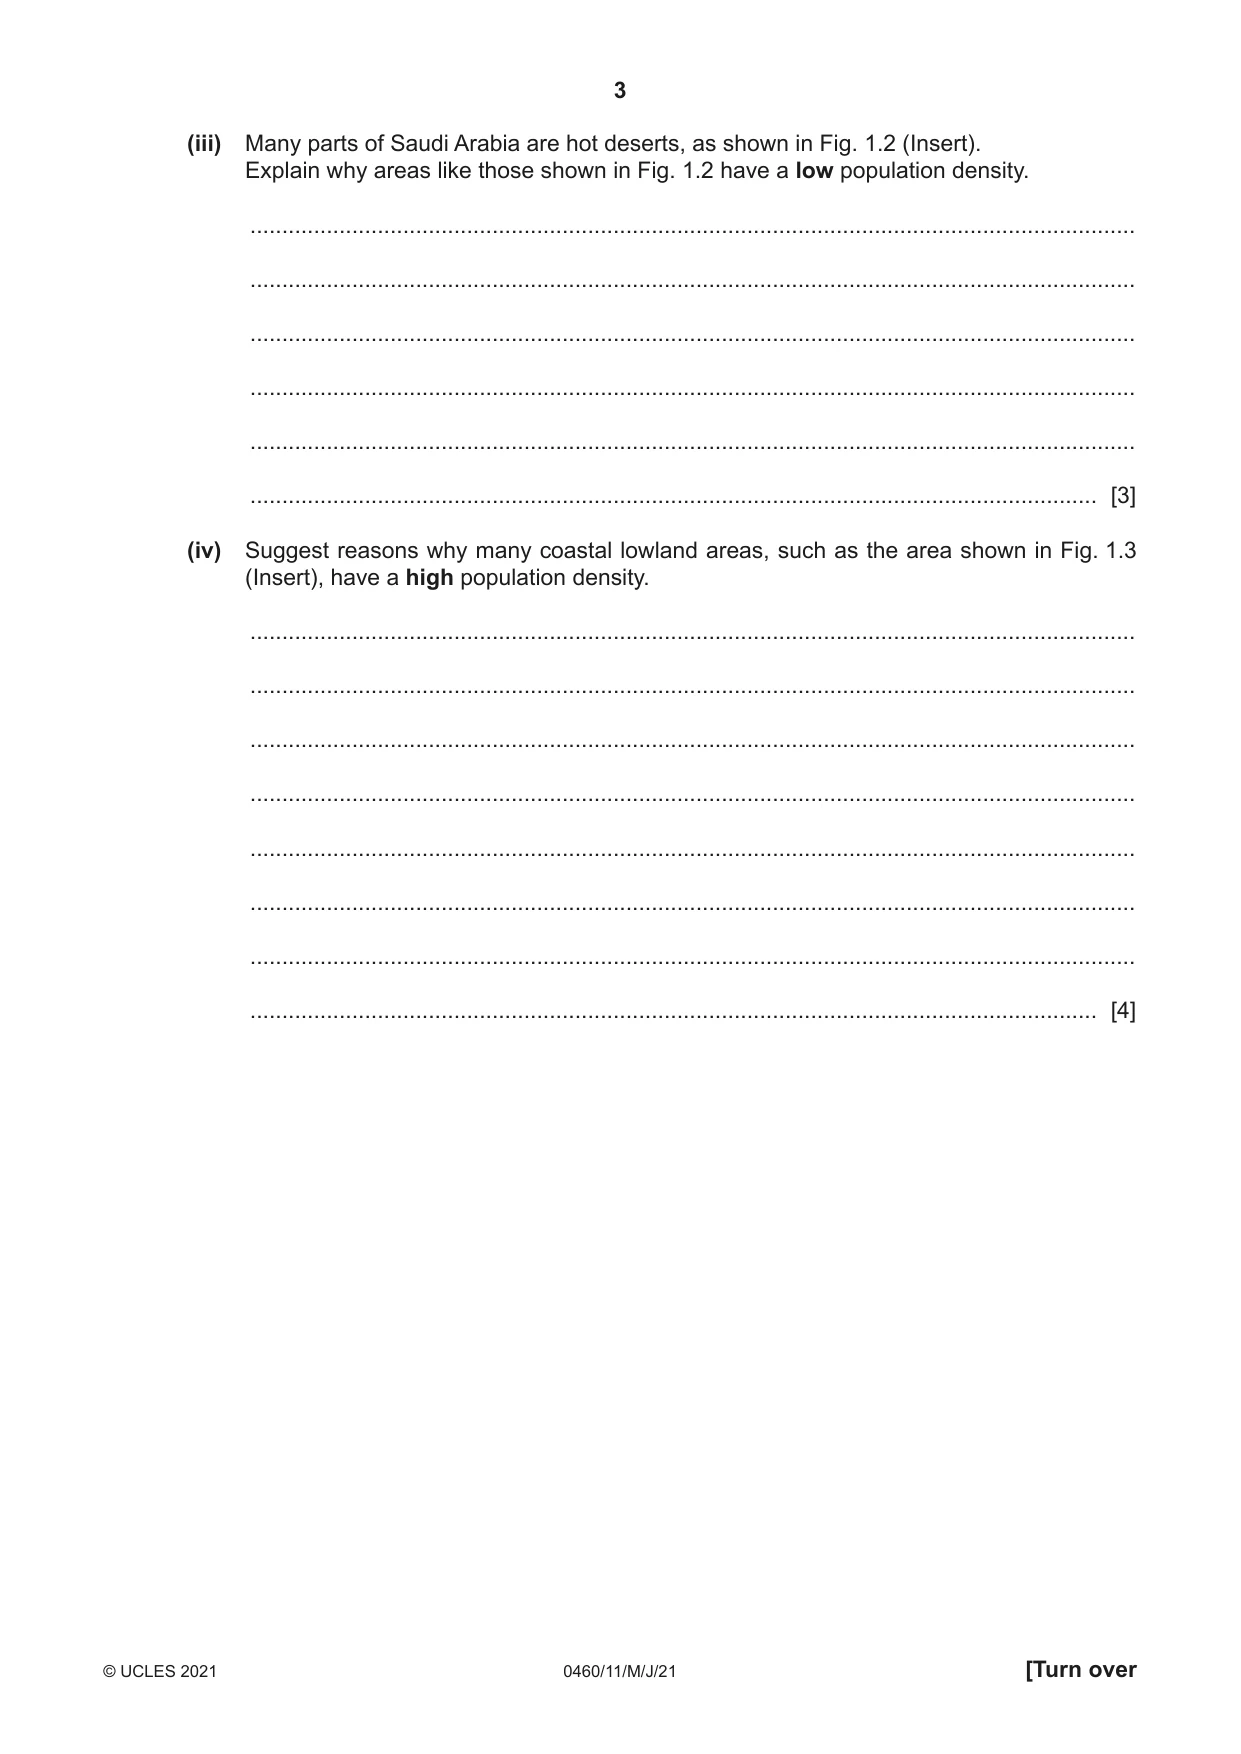
3 0460/11/M/J/21 © UCLES 2021 [Turn over (iii) Many parts of Saudi Arabia are hot deserts, as shown in Fig. 1.2 (Insert). Explain why areas like those shown in Fig. 1.2 have a low population density. … … … … … … [3] (iv) Suggest reasons why many coastal lowland areas, such as the area shown in Fig. 1.3 (Insert), have a high population density. … … … … … … … … [4]
Question paper, page 4
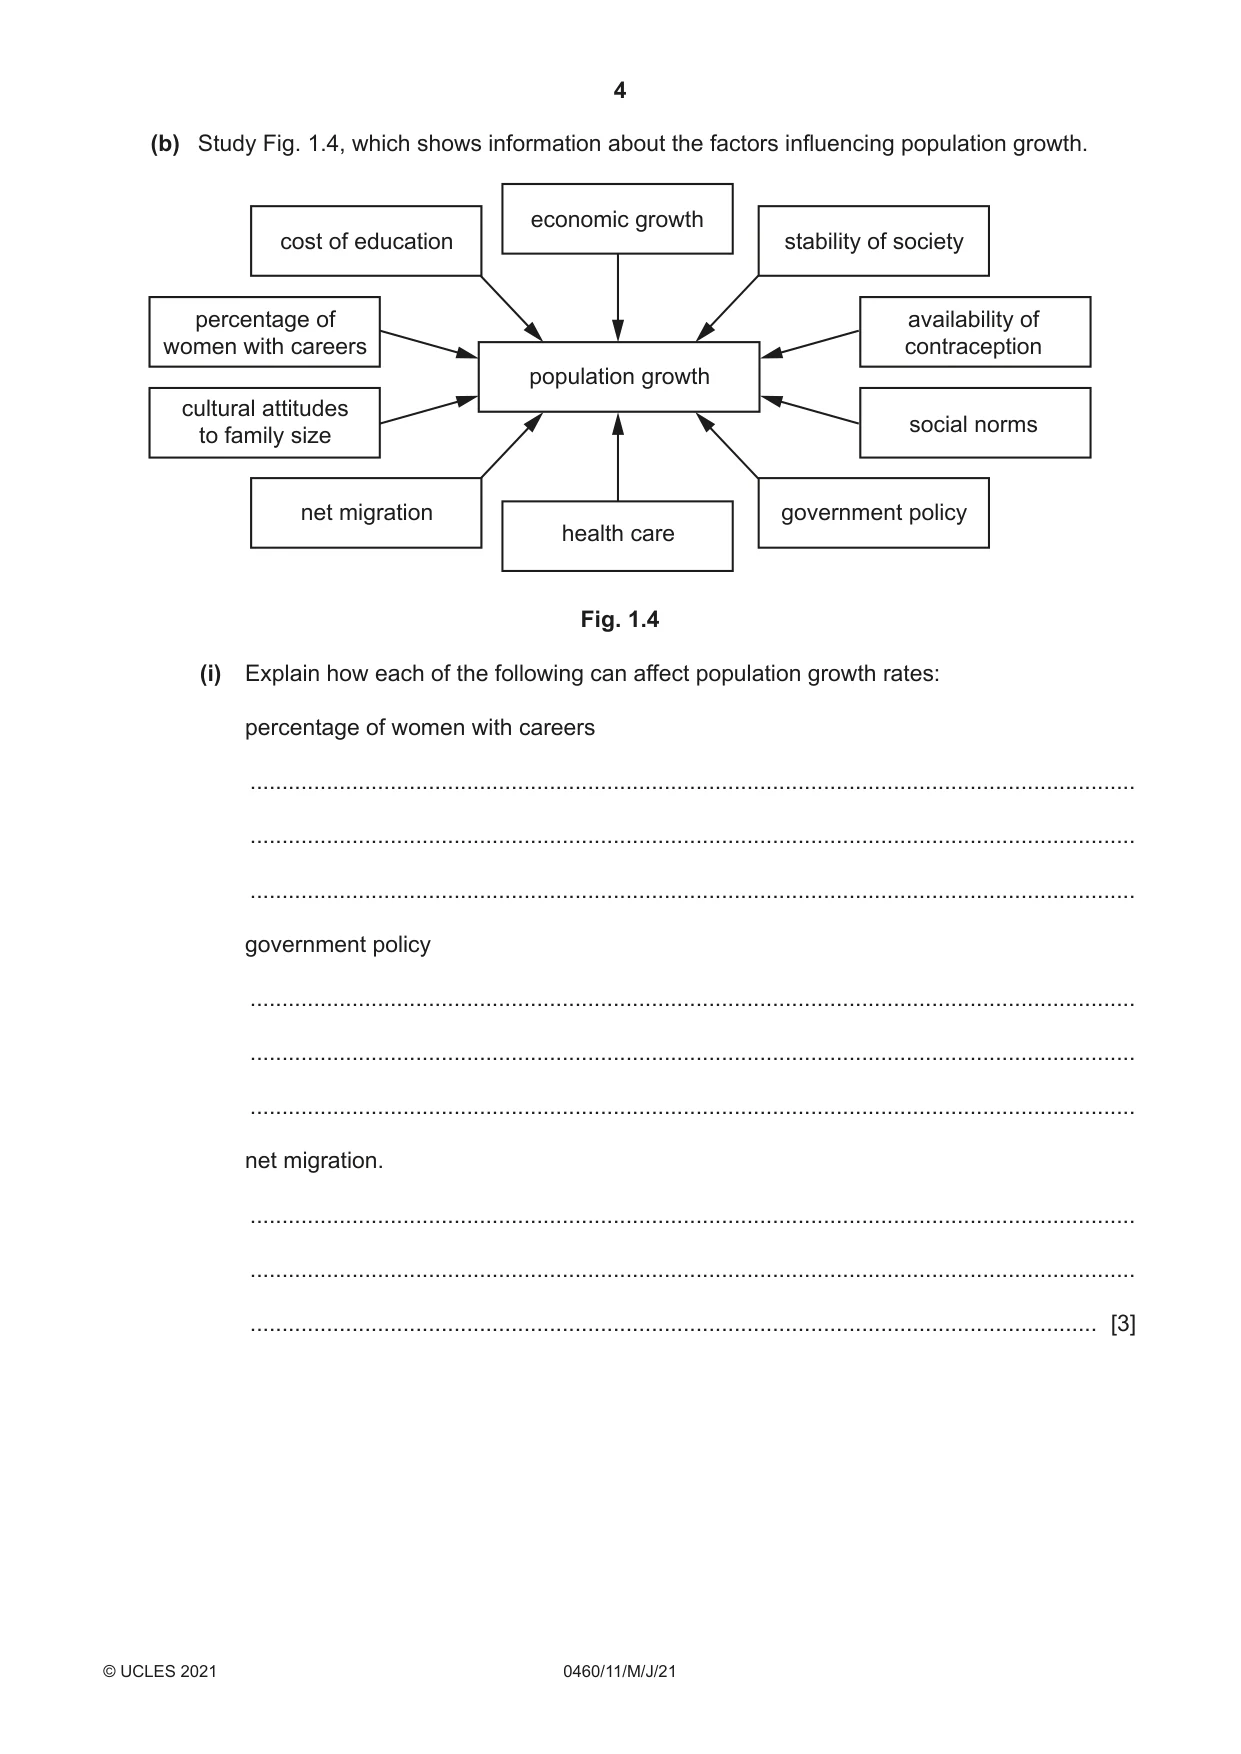
4 0460/11/M/J/21 © UCLES 2021 (b) Study Fig. 1.4, which shows information about the factors influencing population growth. population growth economic growth health care cost of education percentage of women with careers cultural attitudes to family size net migration stability of society availability of contraception social norms government policy Fig. 1.4 (i) Explain how each of the following can affect population growth rates: percentage of women with careers … … … government policy … … … net migration. … … … [3]
Question paper, page 5
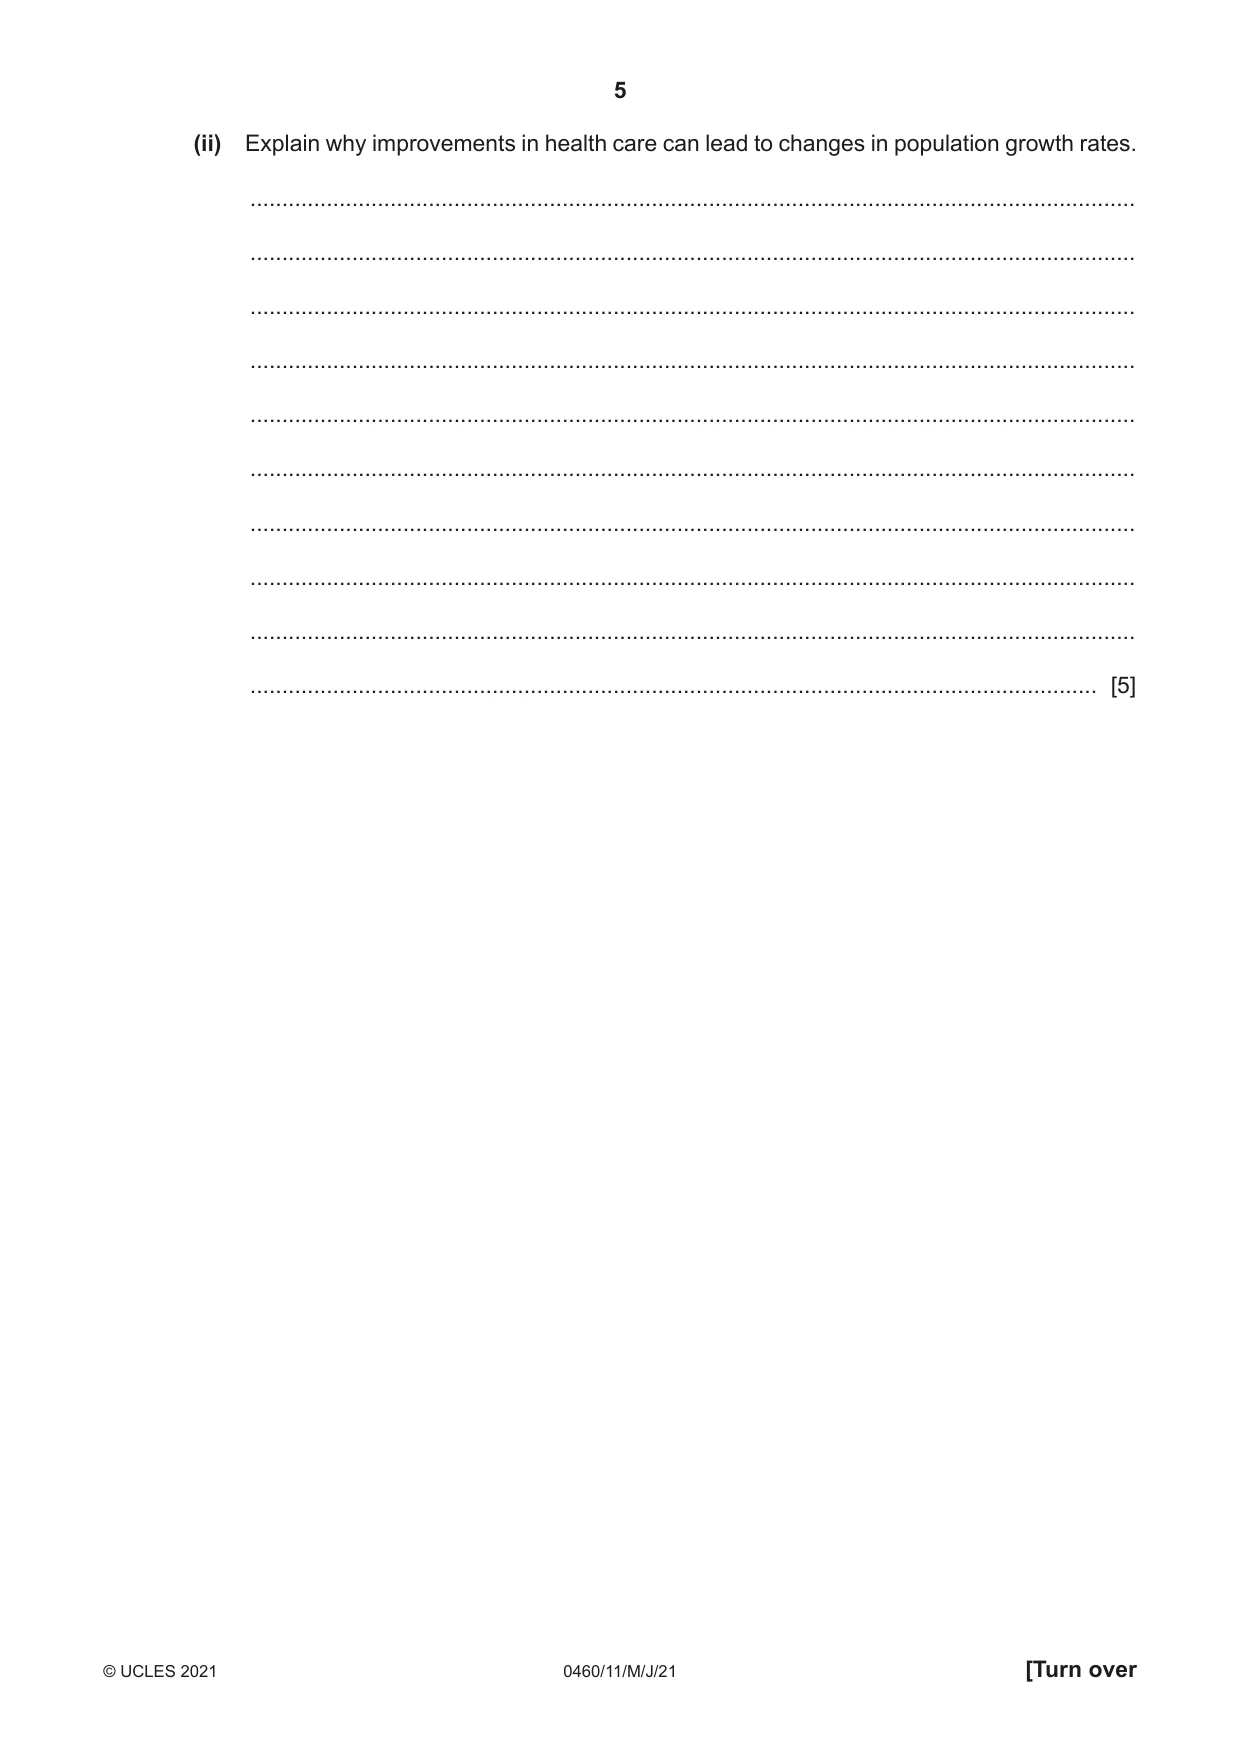
5 0460/11/M/J/21 © UCLES 2021 [Turn over (ii) Explain why improvements in health care can lead to changes in population growth rates. … … … … … … … … … … [5]
Question paper, page 6
6 0460/11/M/J/21 © UCLES 2021 (c) For a named country you have studied, describe the problems which have been caused by a rapid growth in its population. Country … … … … … … … … … … … … … … … … … … … … … … … … … [7] [Total: 25]
Question paper, page 7
7 0460/11/M/J/21 © UCLES 2021 [Turn over TURN PAGE FOR QUESTION 2
Question paper, page 8
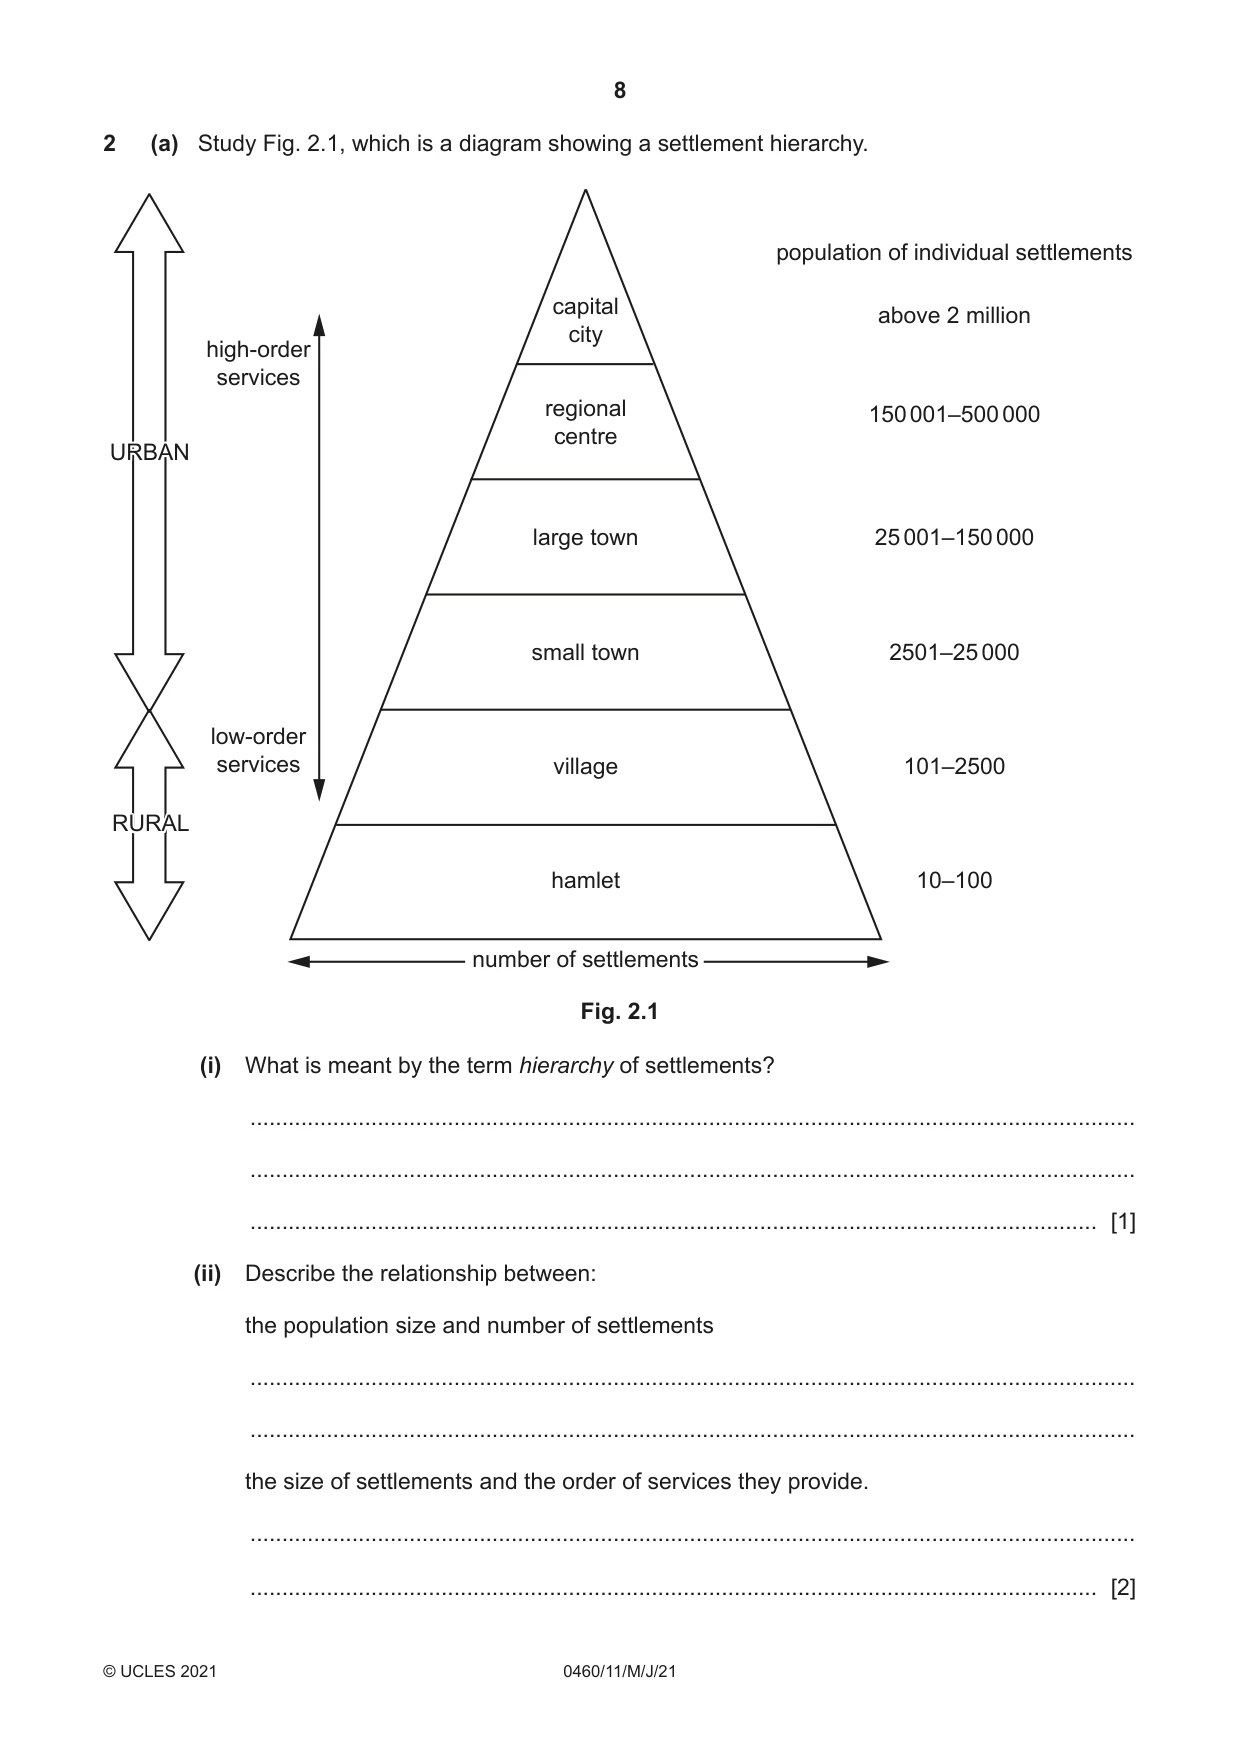
8 0460/11/M/J/21 © UCLES 2021 2 (a) Study Fig. 2.1, which is a diagram showing a settlement hierarchy. hamlet number of settlements village small town large town regional centre capital city 10–100 101–2500 2501–25 000 25 001–150 000 150 001–500 000 above 2 million population of individual settlements high-order services low order services URBAN RURAL low-order services URBAN RURAL Fig. 2.1 (i) What is meant by the term hierarchy of settlements? … … … [1] (ii) Describe the relationship between: the population size and number of settlements … … the size of settlements and the order of services they provide. … … [2]
Question paper, page 9
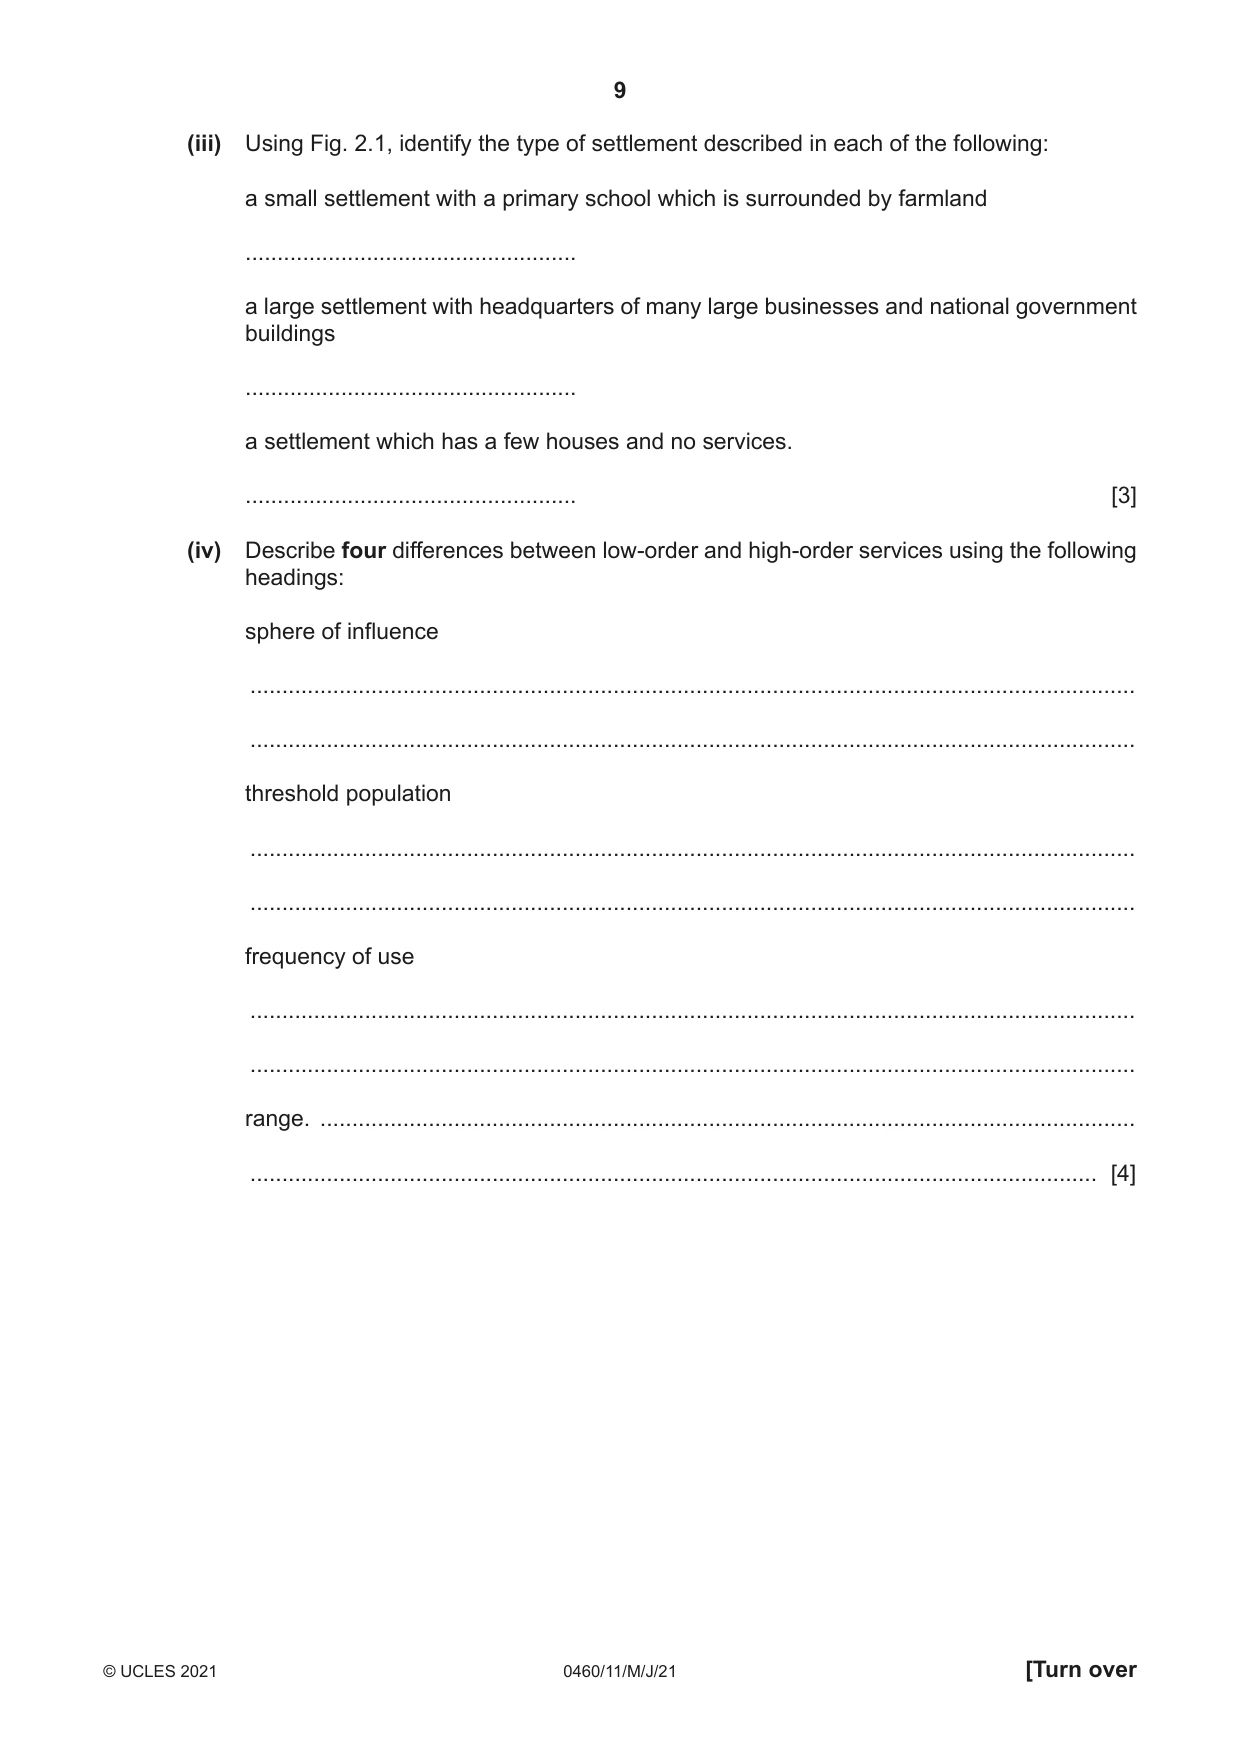
9 0460/11/M/J/21 © UCLES 2021 [Turn over (iii) Using Fig. 2.1, identify the type of settlement described in each of the following: a small settlement with a primary school which is surrounded by farmland … a large settlement with headquarters of many large businesses and national government buildings … a settlement which has a few houses and no services. … [3] (iv) Describe four differences between low-order and high-order services using the following headings: sphere of influence … … threshold population … … frequency of use … … range. … … [4]
Question paper, page 10
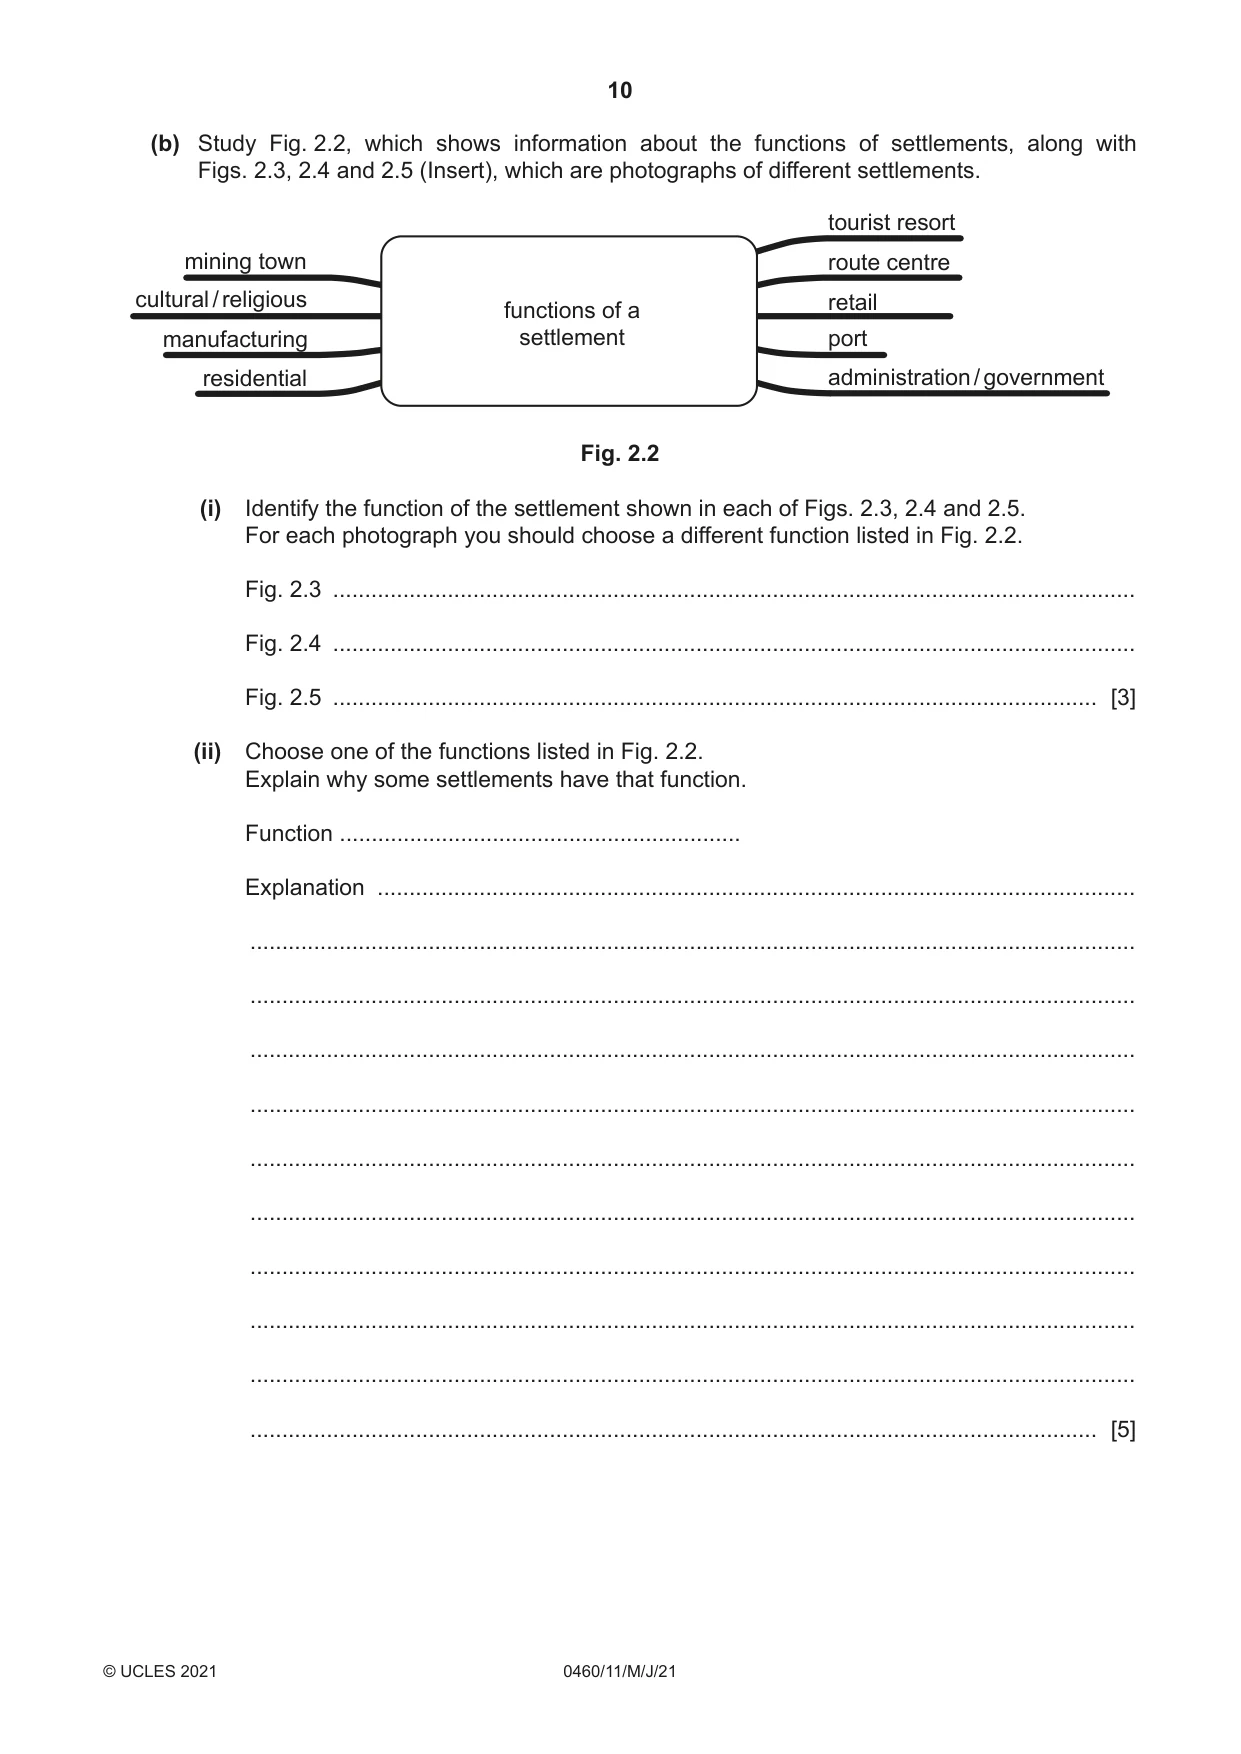
10 0460/11/M/J/21 © UCLES 2021 (b) Study Fig. 2.2, which shows information about the functions of settlements, along with Figs. 2.3, 2.4 and 2.5 (Insert), which are photographs of different settlements. functions of a settlement mining town tourist resort route centre retail port administration / government cultural / religious manufacturing residential Fig. 2.2 (i) Identify the function of the settlement shown in each of Figs. 2.3, 2.4 and 2.5. For each photograph you should choose a different function listed in Fig. 2.2. Fig. 2.3 … Fig. 2.4 … Fig. 2.5 … [3] (ii) Choose one of the functions listed in Fig. 2.2. Explain why some settlements have that function. Function … Explanation … … … … … … … … … … … [5]
Question paper, page 11
11 0460/11/M/J/21 © UCLES 2021 [Turn over (c) For a named urban settlement you have studied, describe the causes and effects of one problem faced by the people living there. Name of settlement … Problem … … … … … … … … … … … … … … … … … … … … … … … … … [7] [Total: 25]
Question paper, page 12
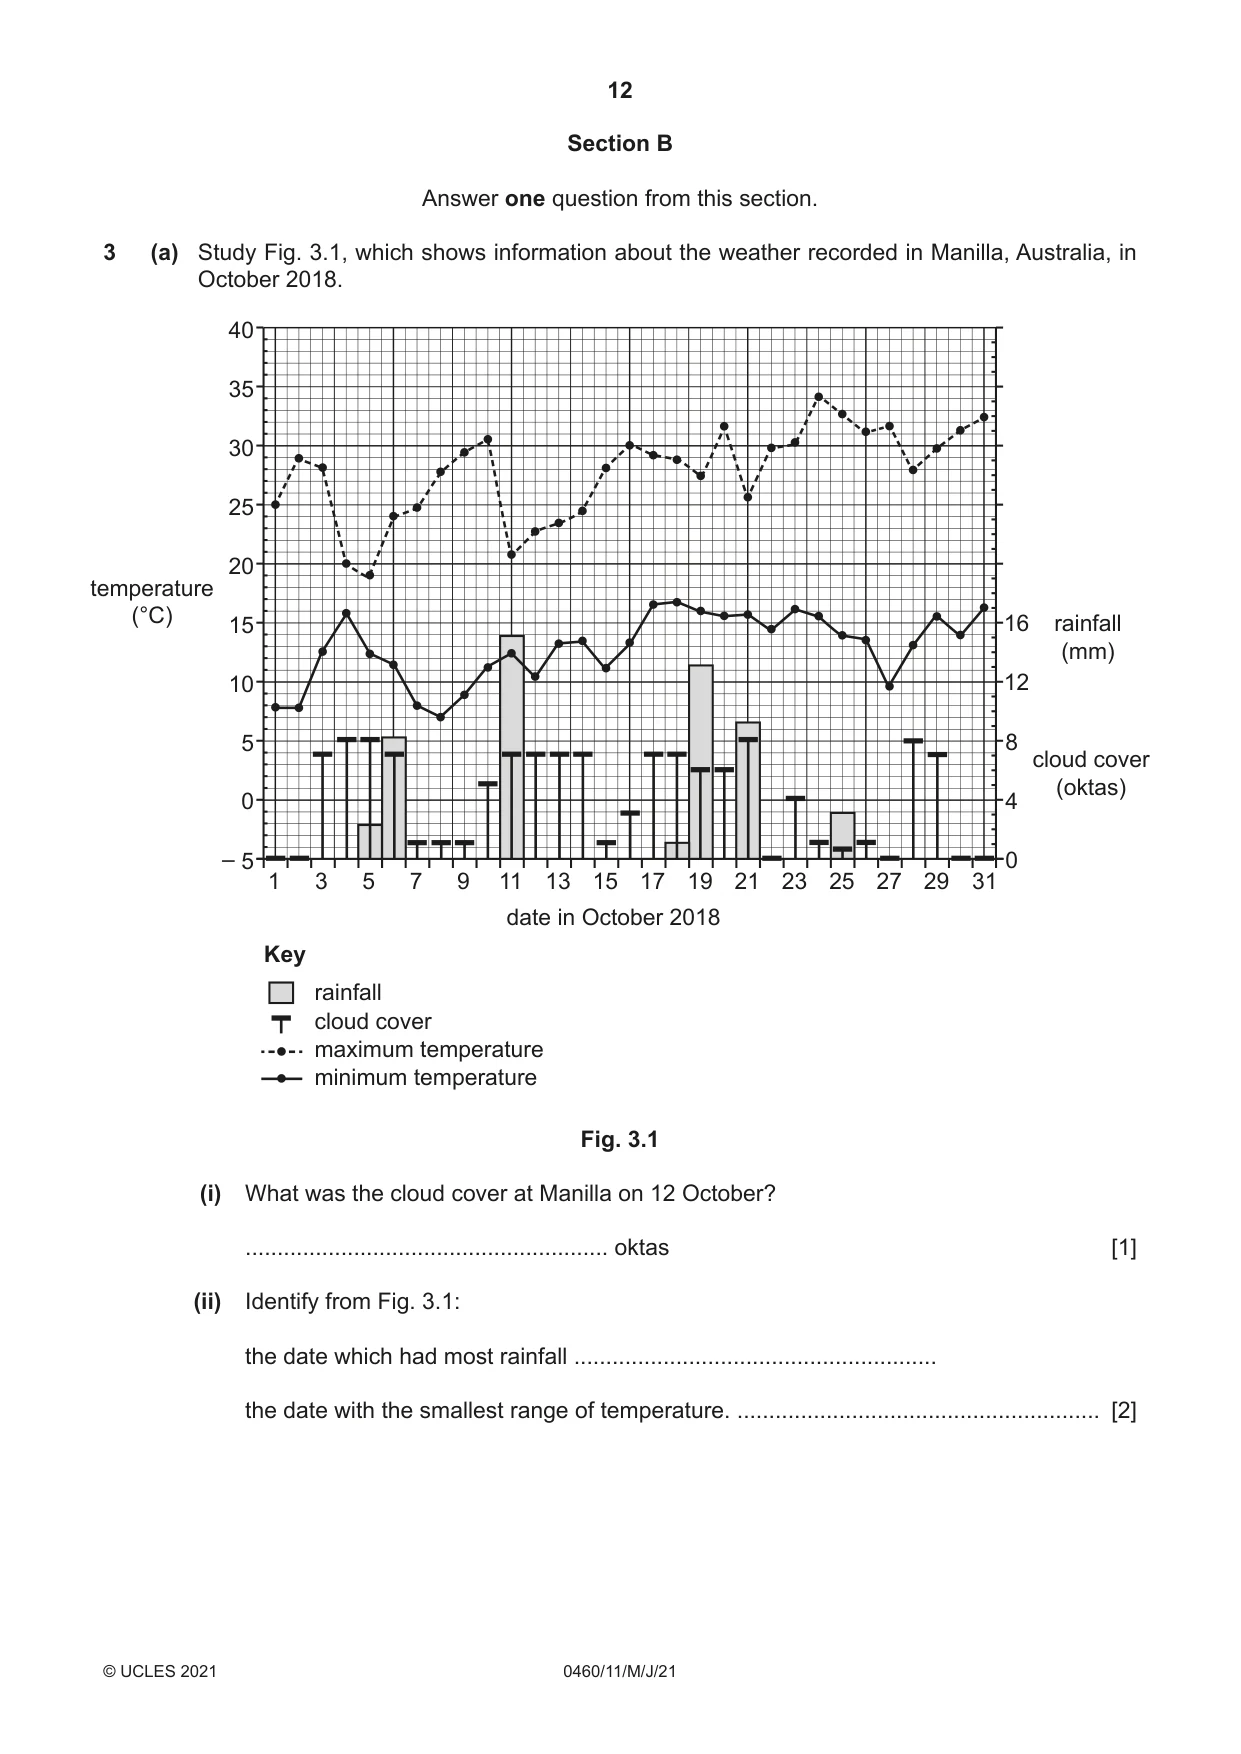
12 0460/11/M/J/21 © UCLES 2021 Section B Answer one question from this section. 3 (a) Study Fig. 3.1, which shows information about the weather recorded in Manilla, Australia, in October 2018. 0 4 8 12 16 rainfall (mm) temperature (°C) cloud cover (oktas) 0 – 5 5 10 15 20 25 30 35 40 1 Key rainfall cloud cover maximum temperature minimum temperature 3 5 7 9 11 13 15 date in October 2018 17 19 21 23 25 27 29 31 Fig. 3.1 (i) What was the cloud cover at Manilla on 12 October? … oktas [1] (ii) Identify from Fig. 3.1: the date which had most rainfall … the date with the smallest range of temperature. … [2]
Question paper, page 13
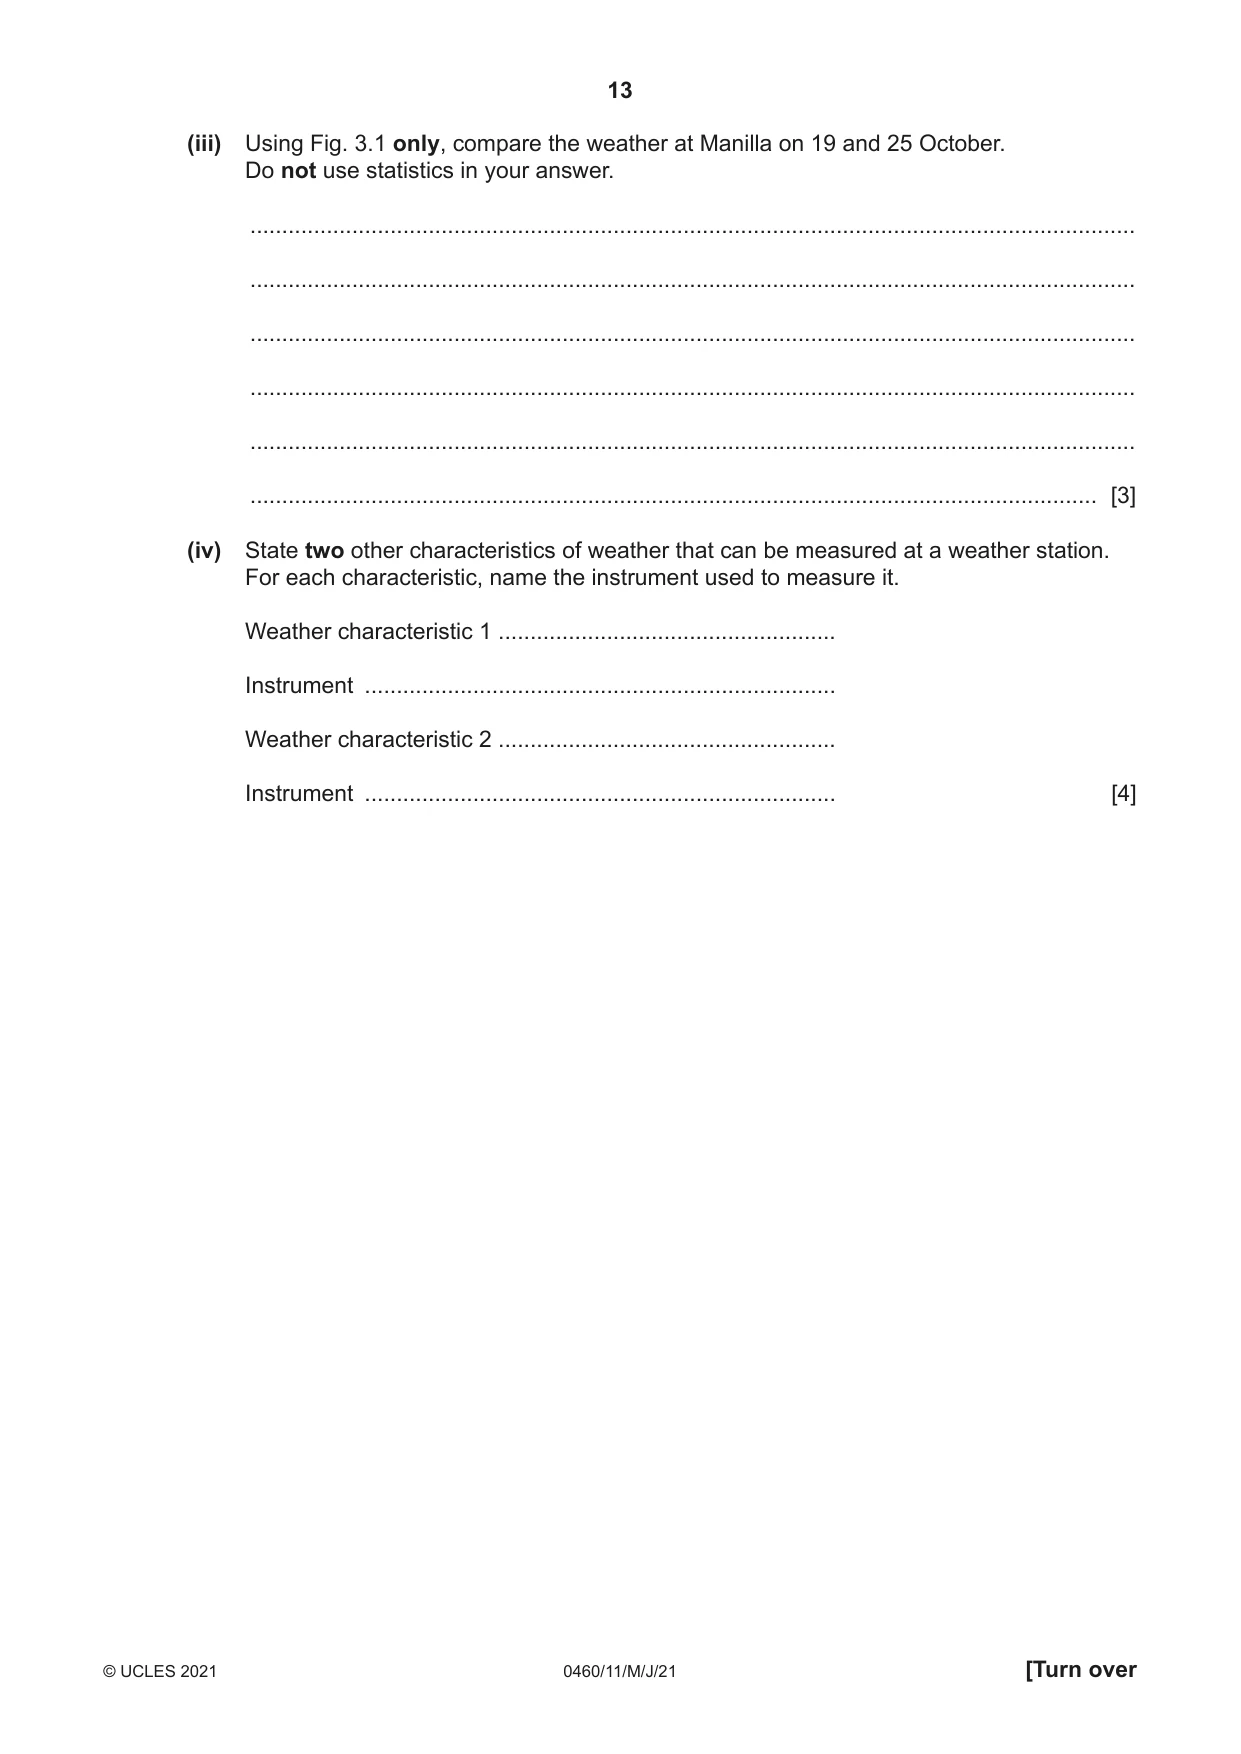
13 0460/11/M/J/21 © UCLES 2021 [Turn over (iii) Using Fig. 3.1 only, compare the weather at Manilla on 19 and 25 October. Do not use statistics in your answer. … … … … … … [3] (iv) State two other characteristics of weather that can be measured at a weather station. For each characteristic, name the instrument used to measure it. Weather characteristic 1 … Instrument … Weather characteristic 2 … Instrument … [4]
Question paper, page 14
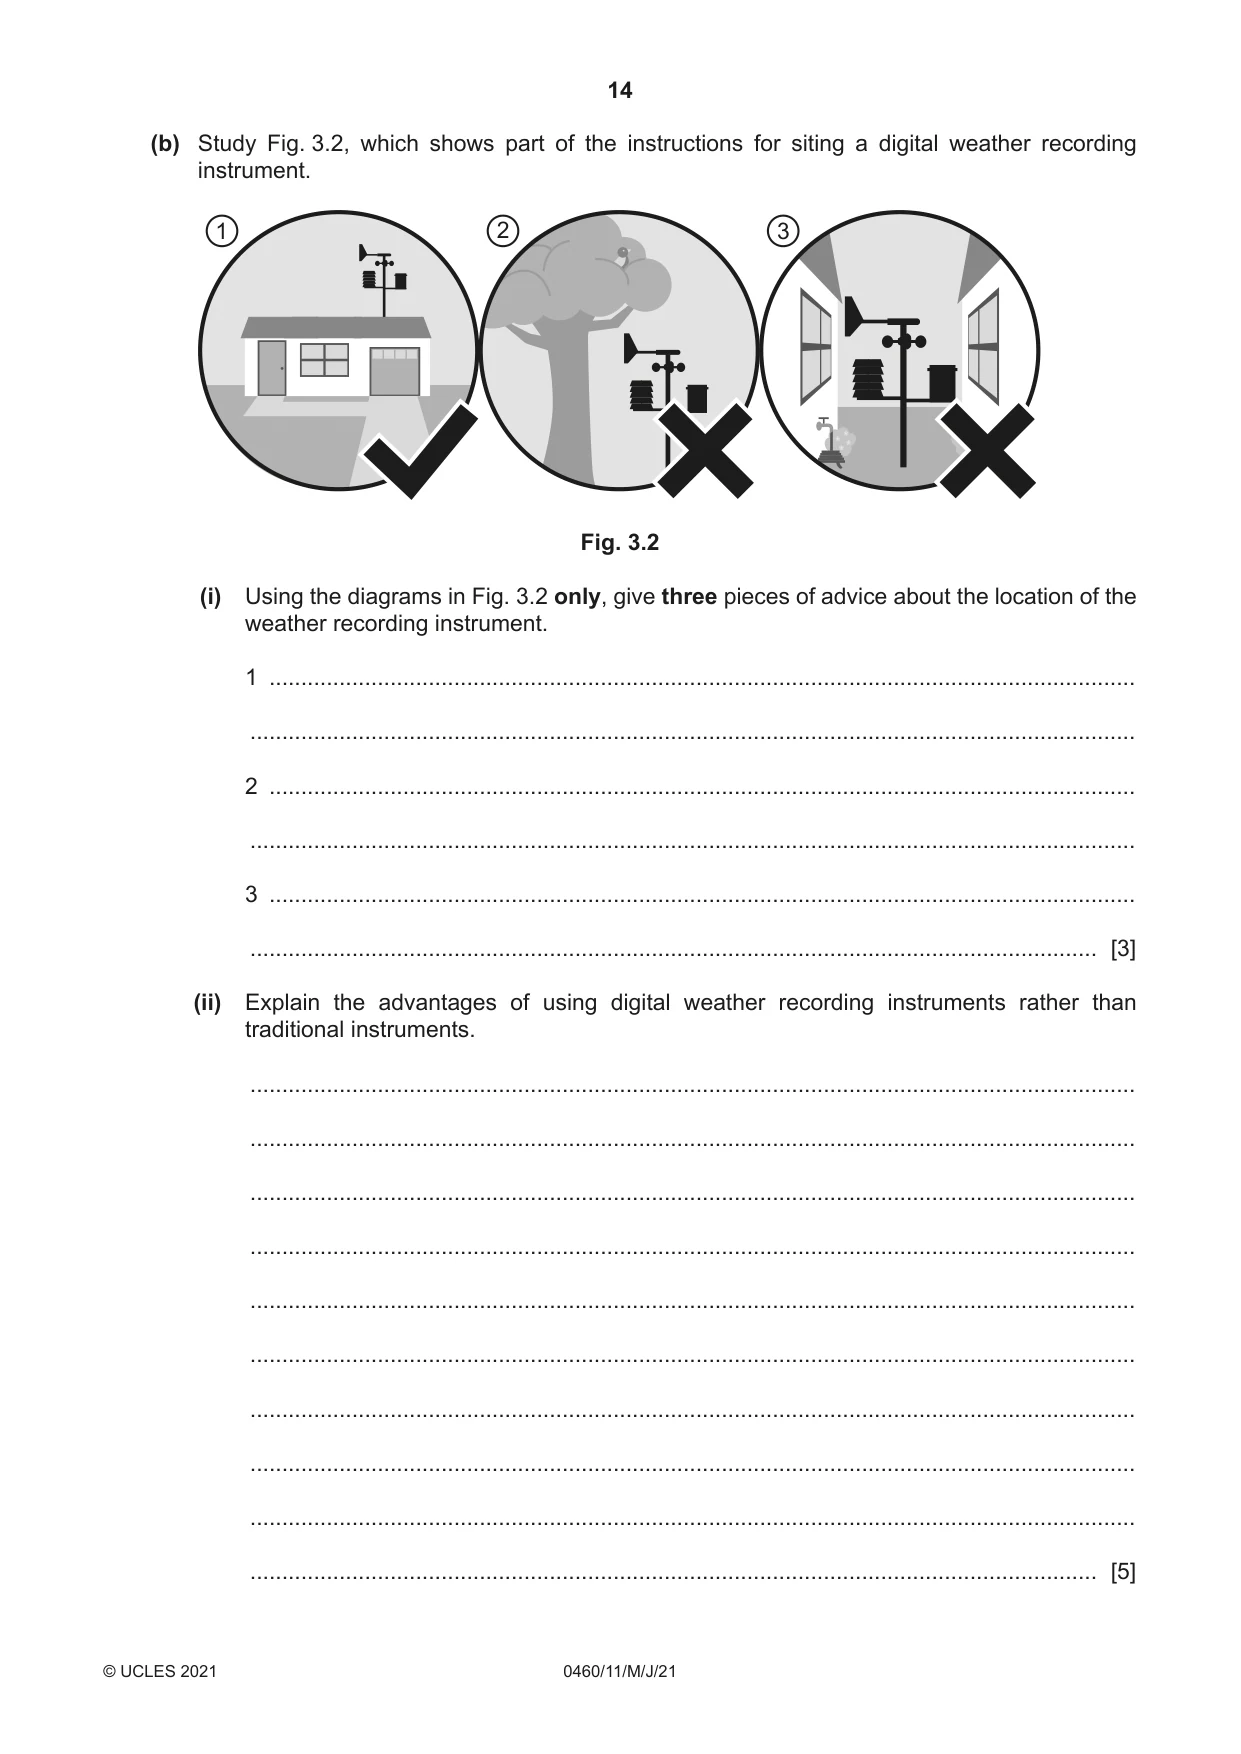
14 0460/11/M/J/21 © UCLES 2021 (b) Study Fig. 3.2, which shows part of the instructions for siting a digital weather recording instrument. 3 2 1 Fig. 3.2 (i) Using the diagrams in Fig. 3.2 only, give three pieces of advice about the location of the weather recording instrument. 1 … … 2 … … 3 … … [3] (ii) Explain the advantages of using digital weather recording instruments rather than traditional instruments. … … … … … … … … … … [5]
Question paper, page 15
15 0460/11/M/J/21 © UCLES 2021 [Turn over (c) For a named river you have studied, explain the causes of flooding. Name of river … … … … … … … … … … … … … … … … … … … … … … … … … … [7] [Total: 25]
Question paper, page 16
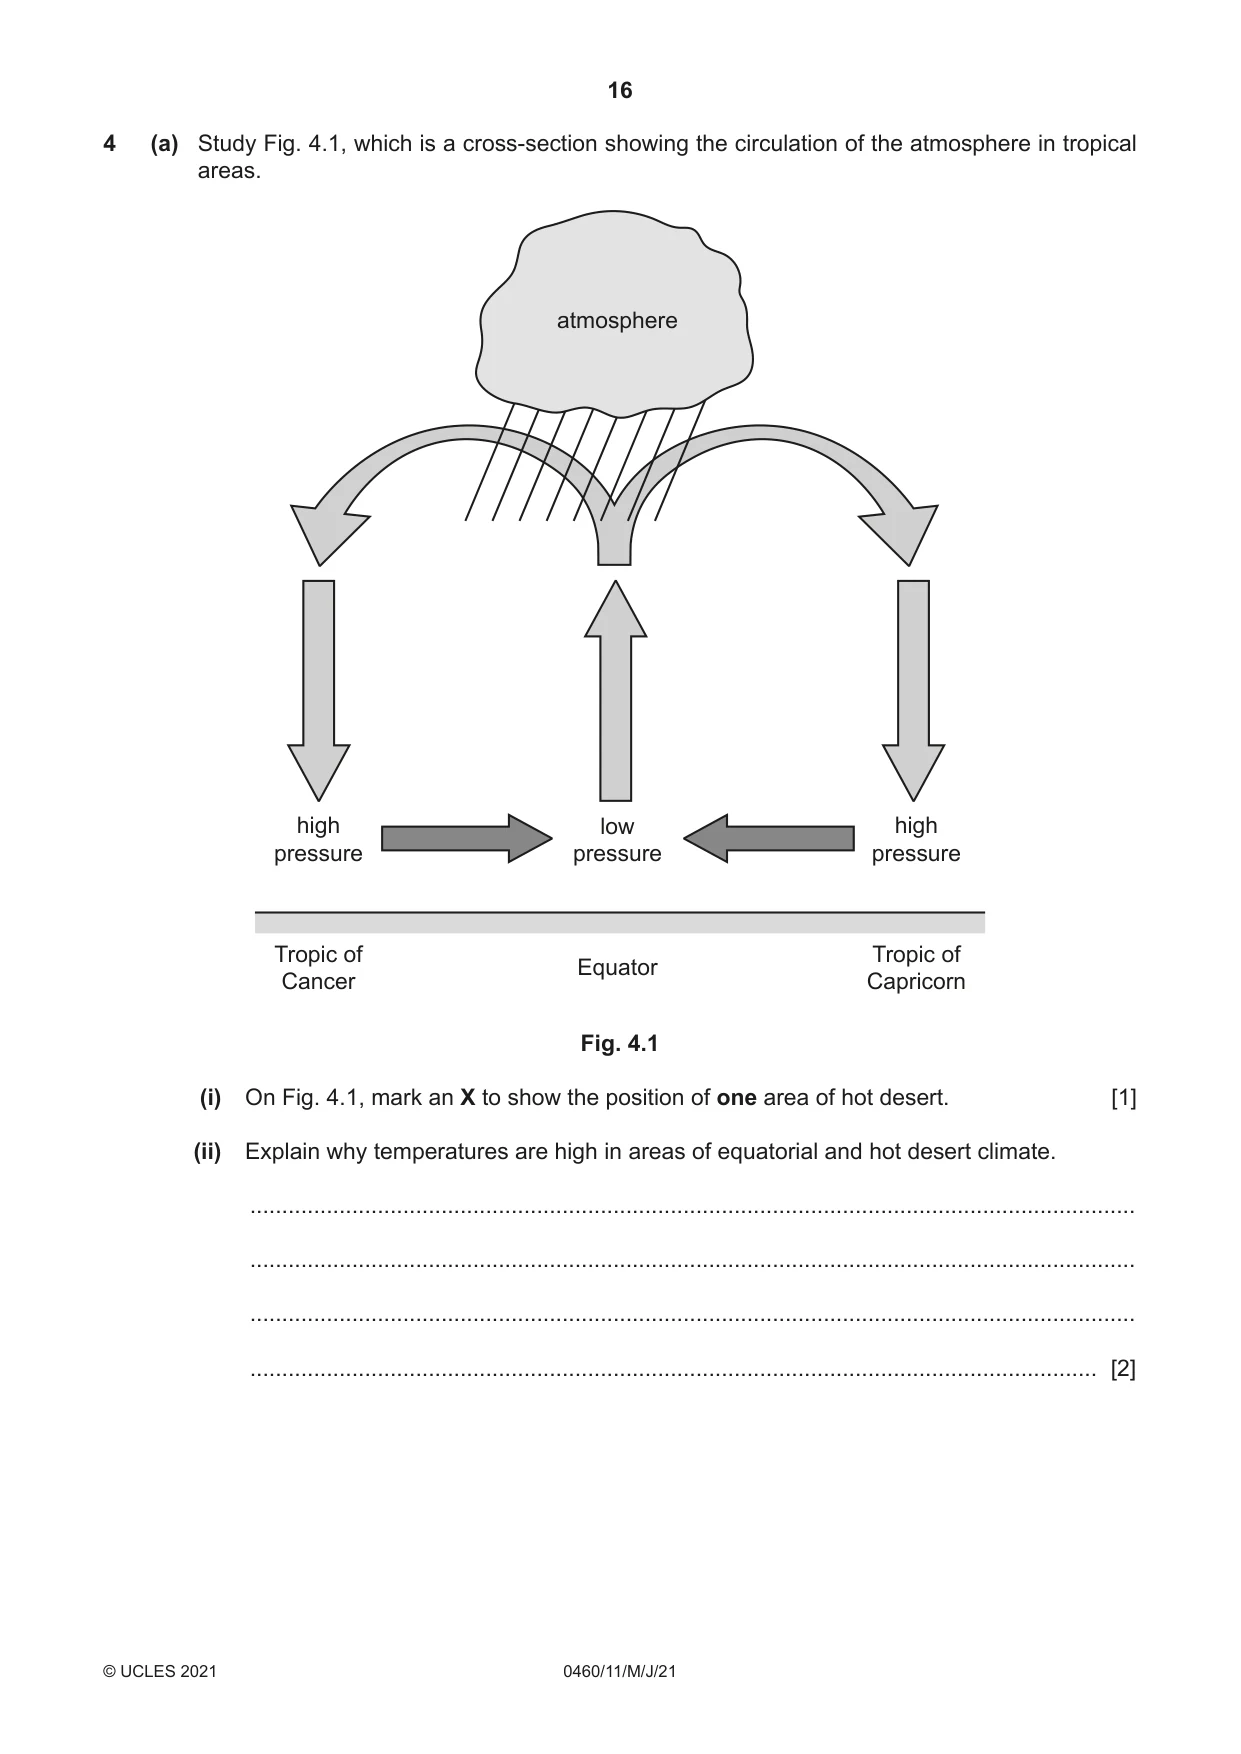
16 0460/11/M/J/21 © UCLES 2021 4 (a) Study Fig. 4.1, which is a cross-section showing the circulation of the atmosphere in tropical areas. Tropic of Cancer Equator Tropic of Capricorn high pressure low pressure high pressure atmosphere Fig. 4.1 (i) On Fig. 4.1, mark an X to show the position of one area of hot desert. [1] (ii) Explain why temperatures are high in areas of equatorial and hot desert climate. … … … … [2]
Question paper, page 17
17 0460/11/M/J/21 © UCLES 2021 [Turn over (iii) Many deserts are inland. Explain why this results in low amounts of rainfall. … … … … … … [3] (iv) Describe the processes which result in large amounts of rainfall in areas of equatorial climate. … … … … … … … … [4]
Question paper, page 18
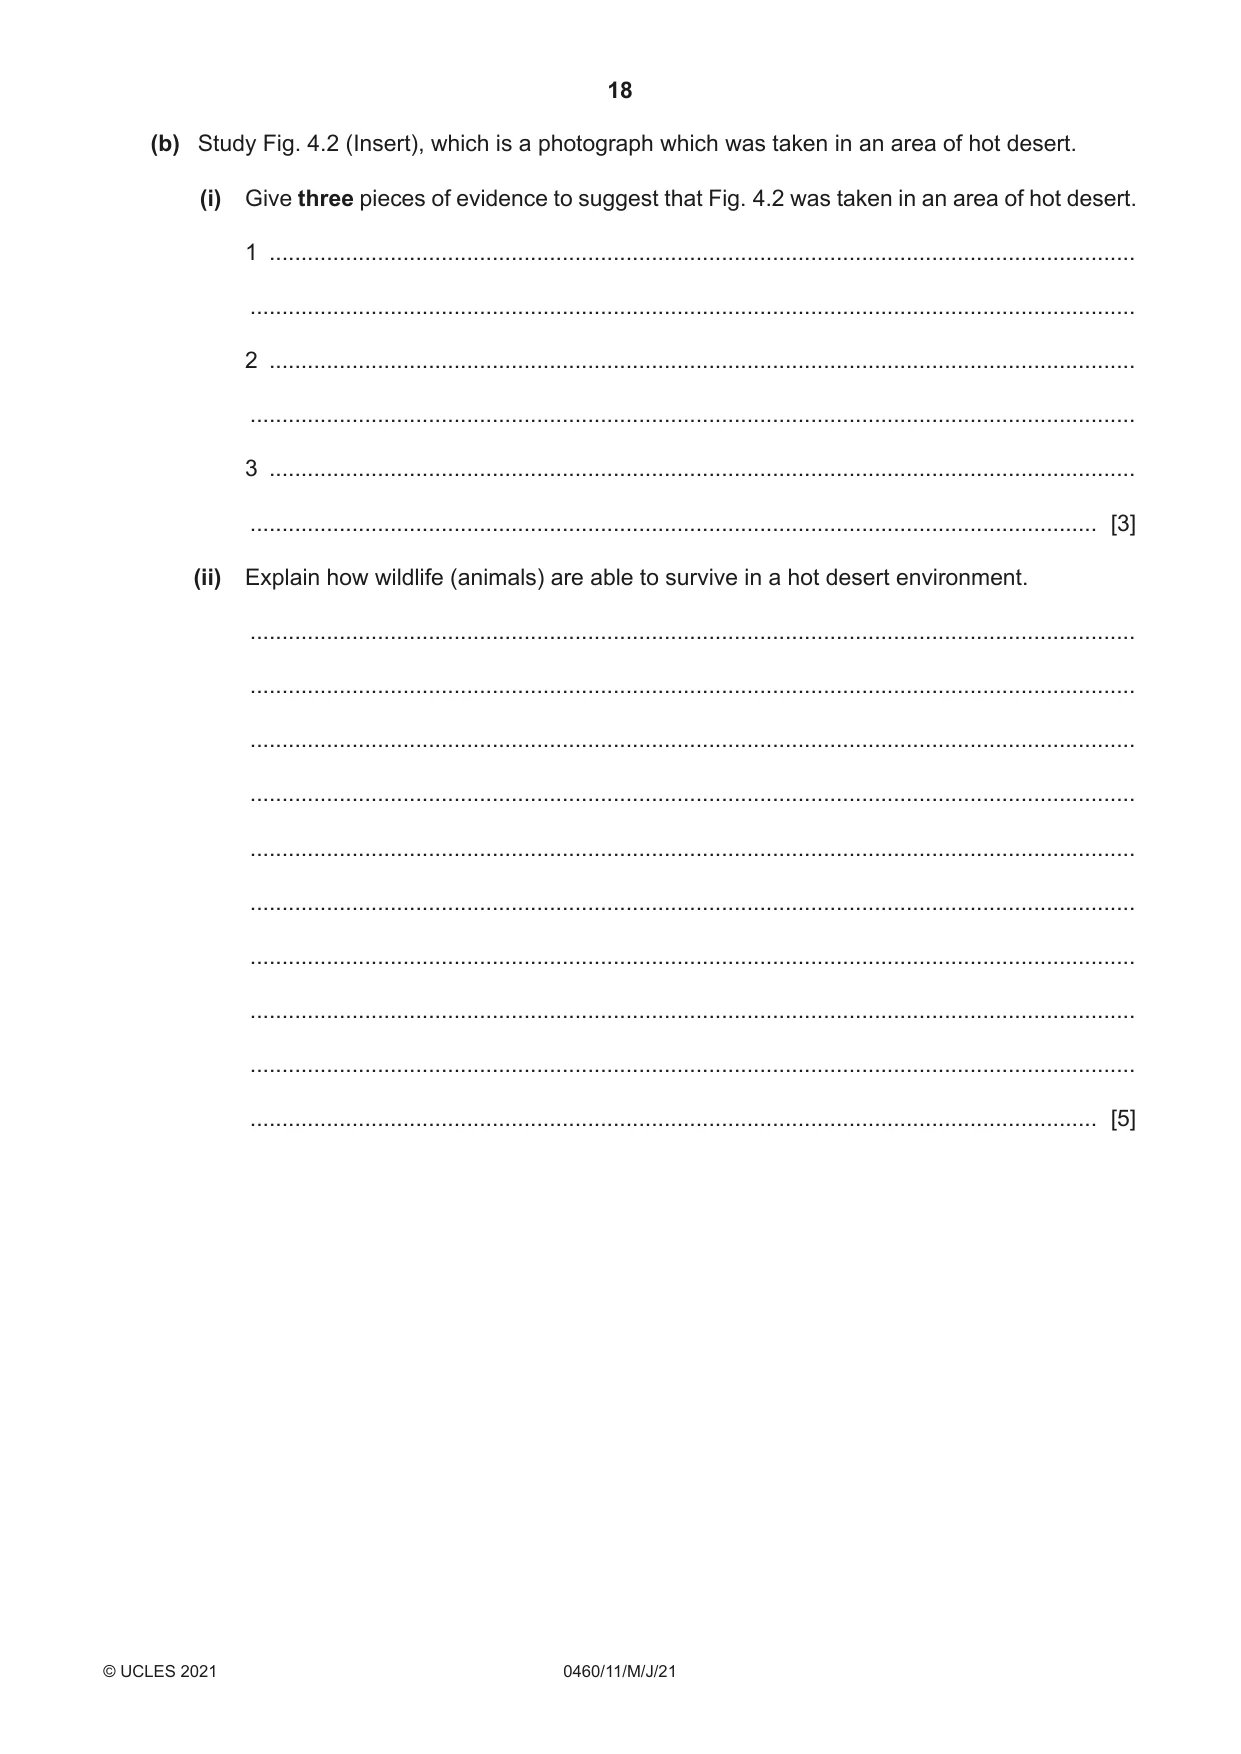
18 0460/11/M/J/21 © UCLES 2021 (b) Study Fig. 4.2 (Insert), which is a photograph which was taken in an area of hot desert. (i) Give three pieces of evidence to suggest that Fig. 4.2 was taken in an area of hot desert. 1 … … 2 … … 3 … … [3] (ii) Explain how wildlife (animals) are able to survive in a hot desert environment. … … … … … … … … … … [5]
Question paper, page 19
19 0460/11/M/J/21 © UCLES 2021 [Turn over (c) For a named area of tropical rainforest you have studied, describe the impacts of deforestation on the local natural environment. Name of area … … … … … … … … … … … … … … … … … … … … … … … … … … [7] [Total: 25]
Question paper, page 20
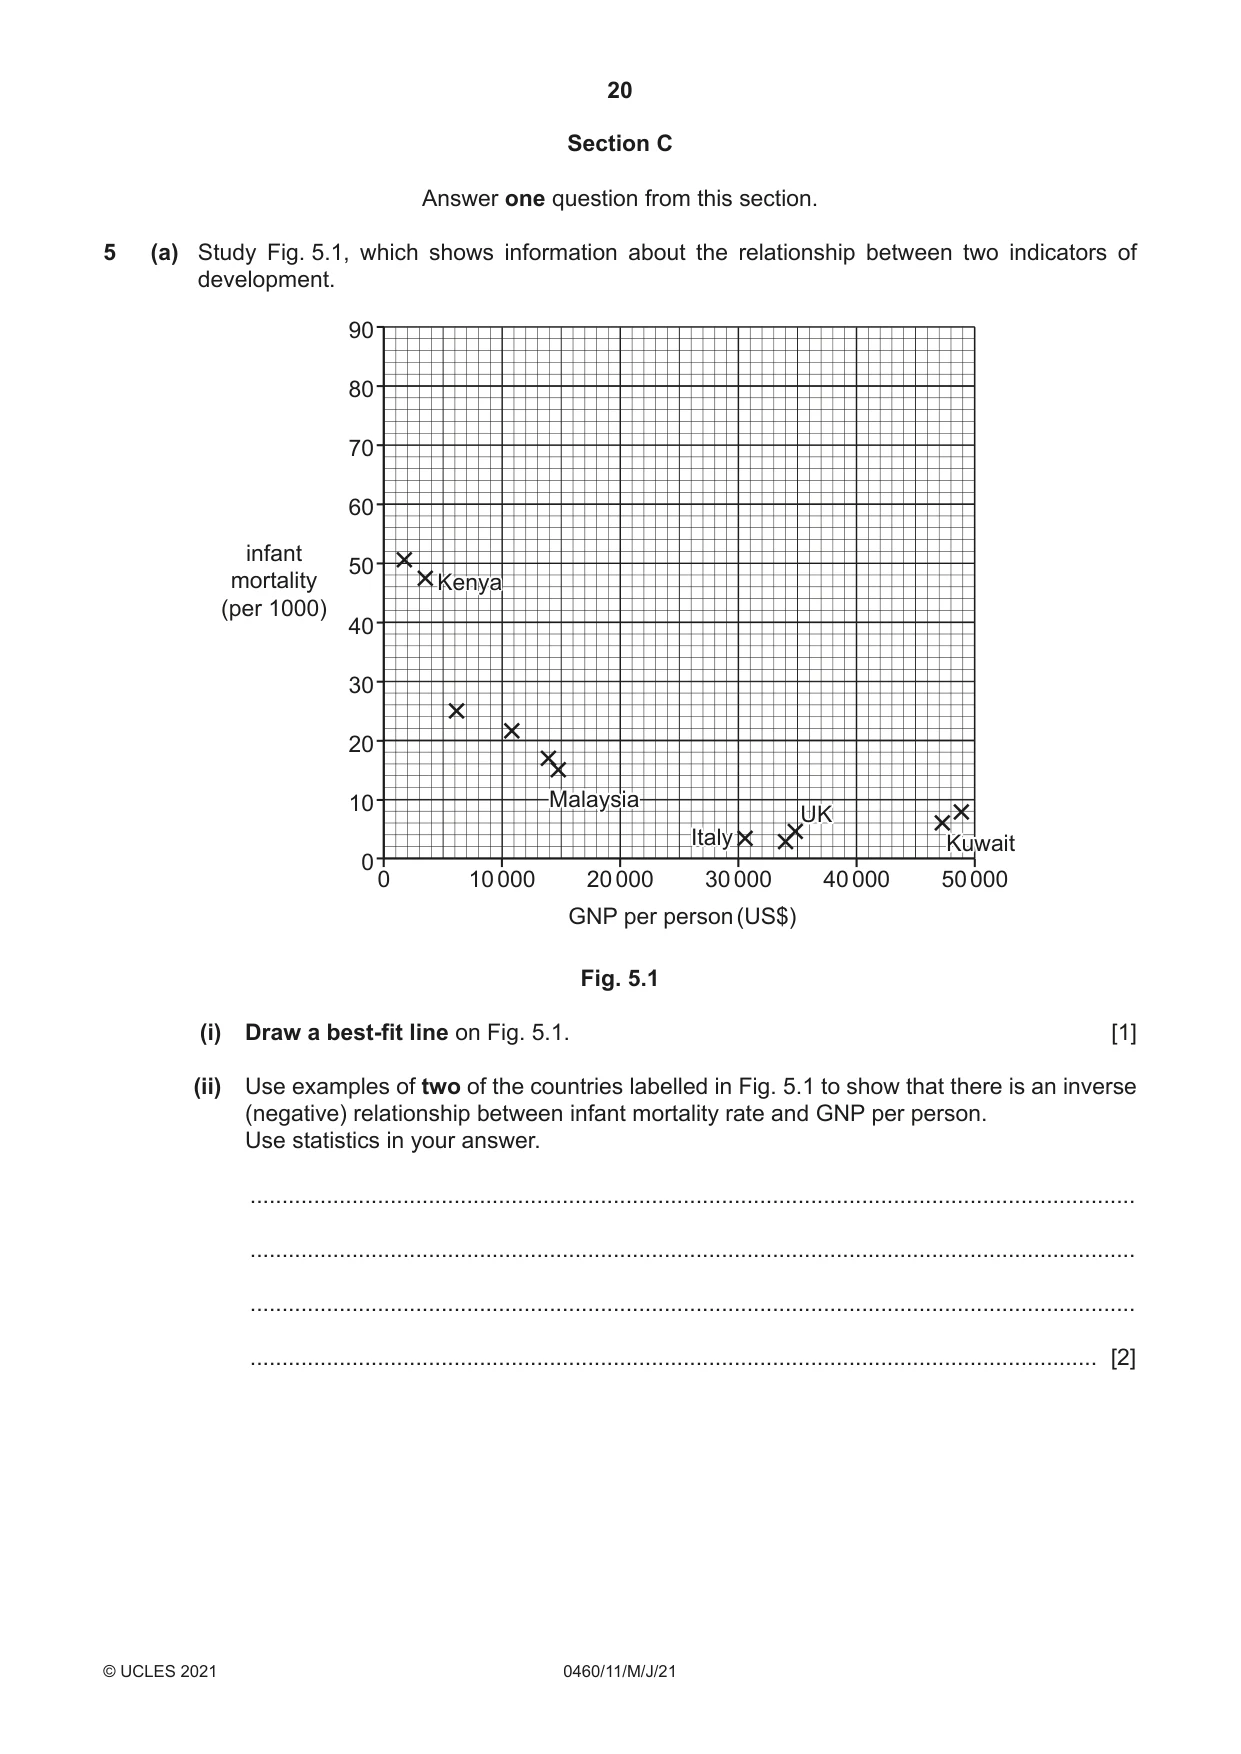
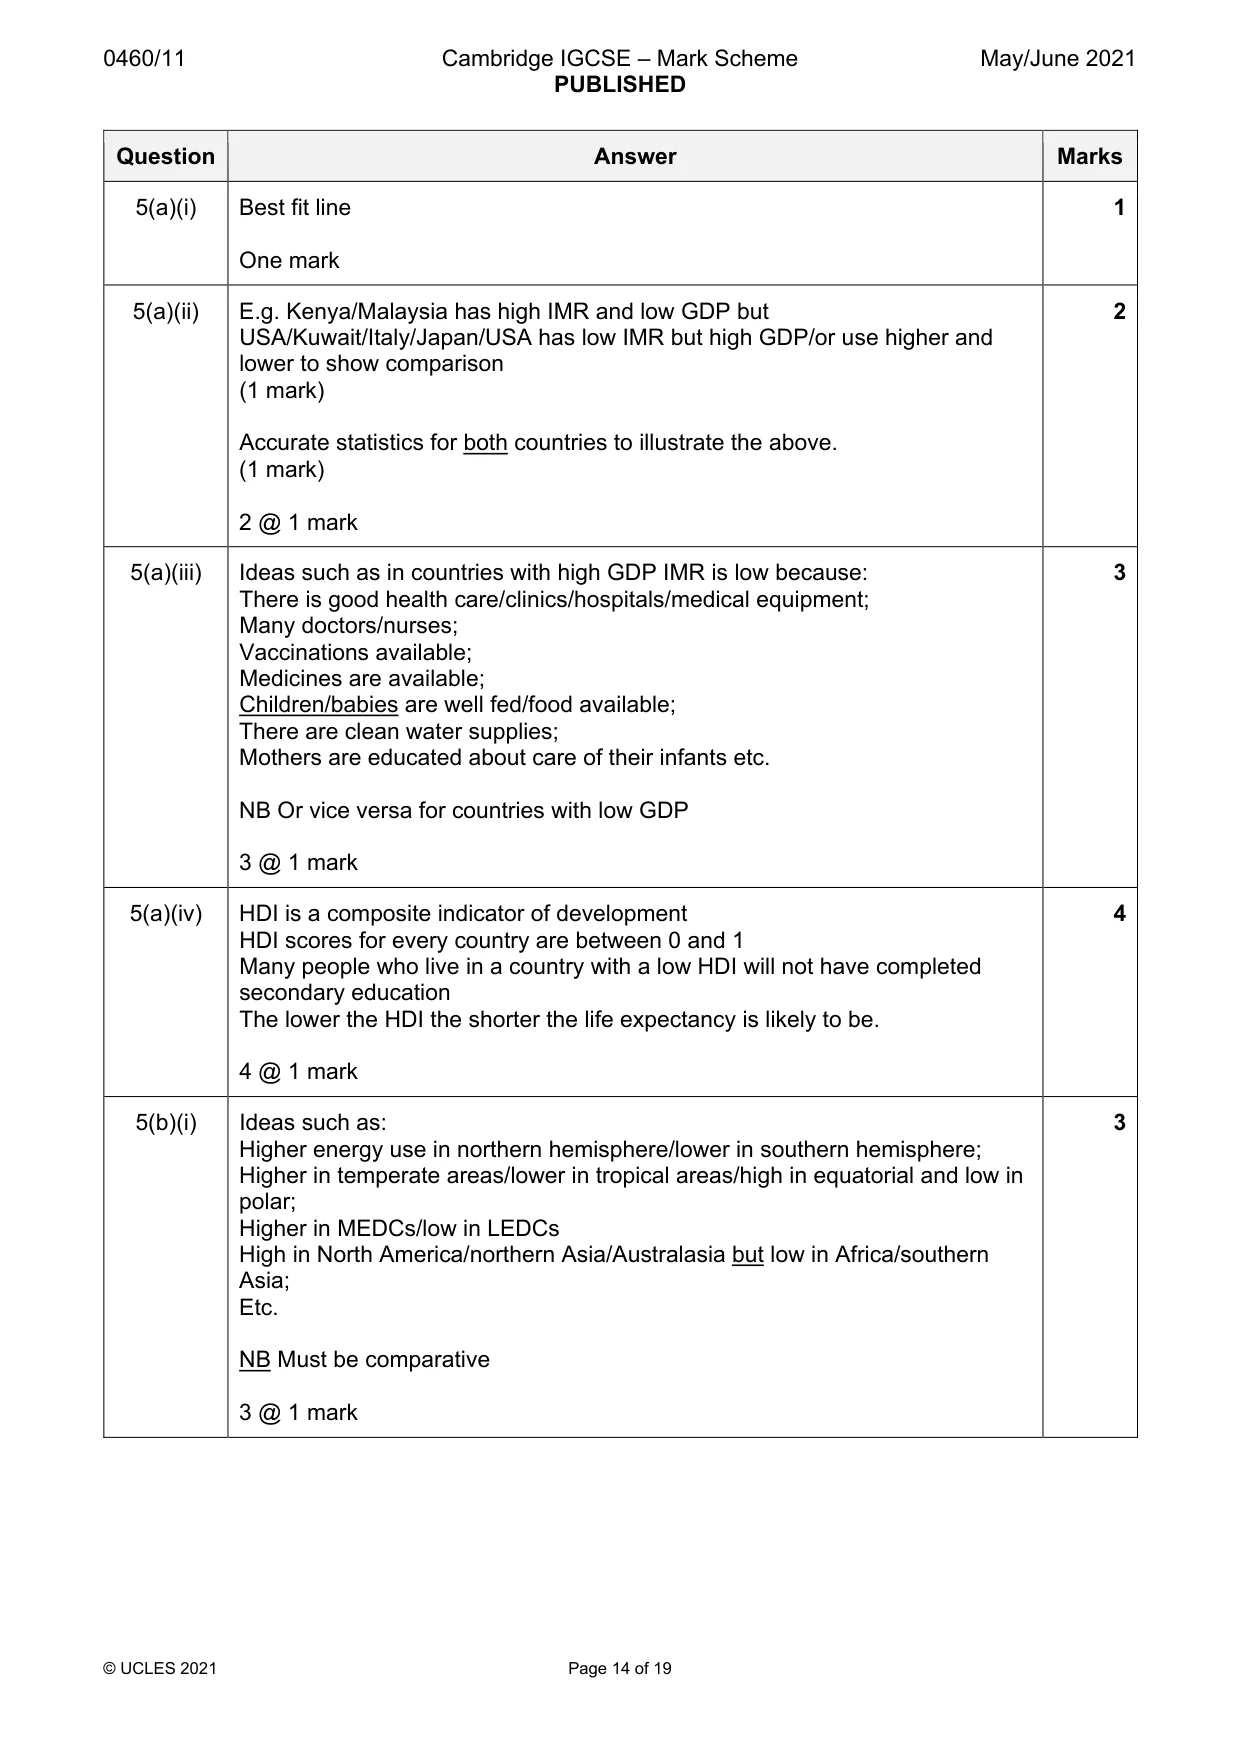
20 0460/11/M/J/21 © UCLES 2021 Section C Answer one question from this section. 5 (a) Study Fig. 5.1, which shows information about the relationship between two indicators of development. infant mortality (per 1000) 0 0 10 20 30 40 50 60 70 80 90 10 000 20 000 30 000 40 000 50 000 GNP per person (US$) Malaysia Italy UK Kuwait Kenya Kenya Malaysia Italy UK Kuwait Fig. 5.1 (i) Draw a best-fit line on Fig. 5.1. [1] (ii) Use examples of two of the countries labelled in Fig. 5.1 to show that there is an inverse (negative) relationship between infant mortality rate and GNP per person. Use statistics in your answer. … … … … [2]
Question paper, page 21
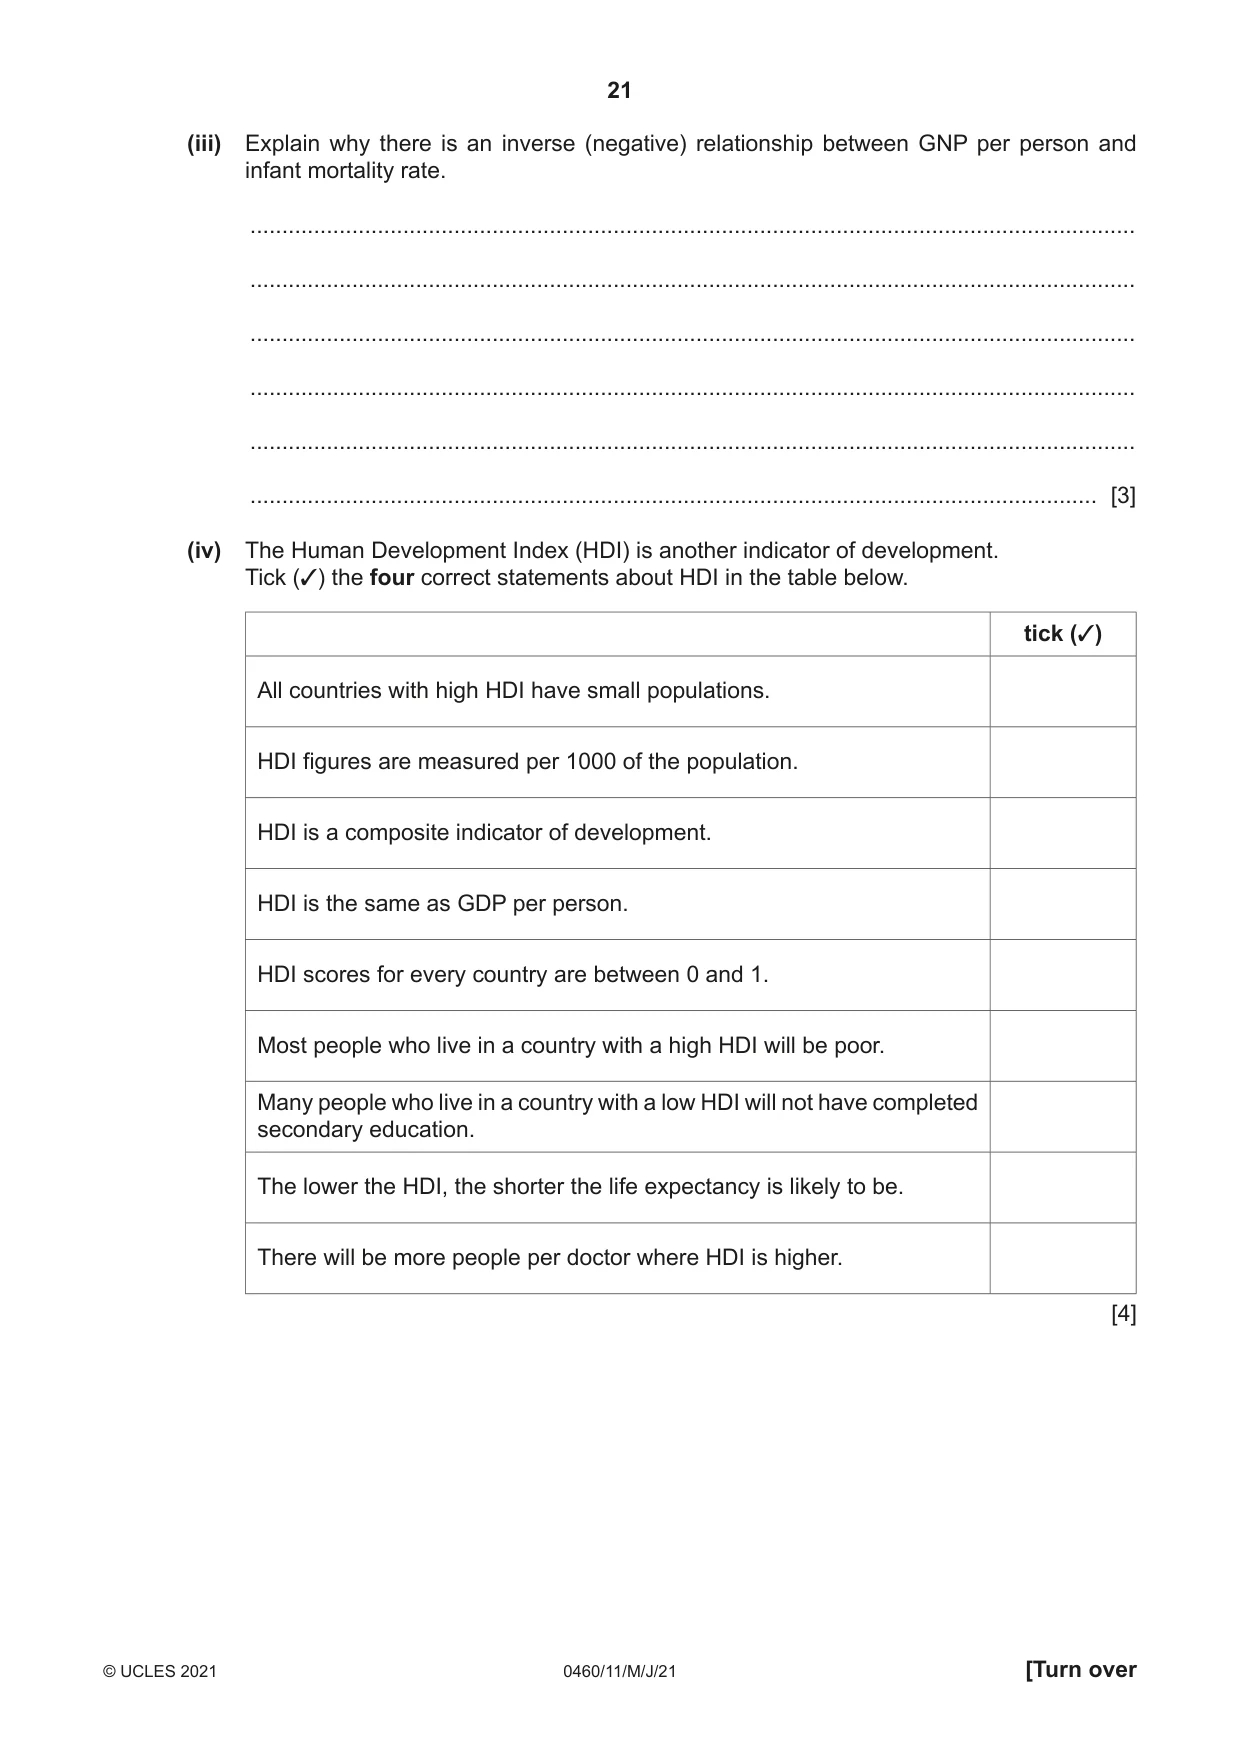
21 0460/11/M/J/21 © UCLES 2021 [Turn over (iii) Explain why there is an inverse (negative) relationship between GNP per person and infant mortality rate. … … … … … … [3] (iv) The Human Development Index (HDI) is another indicator of development. Tick (3) the four correct statements about HDI in the table below. tick (3) All countries with high HDI have small populations. HDI figures are measured per 1000 of the population. HDI is a composite indicator of development. HDI is the same as GDP per person. HDI scores for every country are between 0 and 1. Most people who live in a country with a high HDI will be poor. Many people who live in a country with a low HDI will not have completed secondary education. The lower the HDI, the shorter the life expectancy is likely to be. There will be more people per doctor where HDI is higher. [4]
Question paper, page 22
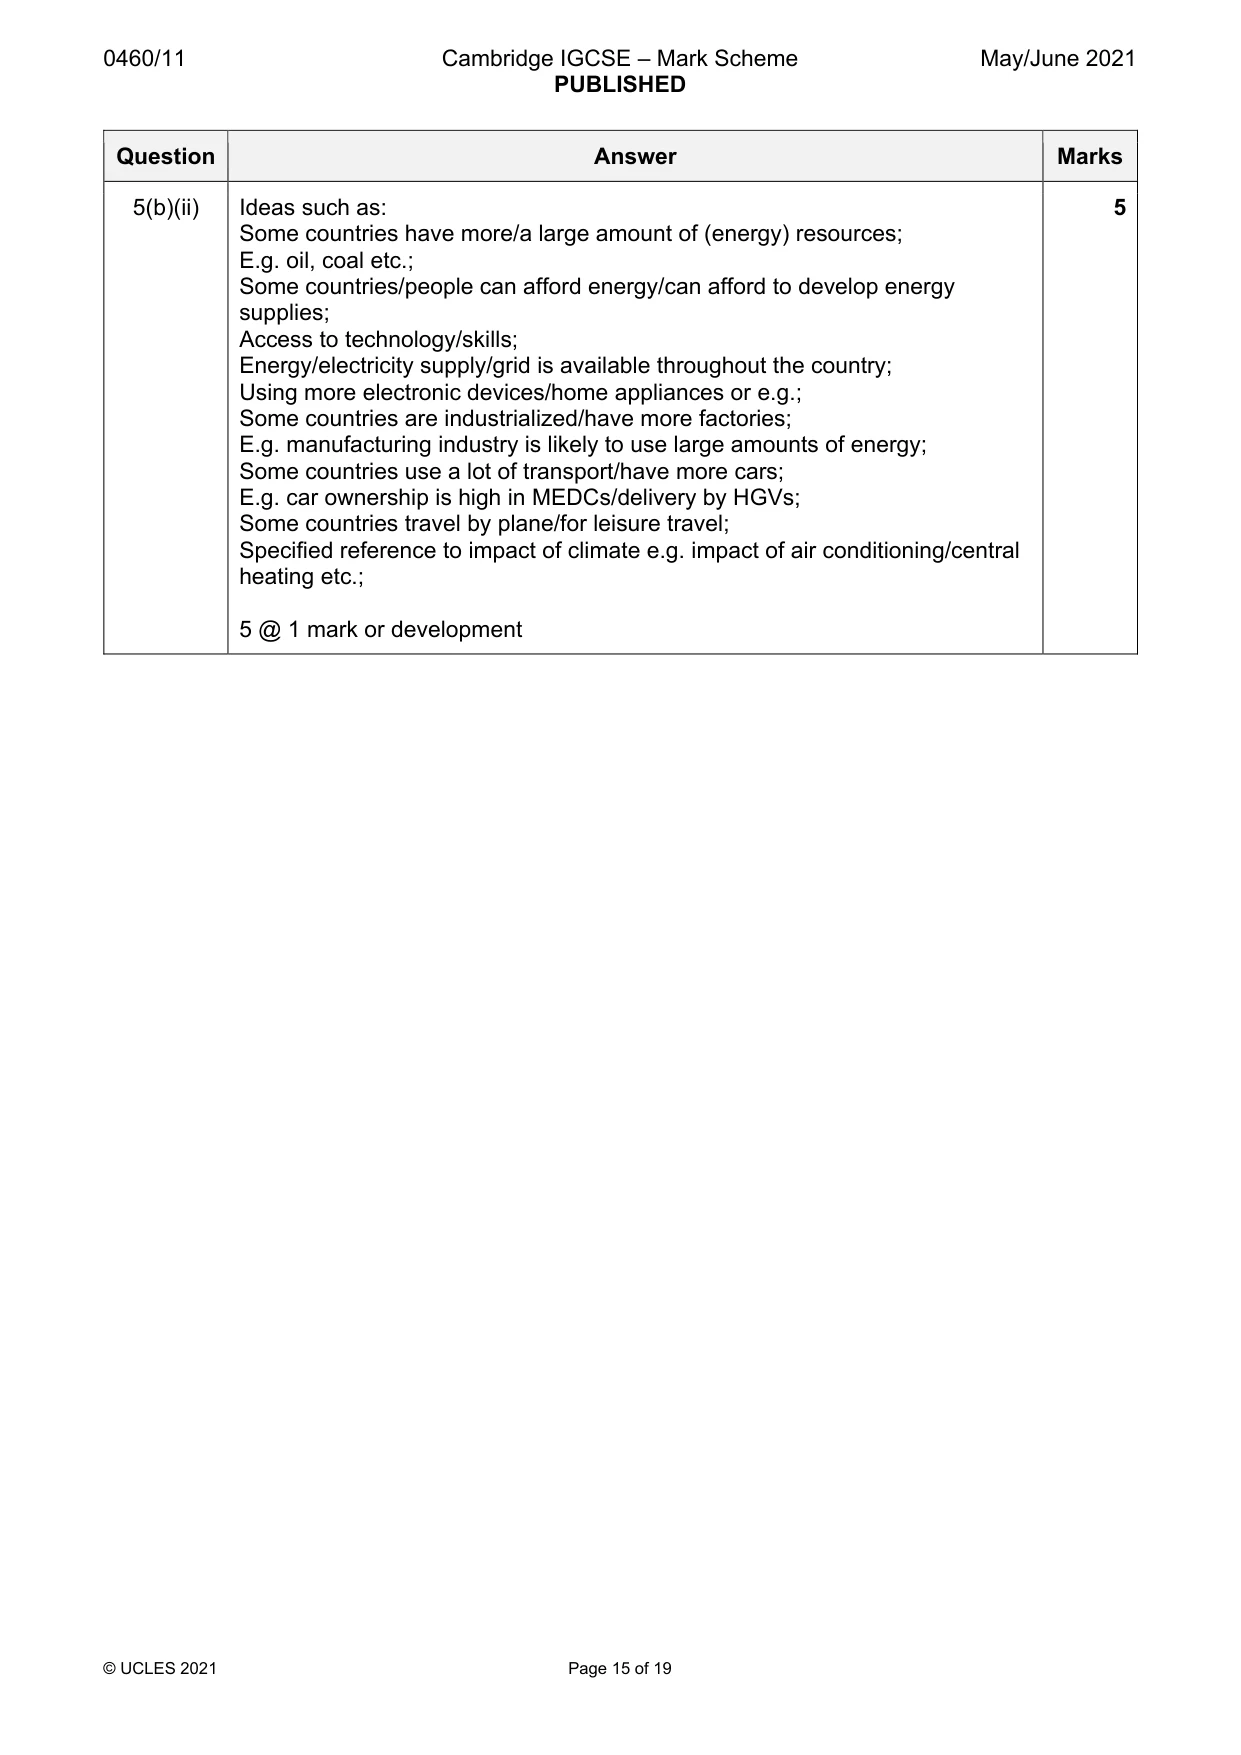
22 0460/11/M/J/21 © UCLES 2021 (b) Study Fig. 5.2 (Insert), which shows a prediction for energy use per person in different parts of the world in 2030. (i) Using Fig. 5.2 only, describe the predicted variation in the use of energy per person in the world. … … … … … … [3] (ii) Explain why some parts of the world use large amounts of energy per person. … … … … … … … … … … [5]
Question paper, page 23
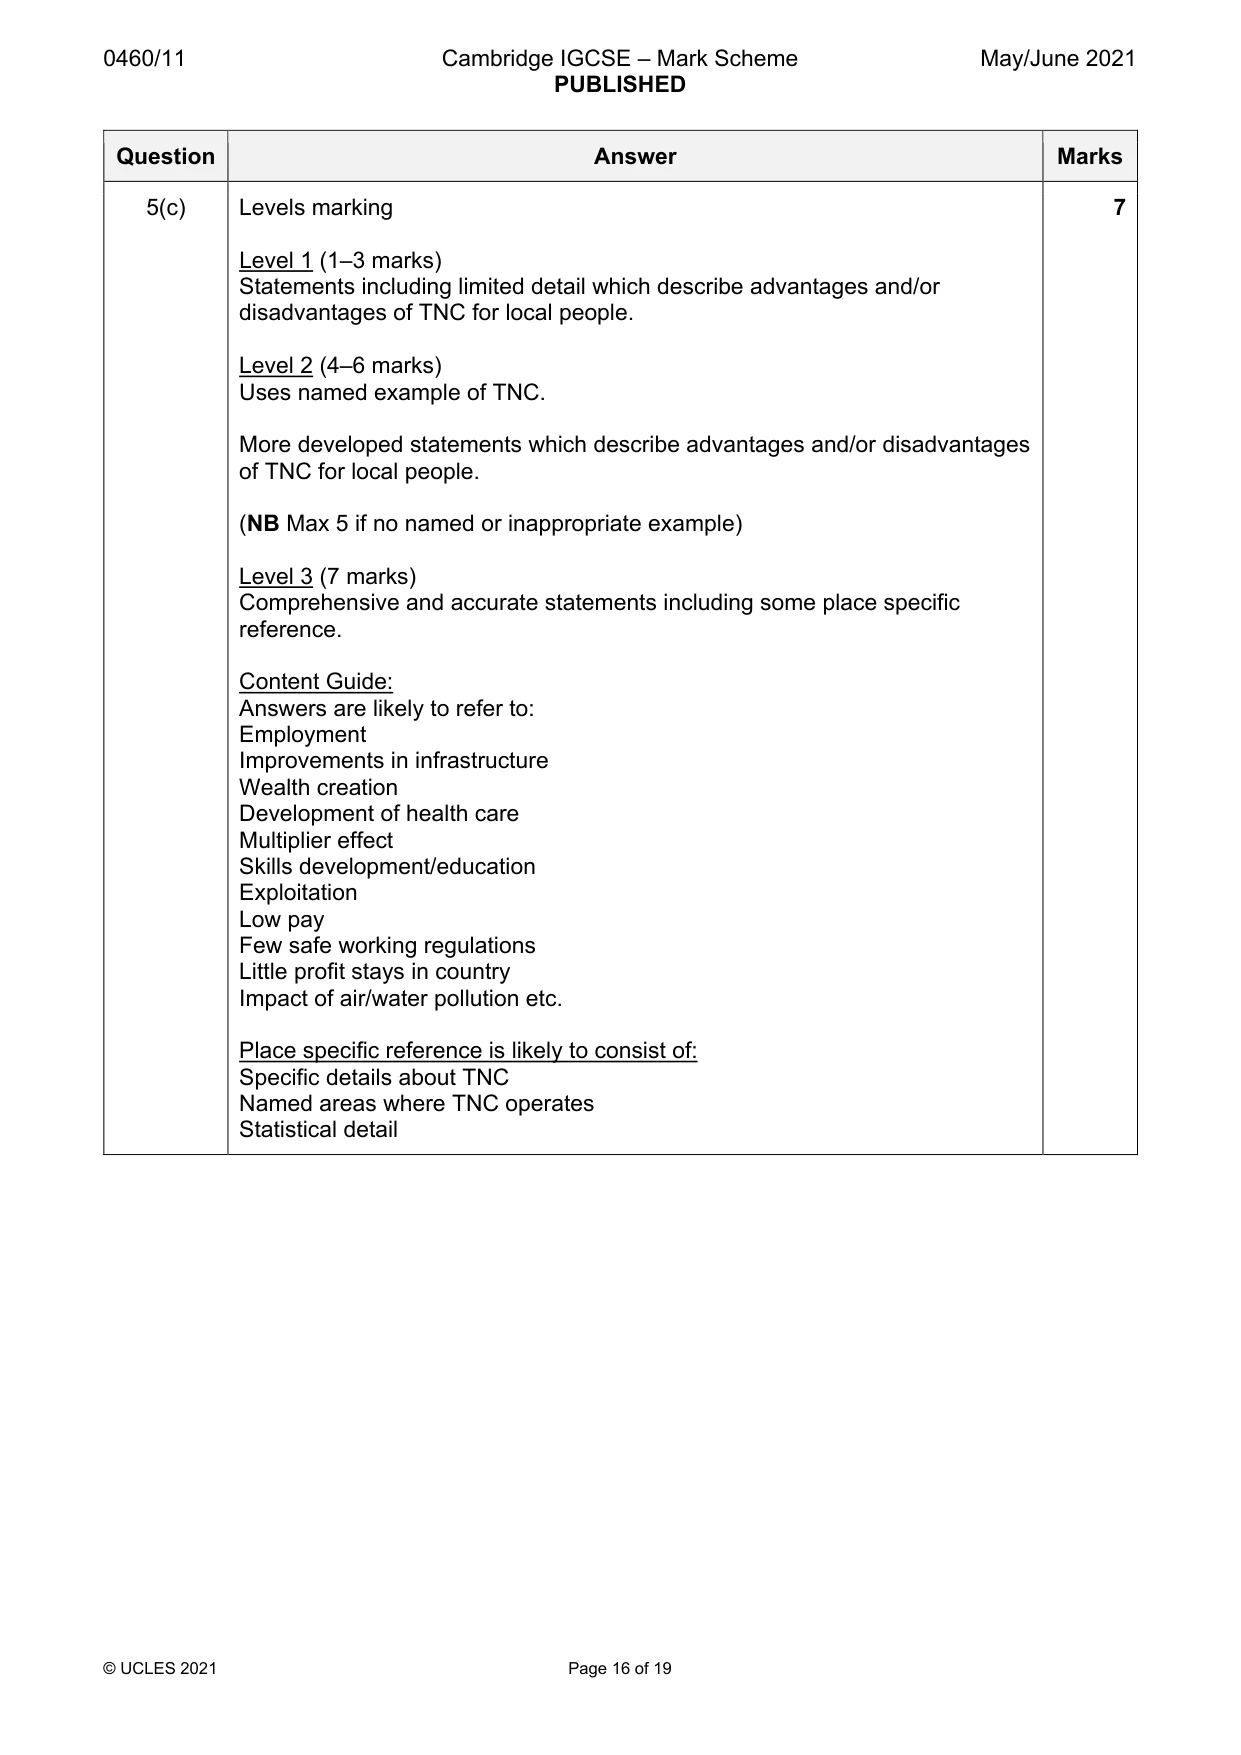
23 0460/11/M/J/21 © UCLES 2021 [Turn over (c) For a named transnational corporation (TNC) you have studied, describe the advantages and disadvantages it brings for people at a local scale. Name of transnational corporation … … … … … … … … … … … … … … … … … … … … … … … … … … [7] [Total: 25]
Question paper, page 24
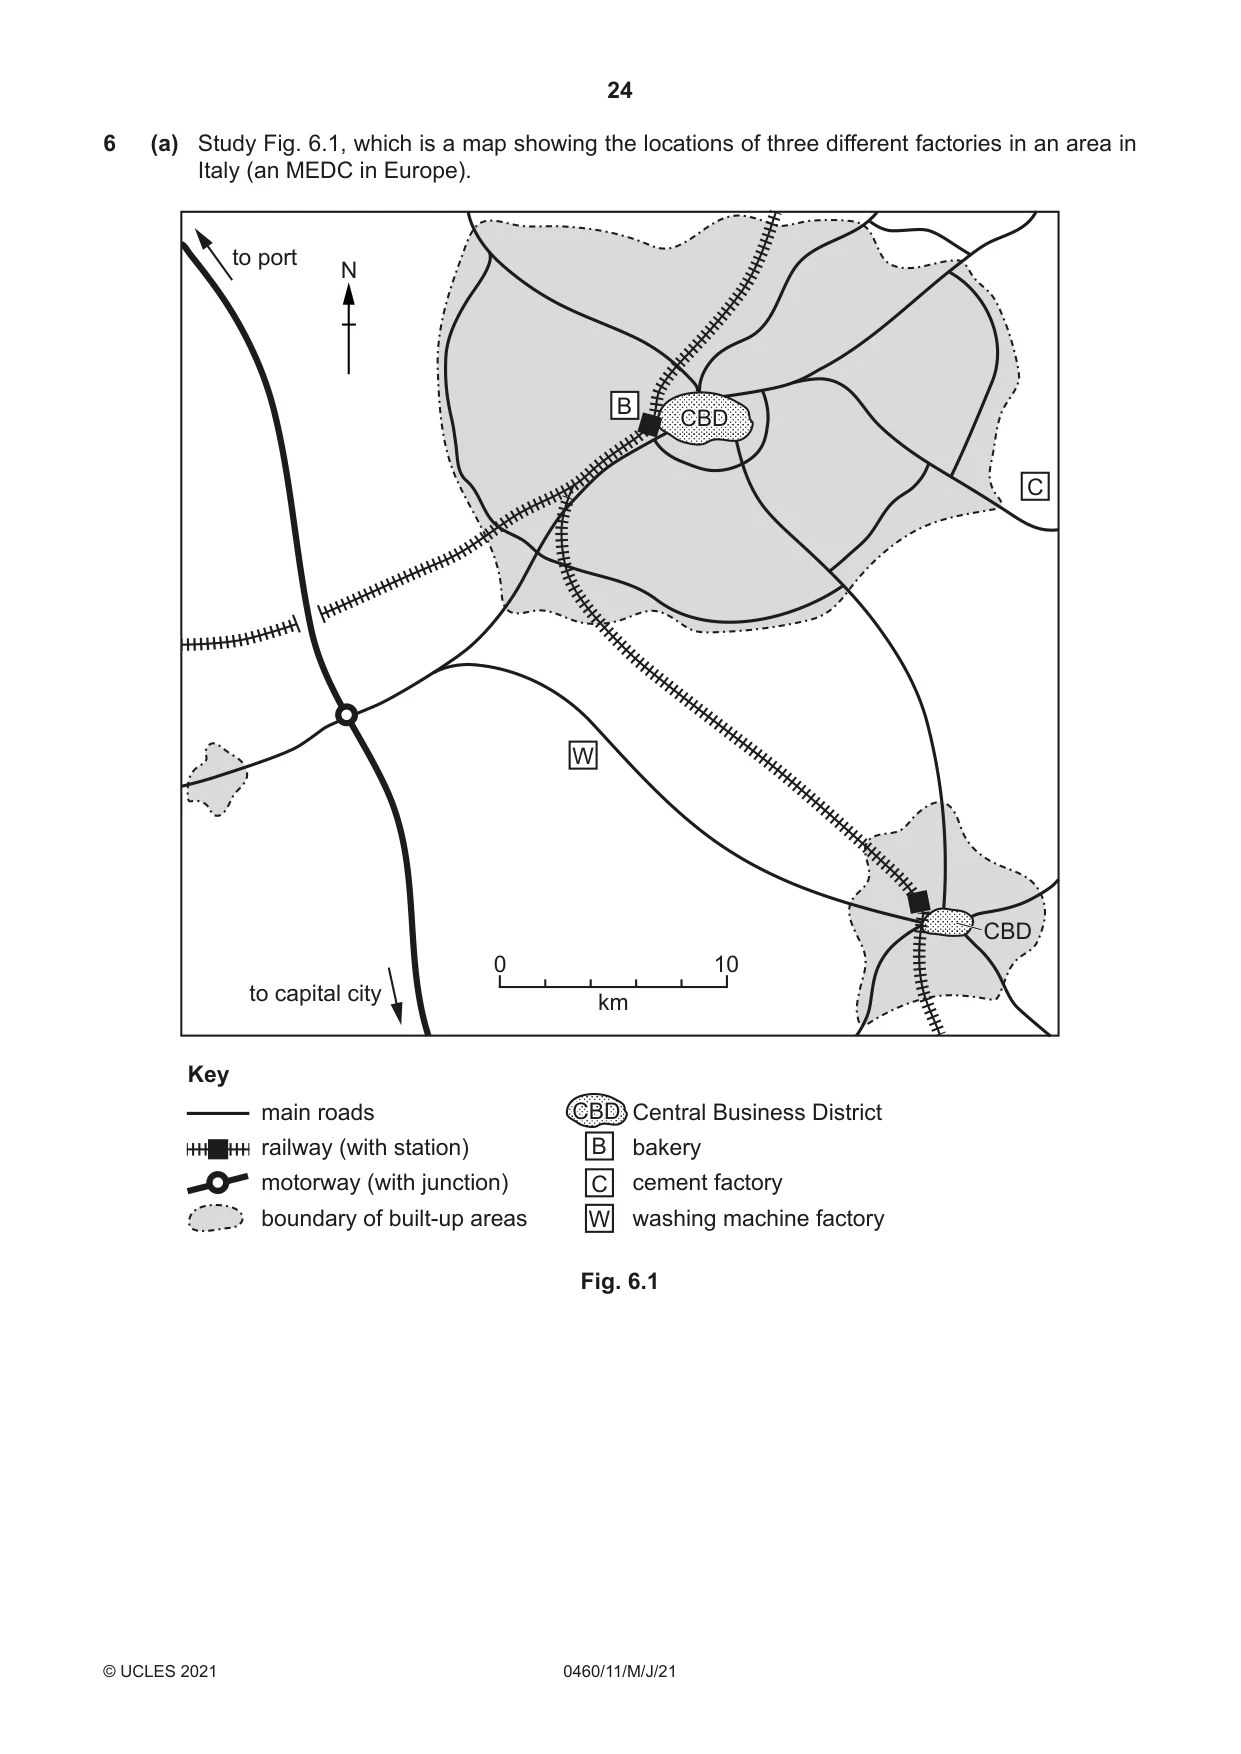
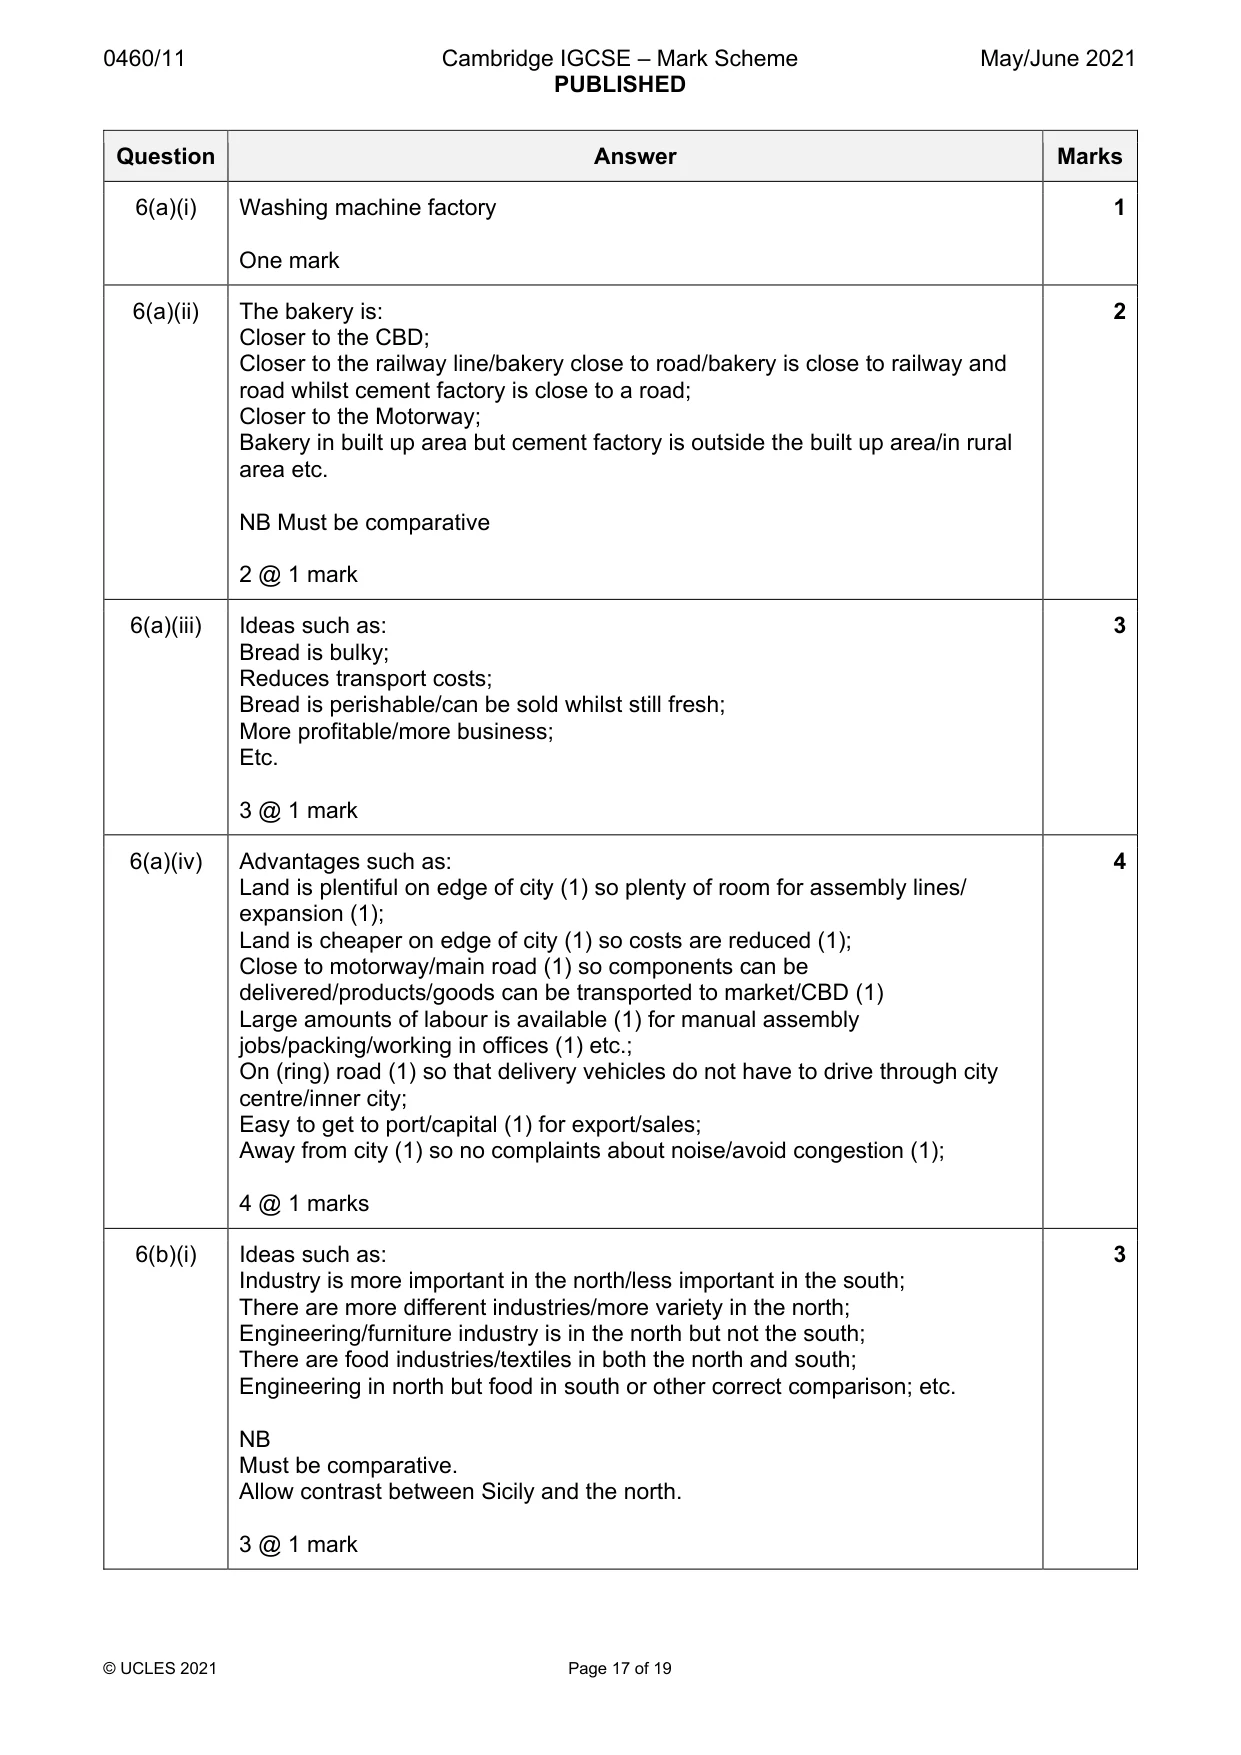
24 0460/11/M/J/21 © UCLES 2021 6 (a) Study Fig. 6.1, which is a map showing the locations of three different factories in an area in Italy (an MEDC in Europe). Key main roads railway (with station) motorway (with junction) boundary of built-up areas Central Business District bakery cement factory washing machine factory 0 10 km B B C C W W to port to capital city N CBD CBD CBD CBD CBD Fig. 6.1
Question paper, page 25
25 0460/11/M/J/21 © UCLES 2021 [Turn over (i) Identify the factory shown in Fig. 6.1 which is an example of assembly industry. … [1] (ii) Using Fig. 6.1, state two differences between the locations of the bakery and the cement factory. 1 … … … 2 … … … [2] (iii) Explain why a location close to a market was chosen by the owners of the bakery. … … … … … … [3] (iv) Explain two advantages of the location of the washing machine factory, which was built in 2018. 1 … … … … 2 … … … … [4]
Question paper, page 26
26 0460/11/M/J/21 © UCLES 2021 (b) Study Fig. 6.2 (Insert), which shows information about the location of selected manufacturing industries in Italy. (i) Compare the importance of manufacturing industry in north and south Italy. … … … … … … [3] (ii) Explain how manufacturing industry may increase the rate of global warming. … … … … … … … … … … [5]
Question paper, page 27
27 0460/11/M/J/21 © UCLES 2021 (c) For a named area you have studied, explain how economic activity is managed to reduce the risks to the natural environment. Name of area … Economic activity … … … … … … … … … … … … … … … … … … … … … … … … … [7] [Total: 25]
Question paper, page 28
28 0460/11/M/J/21 © UCLES 2021 Additional Pages If you use the following lined pages to complete the answer(s) to any question(s), the question number(s) must be clearly shown. … … … … … … … … … … … … … … … … … … … … … … … … … …
Question paper, page 29
29 0460/11/M/J/21 © UCLES 2021 … … … … … … … … … … … … … … … … … … … … … … … … … … … …
Question paper, page 30
30 0460/11/M/J/21 © UCLES 2021 BLANK PAGE
Question paper, page 31
31 0460/11/M/J/21 © UCLES 2021 BLANK PAGE
Question paper, page 32
32 0460/11/M/J/21 © UCLES 2021 BLANK PAGE The boundaries and names shown, the designations used and the presentation of material on any maps contained in this question paper/insert do not imply official endorsement or acceptance by Cambridge Assessment International Education concerning the legal status of any country, territory, or area or any of its authorities, or of the delimitation of its frontiers or boundaries. Permission to reproduce items where third-party owned material protected by copyright is included has been sought and cleared where possible. Every reasonable effort has been made by the publisher (UCLES) to trace copyright holders, but if any items requiring clearance have unwittingly been included, the publisher will be pleased to make amends at the earliest possible opportunity. To avoid the issue of disclosure of answer-related information to candidates, all copyright acknowledgements are reproduced online in the Cambridge Assessment International Education Copyright Acknowledgements Booklet. This is produced for each series of examinations and is freely available to download at www.cambridgeinternational.org after the live examination series. Cambridge Assessment International Education is part of the Cambridge Assessment Group. Cambridge Assessment is the brand name of the University of Cambridge Local Examinations Syndicate (UCLES), which itself is a department of the University of Cambridge.
Mark scheme, page 1
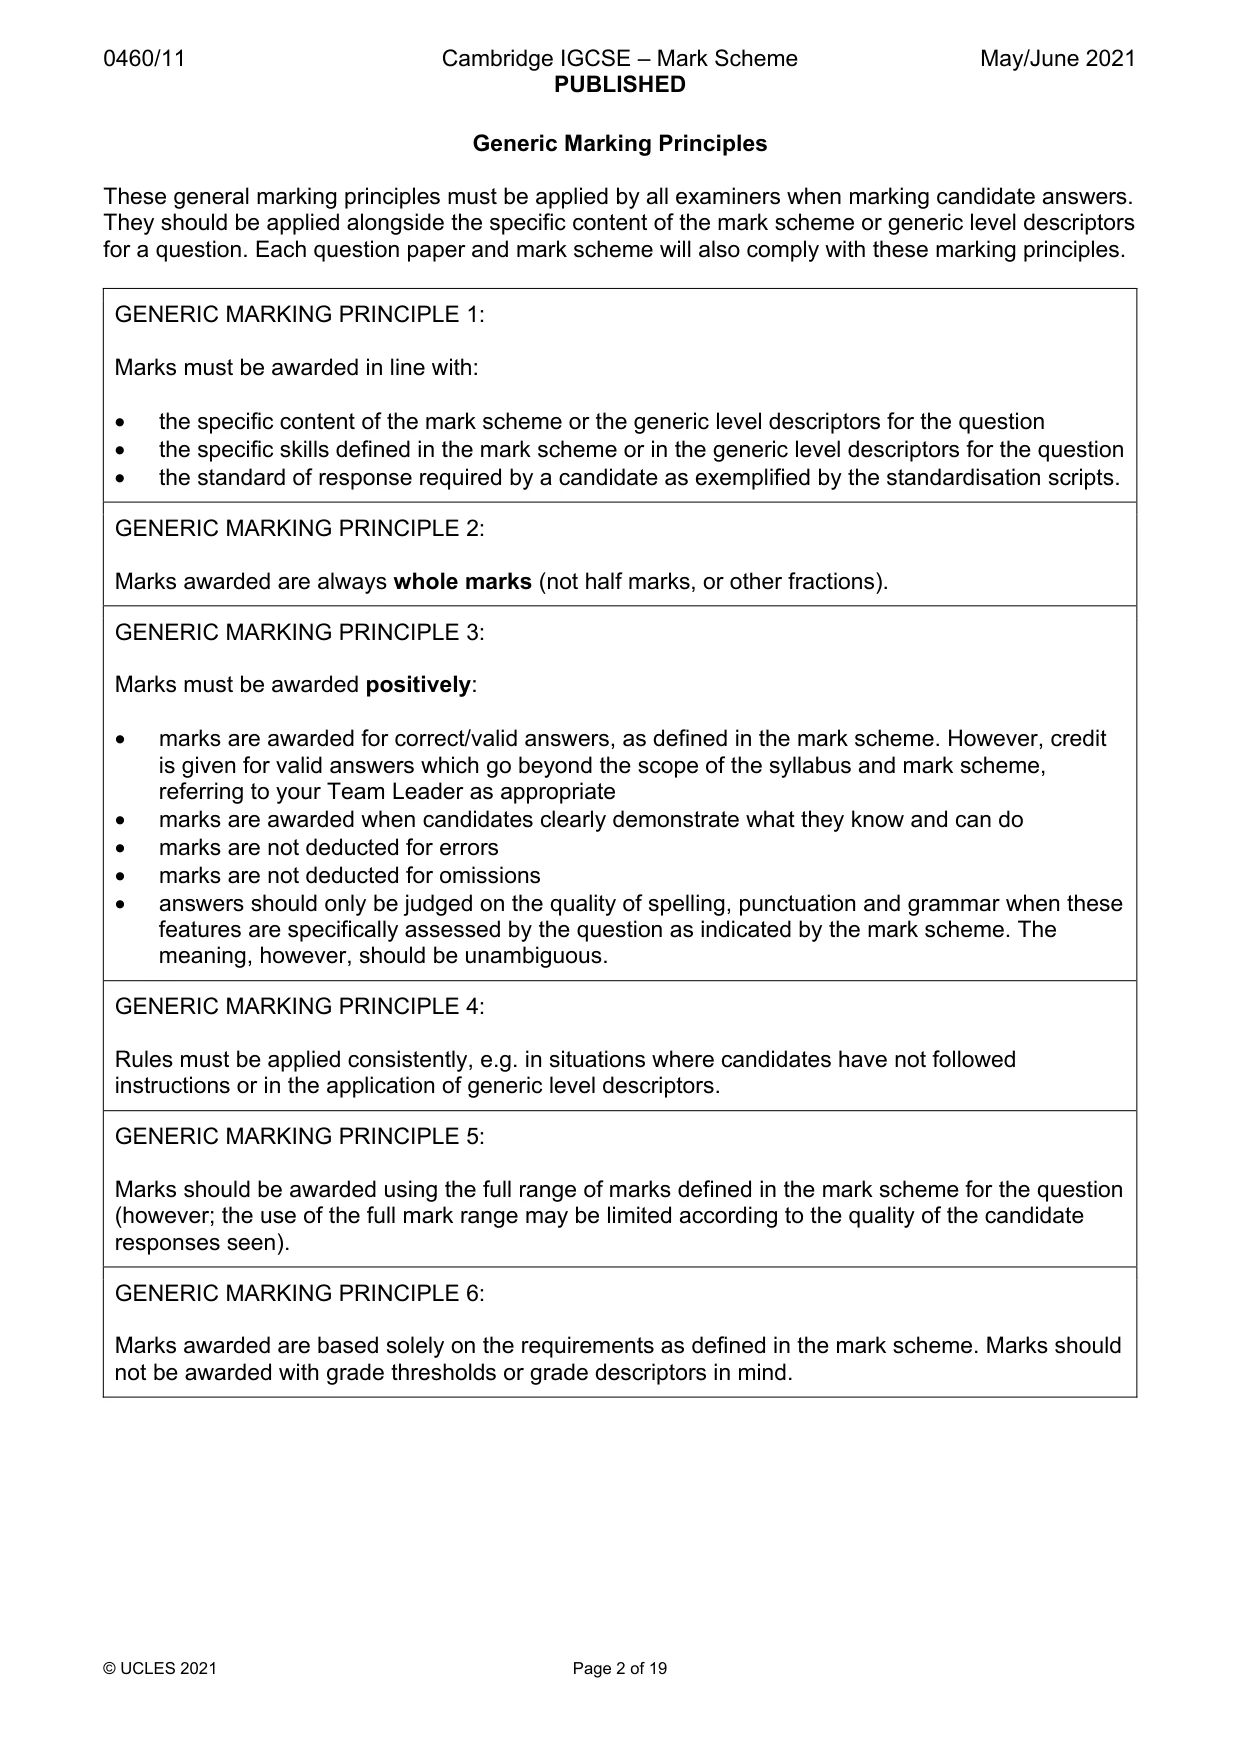
This document consists of 19 printed pages. © UCLES 2021 [Turn over Cambridge IGCSE™ GEOGRAPHY 0460/11 Paper 1 May/June 2021 MARK SCHEME Maximum Mark: 75 Published This mark scheme is published as an aid to teachers and candidates, to indicate the requirements of the examination. It shows the basis on which Examiners were instructed to award marks. It does not indicate the details of the discussions that took place at an Examiners’ meeting before marking began, which would have considered the acceptability of alternative answers. Mark schemes should be read in conjunction with the question paper and the Principal Examiner Report for Teachers. Cambridge International will not enter into discussions about these mark schemes. Cambridge International is publishing the mark schemes for the May/June 2021 series for most Cambridge IGCSE™, Cambridge International A and AS Level components and some Cambridge O Level components.
Mark scheme, page 2
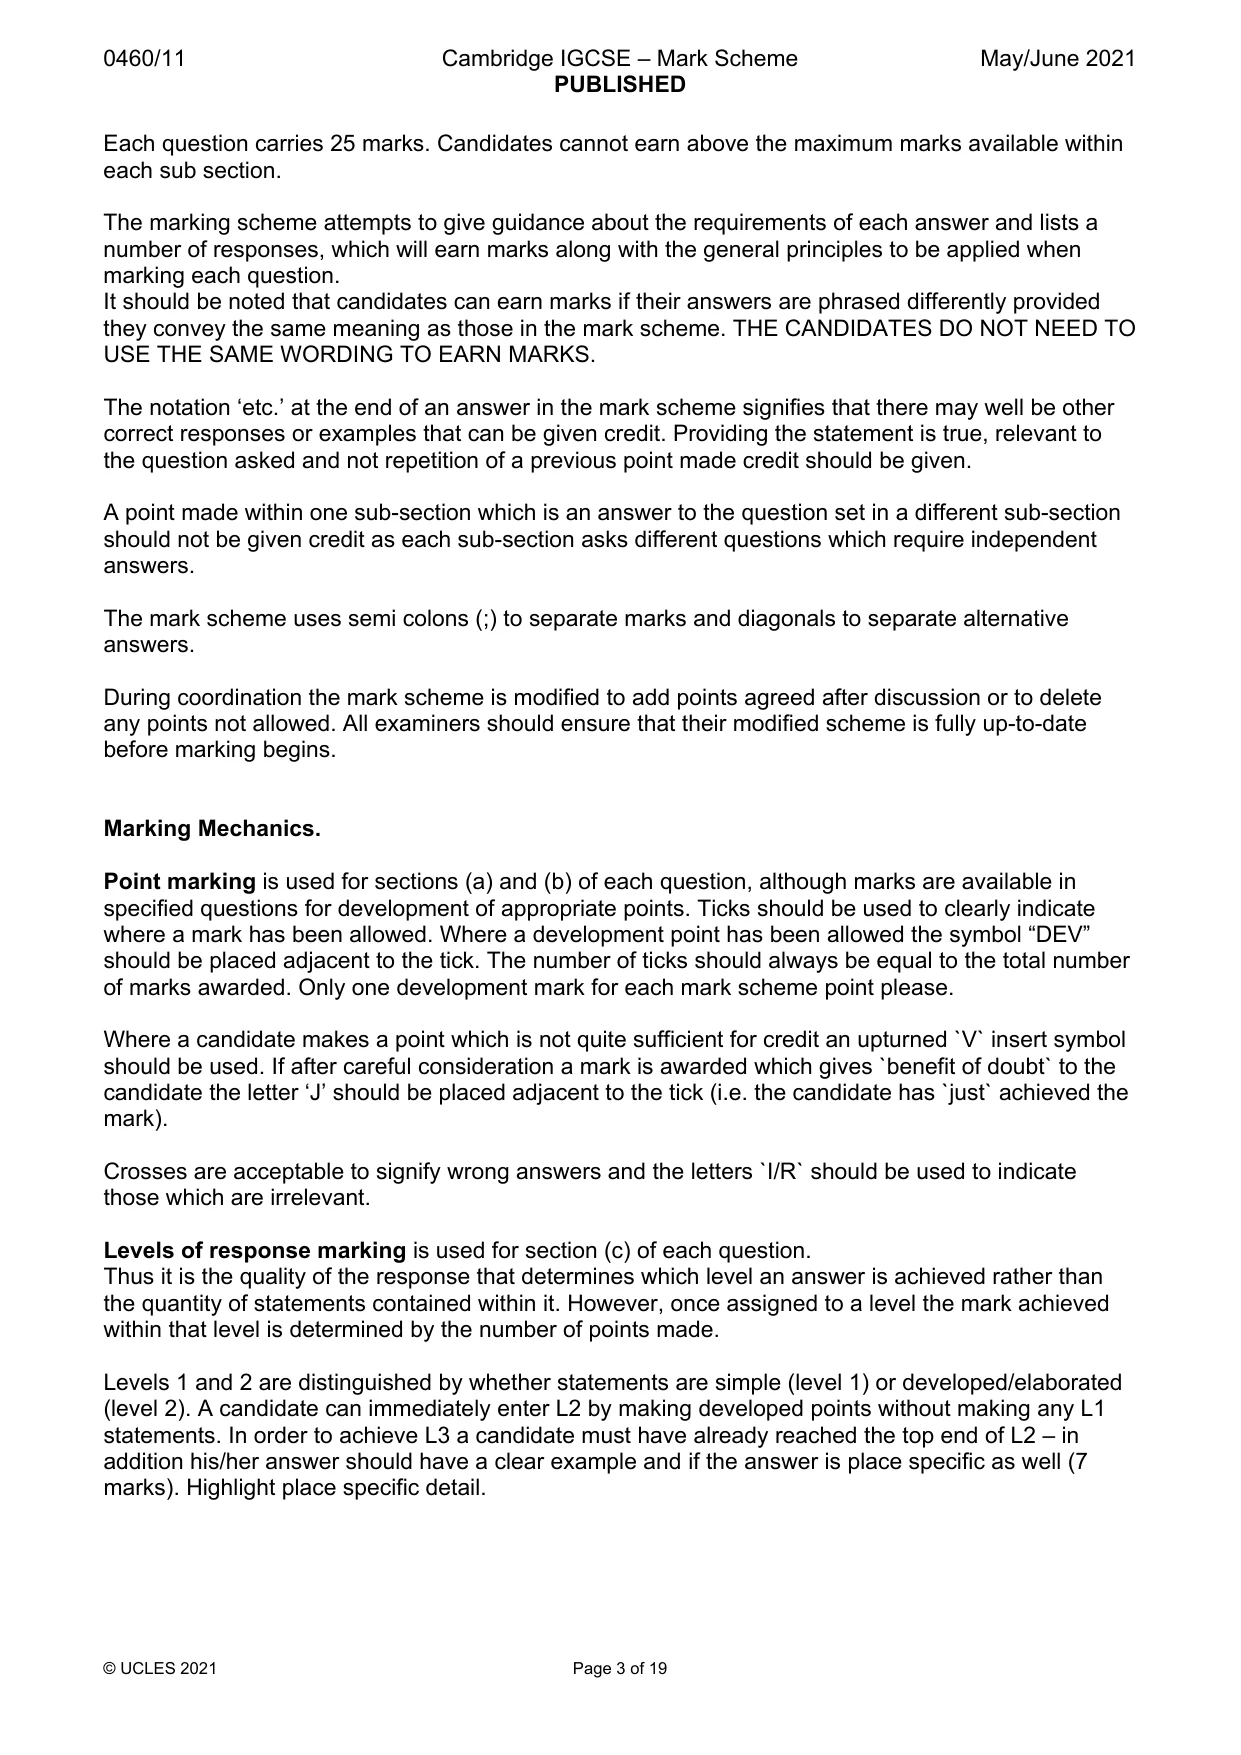
0460/11 Cambridge IGCSE – Mark Scheme PUBLISHED May/June 2021 © UCLES 2021 Page 2 of 19 Generic Marking Principles These general marking principles must be applied by all examiners when marking candidate answers. They should be applied alongside the specific content of the mark scheme or generic level descriptors for a question. Each question paper and mark scheme will also comply with these marking principles. GENERIC MARKING PRINCIPLE 1: Marks must be awarded in line with: • the specific content of the mark scheme or the generic level descriptors for the question • the specific skills defined in the mark scheme or in the generic level descriptors for the question • the standard of response required by a candidate as exemplified by the standardisation scripts. GENERIC MARKING PRINCIPLE 2: Marks awarded are always whole marks (not half marks, or other fractions). GENERIC MARKING PRINCIPLE 3: Marks must be awarded positively: • marks are awarded for correct/valid answers, as defined in the mark scheme. However, credit is given for valid answers which go beyond the scope of the syllabus and mark scheme, referring to your Team Leader as appropriate • marks are awarded when candidates clearly demonstrate what they know and can do • marks are not deducted for errors • marks are not deducted for omissions • answers should only be judged on the quality of spelling, punctuation and grammar when these features are specifically assessed by the question as indicated by the mark scheme. The meaning, however, should be unambiguous. GENERIC MARKING PRINCIPLE 4: Rules must be applied consistently, e.g. in situations where candidates have not followed instructions or in the application of generic level descriptors. GENERIC MARKING PRINCIPLE 5: Marks should be awarded using the full range of marks defined in the mark scheme for the question (however; the use of the full mark range may be limited according to the quality of the candidate responses seen). GENERIC MARKING PRINCIPLE 6: Marks awarded are based solely on the requirements as defined in the mark scheme. Marks should not be awarded with grade thresholds or grade descriptors in mind.
Mark scheme, page 3
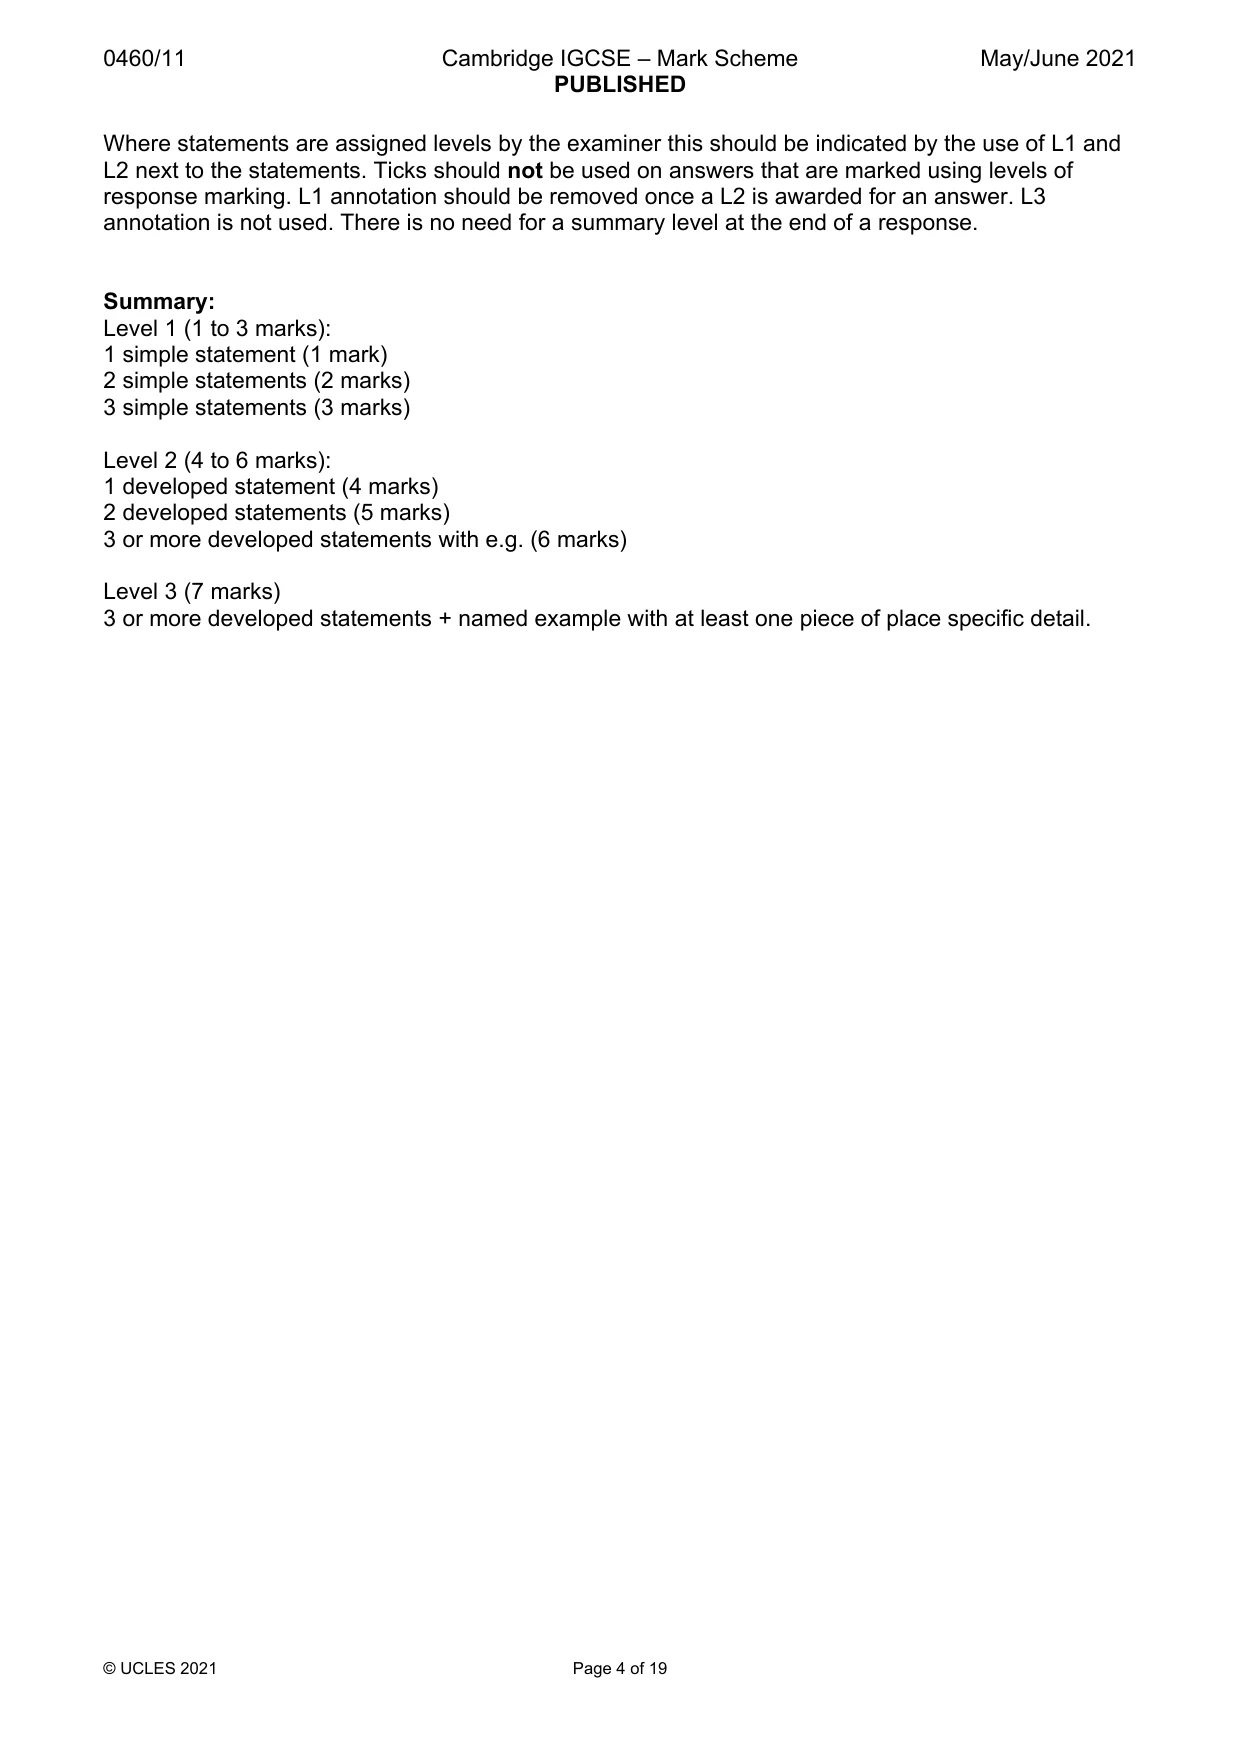
0460/11 Cambridge IGCSE – Mark Scheme PUBLISHED May/June 2021 © UCLES 2021 Page 3 of 19 Each question carries 25 marks. Candidates cannot earn above the maximum marks available within each sub section. The marking scheme attempts to give guidance about the requirements of each answer and lists a number of responses, which will earn marks along with the general principles to be applied when marking each question. It should be noted that candidates can earn marks if their answers are phrased differently provided they convey the same meaning as those in the mark scheme. THE CANDIDATES DO NOT NEED TO USE THE SAME WORDING TO EARN MARKS. The notation ‘etc.’ at the end of an answer in the mark scheme signifies that there may well be other correct responses or examples that can be given credit. Providing the statement is true, relevant to the question asked and not repetition of a previous point made credit should be given. A point made within one sub-section which is an answer to the question set in a different sub-section should not be given credit as each sub-section asks different questions which require independent answers. The mark scheme uses semi colons (;) to separate marks and diagonals to separate alternative answers. During coordination the mark scheme is modified to add points agreed after discussion or to delete any points not allowed. All examiners should ensure that their modified scheme is fully up-to-date before marking begins. Marking Mechanics. Point marking is used for sections (a) and (b) of each question, although marks are available in specified questions for development of appropriate points. Ticks should be used to clearly indicate where a mark has been allowed. Where a development point has been allowed the symbol “DEV” should be placed adjacent to the tick. The number of ticks should always be equal to the total number of marks awarded. Only one development mark for each mark scheme point please. Where a candidate makes a point which is not quite sufficient for credit an upturned `V` insert symbol should be used. If after careful consideration a mark is awarded which gives `benefit of doubt` to the candidate the letter ‘J’ should be placed adjacent to the tick (i.e. the candidate has `just` achieved the mark). Crosses are acceptable to signify wrong answers and the letters `I/R` should be used to indicate those which are irrelevant. Levels of response marking is used for section (c) of each question. Thus it is the quality of the response that determines which level an answer is achieved rather than the quantity of statements contained within it. However, once assigned to a level the mark achieved within that level is determined by the number of points made. Levels 1 and 2 are distinguished by whether statements are simple (level 1) or developed/elaborated (level 2). A candidate can immediately enter L2 by making developed points without making any L1 statements. In order to achieve L3 a candidate must have already reached the top end of L2 – in addition his/her answer should have a clear example and if the answer is place specific as well (7 marks). Highlight place specific detail.
Mark scheme, page 4
0460/11 Cambridge IGCSE – Mark Scheme PUBLISHED May/June 2021 © UCLES 2021 Page 4 of 19 Where statements are assigned levels by the examiner this should be indicated by the use of L1 and L2 next to the statements. Ticks should not be used on answers that are marked using levels of response marking. L1 annotation should be removed once a L2 is awarded for an answer. L3 annotation is not used. There is no need for a summary level at the end of a response. Summary: Level 1 (1 to 3 marks): 1 simple statement (1 mark) 2 simple statements (2 marks) 3 simple statements (3 marks) Level 2 (4 to 6 marks): 1 developed statement (4 marks) 2 developed statements (5 marks) 3 or more developed statements with e.g. (6 marks) Level 3 (7 marks) 3 or more developed statements + named example with at least one piece of place specific detail.
Mark scheme, page 5
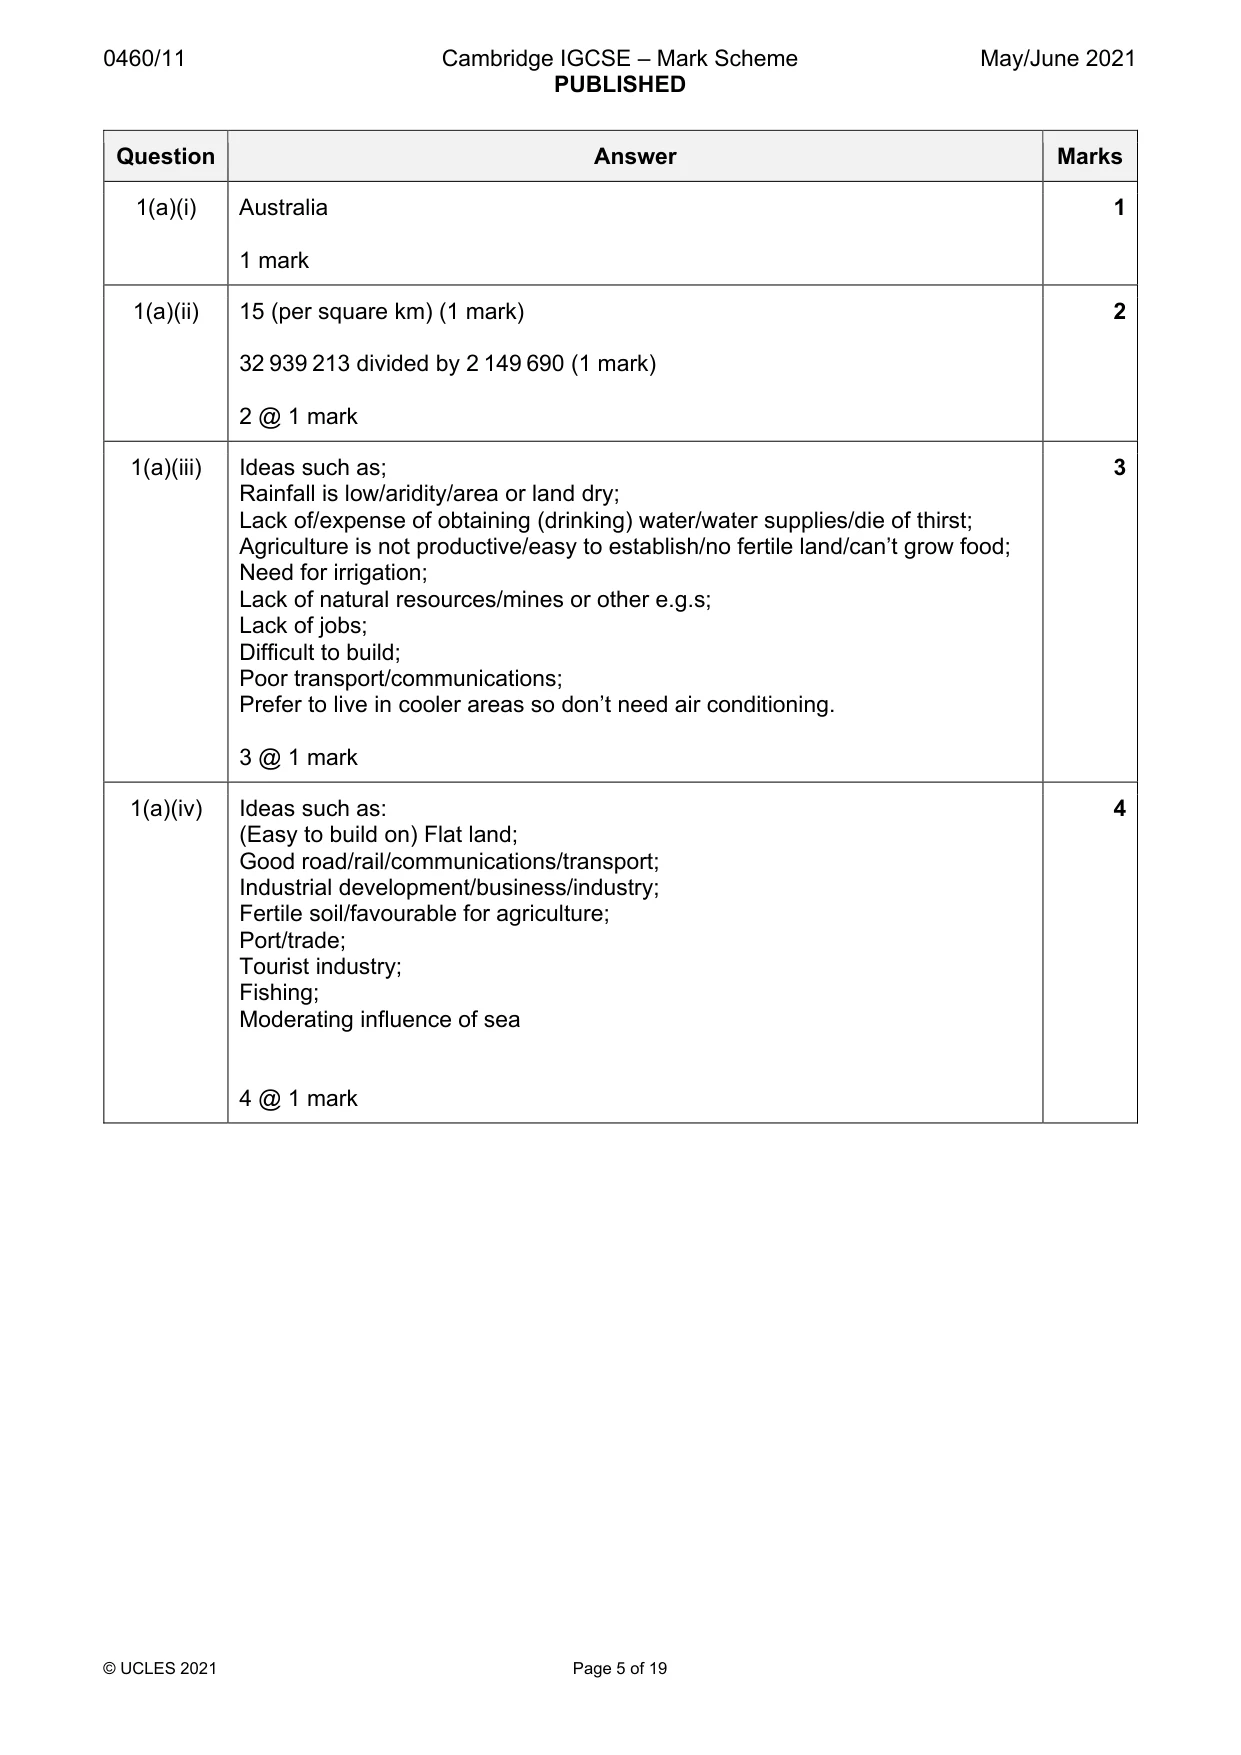
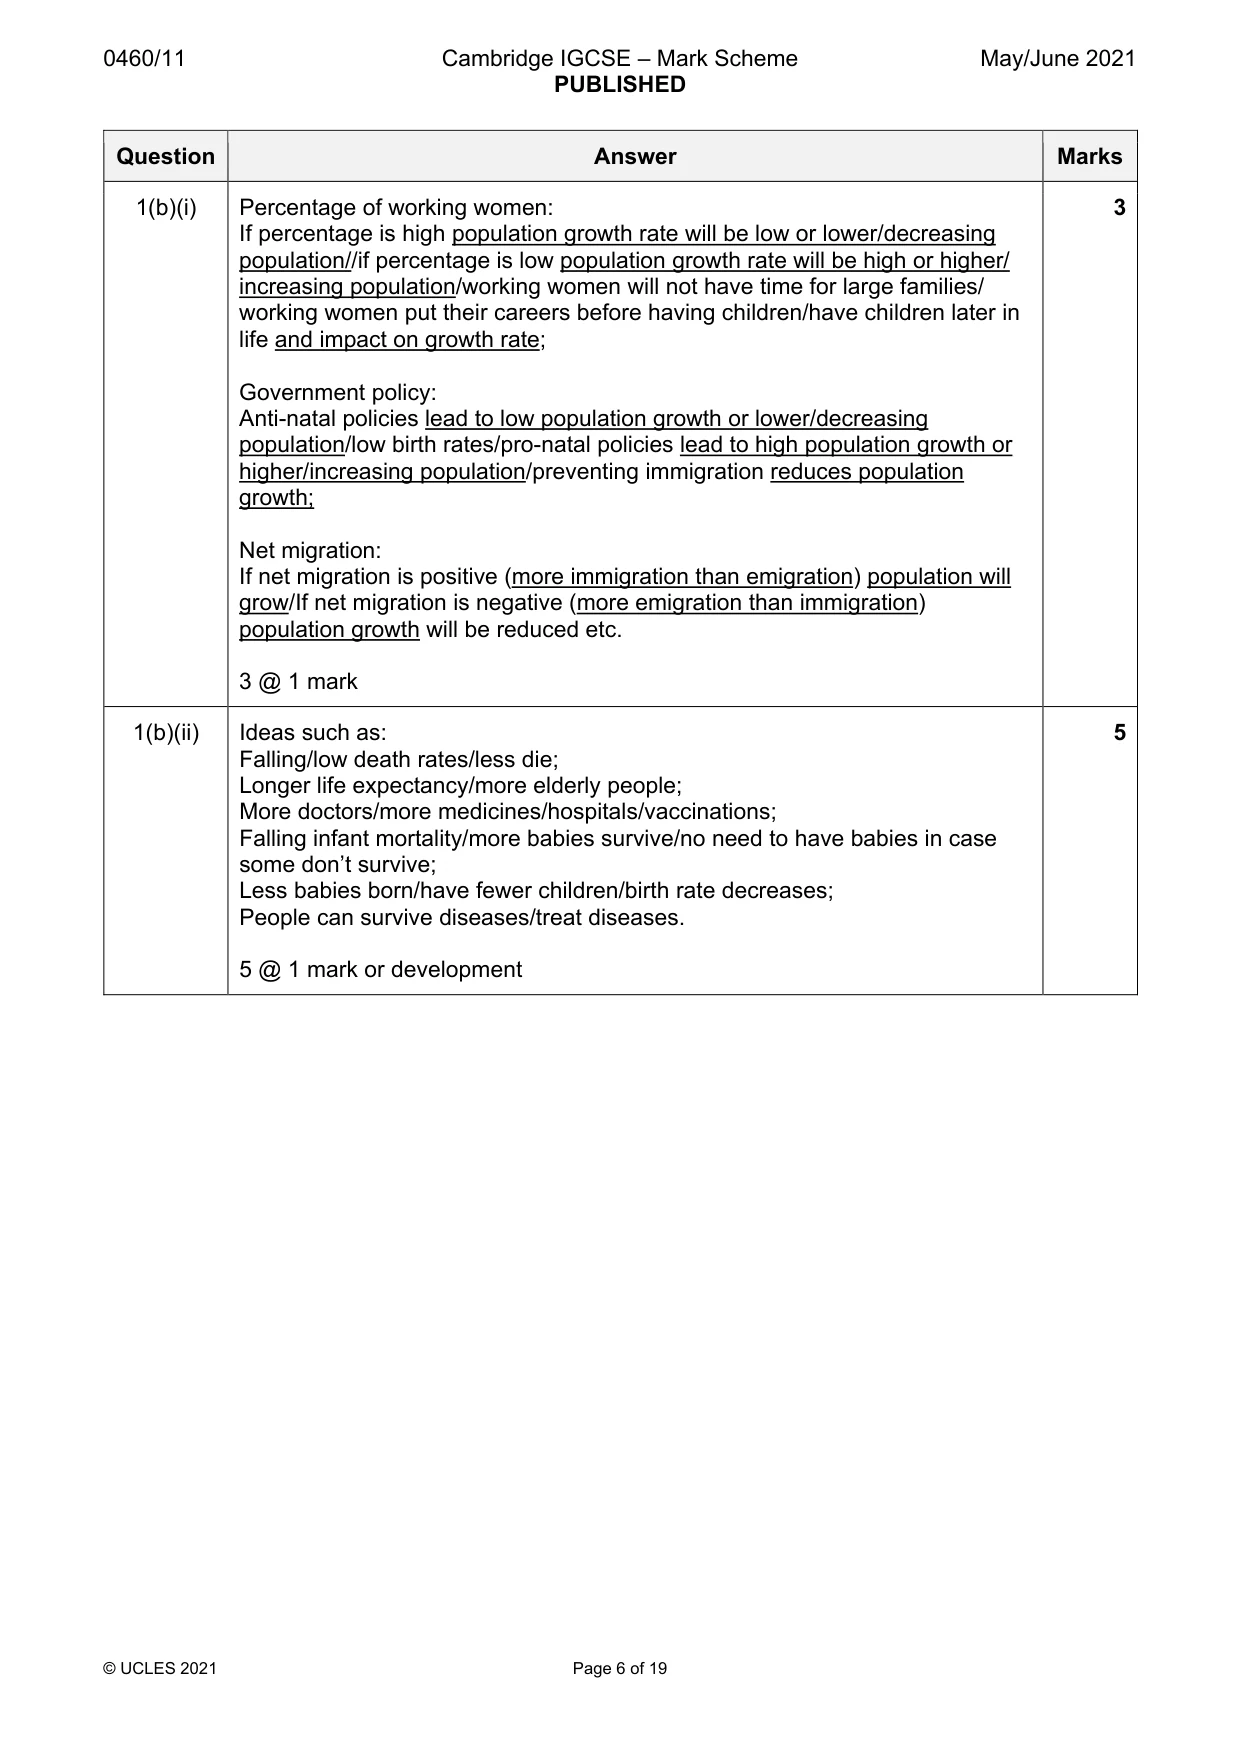
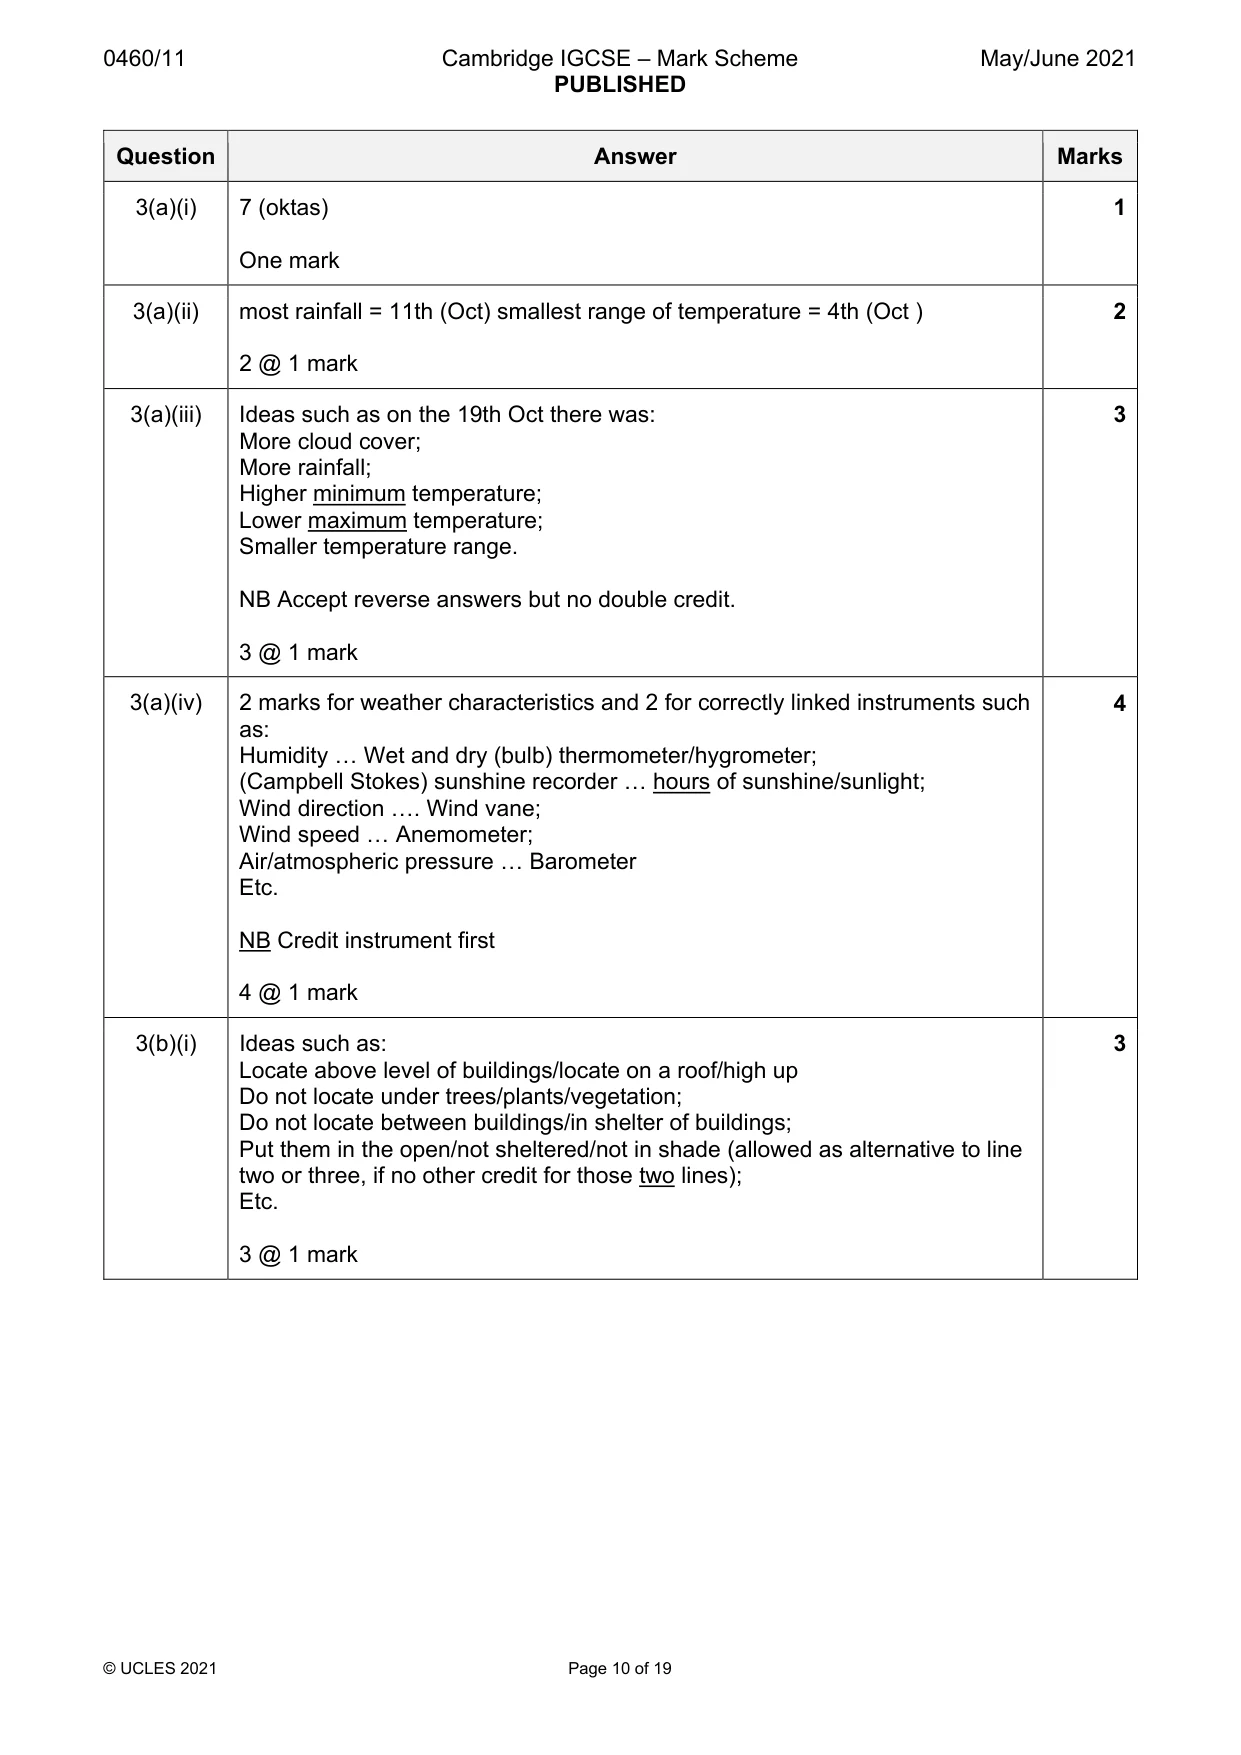
0460/11 Cambridge IGCSE – Mark Scheme PUBLISHED May/June 2021 © UCLES 2021 Page 5 of 19 Question Answer Marks 1(a)(i) Australia 1 mark 1 1(a)(ii) 15 (per square km) (1 mark) 32 939 213 divided by 2 149 690 (1 mark) 2 @ 1 mark 2 1(a)(iii) Ideas such as; Rainfall is low/aridity/area or land dry; Lack of/expense of obtaining (drinking) water/water supplies/die of thirst; Agriculture is not productive/easy to establish/no fertile land/can’t grow food; Need for irrigation; Lack of natural resources/mines or other e.g.s; Lack of jobs; Difficult to build; Poor transport/communications; Prefer to live in cooler areas so don’t need air conditioning. 3 @ 1 mark 3 1(a)(iv) Ideas such as: (Easy to build on) Flat land; Good road/rail/communications/transport; Industrial development/business/industry; Fertile soil/favourable for agriculture; Port/trade; Tourist industry; Fishing; Moderating influence of sea 4 @ 1 mark 4
Mark scheme, page 6
0460/11 Cambridge IGCSE – Mark Scheme PUBLISHED May/June 2021 © UCLES 2021 Page 6 of 19 Question Answer Marks 1(b)(i) Percentage of working women: If percentage is high population growth rate will be low or lower/decreasing population//if percentage is low population growth rate will be high or higher/ increasing population/working women will not have time for large families/ working women put their careers before having children/have children later in life and impact on growth rate; Government policy: Anti-natal policies lead to low population growth or lower/decreasing population/low birth rates/pro-natal policies lead to high population growth or higher/increasing population/preventing immigration reduces population growth; Net migration: If net migration is positive (more immigration than emigration) population will grow/If net migration is negative (more emigration than immigration) population growth will be reduced etc. 3 @ 1 mark 3 1(b)(ii) Ideas such as: Falling/low death rates/less die; Longer life expectancy/more elderly people; More doctors/more medicines/hospitals/vaccinations; Falling infant mortality/more babies survive/no need to have babies in case some don’t survive; Less babies born/have fewer children/birth rate decreases; People can survive diseases/treat diseases. 5 @ 1 mark or development 5
Mark scheme, page 7
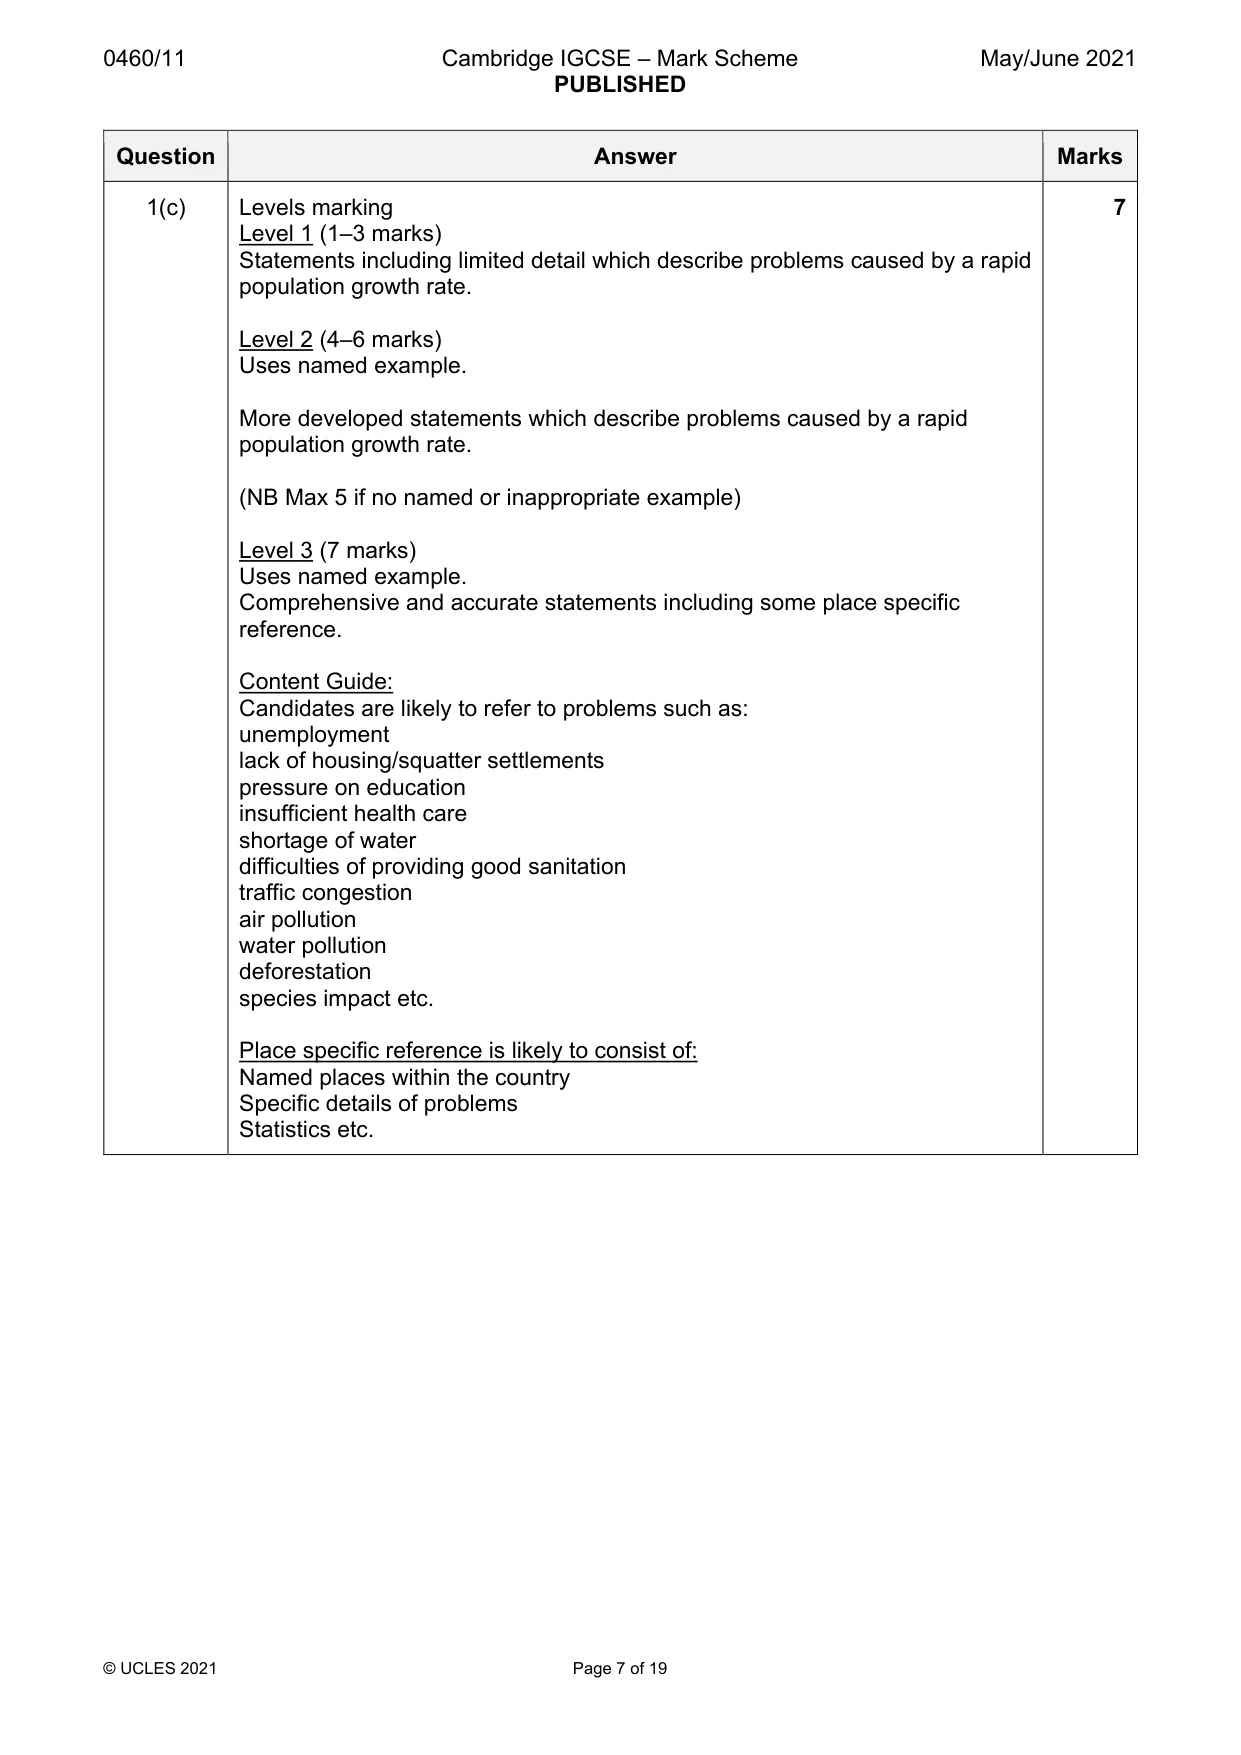
0460/11 Cambridge IGCSE – Mark Scheme PUBLISHED May/June 2021 © UCLES 2021 Page 7 of 19 Question Answer Marks 1(c) Levels marking Level 1 (1–3 marks) Statements including limited detail which describe problems caused by a rapid population growth rate. Level 2 (4–6 marks) Uses named example. More developed statements which describe problems caused by a rapid population growth rate. (NB Max 5 if no named or inappropriate example) Level 3 (7 marks) Uses named example. Comprehensive and accurate statements including some place specific reference. Content Guide: Candidates are likely to refer to problems such as: unemployment lack of housing/squatter settlements pressure on education insufficient health care shortage of water difficulties of providing good sanitation traffic congestion air pollution water pollution deforestation species impact etc. Place specific reference is likely to consist of: Named places within the country Specific details of problems Statistics etc. 7
Mark scheme, page 8
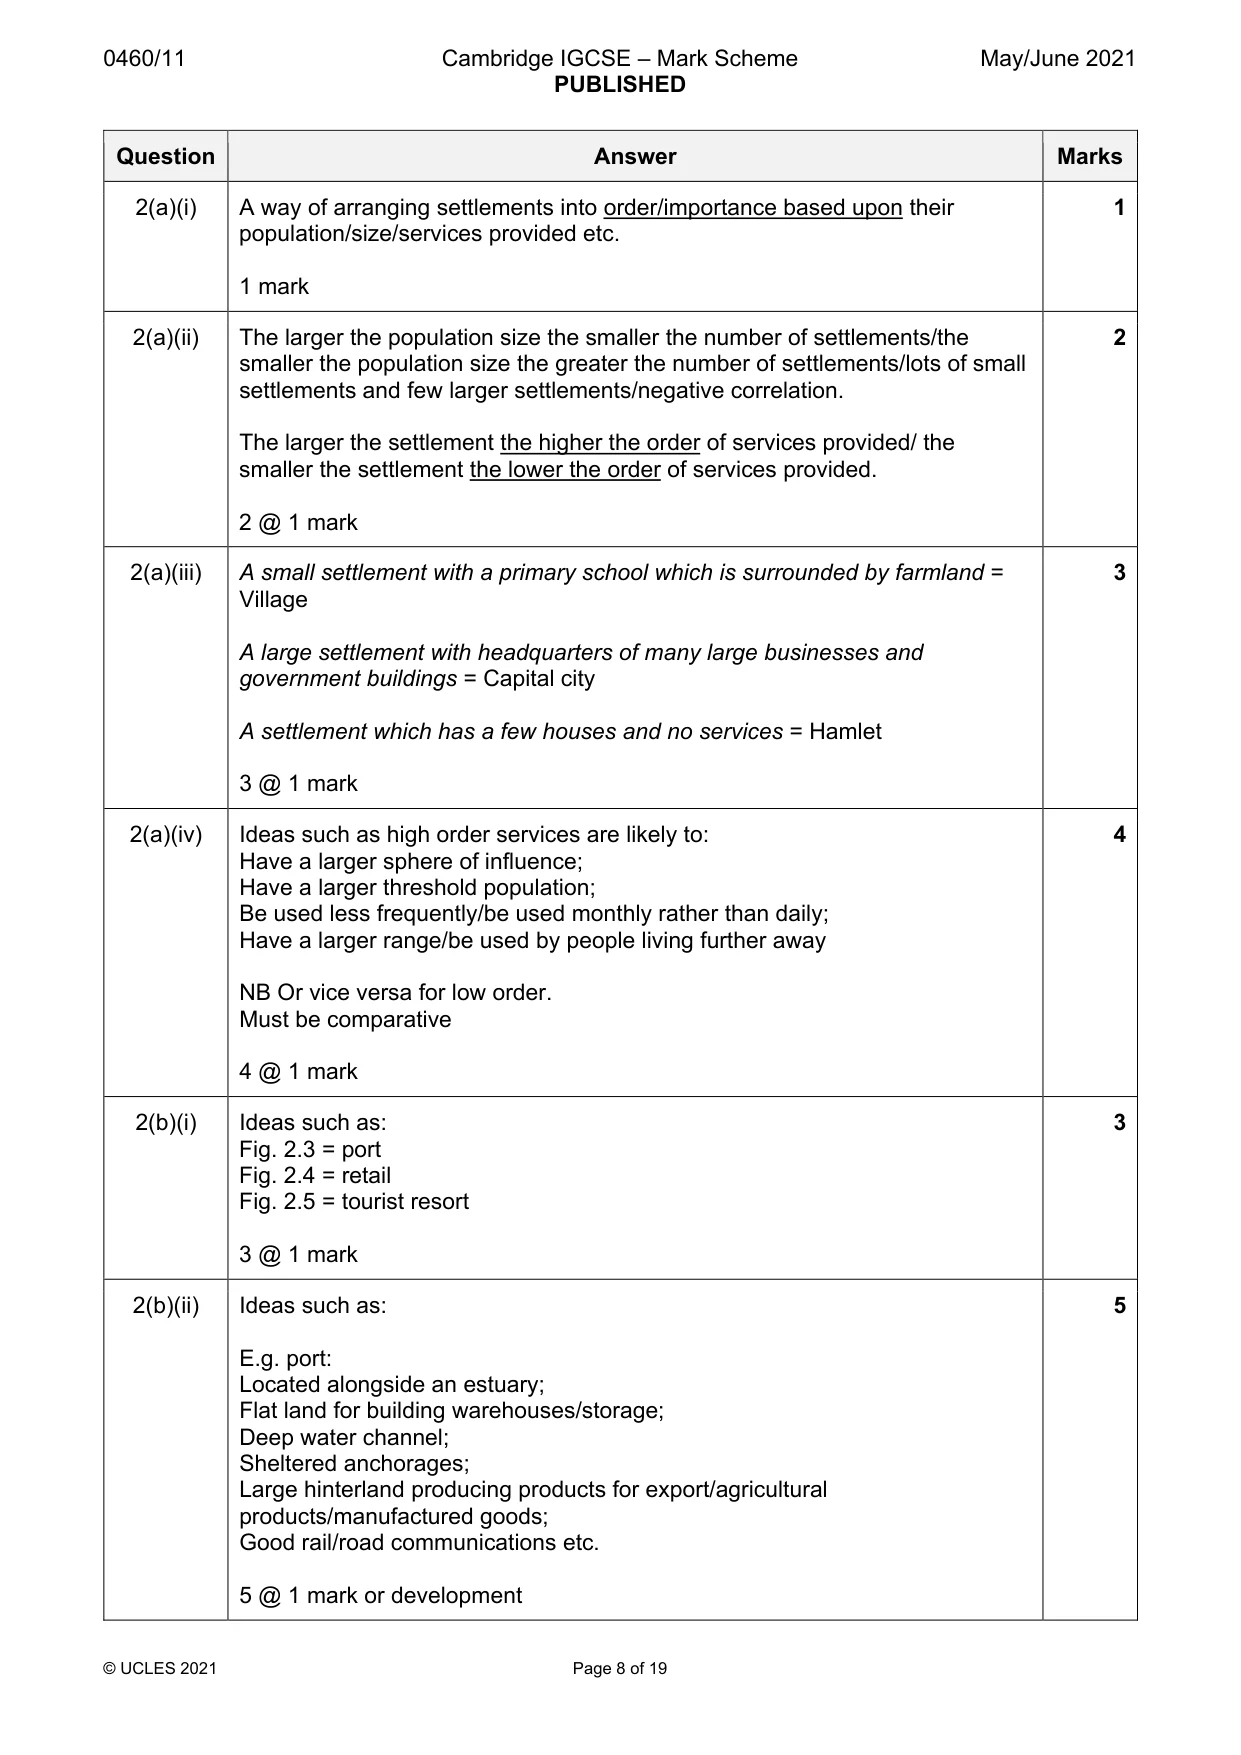
0460/11 Cambridge IGCSE – Mark Scheme PUBLISHED May/June 2021 © UCLES 2021 Page 8 of 19 Question Answer Marks 2(a)(i) A way of arranging settlements into order/importance based upon their population/size/services provided etc. 1 mark 1 2(a)(ii) The larger the population size the smaller the number of settlements/the smaller the population size the greater the number of settlements/lots of small settlements and few larger settlements/negative correlation. The larger the settlement the higher the order of services provided/ the smaller the settlement the lower the order of services provided. 2 @ 1 mark 2 2(a)(iii) A small settlement with a primary school which is surrounded by farmland = Village A large settlement with headquarters of many large businesses and government buildings = Capital city A settlement which has a few houses and no services = Hamlet 3 @ 1 mark 3 2(a)(iv) Ideas such as high order services are likely to: Have a larger sphere of influence; Have a larger threshold population; Be used less frequently/be used monthly rather than daily; Have a larger range/be used by people living further away NB Or vice versa for low order. Must be comparative 4 @ 1 mark 4 2(b)(i) Ideas such as: Fig. 2.3 = port Fig. 2.4 = retail Fig. 2.5 = tourist resort 3 @ 1 mark 3 2(b)(ii) Ideas such as: E.g. port: Located alongside an estuary; Flat land for building warehouses/storage; Deep water channel; Sheltered anchorages; Large hinterland producing products for export/agricultural products/manufactured goods; Good rail/road communications etc. 5 @ 1 mark or development 5
Mark scheme, page 9
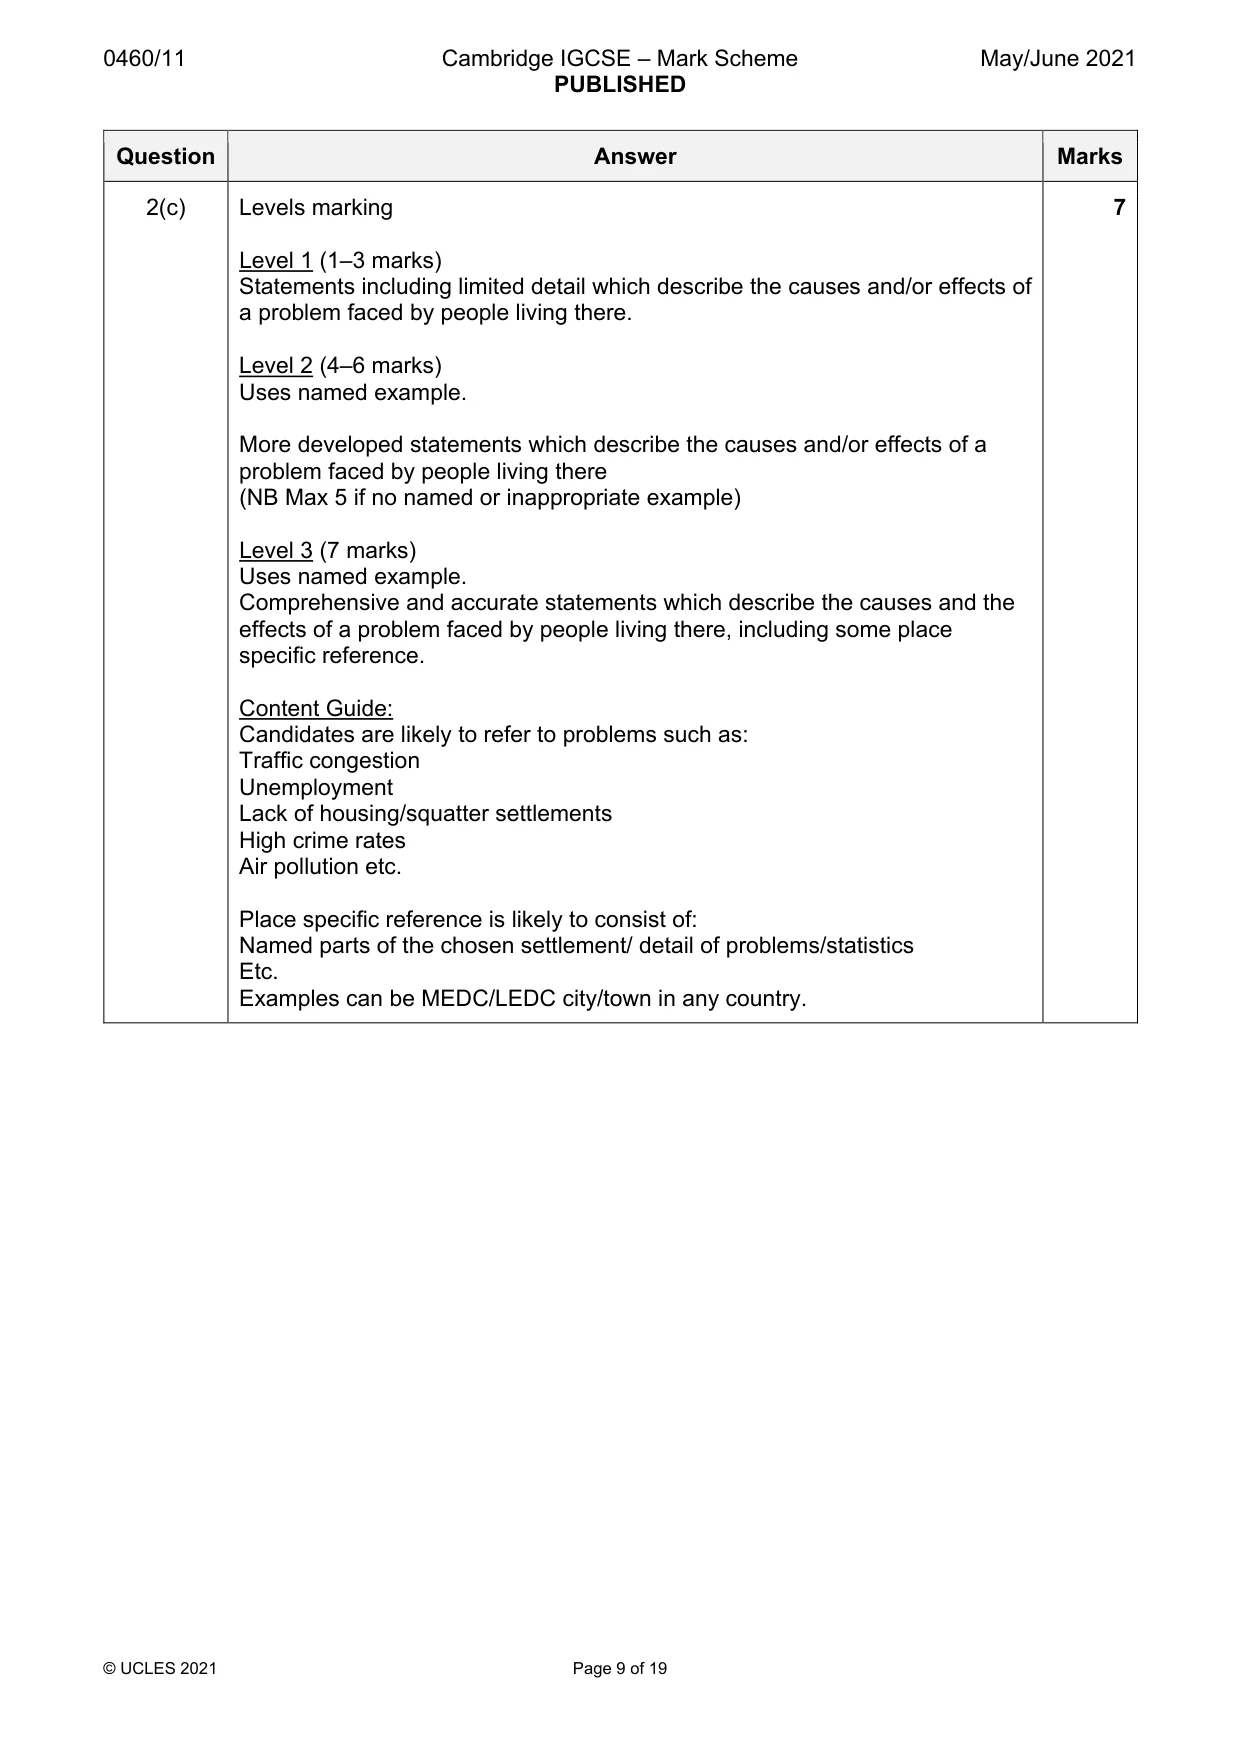
0460/11 Cambridge IGCSE – Mark Scheme PUBLISHED May/June 2021 © UCLES 2021 Page 9 of 19 Question Answer Marks 2(c) Levels marking Level 1 (1–3 marks) Statements including limited detail which describe the causes and/or effects of a problem faced by people living there. Level 2 (4–6 marks) Uses named example. More developed statements which describe the causes and/or effects of a problem faced by people living there (NB Max 5 if no named or inappropriate example) Level 3 (7 marks) Uses named example. Comprehensive and accurate statements which describe the causes and the effects of a problem faced by people living there, including some place specific reference. Content Guide: Candidates are likely to refer to problems such as: Traffic congestion Unemployment Lack of housing/squatter settlements High crime rates Air pollution etc. Place specific reference is likely to consist of: Named parts of the chosen settlement/ detail of problems/statistics Etc. Examples can be MEDC/LEDC city/town in any country. 7
Mark scheme, page 10
0460/11 Cambridge IGCSE – Mark Scheme PUBLISHED May/June 2021 © UCLES 2021 Page 10 of 19 Question Answer Marks 3(a)(i) 7 (oktas) One mark 1 3(a)(ii) most rainfall = 11th (Oct) smallest range of temperature = 4th (Oct ) 2 @ 1 mark 2 3(a)(iii) Ideas such as on the 19th Oct there was: More cloud cover; More rainfall; Higher minimum temperature; Lower maximum temperature; Smaller temperature range. NB Accept reverse answers but no double credit. 3 @ 1 mark 3 3(a)(iv) 2 marks for weather characteristics and 2 for correctly linked instruments such as: Humidity … Wet and dry (bulb) thermometer/hygrometer; (Campbell Stokes) sunshine recorder … hours of sunshine/sunlight; Wind direction …. Wind vane; Wind speed … Anemometer; Air/atmospheric pressure … Barometer Etc. NB Credit instrument first 4 @ 1 mark 4 3(b)(i) Ideas such as: Locate above level of buildings/locate on a roof/high up Do not locate under trees/plants/vegetation; Do not locate between buildings/in shelter of buildings; Put them in the open/not sheltered/not in shade (allowed as alternative to line two or three, if no other credit for those two lines); Etc. 3 @ 1 mark 3
Mark scheme, page 11
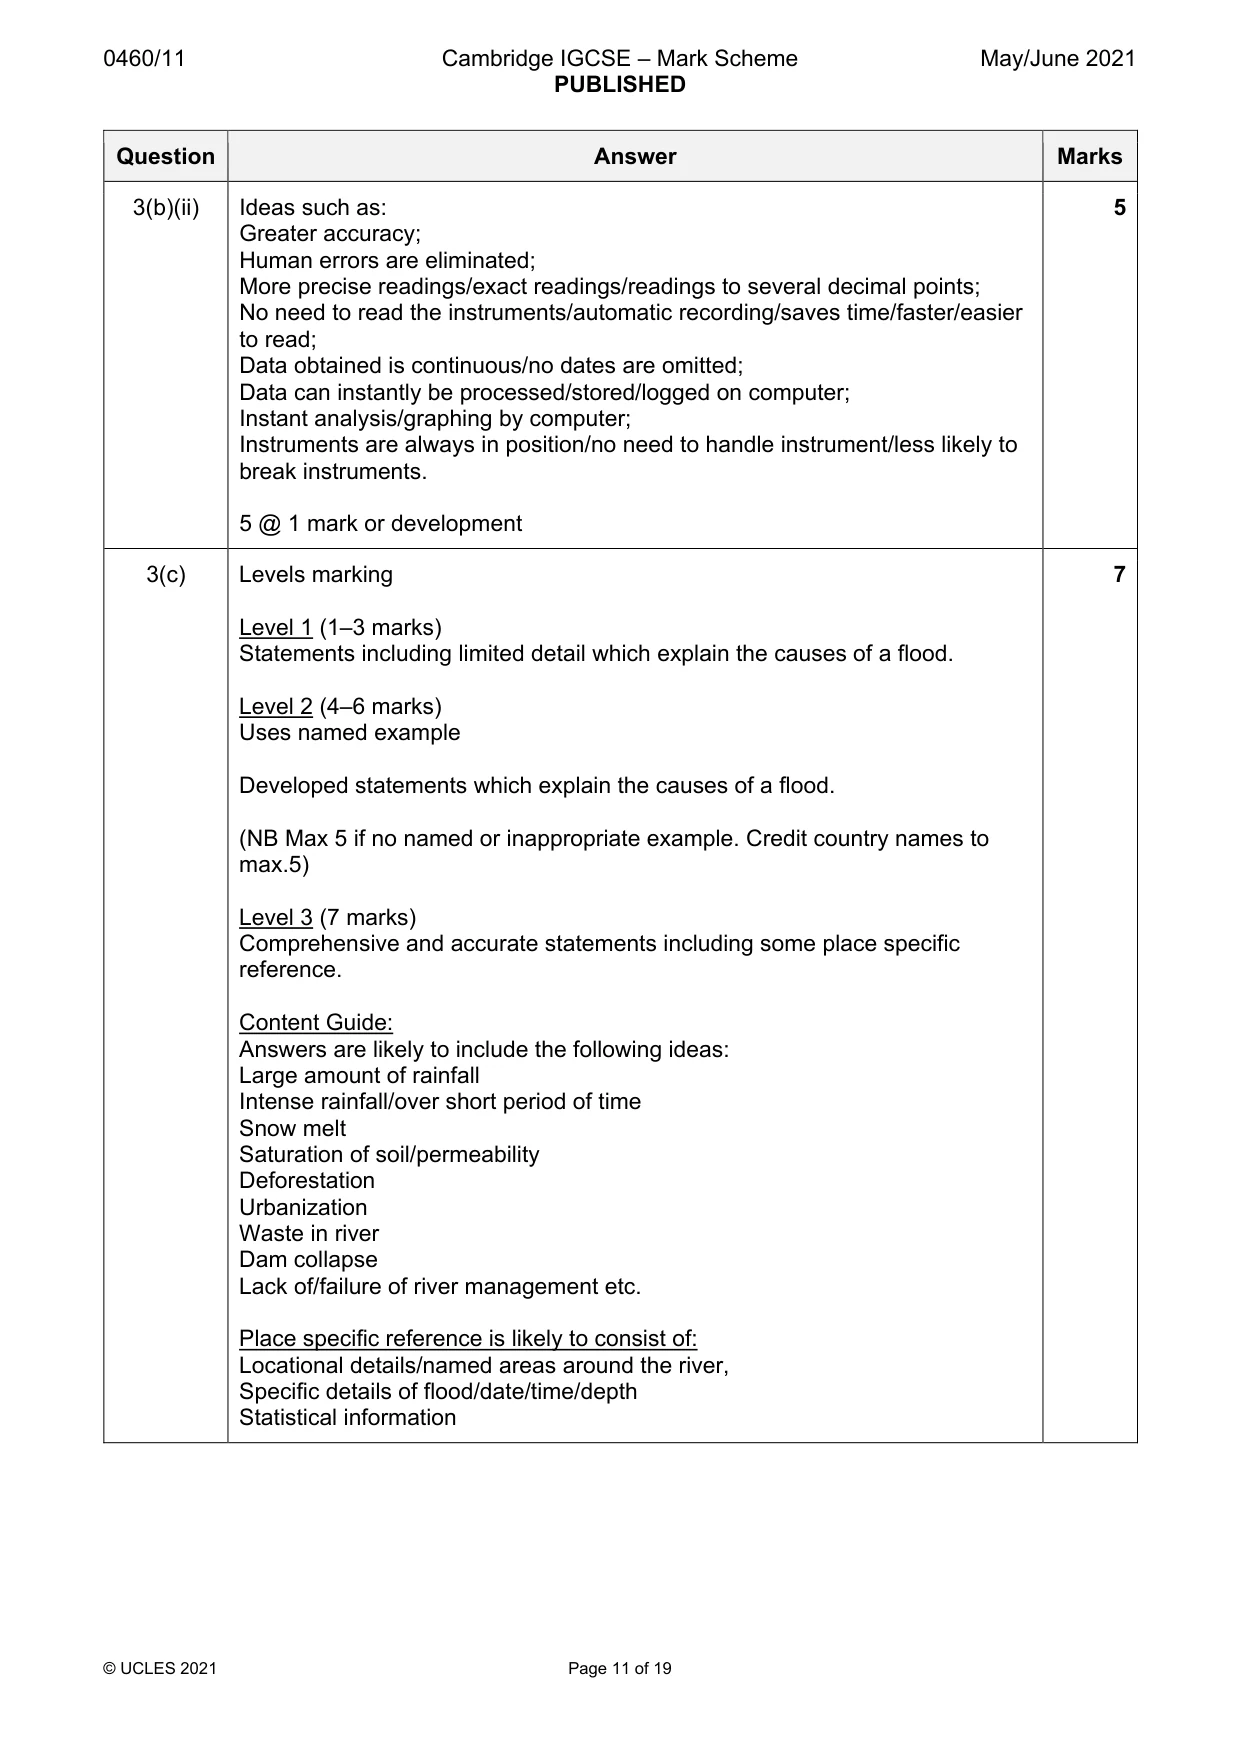
0460/11 Cambridge IGCSE – Mark Scheme PUBLISHED May/June 2021 © UCLES 2021 Page 11 of 19 Question Answer Marks 3(b)(ii) Ideas such as: Greater accuracy; Human errors are eliminated; More precise readings/exact readings/readings to several decimal points; No need to read the instruments/automatic recording/saves time/faster/easier to read; Data obtained is continuous/no dates are omitted; Data can instantly be processed/stored/logged on computer; Instant analysis/graphing by computer; Instruments are always in position/no need to handle instrument/less likely to break instruments. 5 @ 1 mark or development 5 3(c) Levels marking Level 1 (1–3 marks) Statements including limited detail which explain the causes of a flood. Level 2 (4–6 marks) Uses named example Developed statements which explain the causes of a flood. (NB Max 5 if no named or inappropriate example. Credit country names to max.5) Level 3 (7 marks) Comprehensive and accurate statements including some place specific reference. Content Guide: Answers are likely to include the following ideas: Large amount of rainfall Intense rainfall/over short period of time Snow melt Saturation of soil/permeability Deforestation Urbanization Waste in river Dam collapse Lack of/failure of river management etc. Place specific reference is likely to consist of: Locational details/named areas around the river, Specific details of flood/date/time/depth Statistical information 7
Mark scheme, page 12
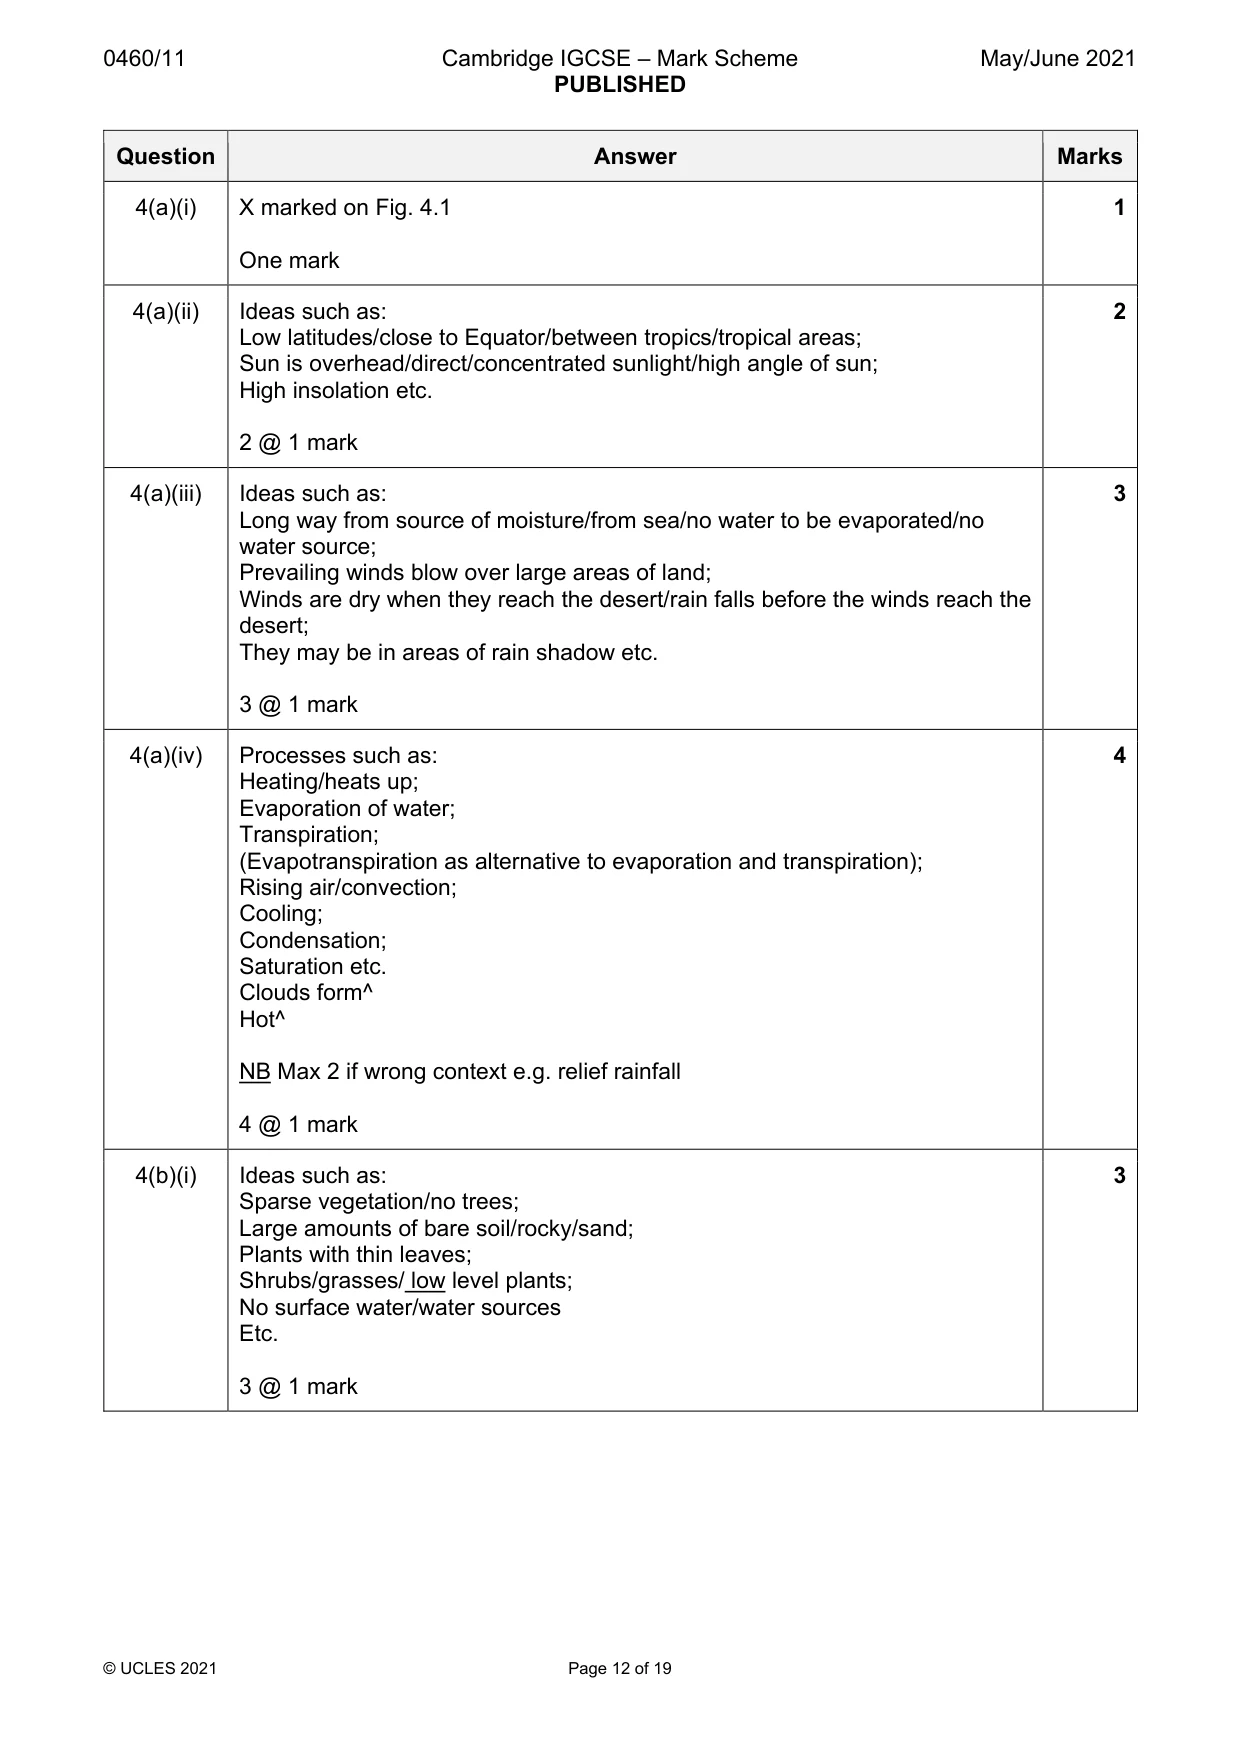
0460/11 Cambridge IGCSE – Mark Scheme PUBLISHED May/June 2021 © UCLES 2021 Page 12 of 19 Question Answer Marks 4(a)(i) X marked on Fig. 4.1 One mark 1 4(a)(ii) Ideas such as: Low latitudes/close to Equator/between tropics/tropical areas; Sun is overhead/direct/concentrated sunlight/high angle of sun; High insolation etc. 2 @ 1 mark 2 4(a)(iii) Ideas such as: Long way from source of moisture/from sea/no water to be evaporated/no water source; Prevailing winds blow over large areas of land; Winds are dry when they reach the desert/rain falls before the winds reach the desert; They may be in areas of rain shadow etc. 3 @ 1 mark 3 4(a)(iv) Processes such as: Heating/heats up; Evaporation of water; Transpiration; (Evapotranspiration as alternative to evaporation and transpiration); Rising air/convection; Cooling; Condensation; Saturation etc. Clouds form^ Hot^ NB Max 2 if wrong context e.g. relief rainfall 4 @ 1 mark 4 4(b)(i) Ideas such as: Sparse vegetation/no trees; Large amounts of bare soil/rocky/sand; Plants with thin leaves; Shrubs/grasses/ low level plants; No surface water/water sources Etc. 3 @ 1 mark 3
Mark scheme, page 13
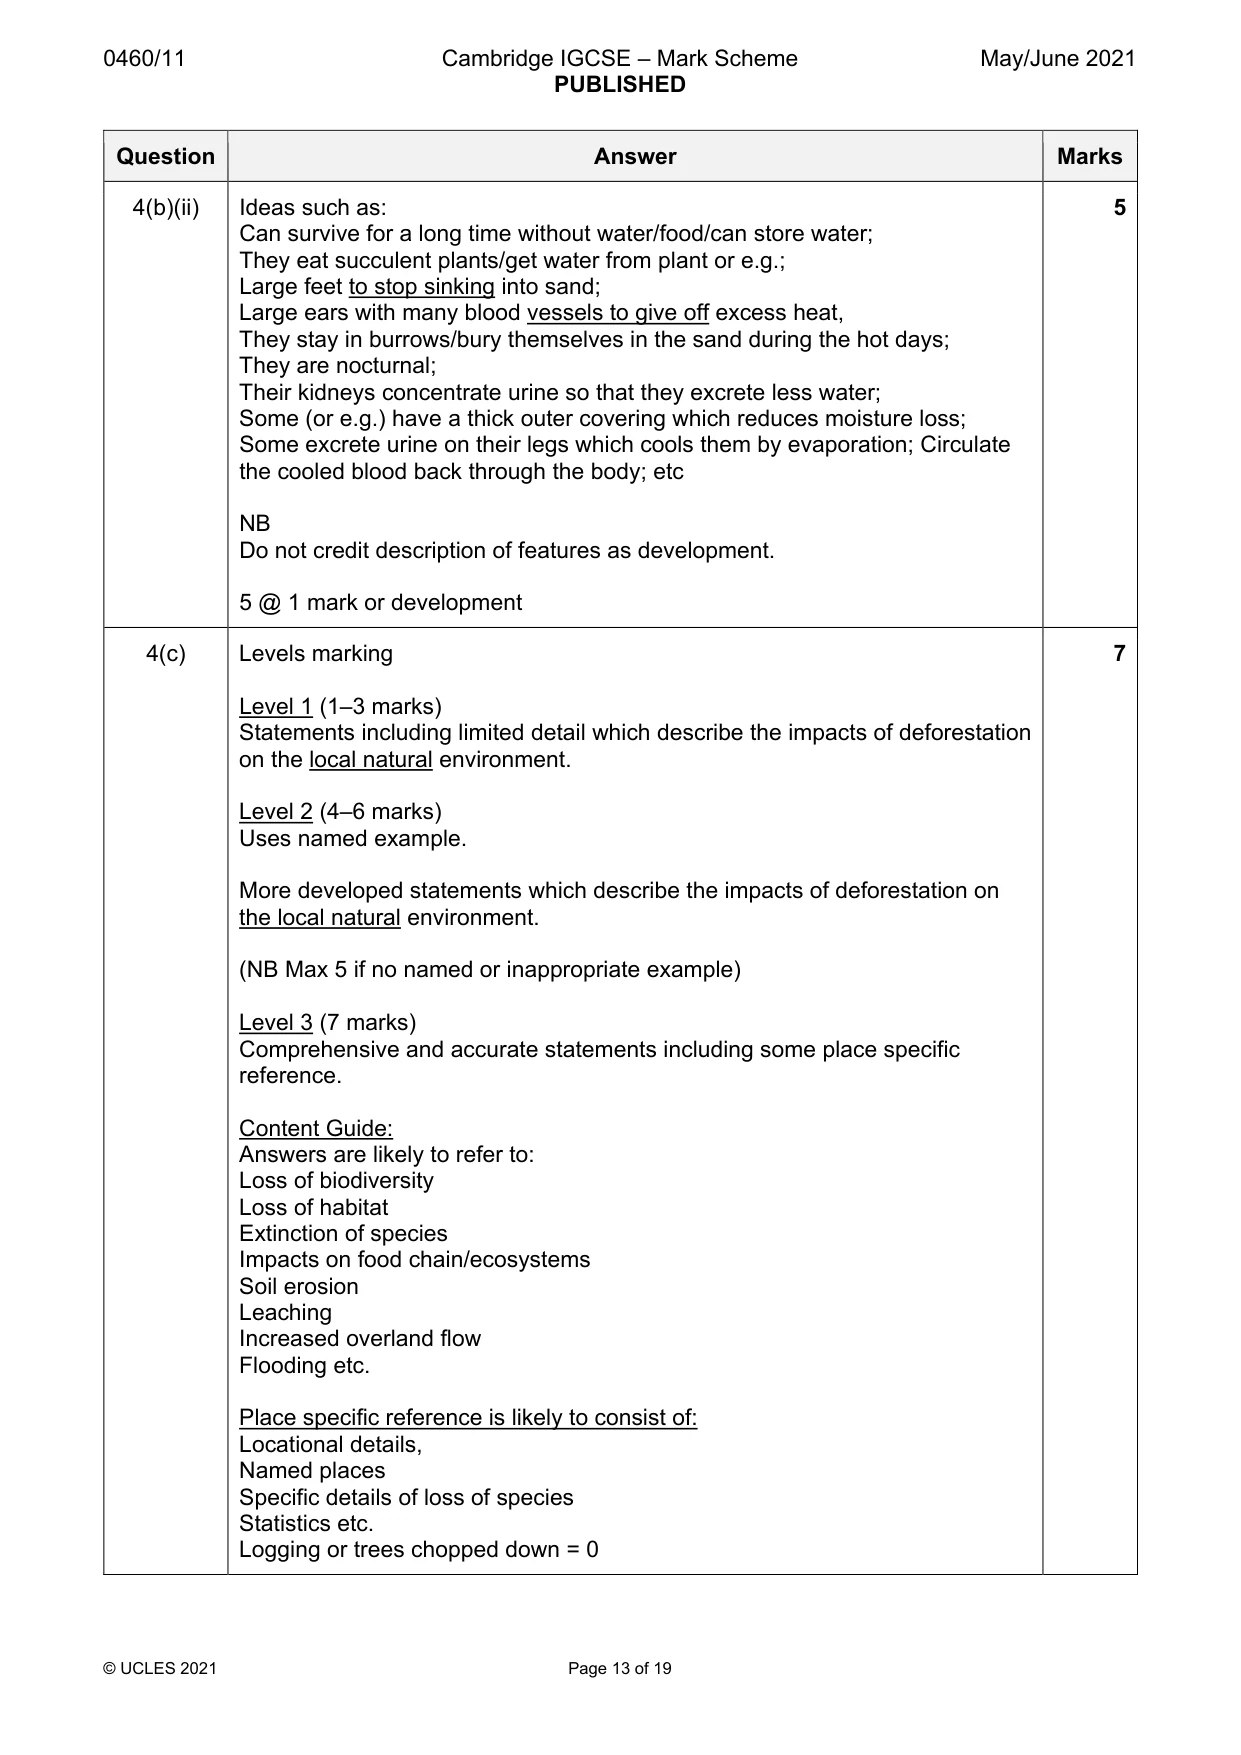
0460/11 Cambridge IGCSE – Mark Scheme PUBLISHED May/June 2021 © UCLES 2021 Page 13 of 19 Question Answer Marks 4(b)(ii) Ideas such as: Can survive for a long time without water/food/can store water; They eat succulent plants/get water from plant or e.g.; Large feet to stop sinking into sand; Large ears with many blood vessels to give off excess heat, They stay in burrows/bury themselves in the sand during the hot days; They are nocturnal; Their kidneys concentrate urine so that they excrete less water; Some (or e.g.) have a thick outer covering which reduces moisture loss; Some excrete urine on their legs which cools them by evaporation; Circulate the cooled blood back through the body; etc NB Do not credit description of features as development. 5 @ 1 mark or development 5 4(c) Levels marking Level 1 (1–3 marks) Statements including limited detail which describe the impacts of deforestation on the local natural environment. Level 2 (4–6 marks) Uses named example. More developed statements which describe the impacts of deforestation on the local natural environment. (NB Max 5 if no named or inappropriate example) Level 3 (7 marks) Comprehensive and accurate statements including some place specific reference. Content Guide: Answers are likely to refer to: Loss of biodiversity Loss of habitat Extinction of species Impacts on food chain/ecosystems Soil erosion Leaching Increased overland flow Flooding etc. Place specific reference is likely to consist of: Locational details, Named places Specific details of loss of species Statistics etc. Logging or trees chopped down = 0 7
Mark scheme, page 14
0460/11 Cambridge IGCSE – Mark Scheme PUBLISHED May/June 2021 © UCLES 2021 Page 14 of 19 Question Answer Marks 5(a)(i) Best fit line One mark 1 5(a)(ii) E.g. Kenya/Malaysia has high IMR and low GDP but USA/Kuwait/Italy/Japan/USA has low IMR but high GDP/or use higher and lower to show comparison (1 mark) Accurate statistics for both countries to illustrate the above. (1 mark) 2 @ 1 mark 2 5(a)(iii) Ideas such as in countries with high GDP IMR is low because: There is good health care/clinics/hospitals/medical equipment; Many doctors/nurses; Vaccinations available; Medicines are available; Children/babies are well fed/food available; There are clean water supplies; Mothers are educated about care of their infants etc. NB Or vice versa for countries with low GDP 3 @ 1 mark 3 5(a)(iv) HDI is a composite indicator of development HDI scores for every country are between 0 and 1 Many people who live in a country with a low HDI will not have completed secondary education The lower the HDI the shorter the life expectancy is likely to be. 4 @ 1 mark 4 5(b)(i) Ideas such as: Higher energy use in northern hemisphere/lower in southern hemisphere; Higher in temperate areas/lower in tropical areas/high in equatorial and low in polar; Higher in MEDCs/low in LEDCs High in North America/northern Asia/Australasia but low in Africa/southern Asia; Etc. NB Must be comparative 3 @ 1 mark 3
Mark scheme, page 15
0460/11 Cambridge IGCSE – Mark Scheme PUBLISHED May/June 2021 © UCLES 2021 Page 15 of 19 Question Answer Marks 5(b)(ii) Ideas such as: Some countries have more/a large amount of (energy) resources; E.g. oil, coal etc.; Some countries/people can afford energy/can afford to develop energy supplies; Access to technology/skills; Energy/electricity supply/grid is available throughout the country; Using more electronic devices/home appliances or e.g.; Some countries are industrialized/have more factories; E.g. manufacturing industry is likely to use large amounts of energy; Some countries use a lot of transport/have more cars; E.g. car ownership is high in MEDCs/delivery by HGVs; Some countries travel by plane/for leisure travel; Specified reference to impact of climate e.g. impact of air conditioning/central heating etc.; 5 @ 1 mark or development 5
Mark scheme, page 16
0460/11 Cambridge IGCSE – Mark Scheme PUBLISHED May/June 2021 © UCLES 2021 Page 16 of 19 Question Answer Marks 5(c) Levels marking Level 1 (1–3 marks) Statements including limited detail which describe advantages and/or disadvantages of TNC for local people. Level 2 (4–6 marks) Uses named example of TNC. More developed statements which describe advantages and/or disadvantages of TNC for local people. (NB Max 5 if no named or inappropriate example) Level 3 (7 marks) Comprehensive and accurate statements including some place specific reference. Content Guide: Answers are likely to refer to: Employment Improvements in infrastructure Wealth creation Development of health care Multiplier effect Skills development/education Exploitation Low pay Few safe working regulations Little profit stays in country Impact of air/water pollution etc. Place specific reference is likely to consist of: Specific details about TNC Named areas where TNC operates Statistical detail 7
Mark scheme, page 17
0460/11 Cambridge IGCSE – Mark Scheme PUBLISHED May/June 2021 © UCLES 2021 Page 17 of 19 Question Answer Marks 6(a)(i) Washing machine factory One mark 1 6(a)(ii) The bakery is: Closer to the CBD; Closer to the railway line/bakery close to road/bakery is close to railway and road whilst cement factory is close to a road; Closer to the Motorway; Bakery in built up area but cement factory is outside the built up area/in rural area etc. NB Must be comparative 2 @ 1 mark 2 6(a)(iii) Ideas such as: Bread is bulky; Reduces transport costs; Bread is perishable/can be sold whilst still fresh; More profitable/more business; Etc. 3 @ 1 mark 3 6(a)(iv) Advantages such as: Land is plentiful on edge of city (1) so plenty of room for assembly lines/ expansion (1); Land is cheaper on edge of city (1) so costs are reduced (1); Close to motorway/main road (1) so components can be delivered/products/goods can be transported to market/CBD (1) Large amounts of labour is available (1) for manual assembly jobs/packing/working in offices (1) etc.; On (ring) road (1) so that delivery vehicles do not have to drive through city centre/inner city; Easy to get to port/capital (1) for export/sales; Away from city (1) so no complaints about noise/avoid congestion (1); 4 @ 1 marks 4 6(b)(i) Ideas such as: Industry is more important in the north/less important in the south; There are more different industries/more variety in the north; Engineering/furniture industry is in the north but not the south; There are food industries/textiles in both the north and south; Engineering in north but food in south or other correct comparison; etc. NB Must be comparative. Allow contrast between Sicily and the north. 3 @ 1 mark 3
Mark scheme, page 18
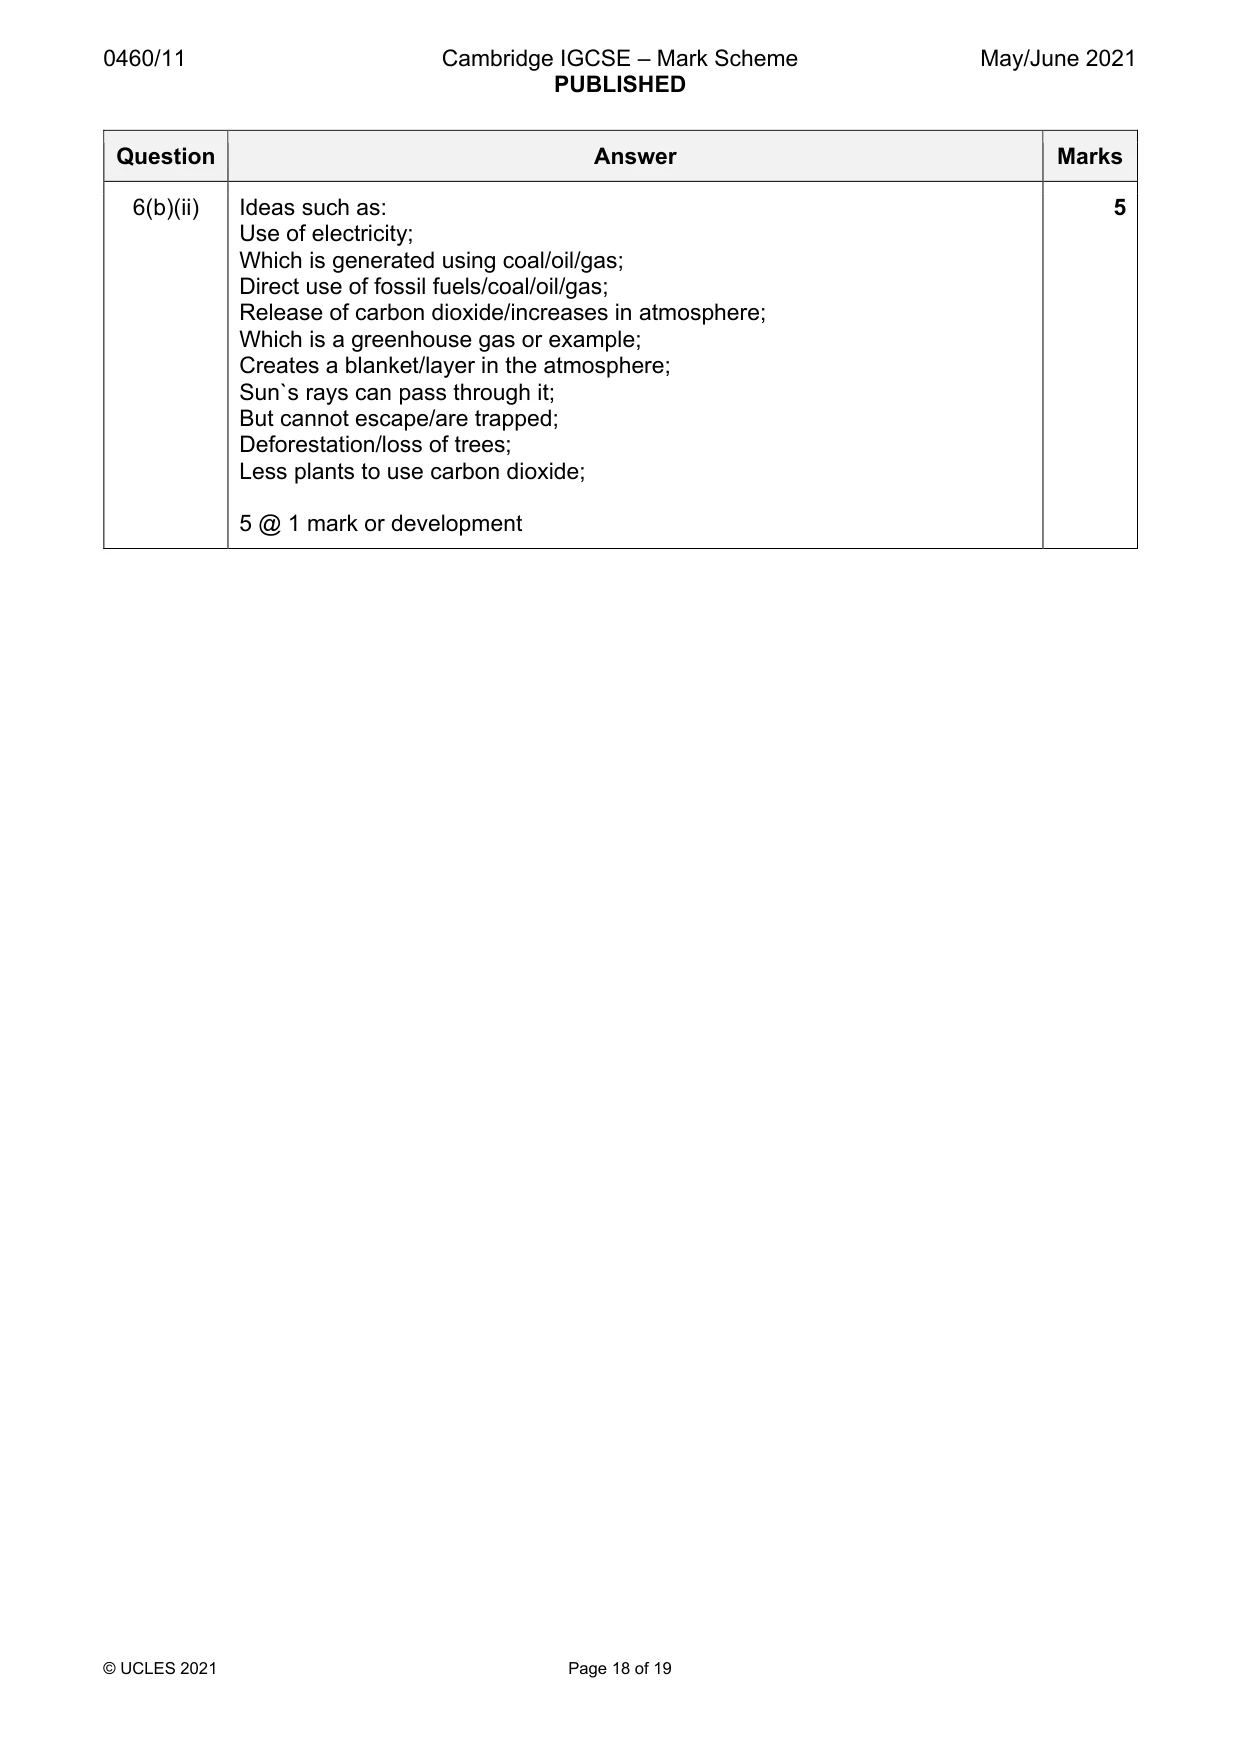
0460/11 Cambridge IGCSE – Mark Scheme PUBLISHED May/June 2021 © UCLES 2021 Page 18 of 19 Question Answer Marks 6(b)(ii) Ideas such as: Use of electricity; Which is generated using coal/oil/gas; Direct use of fossil fuels/coal/oil/gas; Release of carbon dioxide/increases in atmosphere; Which is a greenhouse gas or example; Creates a blanket/layer in the atmosphere; Sun`s rays can pass through it; But cannot escape/are trapped; Deforestation/loss of trees; Less plants to use carbon dioxide; 5 @ 1 mark or development 5
Mark scheme, page 19
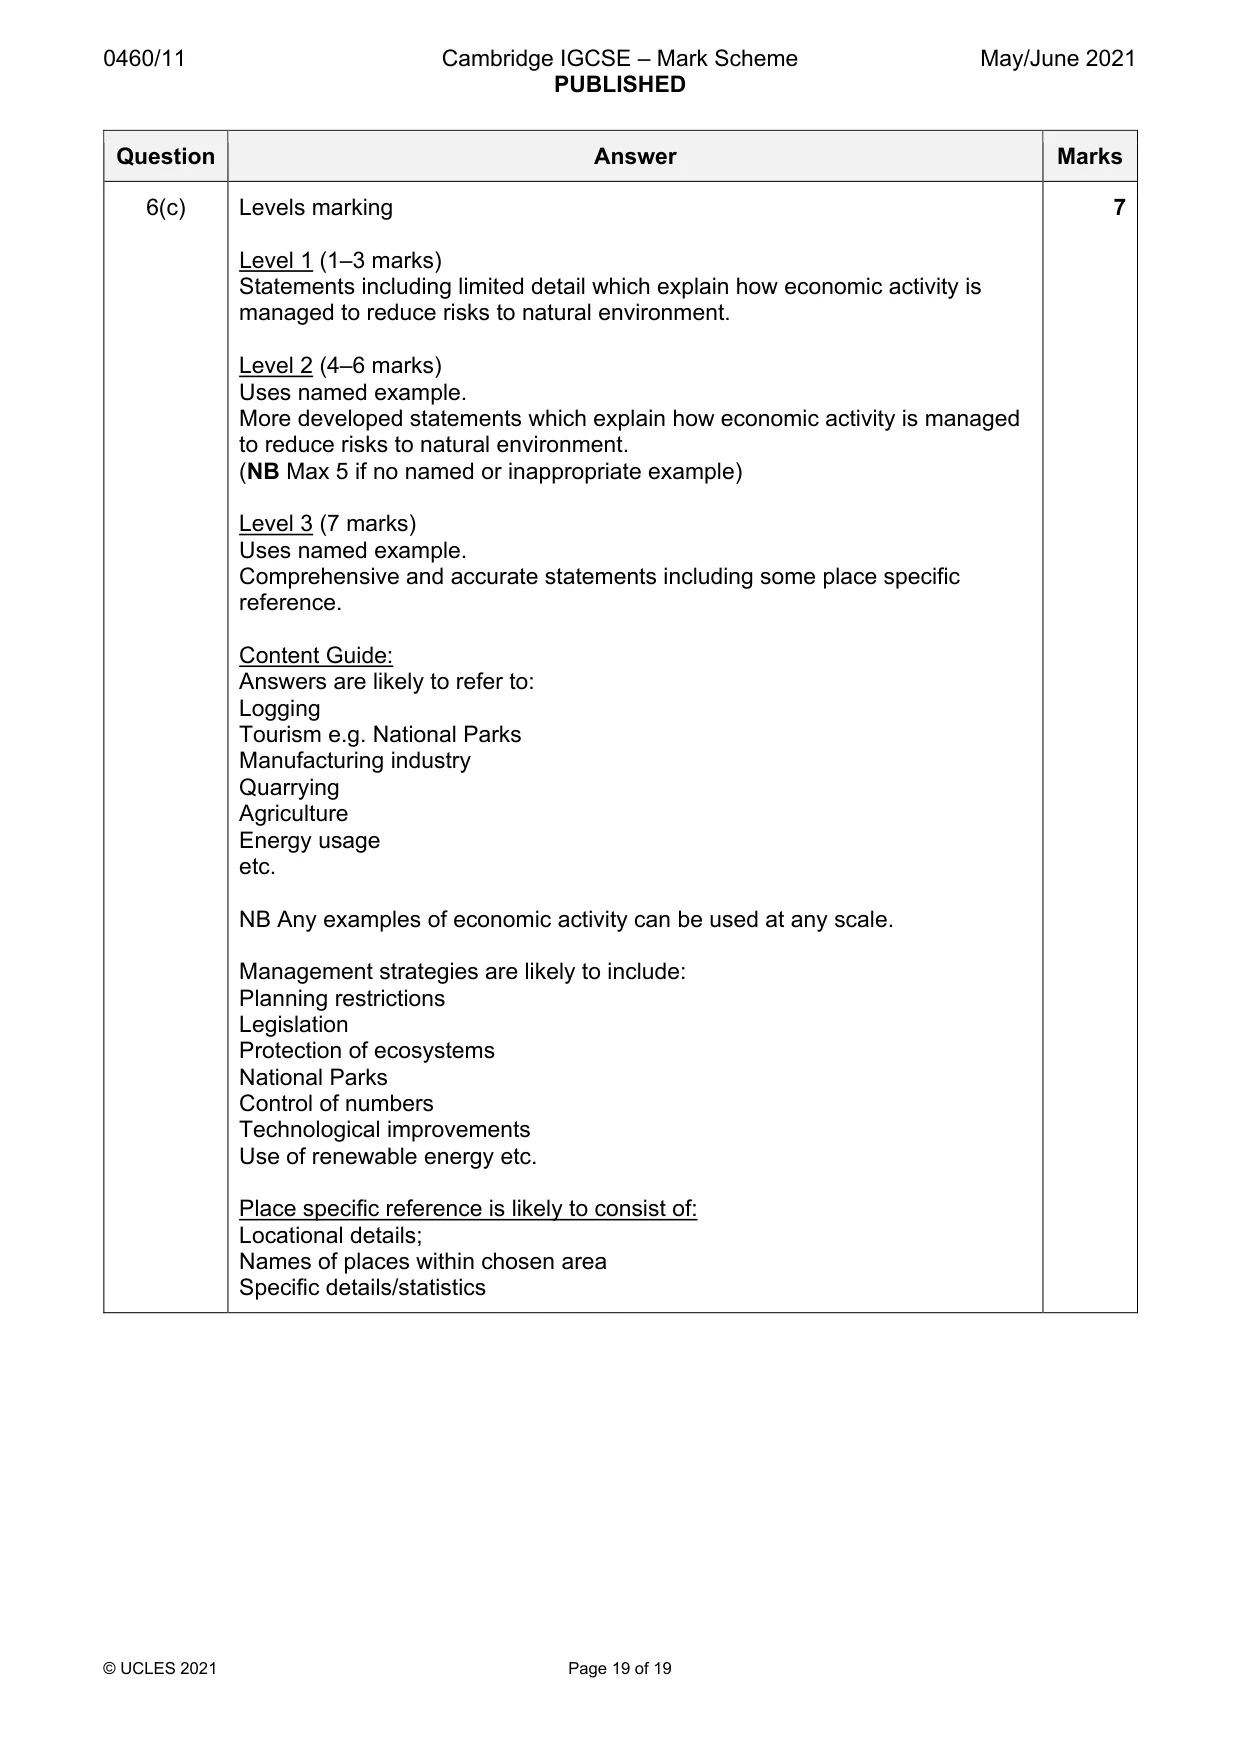
0460/11 Cambridge IGCSE – Mark Scheme PUBLISHED May/June 2021 © UCLES 2021 Page 19 of 19 Question Answer Marks 6(c) Levels marking Level 1 (1–3 marks) Statements including limited detail which explain how economic activity is managed to reduce risks to natural environment. Level 2 (4–6 marks) Uses named example. More developed statements which explain how economic activity is managed to reduce risks to natural environment. (NB Max 5 if no named or inappropriate example) Level 3 (7 marks) Uses named example. Comprehensive and accurate statements including some place specific reference. Content Guide: Answers are likely to refer to: Logging Tourism e.g. National Parks Manufacturing industry Quarrying Agriculture Energy usage etc. NB Any examples of economic activity can be used at any scale. Management strategies are likely to include: Planning restrictions Legislation Protection of ecosystems National Parks Control of numbers Technological improvements Use of renewable energy etc. Place specific reference is likely to consist of: Locational details; Names of places within chosen area Specific details/statistics 7
What you needed in this session
Cambridge’s own grade thresholds for 2021 May/June, Paper 1 · Variant 1. A higher threshold means an easier paper — the bar moves with how the cohort did.