Cambridge IGCSE Geography 0460 — 2021 Feb/March Paper 4 · Variant 2
0460/42/F/M/21 · 2 questions · 60 marks · ≈68 min
The question paper and its mark scheme, free to read here and free to download. This is Cambridge’s own paper, exactly as it was sat.
Question paper20 pages


Mark scheme7 pages
Answers below. Sit the paper first if you are practising.
Questions as text
Q1 · Students in Botswana did some fieldwork to investigate the CBD of Gaborone, the capital…
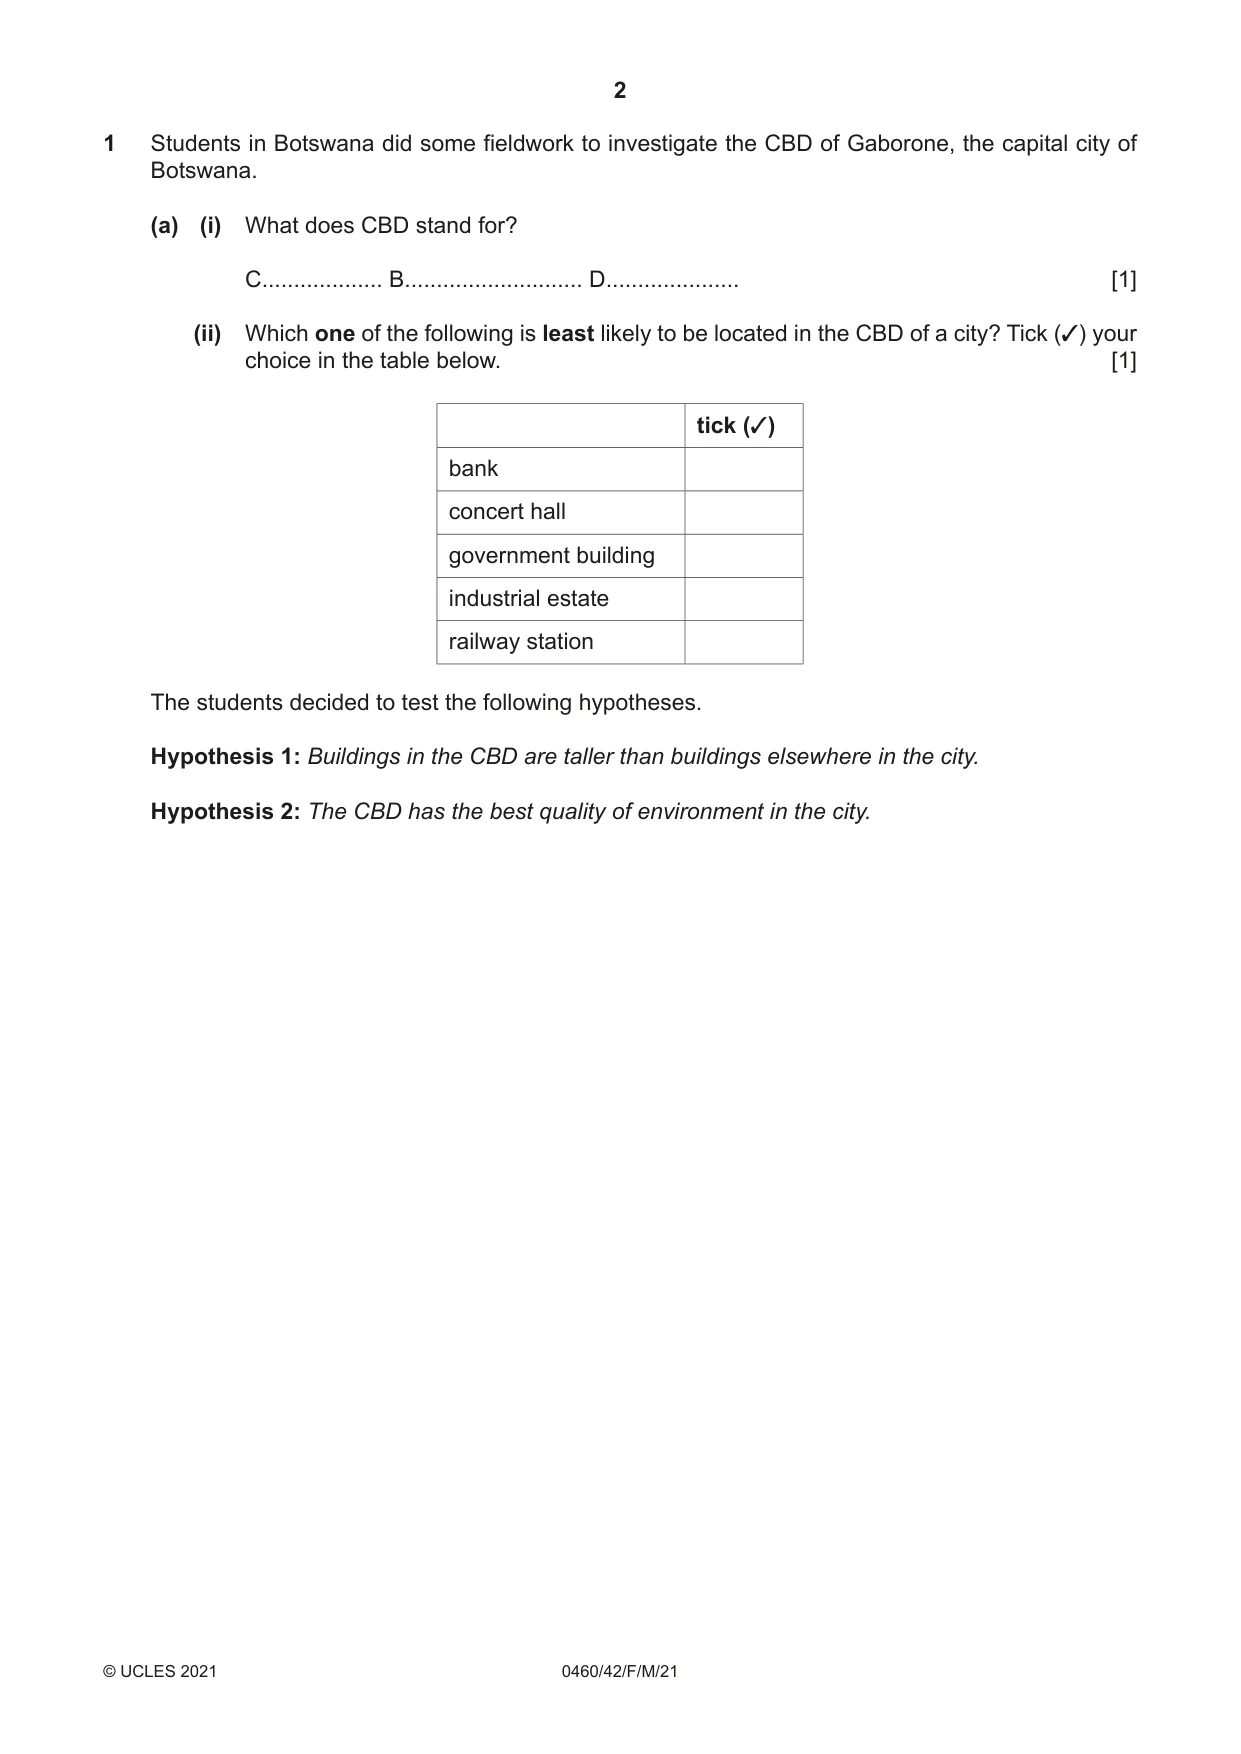
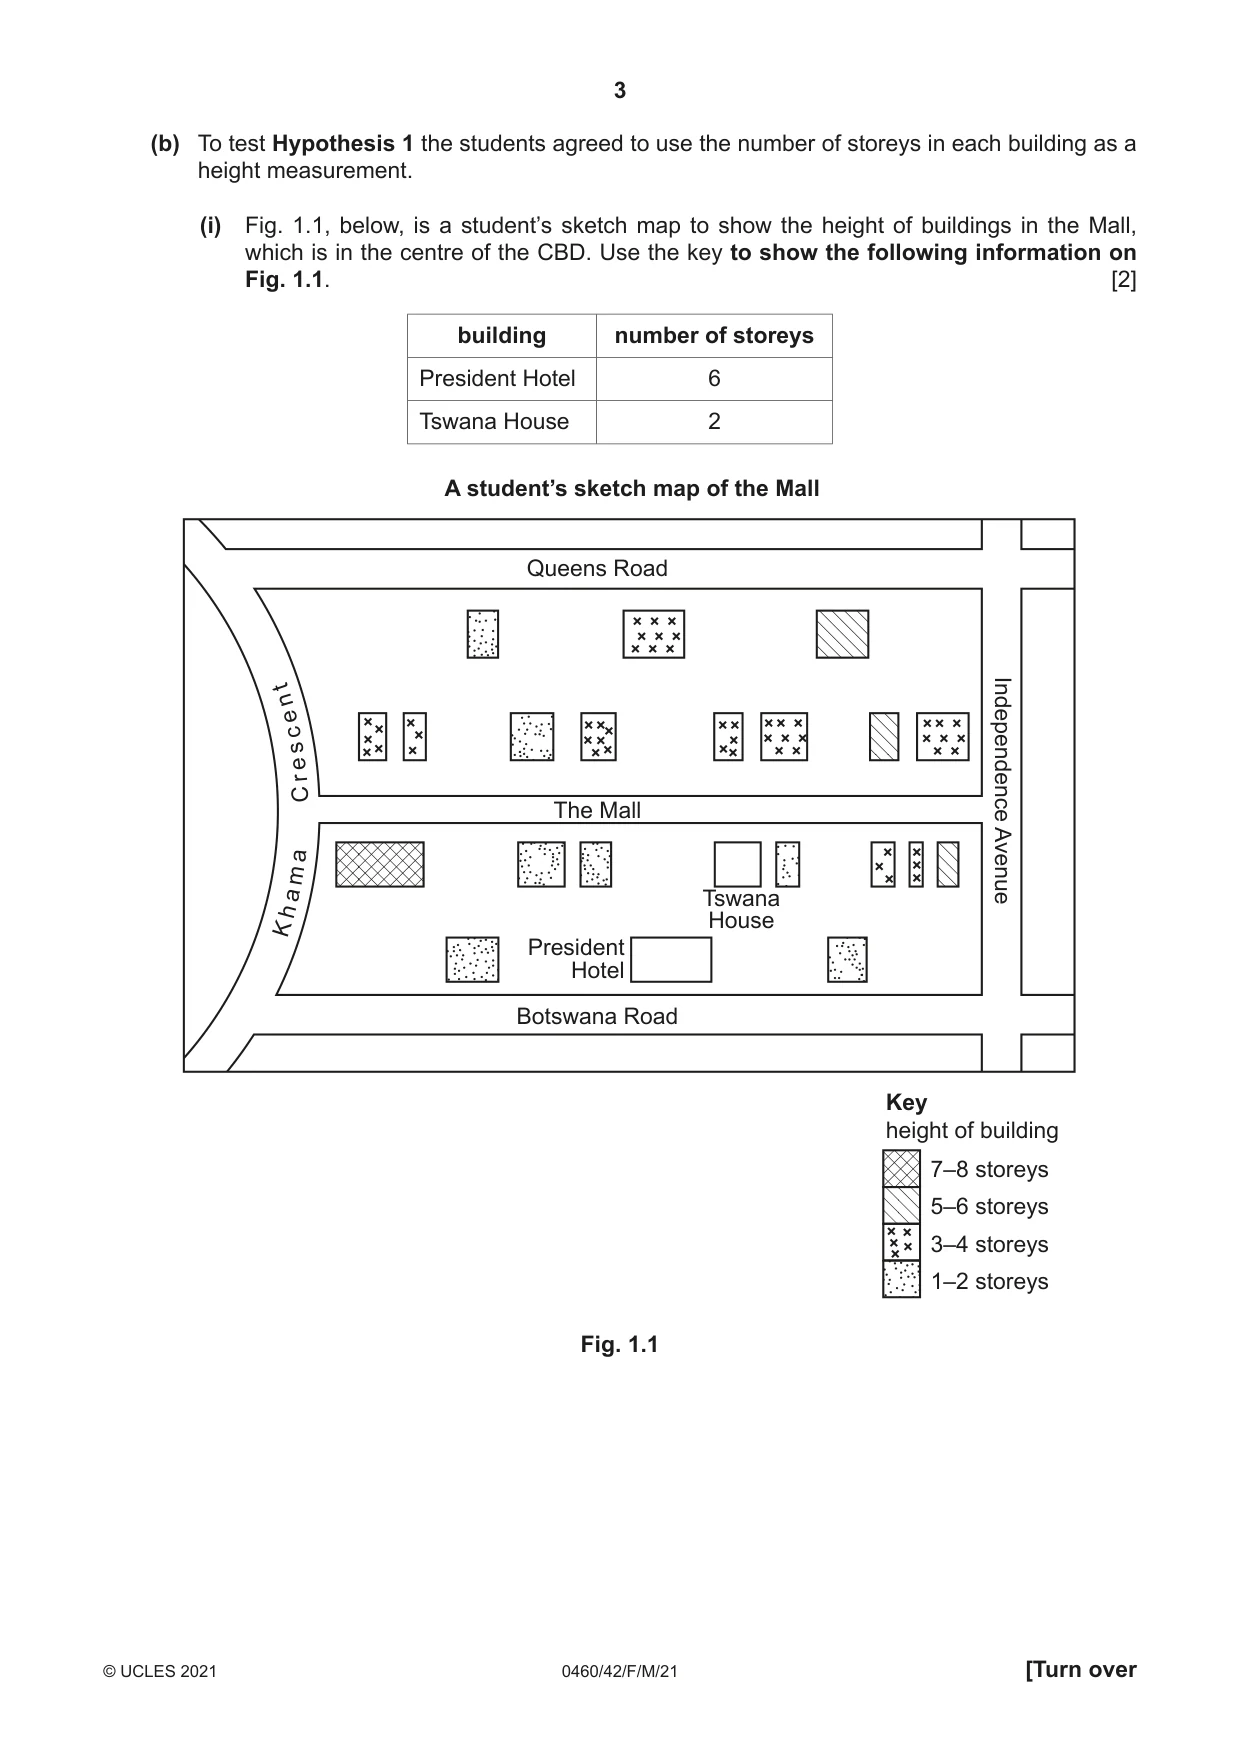
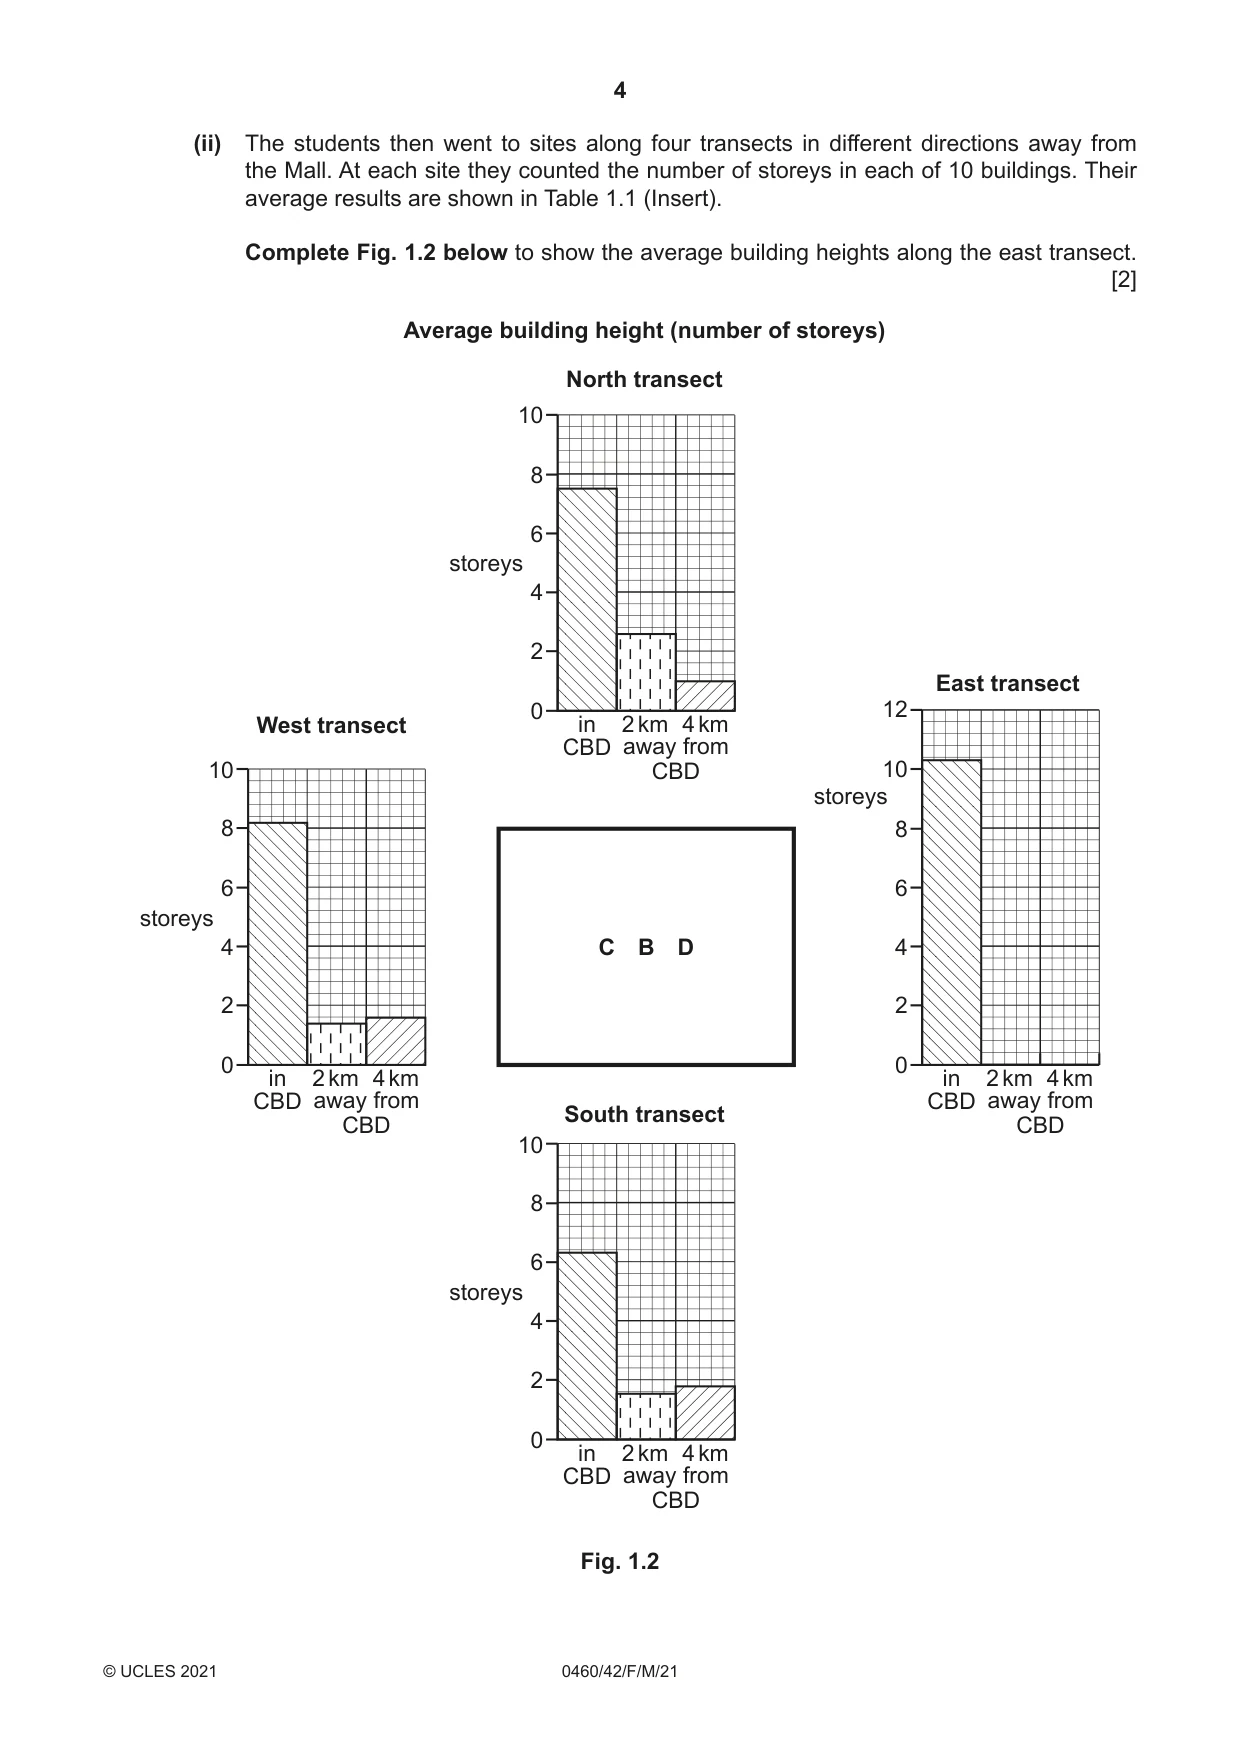
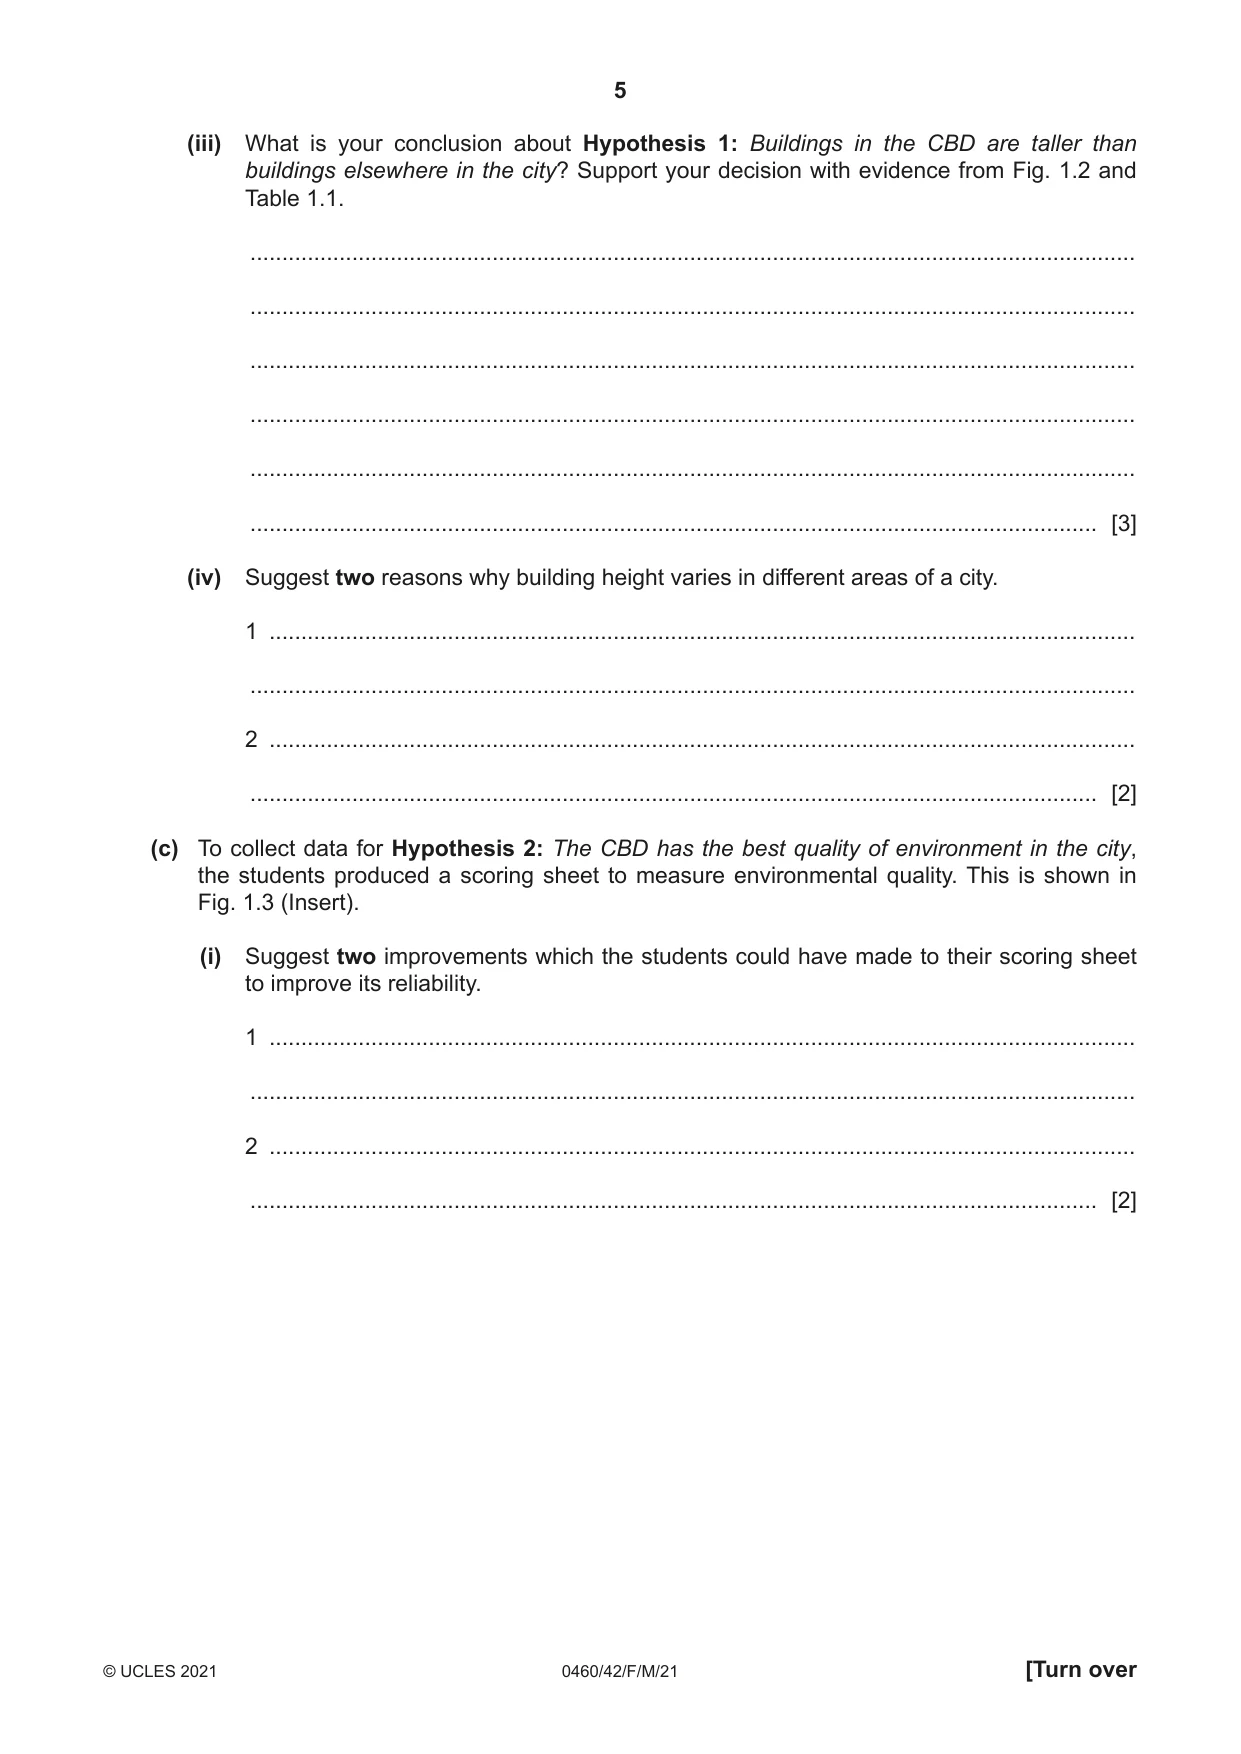
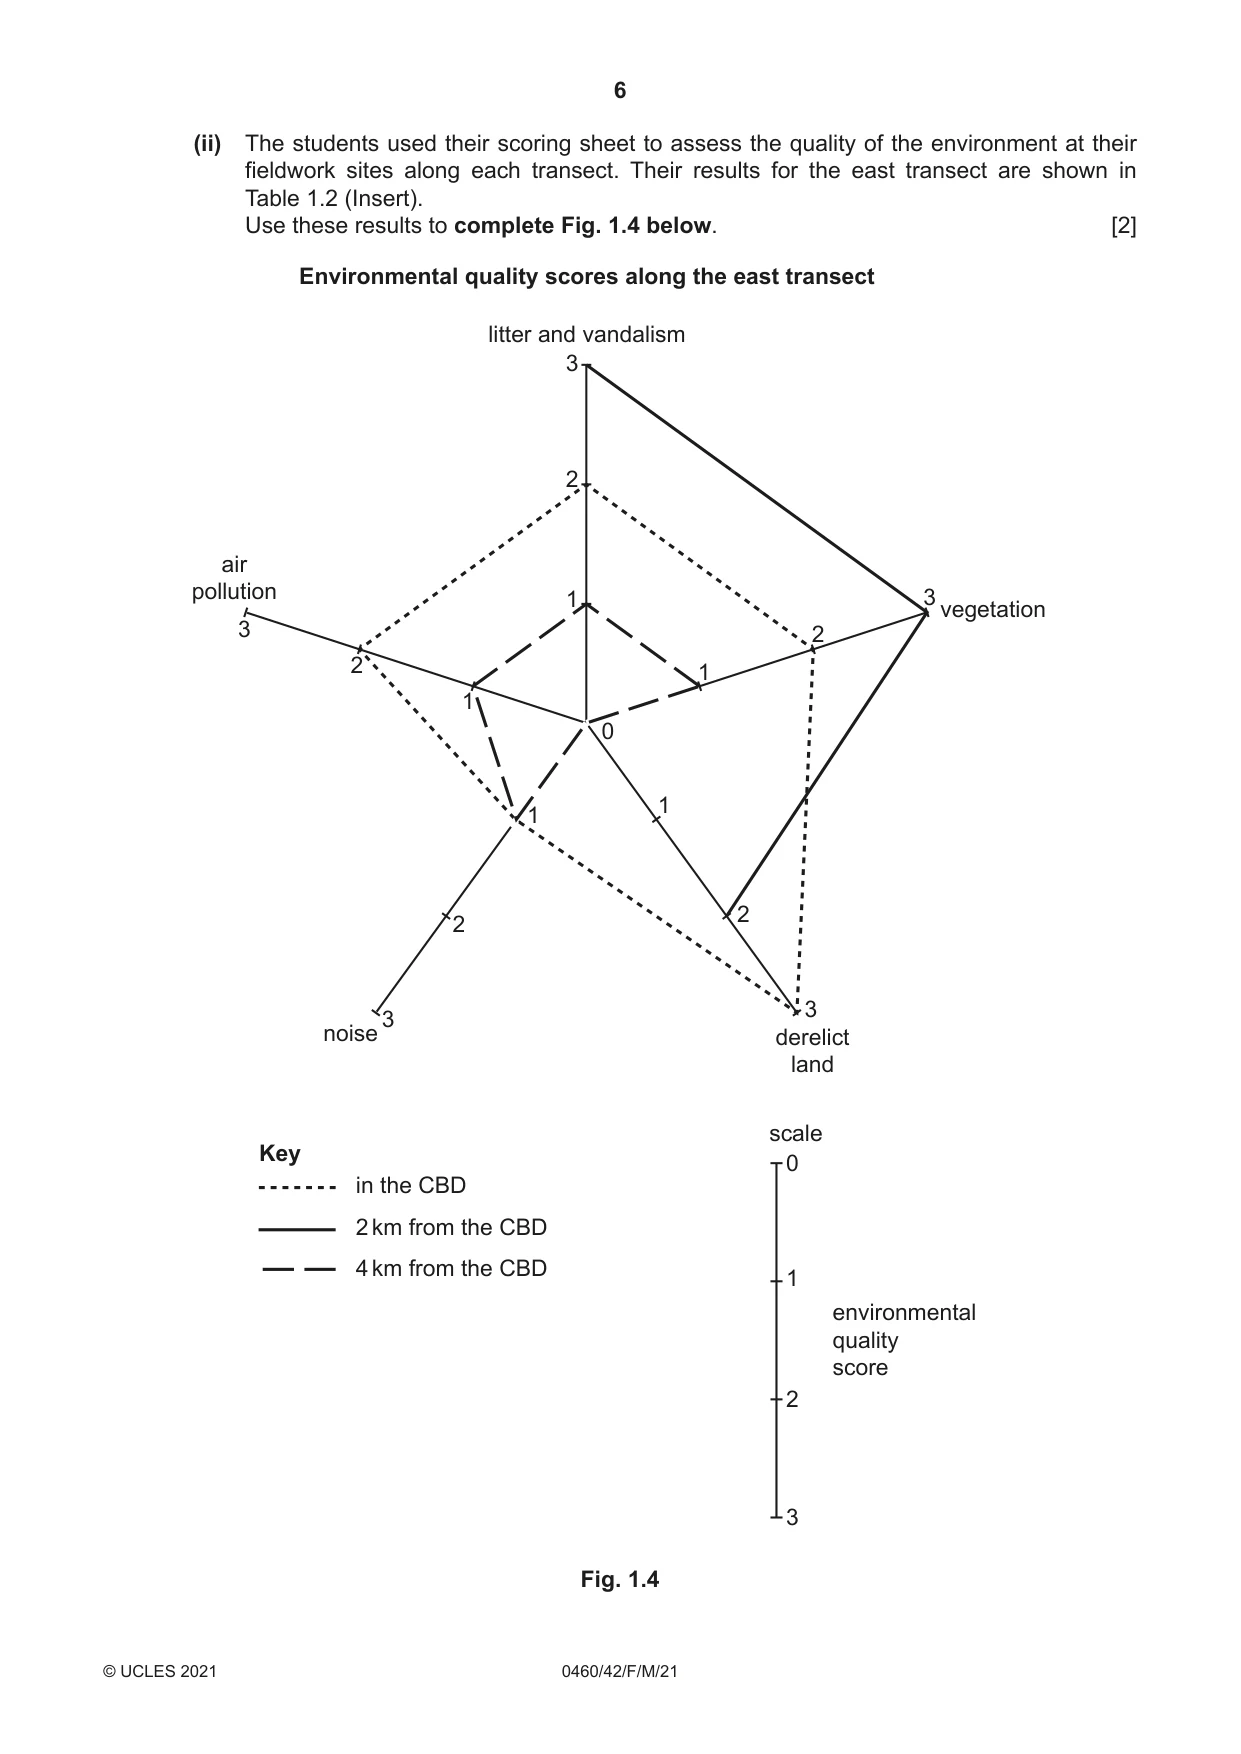
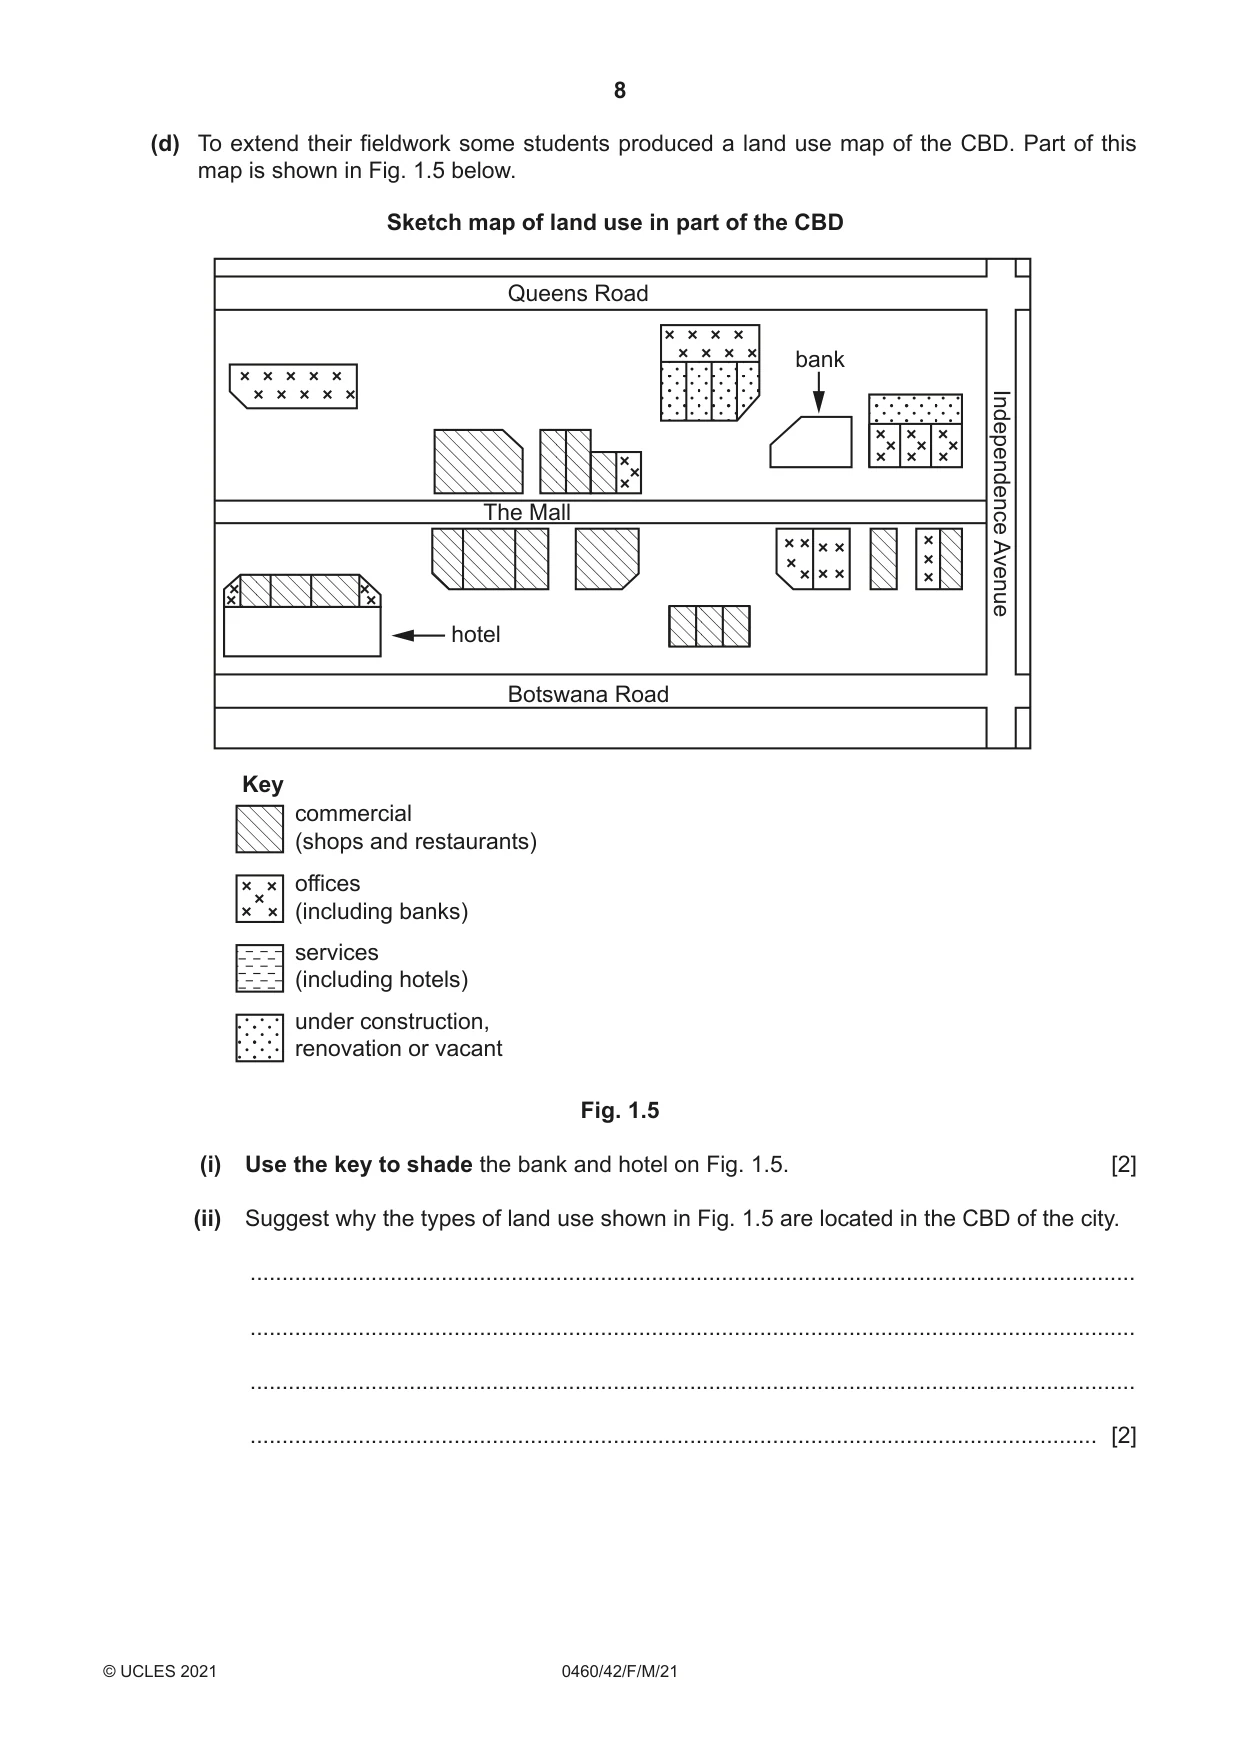
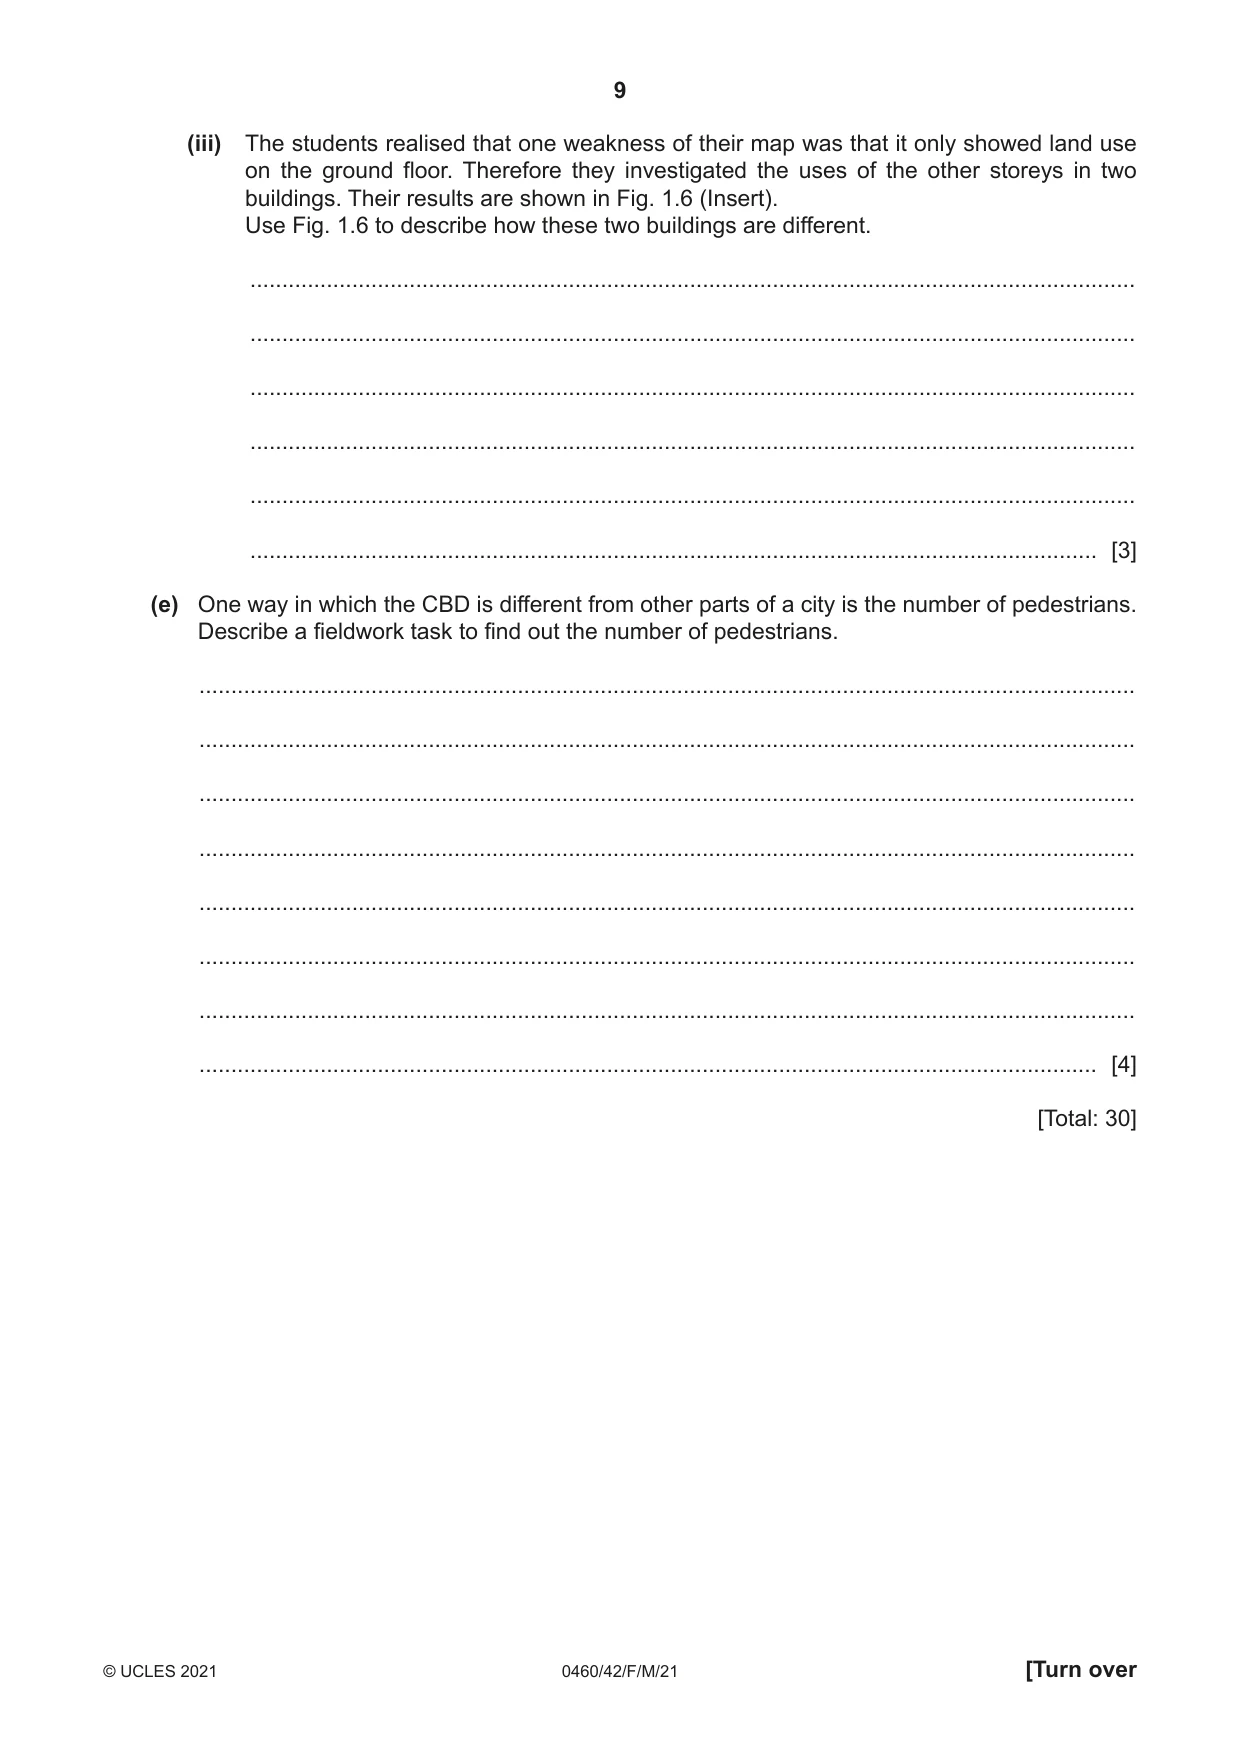
1 Students in Botswana did some fieldwork to investigate the CBD of Gaborone, the capital city of Botswana. (a) (i) What does CBD stand for? C................... B............................ D..................... [1] (ii) Which one of the following is least likely to be located in the CBD of a city? Tick (3) your choice in the table below. [1] tick (3) bank concert hall government building industrial estate railway station The students decided to test the following hypotheses. Hypothesis 1: Buildings in the CBD are taller than buildings elsewhere in the city. Hypothesis 2: The CBD has the best quality of environment in the city. (b) To test Hypothesis 1 the students agreed to use the number of storeys in each building as a height measurement. (i) Fig. 1.1, below, is a student’s sketch map to show the height of buildings in the Mall, which is in the centre of the CBD. Use the key to show the following information on Fig. 1.1. [2] building number of storeys President Hotel 6 Tswana House 2 A student’s sketch map of the Mall Queens Road t n e c s e r C The Mall Independence a m a Avenue Tswana h House K President Hotel Botswana Road Key height of building 7–8 storeys 5–6 storeys 3–4 storeys 1–2 storeys Fig. 1.1 (ii) The students then went to sites along four transects in different directions away from the Mall. At each site they counted the number of storeys in each of 10 buildings. Their average results are shown in Table 1.1 (Insert). Complete Fig. 1.2 below to show the average building heights along the east transect. [2] Average building height (number of storeys) North transect 10 8 6 storeys 4 2 East transect 0 12 West transect in 2 km 4 km CBD away from 10 CBD 10 storeys 8 8 6 6 storeys 4 C B D 4 2 2 0 0 in 2 km 4 km in 2 km 4 km CBD away from CBD away from South transect CBD CBD 10 8 6 storeys 4 2 0 in 2 km 4 km CBD away from CBD Fig. 1.2 (iii) What is your conclusion about Hypothesis 1: Buildings in the CBD are taller than buildings elsewhere in the city? Support your decision with evidence from Fig. 1.2 and Table 1.1. ........................................................................................................................................... ........................................................................................................................................... ........................................................................................................................................... ........................................................................................................................................... ........................................................................................................................................... ..................................................................................................................................... [3] (iv) Suggest two reasons why building height varies in different areas of a city. 1 ........................................................................................................................................ ........................................................................................................................................... 2 ........................................................................................................................................ ..................................................................................................................................... [2] (c) To collect data for Hypothesis 2: The CBD has the best quality of environment in the city, the students produced a scoring sheet to measure environmental quality. This is shown in Fig. 1.3 (Insert). (i) Suggest two improvements which the students could have made to their scoring sheet to improve its reliability. 1 ........................................................................................................................................ ........................................................................................................................................... 2 ........................................................................................................................................ ..................................................................................................................................... [2] (ii) The students used their scoring sheet to assess the quality of the environment at their fieldwork sites along each transect. Their results for the east transect are shown in Table 1.2 (Insert). Use these results to complete Fig. 1.4 below. [2] Environmental quality scores along the east transect litter and vandalism 3 2 air pollution 1 3 vegetation 3 2 2 1 1 0 1 1 2 2 3 3 noise derelict land scale Key 0 in the CBD 2 km from the CBD 4 km from the CBD 1 environmental quality score 2 3 Fig. 1.4 (iii) The total scores of the students’ environmental quality survey are shown in Table 1.3 (Insert). What conclusion would the students make about Hypothesis 2: The CBD has the best quality of environment in the city? Support your decision with evidence of the total scores from Table 1.3 and the individual feature scores along the east transect from Fig. 1.4 and Table 1.2. ........................................................................................................................................... ........................................................................................................................................... ........................................................................................................................................... ........................................................................................................................................... ........................................................................................................................................... ........................................................................................................................................... ........................................................................................................................................... ..................................................................................................................................... [4] (d) To extend their fieldwork some students produced a land use map of the CBD. Part of this map is shown in Fig. 1.5 below. Sketch map of land use in part of the CBD Queens Road bank The Mall Independence Avenue hotel Botswana Road Key commercial (shops and restaurants) offices (including banks) services (including hotels) under construction, renovation or vacant Fig. 1.5 (i) Use the key to shade the bank and hotel on Fig. 1.5. [2] (ii) Suggest why the types of land use shown in Fig. 1.5 are located in the CBD of the city. ........................................................................................................................................... ........................................................................................................................................... ........................................................................................................................................... ..................................................................................................................................... [2] (iii) The students realised that one weakness of their map was that it only showed land use on the ground floor. Therefore they investigated the uses of the other storeys in two buildings. Their results are shown in Fig. 1.6 (Insert). Use Fig. 1.6 to describe how these two buildings are different. ........................................................................................................................................... ........................................................................................................................................... ........................................................................................................................................... ........................................................................................................................................... ........................................................................................................................................... ..................................................................................................................................... [3] (e) One way in which the CBD is different from other parts of a city is the number of pedestrians. Describe a fieldwork task to find out the number of pedestrians. ................................................................................................................................................... ................................................................................................................................................... ................................................................................................................................................... ................................................................................................................................................... ................................................................................................................................................... ................................................................................................................................................... ................................................................................................................................................... ............................................................................................................................................. [4] [Total: 30]
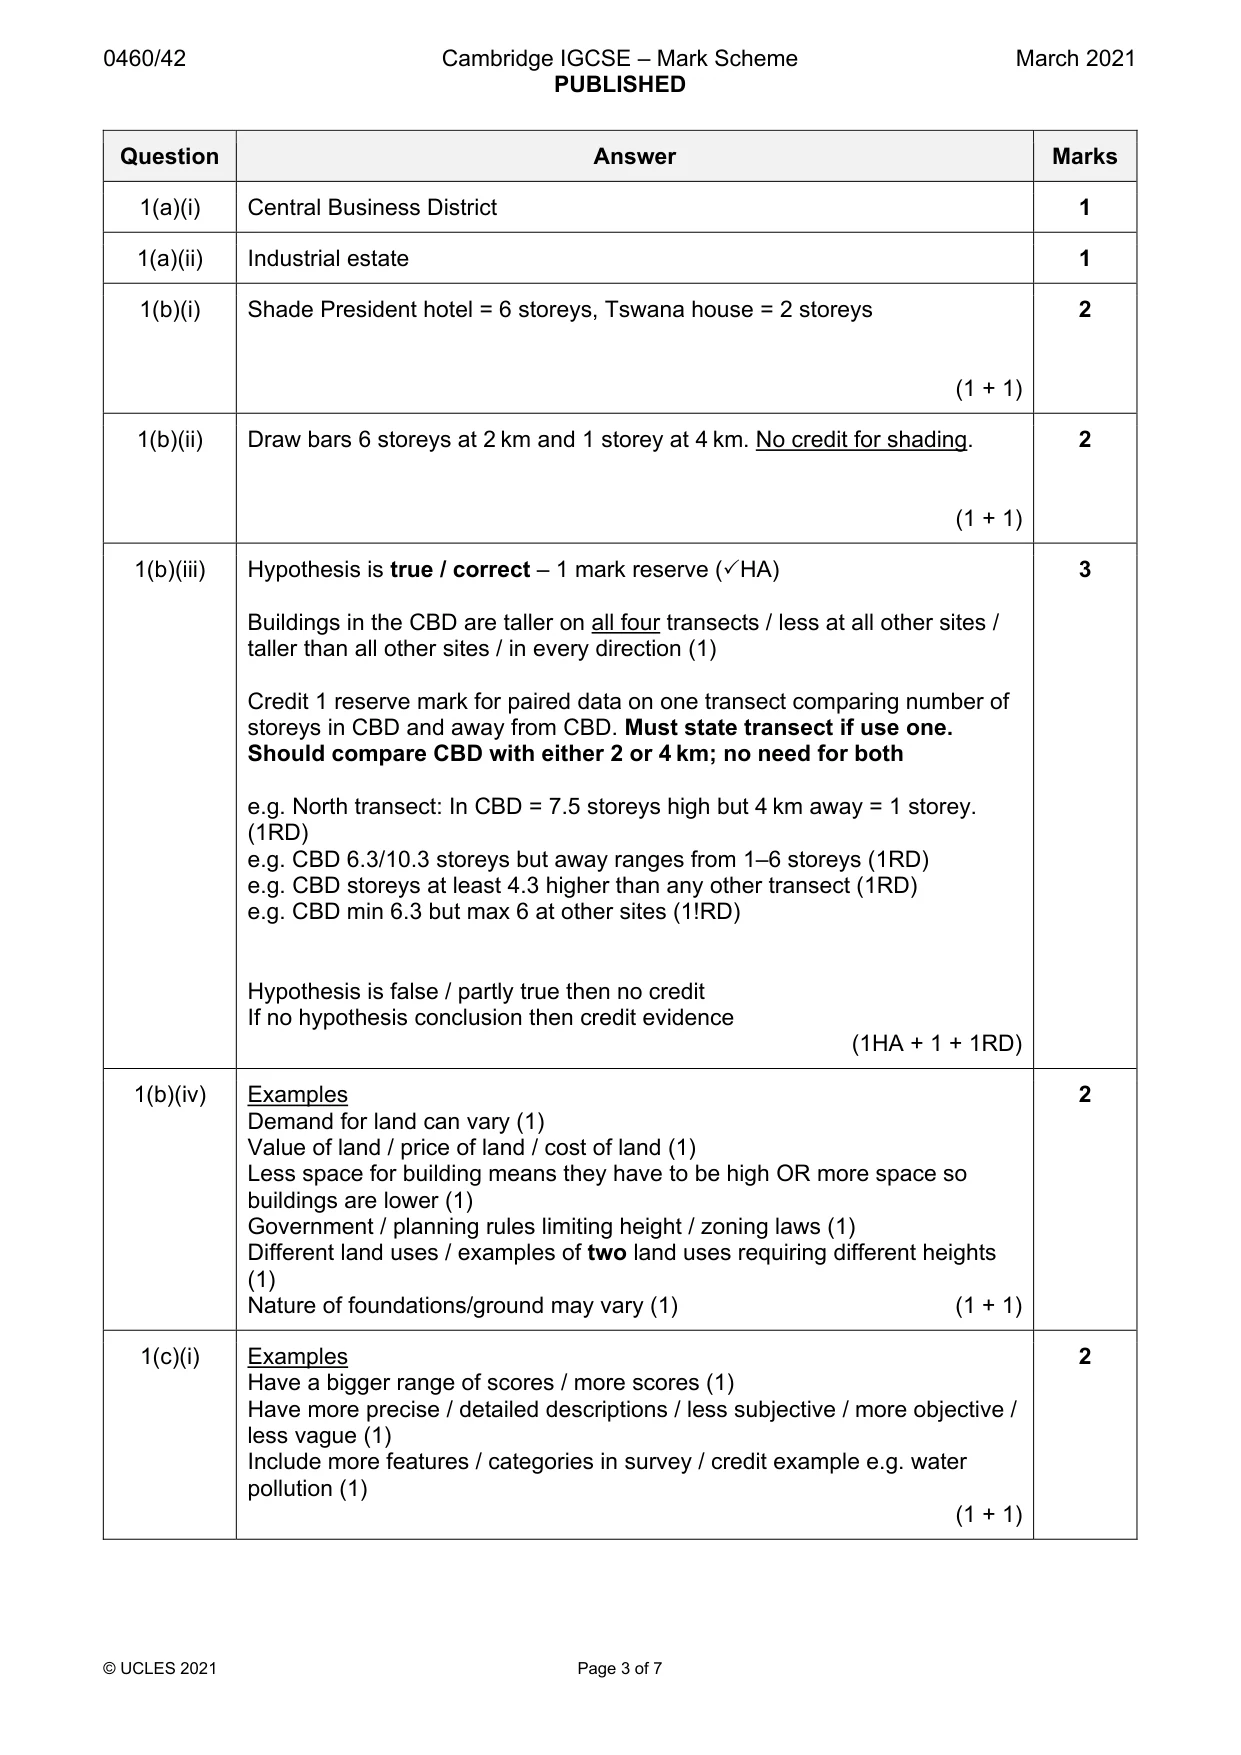
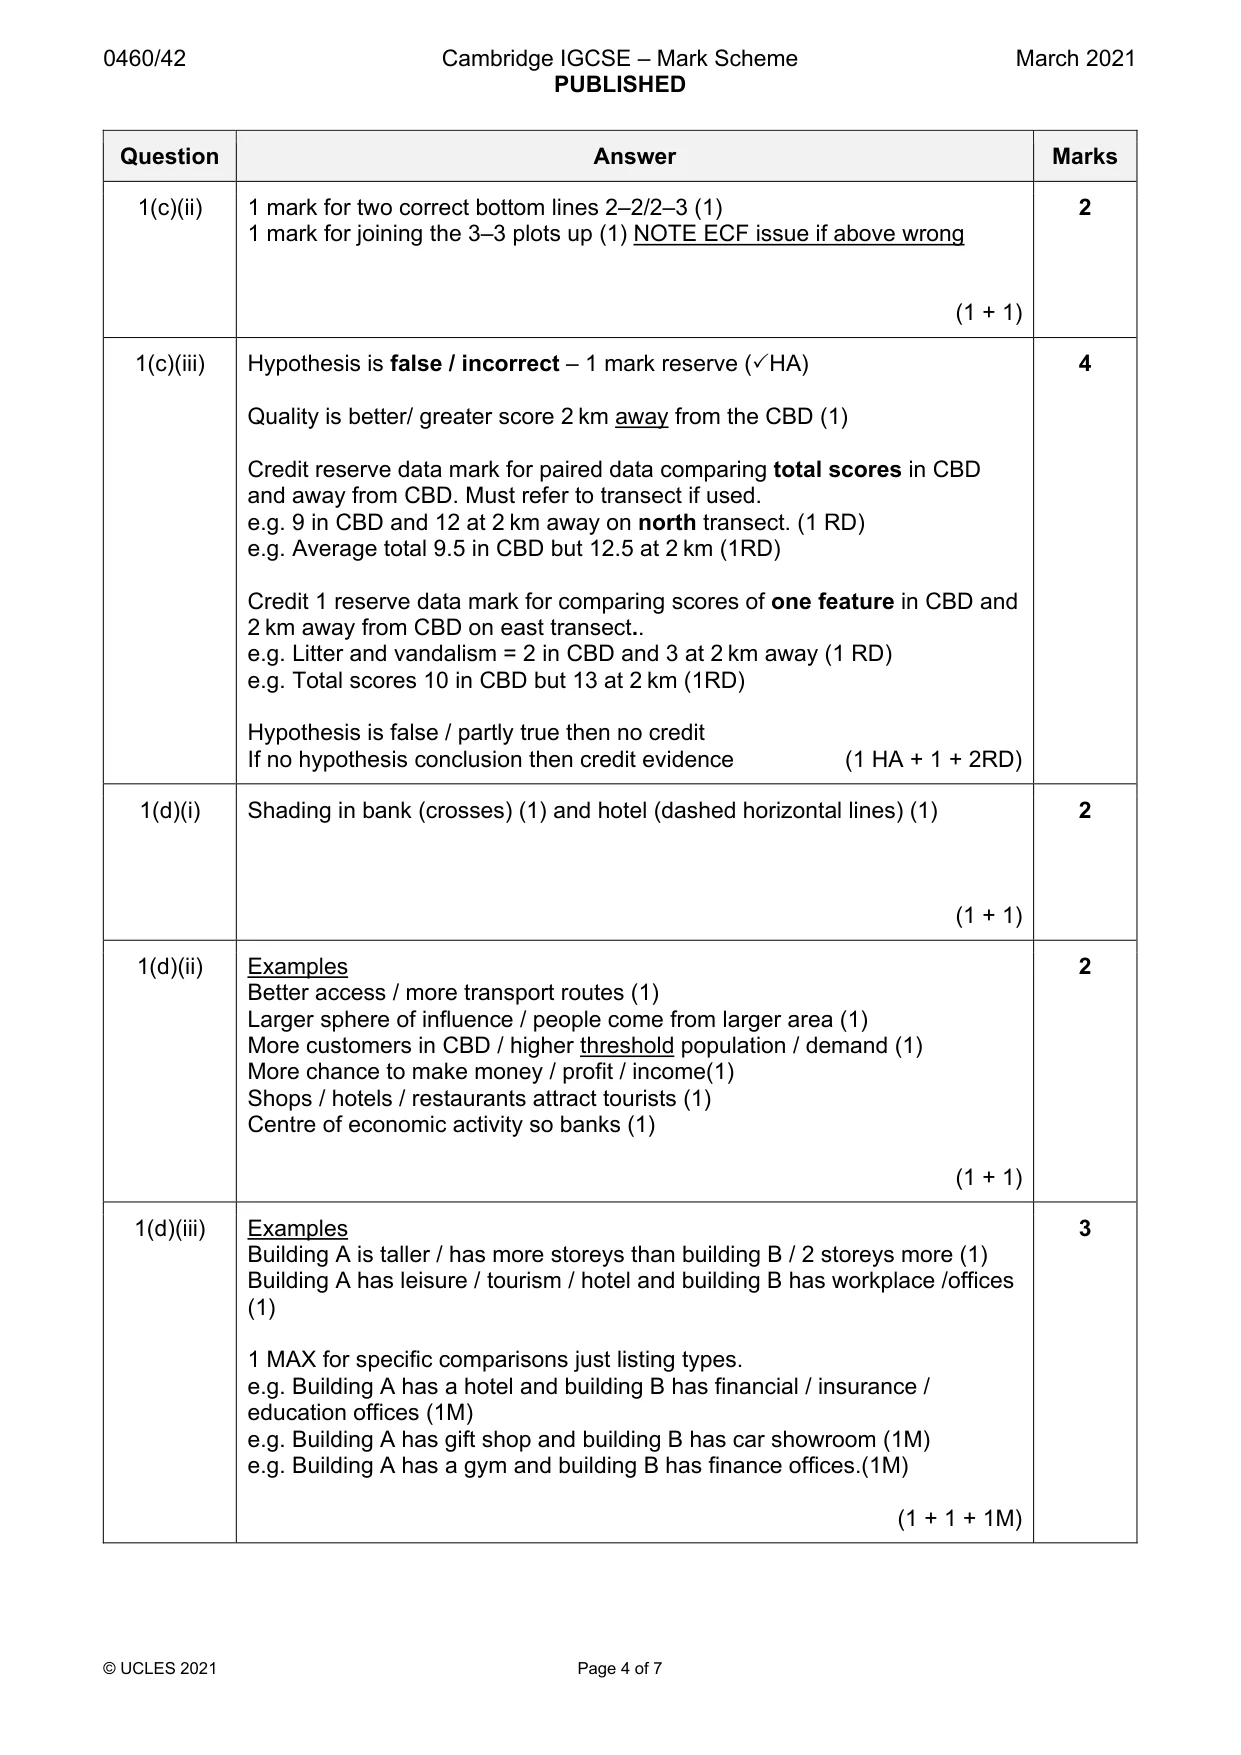
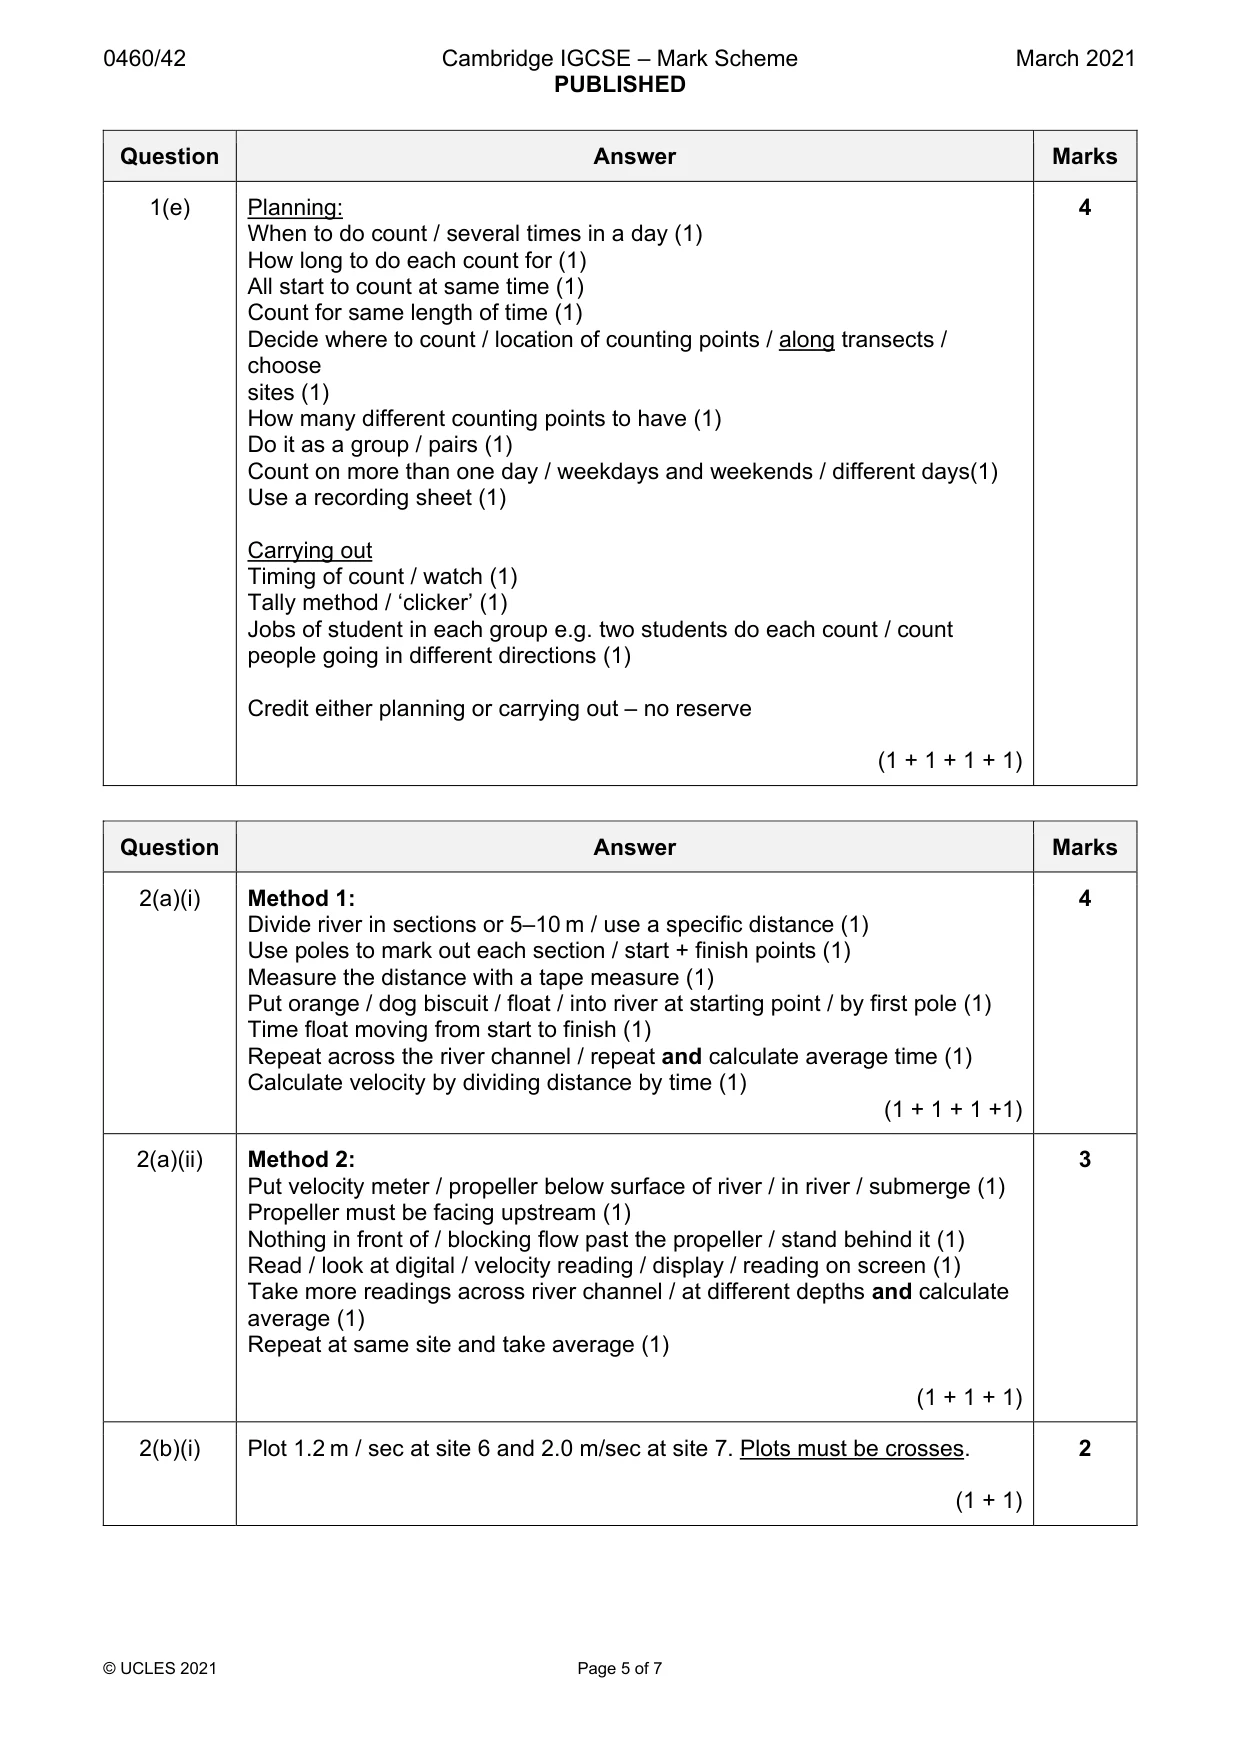
Mark scheme: Question Answer Marks 1(a)(i) Central Business District 1 1(a)(ii) Industrial estate 1 1(b)(i) Shade President hotel = 6 storeys, Tswana house = 2 storeys 2 (1 + 1) 1(b)(ii) Draw bars 6 storeys at 2 km and 1 storey at 4 km. No credit for shading. 2 (1 + 1) 1(b)(iii) Hypothesis is true / correct – 1 mark reserve (HA) 3 Buildings in the CBD are taller on all four transects / less at all other sites / taller than all other sites / in every direction (1) Credit 1 reserve mark for paired data on one transect comparing number of storeys in CBD and away from CBD. Must state transect if use one. Should compare CBD with either 2 or 4 km; no need for both e.g. North transect: In CBD = 7.5 storeys high but 4 km away = 1 storey. (1RD) e.g. CBD 6.3/10.3 storeys but away ranges from 1–6 storeys (1RD) e.g. CBD storeys at least 4.3 higher than any other transect (1RD) e.g. CBD min 6.3 but max 6 at other sites (1!RD) Hypothesis is false / partly true then no credit If no hypothesis conclusion then credit evidence (1HA + 1 + 1RD) 1(b)(iv) Examples 2 Demand for land can vary (1) Value of land / price of land / cost of land (1) Less space for building means they have to be high OR more space so buildings are lower (1) Government / planning rules limiting height / zoning laws (1) Different land uses / examples of two land uses requiring different heights (1) Nature of foundations/ground may vary (1) (1 + 1) 1(c)(i) Examples 2 Have a bigger range of scores / more scores (1) Have more precise / detailed descriptions / less subjective / more objective / less vague (1) Include more features / categories in survey / credit example e.g. water pollution (1) (1 + 1) 1(c)(ii) 1 mark for two correct bottom lines 2–2/2–3 (1) 2 1 mark for joining the 3–3 plots up (1) NOTE ECF issue if above wrong (1 + 1) 1(c)(iii) Hypothesis is false / incorrect – 1 mark reserve (HA) 4 Quality is better/ greater score 2 km away from the CBD (1) Credit reserve data mark for paired data comparing total scores in CBD and away from CBD. Must refer to transect if used. e.g. 9 in CBD and 12 at 2 km away on north transect. (1 RD) e.g. Average total 9.5 in CBD but 12.5 at 2 km (1RD) Credit 1 reserve data mark for comparing scores of one feature in CBD and 2 km away from CBD on east transect.. e.g. Litter and vandalism = 2 in CBD and 3 at 2 km away (1 RD) e.g. Total scores 10 in CBD but 13 at 2 km (1RD) Hypothesis is false / partly true then no credit If no hypothesis conclusion then credit evidence (1 HA + 1 + 2RD) 1(d)(i) Shading in bank (crosses) (1) and hotel (dashed horizontal lines) (1) 2 (1 + 1) 1(d)(ii) Examples 2 Better access / more transport routes (1) Larger sphere of influence / people come from larger area (1) More customers in CBD / higher threshold population / demand (1) More chance to make money / profit / income(1) Shops / hotels / restaurants attract tourists (1) Centre of economic activity so banks (1) (1 + 1) 1(d)(iii) Examples 3 Building A is taller / has more storeys than building B / 2 storeys more (1) Building A has leisure / tourism / hotel and building B has workplace /offices (1) 1 MAX for specific comparisons just listing types. e.g. Building A has a hotel and building B has financial / insurance / education offices (1M) e.g. Building A has gift shop and building B has car showroom (1M) e.g. Building A has a gym and building B has finance offices.(1M) (1 + 1 + 1M) 1(e) Planning: 4 When to do count / several times in a day (1) How long to do each count for (1) All start to count at same time (1) Count for same length of time (1) Decide where to count / location of counting points / along transects / choose sites (1) How many different counting points to have (1) Do it as a group / pairs (1) Count on more than one day / weekdays and weekends / different days(1) Use a recording sheet (1) Carrying out Timing of count / watch (1) Tally method / ‘clicker’ (1) Jobs of student in each group e.g. two students do each count / count people going in different directions (1) Credit either planning or carrying out – no reserve (1 + 1 + 1 + 1)
Q2 · Students were doing fieldwork along a river near to their school
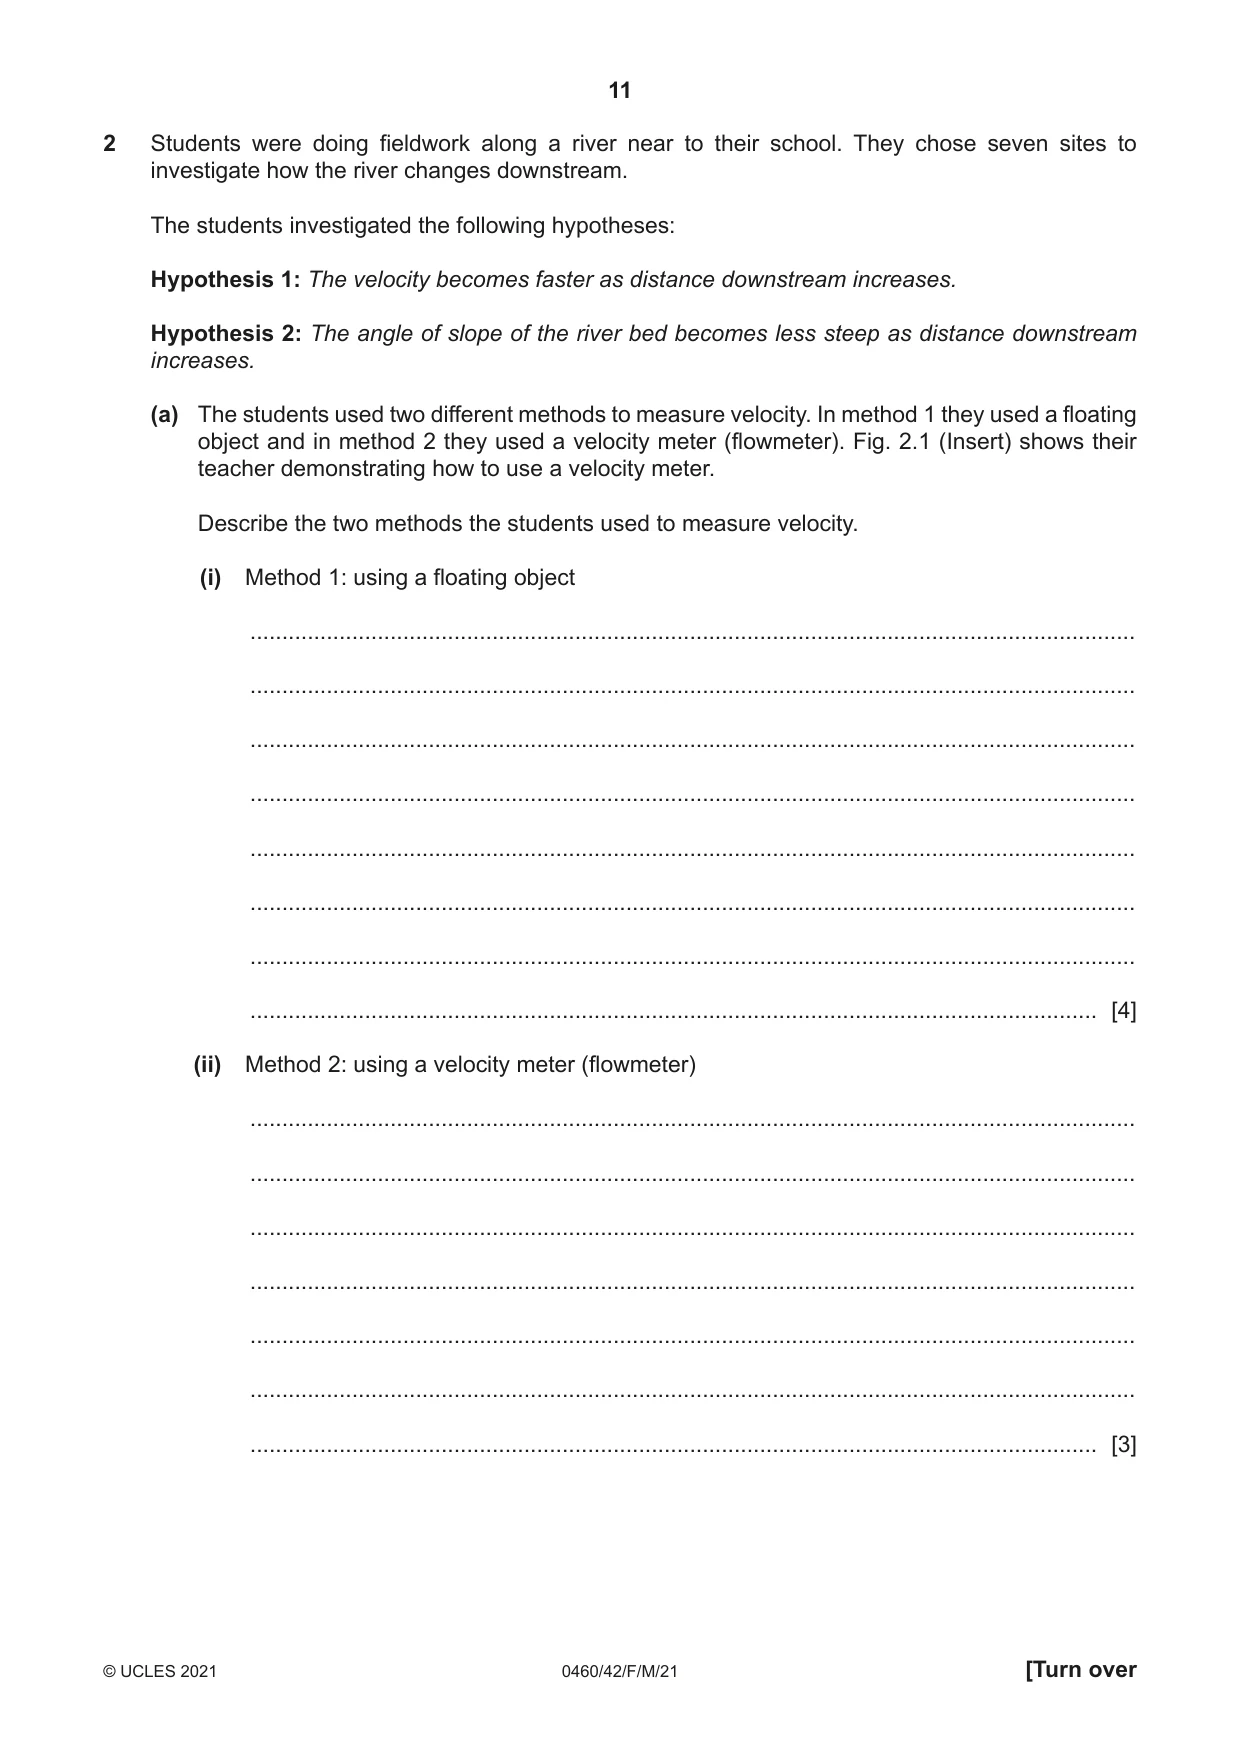
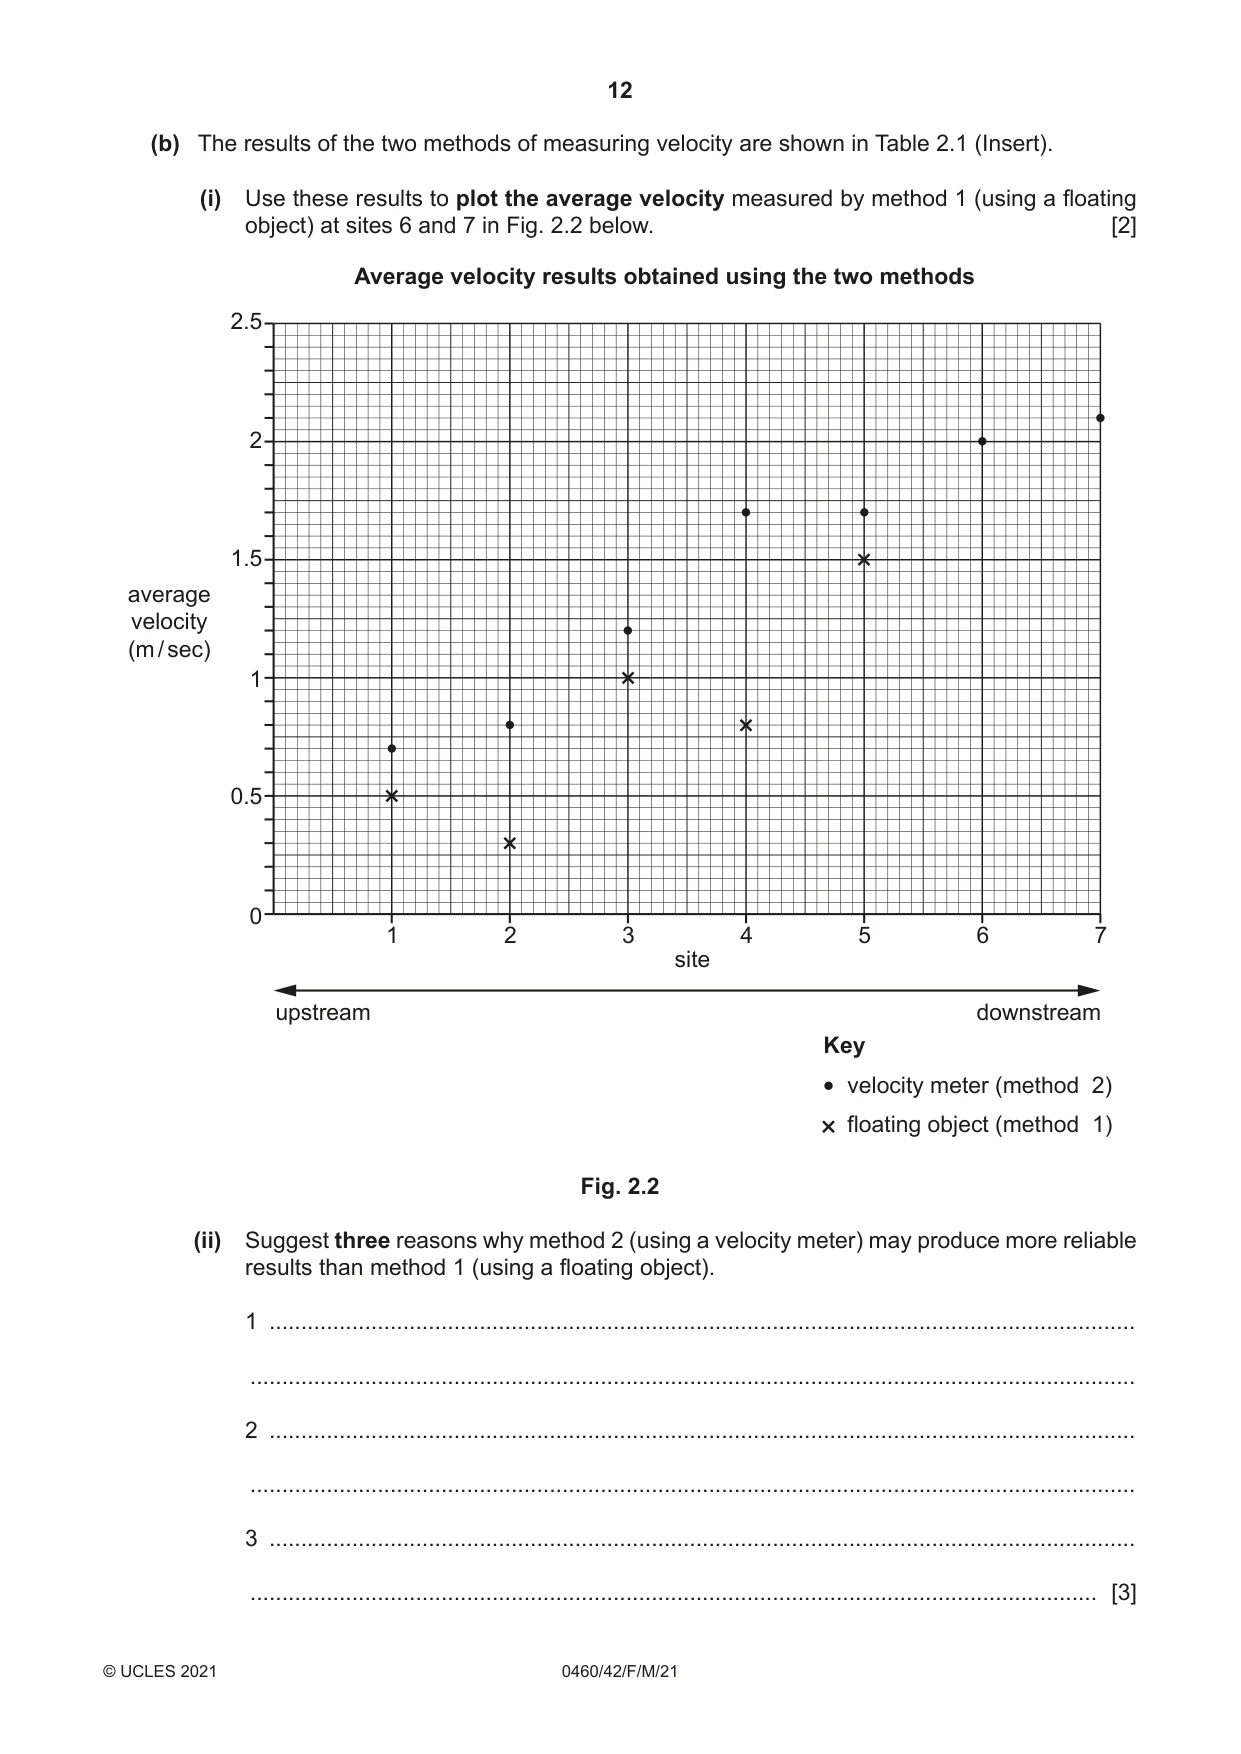
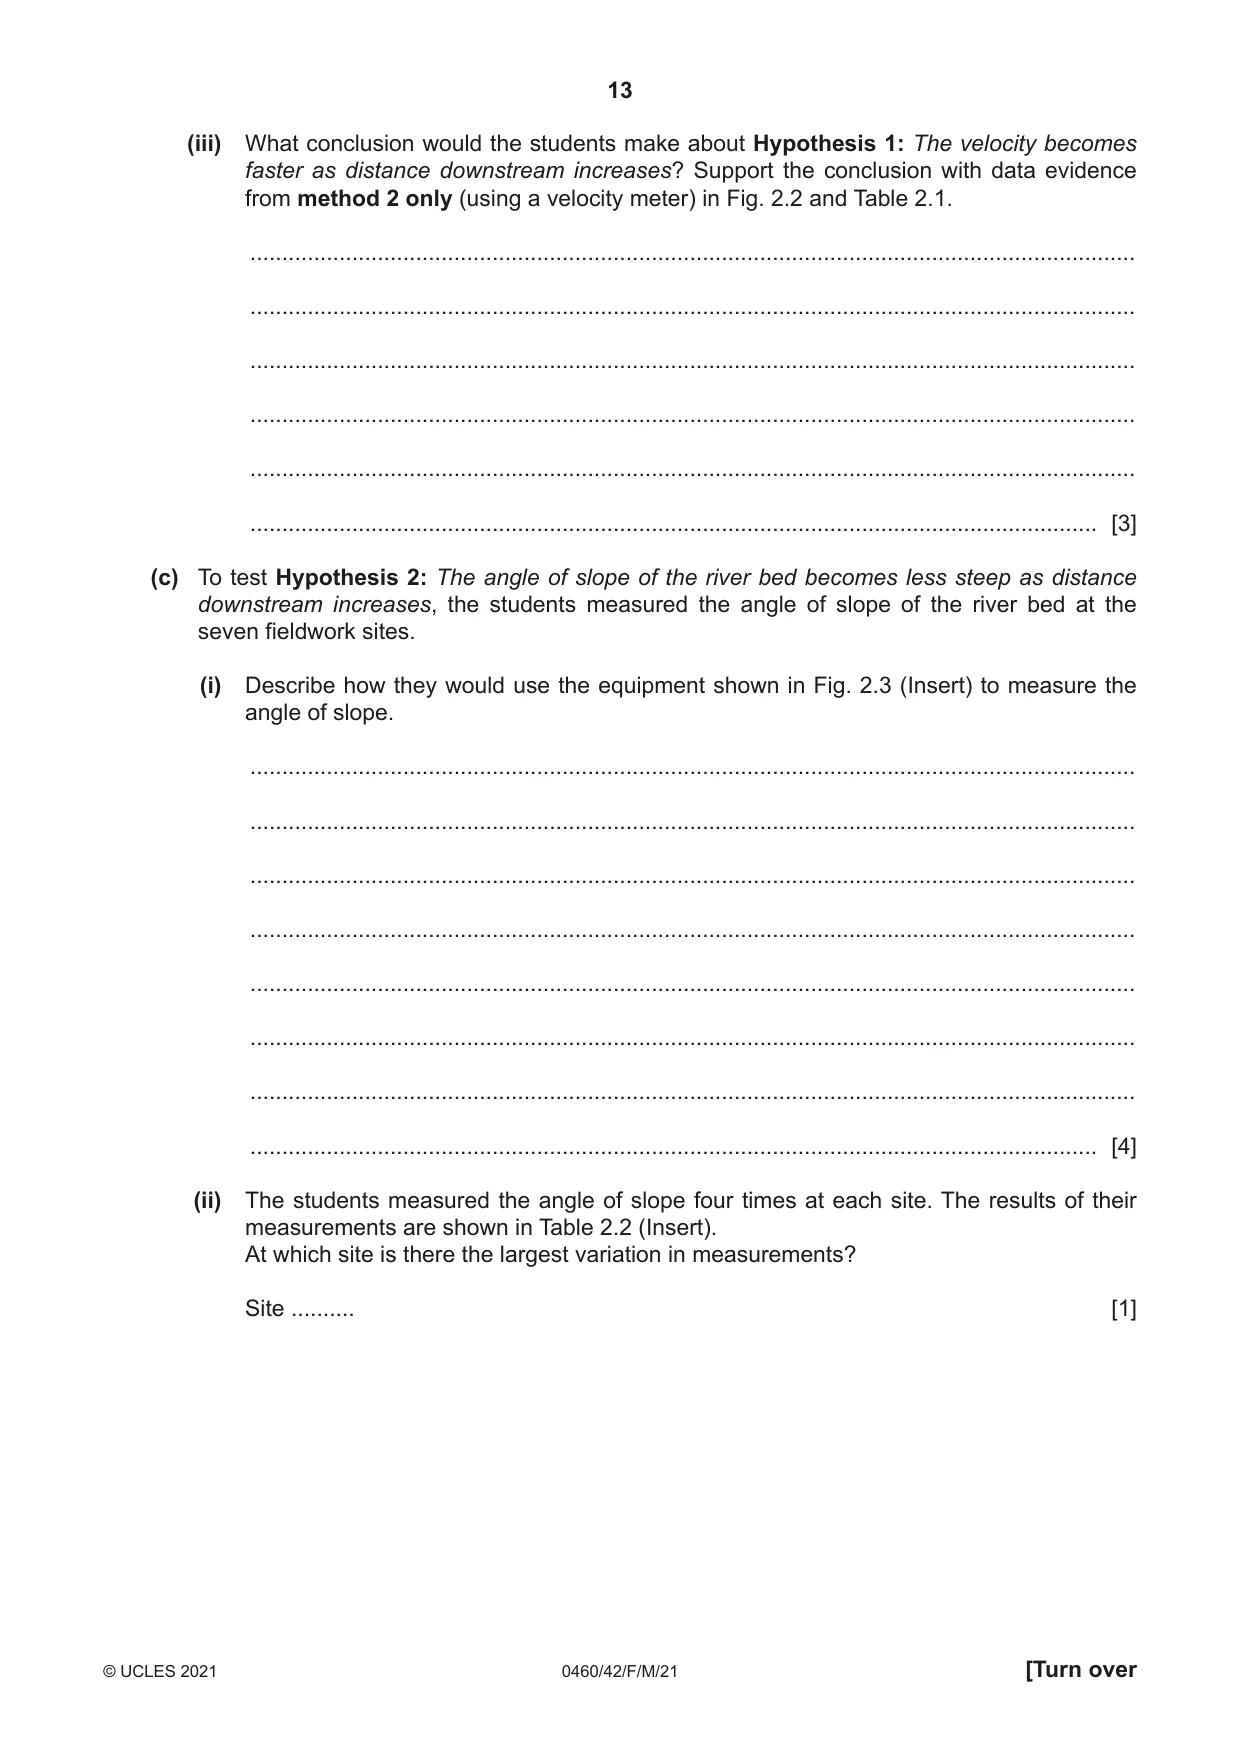
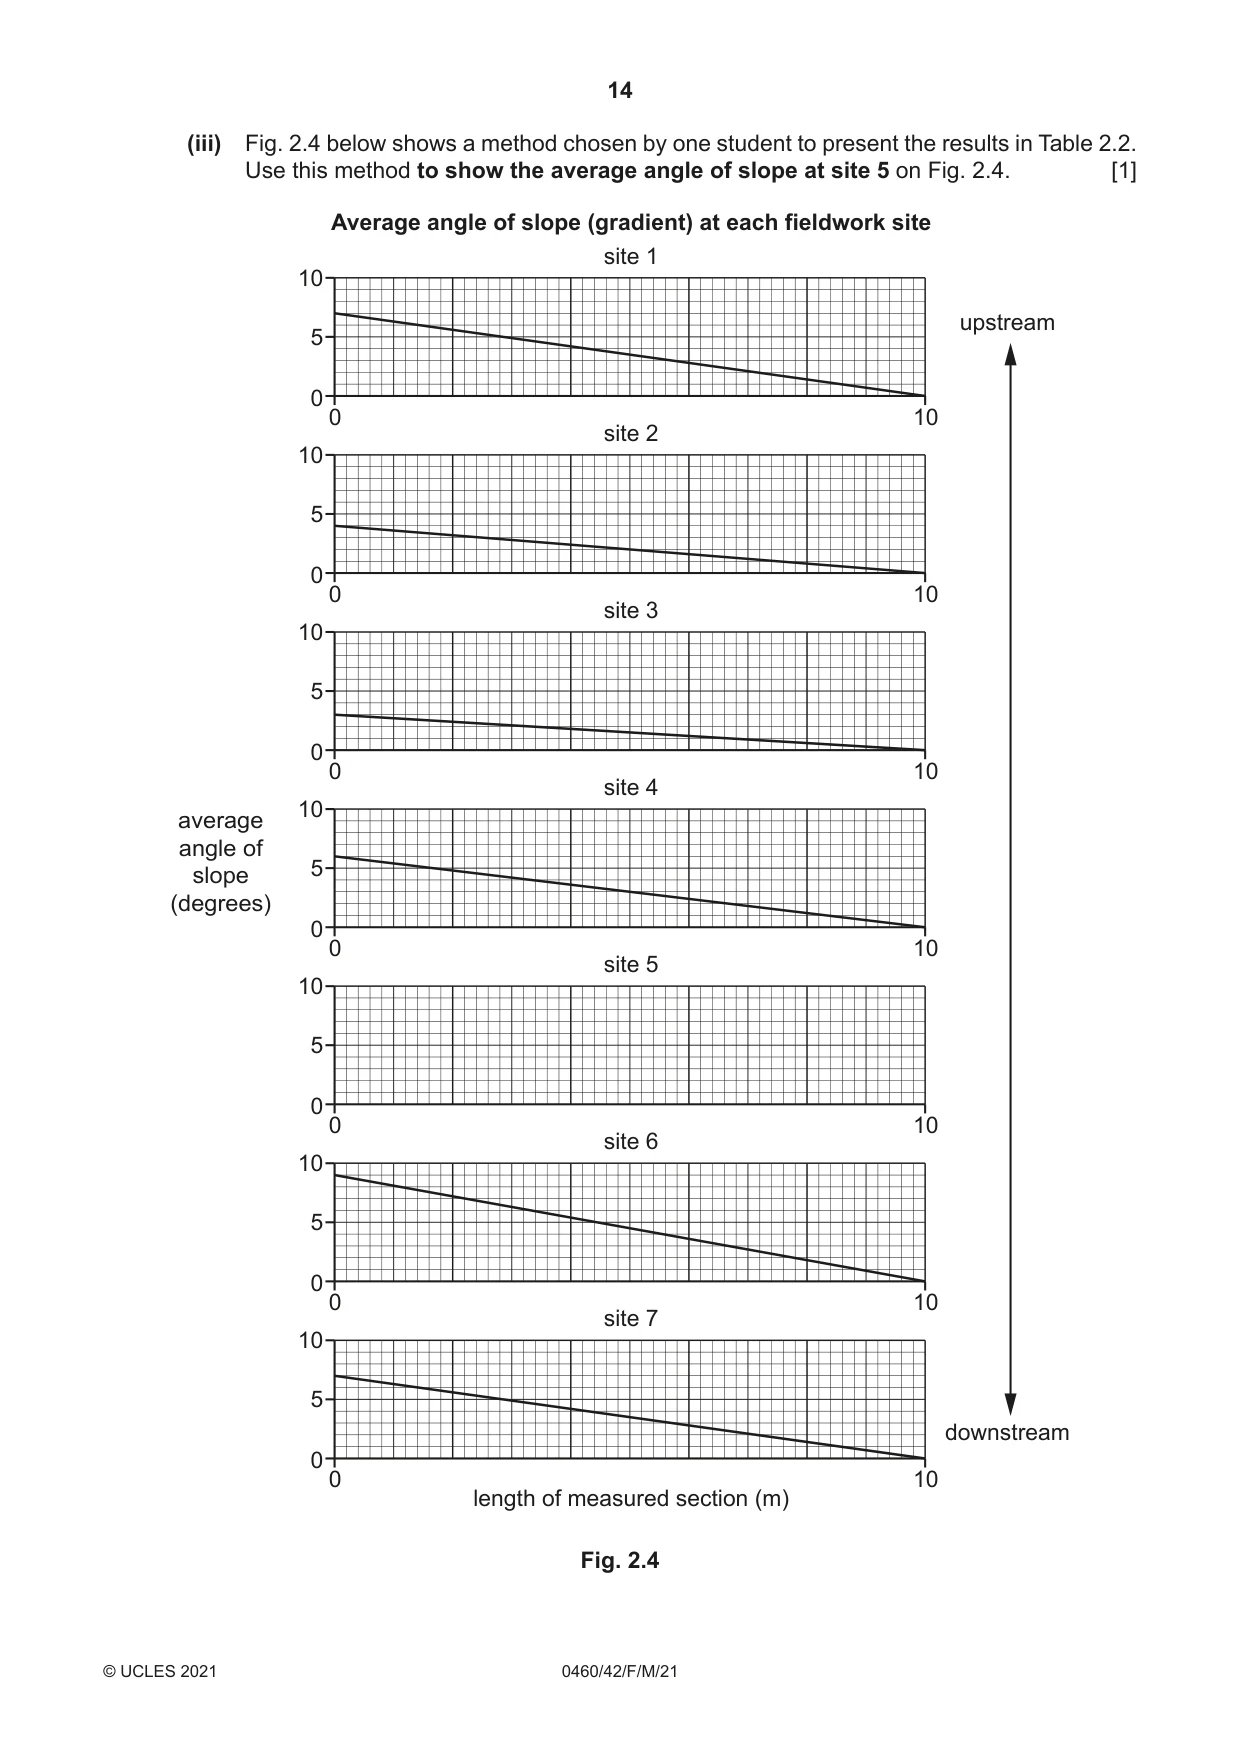
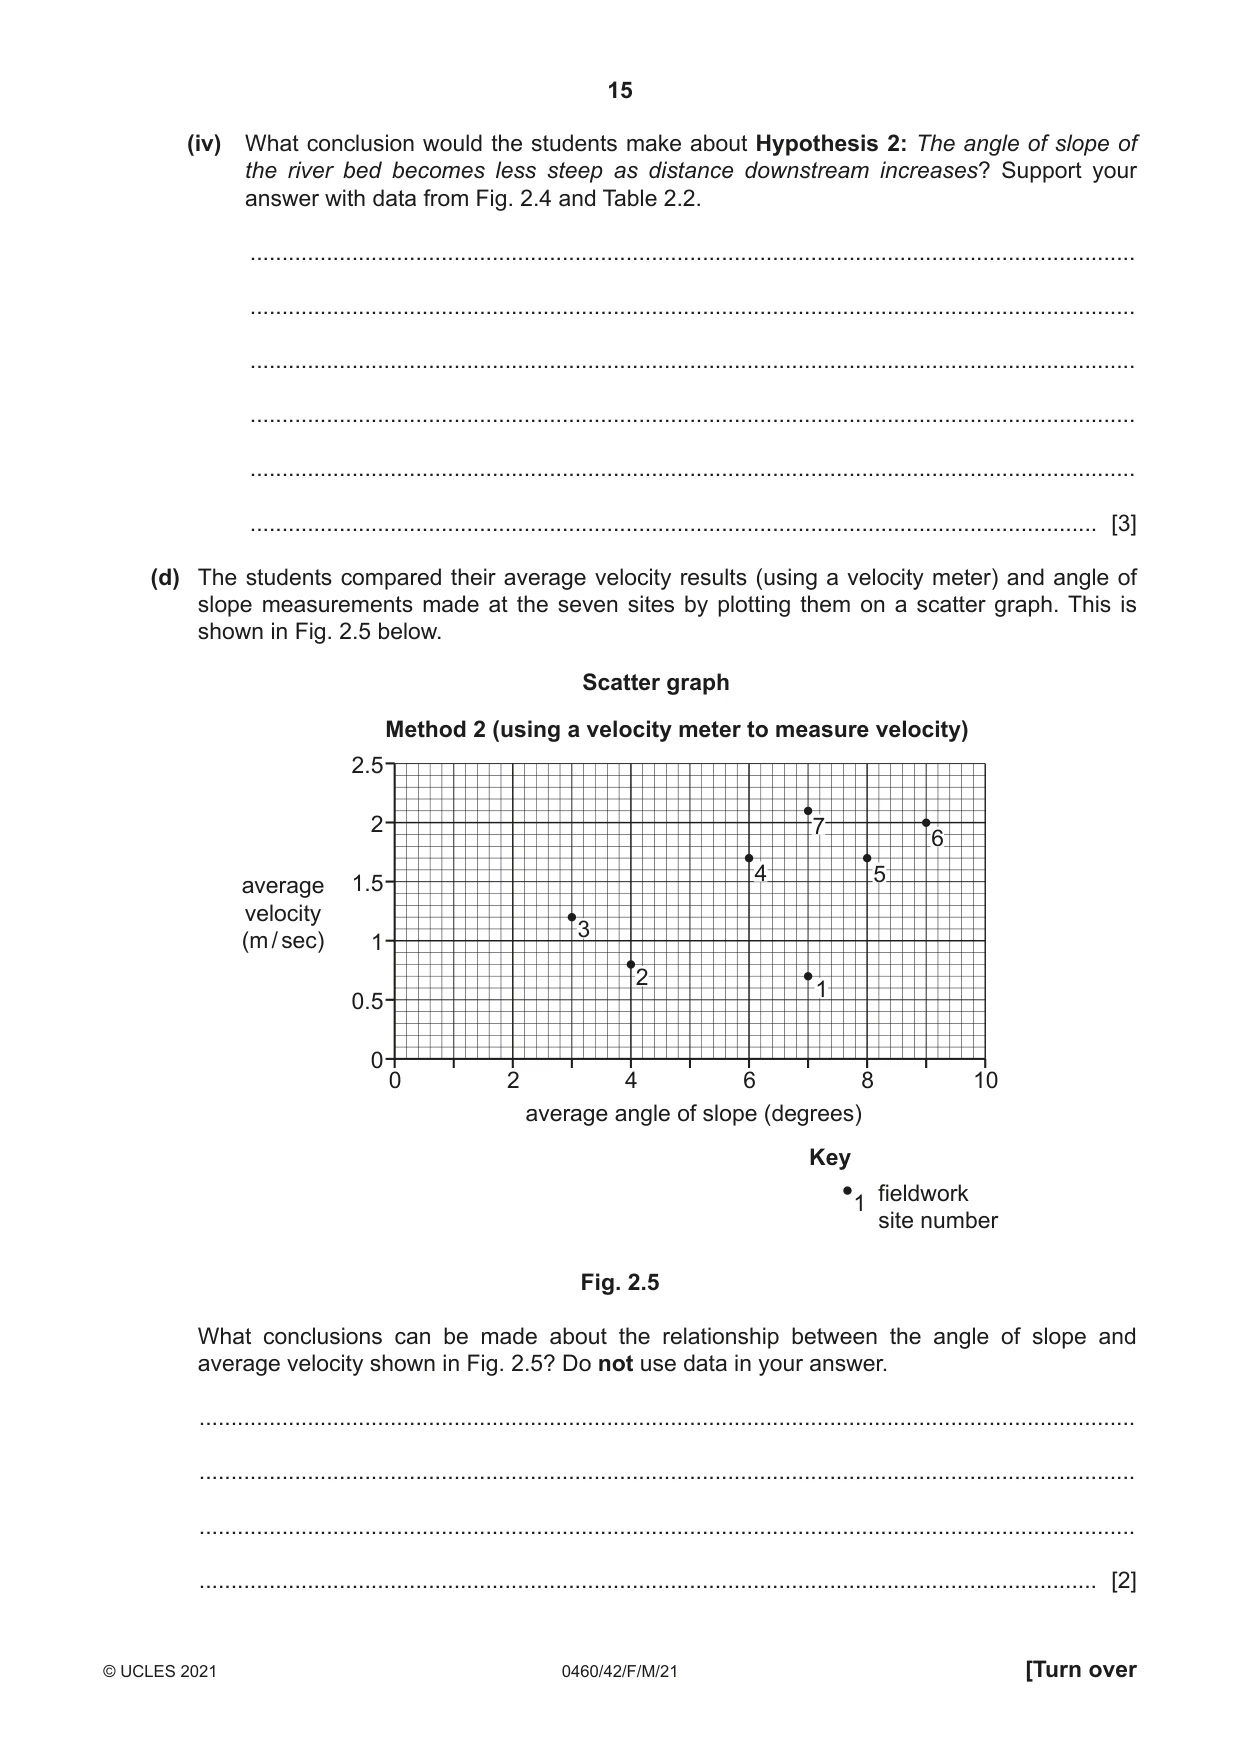
2 Students were doing fieldwork along a river near to their school. They chose seven sites to investigate how the river changes downstream. The students investigated the following hypotheses: Hypothesis 1: The velocity becomes faster as distance downstream increases. Hypothesis 2: The angle of slope of the river bed becomes less steep as distance downstream increases. (a) The students used two different methods to measure velocity. In method 1 they used a floating object and in method 2 they used a velocity meter (flowmeter). Fig. 2.1 (Insert) shows their teacher demonstrating how to use a velocity meter. Describe the two methods the students used to measure velocity. (i) Method 1: using a floating object ........................................................................................................................................... ........................................................................................................................................... ........................................................................................................................................... ........................................................................................................................................... ........................................................................................................................................... ........................................................................................................................................... ........................................................................................................................................... ..................................................................................................................................... [4] (ii) Method 2: using a velocity meter (flowmeter) ........................................................................................................................................... ........................................................................................................................................... ........................................................................................................................................... ........................................................................................................................................... ........................................................................................................................................... ........................................................................................................................................... ..................................................................................................................................... [3] (b) The results of the two methods of measuring velocity are shown in Table 2.1 (Insert). (i) Use these results to plot the average velocity measured by method 1 (using a floating object) at sites 6 and 7 in Fig. 2.2 below. [2] Average velocity results obtained using the two methods 2.5 2 1.5 average velocity (m / sec) 1 0.5 0 1 2 3 4 5 6 7 site upstream downstream Key velocity meter (method 2) floating object (method 1) Fig. 2.2 (ii) Suggest three reasons why method 2 (using a velocity meter) may produce more reliable results than method 1 (using a floating object). 1 ........................................................................................................................................ ........................................................................................................................................... 2 ........................................................................................................................................ ........................................................................................................................................... 3 ........................................................................................................................................ ..................................................................................................................................... [3] (iii) What conclusion would the students make about Hypothesis 1: The velocity becomes faster as distance downstream increases? Support the conclusion with data evidence from method 2 only (using a velocity meter) in Fig. 2.2 and Table 2.1. ........................................................................................................................................... ........................................................................................................................................... ........................................................................................................................................... ........................................................................................................................................... ........................................................................................................................................... ..................................................................................................................................... [3] (c) To test Hypothesis 2: The angle of slope of the river bed becomes less steep as distance downstream increases, the students measured the angle of slope of the river bed at the seven fieldwork sites. (i) Describe how they would use the equipment shown in Fig. 2.3 (Insert) to measure the angle of slope. ........................................................................................................................................... ........................................................................................................................................... ........................................................................................................................................... ........................................................................................................................................... ........................................................................................................................................... ........................................................................................................................................... ........................................................................................................................................... ..................................................................................................................................... [4] (ii) The students measured the angle of slope four times at each site. The results of their measurements are shown in Table 2.2 (Insert). At which site is there the largest variation in measurements? Site .......... [1]
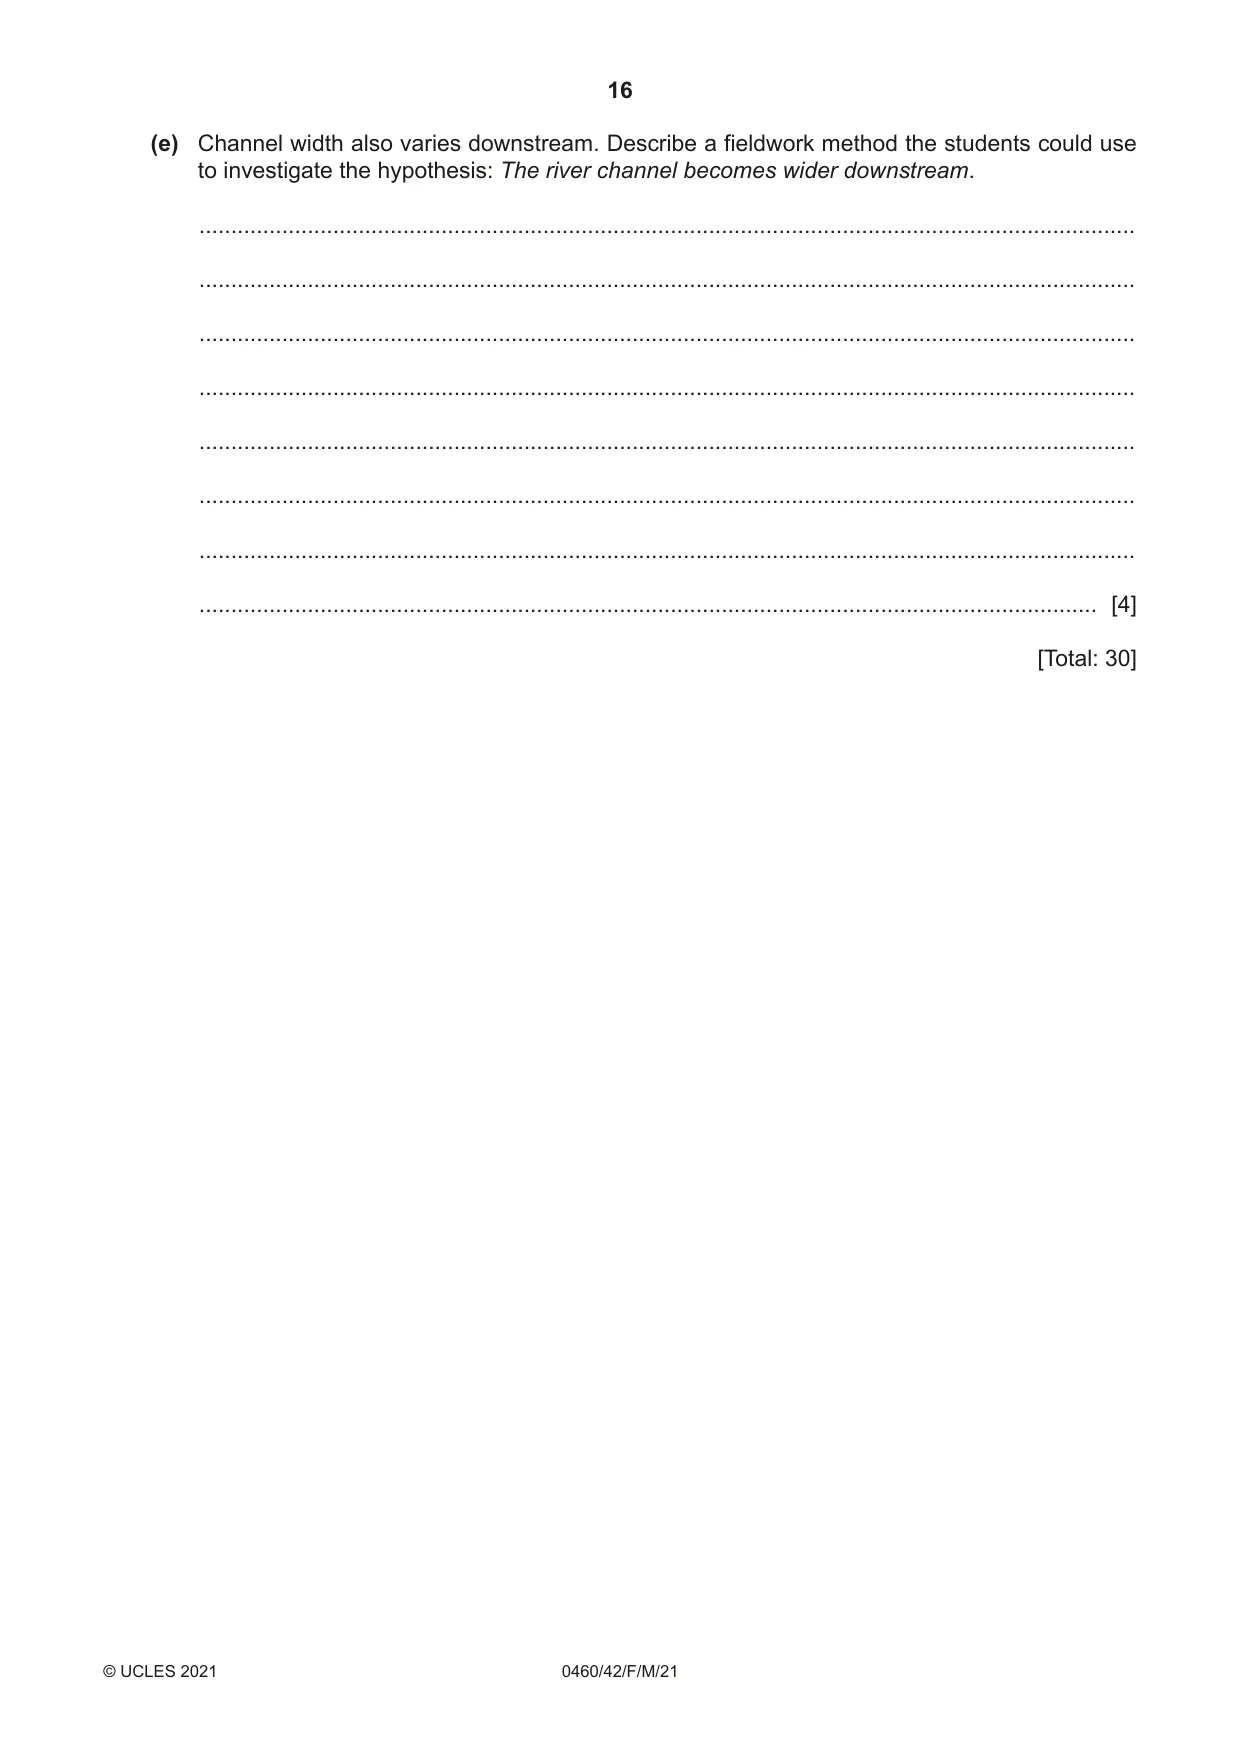
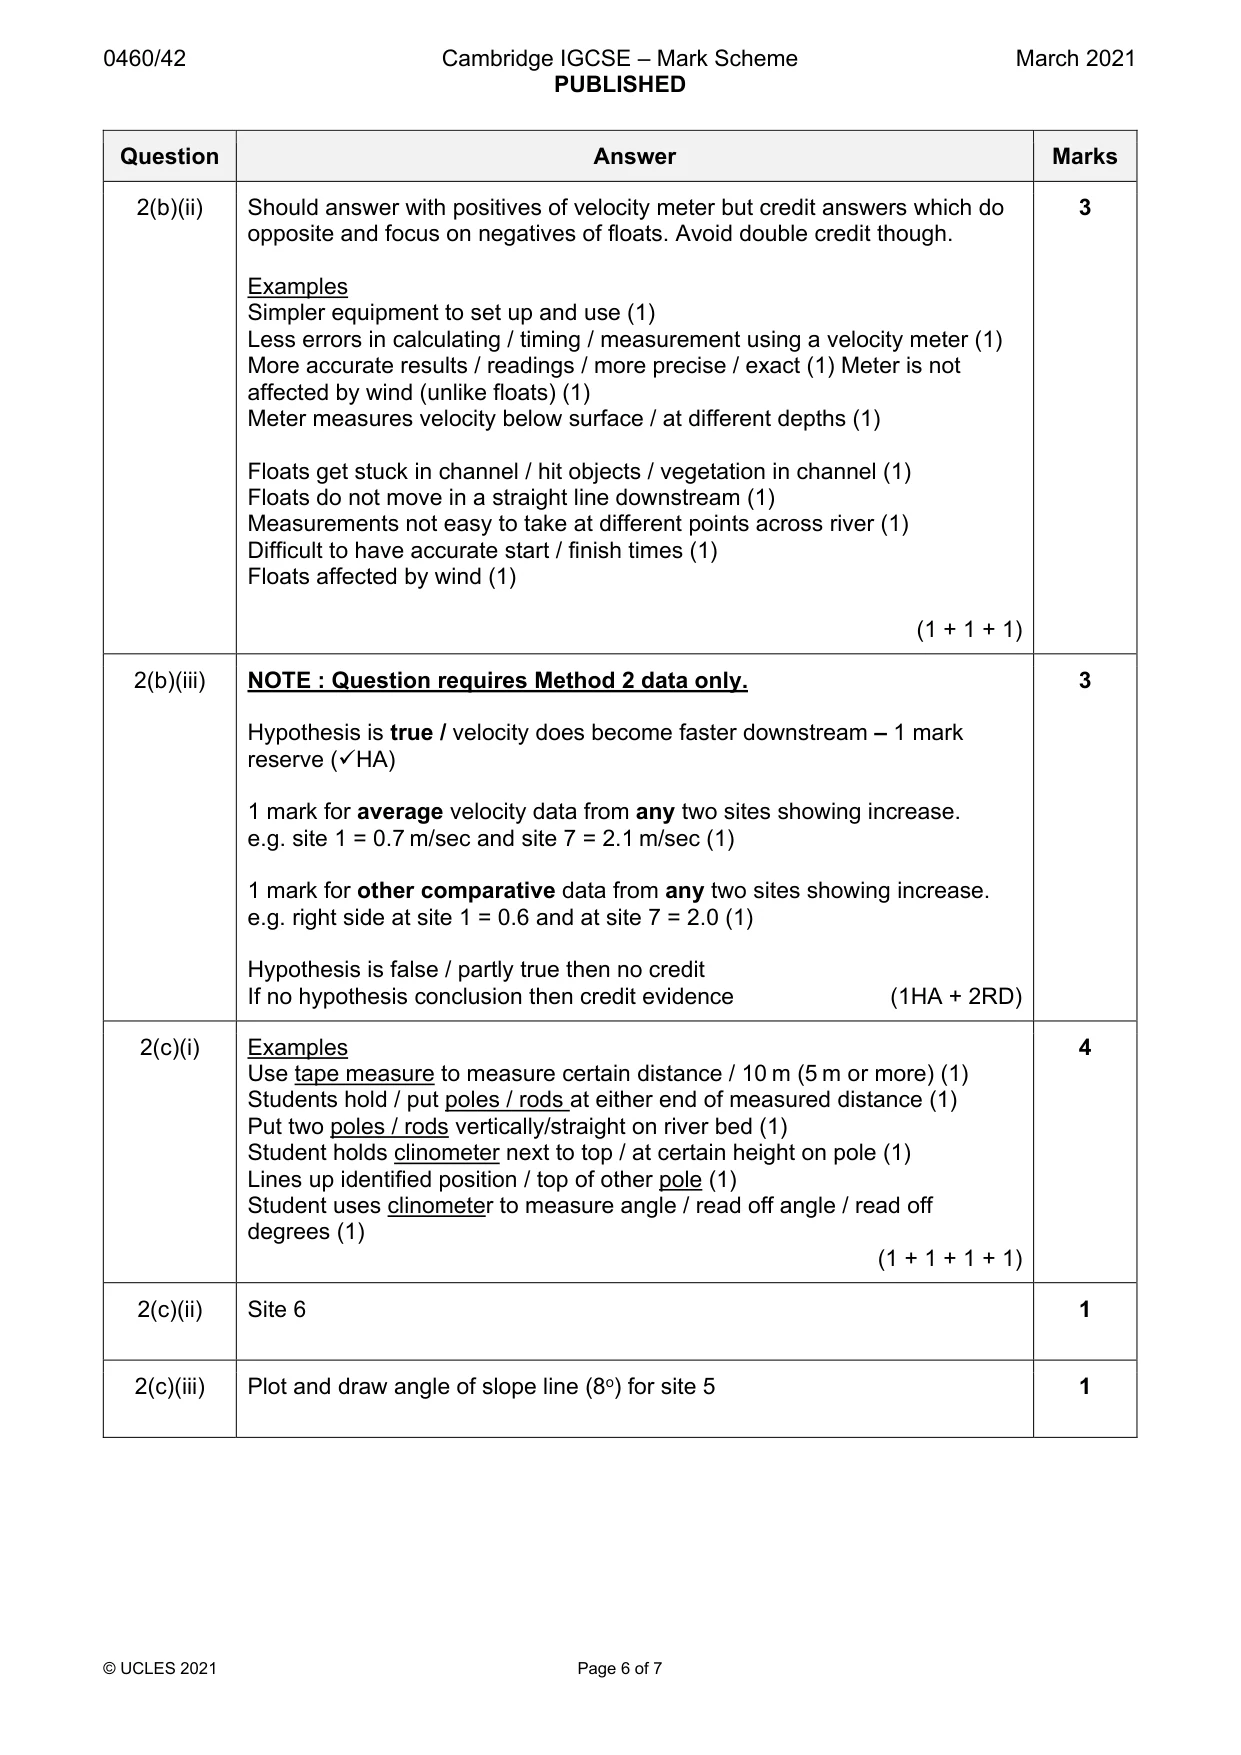
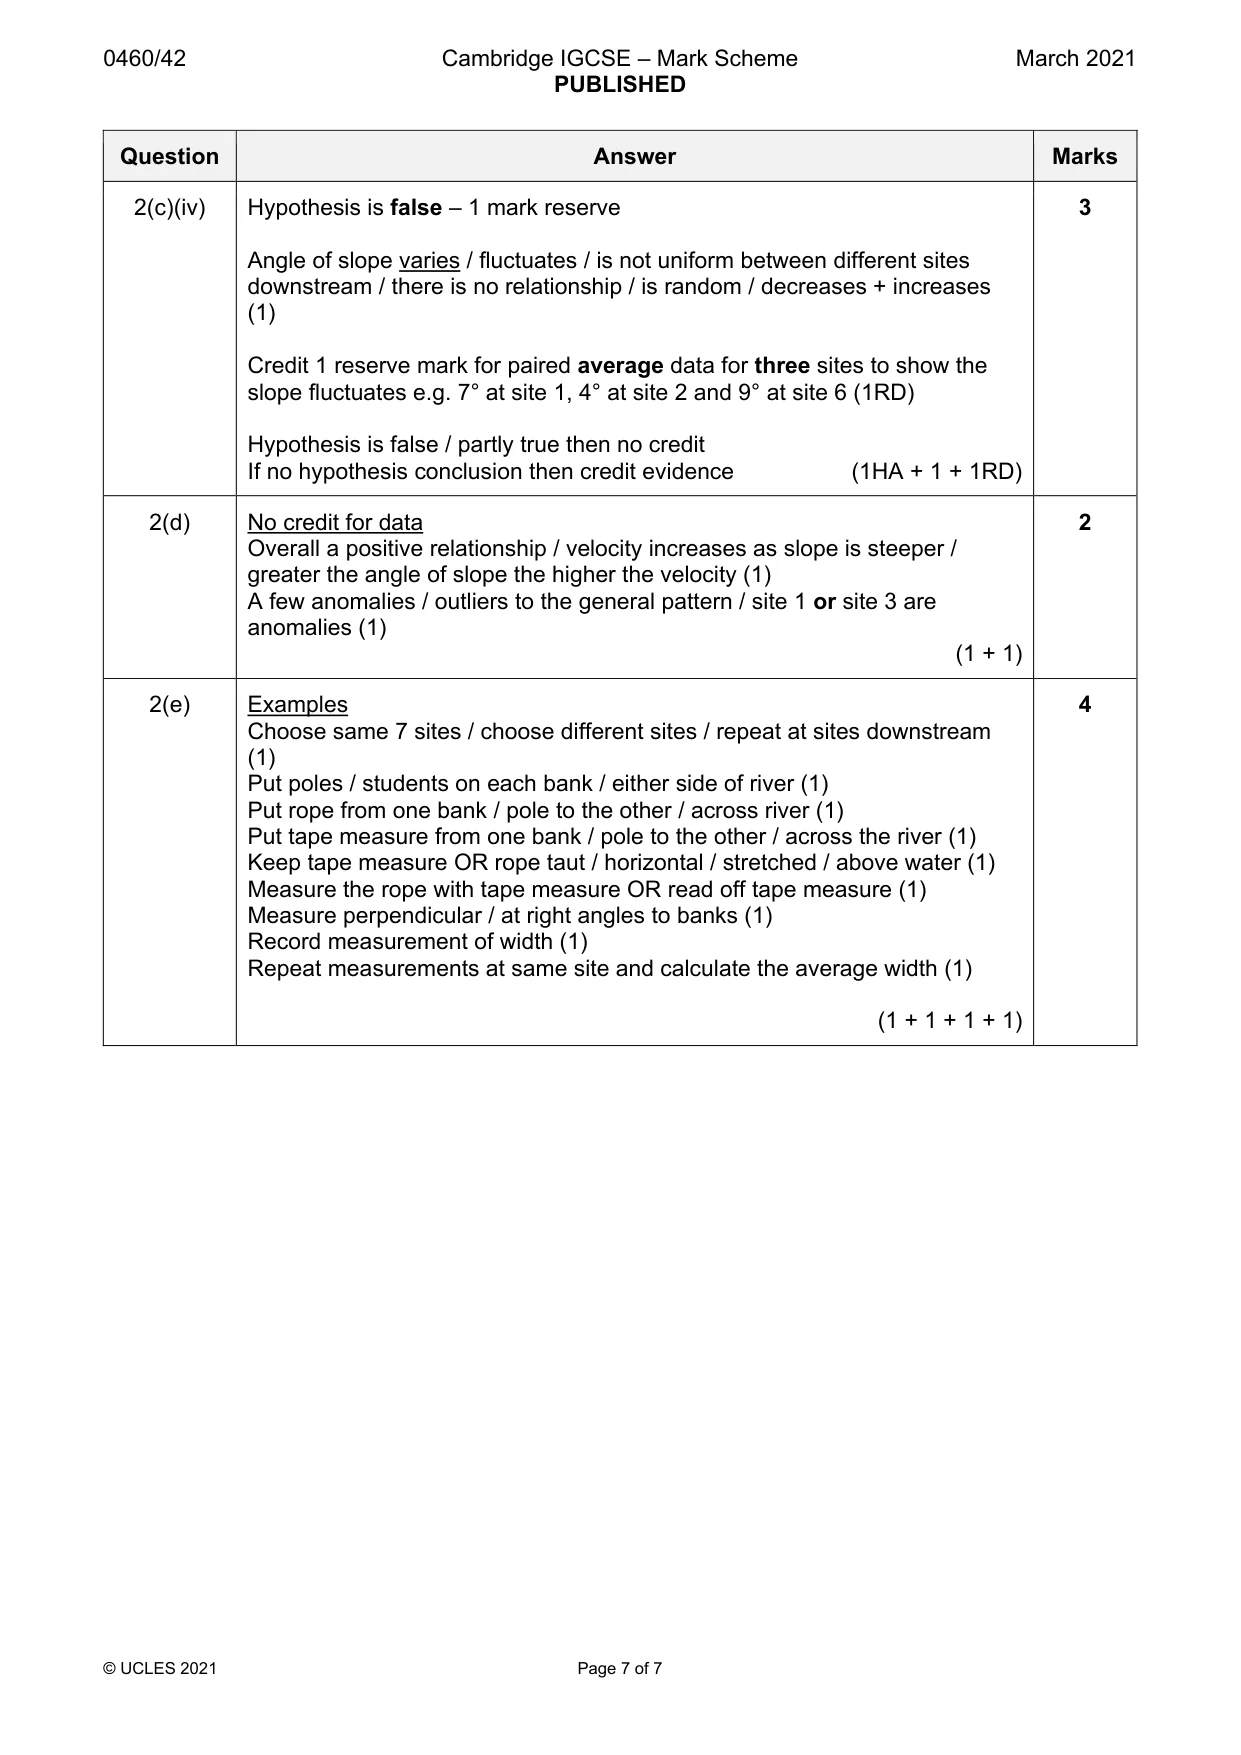
Mark scheme: 2(a)(i) Method 1: 4 Divide river in sections or 5–10 m / use a specific distance (1) Use poles to mark out each section / start + finish points (1) Measure the distance with a tape measure (1) Put orange / dog biscuit / float / into river at starting point / by first pole (1) Time float moving from start to finish (1) Repeat across the river channel / repeat and calculate average time (1) Calculate velocity by dividing distance by time (1) (1 + 1 + 1 +1) 2(a)(ii) Method 2: 3 Put velocity meter / propeller below surface of river / in river / submerge (1) Propeller must be facing upstream (1) Nothing in front of / blocking flow past the propeller / stand behind it (1) Read / look at digital / velocity reading / display / reading on screen (1) Take more readings across river channel / at different depths and calculate average (1) Repeat at same site and take average (1) (1 + 1 + 1) 2(b)(i) Plot 1.2 m / sec at site 6 and 2.0 m/sec at site 7. Plots must be crosses. 2 (1 + 1) 2(b)(ii) Should answer with positives of velocity meter but credit answers which do 3 opposite and focus on negatives of floats. Avoid double credit though. Examples Simpler equipment to set up and use (1) Less errors in calculating / timing / measurement using a velocity meter (1) More accurate results / readings / more precise / exact (1) Meter is not affected by wind (unlike floats) (1) Meter measures velocity below surface / at different depths (1) Floats get stuck in channel / hit objects / vegetation in channel (1) Floats do not move in a straight line downstream (1) Measurements not easy to take at different points across river (1) Difficult to have accurate start / finish times (1) Floats affected by wind (1) (1 + 1 + 1) 2(b)(iii) NOTE : Question requires Method 2 data only. 3 Hypothesis is true / velocity does become faster downstream – 1 mark reserve (HA) 1 mark for average velocity data from any two sites showing increase. e.g. site 1 = 0.7 m/sec and site 7 = 2.1 m/sec (1) 1 mark for other comparative data from any two sites showing increase. e.g. right side at site 1 = 0.6 and at site 7 = 2.0 (1) Hypothesis is false / partly true then no credit If no hypothesis conclusion then credit evidence (1HA + 2RD) 2(c)(i) Examples 4 Use tape measure to measure certain distance / 10 m (5 m or more) (1) Students hold / put poles / rods at either end of measured distance (1) Put two poles / rods vertically/straight on river bed (1) Student holds clinometer next to top / at certain height on pole (1) Lines up identified position / top of other pole (1) Student uses clinometer to measure angle / read off angle / read off degrees (1) (1 + 1 + 1 + 1) 2(c)(ii) Site 6 1 2(c)(iii) Plot and draw angle of slope line (8o) for site 5 1 2(c)(iv) Hypothesis is false – 1 mark reserve 3 Angle of slope varies / fluctuates / is not uniform between different sites downstream / there is no relationship / is random / decreases + increases (1) Credit 1 reserve mark for paired average data for three sites to show the slope fluctuates e.g. 7° at site 1, 4° at site 2 and 9° at site 6 (1RD) Hypothesis is false / partly true then no credit If no hypothesis conclusion then credit evidence (1HA + 1 + 1RD) 2(d) No credit for data 2 Overall a positive relationship / velocity increases as slope is steeper / greater the angle of slope the higher the velocity (1) A few anomalies / outliers to the general pattern / site 1 or site 3 are anomalies (1) (1 + 1) 2(e) Examples 4 Choose same 7 sites / choose different sites / repeat at sites downstream (1) Put poles / students on each bank / either side of river (1) Put rope from one bank / pole to the other / across river (1) Put tape measure from one bank / pole to the other / across the river (1) Keep tape measure OR rope taut / horizontal / stretched / above water (1) Measure the rope with tape measure OR read off tape measure (1) Measure perpendicular / at right angles to banks (1) Record measurement of width (1) Repeat measurements at same site and calculate the average width (1) (1 + 1 + 1 + 1)
What was in this paper
The subtopics covered by these 2 questions, and how many questions each got. Open one in a new tab to see every Cambridge question on it.
What you needed in this session
Cambridge’s own grade thresholds for 2021 Feb/March, Paper 4 · Variant 2. A higher threshold means an easier paper — the bar moves with how the cohort did.