Cambridge IGCSE Geography 0460 — 2020 Feb/March Paper 4 · Variant 2
0460/42/F/M/20 · 2 questions · 60 marks · ≈68 min
The question paper and its mark scheme, free to read here and free to download. This is Cambridge’s own paper, exactly as it was sat.
Question paper20 pages









Mark scheme8 pages
Answers below. Sit the paper first if you are practising.




Questions as text
Q1 · A class of students went on a field visit to some coastal sand dunes in northern…
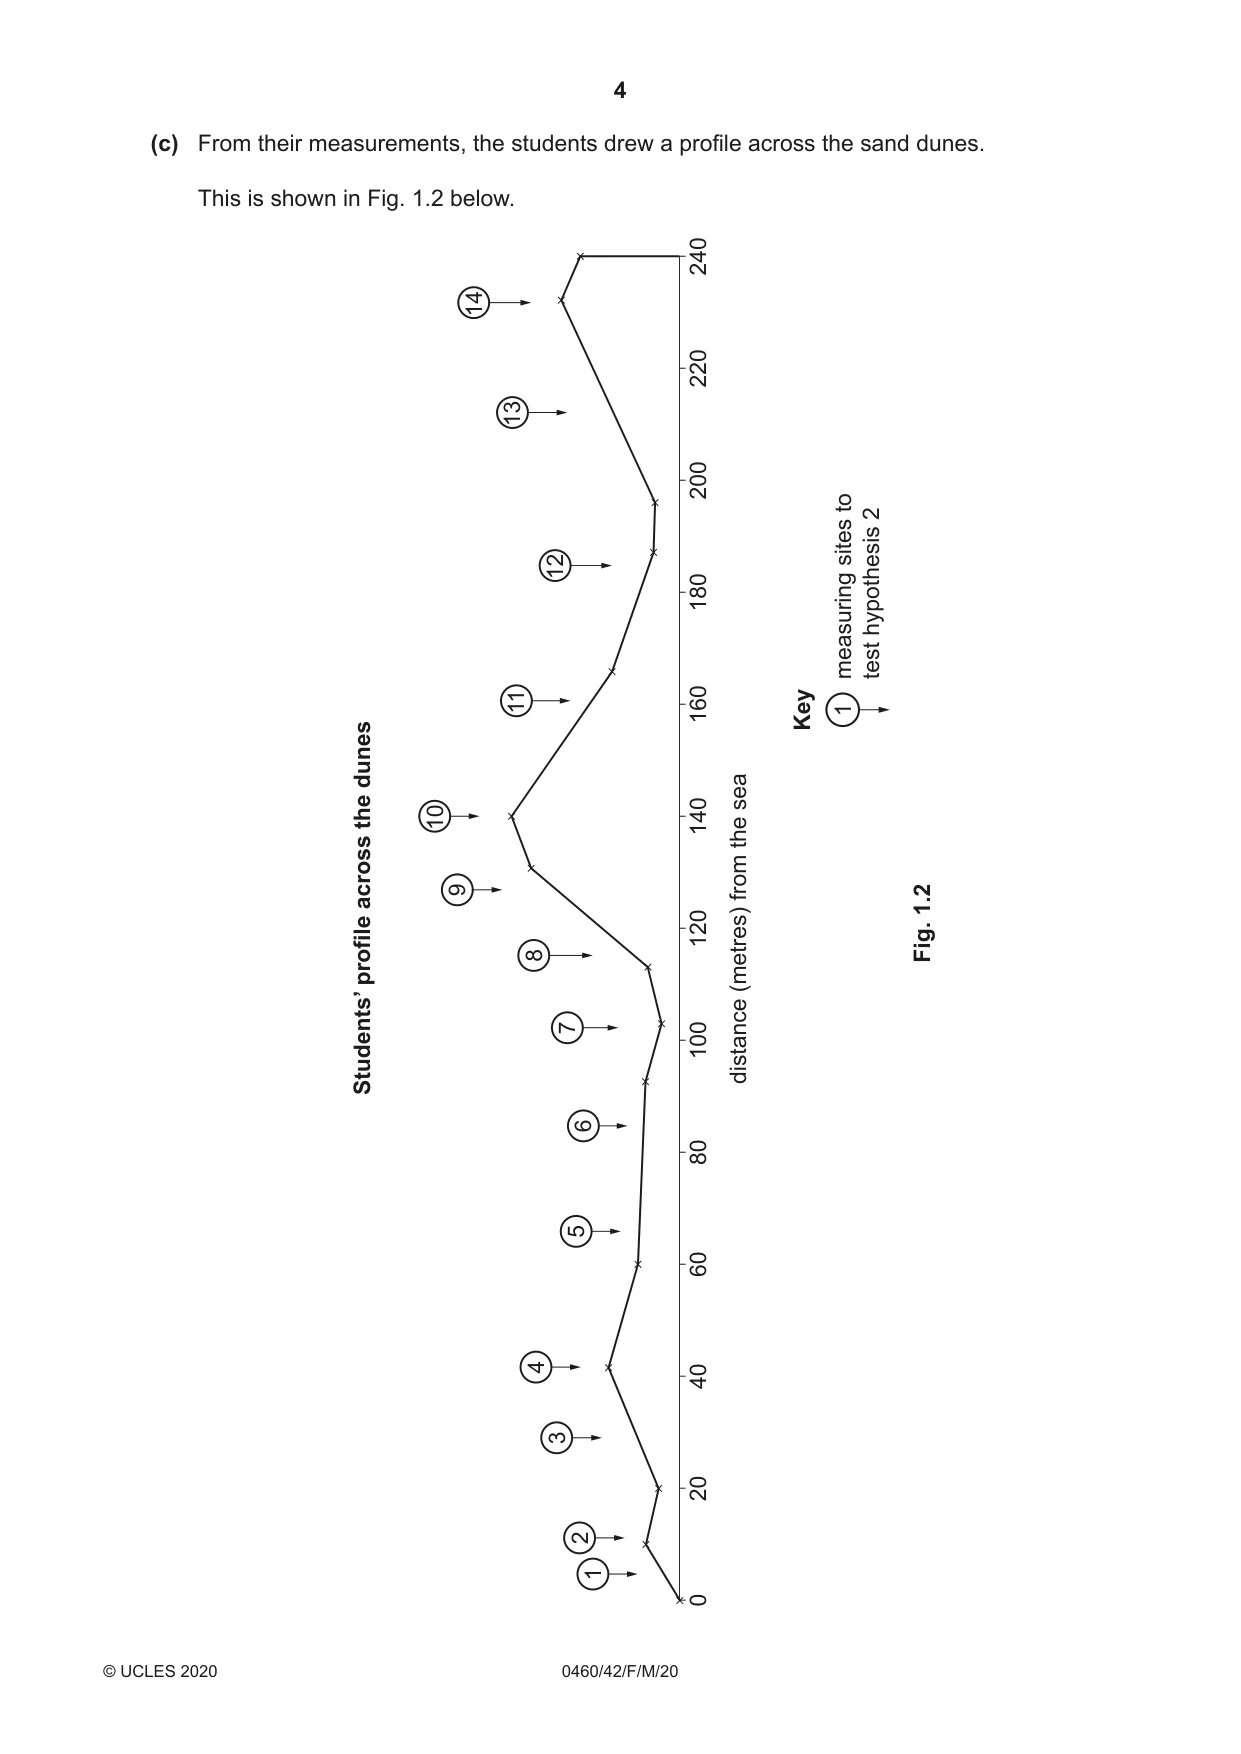
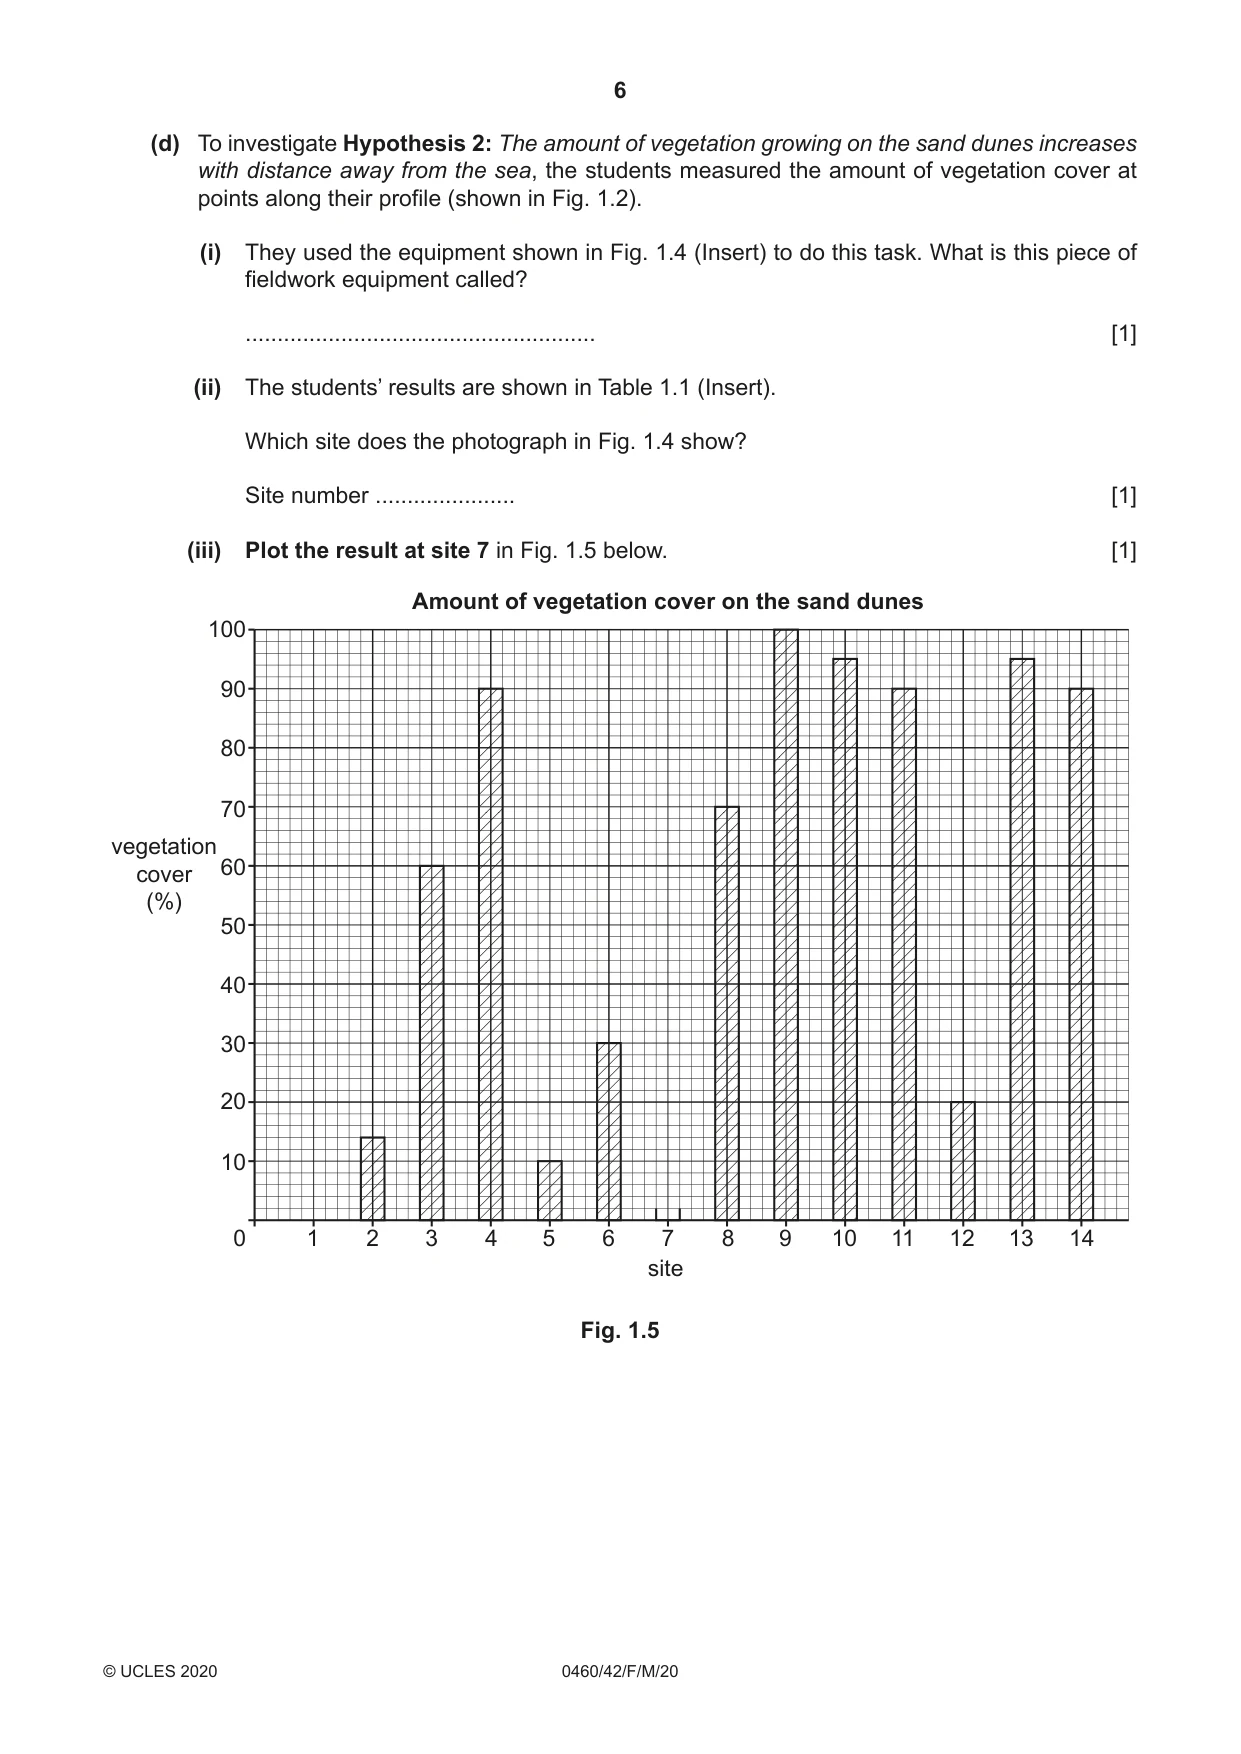
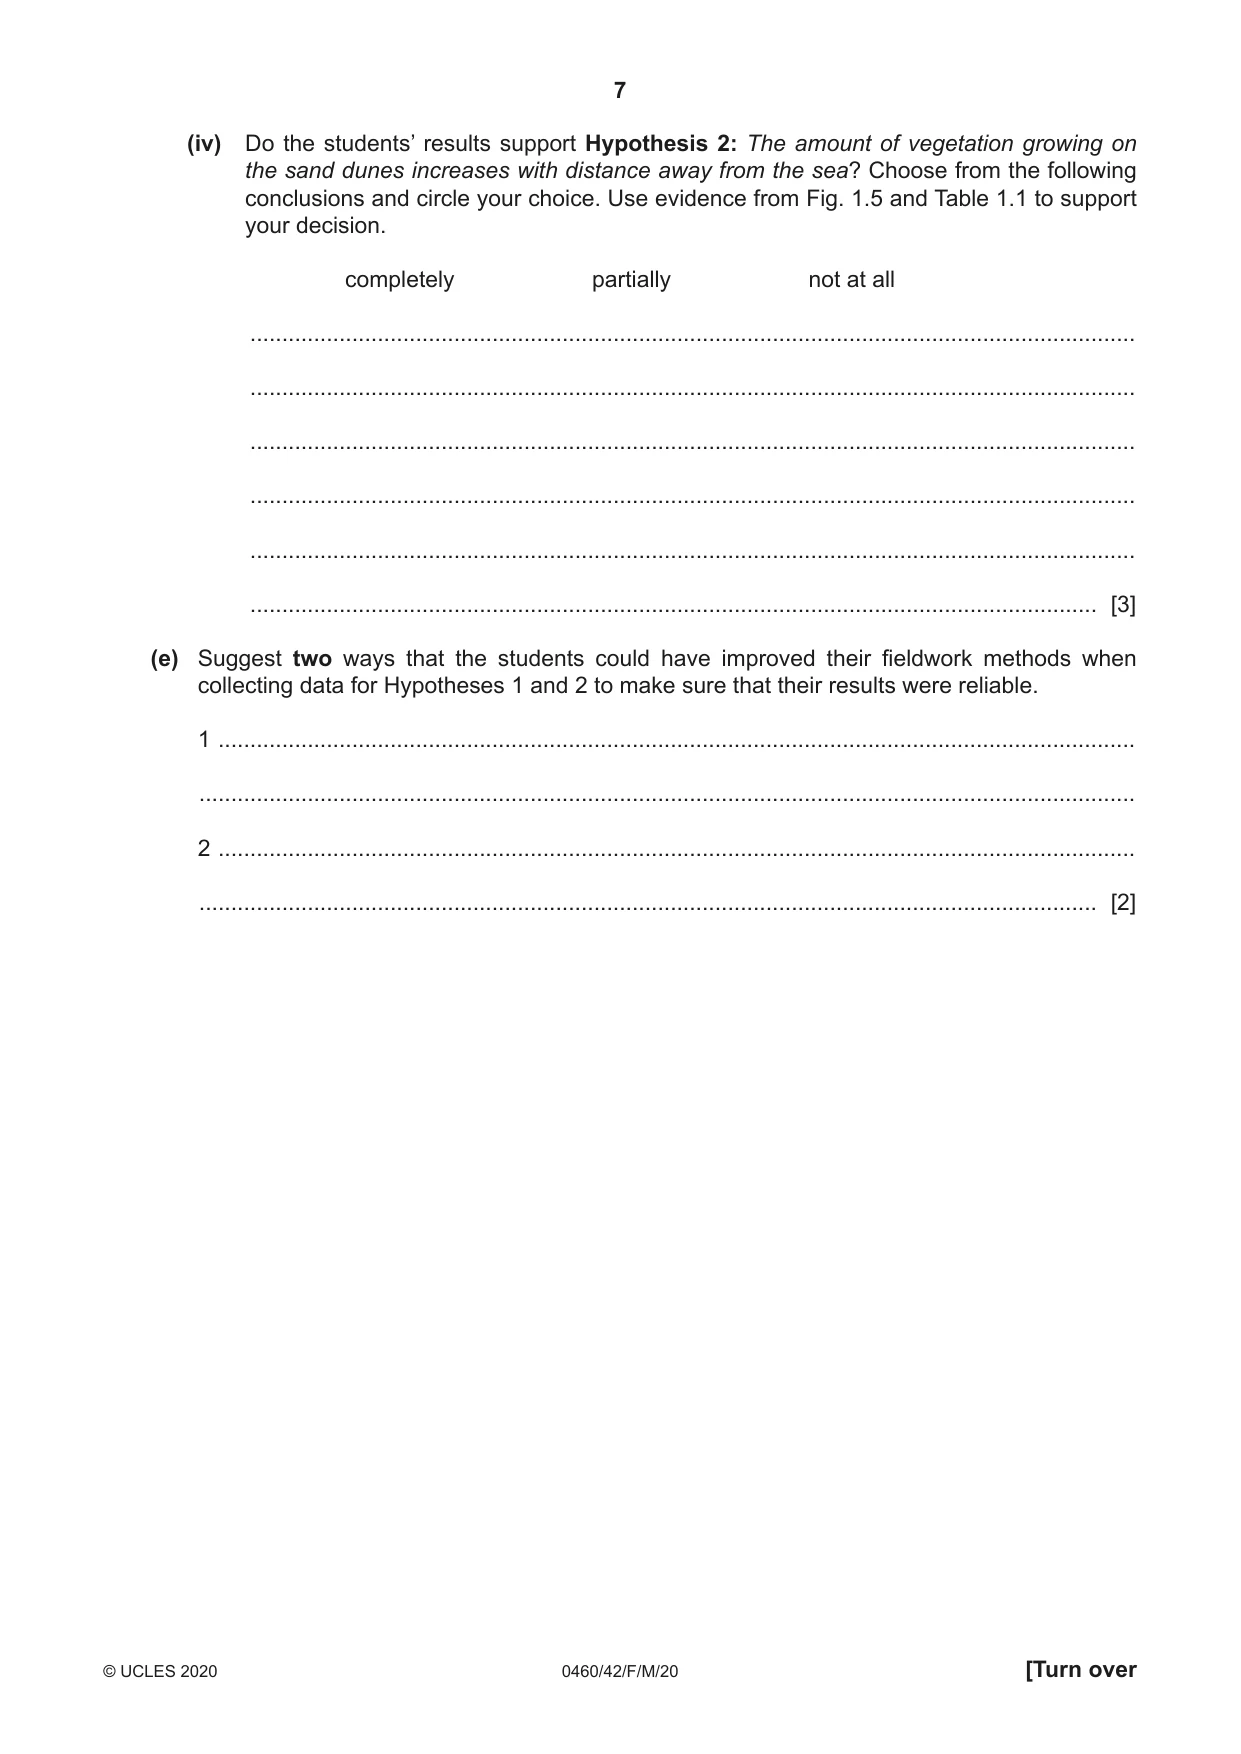
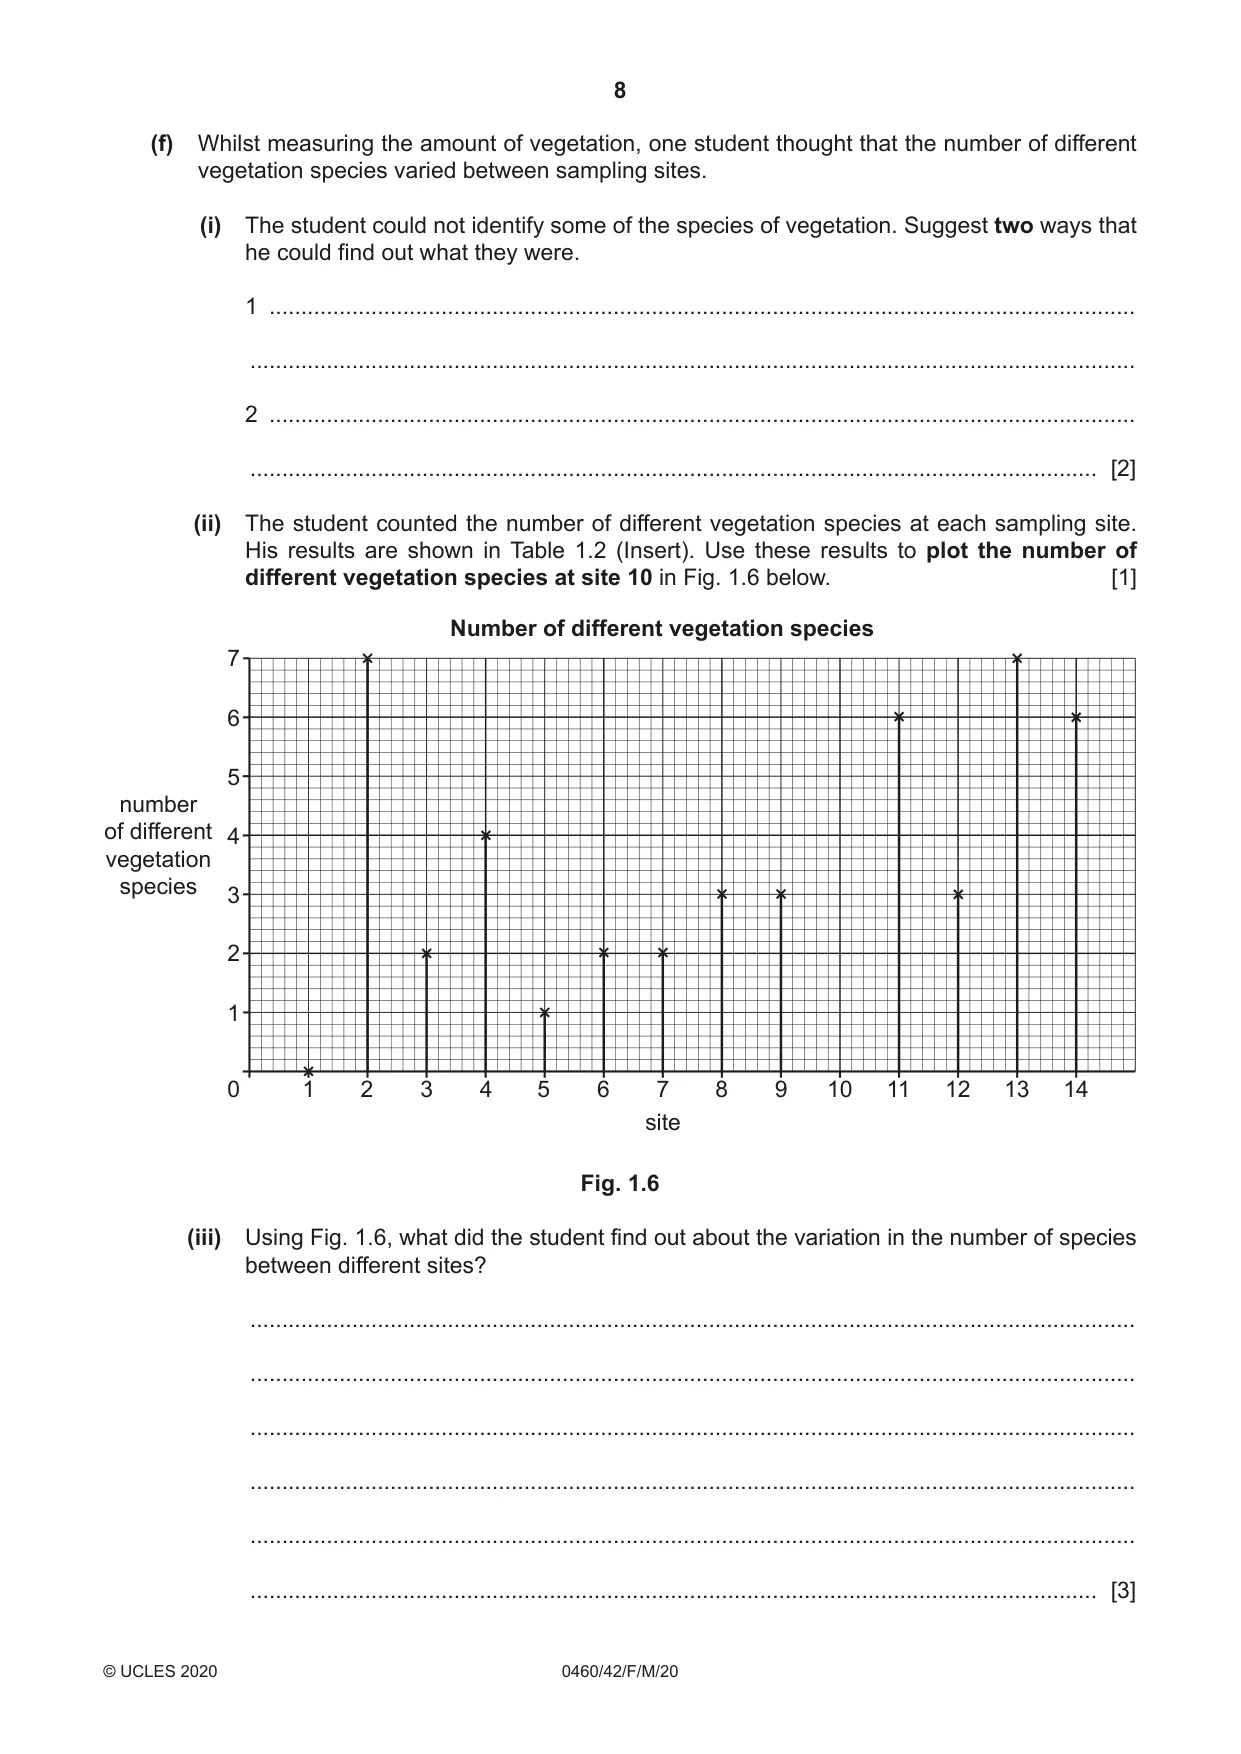
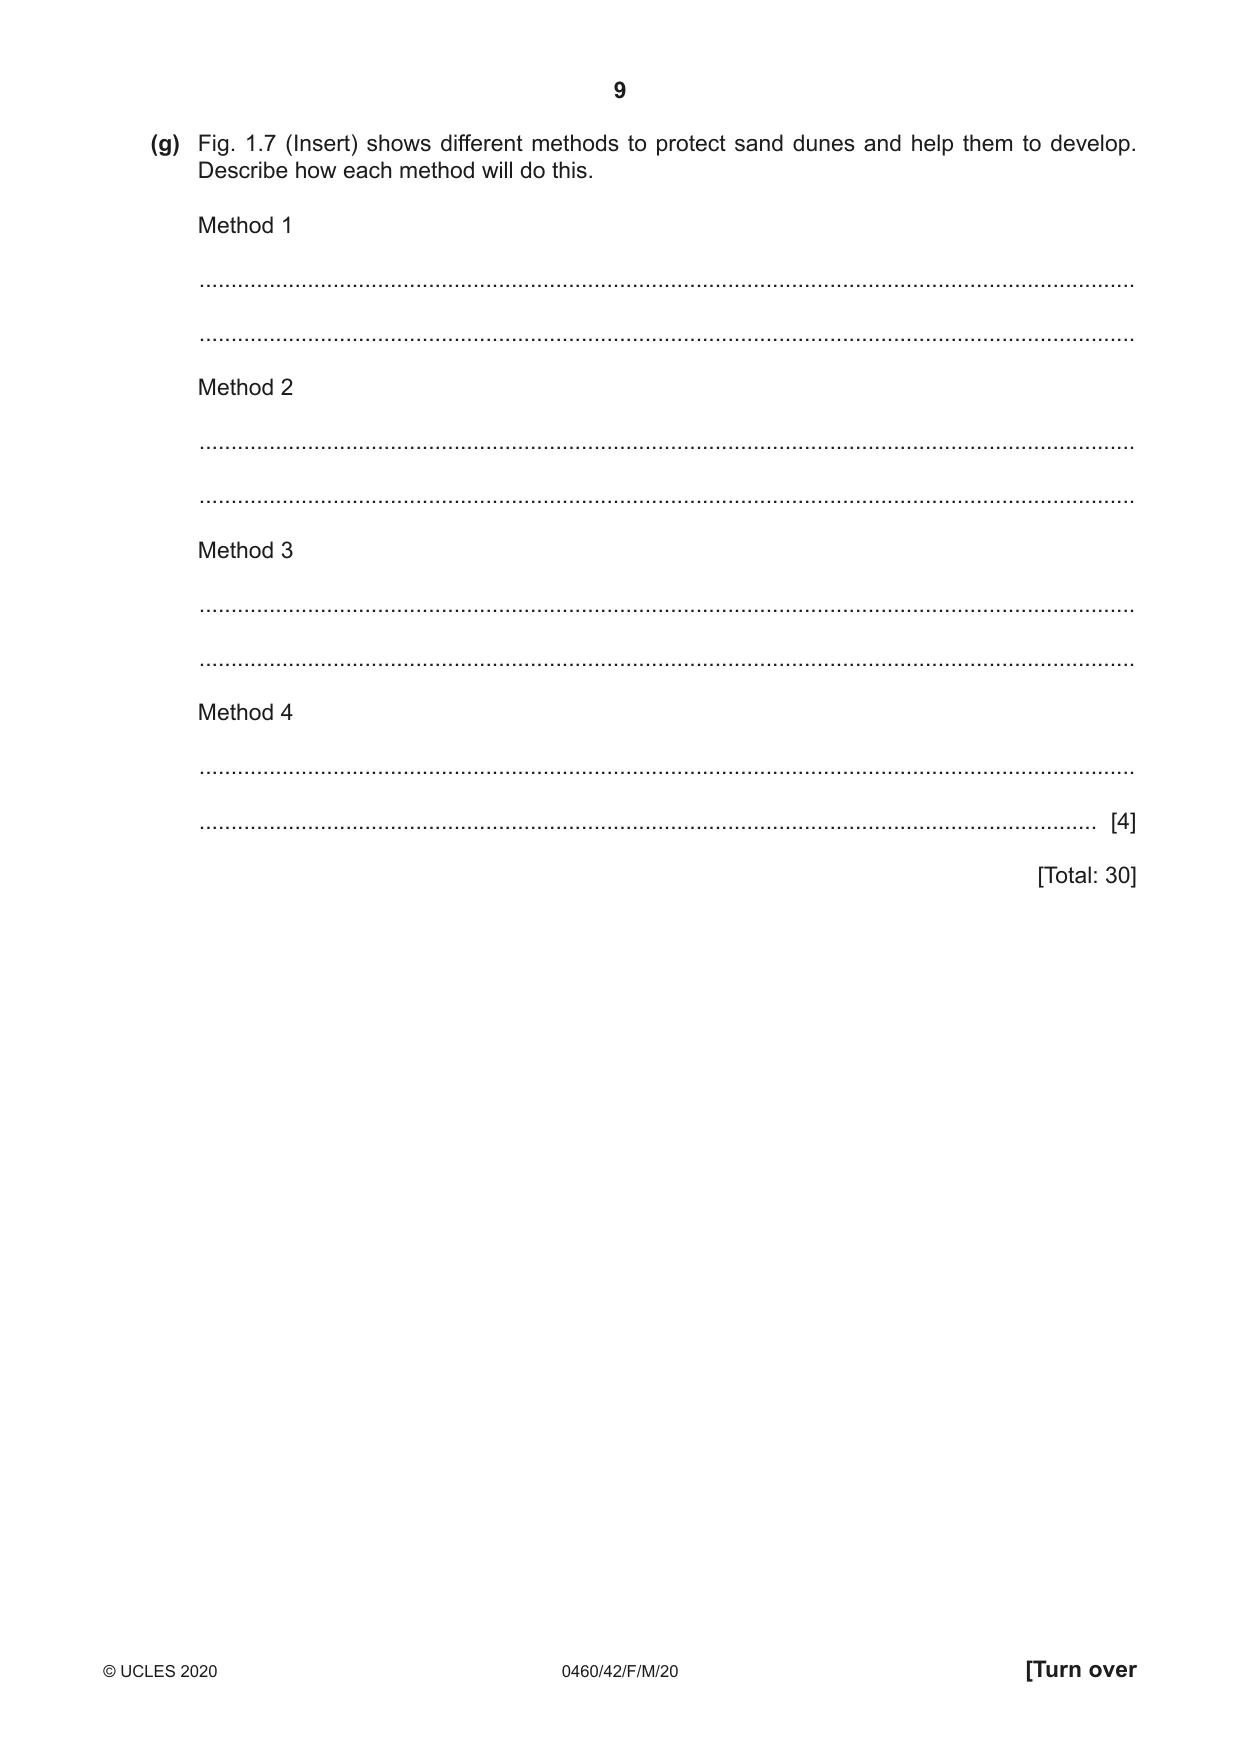
1 A class of students went on a field visit to some coastal sand dunes in northern Brittany, France. Having studied the formation of sand dunes in class, the students wanted to find out more about their shape and the vegetation that grows on them. (a) Put the following statements in the correct order in the table below to show the correct sequence of how sand dunes are formed. The first statement has been done for you. • The growth of marram grass helps to stabilise the dunes. • Wind picks up sand and moves it up the beach. • Sand is deposited around the obstacle and the dune begins to grow. • Friction with an obstacle on the beach slows down the wind. 1 Wind from the sea blows onshore. 2 ................................................................................................................... ................................................................................................................... 3 ................................................................................................................... ................................................................................................................... 4 ................................................................................................................... ................................................................................................................... 5 ................................................................................................................... ................................................................................................................... [3] The students agreed to test two hypotheses. Hypothesis 1: The profile of sand dunes in the area matches a model profile drawn in a textbook. Hypothesis 2: The amount of vegetation growing on the sand dunes increases with distance away from the sea. (b) To investigate Hypothesis 1, the students measured the changing angle of slope across the sand dunes inland from the sea. The method they used is shown in Fig. 1.1 (Insert). Explain how the following equipment was used. Ranging poles ................................................................................................................................................... ................................................................................................................................................... ................................................................................................................................................... ................................................................................................................................................... Tape measure ................................................................................................................................................... ................................................................................................................................................... ................................................................................................................................................... ................................................................................................................................................... Clinometer ................................................................................................................................................... ................................................................................................................................................... ................................................................................................................................................... ............................................................................................................................................. [6] (c) From their measurements, the students drew a This is shown in Fig. 1.2 below. 14 13 12 11 dunes the 10 9 across 8 profile 7 Students’ 6 5 4 3 2 1 Compare the students’ profile (Fig. 1.2) with the model profile drawn in a textbook, which is shown in Fig. 1.3 (Insert). What conclusion would the students make about Hypothesis 1: The profile of sand dunes in the area matches a model profile drawn in a textbook? Support your conclusion with evidence from Figs. 1.2 and 1.3. ................................................................................................................................................... ................................................................................................................................................... ................................................................................................................................................... ................................................................................................................................................... ................................................................................................................................................... ............................................................................................................................................. [3] (d) To investigate Hypothesis 2: The amount of vegetation growing on the sand dunes increases with distance away from the sea, the students measured the amount of vegetation cover at points along their profile (shown in Fig. 1.2). (i) They used the equipment shown in Fig. 1.4 (Insert) to do this task. What is this piece of fieldwork equipment called? ....................................................... [1] (ii) The students’ results are shown in Table 1.1 (Insert). Which site does the photograph in Fig. 1.4 show? Site number ...................... [1] (iii) Plot the result at site 7 in Fig. 1.5 below. [1] Amount of vegetation cover on the sand dunes 100 90 80 70 vegetation 60 cover (%) 50 40 30 20 10 0 1 2 3 4 5 6 7 8 9 10 11 12 13 14 site Fig. 1.5 (iv) Do the students’ results support Hypothesis 2: The amount of vegetation growing on the sand dunes increases with distance away from the sea? Choose from the following conclusions and circle your choice. Use evidence from Fig. 1.5 and Table 1.1 to support your decision. completely partially not at all ........................................................................................................................................... ........................................................................................................................................... ........................................................................................................................................... ........................................................................................................................................... ........................................................................................................................................... ..................................................................................................................................... [3] (e) Suggest two ways that the students could have improved their fieldwork methods when collecting data for Hypotheses 1 and 2 to make sure that their results were reliable. 1 ................................................................................................................................................ ................................................................................................................................................... 2 ................................................................................................................................................ ............................................................................................................................................. [2] (f) Whilst measuring the amount of vegetation, one student thought that the number of different vegetation species varied between sampling sites. (i) The student could not identify some of the species of vegetation. Suggest two ways that he could find out what they were. 1 ........................................................................................................................................ ........................................................................................................................................... 2 ........................................................................................................................................ ..................................................................................................................................... [2] (ii) The student counted the number of different vegetation species at each sampling site. His results are shown in Table 1.2 (Insert). Use these results to plot the number of different vegetation species at site 10 in Fig. 1.6 below. [1] Number of different vegetation species 7 6 5 number of different 4 vegetation species 3 2 1 0 1 2 3 4 5 6 7 8 9 10 11 12 13 14 site Fig. 1.6 (iii) Using Fig. 1.6, what did the student find out about the variation in the number of species between different sites? ........................................................................................................................................... ........................................................................................................................................... ........................................................................................................................................... ........................................................................................................................................... ........................................................................................................................................... ..................................................................................................................................... [3] (g) Fig. 1.7 (Insert) shows different methods to protect sand dunes and help them to develop. Describe how each method will do this. Method 1 ................................................................................................................................................... ................................................................................................................................................... Method 2 ................................................................................................................................................... ................................................................................................................................................... Method 3 ................................................................................................................................................... ................................................................................................................................................... Method 4 ................................................................................................................................................... ............................................................................................................................................. [4] [Total: 30]
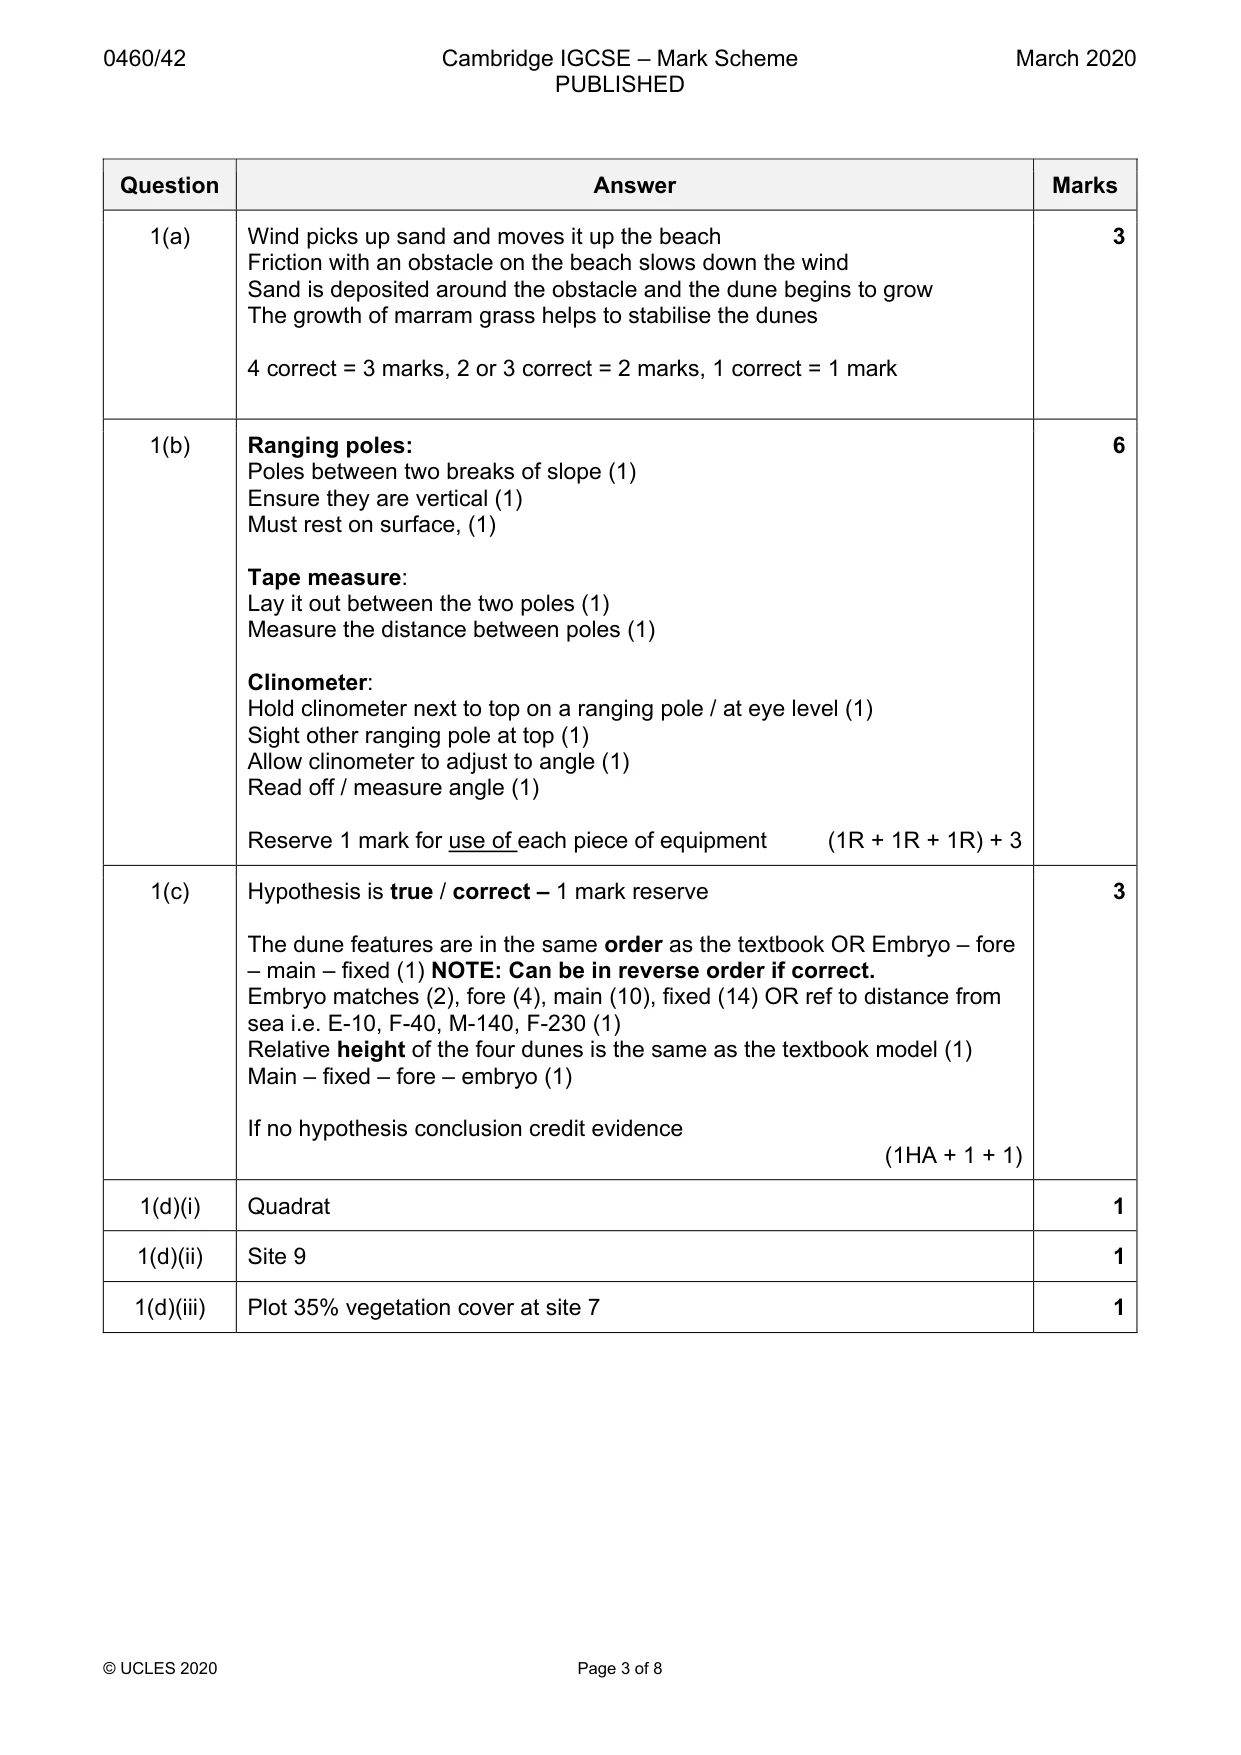
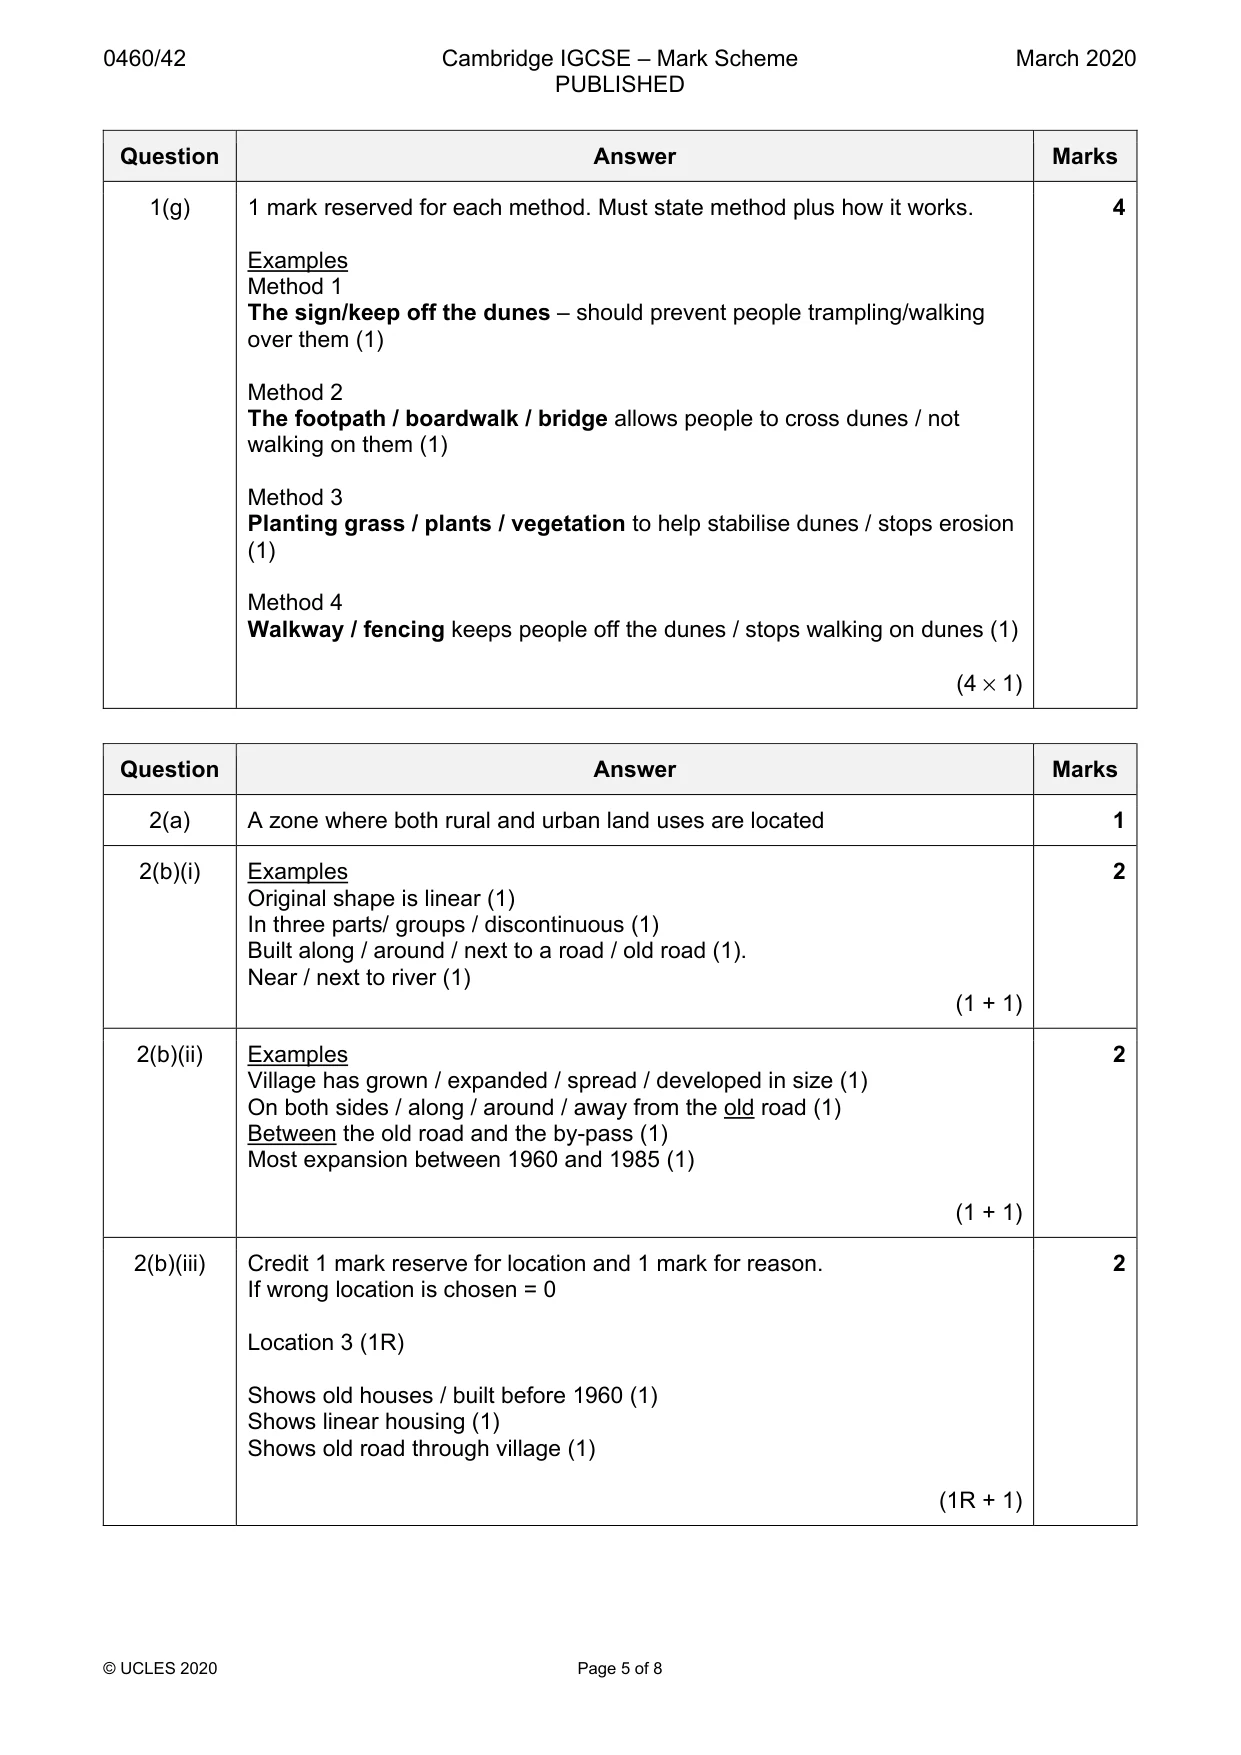
Mark scheme: Question Answer Marks 1(a) Wind picks up sand and moves it up the beach 3 Friction with an obstacle on the beach slows down the wind Sand is deposited around the obstacle and the dune begins to grow The growth of marram grass helps to stabilise the dunes 4 correct = 3 marks, 2 or 3 correct = 2 marks, 1 correct = 1 mark 1(b) Ranging poles: 6 Poles between two breaks of slope (1) Ensure they are vertical (1) Must rest on surface, (1) Tape measure: Lay it out between the two poles (1) Measure the distance between poles (1) Clinometer: Hold clinometer next to top on a ranging pole / at eye level (1) Sight other ranging pole at top (1) Allow clinometer to adjust to angle (1) Read off / measure angle (1) Reserve 1 mark for use of each piece of equipment (1R + 1R + 1R) + 3 1(c) Hypothesis is true / correct – 1 mark reserve 3 The dune features are in the same order as the textbook OR Embryo – fore – main – fixed (1) NOTE: Can be in reverse order if correct. Embryo matches (2), fore (4), main (10), fixed (14) OR ref to distance from sea i.e. E-10, F-40, M-140, F-230 (1) Relative height of the four dunes is the same as the textbook model (1) Main – fixed – fore – embryo (1) If no hypothesis conclusion credit evidence (1HA + 1 + 1) 1(d)(i) Quadrat 1 1(d)(ii) Site 9 1 1(d)(iii) Plot 35% vegetation cover at site 7 1 1(d)(iv) Hypothesis is partially supported – 1 mark reserve 3 Agree: Any 2 percentages and 2 site numbers that show increase. e.g. Percentage of cover increases from 0% at site 1 to 90% at site 14 (1) Disagree: Any 2 percentages and 2 site numbers that show decrease. e.g. Percentage of cover is 90% at site 11 and 20% at site 12 (1) If no hypothesis conclusion credit evidence NOTE: Accept data if no units e.g. 90 instead of 90% is OK (1HA + 1 + 1) 1(e) Examples 2 Another student checks measurements (1) Take more measurements / more sites / intervals and average results (1) Measure along more than one dune profile/another part of beach (1) (1 + 1) 1(f)(i) Examples 2 Photograph / take sample / sketch / write a description of vegetation (1) Look up in book / internet / app / vegetation chart (1) Ask ranger / teacher / expert / farmer (1) (1 + 1) 1(f)(ii) Plot 4 species at site 10 – line not needed. 1 1f(iii) Examples 3 Number of species does vary between sites / increases / decreases / no regular pattern (1) Any 2 sites with different numbers e.g. Site 2 is 7 and Site 3 is 2 (1) Number varies between 0 and 7 (1) Overall more species at sites furthest from the sea (1) Some anomalies e.g. 6 and 7 same (1) (1 + 1 +1) 1(g) 1 mark reserved for each method. Must state method plus how it works. 4 Examples Method 1 The sign/keep off the dunes – should prevent people trampling/walking over them (1) Method 2 The footpath / boardwalk / bridge allows people to cross dunes / not walking on them (1) Method 3 Planting grass / plants / vegetation to help stabilise dunes / stops erosion (1) Method 4 Walkway / fencing keeps people off the dunes / stops walking on dunes (1) (4 × 1)
Q2 · Students in the UK were studying a village in the rural–urban fringe
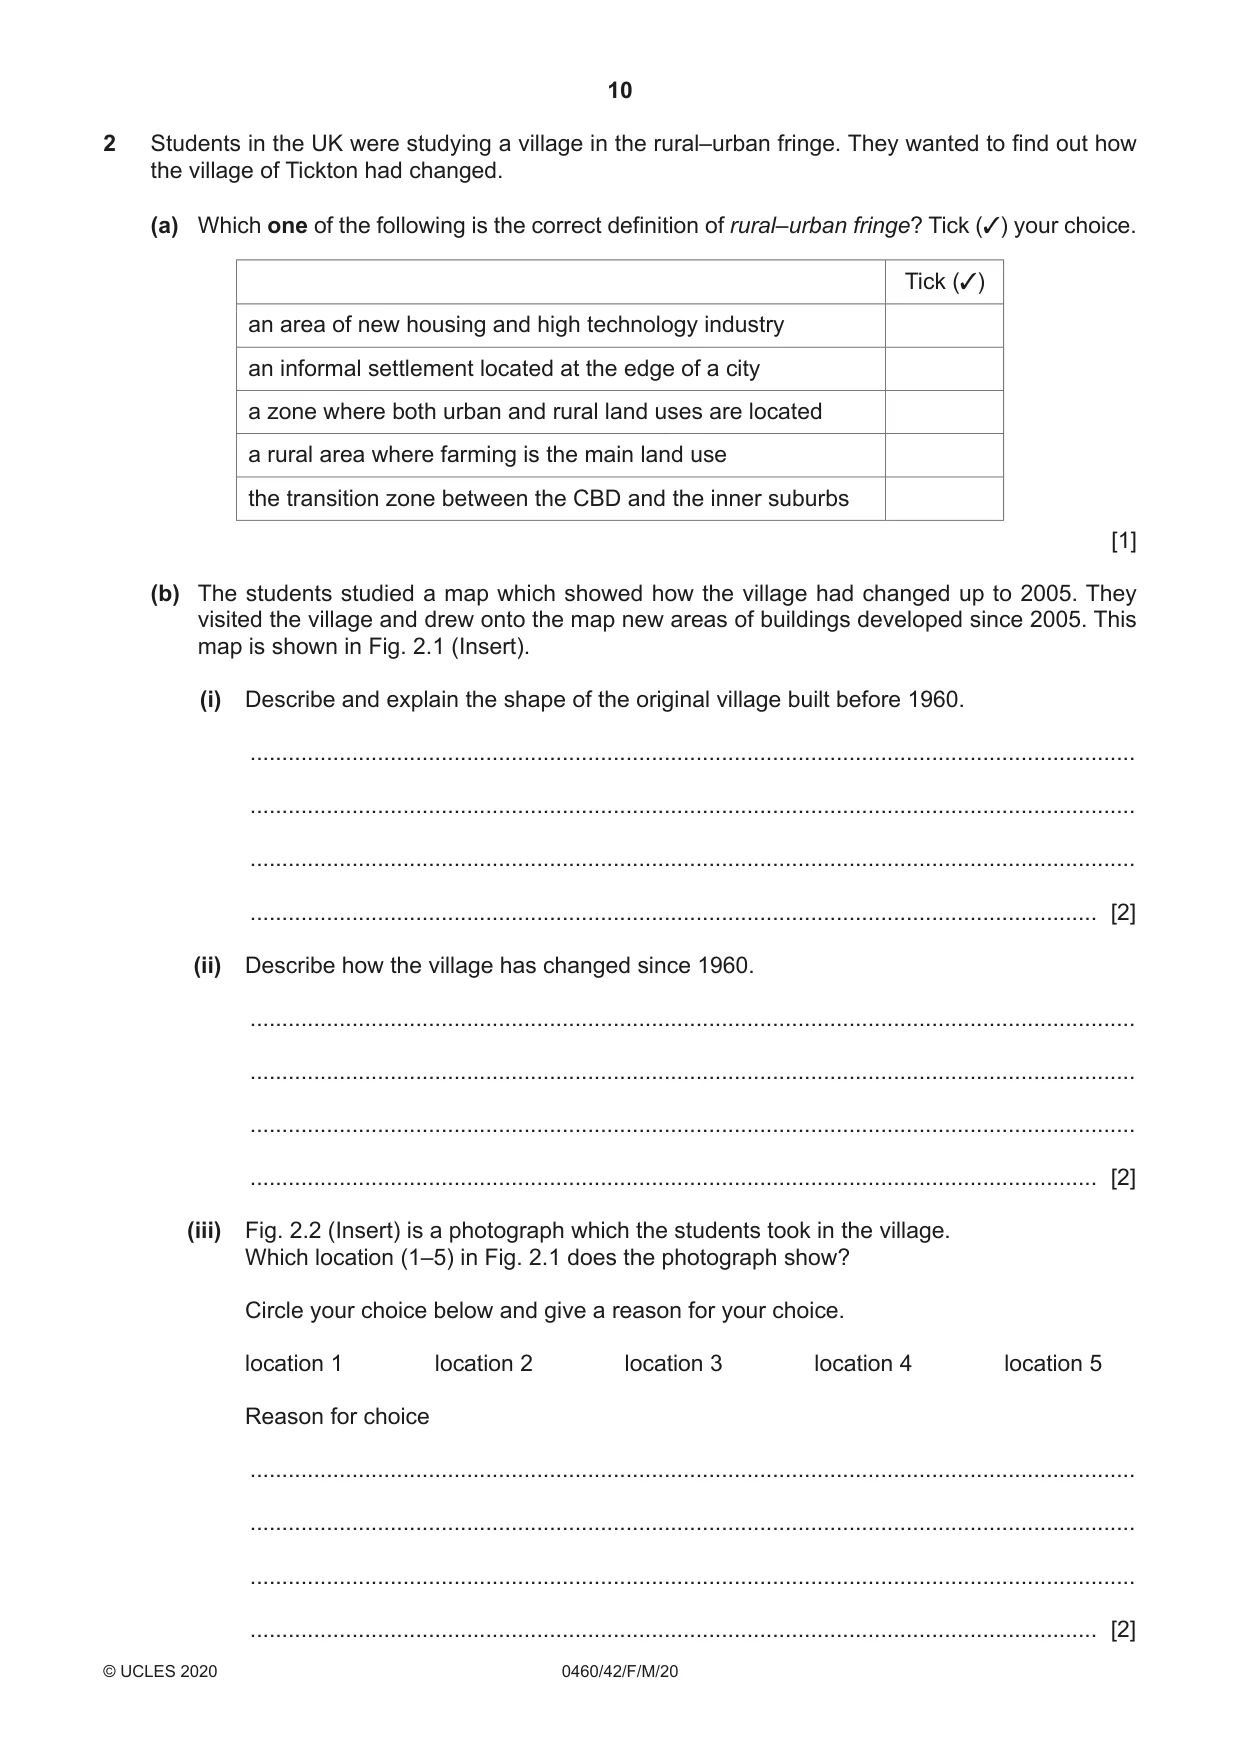
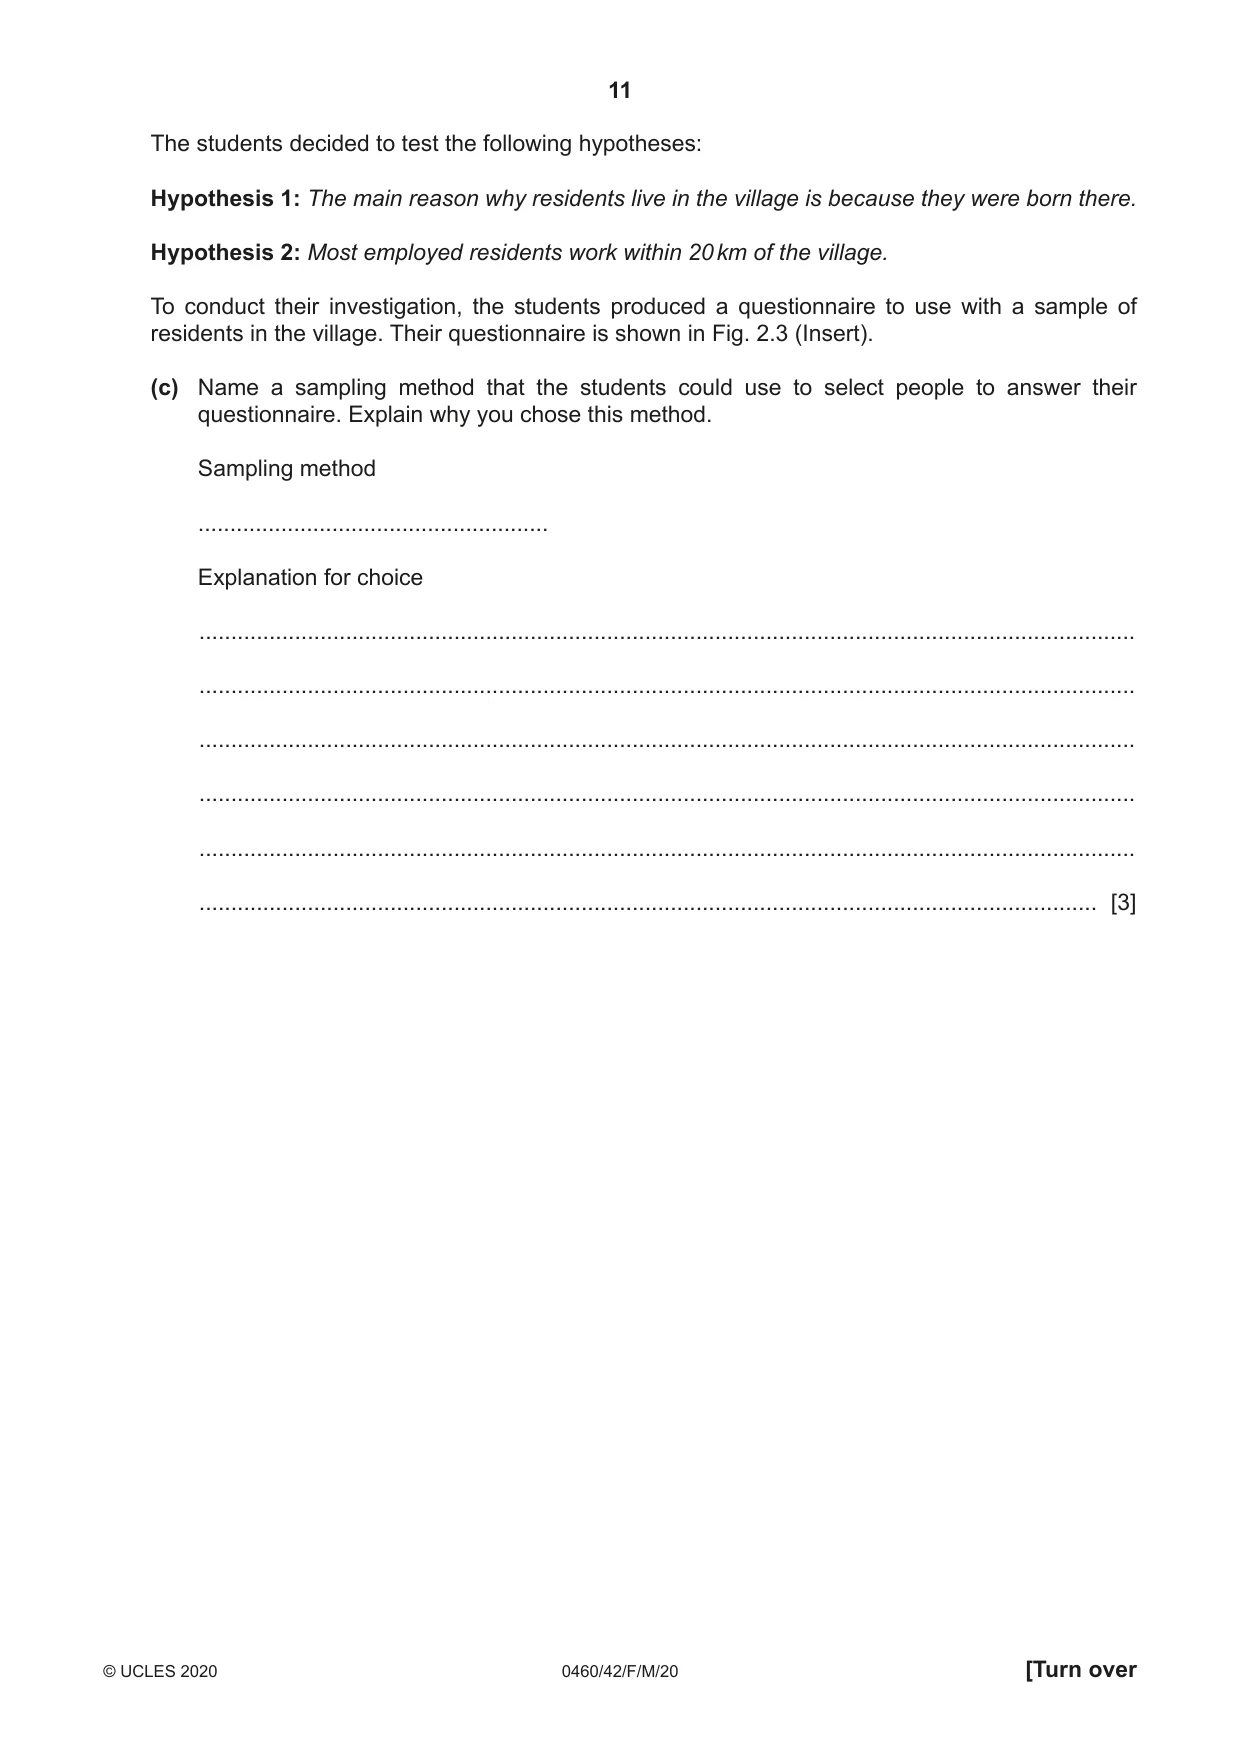
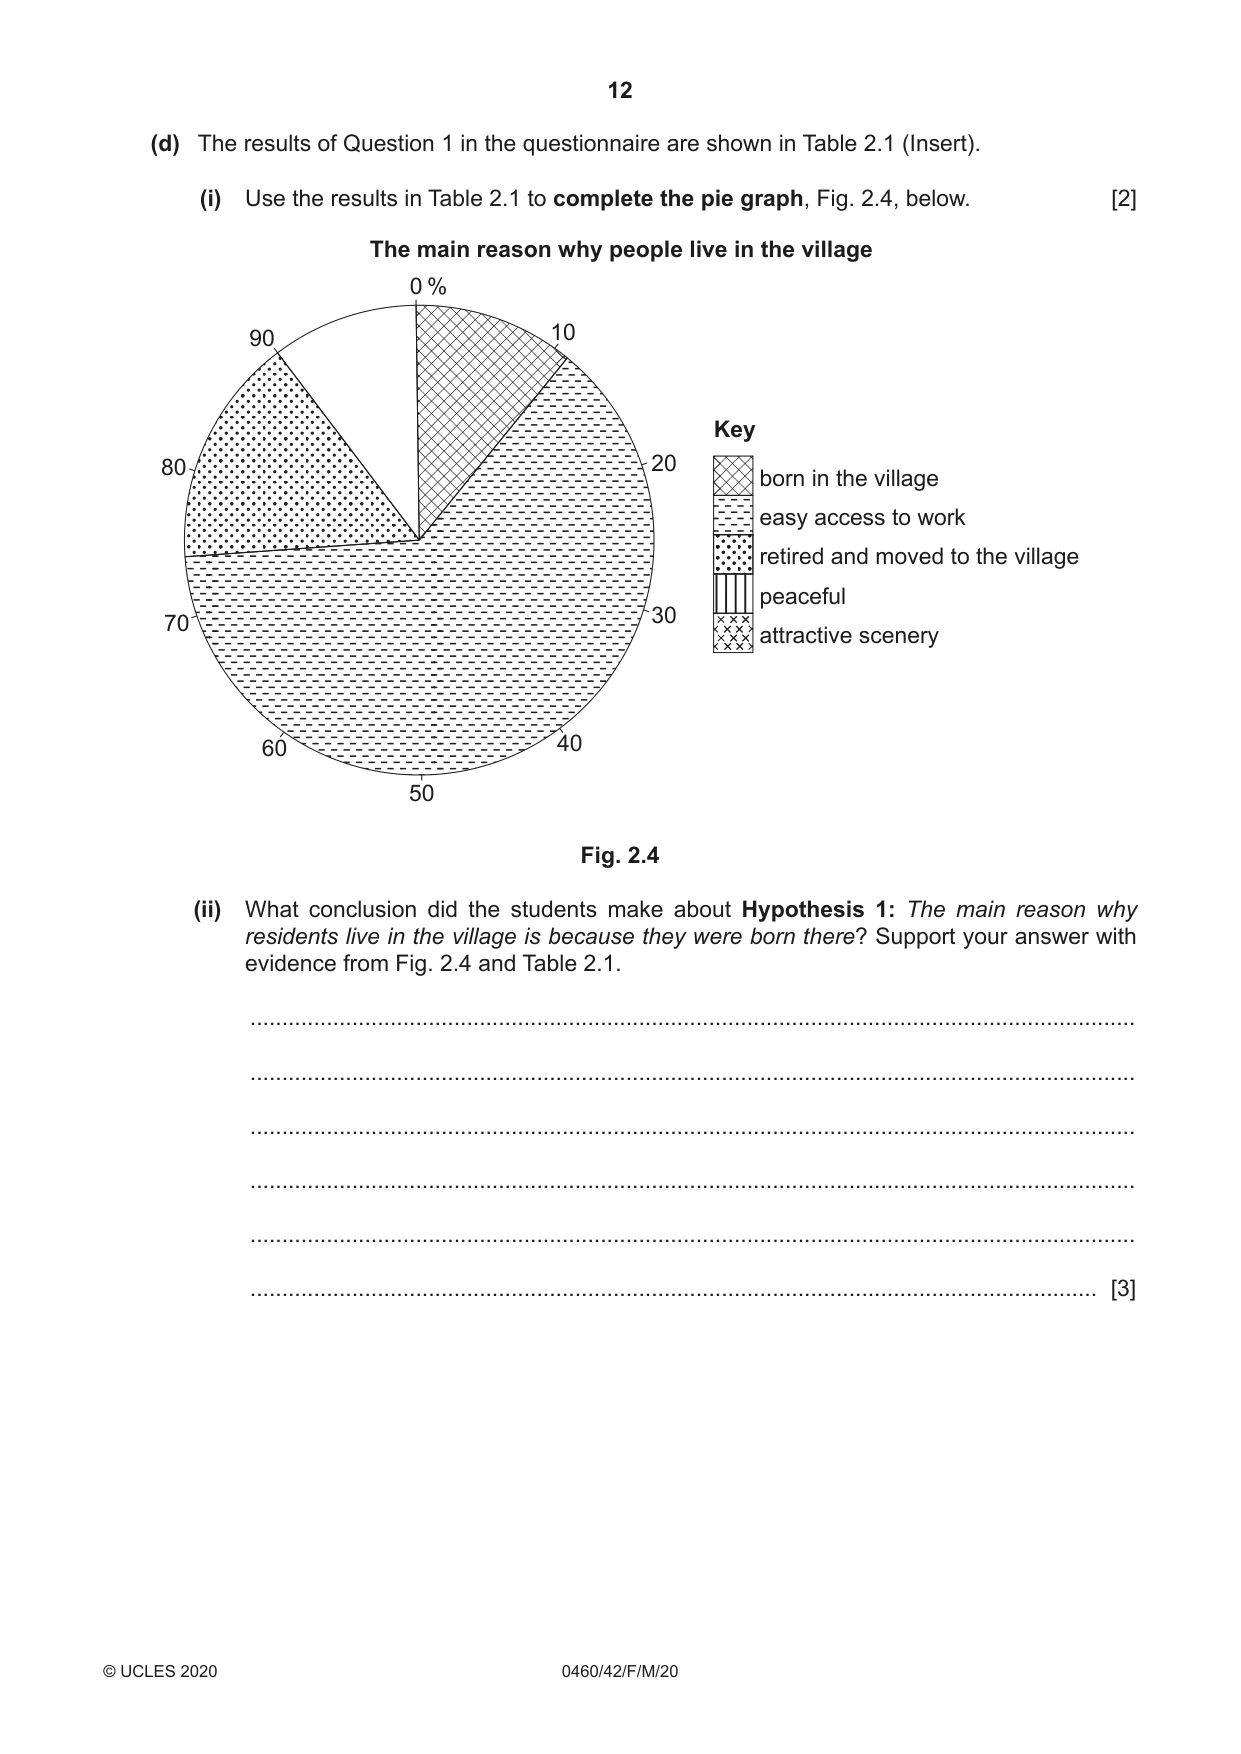
2 Students in the UK were studying a village in the rural–urban fringe. They wanted to find out how the village of Tickton had changed. (a) Which one of the following is the correct definition of rural–urban fringe? Tick (3) your choice. Tick (3) an area of new housing and high technology industry an informal settlement located at the edge of a city a zone where both urban and rural land uses are located a rural area where farming is the main land use the transition zone between the CBD and the inner suburbs [1] (b) The students studied a map which showed how the village had changed up to 2005. They visited the village and drew onto the map new areas of buildings developed since 2005. This map is shown in Fig. 2.1 (Insert). (i) Describe and explain the shape of the original village built before 1960. ........................................................................................................................................... ........................................................................................................................................... ........................................................................................................................................... ..................................................................................................................................... [2] (ii) Describe how the village has changed since 1960. ........................................................................................................................................... ........................................................................................................................................... ........................................................................................................................................... ..................................................................................................................................... [2] (iii) Fig. 2.2 (Insert) is a photograph which the students took in the village. Which location (1–5) in Fig. 2.1 does the photograph show? Circle your choice below and give a reason for your choice. location 1 location 2 location 3 location 4 location 5 Reason for choice ........................................................................................................................................... ........................................................................................................................................... ........................................................................................................................................... ..................................................................................................................................... [2] The students decided to test the following hypotheses: Hypothesis 1: The main reason why residents live in the village is because they were born there. Hypothesis 2: Most employed residents work within 20 km of the village. To conduct their investigation, the students produced a questionnaire to use with a sample of residents in the village. Their questionnaire is shown in Fig. 2.3 (Insert). (c) Name a sampling method that the students could use to select people to answer their questionnaire. Explain why you chose this method. Sampling method ....................................................... Explanation for choice ................................................................................................................................................... ................................................................................................................................................... ................................................................................................................................................... ................................................................................................................................................... ................................................................................................................................................... ............................................................................................................................................. [3] (d) The results of Question 1 in the questionnaire are shown in Table 2.1 (Insert). (i) Use the results in Table 2.1 to complete the pie graph, Fig. 2.4, below. [2] The main reason why people live in the village 0 % 90 10 Key 80 20 born in the village easy access to work retired and moved to the village peaceful 30 70 attractive scenery 60 40 50 Fig. 2.4 (ii) What conclusion did the students make about Hypothesis 1: The main reason why residents live in the village is because they were born there? Support your answer with evidence from Fig. 2.4 and Table 2.1. ........................................................................................................................................... ........................................................................................................................................... ........................................................................................................................................... ........................................................................................................................................... ........................................................................................................................................... ..................................................................................................................................... [3]
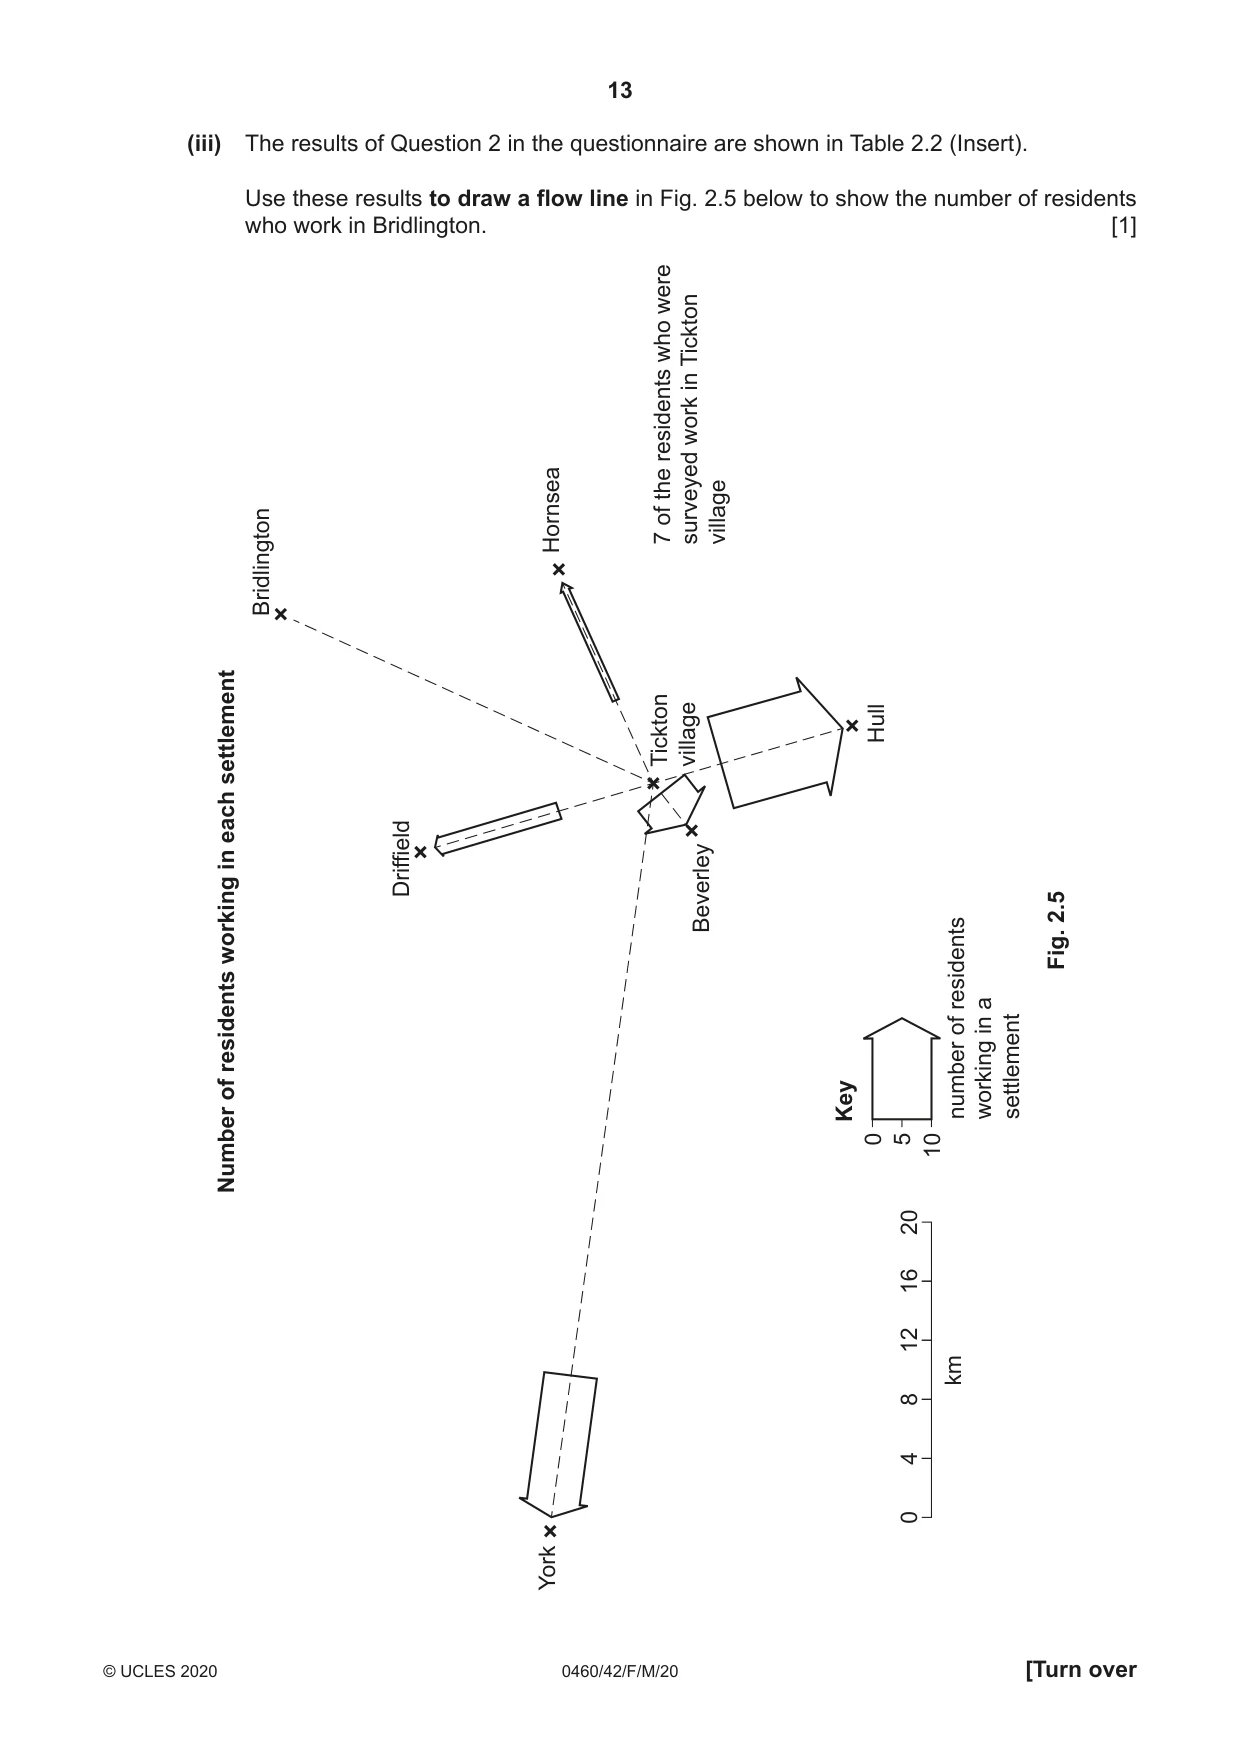
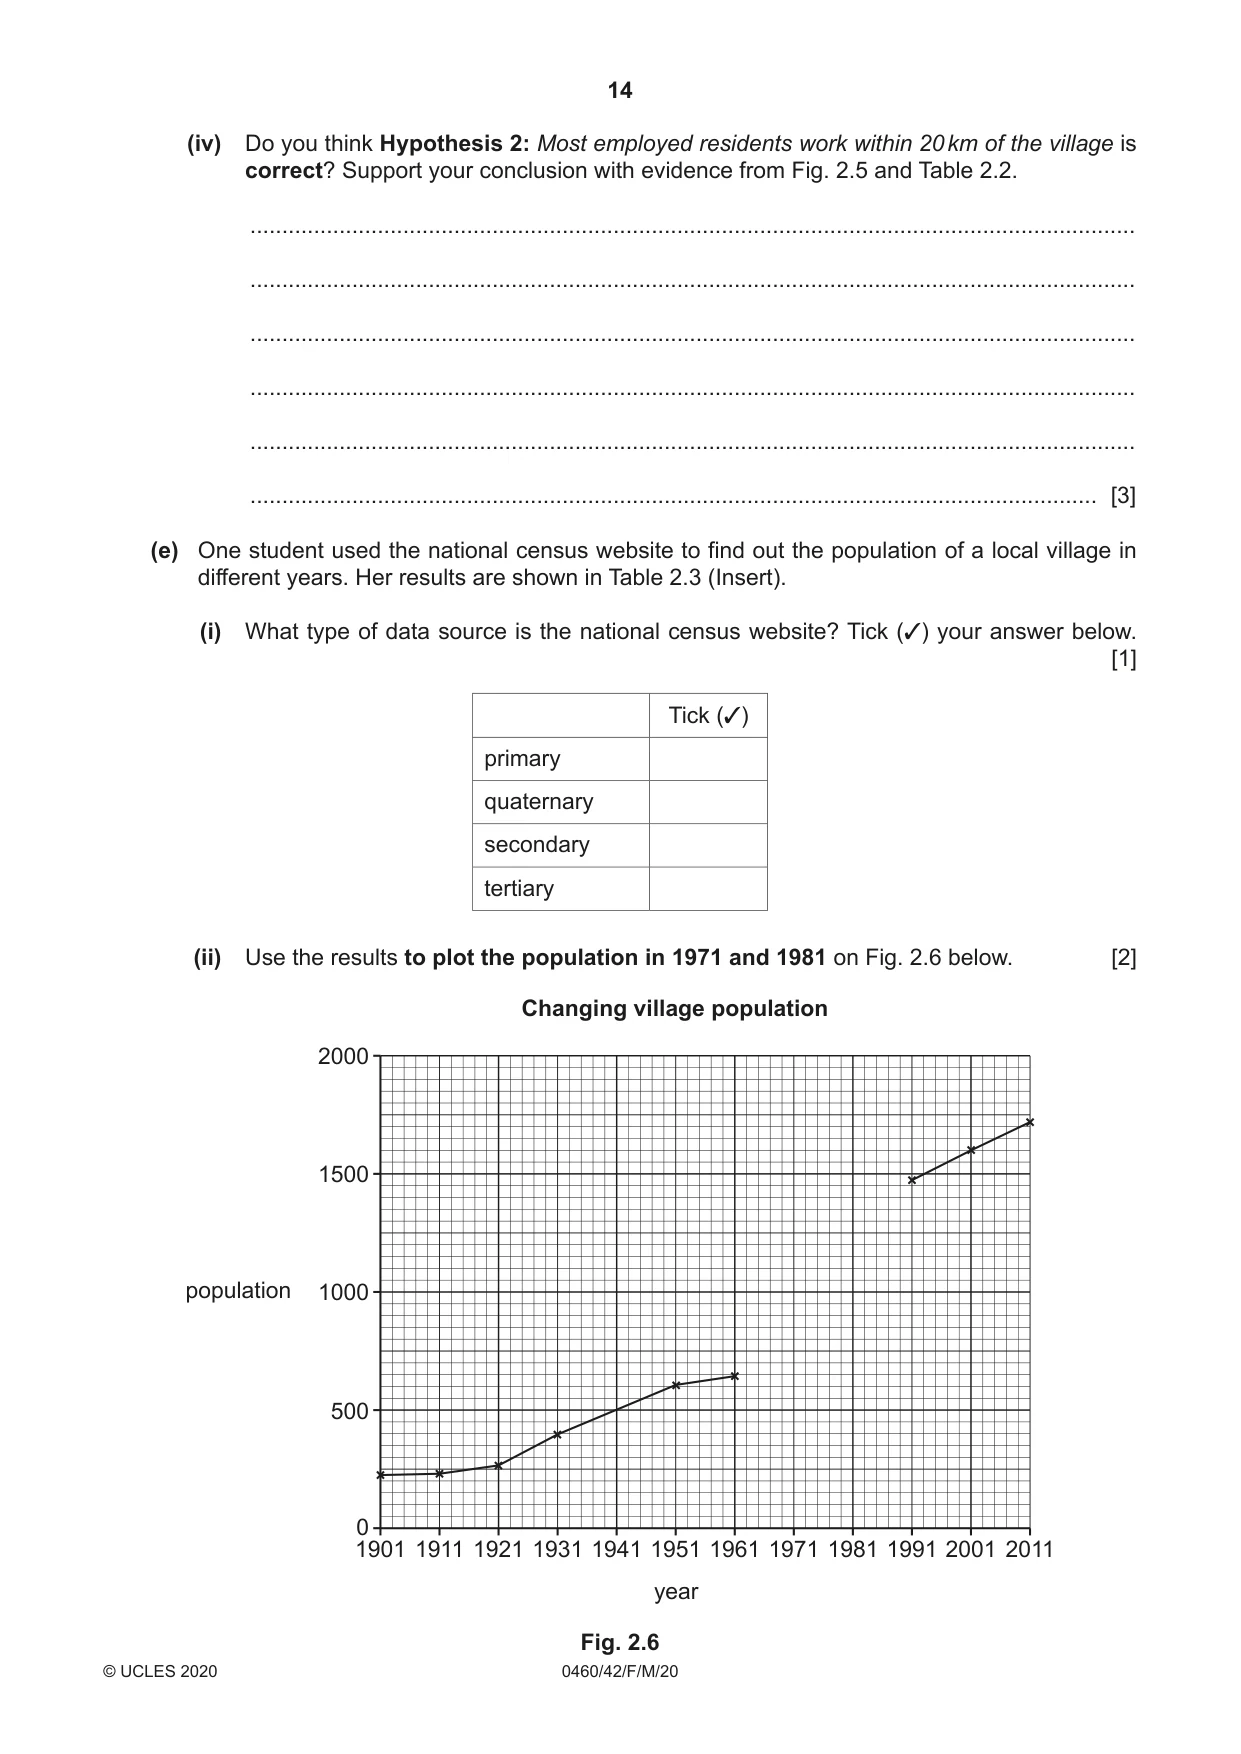
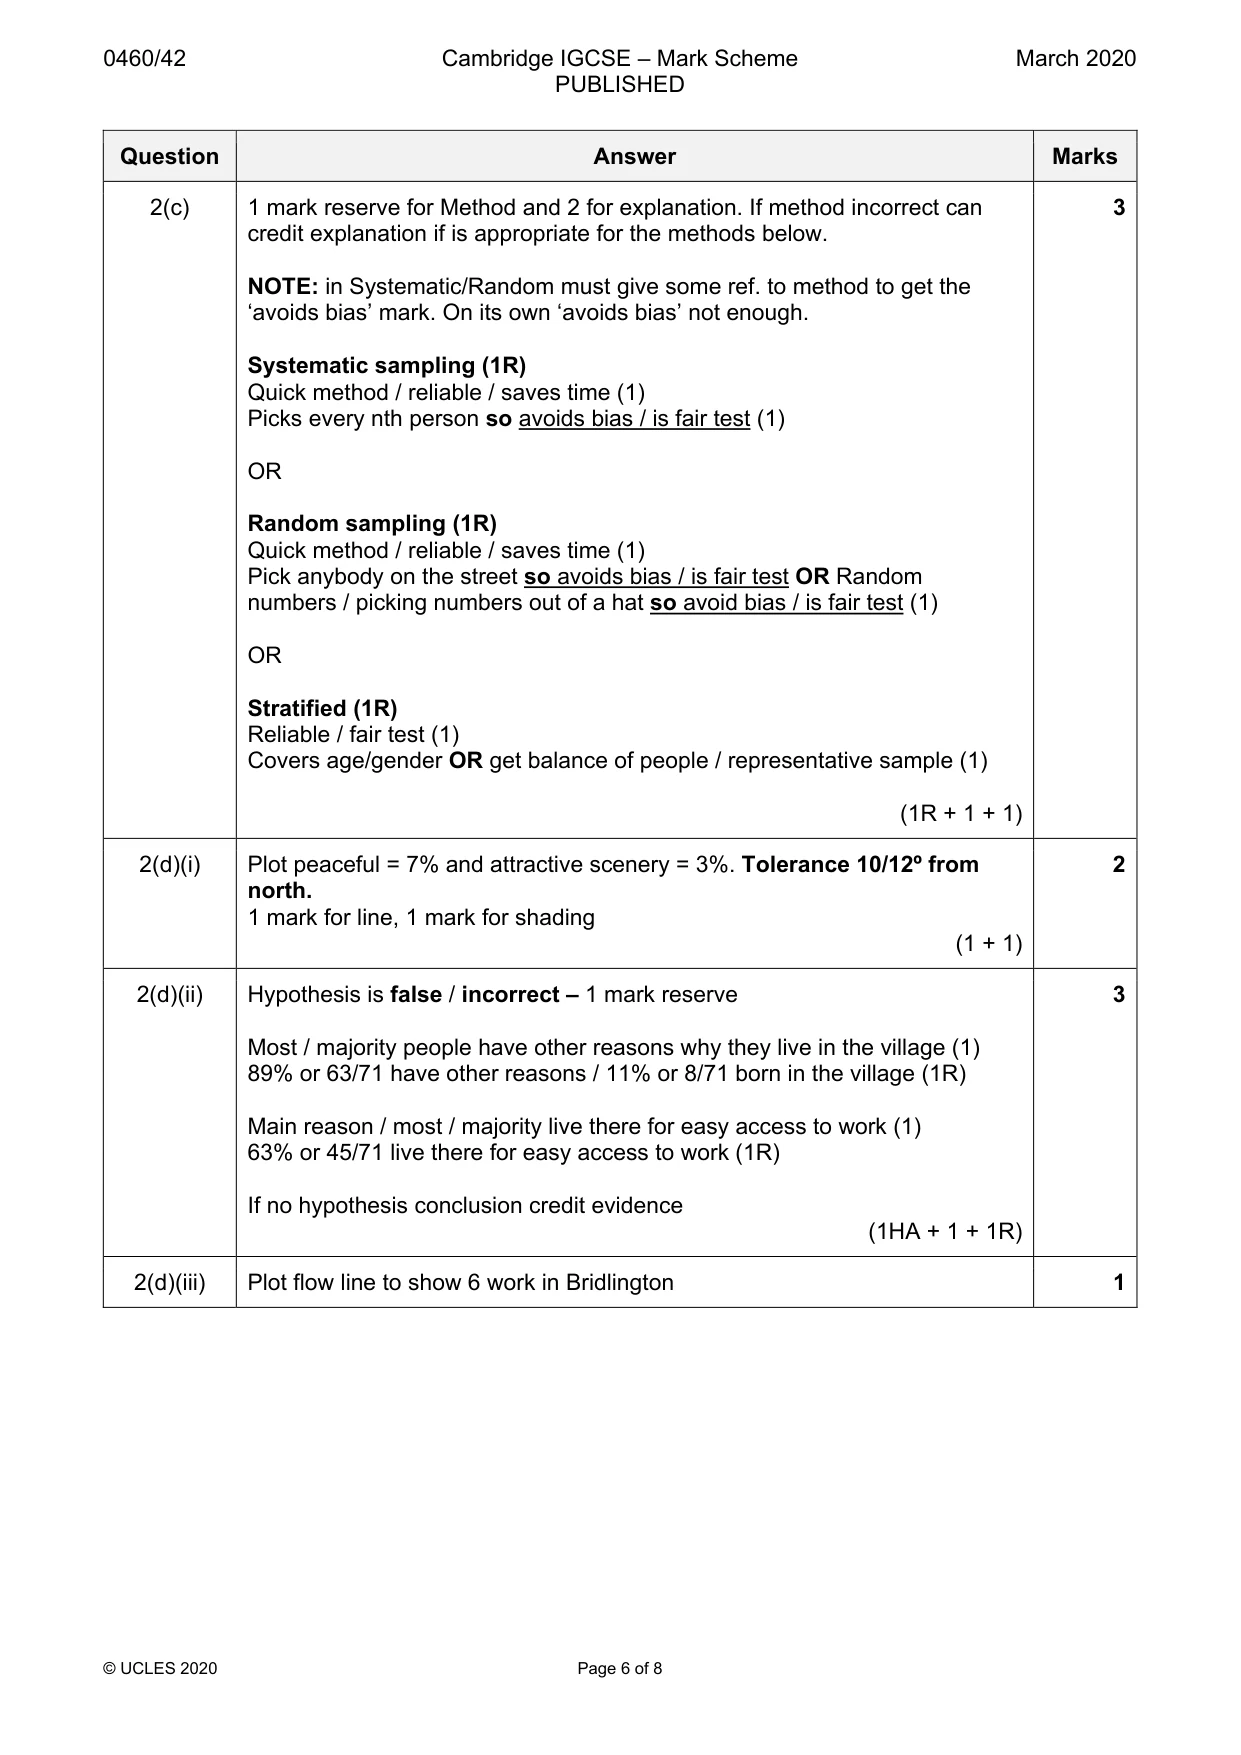
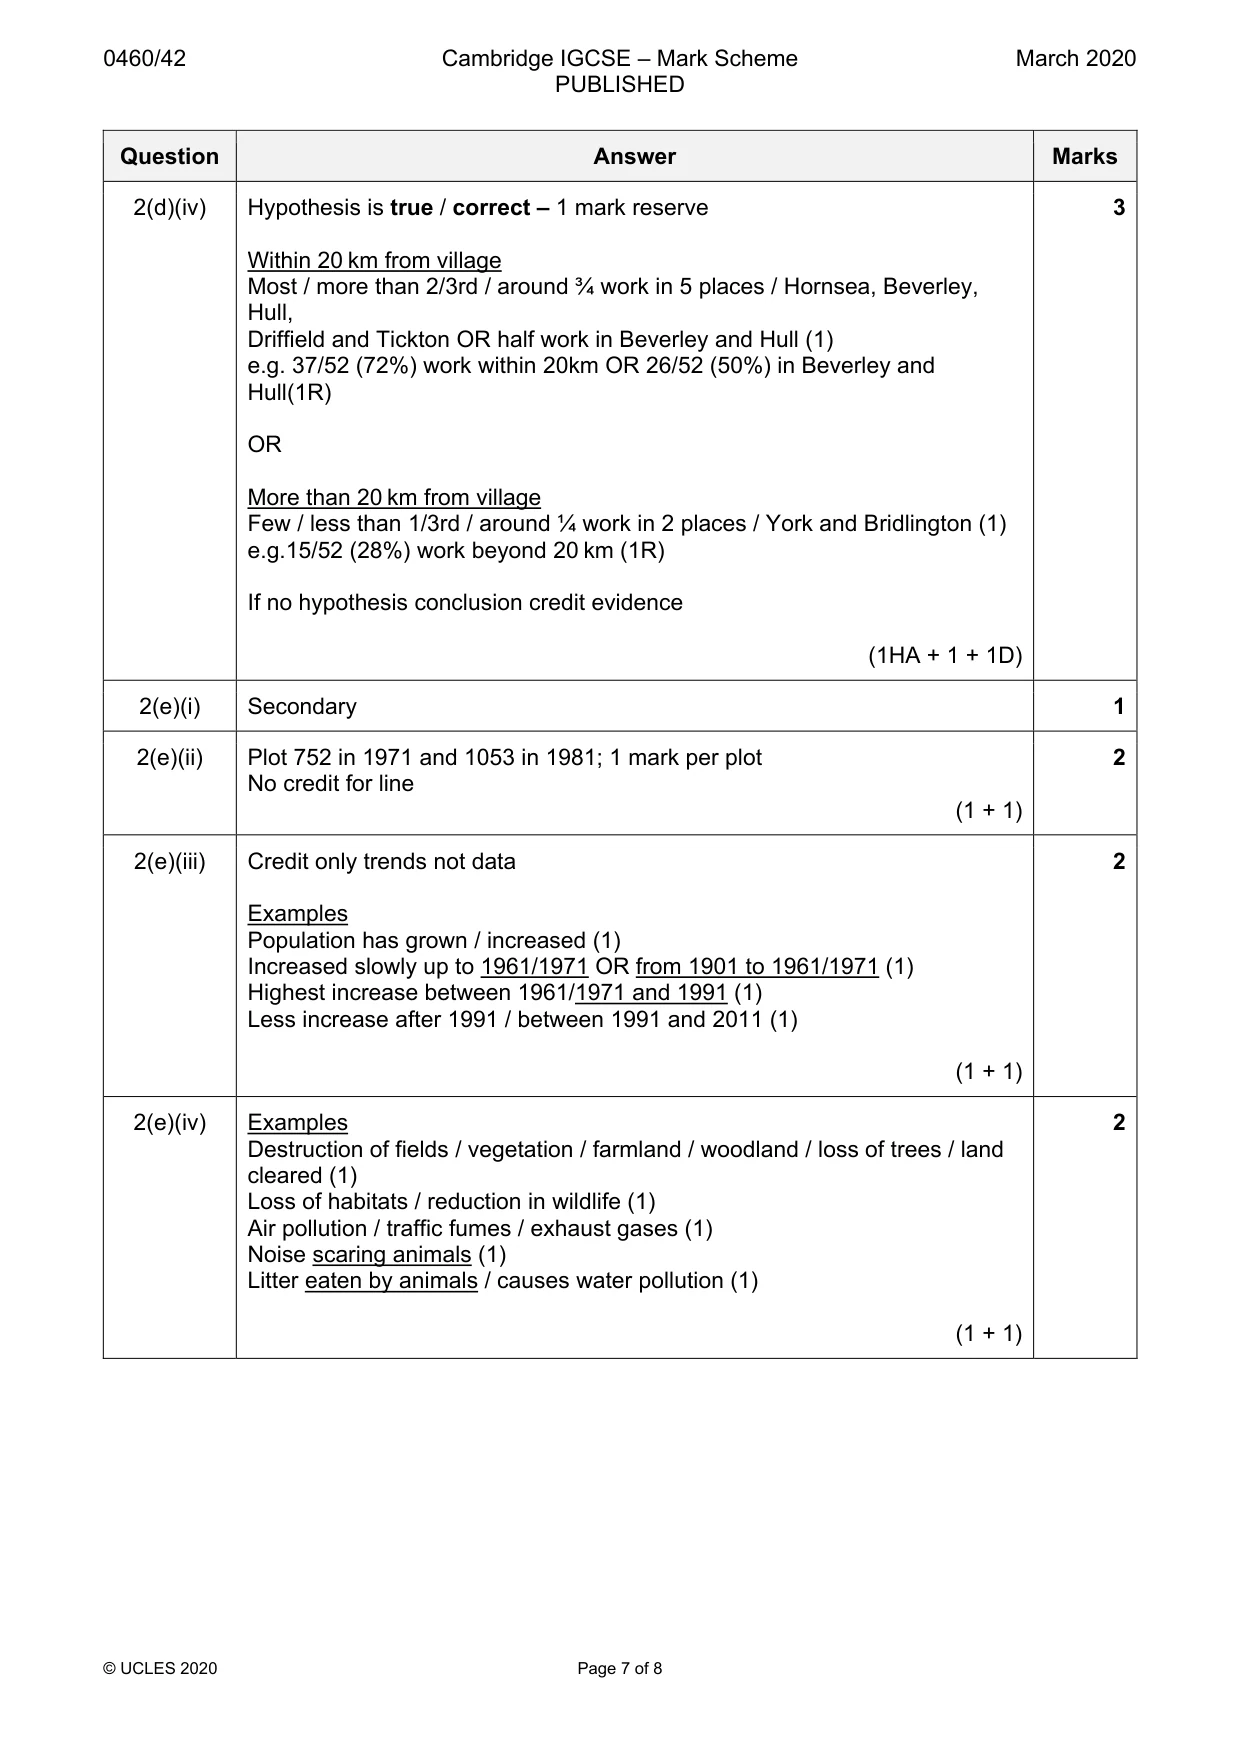
Mark scheme: 2(a) A zone where both rural and urban land uses are located 1 2(b)(i) Examples 2 Original shape is linear (1) In three parts/ groups / discontinuous (1) Built along / around / next to a road / old road (1). Near / next to river (1) (1 + 1) 2(b)(ii) Examples 2 Village has grown / expanded / spread / developed in size (1) On both sides / along / around / away from the old road (1) Between the old road and the by-pass (1) Most expansion between 1960 and 1985 (1) (1 + 1) 2(b)(iii) Credit 1 mark reserve for location and 1 mark for reason. 2 If wrong location is chosen = 0 Location 3 (1R) Shows old houses / built before 1960 (1) Shows linear housing (1) Shows old road through village (1) (1R + 1) 2(c) 1 mark reserve for Method and 2 for explanation. If method incorrect can 3 credit explanation if is appropriate for the methods below. NOTE: in Systematic/Random must give some ref. to method to get the ‘avoids bias’ mark. On its own ‘avoids bias’ not enough. Systematic sampling (1R) Quick method / reliable / saves time (1) Picks every nth person so avoids bias / is fair test (1) OR Random sampling (1R) Quick method / reliable / saves time (1) Pick anybody on the street so avoids bias / is fair test OR Random numbers / picking numbers out of a hat so avoid bias / is fair test (1) OR Stratified (1R) Reliable / fair test (1) Covers age/gender OR get balance of people / representative sample (1) (1R + 1 + 1) 2(d)(i) Plot peaceful = 7% and attractive scenery = 3%. Tolerance 10/12º from 2 north. 1 mark for line, 1 mark for shading (1 + 1) 2(d)(ii) Hypothesis is false / incorrect – 1 mark reserve 3 Most / majority people have other reasons why they live in the village (1) 89% or 63/71 have other reasons / 11% or 8/71 born in the village (1R) Main reason / most / majority live there for easy access to work (1) 63% or 45/71 live there for easy access to work (1R) If no hypothesis conclusion credit evidence (1HA + 1 + 1R) 2(d)(iii) Plot flow line to show 6 work in Bridlington 1 2(d)(iv) Hypothesis is true / correct – 1 mark reserve 3 Within 20 km from village Most / more than 2/3rd / around ¾ work in 5 places / Hornsea, Beverley, Hull, Driffield and Tickton OR half work in Beverley and Hull (1) e.g. 37/52 (72%) work within 20km OR 26/52 (50%) in Beverley and Hull(1R) OR More than 20 km from village Few / less than 1/3rd / around ¼ work in 2 places / York and Bridlington (1) e.g.15/52 (28%) work beyond 20 km (1R) If no hypothesis conclusion credit evidence (1HA + 1 + 1D) 2(e)(i) Secondary 1 2(e)(ii) Plot 752 in 1971 and 1053 in 1981; 1 mark per plot 2 No credit for line (1 + 1) 2(e)(iii) Credit only trends not data 2 Examples Population has grown / increased (1) Increased slowly up to 1961/1971 OR from 1901 to 1961/1971 (1) Highest increase between 1961/1971 and 1991 (1) Less increase after 1991 / between 1991 and 2011 (1) (1 + 1) 2(e)(iv) Examples 2 Destruction of fields / vegetation / farmland / woodland / loss of trees / land cleared (1) Loss of habitats / reduction in wildlife (1) Air pollution / traffic fumes / exhaust gases (1) Noise scaring animals (1) Litter eaten by animals / causes water pollution (1) (1 + 1) 2(f) Generic answers. 4 Devise a hypothesis or example of hypothesis (1) Carry out a pilot survey (1) Count / tally number or type of shops and services (1) Then One Method only such as: Get a map / draw a sketch map of village (1) Take photographs (1) Plot / mark / note down / on map shops and services (1) Make sure cover all village (1) Identifying / classify different types / order of shops and services (1) OR Questionnaire / interview / survey / ask people (1) Decide where OR when to do Q (1) Example of Q e.g., which shops using / where from / how often (1 MAX for question) Explain purpose / be polite (1) Ask a cross-section of people in village (1) (4 × 1)
More questions on Settlements (rural and urban) and service provision
What was in this paper
The subtopics covered by these 2 questions, and how many questions each got. Open one in a new tab to see every Cambridge question on it.
What you needed in this session
Cambridge’s own grade thresholds for 2020 Feb/March, Paper 4 · Variant 2. A higher threshold means an easier paper — the bar moves with how the cohort did.