Cambridge IGCSE Geography 0460 — 2019 Feb/March Paper 4 · Variant 2
0460/42/F/M/19 · 2 questions · 60 marks · ≈68 min
The question paper and its mark scheme, free to read here and free to download. This is Cambridge’s own paper, exactly as it was sat.
Question paper20 pages
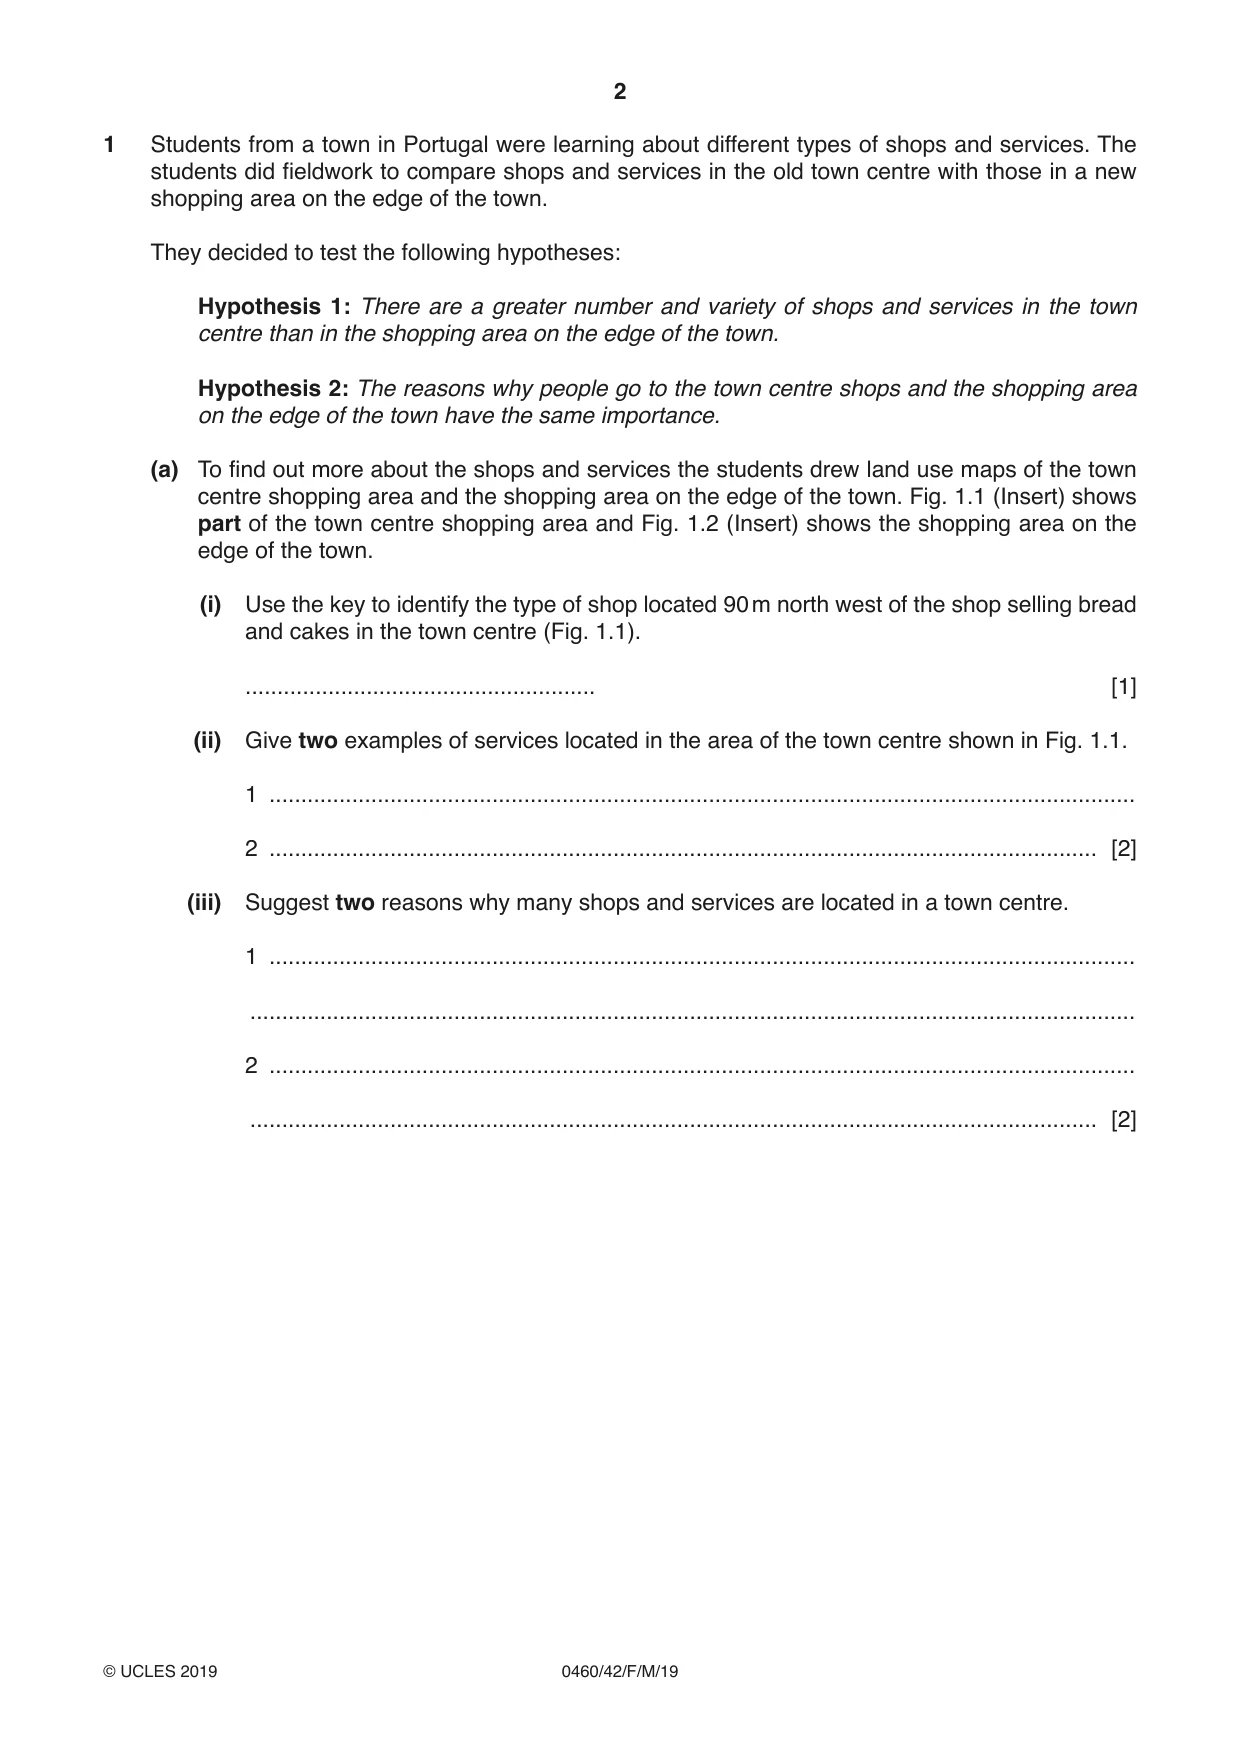
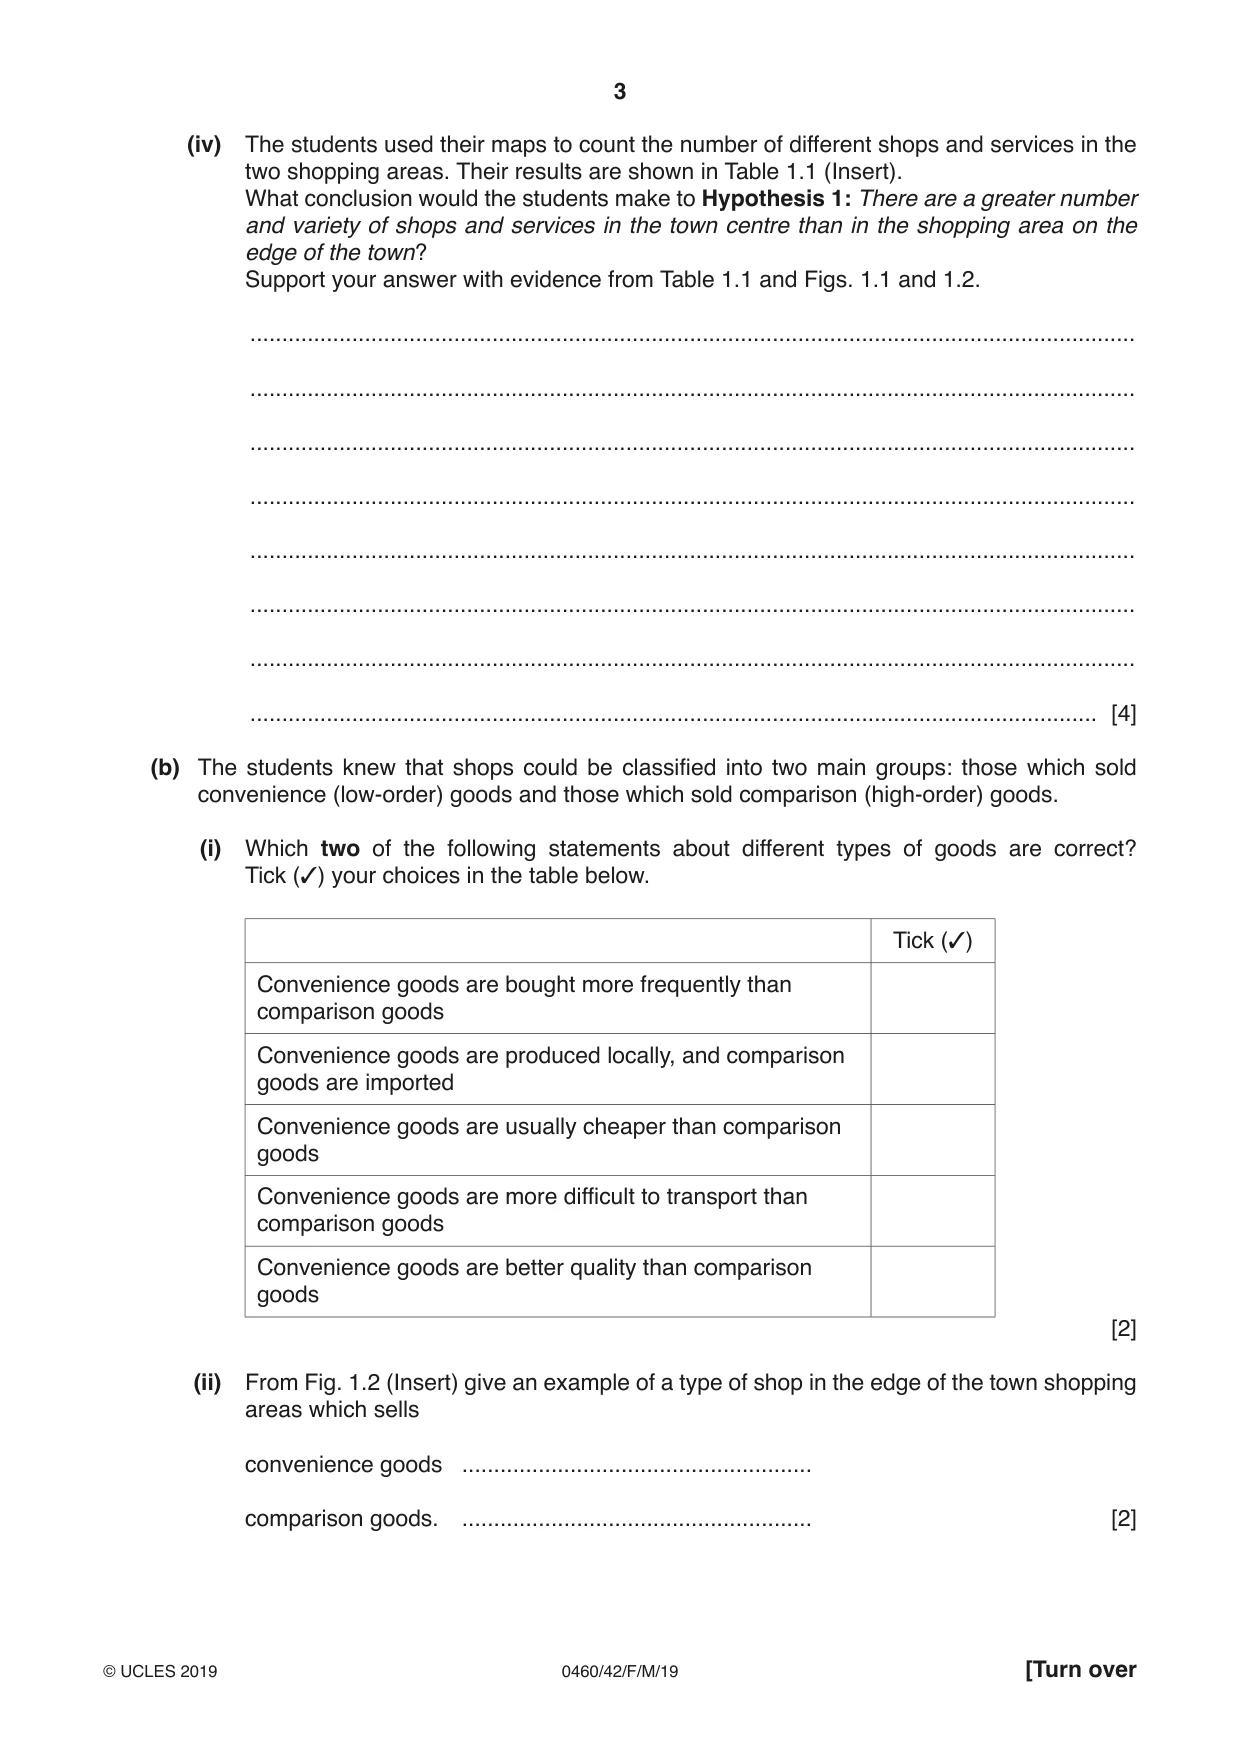






Mark scheme8 pages
Answers below. Sit the paper first if you are practising.
Questions as text
Q1 · Students from a town in Portugal were learning about different types of shops and services
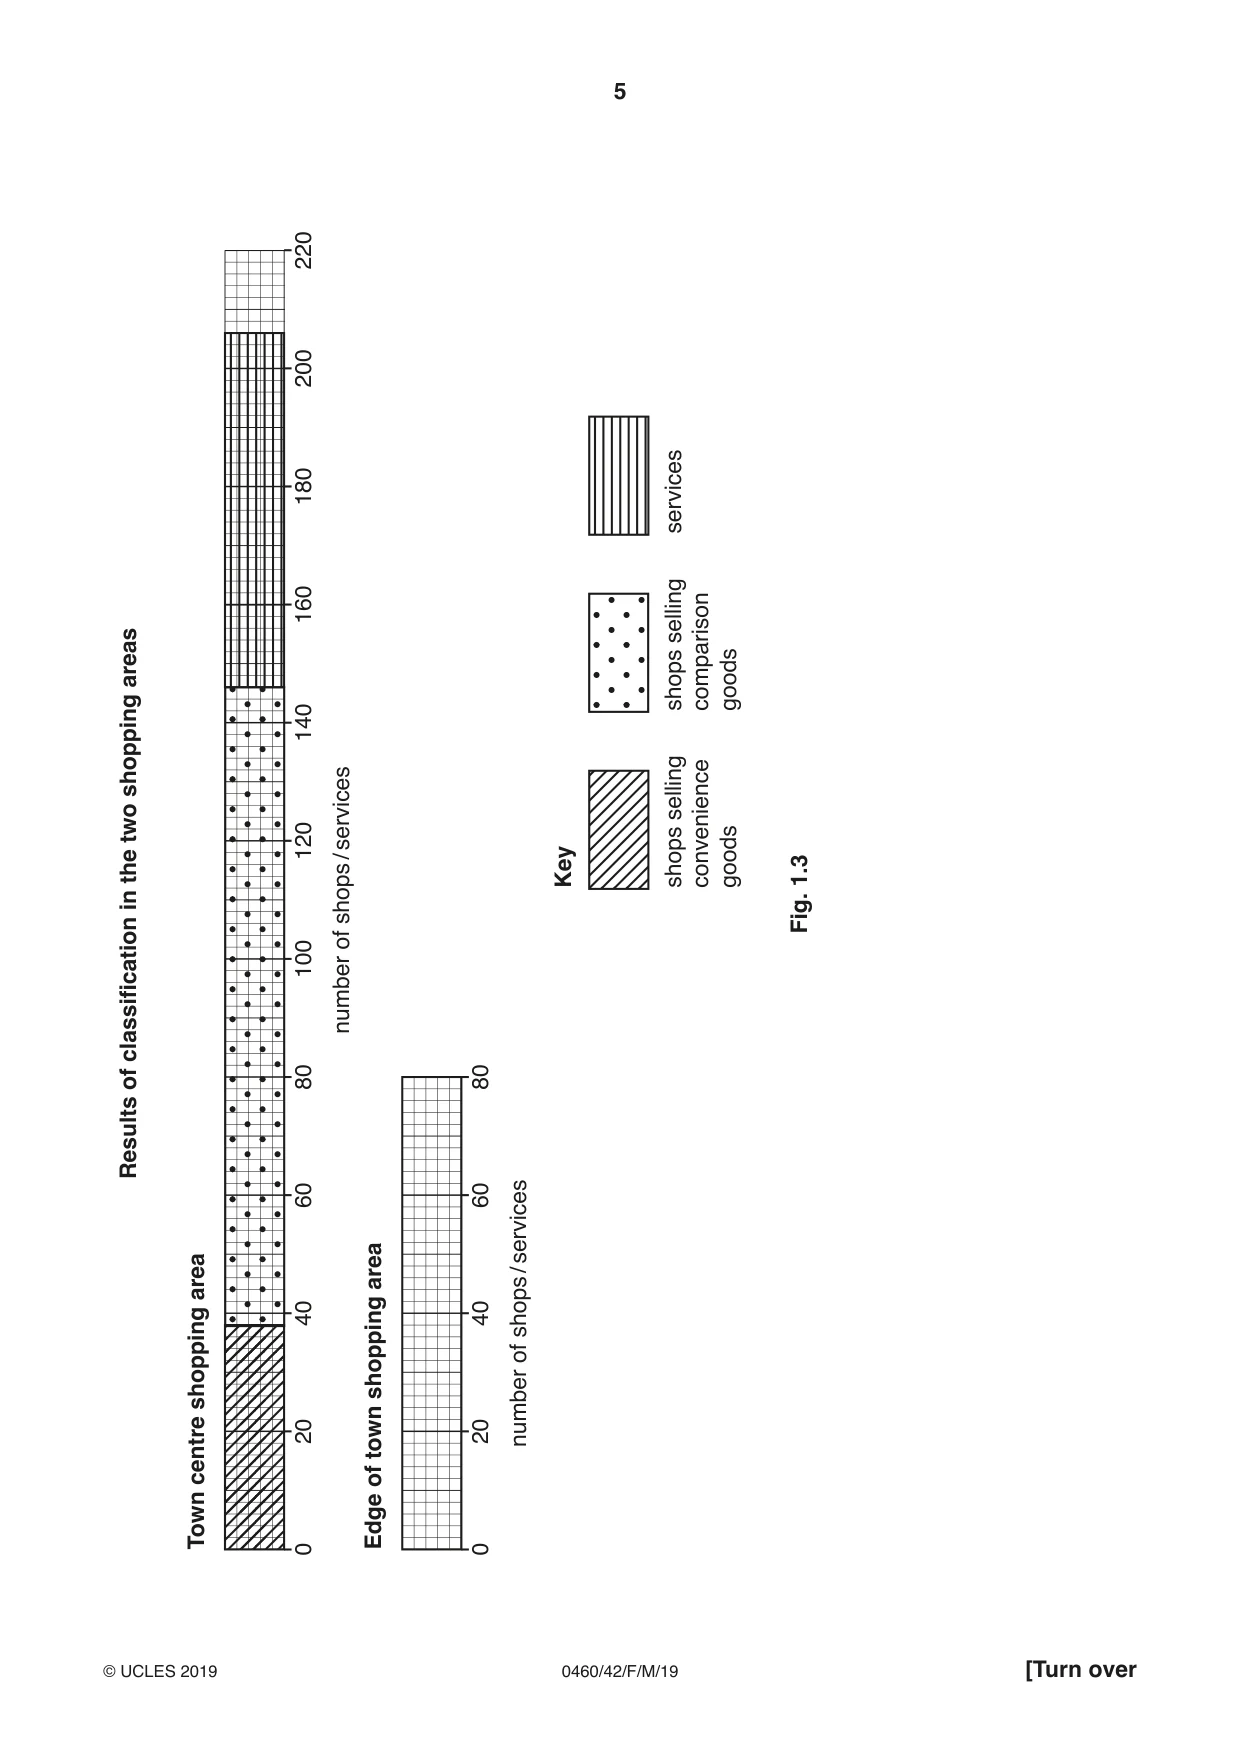
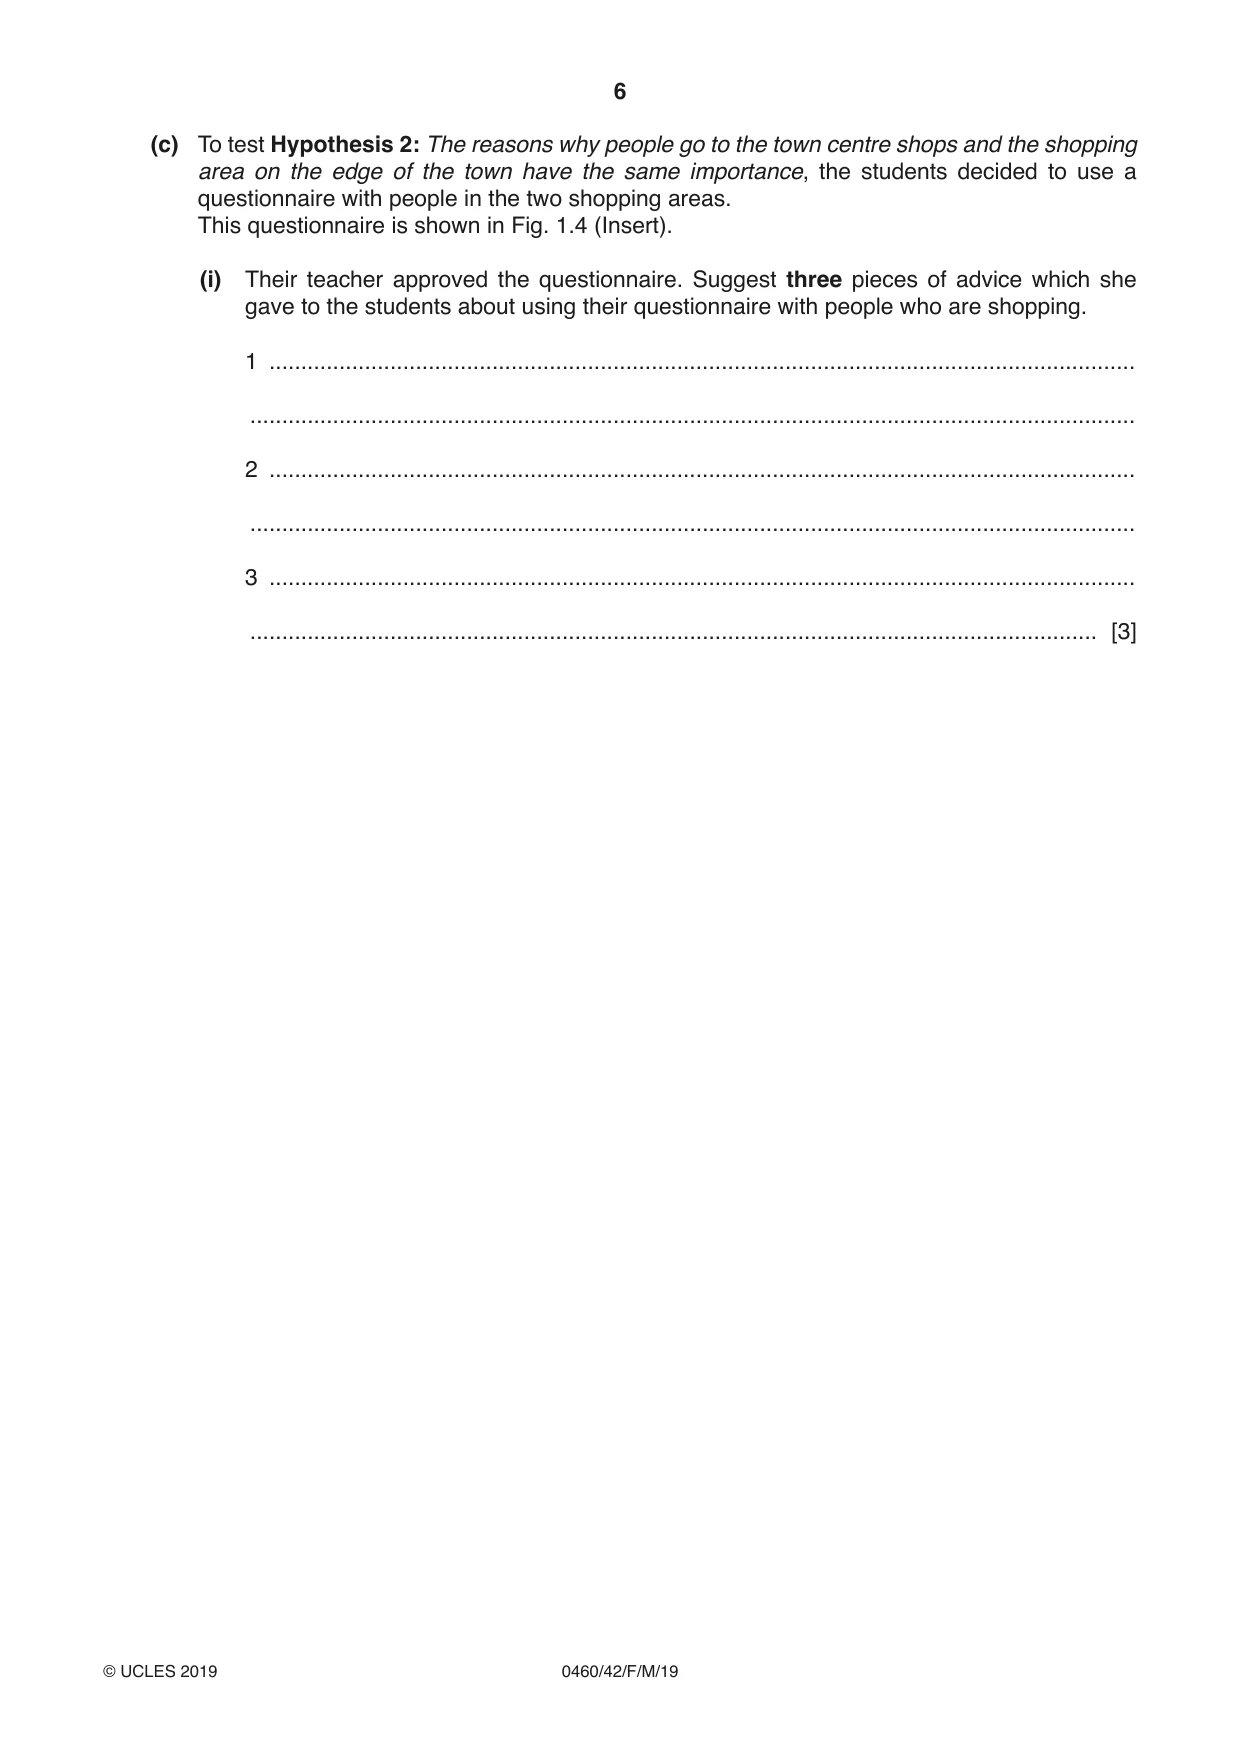
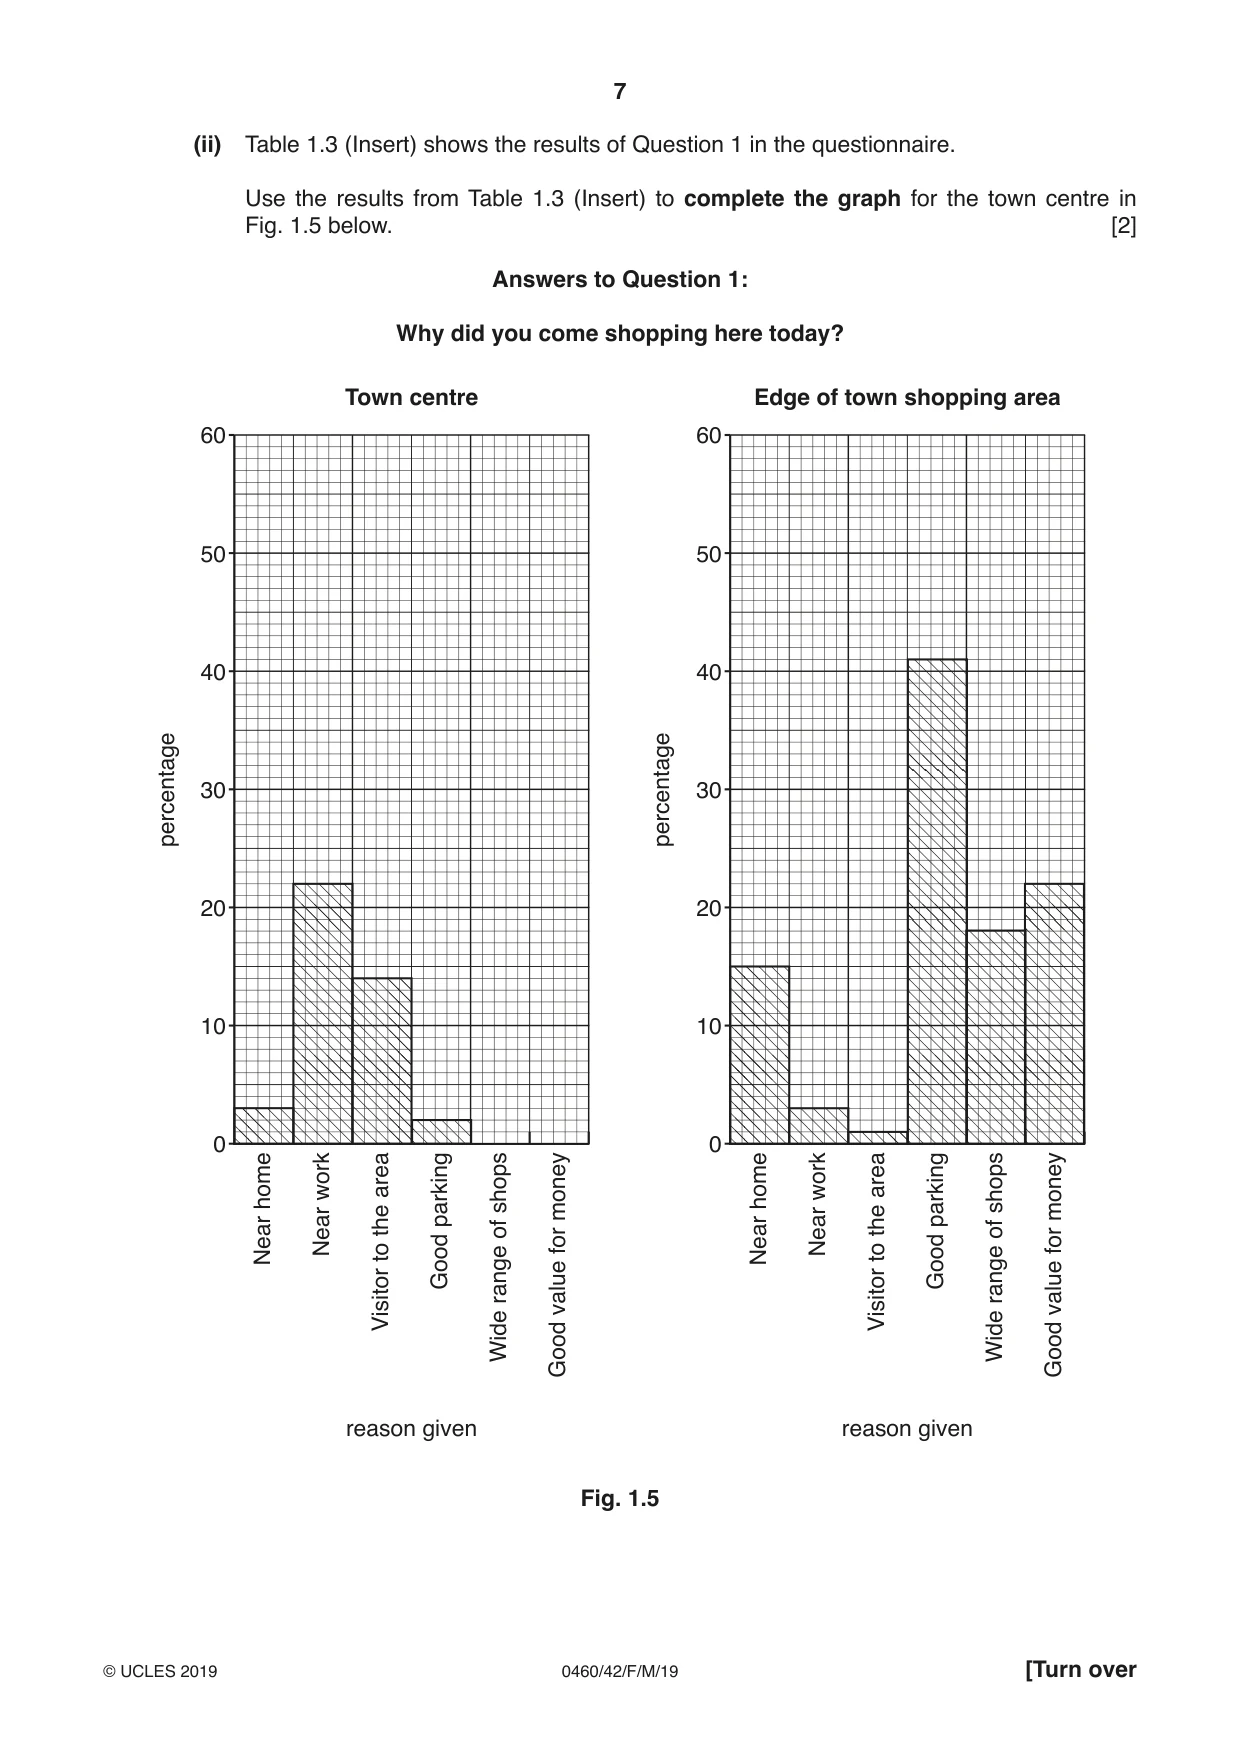
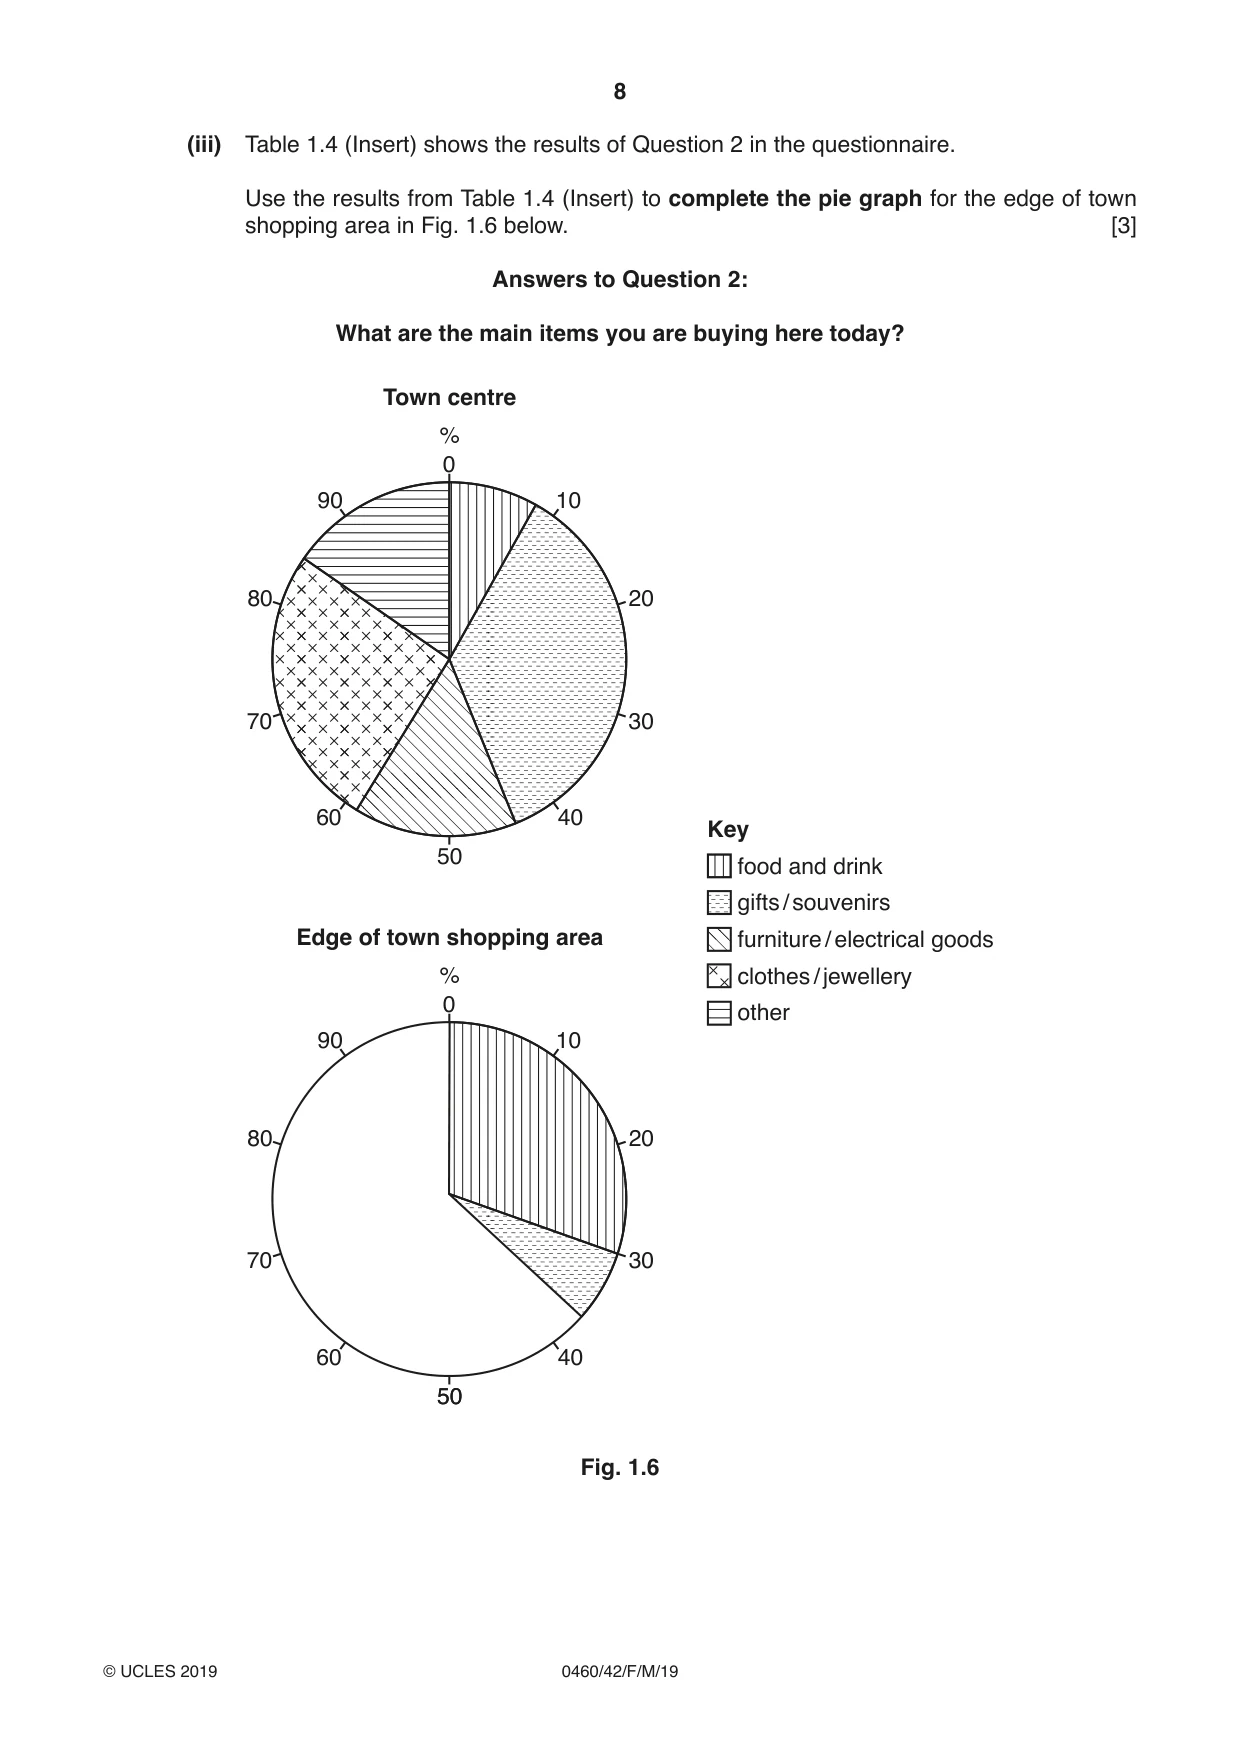
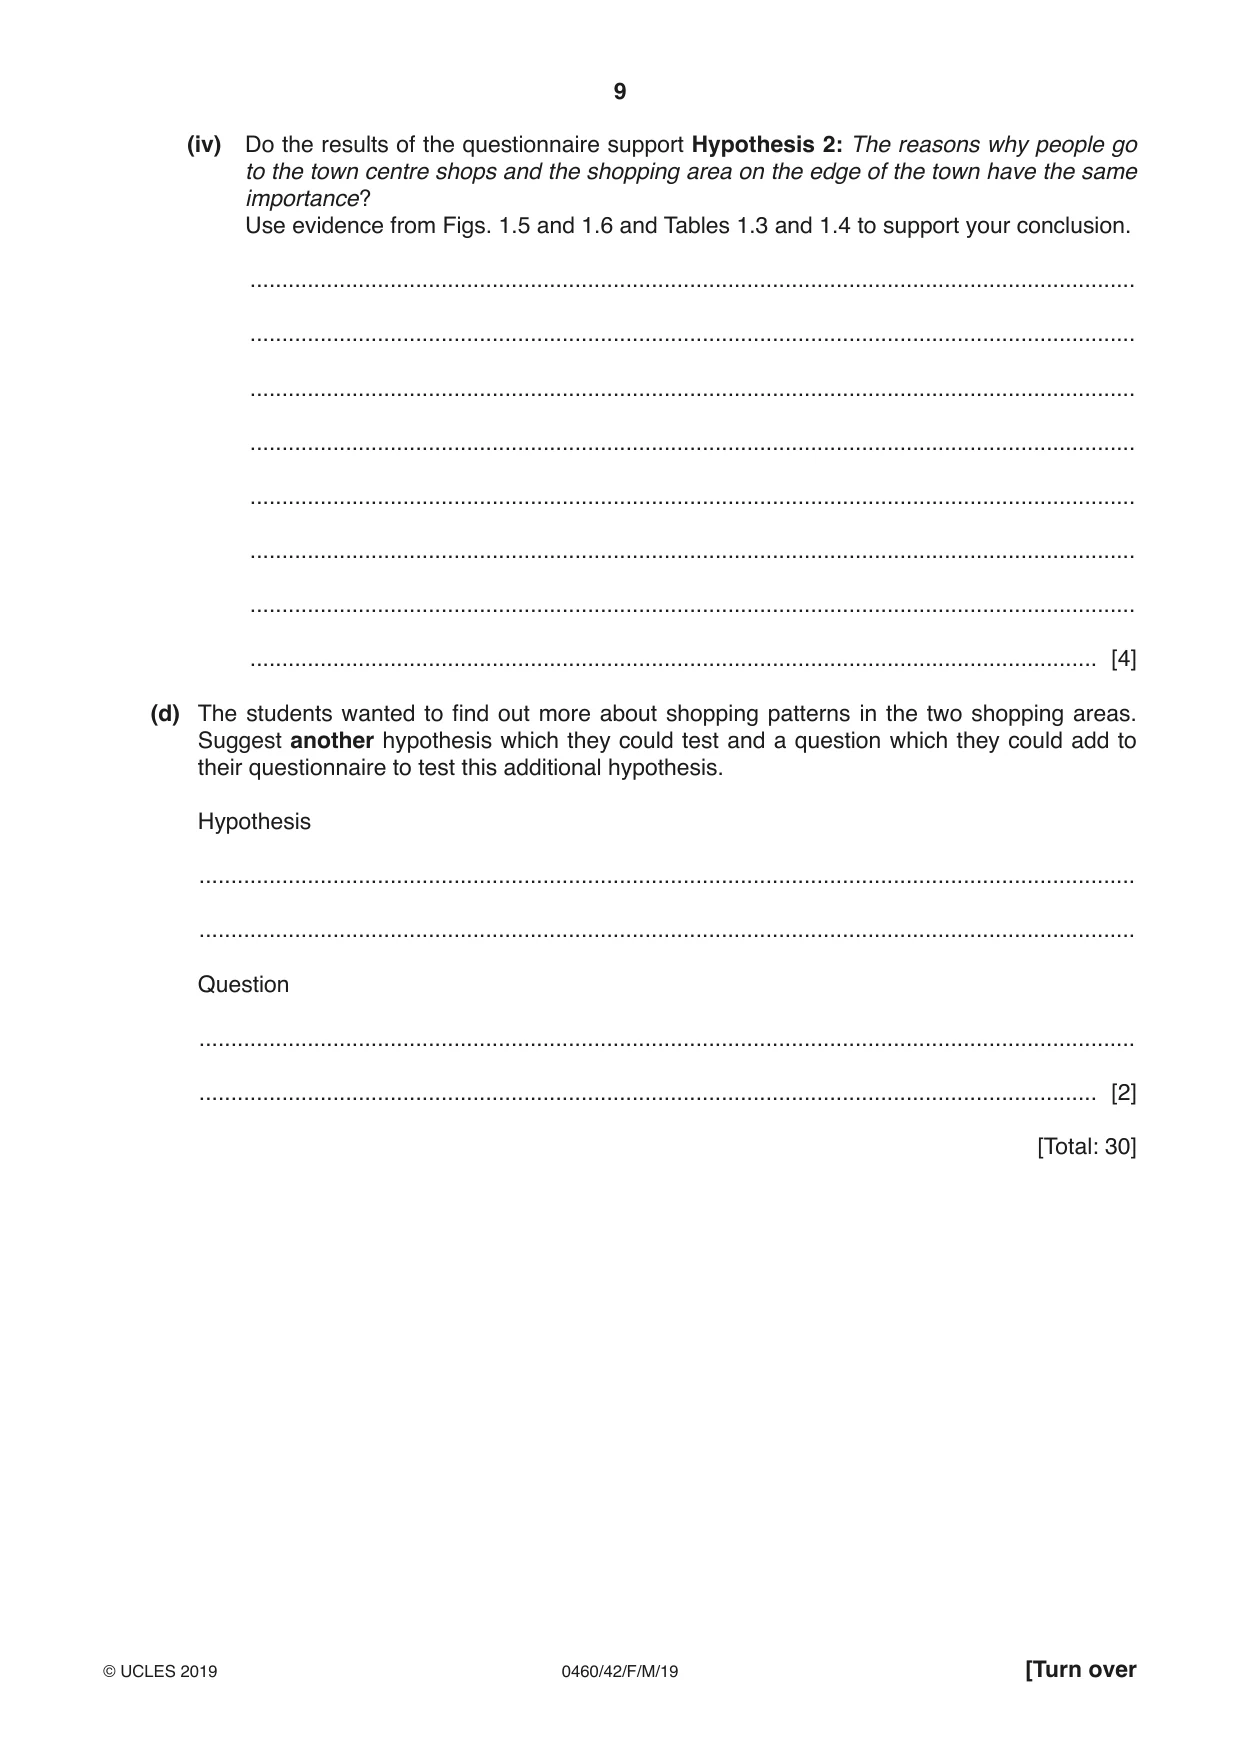
1 Students from a town in Portugal were learning about different types of shops and services. The students did fieldwork to compare shops and services in the old town centre with those in a new shopping area on the edge of the town. They decided to test the following hypotheses: Hypothesis 1: There are a greater number and variety of shops and services in the town centre than in the shopping area on the edge of the town. Hypothesis 2: The reasons why people go to the town centre shops and the shopping area on the edge of the town have the same importance. (a) To find out more about the shops and services the students drew land use maps of the town centre shopping area and the shopping area on the edge of the town. Fig. 1.1 (Insert) shows part of the town centre shopping area and Fig. 1.2 (Insert) shows the shopping area on the edge of the town. (i) Use the key to identify the type of shop located 90 m north west of the shop selling bread and cakes in the town centre (Fig. 1.1). ....................................................... [1] (ii) Give two examples of services located in the area of the town centre shown in Fig. 1.1. 1 ........................................................................................................................................ 2 .................................................................................................................................. [2] (iii) Suggest two reasons why many shops and services are located in a town centre. 1 ........................................................................................................................................ ........................................................................................................................................... 2 ........................................................................................................................................ ..................................................................................................................................... [2] (iv) The students used their maps to count the number of different shops and services in the two shopping areas. Their results are shown in Table 1.1 (Insert). What conclusion would the students make to Hypothesis 1: There are a greater number and variety of shops and services in the town centre than in the shopping area on the edge of the town? Support your answer with evidence from Table 1.1 and Figs. 1.1 and 1.2. ........................................................................................................................................... ........................................................................................................................................... ........................................................................................................................................... ........................................................................................................................................... ........................................................................................................................................... ........................................................................................................................................... ........................................................................................................................................... ..................................................................................................................................... [4] (b) The students knew that shops could be classified into two main groups: those which sold convenience (low-order) goods and those which sold comparison (high-order) goods. (i) Which two of the following statements about different types of goods are correct? Tick (✓) your choices in the table below. Tick (✓) Convenience goods are bought more frequently than comparison goods Convenience goods are produced locally, and comparison goods are imported Convenience goods are usually cheaper than comparison goods Convenience goods are more difficult to transport than comparison goods Convenience goods are better quality than comparison goods [2] (ii) From Fig. 1.2 (Insert) give an example of a type of shop in the edge of the town shopping areas which sells convenience goods ....................................................... comparison goods. ....................................................... [2] (iii) The students classified the shops and services in the two shopping areas. Their classification results are shown in Table 1.2 (Insert). Use the results from Table 1.2 to draw the graph for the edge of town shopping area in Fig. 1.3 on the page opposite. [3] 220 200 180 services 160 selling shopscomparisongoods 140 selling services120 / Key shopsconveniencegoods 1.3 shops Fig. of 100 number 80 80 60 60 services / area 40 40 shops of shopping 20 20 number town of 0 Edge 0 (c) To test Hypothesis 2: The reasons why people go to the town centre shops and the shopping area on the edge of the town have the same importance, the students decided to use a questionnaire with people in the two shopping areas. This questionnaire is shown in Fig. 1.4 (Insert). (i) Their teacher approved the questionnaire. Suggest three pieces of advice which she gave to the students about using their questionnaire with people who are shopping. 1 ........................................................................................................................................ ........................................................................................................................................... 2 ........................................................................................................................................ ........................................................................................................................................... 3 ........................................................................................................................................ ..................................................................................................................................... [3] (ii) Table 1.3 (Insert) shows the results of Question 1 in the questionnaire. Use the results from Table 1.3 (Insert) to complete the graph for the town centre in Fig. 1.5 below. [2] Answers to Question 1: Why did you come shopping here today? Town centre Edge of town shopping area 60 60 50 50 40 40 30 30percentage percentage 20 20 10 10 0 0 home work area parking shops money home work area parking shops money the of the of for for Near to Near to Near Near Good Good range range value value Visitor Visitor Wide Wide Good Good reason given reason given Fig. 1.5 (iii) Table 1.4 (Insert) shows the results of Question 2 in the questionnaire. Use the results from Table 1.4 (Insert) to complete the pie graph for the edge of town shopping area in Fig. 1.6 below. [3] Answers to Question 2: What are the main items you are buying here today? Town centre % 0 90 10 80 20 70 30 60 40 Key 50 food and drink gifts / souvenirs Edge of town shopping area furniture / electrical goods % clothes / jewellery 0 other 90 10 80 20 70 30 60 40 5050 Fig. 1.6 (iv) Do the results of the questionnaire support Hypothesis 2: The reasons why people go to the town centre shops and the shopping area on the edge of the town have the same importance? Use evidence from Figs. 1.5 and 1.6 and Tables 1.3 and 1.4 to support your conclusion. ........................................................................................................................................... ........................................................................................................................................... ........................................................................................................................................... ........................................................................................................................................... ........................................................................................................................................... ........................................................................................................................................... ........................................................................................................................................... ..................................................................................................................................... [4] (d) The students wanted to find out more about shopping patterns in the two shopping areas. Suggest another hypothesis which they could test and a question which they could add to their questionnaire to test this additional hypothesis. Hypothesis ................................................................................................................................................... ................................................................................................................................................... Question ................................................................................................................................................... ............................................................................................................................................. [2] [Total: 30]
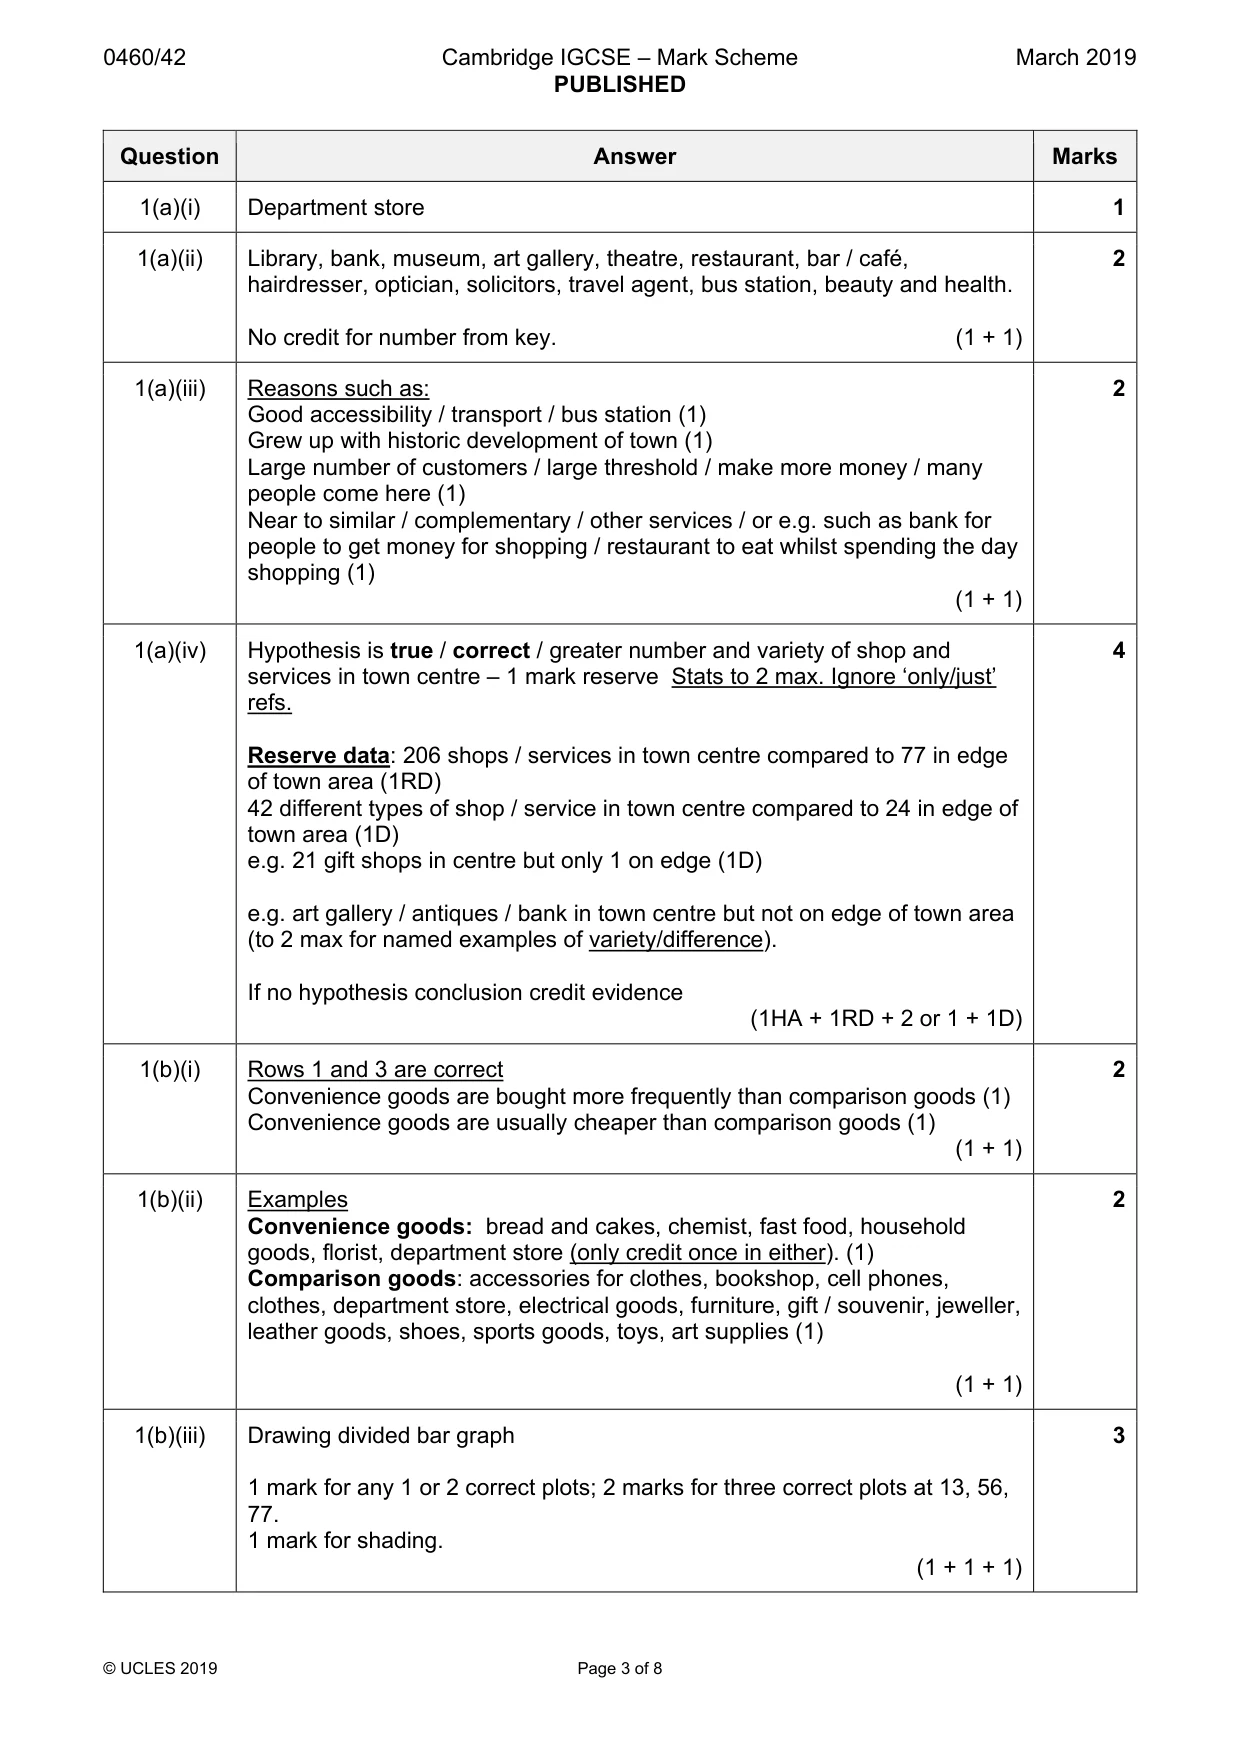
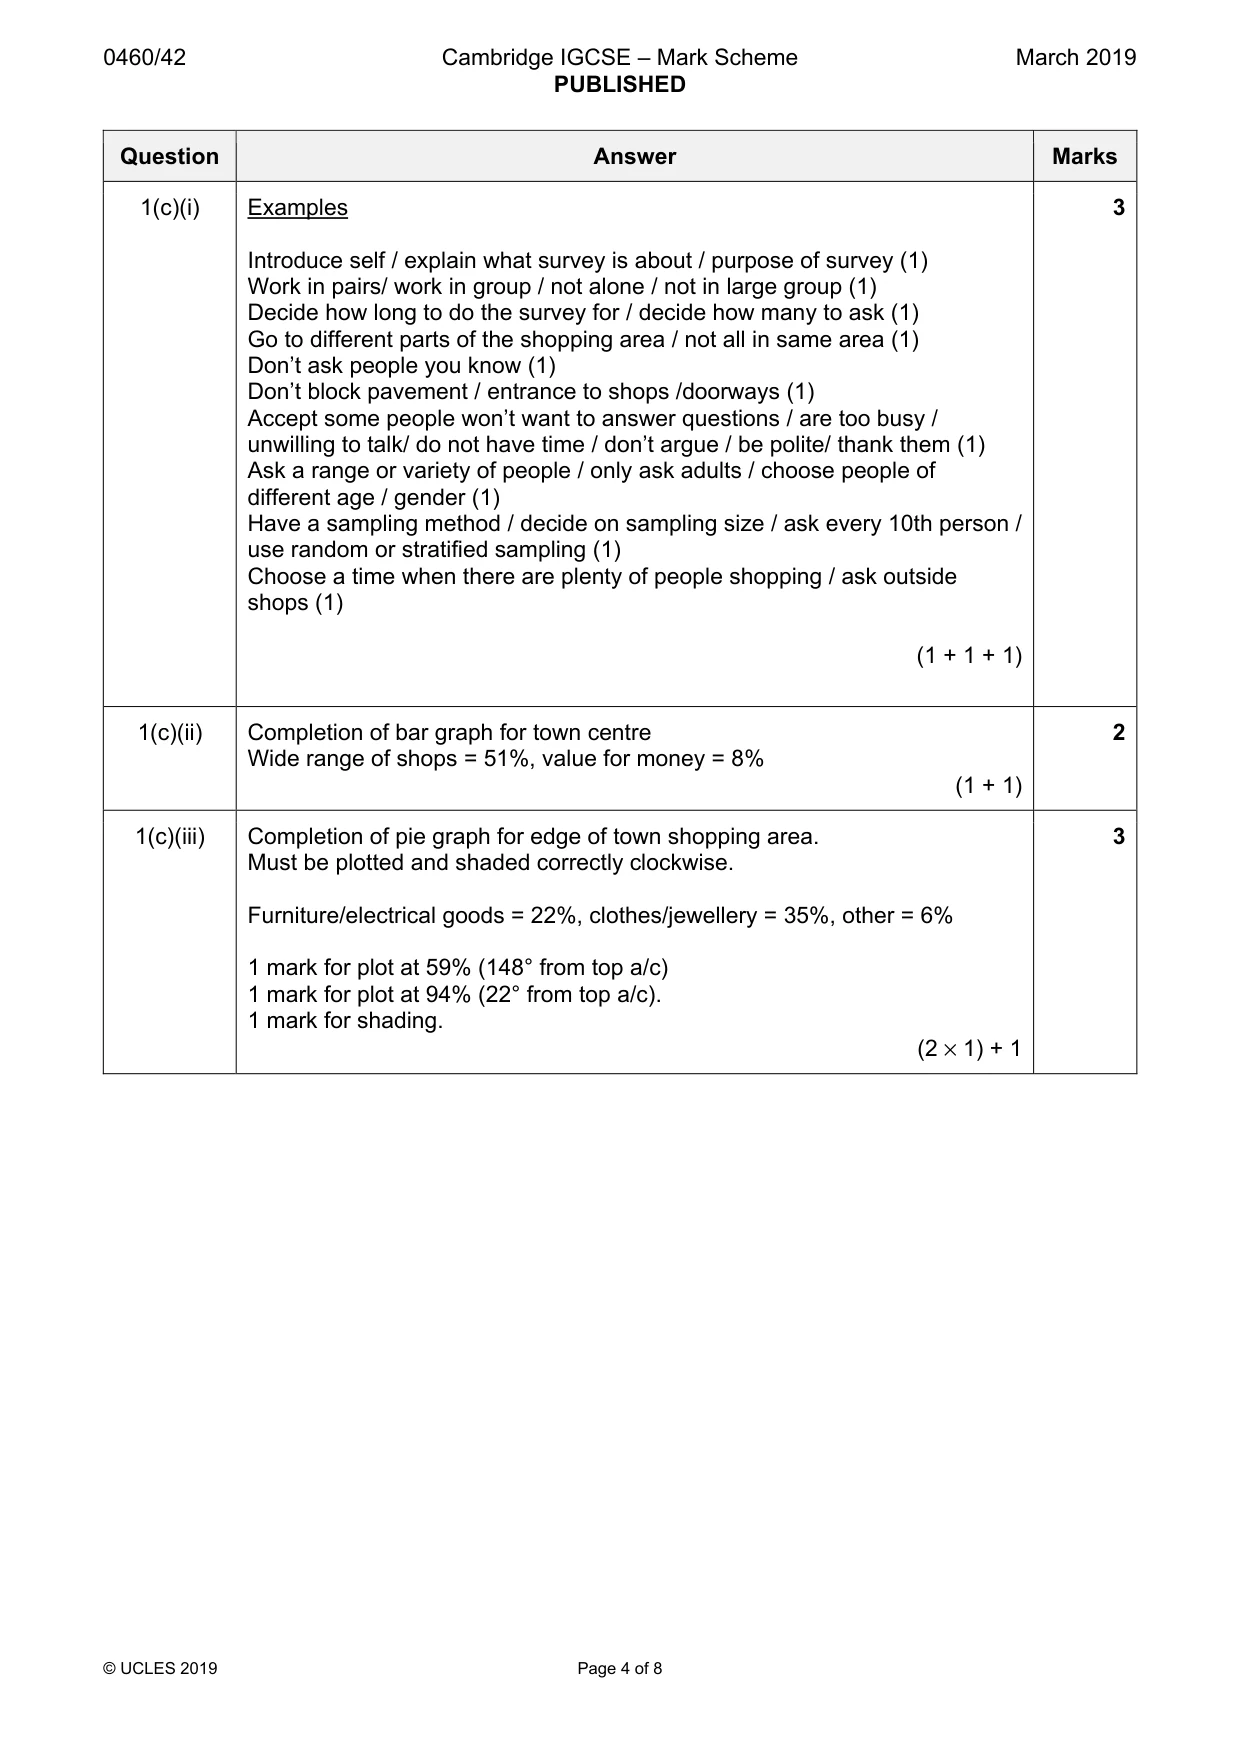
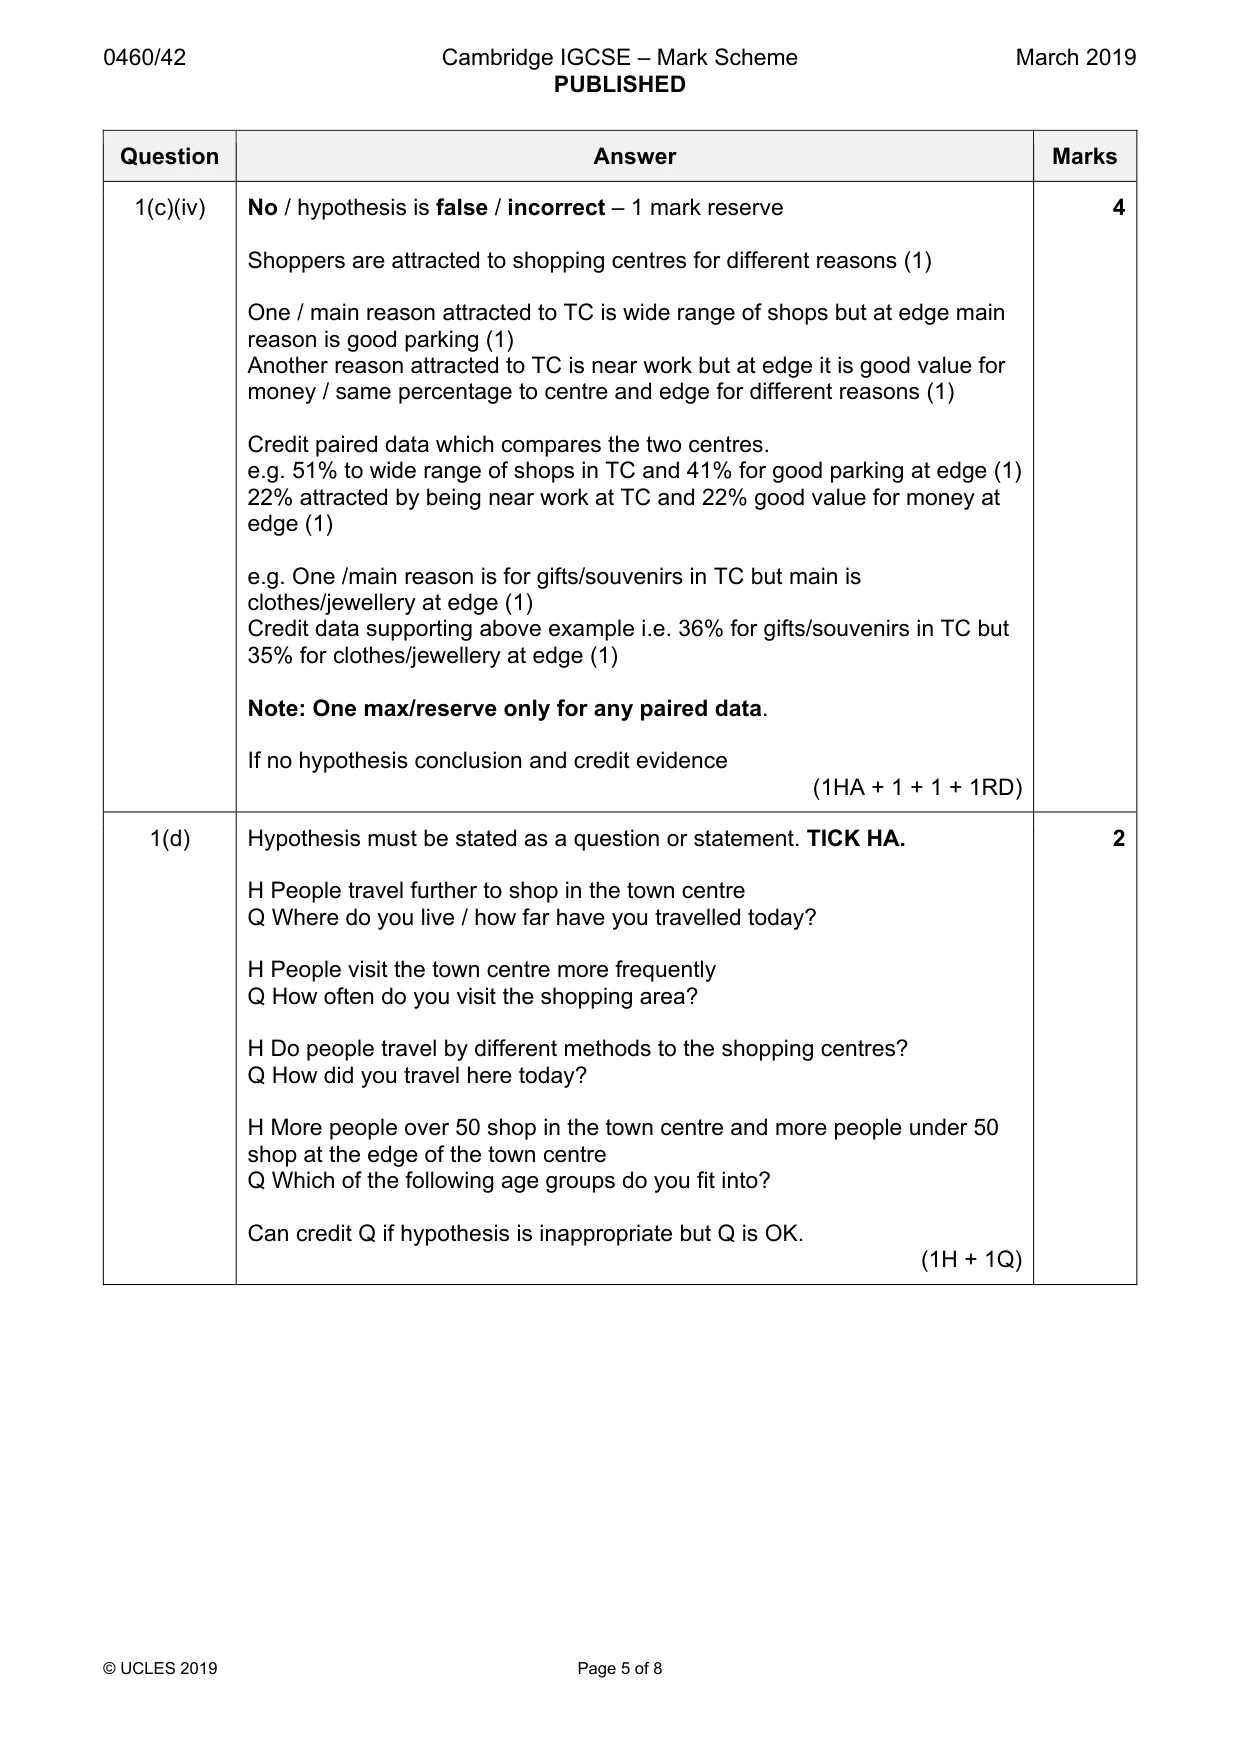
Mark scheme: Question Answer Marks 1(a)(i) Department store 1 1(a)(ii) Library, bank, museum, art gallery, theatre, restaurant, bar / café, 2 hairdresser, optician, solicitors, travel agent, bus station, beauty and health. No credit for number from key. (1 + 1) 1(a)(iii) Reasons such as: 2 Good accessibility / transport / bus station (1) Grew up with historic development of town (1) Large number of customers / large threshold / make more money / many people come here (1) Near to similar / complementary / other services / or e.g. such as bank for people to get money for shopping / restaurant to eat whilst spending the day shopping (1) (1 + 1) 1(a)(iv) Hypothesis is true / correct / greater number and variety of shop and 4 services in town centre – 1 mark reserve Stats to 2 max. Ignore ‘only/just’ refs. Reserve data: 206 shops / services in town centre compared to 77 in edge of town area (1RD) 42 different types of shop / service in town centre compared to 24 in edge of town area (1D) e.g. 21 gift shops in centre but only 1 on edge (1D) e.g. art gallery / antiques / bank in town centre but not on edge of town area (to 2 max for named examples of variety/difference). If no hypothesis conclusion credit evidence (1HA + 1RD + 2 or 1 + 1D) 1(b)(i) Rows 1 and 3 are correct 2 Convenience goods are bought more frequently than comparison goods (1) Convenience goods are usually cheaper than comparison goods (1) (1 + 1) 1(b)(ii) Examples 2 Convenience goods: bread and cakes, chemist, fast food, household goods, florist, department store (only credit once in either). (1) Comparison goods: accessories for clothes, bookshop, cell phones, clothes, department store, electrical goods, furniture, gift / souvenir, jeweller, leather goods, shoes, sports goods, toys, art supplies (1) (1 + 1) 1(b)(iii) Drawing divided bar graph 3 1 mark for any 1 or 2 correct plots; 2 marks for three correct plots at 13, 56, 77. 1 mark for shading. (1 + 1 + 1) 1(c)(i) Examples 3 Introduce self / explain what survey is about / purpose of survey (1) Work in pairs/ work in group / not alone / not in large group (1) Decide how long to do the survey for / decide how many to ask (1) Go to different parts of the shopping area / not all in same area (1) Don’t ask people you know (1) Don’t block pavement / entrance to shops /doorways (1) Accept some people won’t want to answer questions / are too busy / unwilling to talk/ do not have time / don’t argue / be polite/ thank them (1) Ask a range or variety of people / only ask adults / choose people of different age / gender (1) Have a sampling method / decide on sampling size / ask every 10th person / use random or stratified sampling (1) Choose a time when there are plenty of people shopping / ask outside shops (1) (1 + 1 + 1) 1(c)(ii) Completion of bar graph for town centre 2 Wide range of shops = 51%, value for money = 8% (1 + 1) 1(c)(iii) Completion of pie graph for edge of town shopping area. 3 Must be plotted and shaded correctly clockwise. Furniture/electrical goods = 22%, clothes/jewellery = 35%, other = 6% 1 mark for plot at 59% (148° from top a/c) 1 mark for plot at 94% (22° from top a/c). 1 mark for shading. (2 × 1) + 1 1(c)(iv) No / hypothesis is false / incorrect – 1 mark reserve 4 Shoppers are attracted to shopping centres for different reasons (1) One / main reason attracted to TC is wide range of shops but at edge main reason is good parking (1) Another reason attracted to TC is near work but at edge it is good value for money / same percentage to centre and edge for different reasons (1) Credit paired data which compares the two centres. e.g. 51% to wide range of shops in TC and 41% for good parking at edge (1) 22% attracted by being near work at TC and 22% good value for money at edge (1) e.g. One /main reason is for gifts/souvenirs in TC but main is clothes/jewellery at edge (1) Credit data supporting above example i.e. 36% for gifts/souvenirs in TC but 35% for clothes/jewellery at edge (1) Note: One max/reserve only for any paired data. If no hypothesis conclusion and credit evidence (1HA + 1 + 1 + 1RD) 1(d) Hypothesis must be stated as a question or statement. TICK HA. 2 H People travel further to shop in the town centre Q Where do you live / how far have you travelled today? H People visit the town centre more frequently Q How often do you visit the shopping area? H Do people travel by different methods to the shopping centres? Q How did you travel here today? H More people over 50 shop in the town centre and more people under 50 shop at the edge of the town centre Q Which of the following age groups do you fit into? Can credit Q if hypothesis is inappropriate but Q is OK. (1H + 1Q)
More questions on Settlements (rural and urban) and service provision
Q2 · Students from a school in Dorset in south west England carried out fieldwork to…
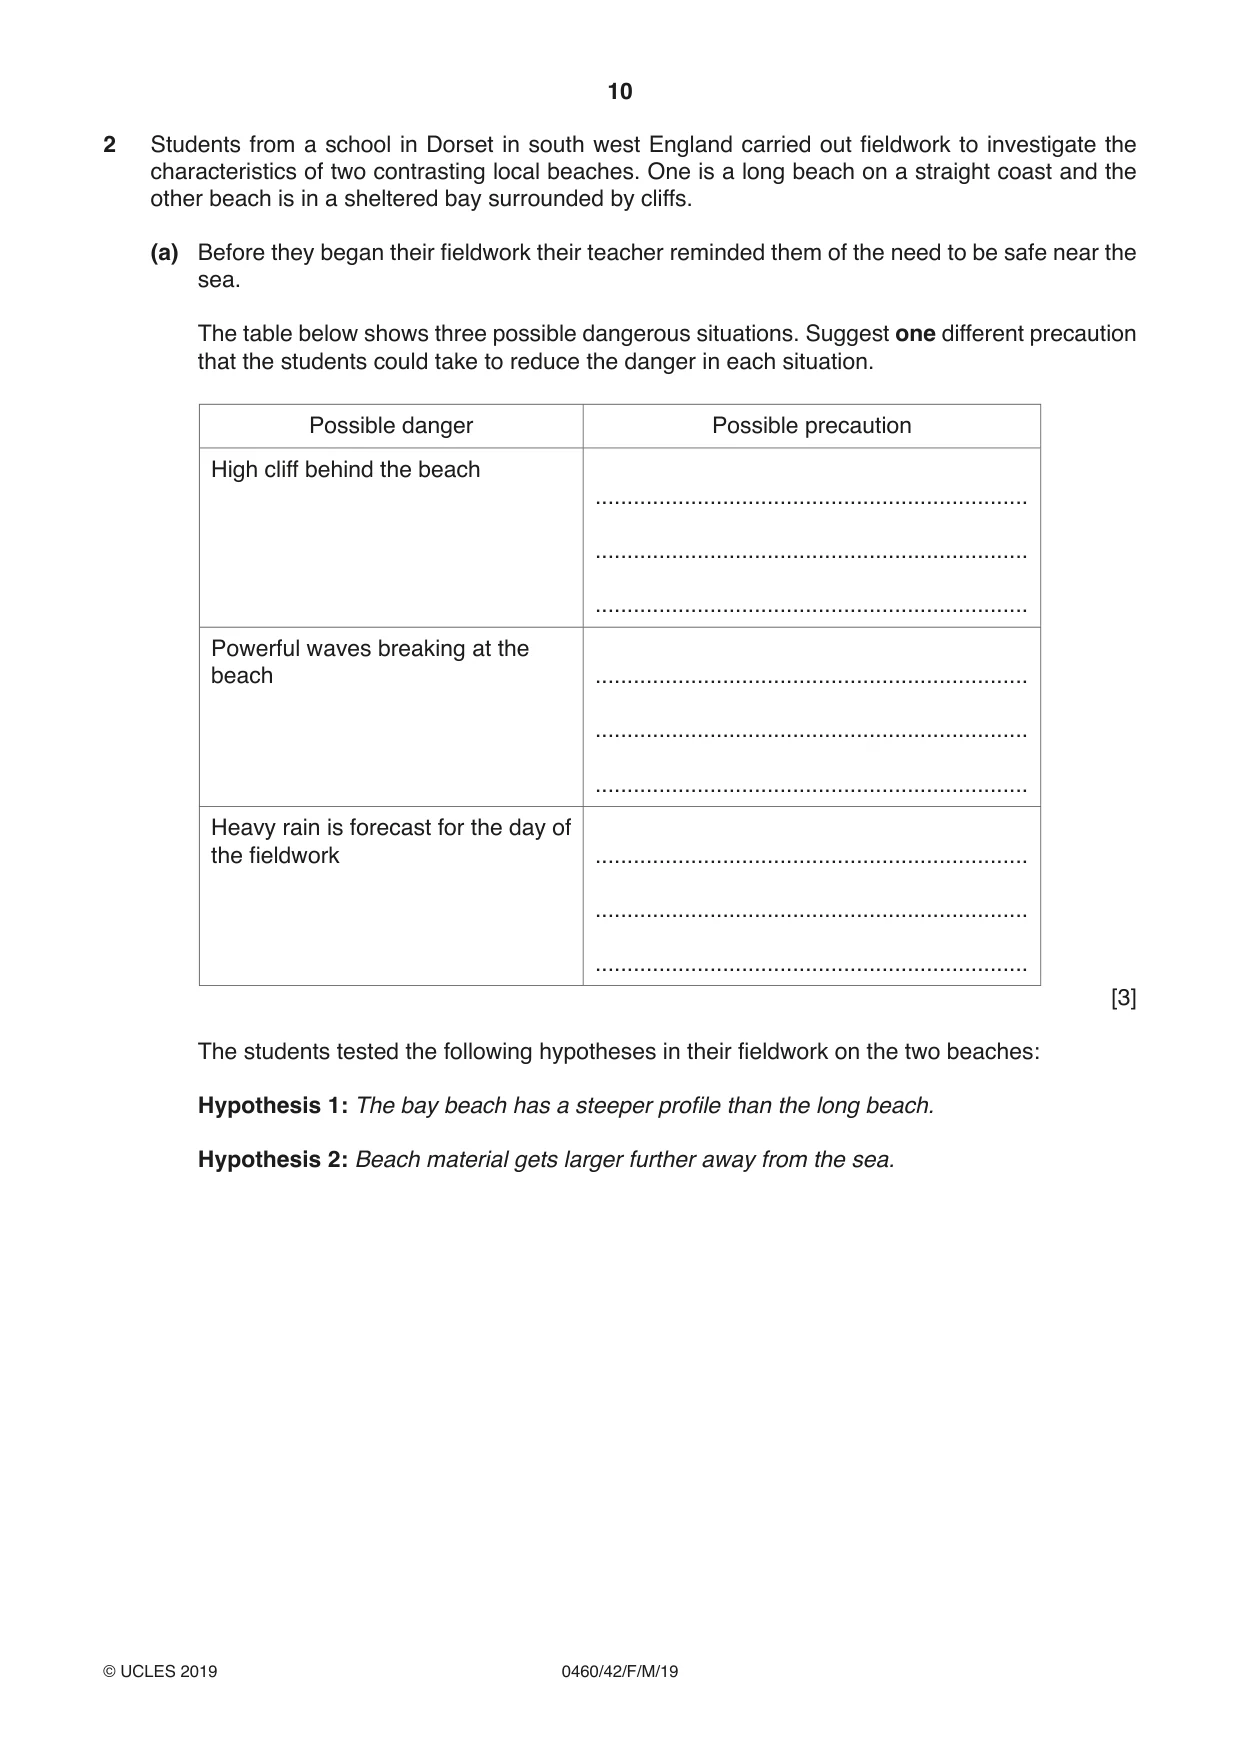
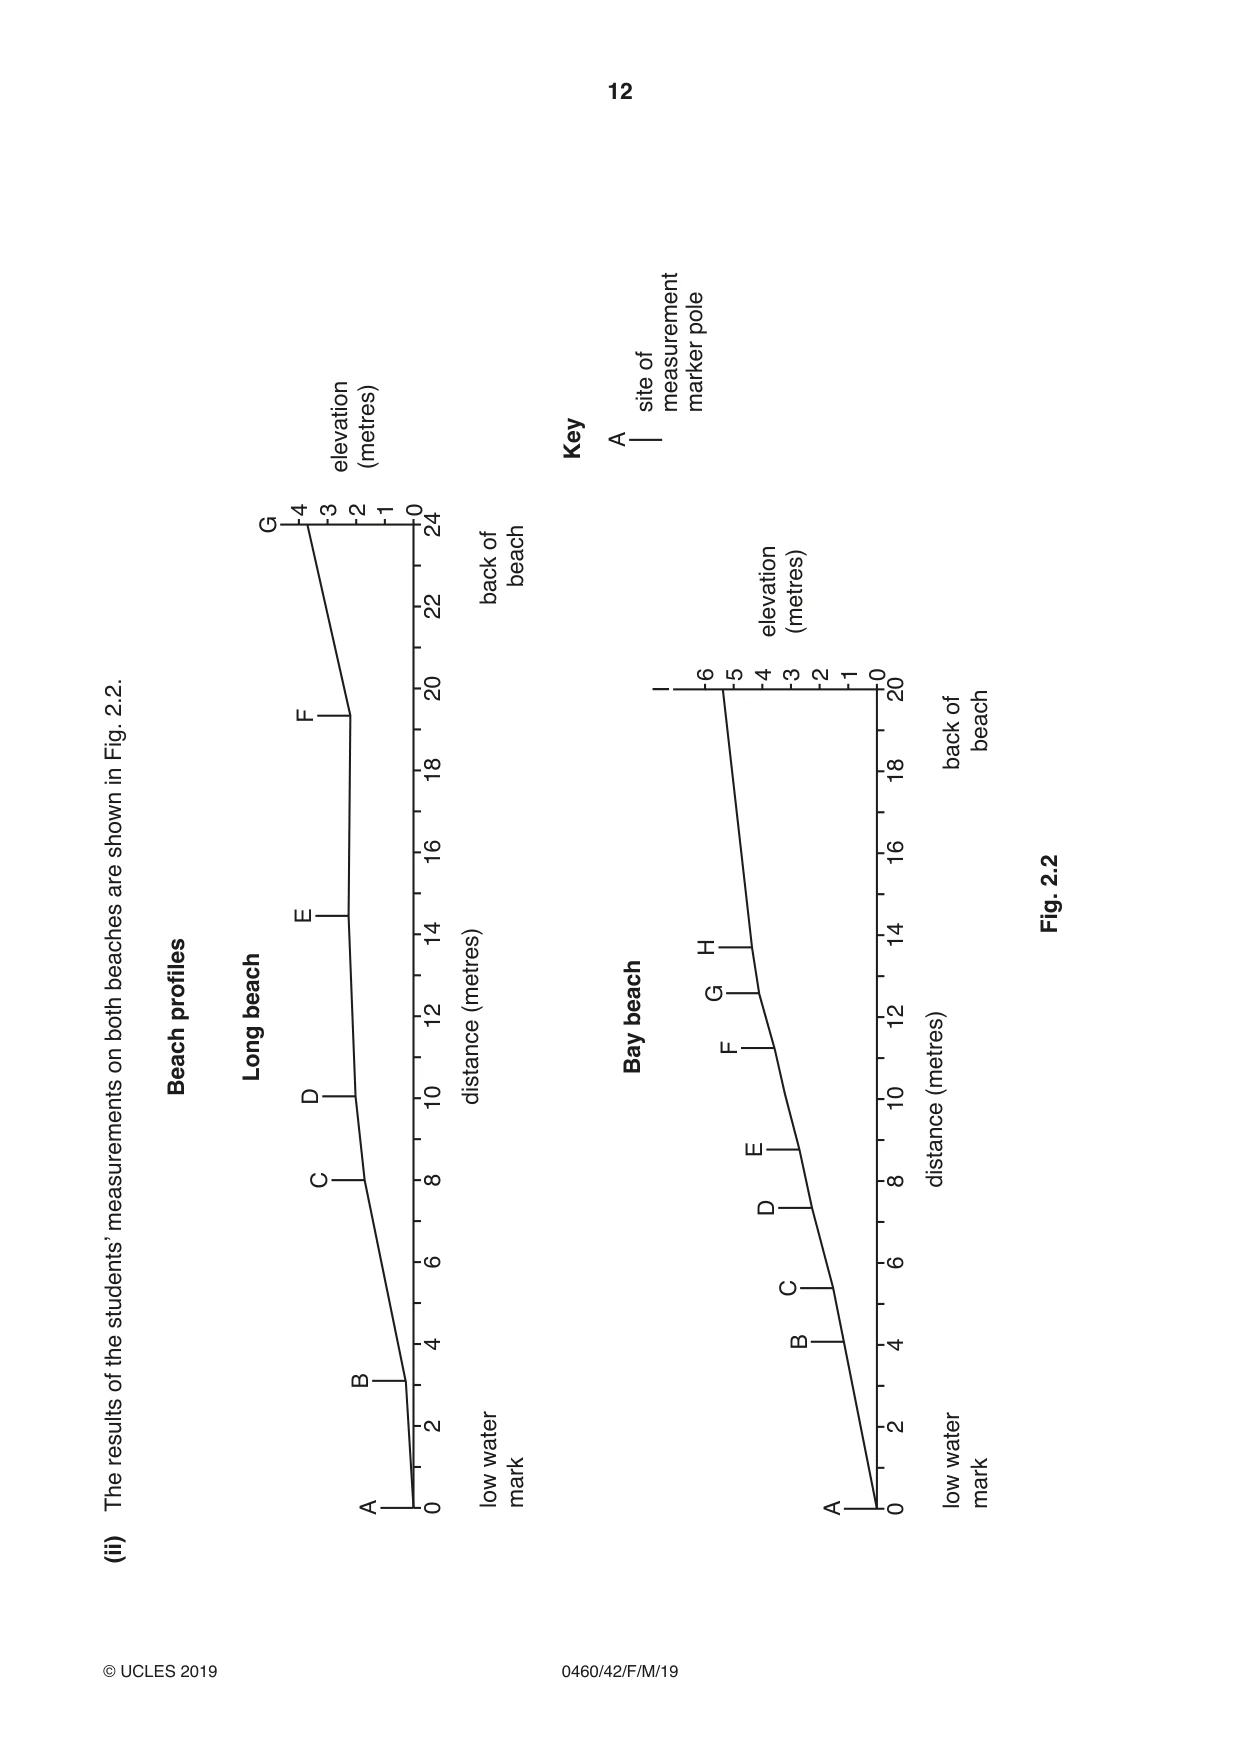
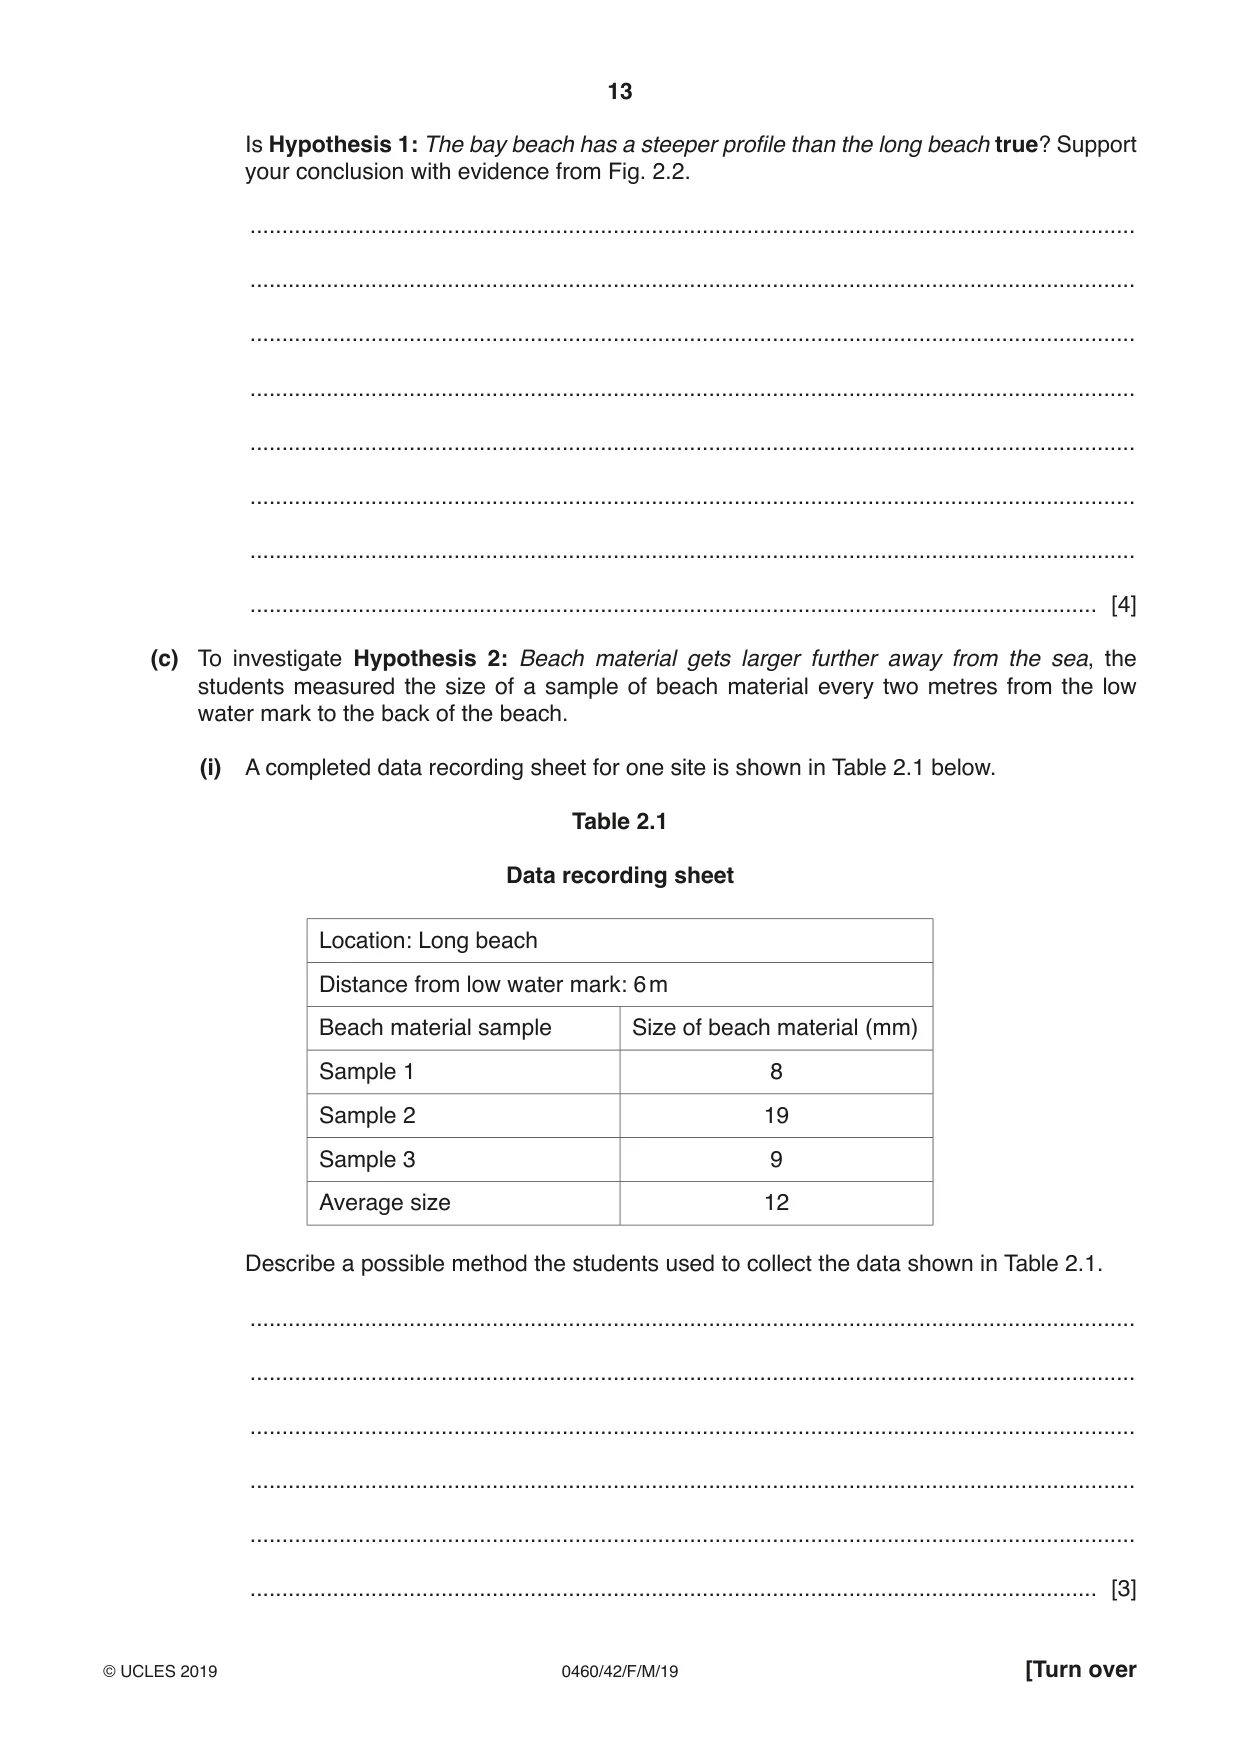
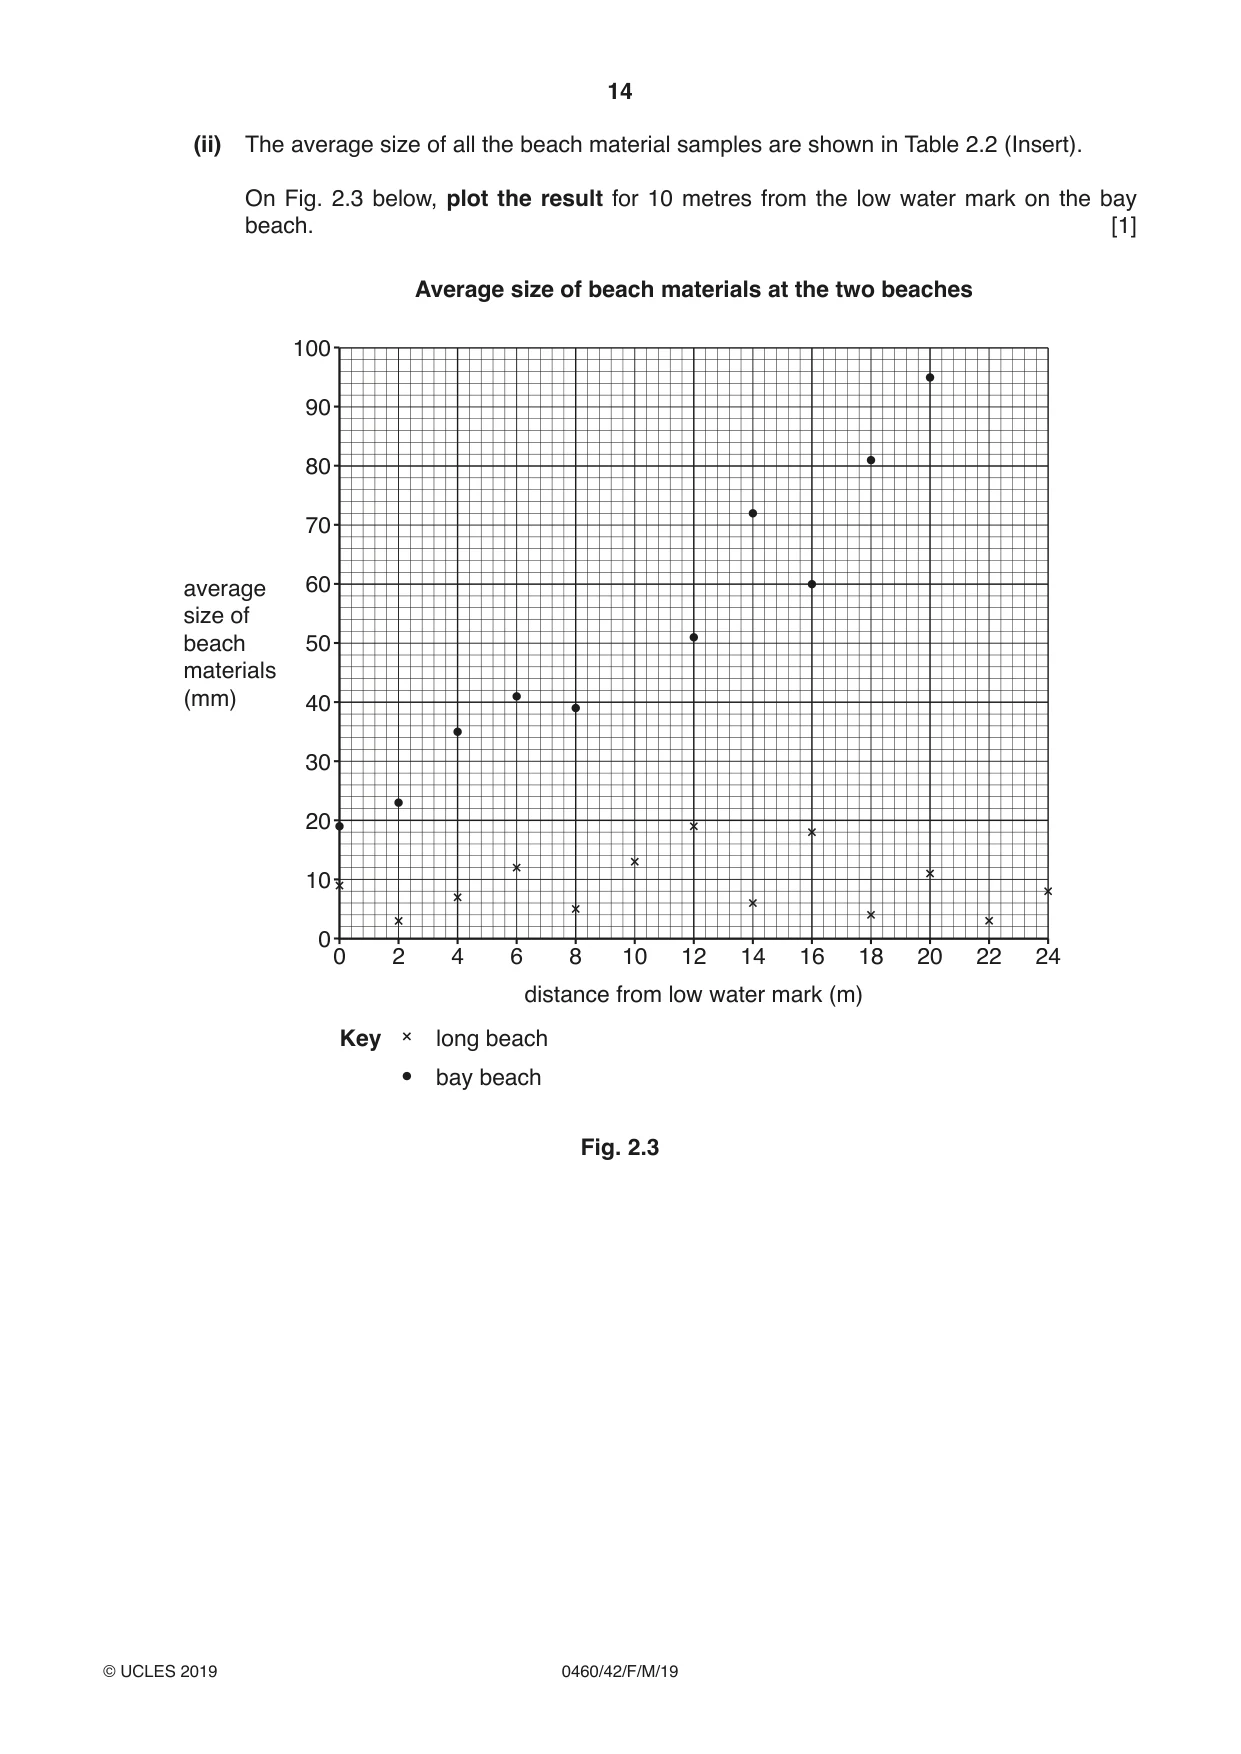
2 Students from a school in Dorset in south west England carried out fieldwork to investigate the characteristics of two contrasting local beaches. One is a long beach on a straight coast and the other beach is in a sheltered bay surrounded by cliffs. (a) Before they began their fieldwork their teacher reminded them of the need to be safe near the sea. The table below shows three possible dangerous situations. Suggest one different precaution that the students could take to reduce the danger in each situation. Possible danger Possible precaution High cliff behind the beach .................................................................... .................................................................... .................................................................... Powerful waves breaking at the beach .................................................................... .................................................................... .................................................................... Heavy rain is forecast for the day of the fieldwork .................................................................... .................................................................... .................................................................... [3] The students tested the following hypotheses in their fieldwork on the two beaches: Hypothesis 1: The bay beach has a steeper profile than the long beach. Hypothesis 2: Beach material gets larger further away from the sea. (b) To investigate Hypothesis 1 the students measured the changing profile from the sea to the back of the beach. Fig. 2.1 (Insert) shows their method. (i) Describe how the students measured the beach profile. ........................................................................................................................................... ........................................................................................................................................... ........................................................................................................................................... ........................................................................................................................................... ........................................................................................................................................... ........................................................................................................................................... ........................................................................................................................................... ..................................................................................................................................... [4] pole of sitemeasurementmarker A Key elevation(metres) 43210 G 24 of beach back 22 elevation(metres) 6543210 I of2.2. F 20 20 beachFig. back in 18 18 shown 16 16 2.2are E Fig. 14 14 Hbeaches G (metres) profiles beach 12 beach 12both Fon Bay Beach Long (metres) D 10 distance 10 E C 8 8 distance Dmeasurements 6 6 Cstudents’ the 4 B 4 of B 2 2 results water water mark lowmarkThe A 0 low A 0 (ii)
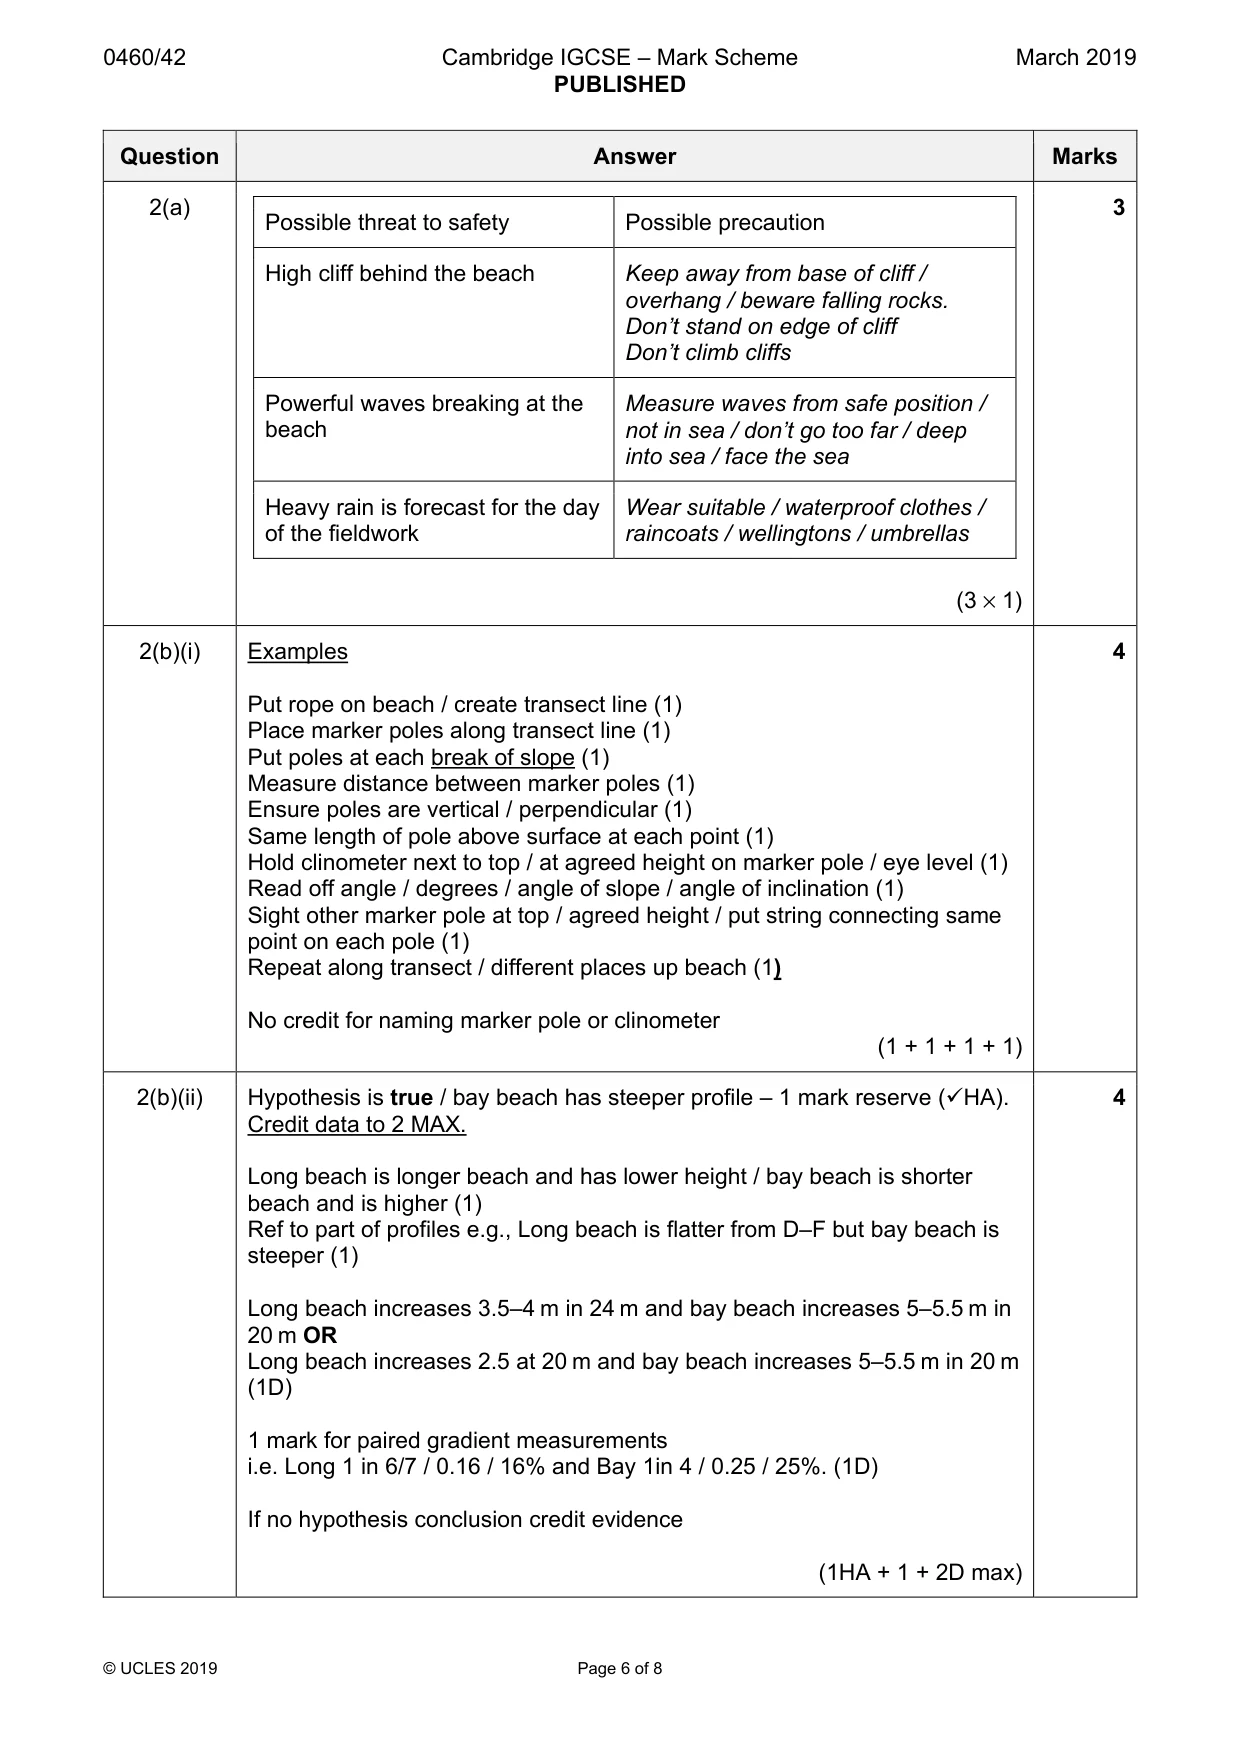
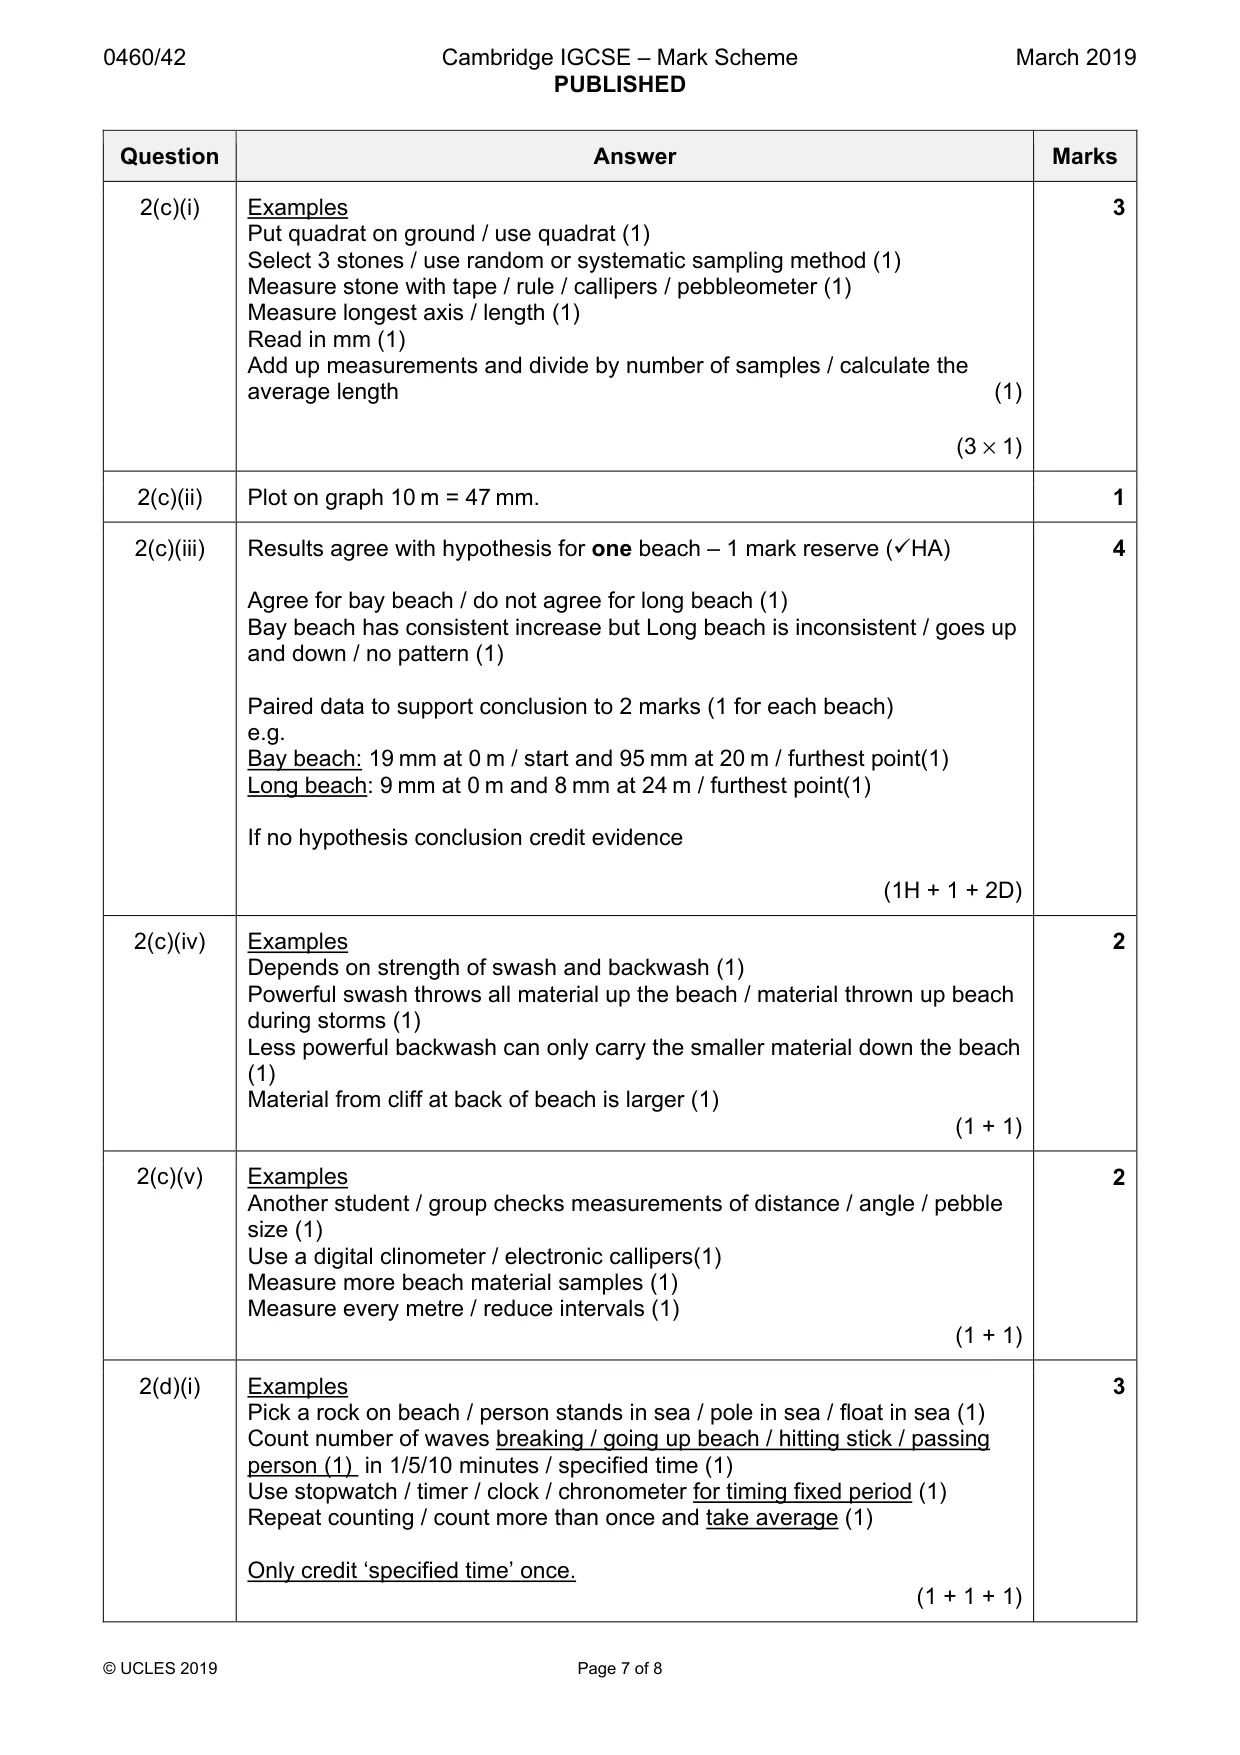
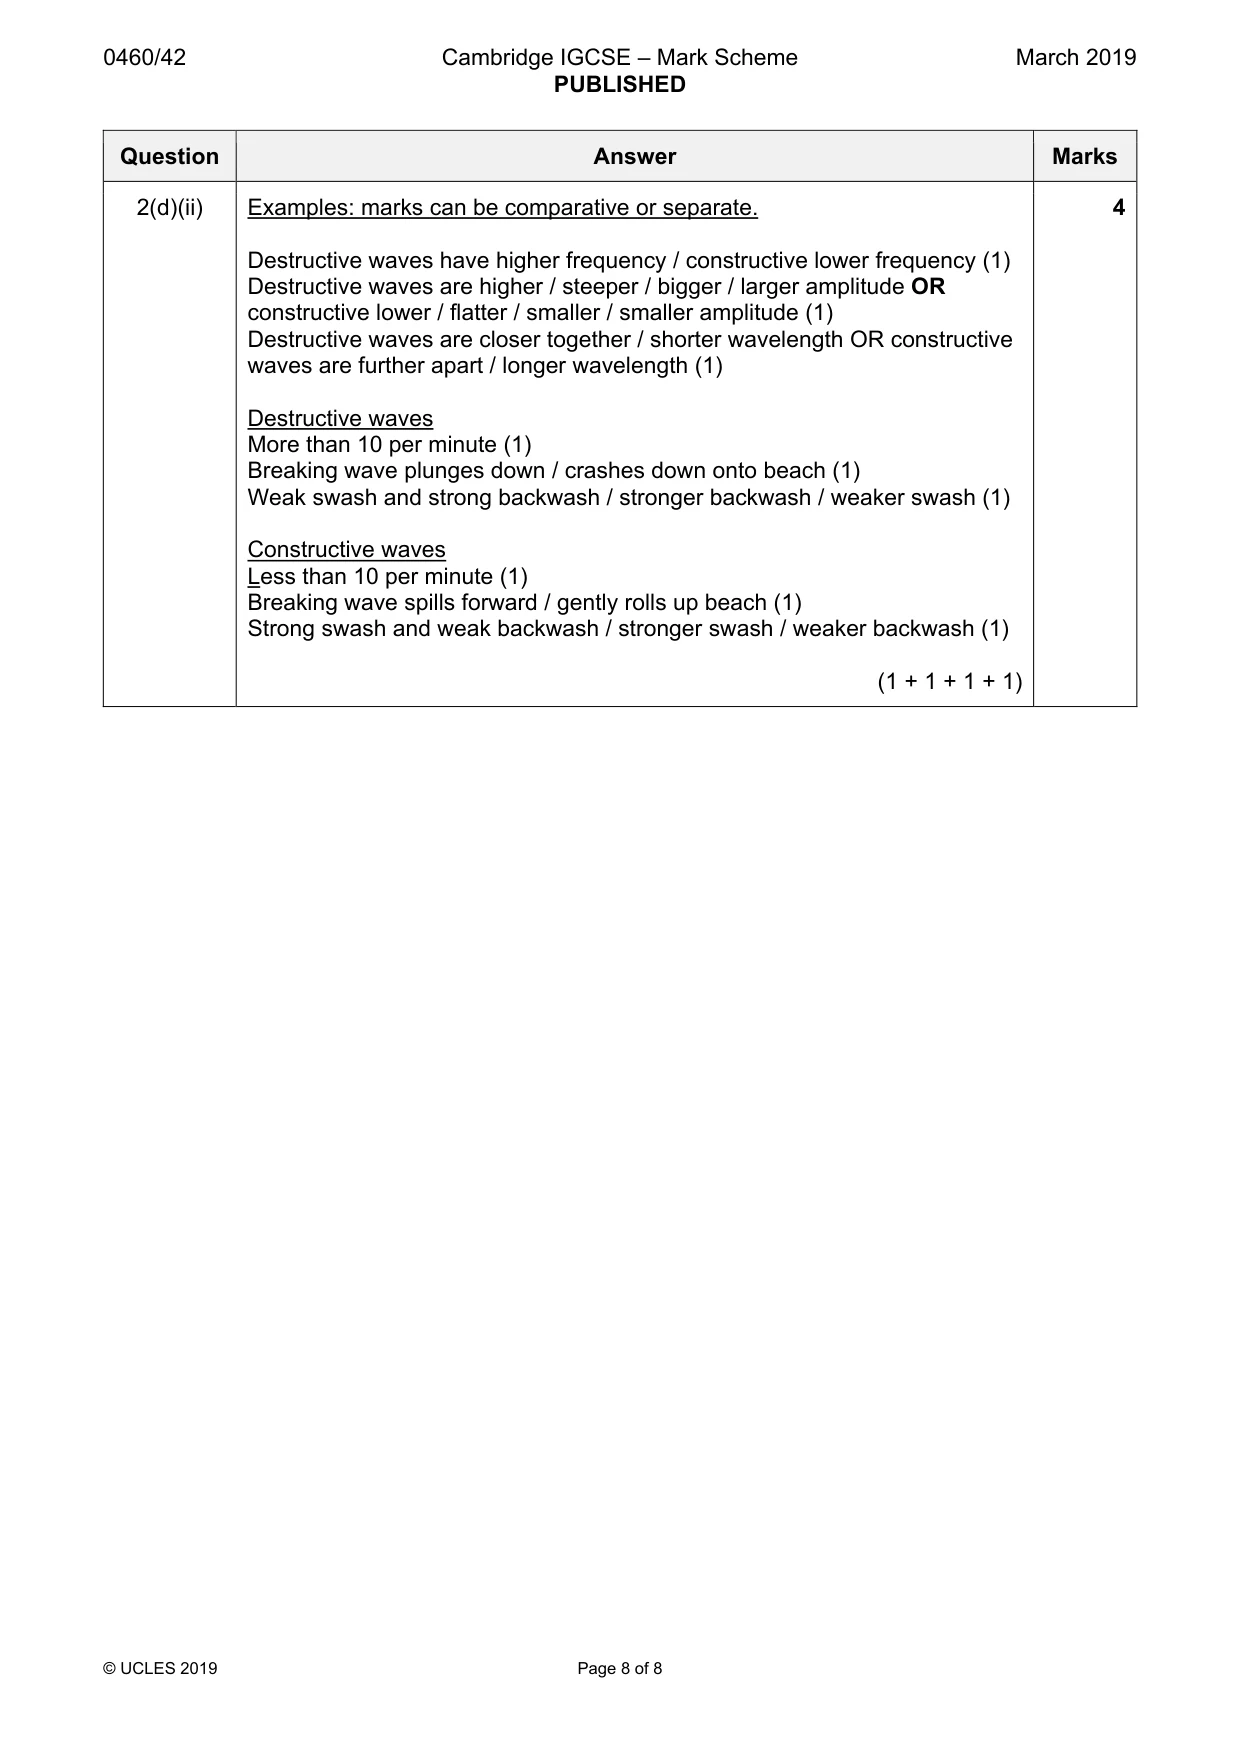
Mark scheme: 2(a) 3 Possible threat to safety Possible precaution High cliff behind the beach Keep away from base of cliff / overhang / beware falling rocks. Don’t stand on edge of cliff Don’t climb cliffs Powerful waves breaking at the Measure waves from safe position / beach not in sea / don’t go too far / deep into sea / face the sea Heavy rain is forecast for the day Wear suitable / waterproof clothes / of the fieldwork raincoats / wellingtons / umbrellas (3 × 1) 2(b)(i) Examples 4 Put rope on beach / create transect line (1) Place marker poles along transect line (1) Put poles at each break of slope (1) Measure distance between marker poles (1) Ensure poles are vertical / perpendicular (1) Same length of pole above surface at each point (1) Hold clinometer next to top / at agreed height on marker pole / eye level (1) Read off angle / degrees / angle of slope / angle of inclination (1) Sight other marker pole at top / agreed height / put string connecting same point on each pole (1) Repeat along transect / different places up beach (1) No credit for naming marker pole or clinometer (1 + 1 + 1 + 1) 2(b)(ii) Hypothesis is true / bay beach has steeper profile – 1 mark reserve (9HA). 4 Credit data to 2 MAX. Long beach is longer beach and has lower height / bay beach is shorter beach and is higher (1) Ref to part of profiles e.g., Long beach is flatter from D–F but bay beach is steeper (1) Long beach increases 3.5–4 m in 24 m and bay beach increases 5–5.5 m in 20 m OR Long beach increases 2.5 at 20 m and bay beach increases 5–5.5 m in 20 m (1D) 1 mark for paired gradient measurements i.e. Long 1 in 6/7 / 0.16 / 16% and Bay 1in 4 / 0.25 / 25%. (1D) If no hypothesis conclusion credit evidence (1HA + 1 + 2D max) 2(c)(i) Examples 3 Put quadrat on ground / use quadrat (1) Select 3 stones / use random or systematic sampling method (1) Measure stone with tape / rule / callipers / pebbleometer (1) Measure longest axis / length (1) Read in mm (1) Add up measurements and divide by number of samples / calculate the average length (1) (3 × 1) 2(c)(ii) Plot on graph 10 m = 47 mm. 1 2(c)(iii) Results agree with hypothesis for one beach – 1 mark reserve (9HA) 4 Agree for bay beach / do not agree for long beach (1) Bay beach has consistent increase but Long beach is inconsistent / goes up and down / no pattern (1) Paired data to support conclusion to 2 marks (1 for each beach) e.g. Bay beach: 19 mm at 0 m / start and 95 mm at 20 m / furthest point(1) Long beach: 9 mm at 0 m and 8 mm at 24 m / furthest point(1) If no hypothesis conclusion credit evidence (1H + 1 + 2D) 2(c)(iv) Examples 2 Depends on strength of swash and backwash (1) Powerful swash throws all material up the beach / material thrown up beach during storms (1) Less powerful backwash can only carry the smaller material down the beach (1) Material from cliff at back of beach is larger (1) (1 + 1) 2(c)(v) Examples 2 Another student / group checks measurements of distance / angle / pebble size (1) Use a digital clinometer / electronic callipers(1) Measure more beach material samples (1) Measure every metre / reduce intervals (1) (1 + 1) 2(d)(i) Examples 3 Pick a rock on beach / person stands in sea / pole in sea / float in sea (1) Count number of waves breaking / going up beach / hitting stick / passing person (1) in 1/5/10 minutes / specified time (1) Use stopwatch / timer / clock / chronometer for timing fixed period (1) Repeat counting / count more than once and take average (1) Only credit ‘specified time’ once. (1 + 1 + 1) 2(d)(ii) Examples: marks can be comparative or separate. 4 Destructive waves have higher frequency / constructive lower frequency (1) Destructive waves are higher / steeper / bigger / larger amplitude OR constructive lower / flatter / smaller / smaller amplitude (1) Destructive waves are closer together / shorter wavelength OR constructive waves are further apart / longer wavelength (1) Destructive waves More than 10 per minute (1) Breaking wave plunges down / crashes down onto beach (1) Weak swash and strong backwash / stronger backwash / weaker swash (1) Constructive waves Less than 10 per minute (1) Breaking wave spills forward / gently rolls up beach (1) Strong swash and weak backwash / stronger swash / weaker backwash (1) (1 + 1 + 1 + 1)
What was in this paper
The subtopics covered by these 2 questions, and how many questions each got. Open one in a new tab to see every Cambridge question on it.
What you needed in this session
Cambridge’s own grade thresholds for 2019 Feb/March, Paper 4 · Variant 2. A higher threshold means an easier paper — the bar moves with how the cohort did.