Cambridge IGCSE Geography 0460 — 2017 Feb/March Paper 4 · Variant 2
0460/42/F/M/17 · 2 questions · 60 marks · ≈68 min
The question paper and its mark scheme, free to read here and free to download. This is Cambridge’s own paper, exactly as it was sat.
Question paper20 pages






Mark scheme6 pages
Answers below. Sit the paper first if you are practising.
Questions as text
Q1 · Students at a local secondary school investigated traffic flows on four roads going into…
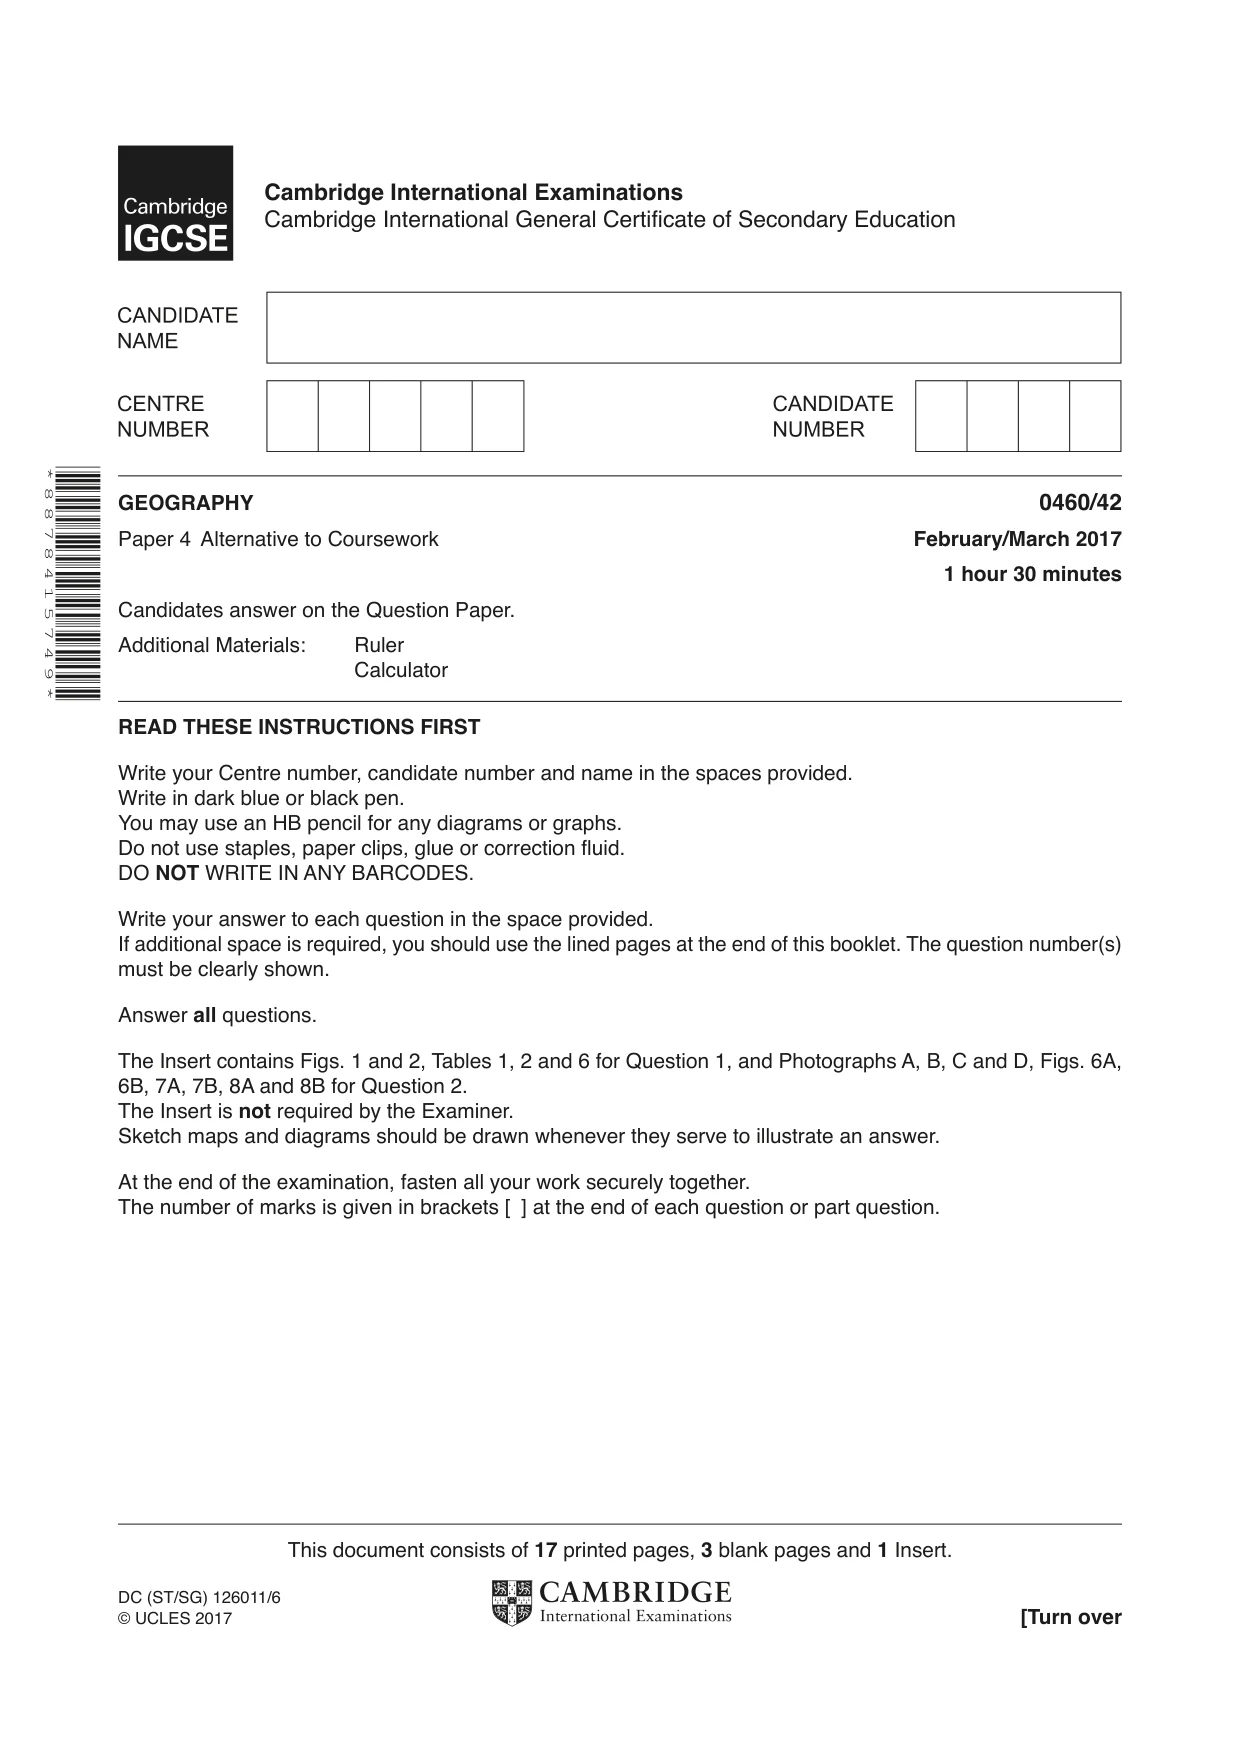
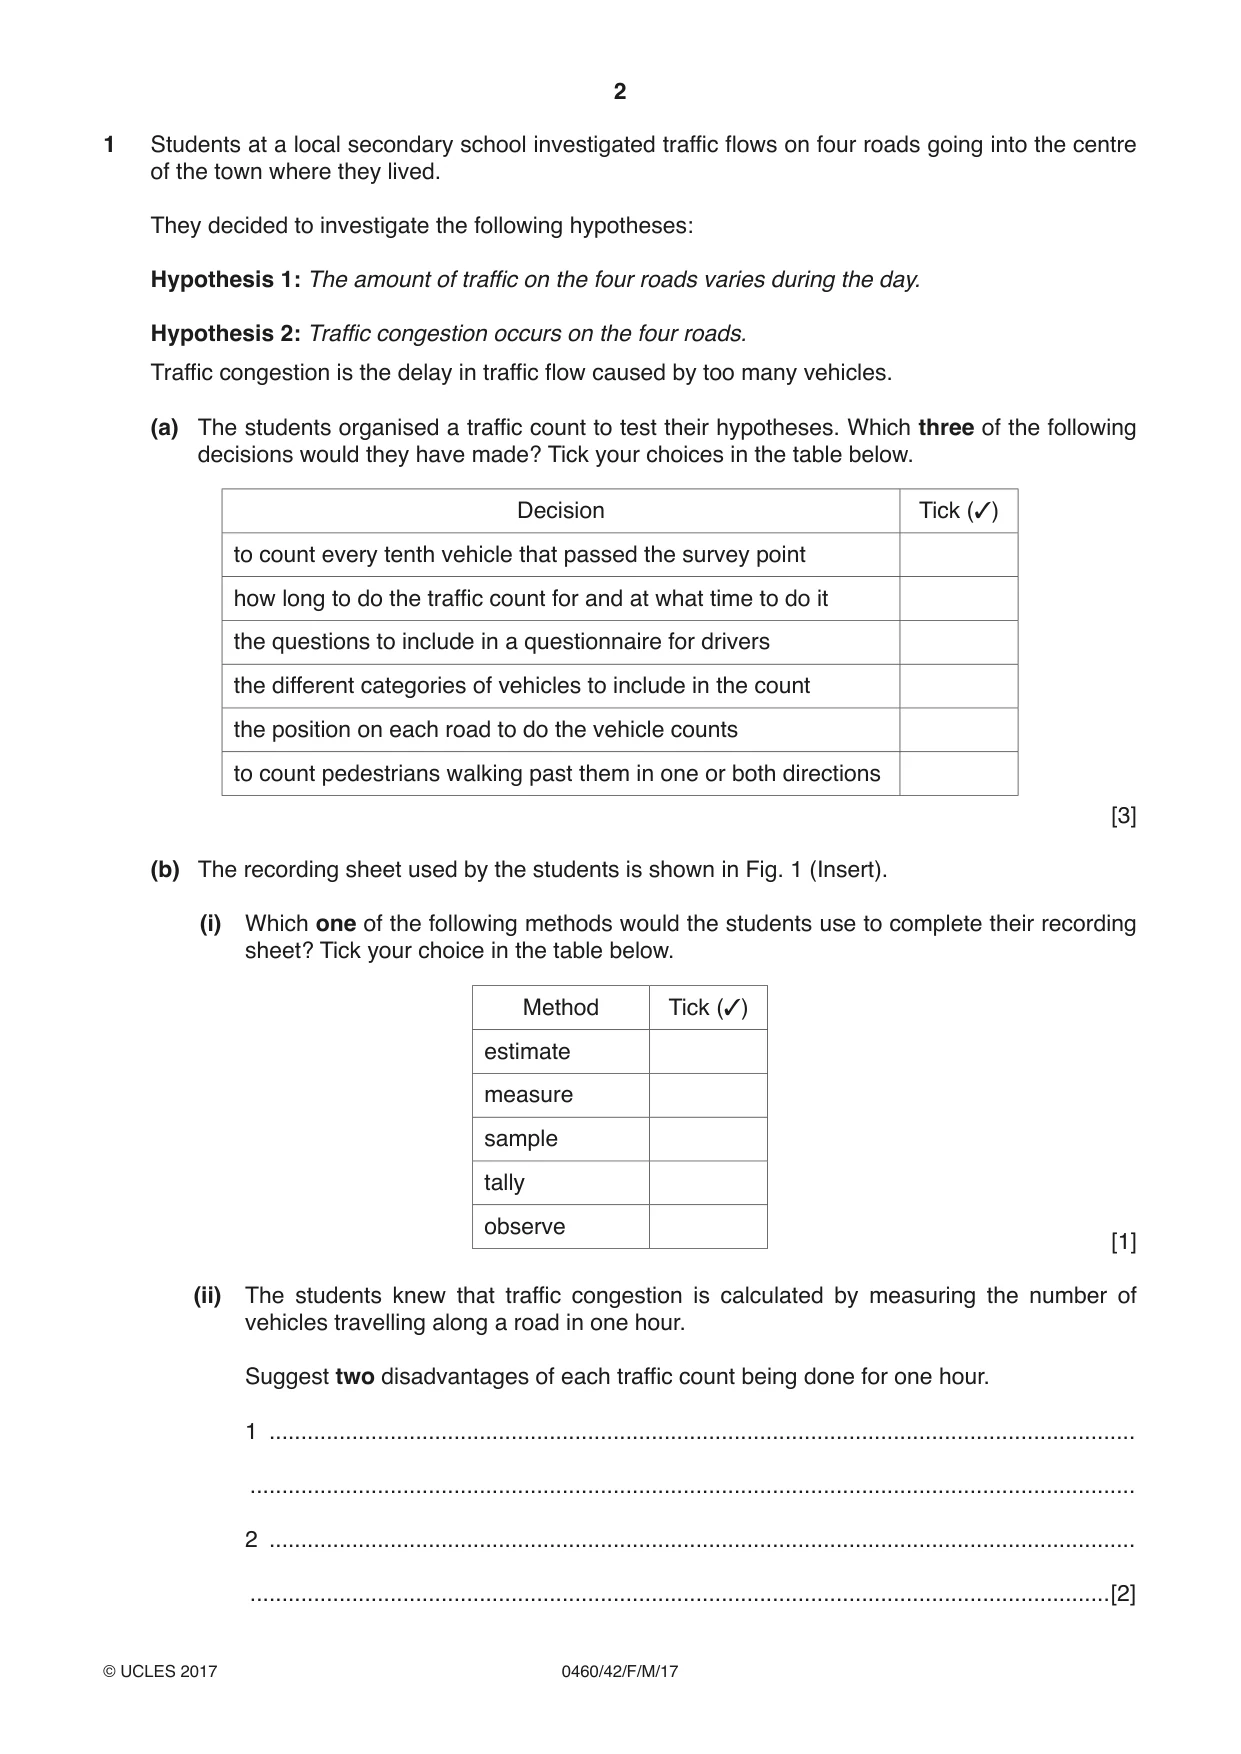
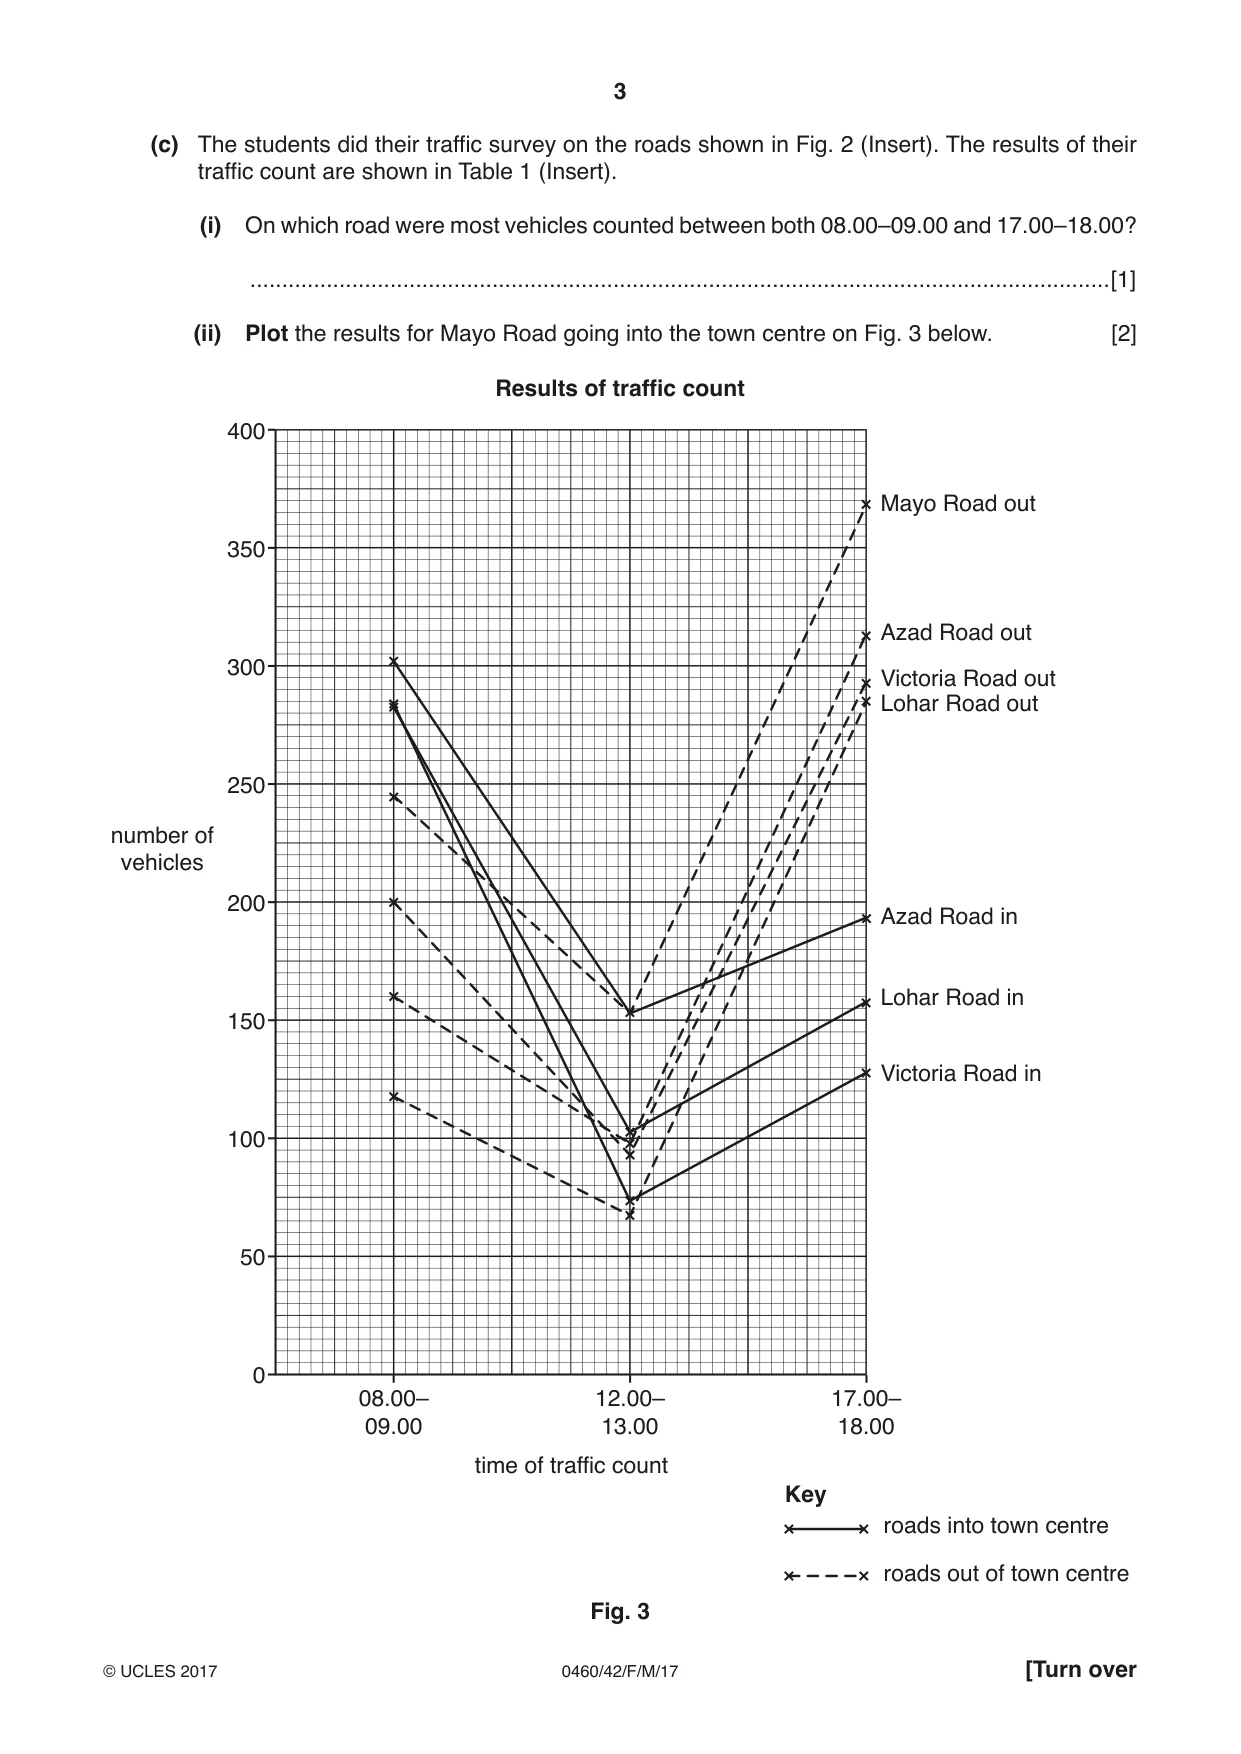
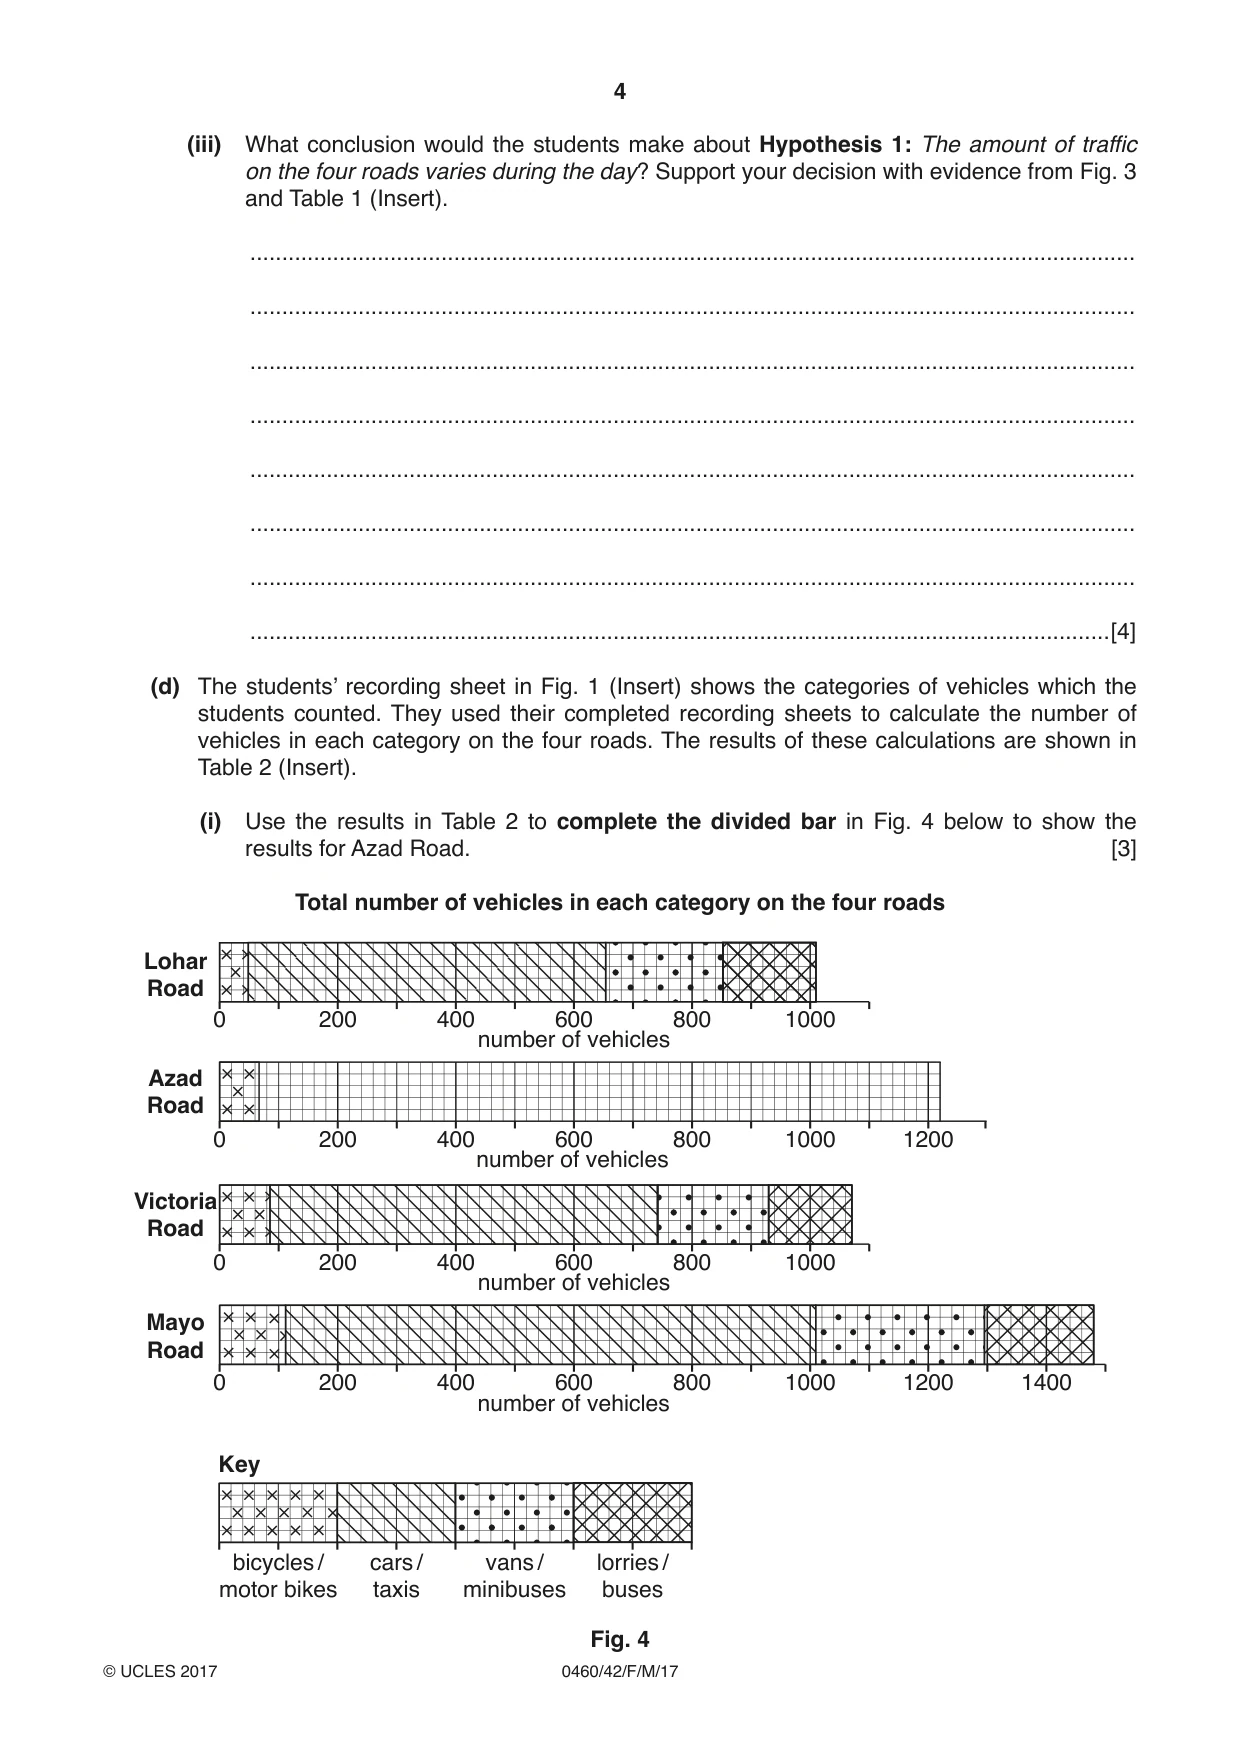
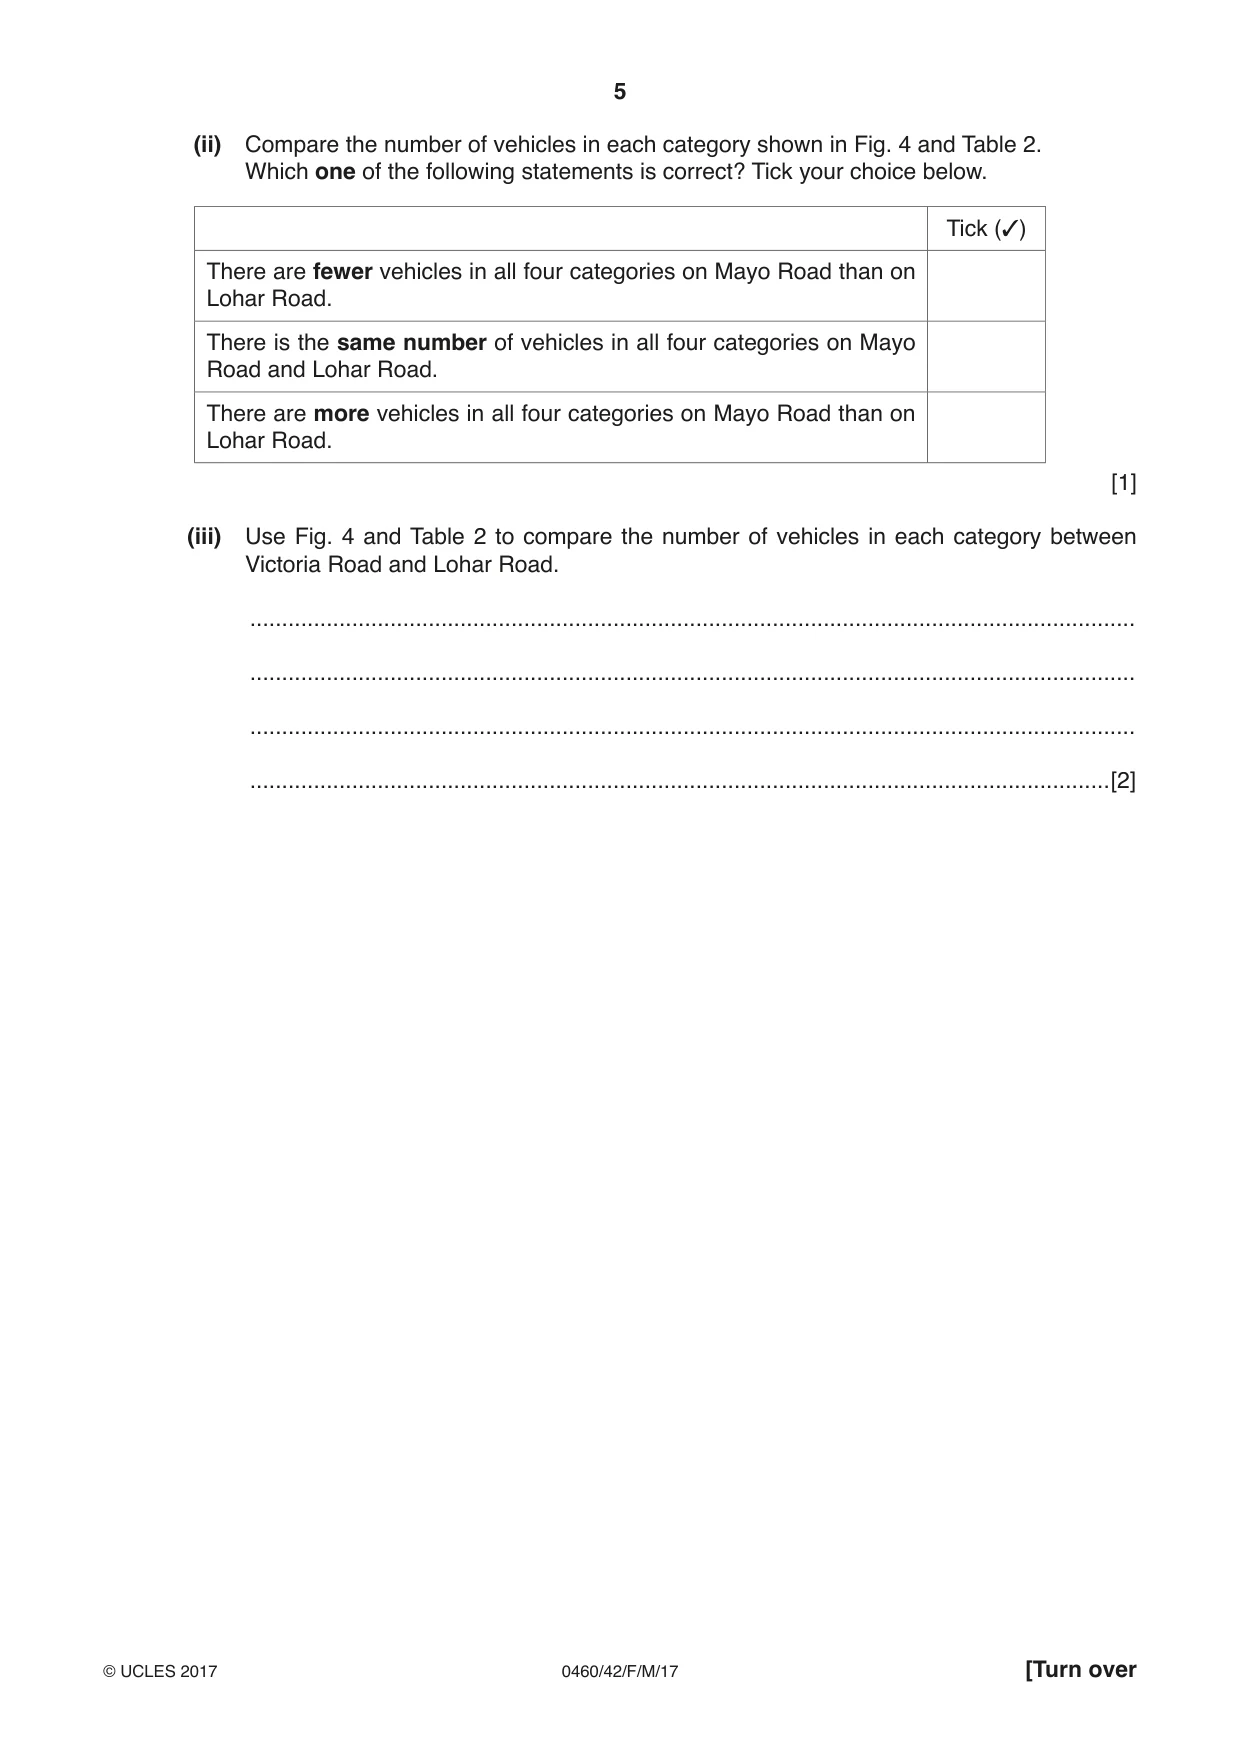
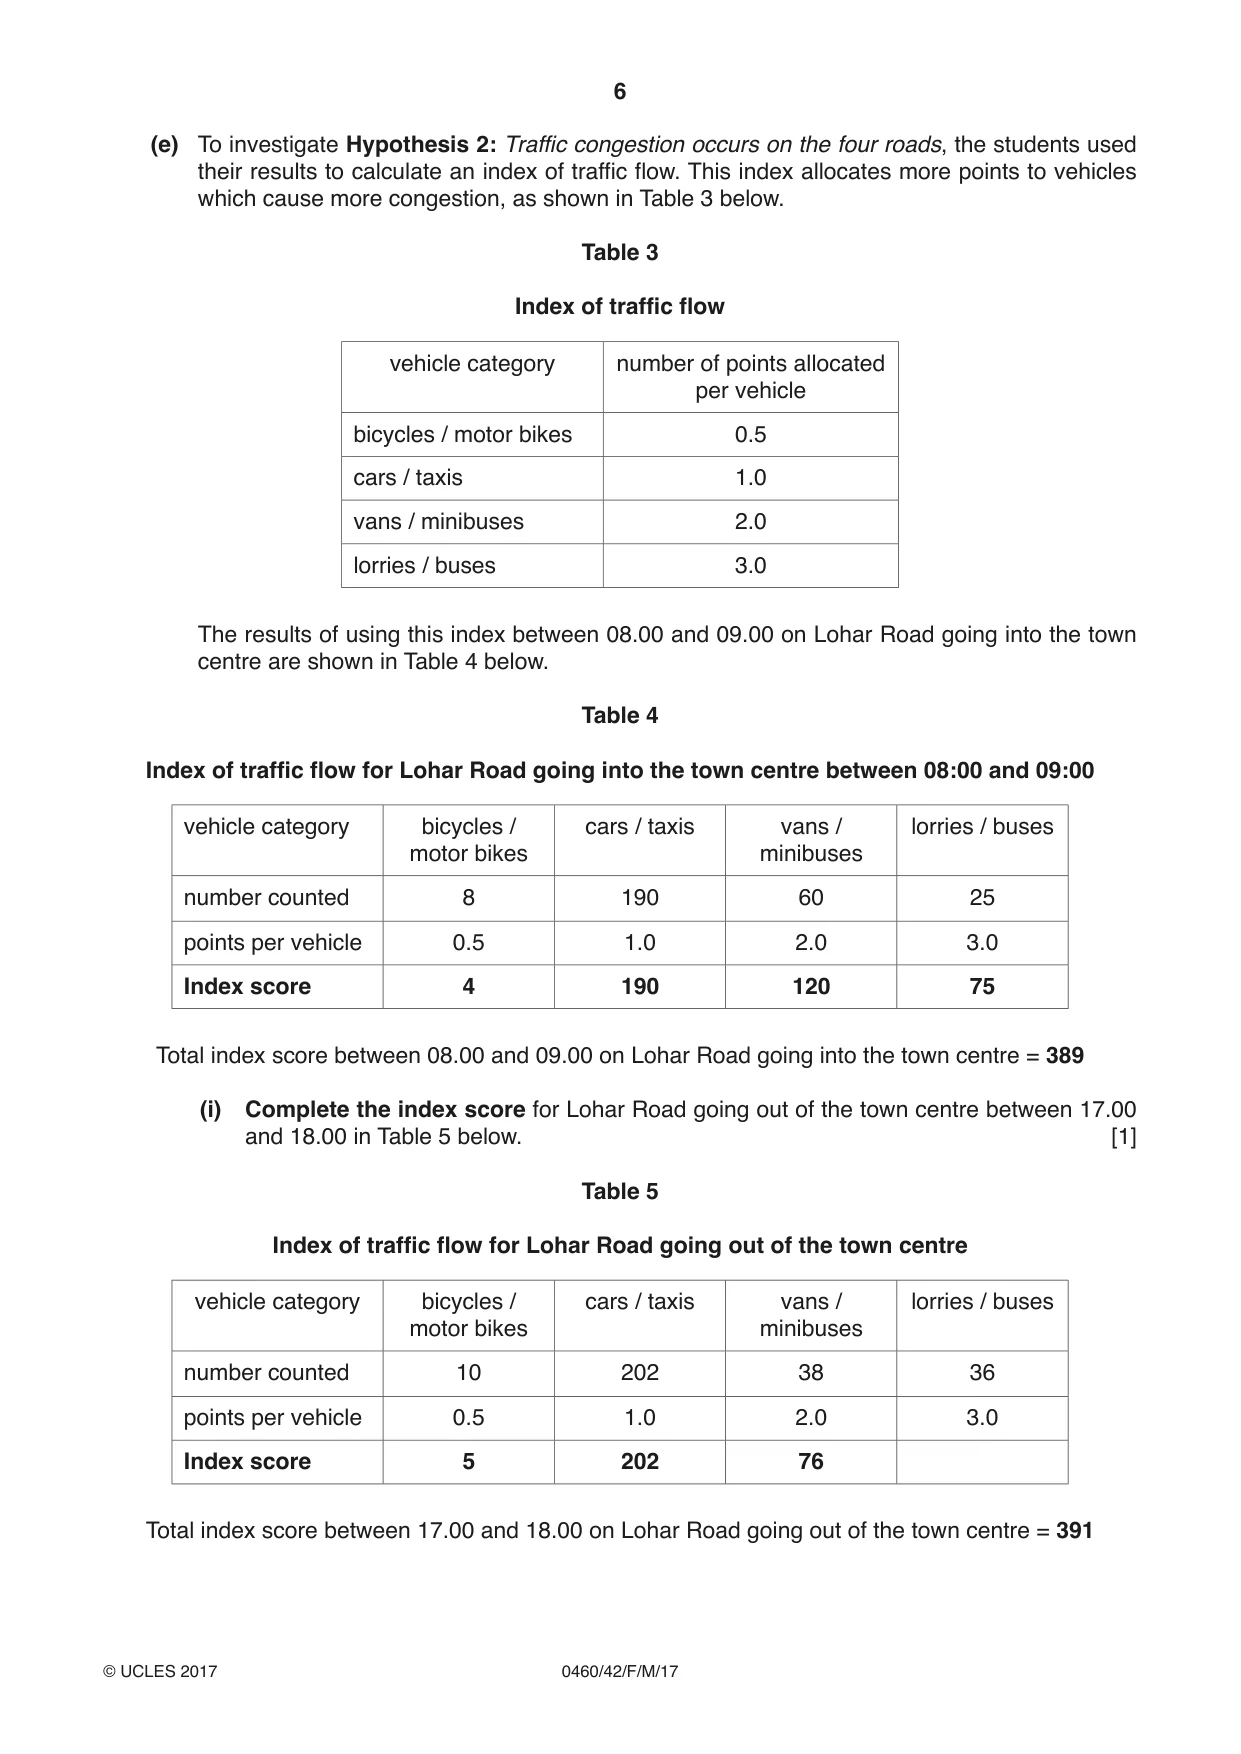
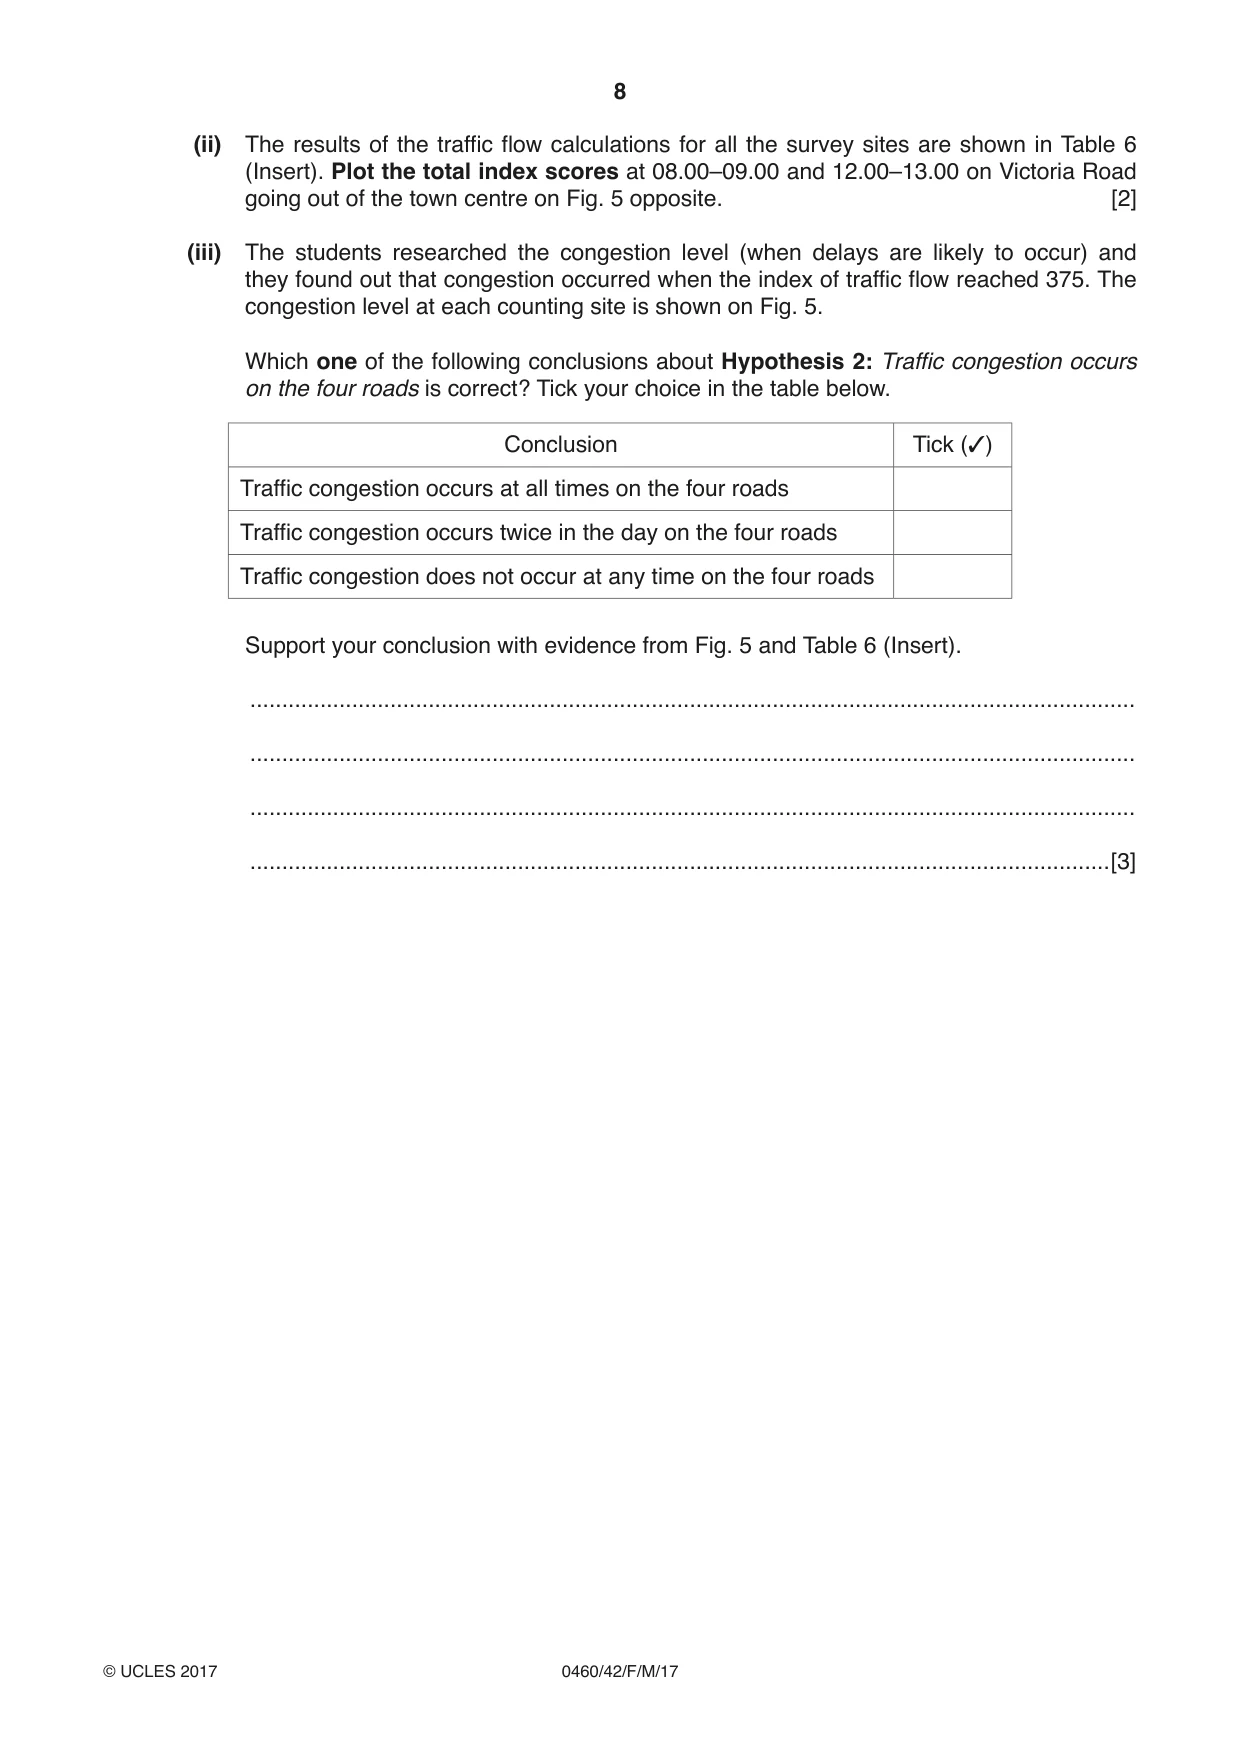
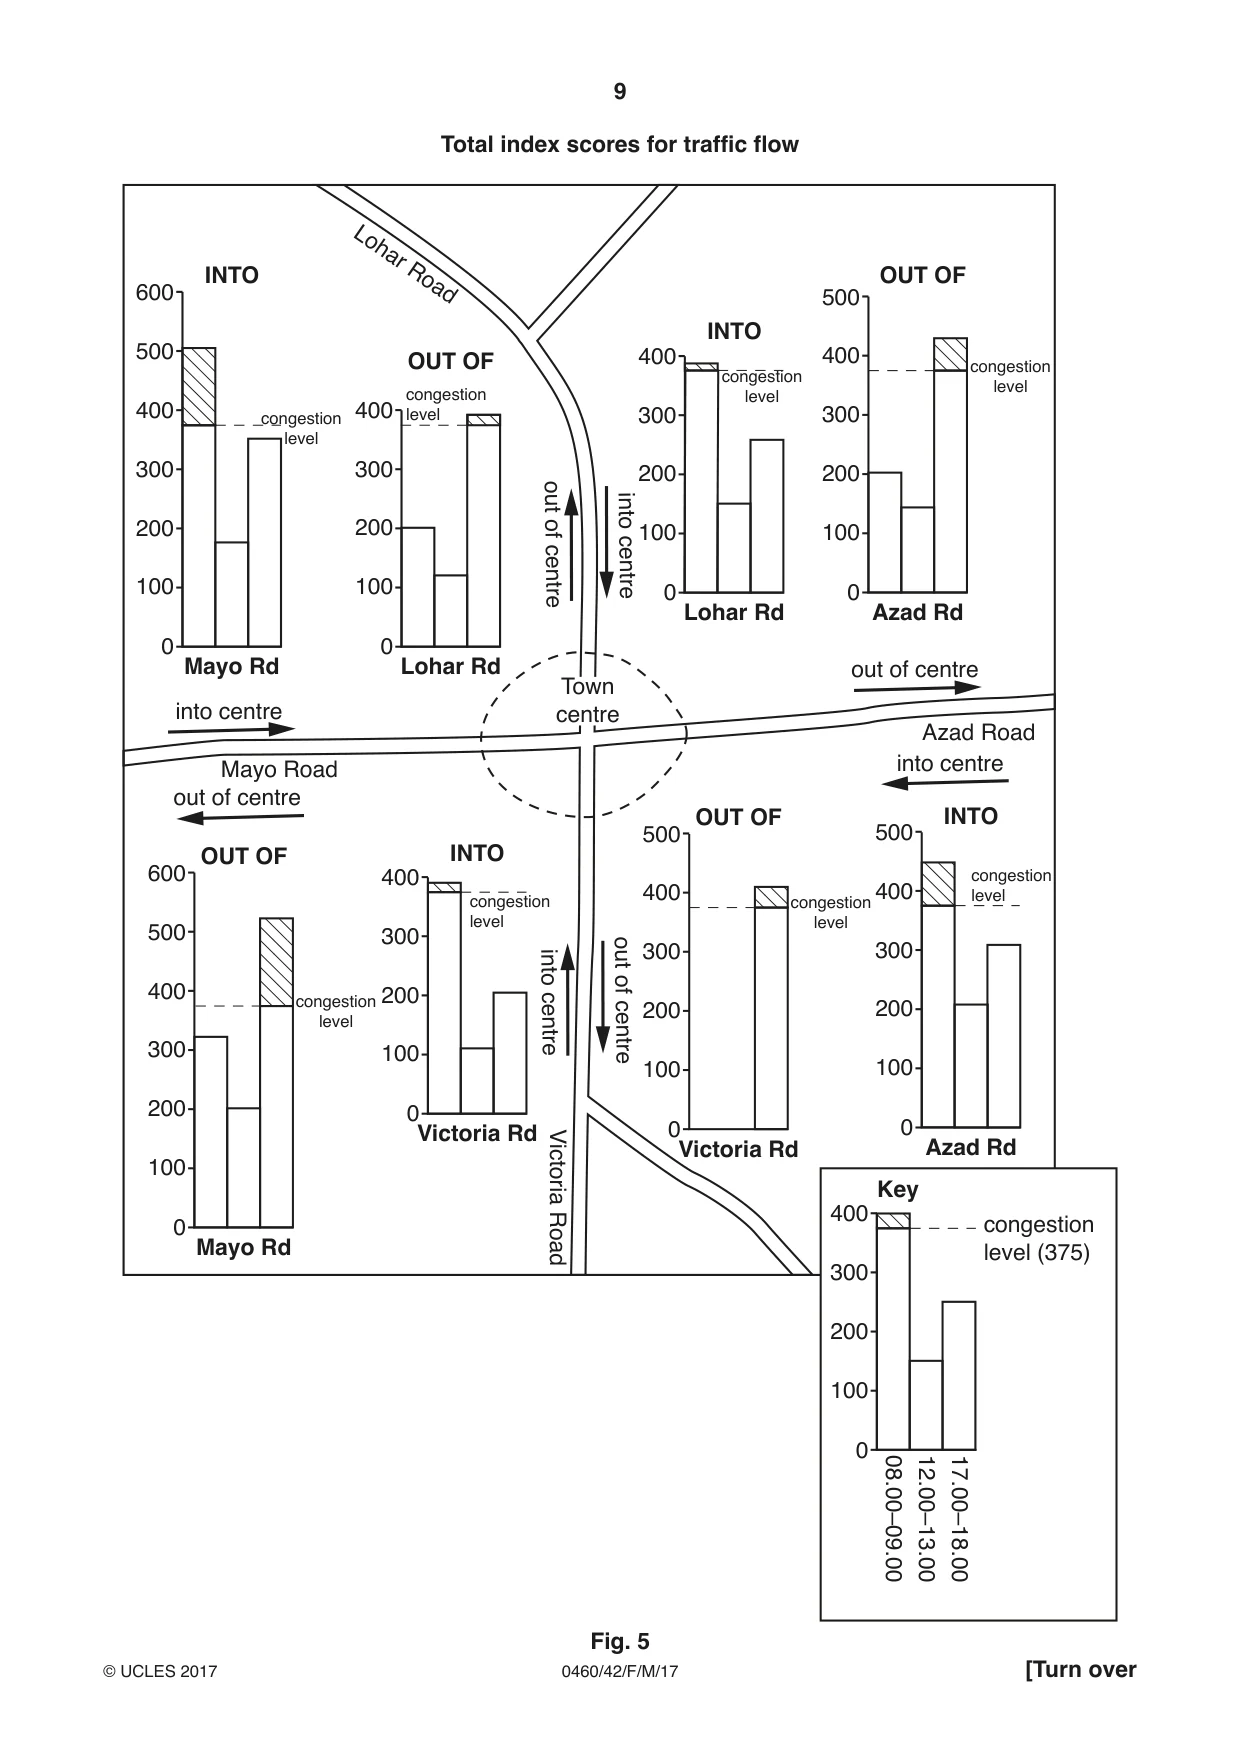
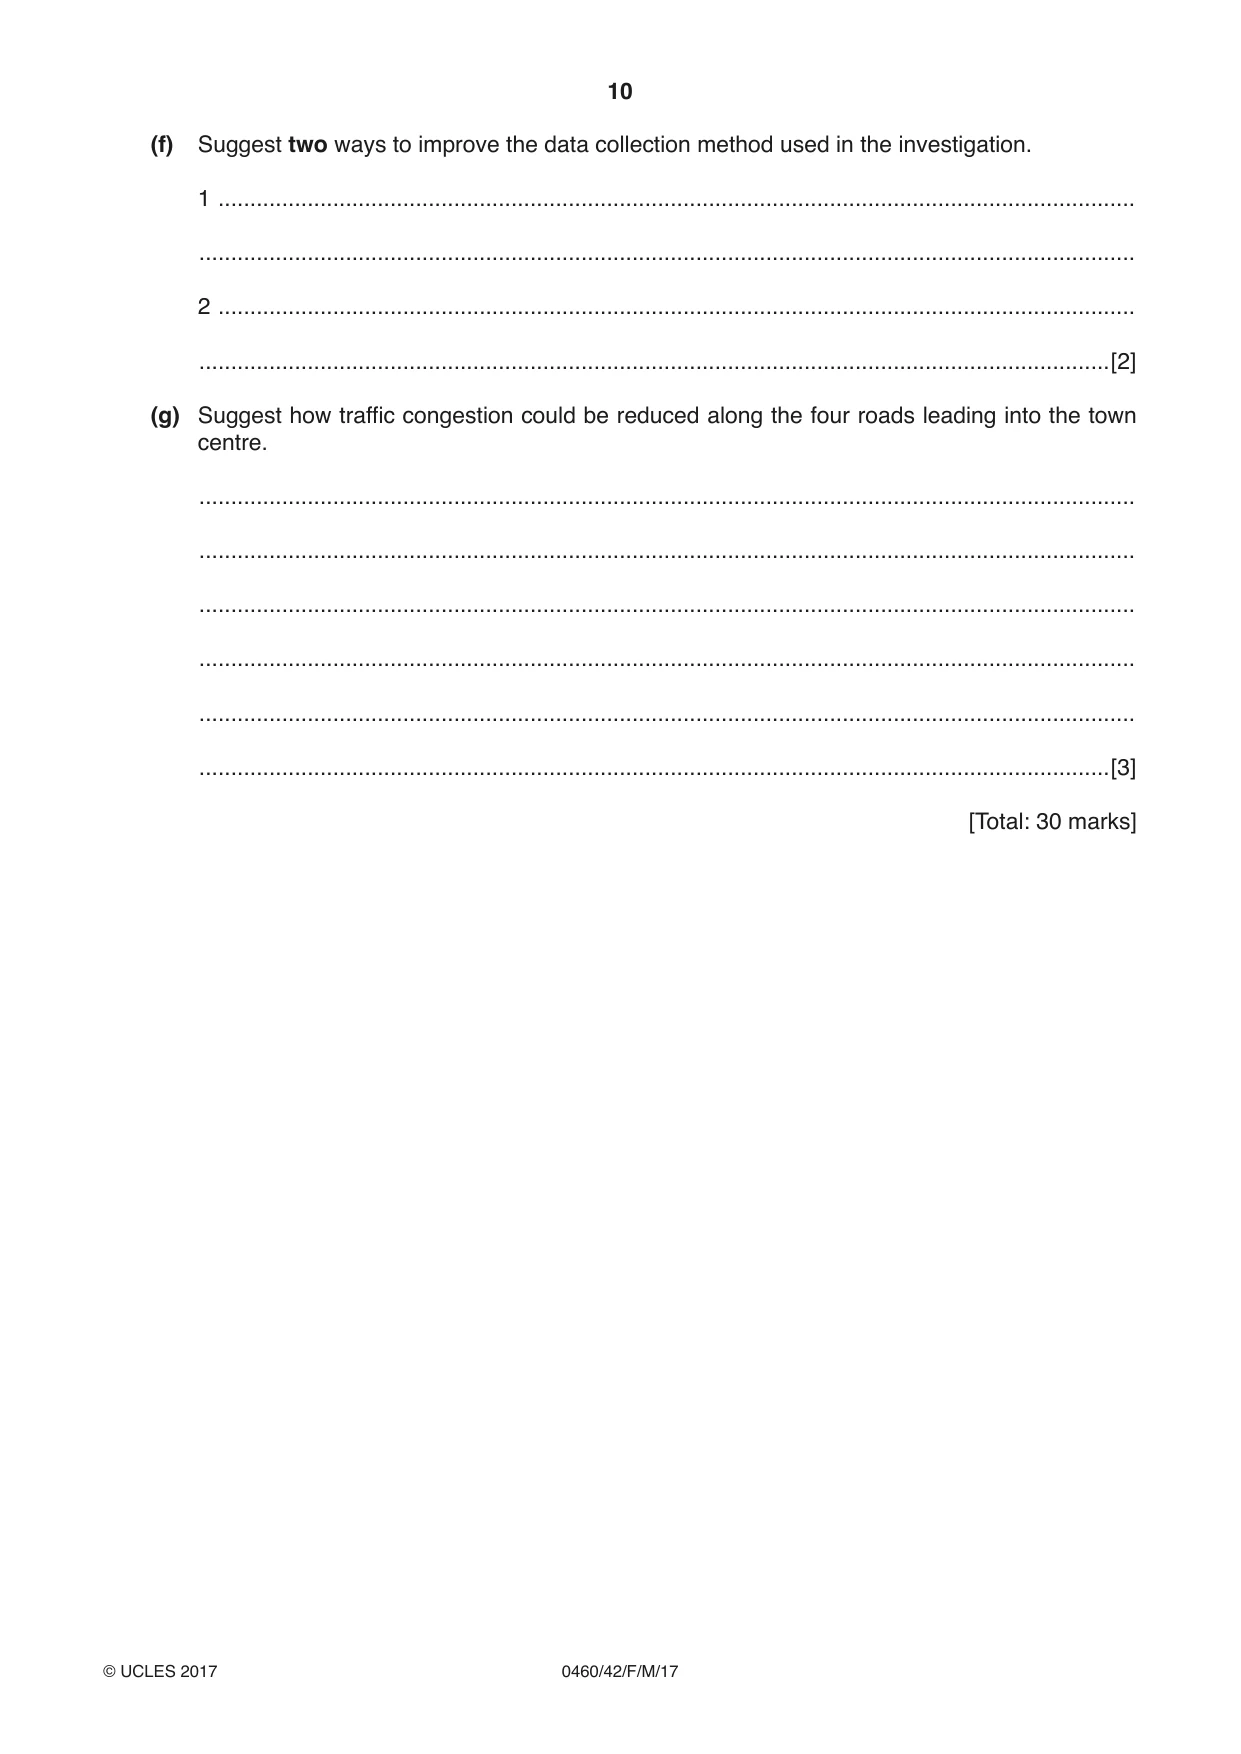
1 Students at a local secondary school investigated traffic flows on four roads going into the centre of the town where they lived. They decided to investigate the following hypotheses: Hypothesis 1: The amount of traffic on the four roads varies during the day. Hypothesis 2: Traffic congestion occurs on the four roads. Traffic congestion is the delay in traffic flow caused by too many vehicles. (a) The students organised a traffic count to test their hypotheses. Which three of the following decisions would they have made? Tick your choices in the table below. Decision Tick (3) to count every tenth vehicle that passed the survey point how long to do the traffic count for and at what time to do it the questions to include in a questionnaire for drivers the different categories of vehicles to include in the count the position on each road to do the vehicle counts to count pedestrians walking past them in one or both directions [3] (b) The recording sheet used by the students is shown in Fig. 1 (Insert). (i) Which one of the following methods would the students use to complete their recording sheet? Tick your choice in the table below. Method Tick (3) estimate measure sample tally observe [1] (ii) The students knew that traffic congestion is calculated by measuring the number of vehicles travelling along a road in one hour. Suggest two disadvantages of each traffic count being done for one hour. 1 ........................................................................................................................................ ........................................................................................................................................... 2 ........................................................................................................................................ .......................................................................................................................................[2] (c) The students did their traffic survey on the roads shown in Fig. 2 (Insert). The results of their traffic count are shown in Table 1 (Insert). (i) On which road were most vehicles counted between both 08.00–09.00 and 17.00–18.00? .......................................................................................................................................[1] (ii) Plot the results for Mayo Road going into the town centre on Fig. 3 below. [2] Results of traffic count 400 Mayo Road out 350 Azad Road out 300 Victoria Road out Lohar Road out 250 number of vehicles 200 Azad Road in Lohar Road in 150 Victoria Road in 100 50 0 08.00– 12.00– 17.00– 09.00 13.00 18.00 time of traffic count Key roads into town centre roads out of town centre Fig. 3 (iii) What conclusion would the students make about Hypothesis 1: The amount of traffic on the four roads varies during the day? Support your decision with evidence from Fig. 3 and Table 1 (Insert). ........................................................................................................................................... ........................................................................................................................................... ........................................................................................................................................... ........................................................................................................................................... ........................................................................................................................................... ........................................................................................................................................... ........................................................................................................................................... .......................................................................................................................................[4] (d) The students’ recording sheet in Fig. 1 (Insert) shows the categories of vehicles which the students counted. They used their completed recording sheets to calculate the number of vehicles in each category on the four roads. The results of these calculations are shown in Table 2 (Insert). (i) Use the results in Table 2 to complete the divided bar in Fig. 4 below to show the results for Azad Road. [3] Total number of vehicles in each category on the four roads Lohar Road 0 200 400 600 800 1000 number of vehicles Azad Road 0 200 400 600 800 1000 1200 number of vehicles Victoria Road 0 200 400 600 800 1000 number of vehicles Mayo Road 0 200 400 600 800 1000 1200 1400 number of vehicles Key bicycles / cars / vans / lorries / motor bikes taxis minibuses buses Fig. 4 (ii) Compare the number of vehicles in each category shown in Fig. 4 and Table 2. Which one of the following statements is correct? Tick your choice below. Tick (3) There are fewer vehicles in all four categories on Mayo Road than on Lohar Road. There is the same number of vehicles in all four categories on Mayo Road and Lohar Road. There are more vehicles in all four categories on Mayo Road than on Lohar Road. [1] (iii) Use Fig. 4 and Table 2 to compare the number of vehicles in each category between Victoria Road and Lohar Road. ........................................................................................................................................... ........................................................................................................................................... ........................................................................................................................................... .......................................................................................................................................[2] (e) To investigate Hypothesis 2: Traffic congestion occurs on the four roads, the students used their results to calculate an index of traffic flow. This index allocates more points to vehicles which cause more congestion, as shown in Table 3 below. Table 3 Index of traffic flow vehicle category number of points allocated per vehicle bicycles / motor bikes 0.5 cars / taxis 1.0 vans / minibuses 2.0 lorries / buses 3.0 The results of using this index between 08.00 and 09.00 on Lohar Road going into the town centre are shown in Table 4 below. Table 4 Index of traffic flow for Lohar Road going into the town centre between 08:00 and 09:00 vehicle category bicycles / cars / taxis vans / lorries / buses motor bikes minibuses number counted 8 190 60 25 points per vehicle 0.5 1.0 2.0 3.0 Index score 4 190 120 75 Total index score between 08.00 and 09.00 on Lohar Road going into the town centre = 389 (i) Complete the index score for Lohar Road going out of the town centre between 17.00 and 18.00 in Table 5 below. [1] Table 5 Index of traffic flow for Lohar Road going out of the town centre vehicle category bicycles / cars / taxis vans / lorries / buses motor bikes minibuses number counted 10 202 38 36 points per vehicle 0.5 1.0 2.0 3.0 Index score 5 202 76 Total index score between 17.00 and 18.00 on Lohar Road going out of the town centre = 391 TURN PAGE FOR QUESTION 1 (e)(ii) (ii) The results of the traffic flow calculations for all the survey sites are shown in Table 6 (Insert). Plot the total index scores at 08.00–09.00 and 12.00–13.00 on Victoria Road going out of the town centre on Fig. 5 opposite. [2] (iii) The students researched the congestion level (when delays are likely to occur) and they found out that congestion occurred when the index of traffic flow reached 375. The congestion level at each counting site is shown on Fig. 5. Which one of the following conclusions about Hypothesis 2: Traffic congestion occurs on the four roads is correct? Tick your choice in the table below. Conclusion Tick (3) Traffic congestion occurs at all times on the four roads Traffic congestion occurs twice in the day on the four roads Traffic congestion does not occur at any time on the four roads Support your conclusion with evidence from Fig. 5 and Table 6 (Insert). ........................................................................................................................................... ........................................................................................................................................... ........................................................................................................................................... .......................................................................................................................................[3] Total index scores for traffic flow Lohar INTO OUT OF600 Road 500 INTO 500 OUT OF 400 400 congestion congestion level congestion level 400 congestion 400 level 300 300 level 300 300 200 200 out into of200 200 100 100 centre100 100 centre 0 0 Lohar Rd Azad Rd 0 0 Mayo Rd Lohar Rd out of centre Town into centre centre Azad Road into centre Mayo Road out of centre OUT OF INTO 500 500 OUT OF INTO congestion 600 400 level congestion 400 congestion 400 500 300 level level out 300 300 into 400 congestion 200 of level centre 200 200 centre 300 100 100 100 200 0 Victoria Rd 0 0 Victoria Rd Azad Rd 100 Victoria Key 400 0 congestion Mayo Rd Road level (375) 300 200 100 0 08.00–09.0012.00–13.0017.00–18.00 (f) Suggest two ways to improve the data collection method used in the investigation. 1 ................................................................................................................................................ ................................................................................................................................................... 2 ................................................................................................................................................ ...............................................................................................................................................[2] (g) Suggest how traffic congestion could be reduced along the four roads leading into the town centre. ................................................................................................................................................... ................................................................................................................................................... ................................................................................................................................................... ................................................................................................................................................... ................................................................................................................................................... ...............................................................................................................................................[3] [Total: 30 marks]
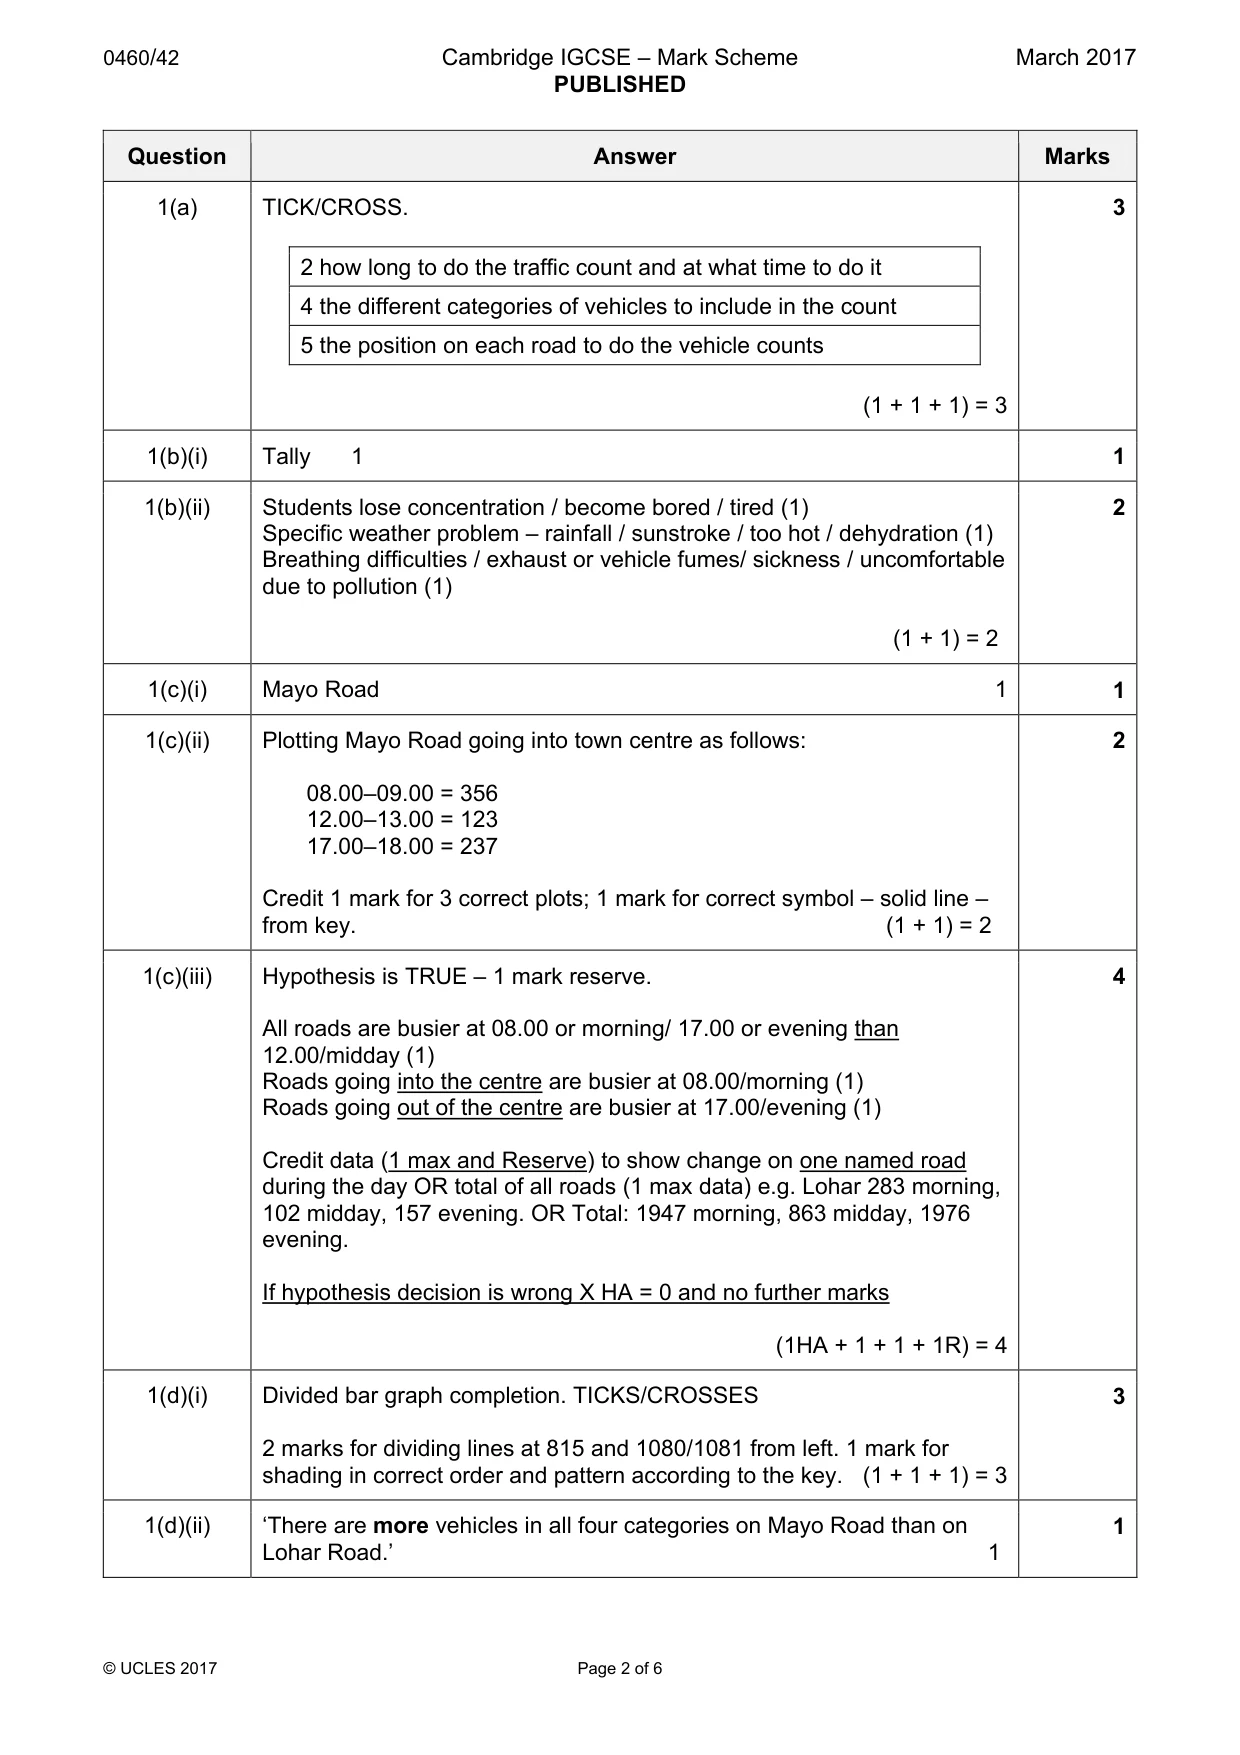
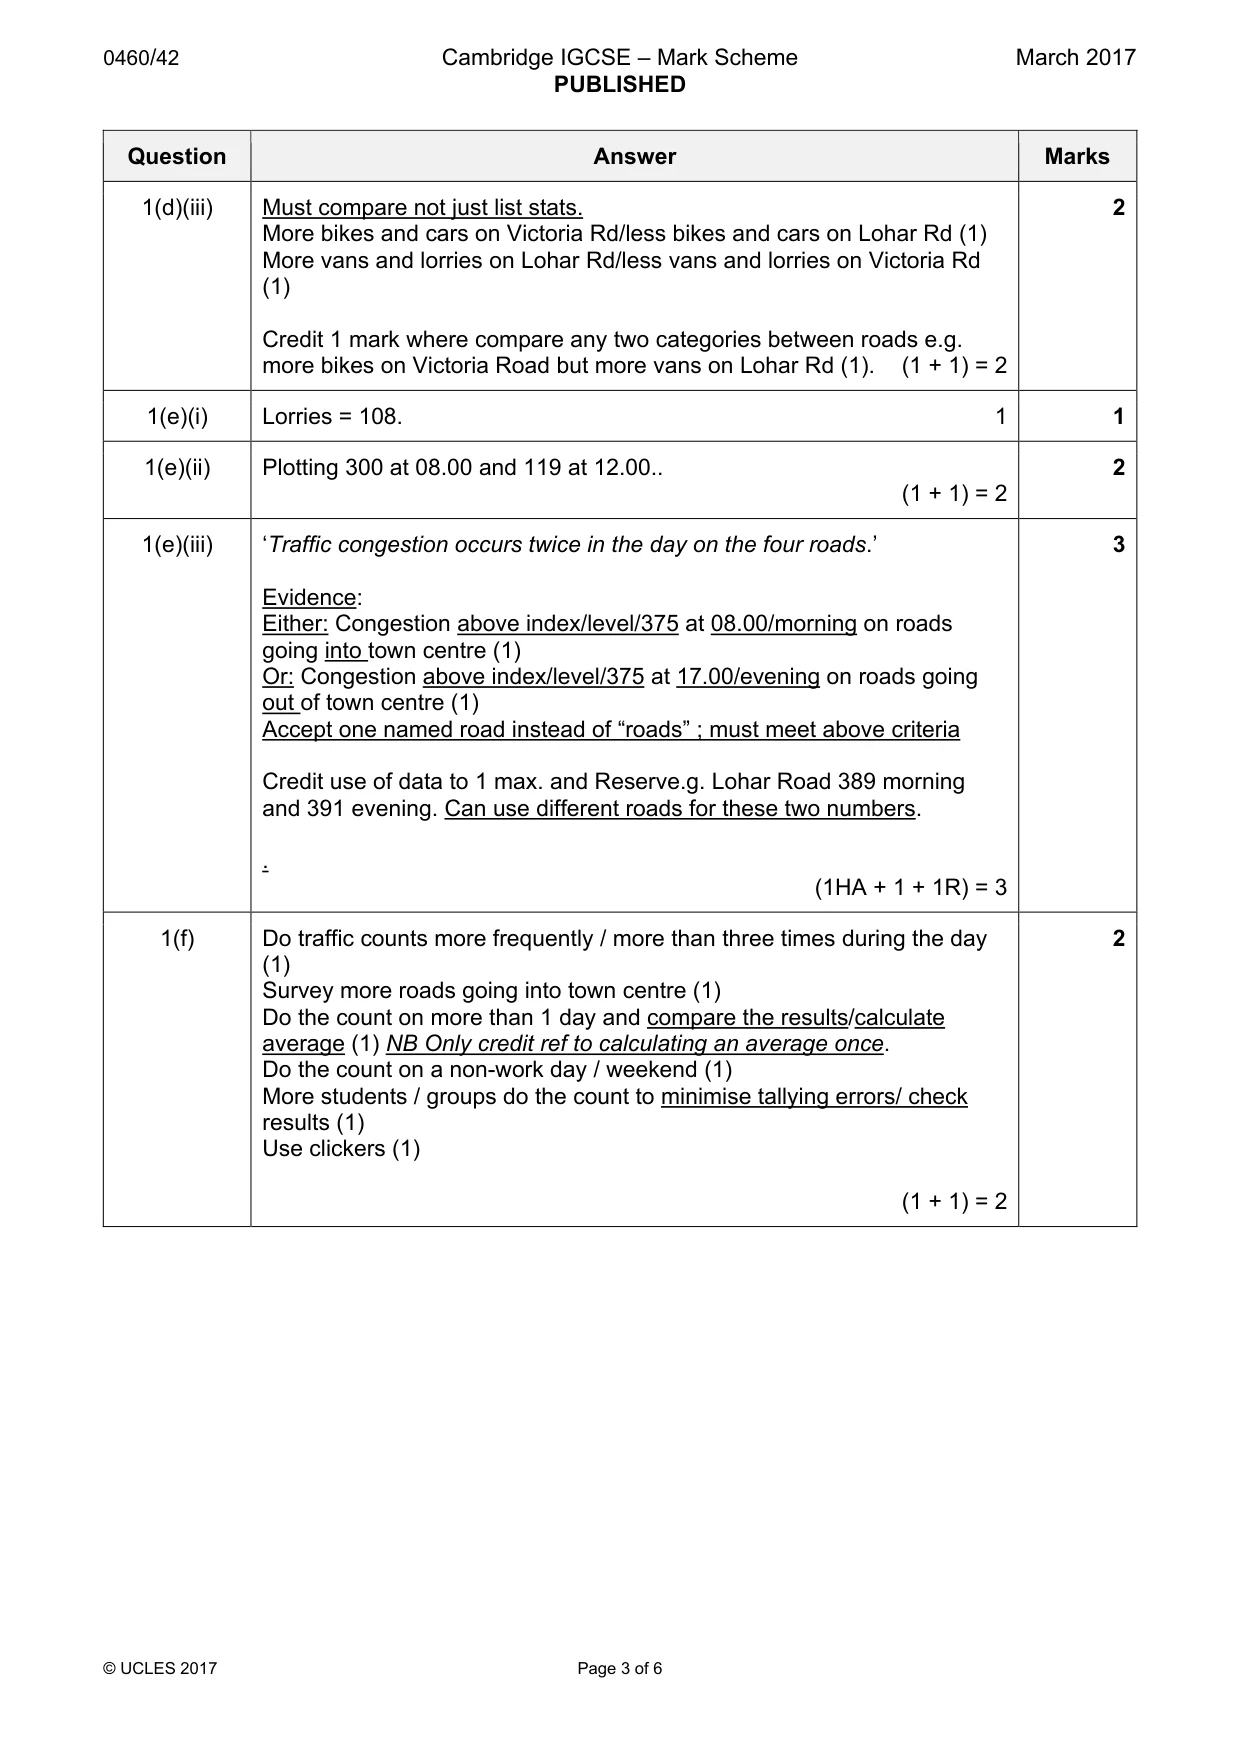
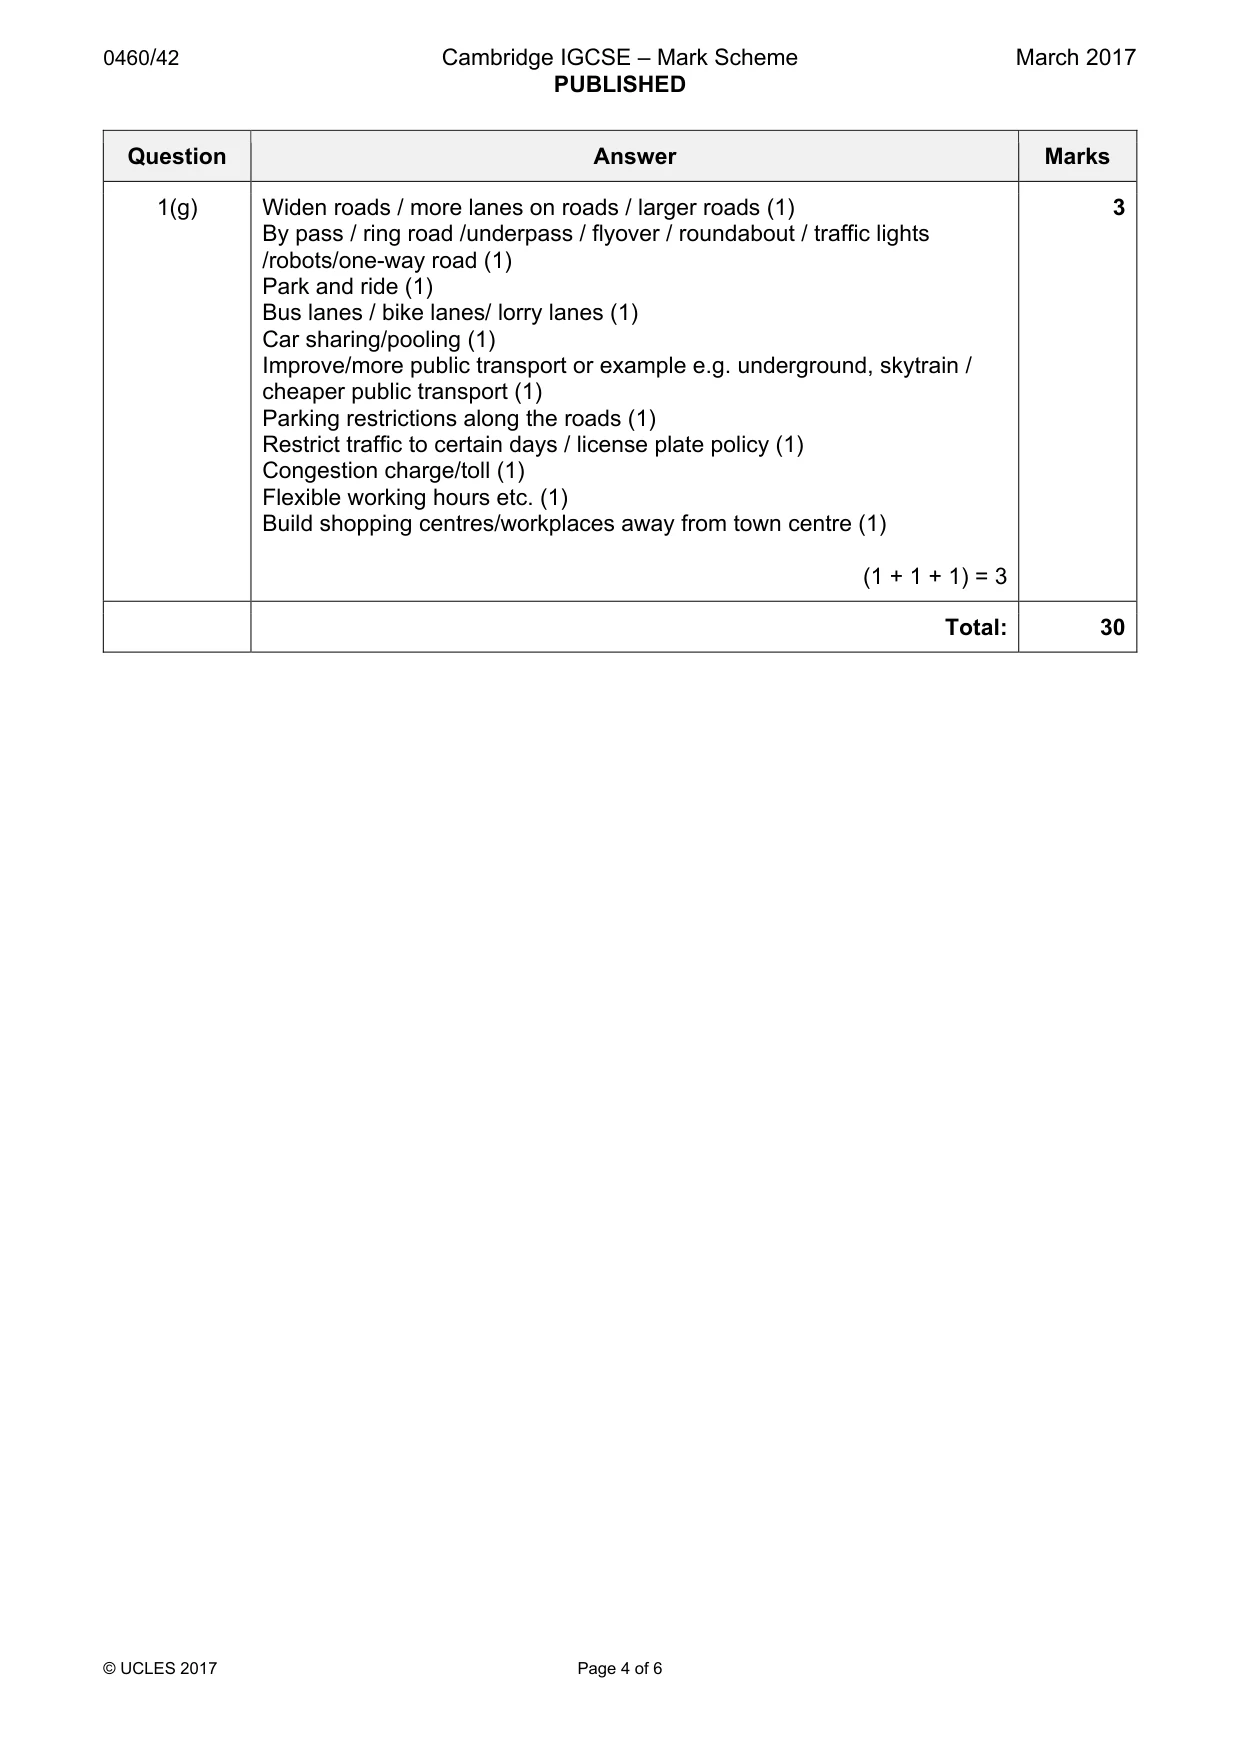
Mark scheme: Question Answer Marks 1(a) TICK/CROSS. 3 2 how long to do the traffic count and at what time to do it 4 the different categories of vehicles to include in the count 5 the position on each road to do the vehicle counts (1 + 1 + 1) = 3 1(b)(i) Tally 1 1 1(b)(ii) Students lose concentration / become bored / tired (1) 2 Specific weather problem – rainfall / sunstroke / too hot / dehydration (1) Breathing difficulties / exhaust or vehicle fumes/ sickness / uncomfortable due to pollution (1) (1 + 1) = 2 1(c)(i) Mayo Road 1 1 1(c)(ii) Plotting Mayo Road going into town centre as follows: 2 08.00–09.00 = 356 12.00–13.00 = 123 17.00–18.00 = 237 Credit 1 mark for 3 correct plots; 1 mark for correct symbol – solid line – from key. (1 + 1) = 2 1(c)(iii) Hypothesis is TRUE – 1 mark reserve. 4 All roads are busier at 08.00 or morning/ 17.00 or evening than 12.00/midday (1) Roads going into the centre are busier at 08.00/morning (1) Roads going out of the centre are busier at 17.00/evening (1) Credit data (1 max and Reserve) to show change on one named road during the day OR total of all roads (1 max data) e.g. Lohar 283 morning, 102 midday, 157 evening. OR Total: 1947 morning, 863 midday, 1976 evening. If hypothesis decision is wrong X HA = 0 and no further marks (1HA + 1 + 1 + 1R) = 4 1(d)(i) Divided bar graph completion. TICKS/CROSSES 3 2 marks for dividing lines at 815 and 1080/1081 from left. 1 mark for shading in correct order and pattern according to the key. (1 + 1 + 1) = 3 1(d)(ii) ‘There are more vehicles in all four categories on Mayo Road than on 1 Lohar Road.’ 1 1(d)(iii) Must compare not just list stats. 2 More bikes and cars on Victoria Rd/less bikes and cars on Lohar Rd (1) More vans and lorries on Lohar Rd/less vans and lorries on Victoria Rd (1) Credit 1 mark where compare any two categories between roads e.g. more bikes on Victoria Road but more vans on Lohar Rd (1). (1 + 1) = 2 1(e)(i) Lorries = 108. 1 1 1(e)(ii) Plotting 300 at 08.00 and 119 at 12.00.. 2 (1 + 1) = 2 1(e)(iii) ‘Traffic congestion occurs twice in the day on the four roads.’ 3 Evidence: Either: Congestion above index/level/375 at 08.00/morning on roads going into town centre (1) Or: Congestion above index/level/375 at 17.00/evening on roads going out of town centre (1) Accept one named road instead of “roads” ; must meet above criteria Credit use of data to 1 max. and Reserve.g. Lohar Road 389 morning and 391 evening. Can use different roads for these two numbers. . (1HA + 1 + 1R) = 3 1(f) Do traffic counts more frequently / more than three times during the day 2 (1) Survey more roads going into town centre (1) Do the count on more than 1 day and compare the results/calculate average (1) NB Only credit ref to calculating an average once. Do the count on a non-work day / weekend (1) More students / groups do the count to minimise tallying errors/ check results (1) Use clickers (1) (1 + 1) = 2 1(g) Widen roads / more lanes on roads / larger roads (1) 3 By pass / ring road /underpass / flyover / roundabout / traffic lights /robots/one-way road (1) Park and ride (1) Bus lanes / bike lanes/ lorry lanes (1) Car sharing/pooling (1) Improve/more public transport or example e.g. underground, skytrain / cheaper public transport (1) Parking restrictions along the roads (1) Restrict traffic to certain days / license plate policy (1) Congestion charge/toll (1) Flexible working hours etc. (1) Build shopping centres/workplaces away from town centre (1) (1 + 1 + 1) = 3 Total: 30
Q2 · Geography students at schools in Singapore and Albany (USA) wanted to compare the weather…
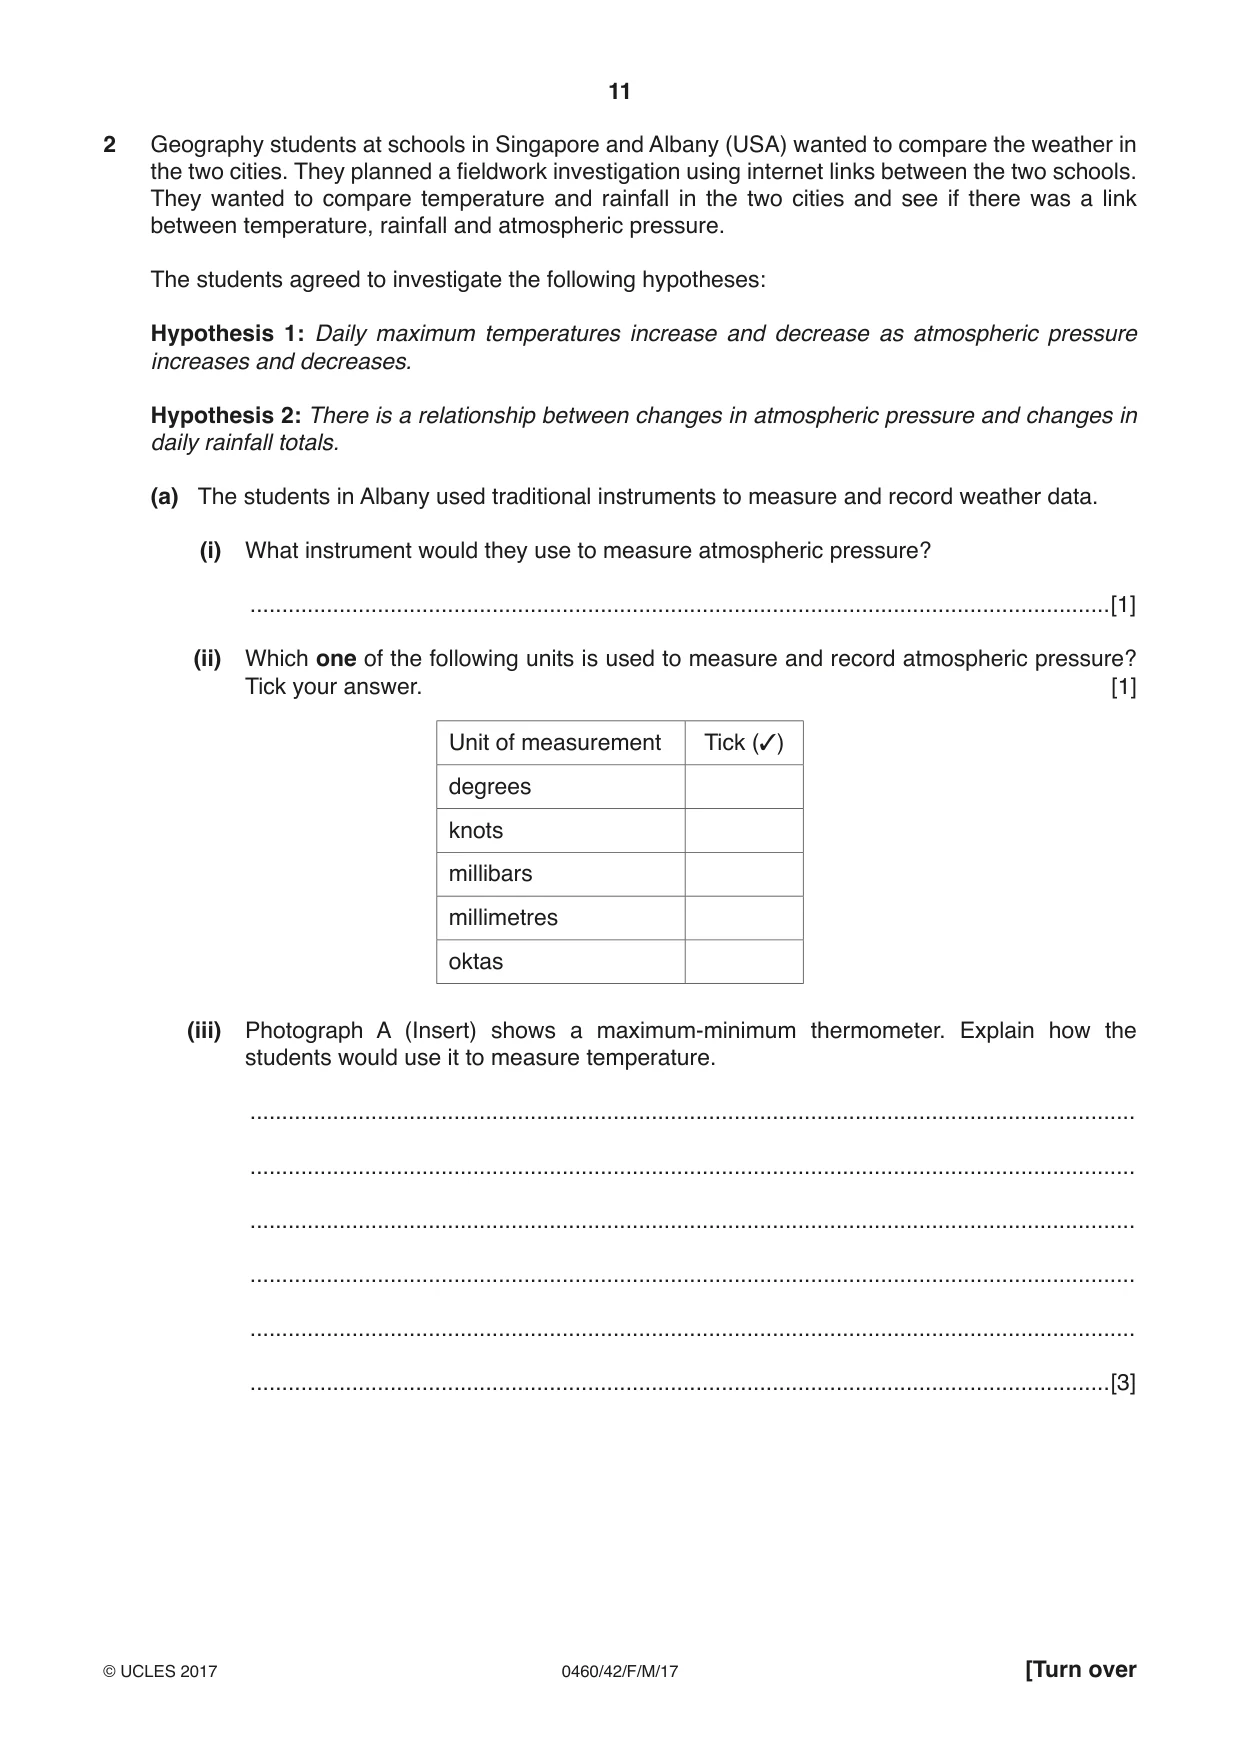
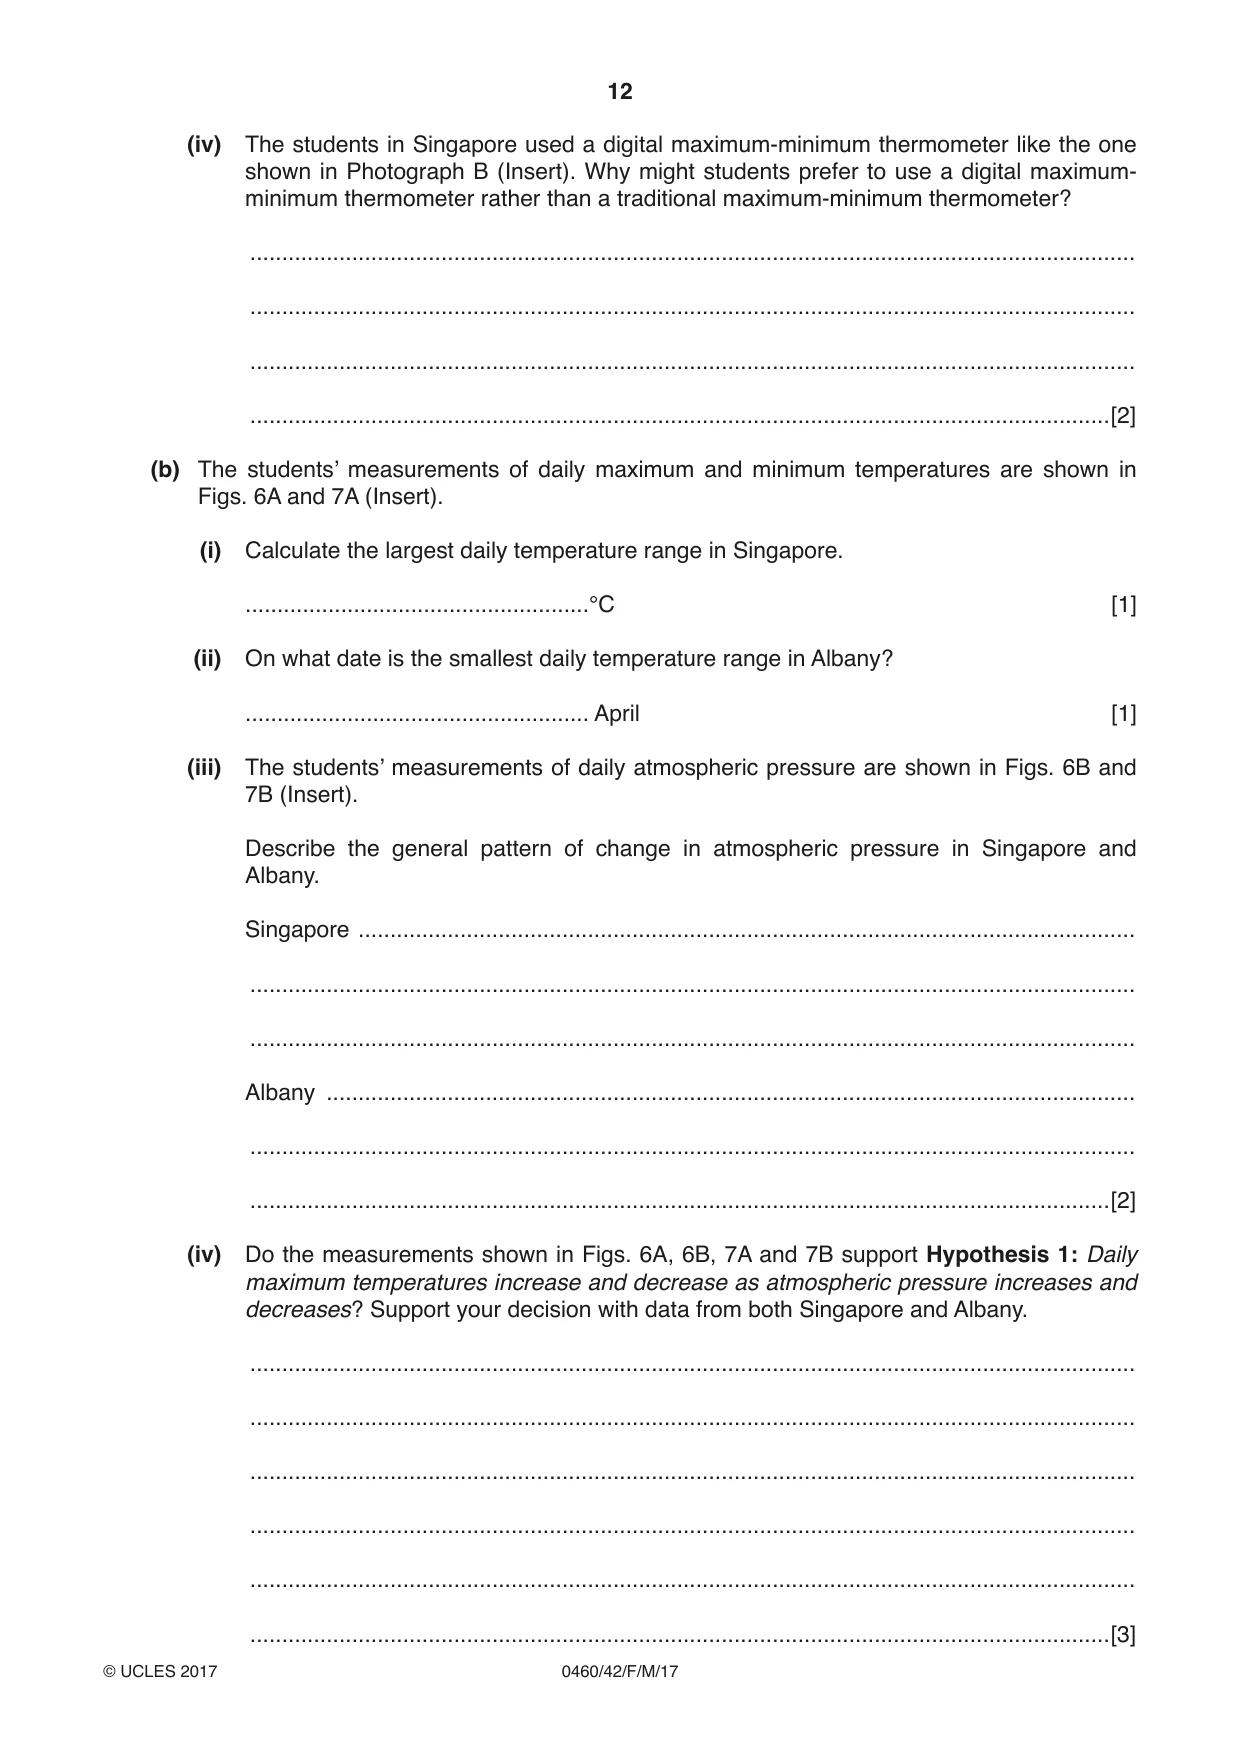
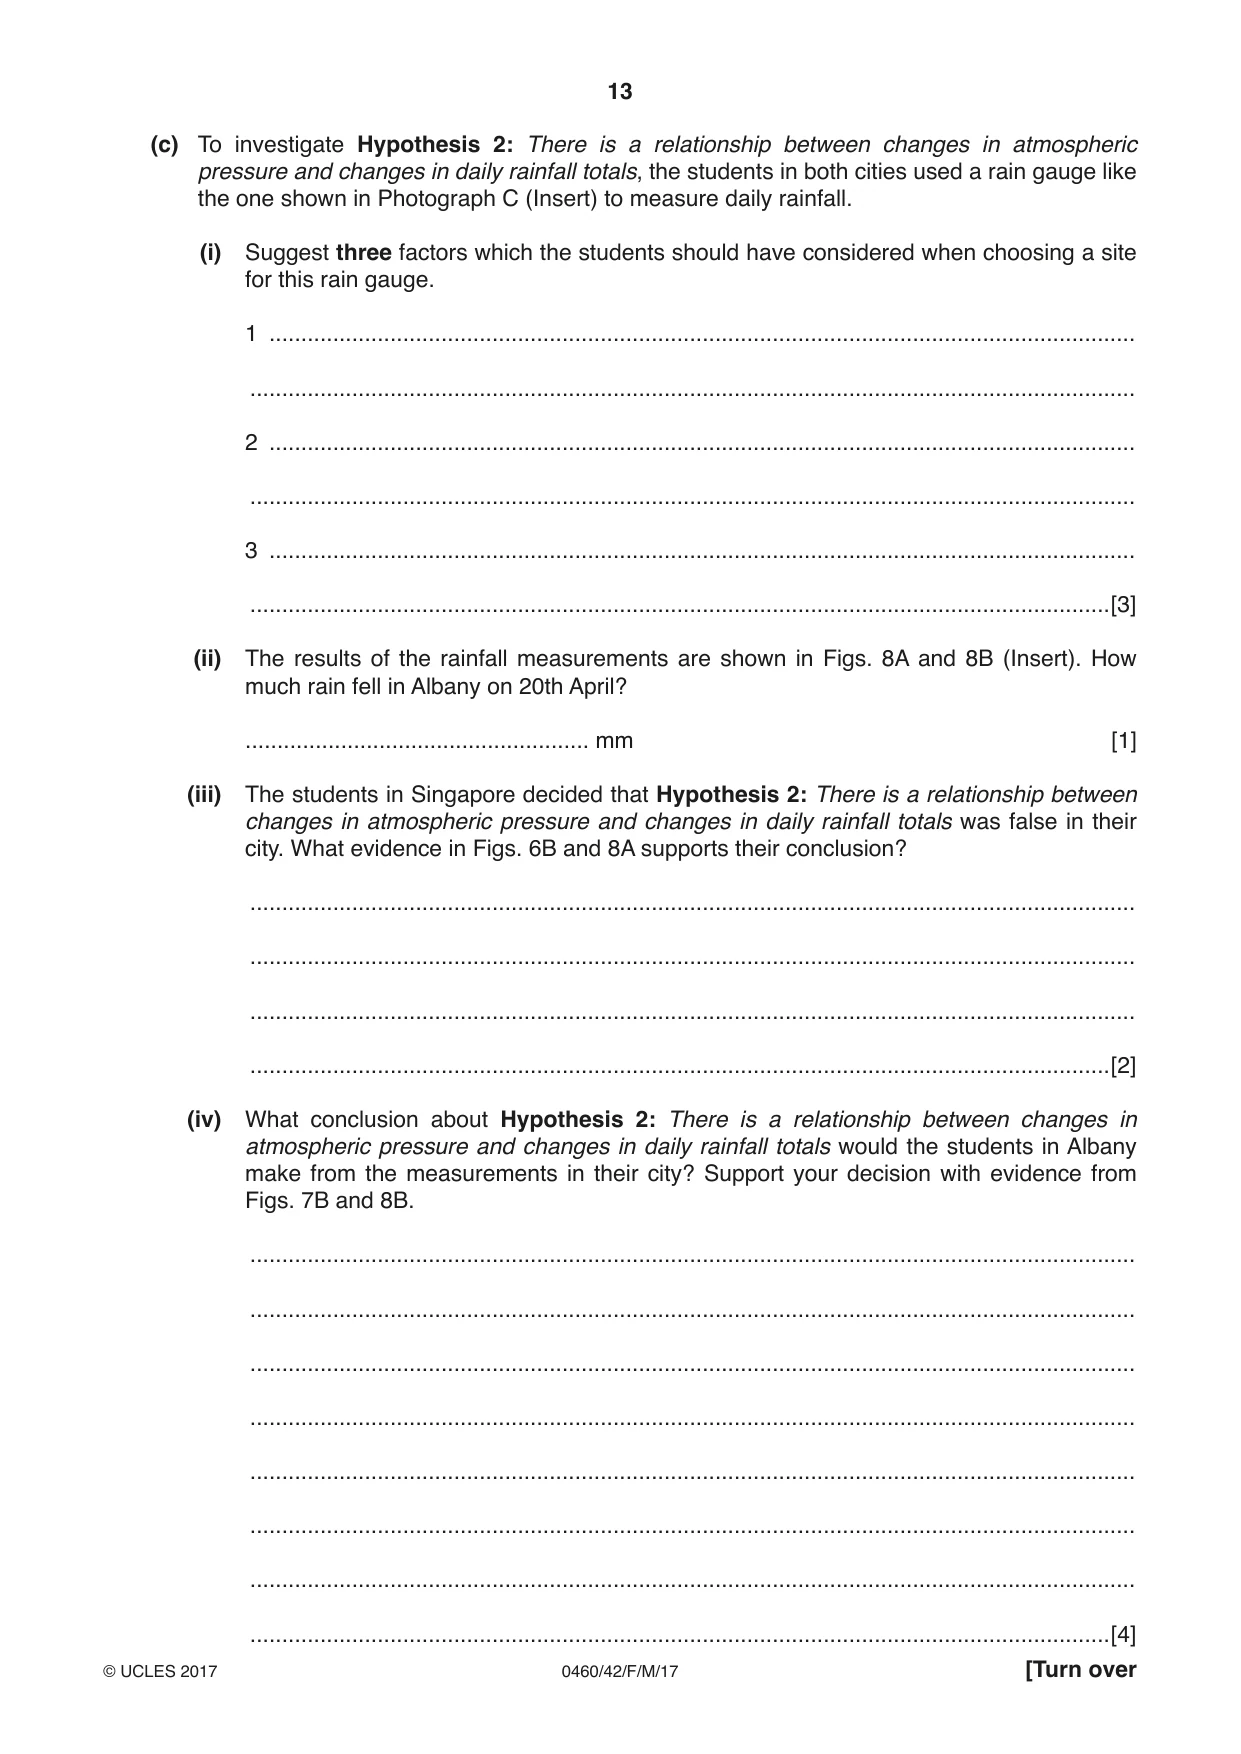
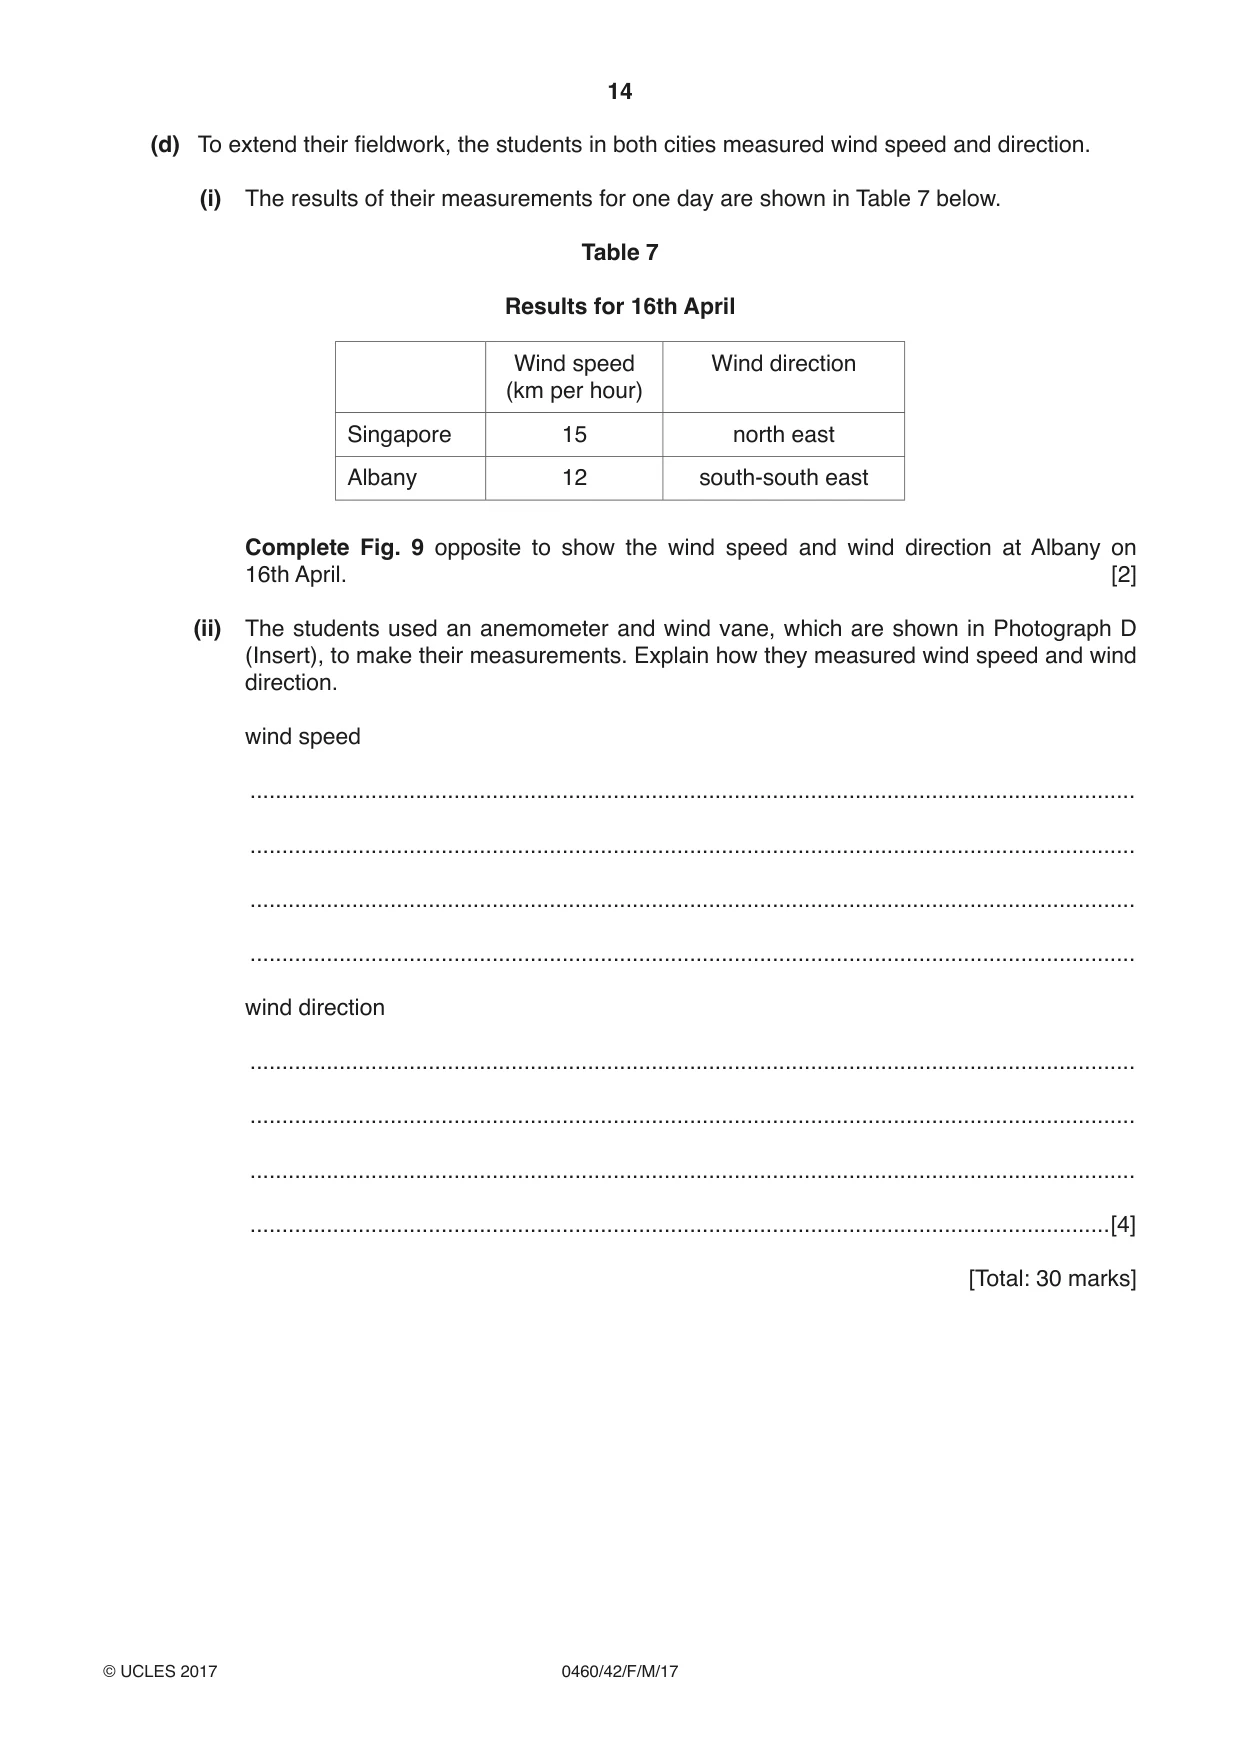
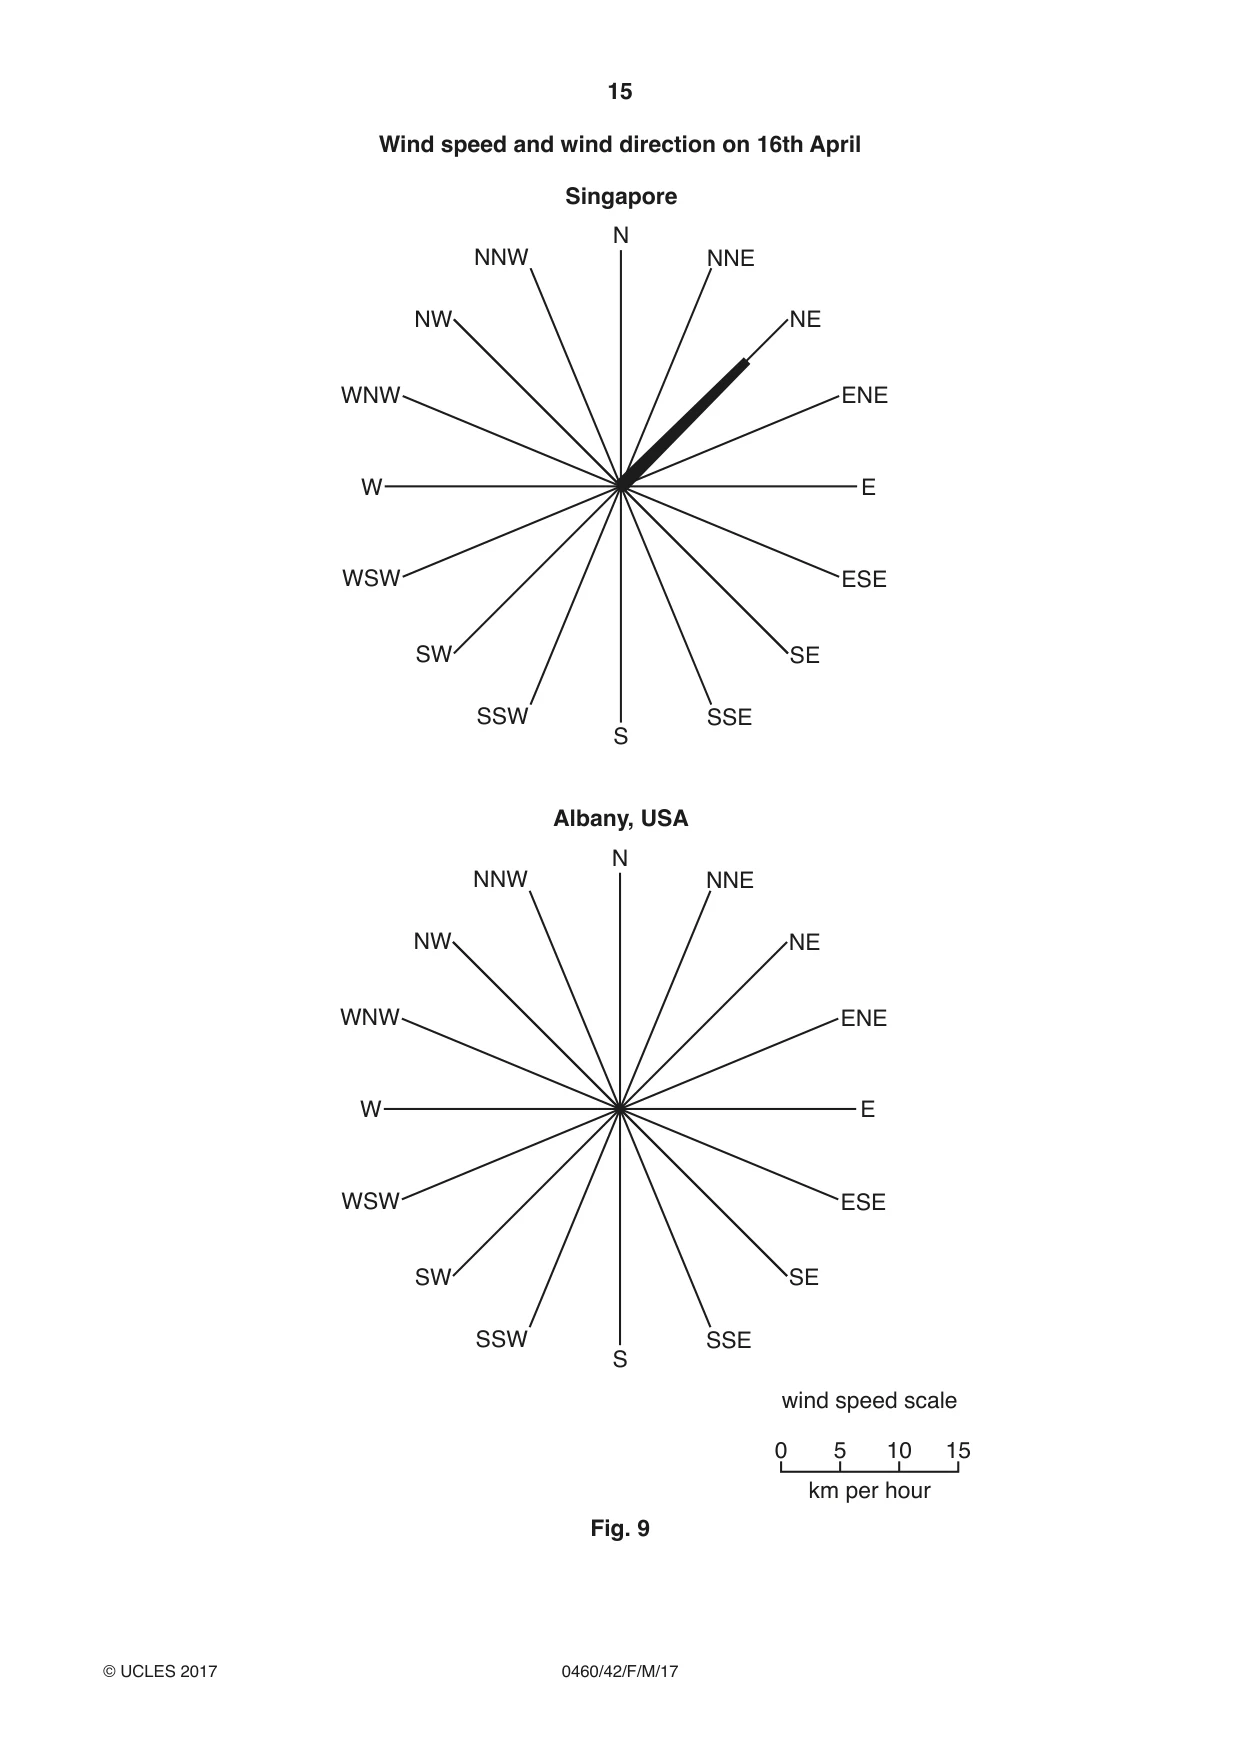
2 Geography students at schools in Singapore and Albany (USA) wanted to compare the weather in the two cities. They planned a fieldwork investigation using internet links between the two schools. They wanted to compare temperature and rainfall in the two cities and see if there was a link between temperature, rainfall and atmospheric pressure. The students agreed to investigate the following hypotheses: Hypothesis 1: Daily maximum temperatures increase and decrease as atmospheric pressure increases and decreases. Hypothesis 2: There is a relationship between changes in atmospheric pressure and changes in daily rainfall totals. (a) The students in Albany used traditional instruments to measure and record weather data. (i) What instrument would they use to measure atmospheric pressure? .......................................................................................................................................[1] (ii) Which one of the following units is used to measure and record atmospheric pressure? Tick your answer. [1] Unit of measurement Tick (3) degrees knots millibars millimetres oktas (iii) Photograph A (Insert) shows a maximum-minimum thermometer. Explain how the students would use it to measure temperature. ........................................................................................................................................... ........................................................................................................................................... ........................................................................................................................................... ........................................................................................................................................... ........................................................................................................................................... .......................................................................................................................................[3] (iv) The students in Singapore used a digital maximum-minimum thermometer like the one shown in Photograph B (Insert). Why might students prefer to use a digital maximum- minimum thermometer rather than a traditional maximum-minimum thermometer? ........................................................................................................................................... ........................................................................................................................................... ........................................................................................................................................... .......................................................................................................................................[2] (b) The students’ measurements of daily maximum and minimum temperatures are shown in Figs. 6A and 7A (Insert). (i) Calculate the largest daily temperature range in Singapore. ......................................................°C [1] (ii) On what date is the smallest daily temperature range in Albany? ...................................................... April [1] (iii) The students’ measurements of daily atmospheric pressure are shown in Figs. 6B and 7B (Insert). Describe the general pattern of change in atmospheric pressure in Singapore and Albany. Singapore .......................................................................................................................... ........................................................................................................................................... ........................................................................................................................................... Albany ............................................................................................................................... ........................................................................................................................................... .......................................................................................................................................[2] (iv) Do the measurements shown in Figs. 6A, 6B, 7A and 7B support Hypothesis 1: Daily maximum temperatures increase and decrease as atmospheric pressure increases and decreases? Support your decision with data from both Singapore and Albany. ........................................................................................................................................... ........................................................................................................................................... ........................................................................................................................................... ........................................................................................................................................... ........................................................................................................................................... .......................................................................................................................................[3] (c) To investigate Hypothesis 2: There is a relationship between changes in atmospheric pressure and changes in daily rainfall totals, the students in both cities used a rain gauge like the one shown in Photograph C (Insert) to measure daily rainfall. (i) Suggest three factors which the students should have considered when choosing a site for this rain gauge. 1 ........................................................................................................................................ ........................................................................................................................................... 2 ........................................................................................................................................ ........................................................................................................................................... 3 ........................................................................................................................................ .......................................................................................................................................[3] (ii) The results of the rainfall measurements are shown in Figs. 8A and 8B (Insert). How much rain fell in Albany on 20th April? ...................................................... mm [1] (iii) The students in Singapore decided that Hypothesis 2: There is a relationship between changes in atmospheric pressure and changes in daily rainfall totals was false in their city. What evidence in Figs. 6B and 8A supports their conclusion? ........................................................................................................................................... ........................................................................................................................................... ........................................................................................................................................... .......................................................................................................................................[2] (iv) What conclusion about Hypothesis 2: There is a relationship between changes in atmospheric pressure and changes in daily rainfall totals would the students in Albany make from the measurements in their city? Support your decision with evidence from Figs. 7B and 8B. ........................................................................................................................................... ........................................................................................................................................... ........................................................................................................................................... ........................................................................................................................................... ........................................................................................................................................... ........................................................................................................................................... ...........................................................................................................................................
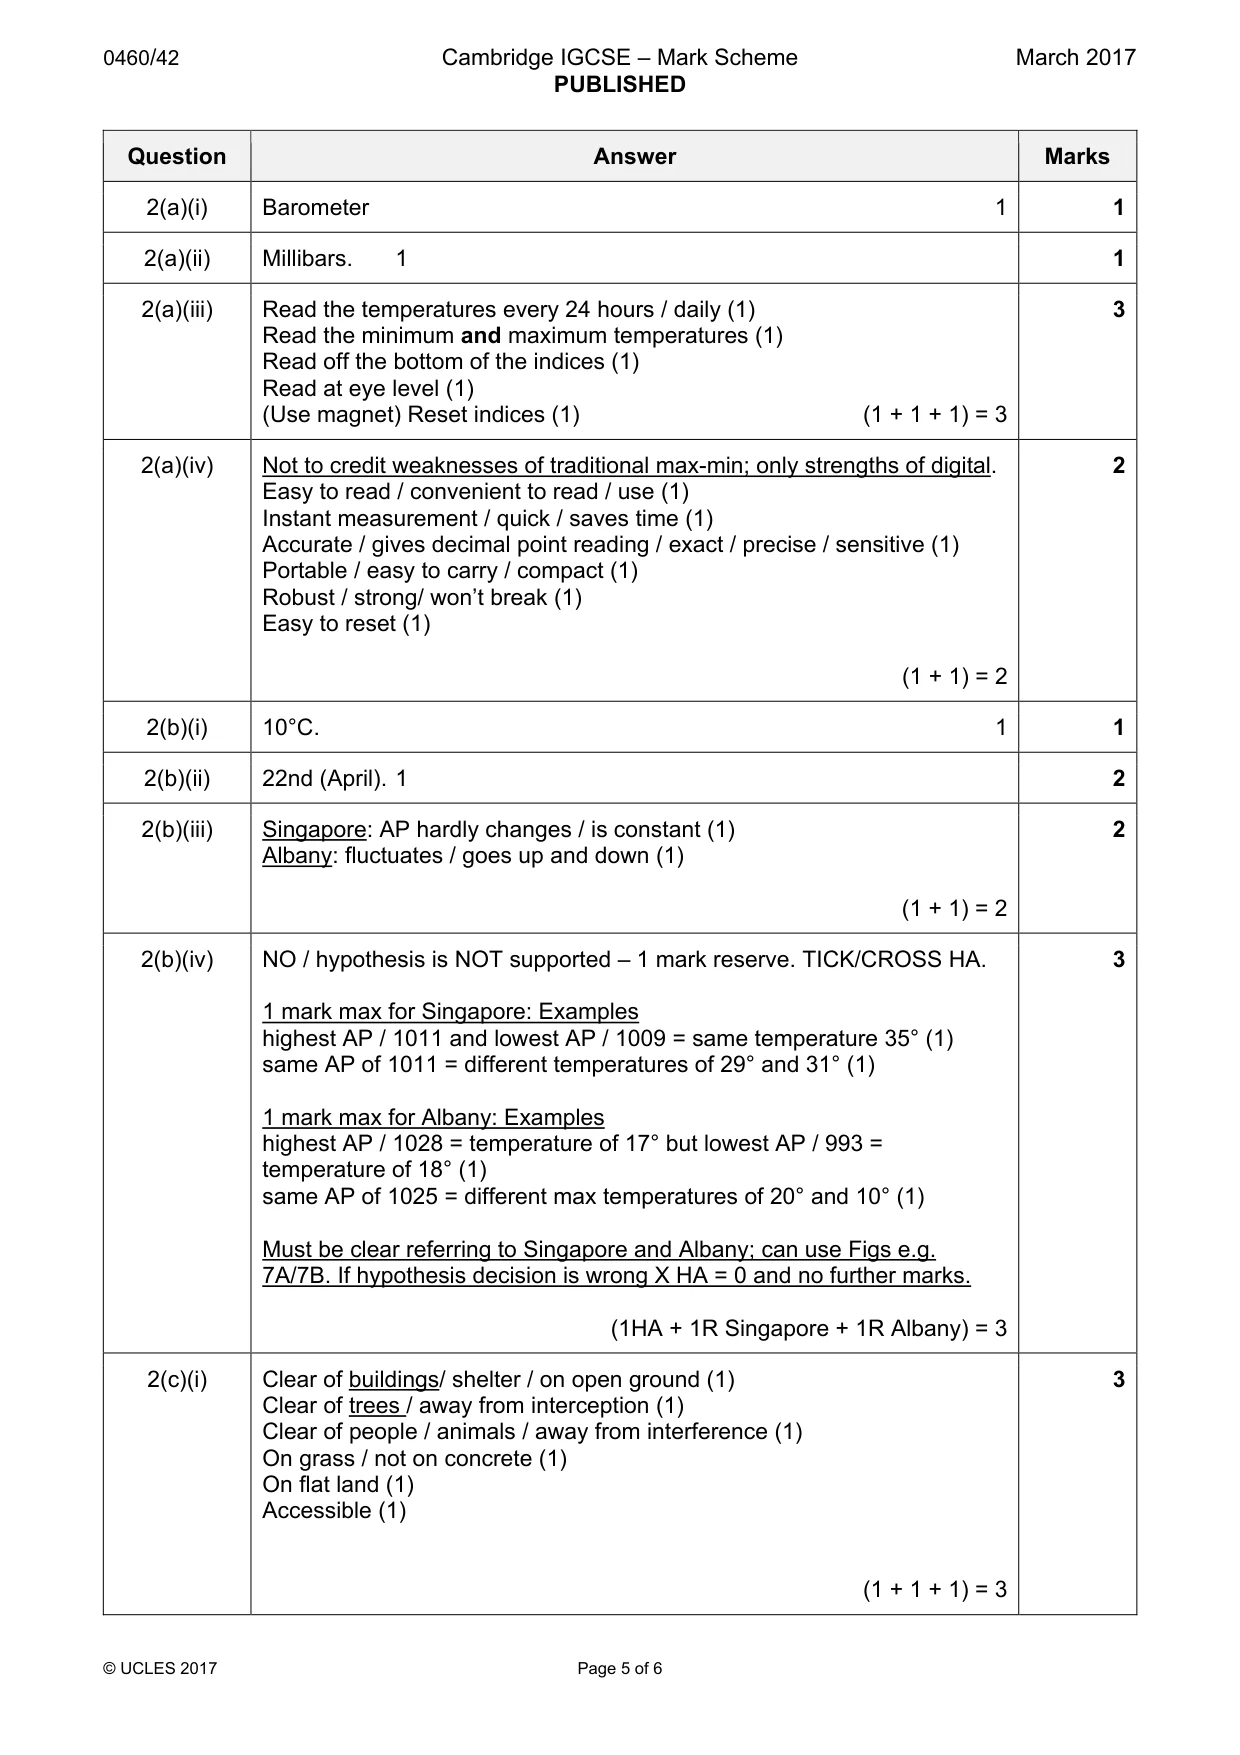
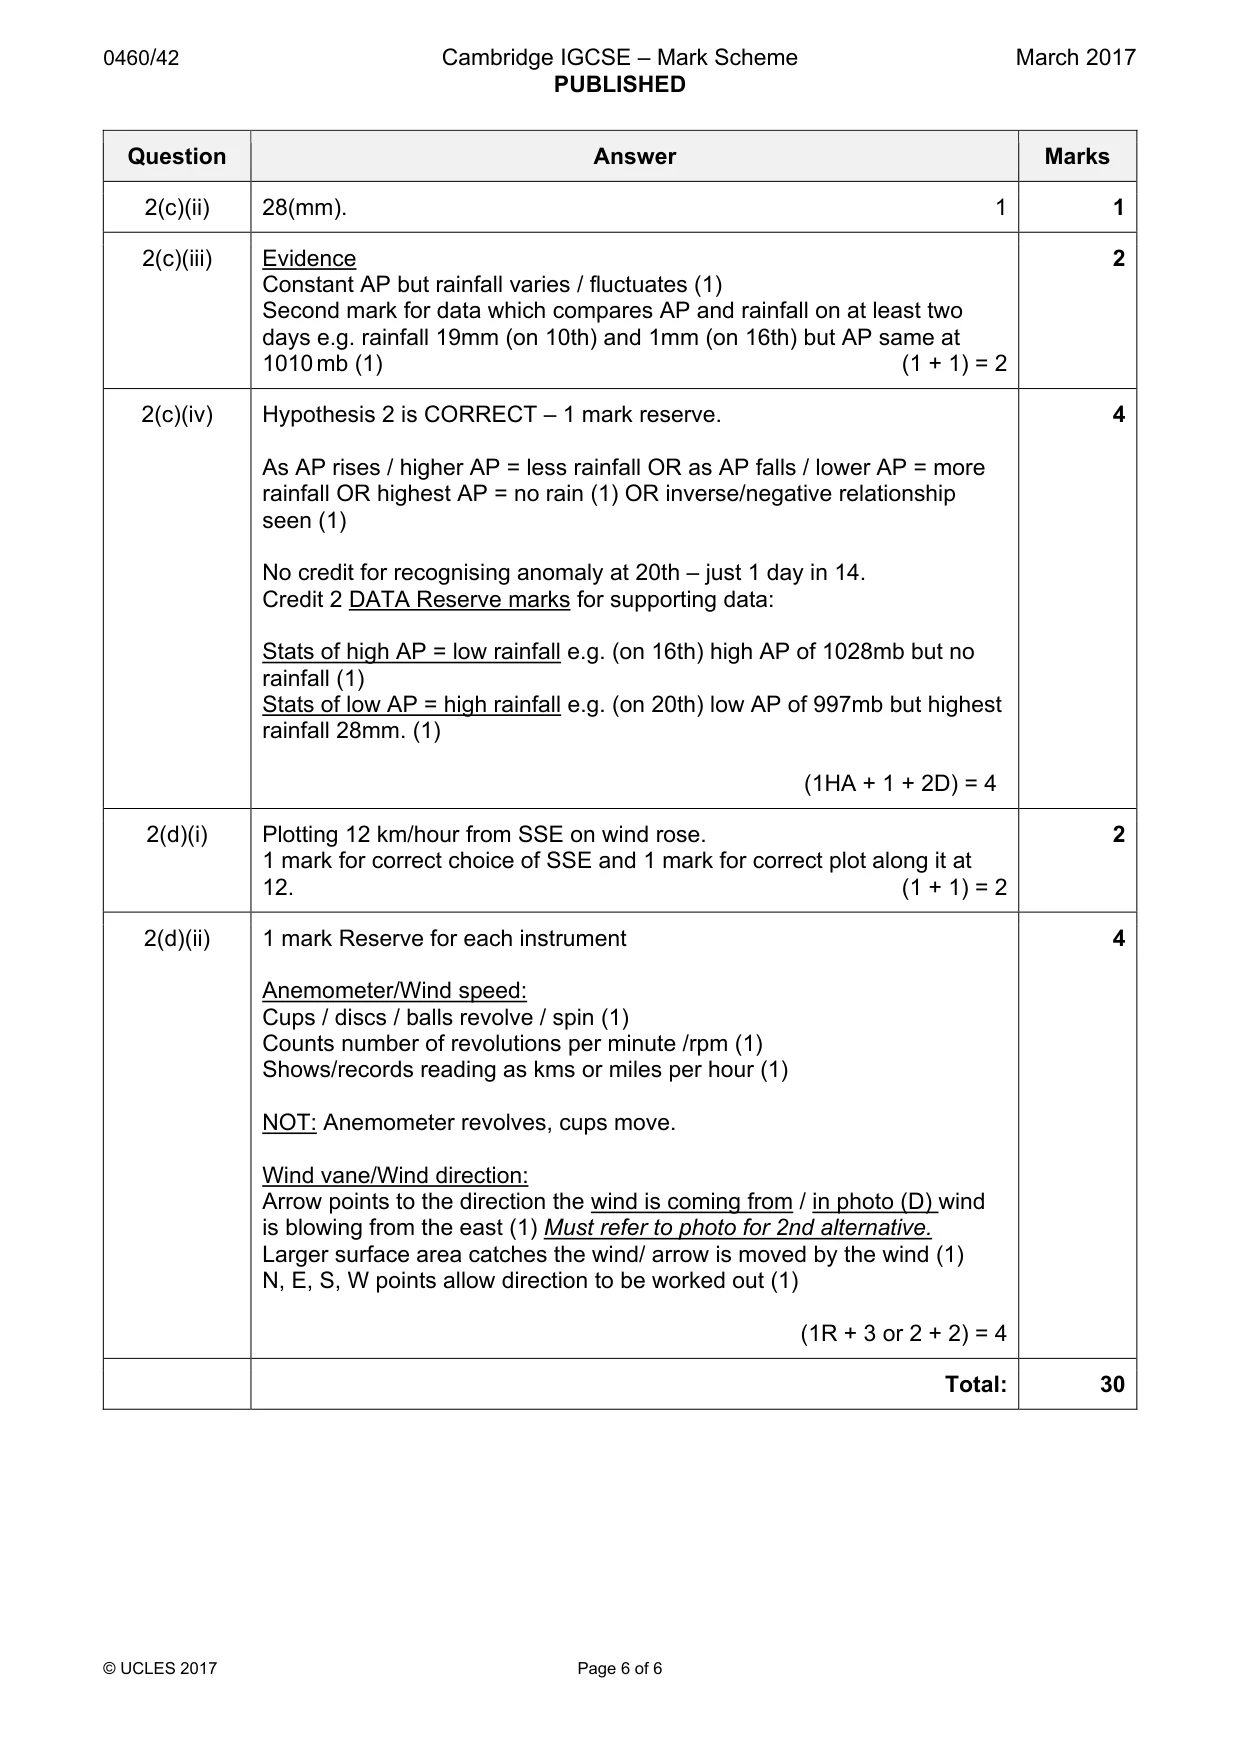
Mark scheme: 2(a)(i) Barometer 1 1 2(a)(ii) Millibars. 1 1 2(a)(iii) Read the temperatures every 24 hours / daily (1) 3 Read the minimum and maximum temperatures (1) Read off the bottom of the indices (1) Read at eye level (1) (Use magnet) Reset indices (1) (1 + 1 + 1) = 3 2(a)(iv) Not to credit weaknesses of traditional max-min; only strengths of digital. 2 Easy to read / convenient to read / use (1) Instant measurement / quick / saves time (1) Accurate / gives decimal point reading / exact / precise / sensitive (1) Portable / easy to carry / compact (1) Robust / strong/ won’t break (1) Easy to reset (1) (1 + 1) = 2 2(b)(i) 10°C. 1 1 2(b)(ii) 22nd (April). 1 2 2(b)(iii) Singapore: AP hardly changes / is constant (1) 2 Albany: fluctuates / goes up and down (1) (1 + 1) = 2 2(b)(iv) NO / hypothesis is NOT supported – 1 mark reserve. TICK/CROSS HA. 3 1 mark max for Singapore: Examples highest AP / 1011 and lowest AP / 1009 = same temperature 35° (1) same AP of 1011 = different temperatures of 29° and 31° (1) 1 mark max for Albany: Examples highest AP / 1028 = temperature of 17° but lowest AP / 993 = temperature of 18° (1) same AP of 1025 = different max temperatures of 20° and 10° (1) Must be clear referring to Singapore and Albany; can use Figs e.g. 7A/7B. If hypothesis decision is wrong X HA = 0 and no further marks. (1HA + 1R Singapore + 1R Albany) = 3 2(c)(i) Clear of buildings/ shelter / on open ground (1) 3 Clear of trees / away from interception (1) Clear of people / animals / away from interference (1) On grass / not on concrete (1) On flat land (1) Accessible (1) (1 + 1 + 1) = 3 2(c)(ii) 28(mm). 1 1 2(c)(iii) Evidence 2 Constant AP but rainfall varies / fluctuates (1) Second mark for data which compares AP and rainfall on at least two days e.g. rainfall 19mm (on 10th) and 1mm (on 16th) but AP same at 1010 mb (1) (1 + 1) = 2 2(c)(iv) Hypothesis 2 is CORRECT – 1 mark reserve. 4 As AP rises / higher AP = less rainfall OR as AP falls / lower AP = more rainfall OR highest AP = no rain (1) OR inverse/negative relationship seen (1) No credit for recognising anomaly at 20th – just 1 day in 14. Credit 2 DATA Reserve marks for supporting data: Stats of high AP = low rainfall e.g. (on 16th) high AP of 1028mb but no rainfall (1) Stats of low AP = high rainfall e.g. (on 20th) low AP of 997mb but highest rainfall 28mm. (1) (1HA + 1 + 2D) = 4 2(d)(i) Plotting 12 km/hour from SSE on wind rose. 2 1 mark for correct choice of SSE and 1 mark for correct plot along it at 12. (1 + 1) = 2 2(d)(ii) 1 mark Reserve for each instrument 4 Anemometer/Wind speed: Cups / discs / balls revolve / spin (1) Counts number of revolutions per minute /rpm (1) Shows/records reading as kms or miles per hour (1) NOT: Anemometer revolves, cups move. Wind vane/Wind direction: Arrow points to the direction the wind is coming from / in photo (D) wind is blowing from the east (1) Must refer to photo for 2nd alternative. Larger surface area catches the wind/ arrow is moved by the wind (1) N, E, S, W points allow direction to be worked out (1) (1R + 3 or 2 + 2) = 4 Total: 30
What was in this paper
The subtopics covered by these 2 questions, and how many questions each got. Open one in a new tab to see every Cambridge question on it.
What you needed in this session
Cambridge’s own grade thresholds for 2017 Feb/March, Paper 4 · Variant 2. A higher threshold means an easier paper — the bar moves with how the cohort did.