Cambridge IGCSE Geography 0460 — 2015 Oct/Nov Paper 4 · Variant 2
0460/42/O/N/15 · 60 marks · ≈68 min
The question paper and its mark scheme, free to read here and free to download. This is Cambridge’s own paper, exactly as it was sat.
Question paper20 pages




Mark scheme7 pages
Answers below. Sit the paper first if you are practising.
Paper as text
Question paper, page 1
This document consists of 17 printed pages, 3 blank pages and 1 Insert. DC (AC/SG) 99192/7 © UCLES 2015 [Turn over Cambridge International Examinations Cambridge International General Certificate of Secondary Education * 4 9 2 8 8 2 7 2 2 0 * GEOGRAPHY 0460/42 Paper 4 Alternative to Coursework October/November 2015 1 hour 30 minutes Candidates answer on the Question Paper. Additional Materials: Ruler Calculator READ THESE INSTRUCTIONS FIRST Write your Centre number, candidate number and name in the spaces provided. Write in dark blue or black pen. You may use an HB pencil for any diagrams or graphs. Do not use staples, paper clips, glue or correction fluid. DO NOT WRITE IN ANY BARCODES. Write your answer to each question in the space provided. If additional space is required, you should use the lined pages at the end of this booklet. The question number(s) must be clearly shown. Answer all questions. The Insert contains Figs 1, 4 and 5, Photograph A and Table 1 for Question 1, and Table 2 and Figs 8, 10 and 11 for Question 2. The Insert is not required by the Examiner. Sketch maps and diagrams should be drawn whenever they serve to illustrate an answer. At the end of the examination, fasten all your work securely together. The number of marks is given in brackets [ ] at the end of each question or part question. The syllabus is approved for use in England, Wales and Northern Ireland as a Cambridge International Level 1/Level 2 Certificate.
Question paper, page 2
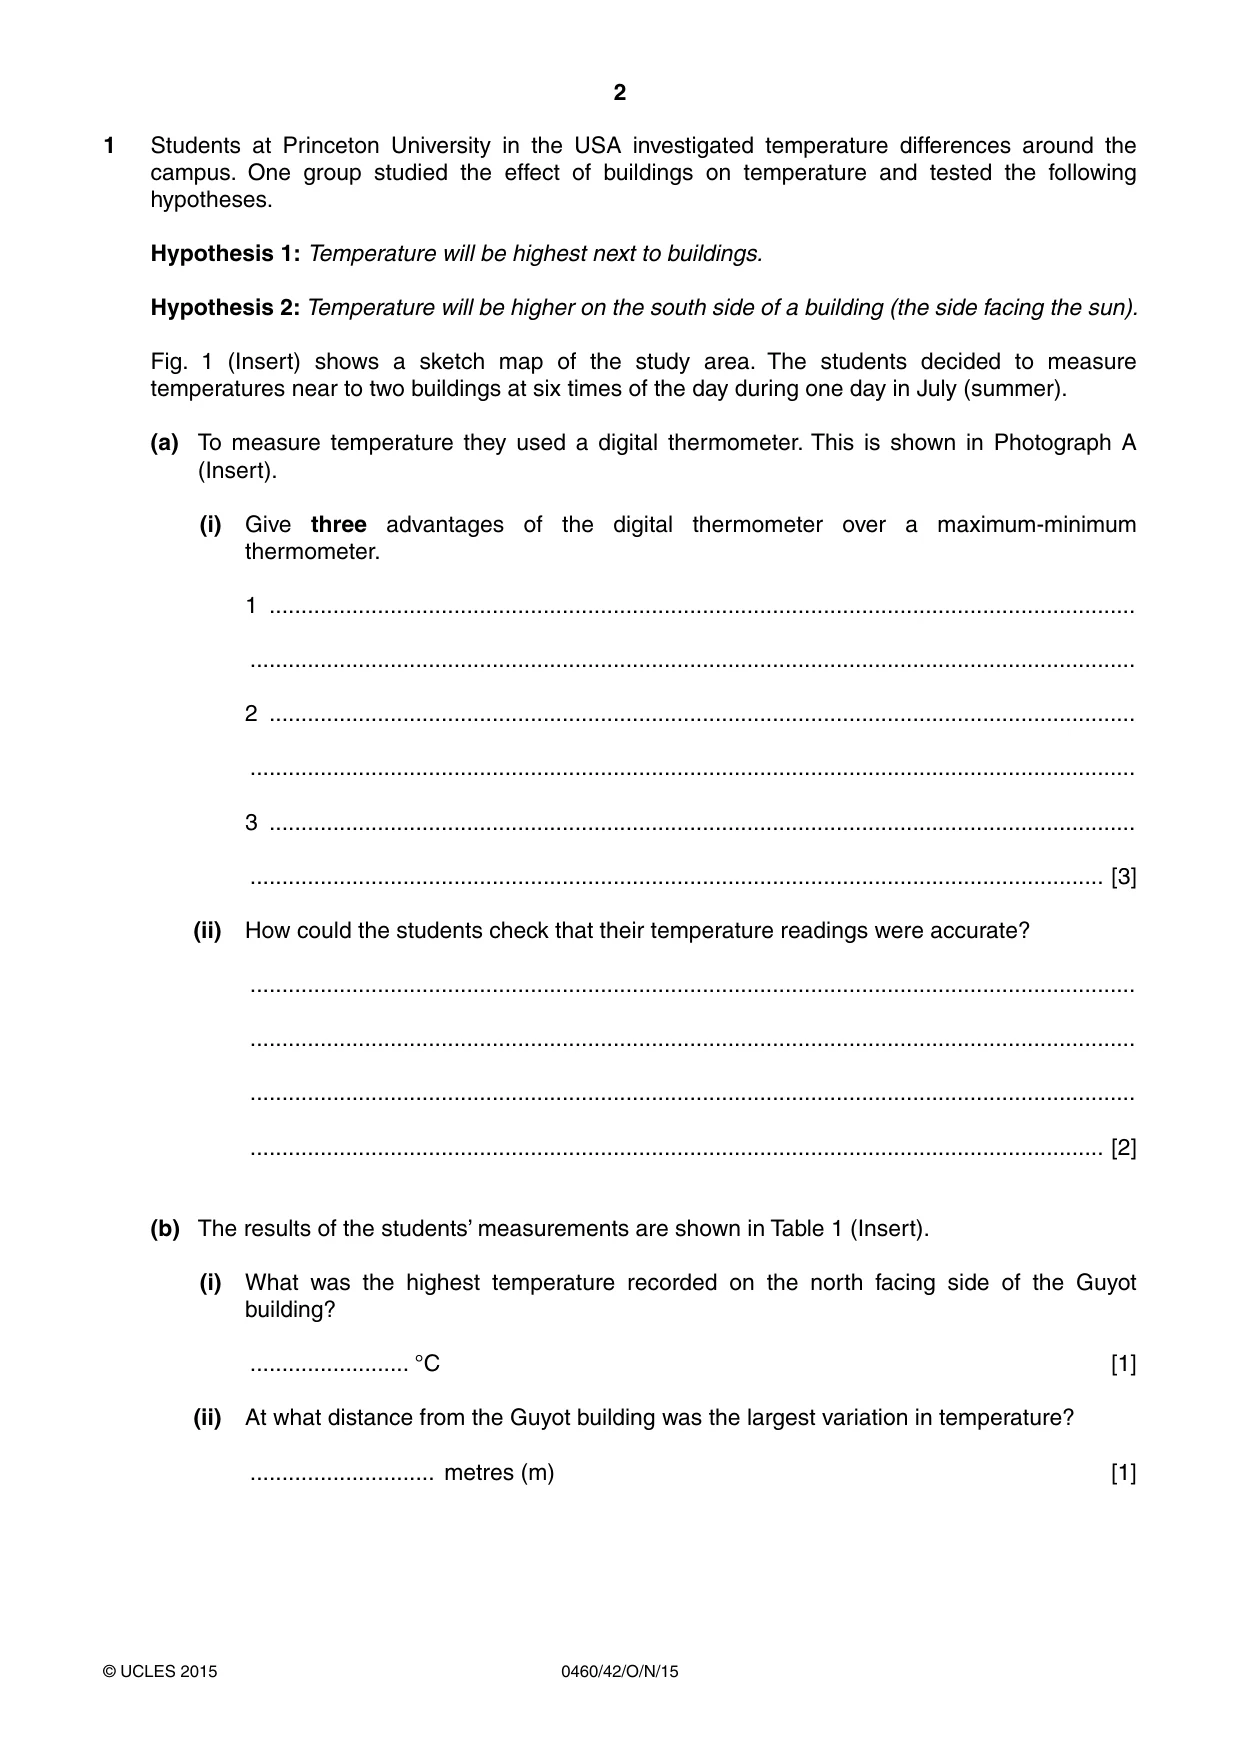
2 0460/42/O/N/15 © UCLES 2015 1 Students at Princeton University in the USA investigated temperature differences around the campus. One group studied the effect of buildings on temperature and tested the following hypotheses. Hypothesis 1: Temperature will be highest next to buildings. Hypothesis 2: Temperature will be higher on the south side of a building (the side facing the sun). Fig. 1 (Insert) shows a sketch map of the study area. The students decided to measure temperatures near to two buildings at six times of the day during one day in July (summer). (a) To measure temperature they used a digital thermometer. This is shown in Photograph A (Insert). (i) Give three advantages of the digital thermometer over a maximum-minimum thermometer. 1 … … 2 … … 3 … … [3] (ii) How could the students check that their temperature readings were accurate? … … … … [2] (b) The results of the students’ measurements are shown in Table 1 (Insert). (i) What was the highest temperature recorded on the north facing side of the Guyot building? … °C [1] (ii) At what distance from the Guyot building was the largest variation in temperature? … metres (m) [1]
Question paper, page 3
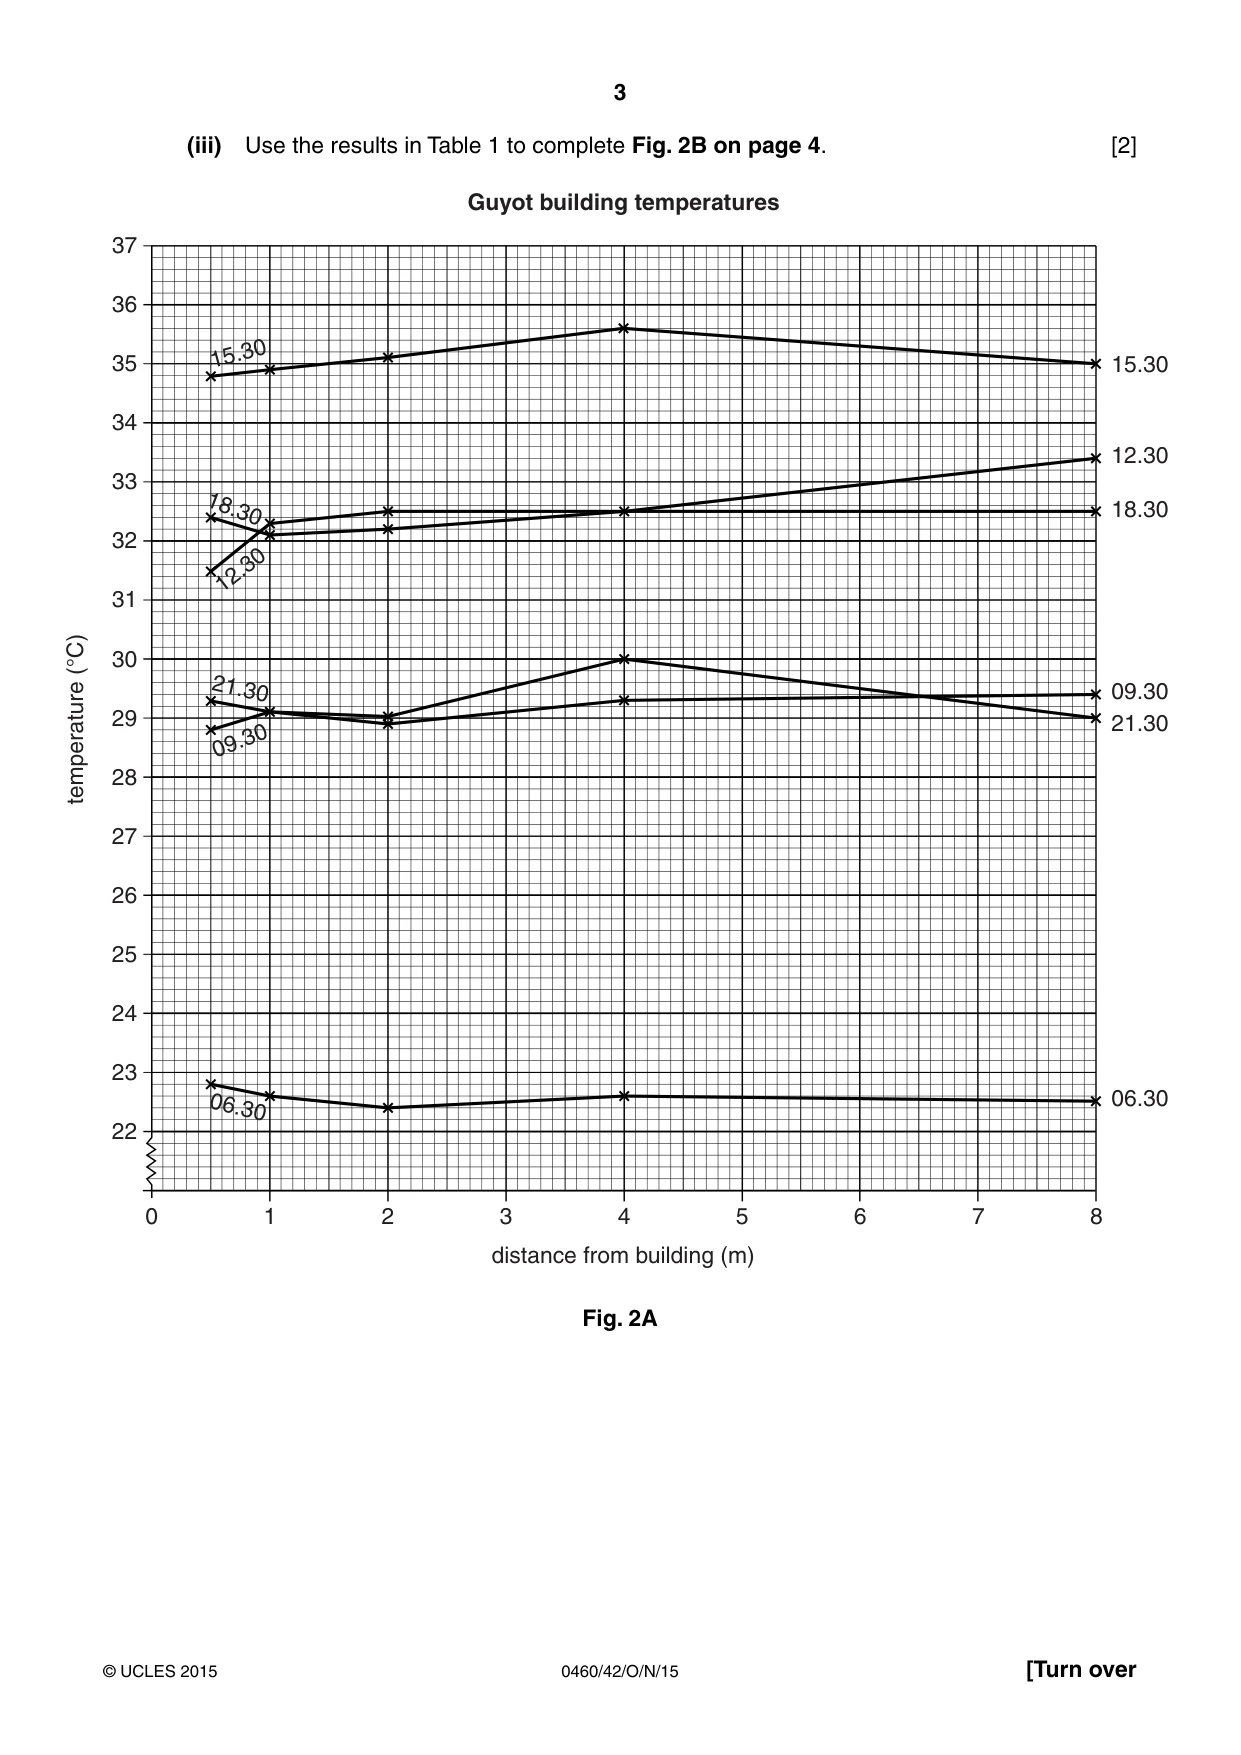
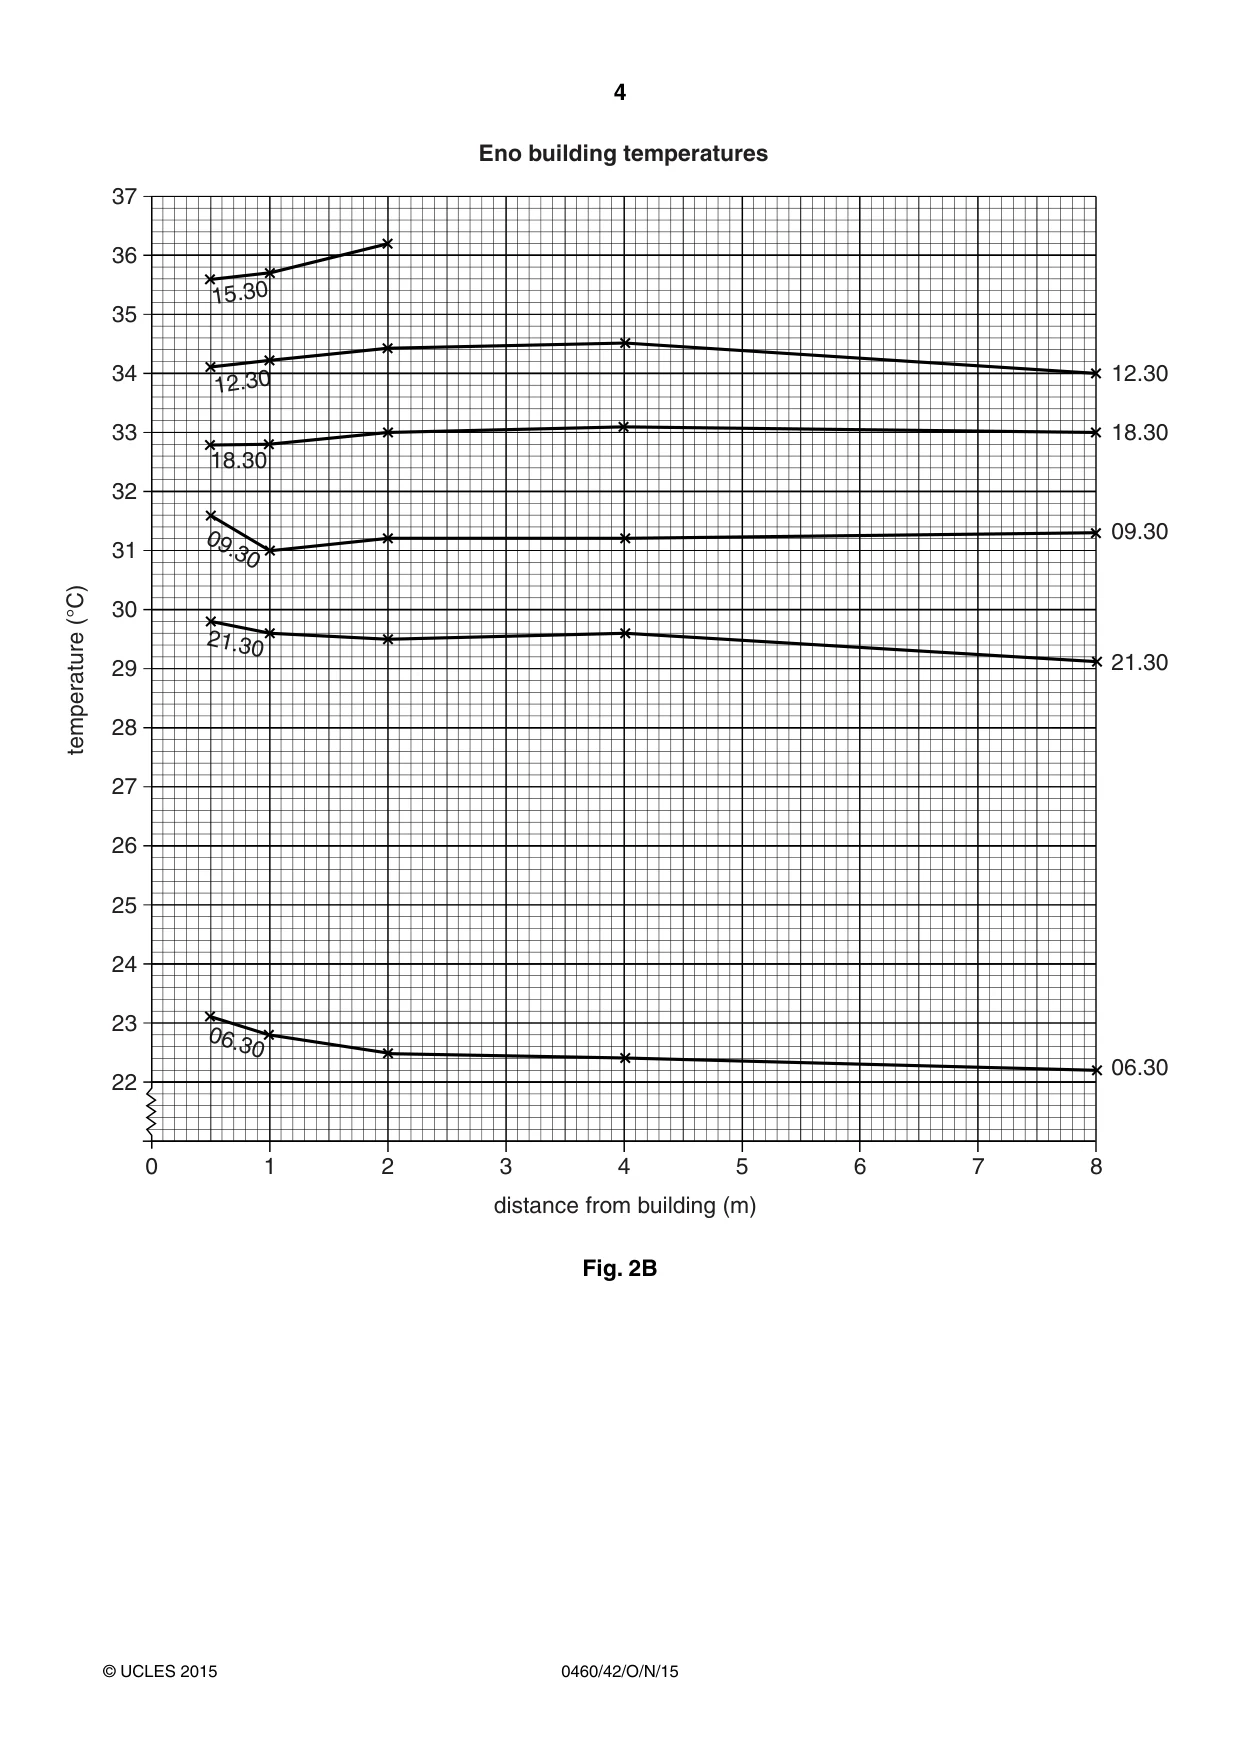
3 0460/42/O/N/15 © UCLES 2015 [Turn over (iii) Use the results in Table 1 to complete Fig. 2B on page 4. [2] 37 36 35 34 33 32 31 30 29 28 27 26 25 24 23 22 0 1 2 3 4 5 6 7 8 distance from building (m) temperature (°C) Guyot building temperatures 15.30 12.30 18.30 09.30 21.30 06.30 15.30 12.30 18.30 09.30 21.30 06.30 Fig. 2A
Question paper, page 4
4 0460/42/O/N/15 © UCLES 2015 distance from building (m) temperature (°C) Eno building temperatures 12.30 18.30 18.30 09.30 21.30 06.30 15.30 12.30 09.30 21.30 06.30 37 36 35 34 33 32 31 30 29 28 27 26 25 24 23 22 0 1 2 3 4 5 6 7 8 Fig. 2B
Question paper, page 5
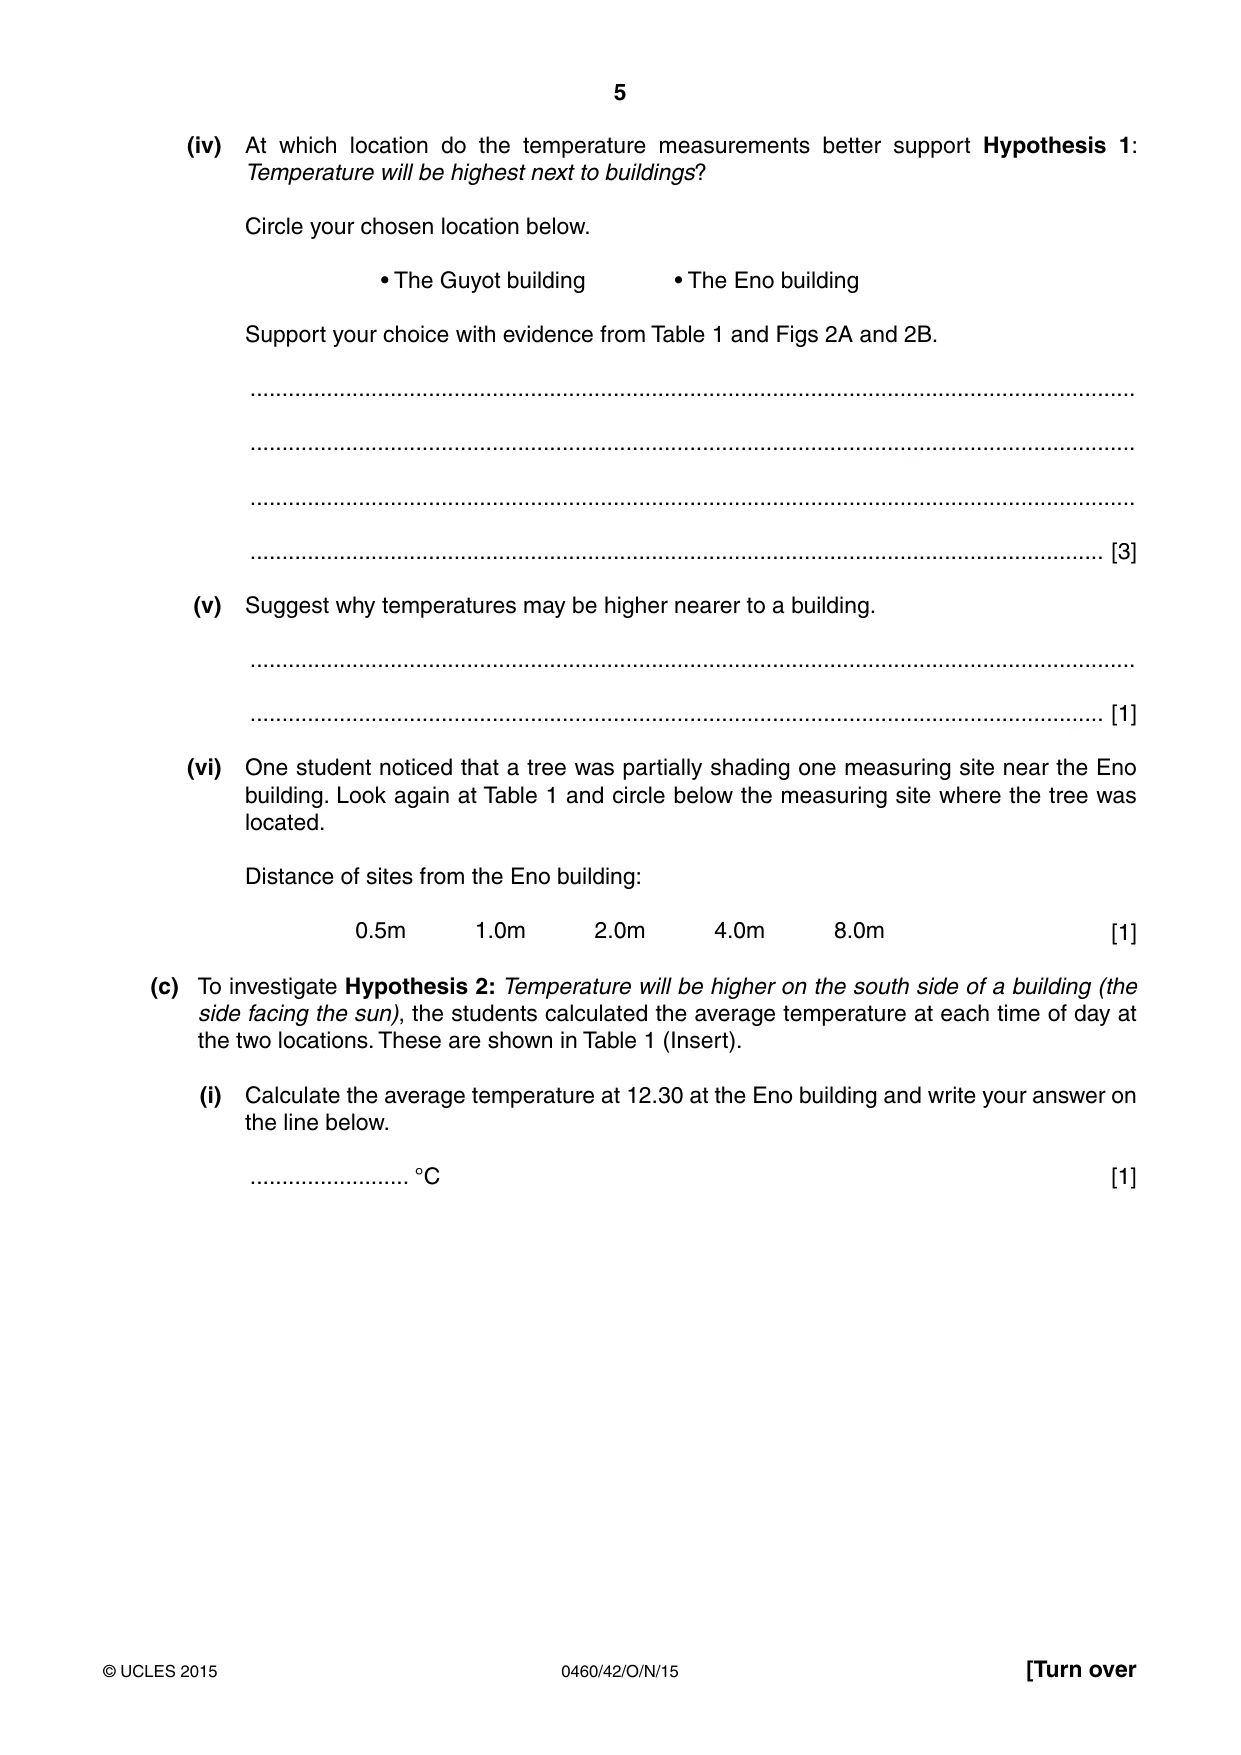
5 0460/42/O/N/15 © UCLES 2015 [Turn over (iv) At which location do the temperature measurements better support Hypothesis 1: Temperature will be highest next to buildings? Circle your chosen location below. • The Guyot building • The Eno building Support your choice with evidence from Table 1 and Figs 2A and 2B. … … … … [3] (v) Suggest why temperatures may be higher nearer to a building. … … [1] (vi) One student noticed that a tree was partially shading one measuring site near the Eno building. Look again at Table 1 and circle below the measuring site where the tree was located. Distance of sites from the Eno building: 0.5m 1.0m 2.0m 4.0m 8.0m [1] (c) To investigate Hypothesis 2: Temperature will be higher on the south side of a building (the side facing the sun), the students calculated the average temperature at each time of day at the two locations. These are shown in Table 1 (Insert). (i) Calculate the average temperature at 12.30 at the Eno building and write your answer on the line below. … °C [1]
Question paper, page 6
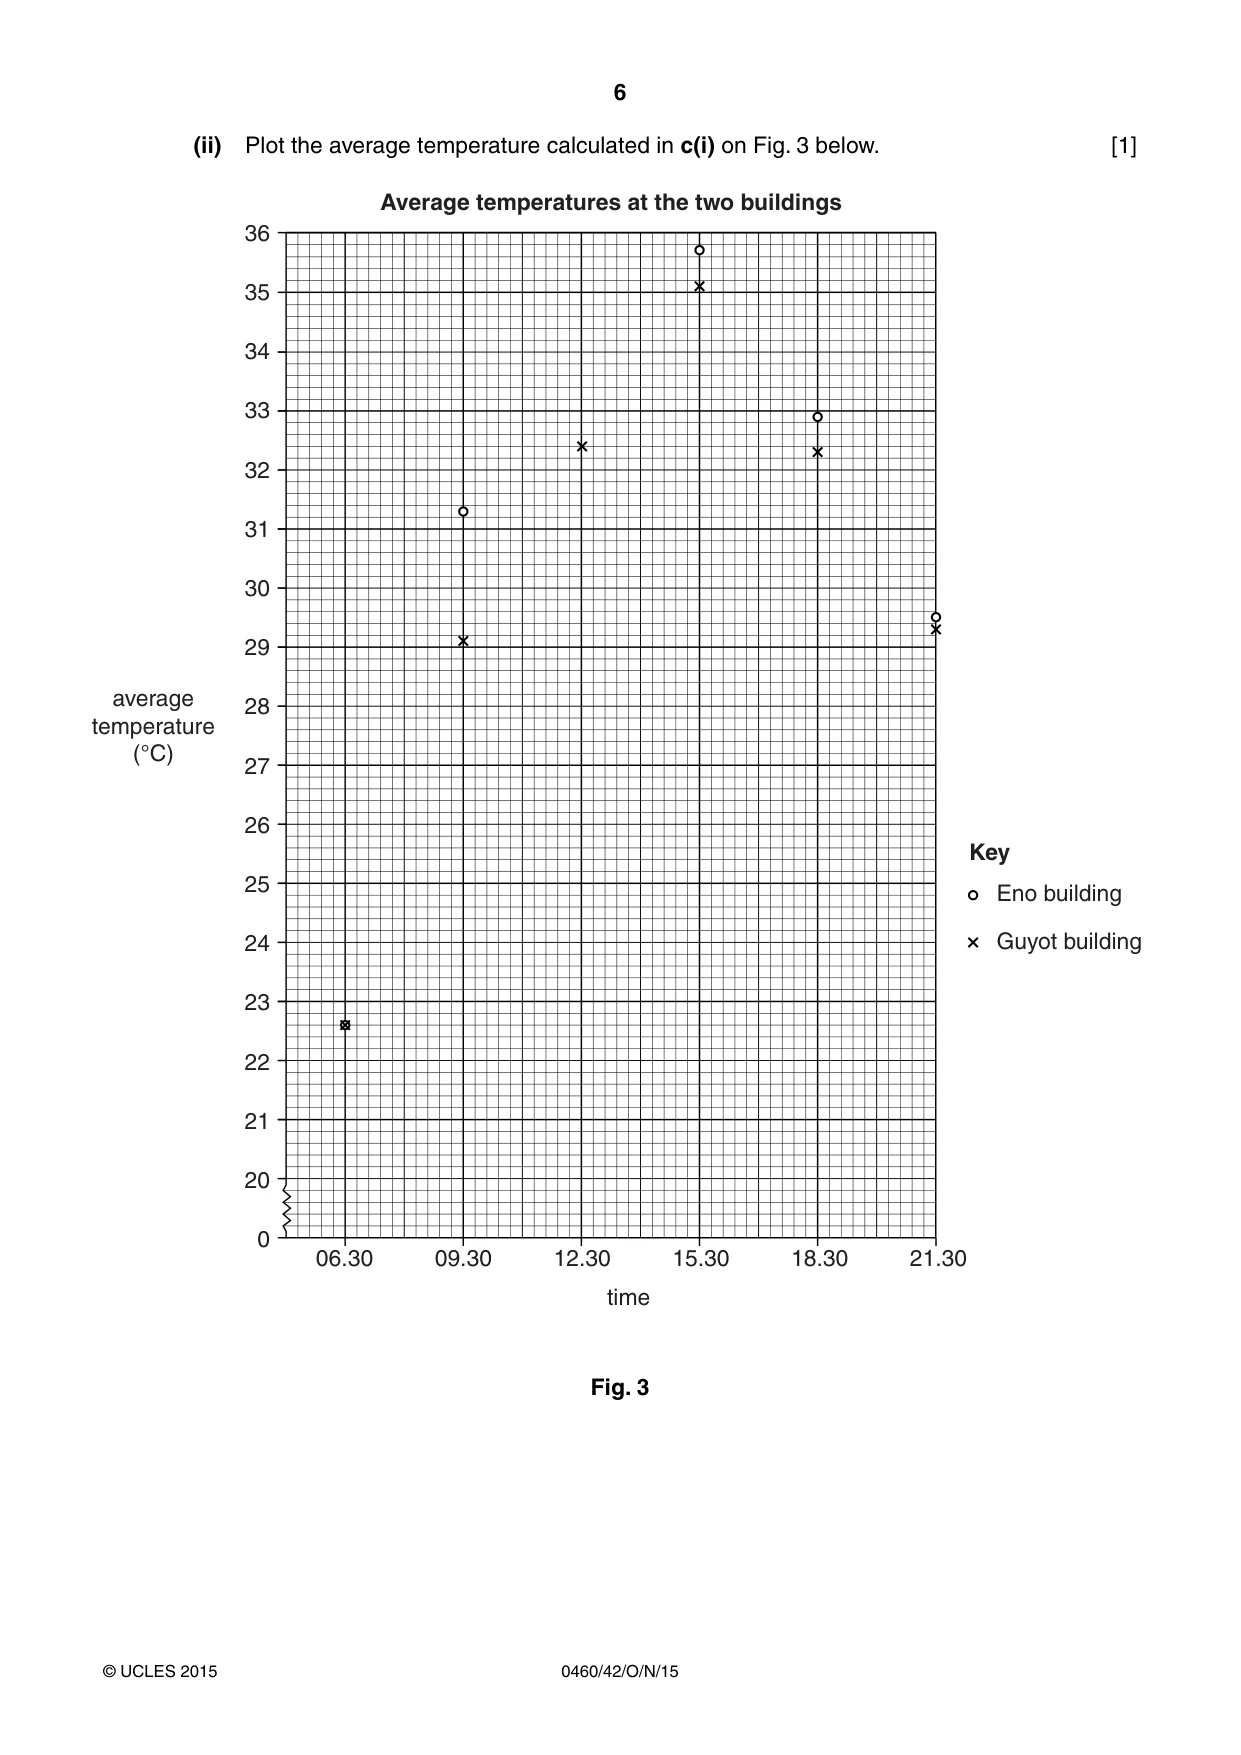
6 0460/42/O/N/15 © UCLES 2015 (ii) Plot the average temperature calculated in c(i) on Fig. 3 below. [1] 06.30 09.30 12.30 15.30 18.30 21.30 time average temperature (°C) Average temperatures at the two buildings 36 35 34 33 32 31 30 29 28 27 26 25 24 23 22 21 20 0 Key Eno building Guyot building Fig. 3
Question paper, page 7
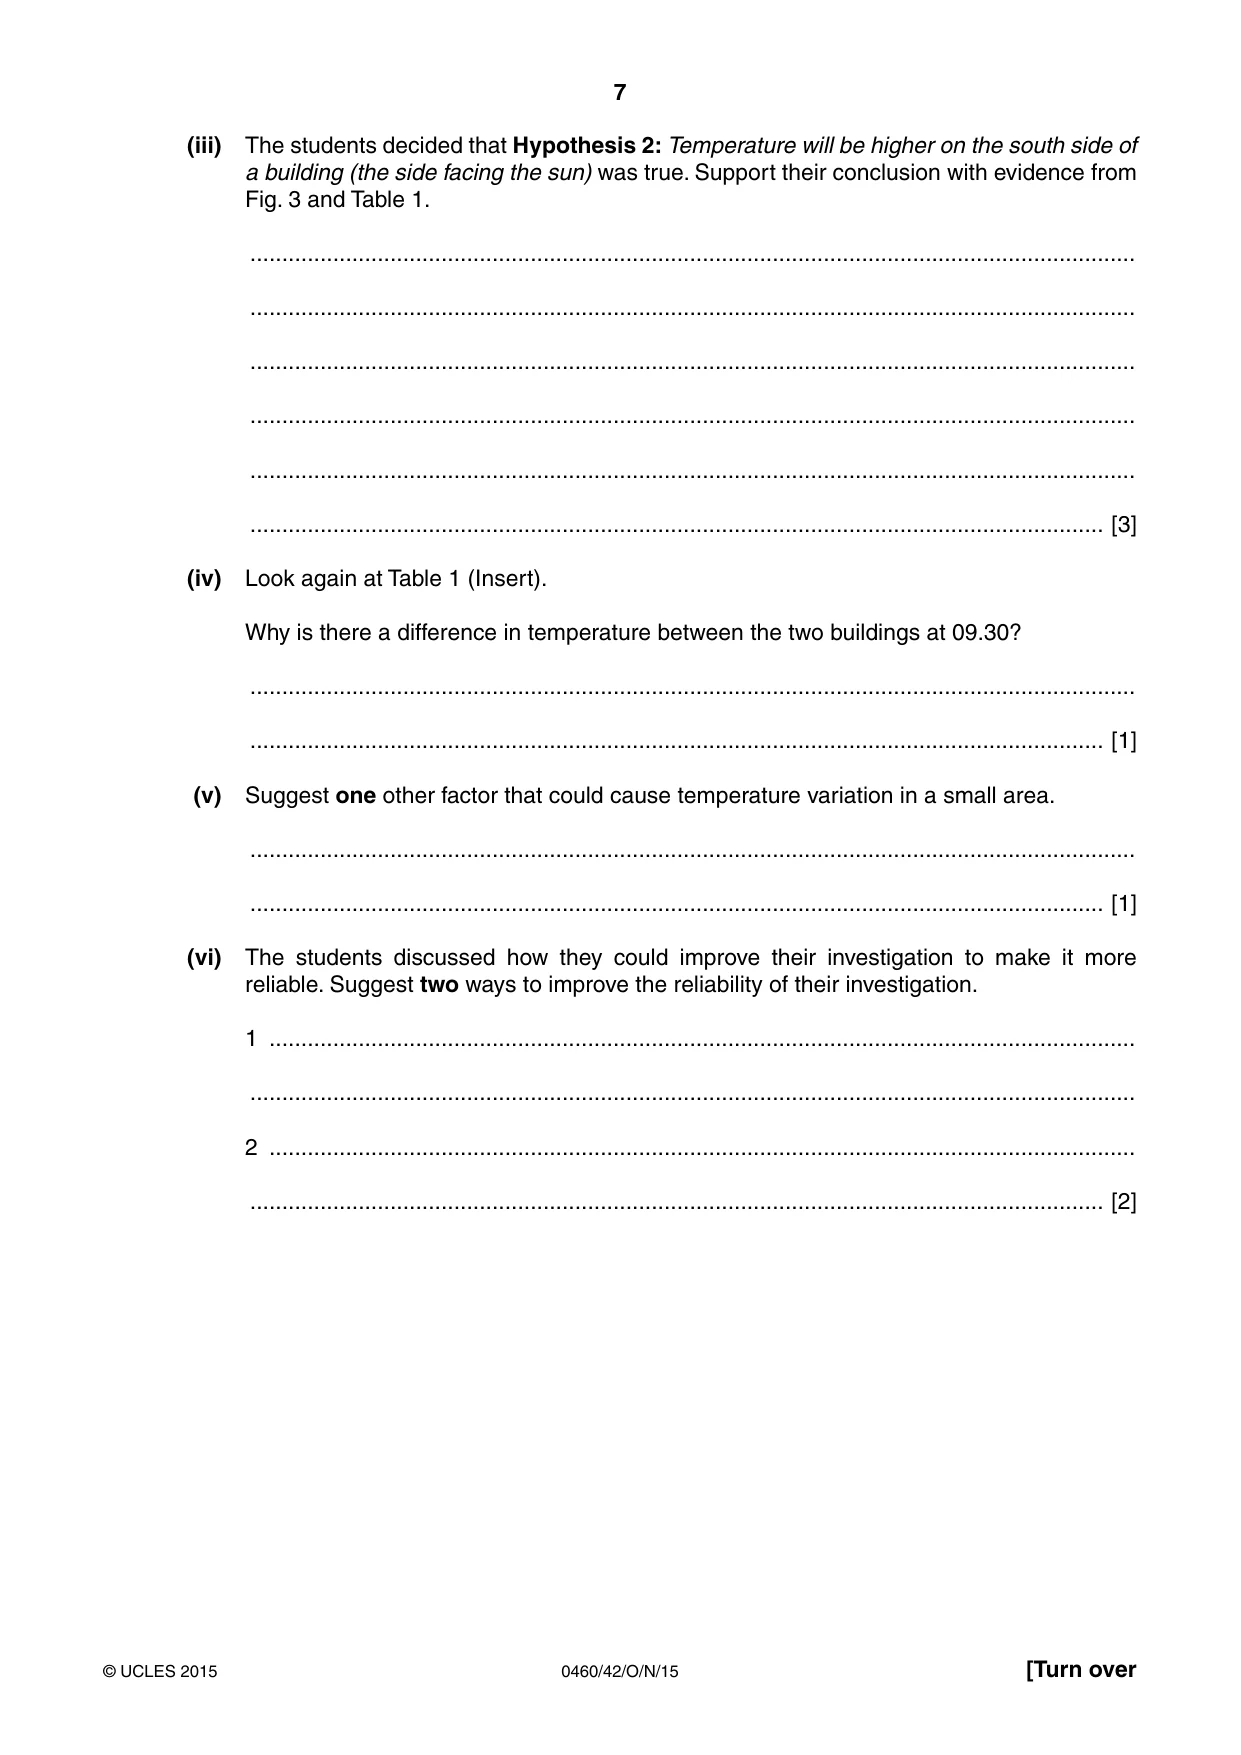
7 0460/42/O/N/15 © UCLES 2015 [Turn over (iii) The students decided that Hypothesis 2: Temperature will be higher on the south side of a building (the side facing the sun) was true. Support their conclusion with evidence from Fig. 3 and Table 1. … … … … … … [3] (iv) Look again at Table 1 (Insert). Why is there a difference in temperature between the two buildings at 09.30? … … [1] (v) Suggest one other factor that could cause temperature variation in a small area. … … [1] (vi) The students discussed how they could improve their investigation to make it more reliable. Suggest two ways to improve the reliability of their investigation. 1 … … 2 … … [2]
Question paper, page 8
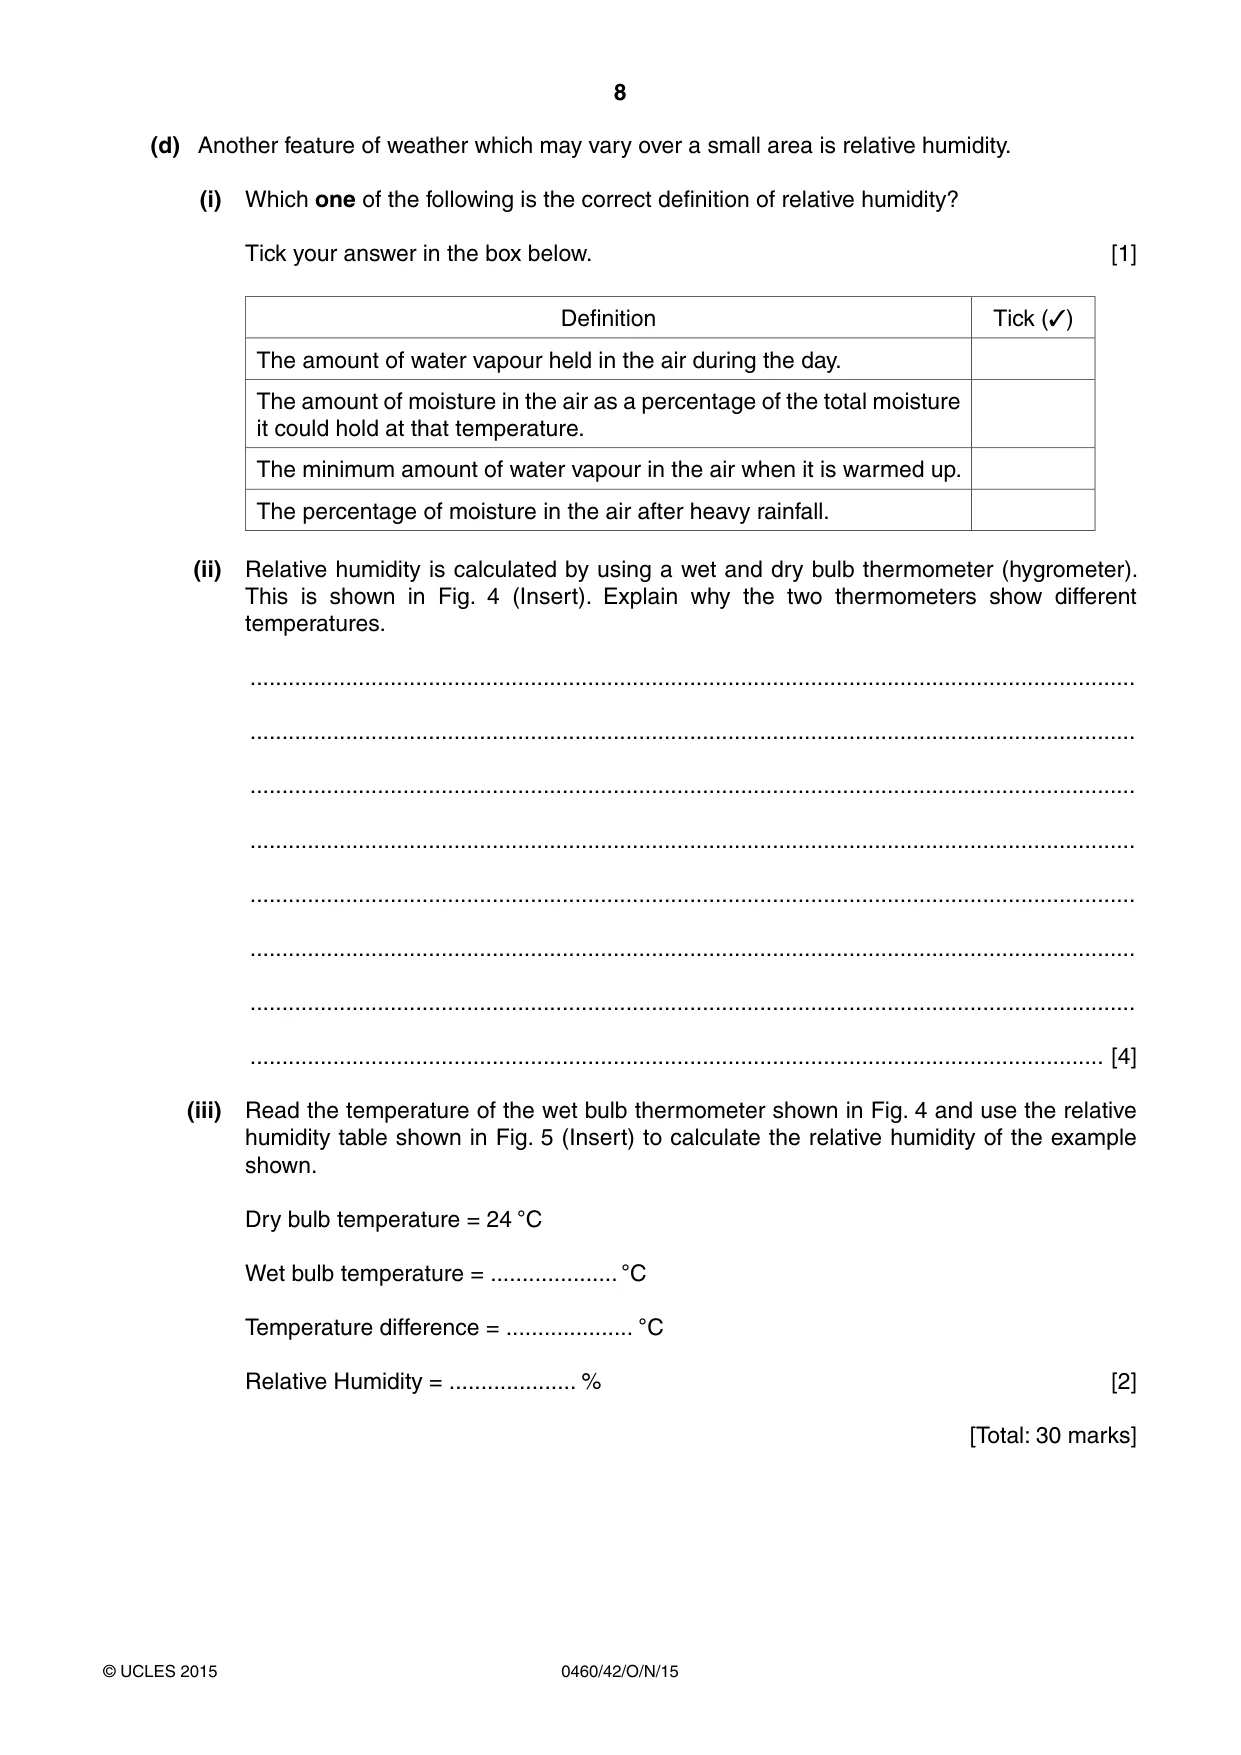
8 0460/42/O/N/15 © UCLES 2015 (d) Another feature of weather which may vary over a small area is relative humidity. (i) Which one of the following is the correct definition of relative humidity? Tick your answer in the box below. [1] Definition Tick (✓) The amount of water vapour held in the air during the day. The amount of moisture in the air as a percentage of the total moisture it could hold at that temperature. The minimum amount of water vapour in the air when it is warmed up. The percentage of moisture in the air after heavy rainfall. (ii) Relative humidity is calculated by using a wet and dry bulb thermometer (hygrometer). This is shown in Fig. 4 (Insert). Explain why the two thermometers show different temperatures. … … … … … … … … [4] (iii) Read the temperature of the wet bulb thermometer shown in Fig. 4 and use the relative humidity table shown in Fig. 5 (Insert) to calculate the relative humidity of the example shown. Dry bulb temperature = 24 °C Wet bulb temperature = … °C Temperature difference = … °C Relative Humidity = … % [2] [Total: 30 marks]
Question paper, page 9
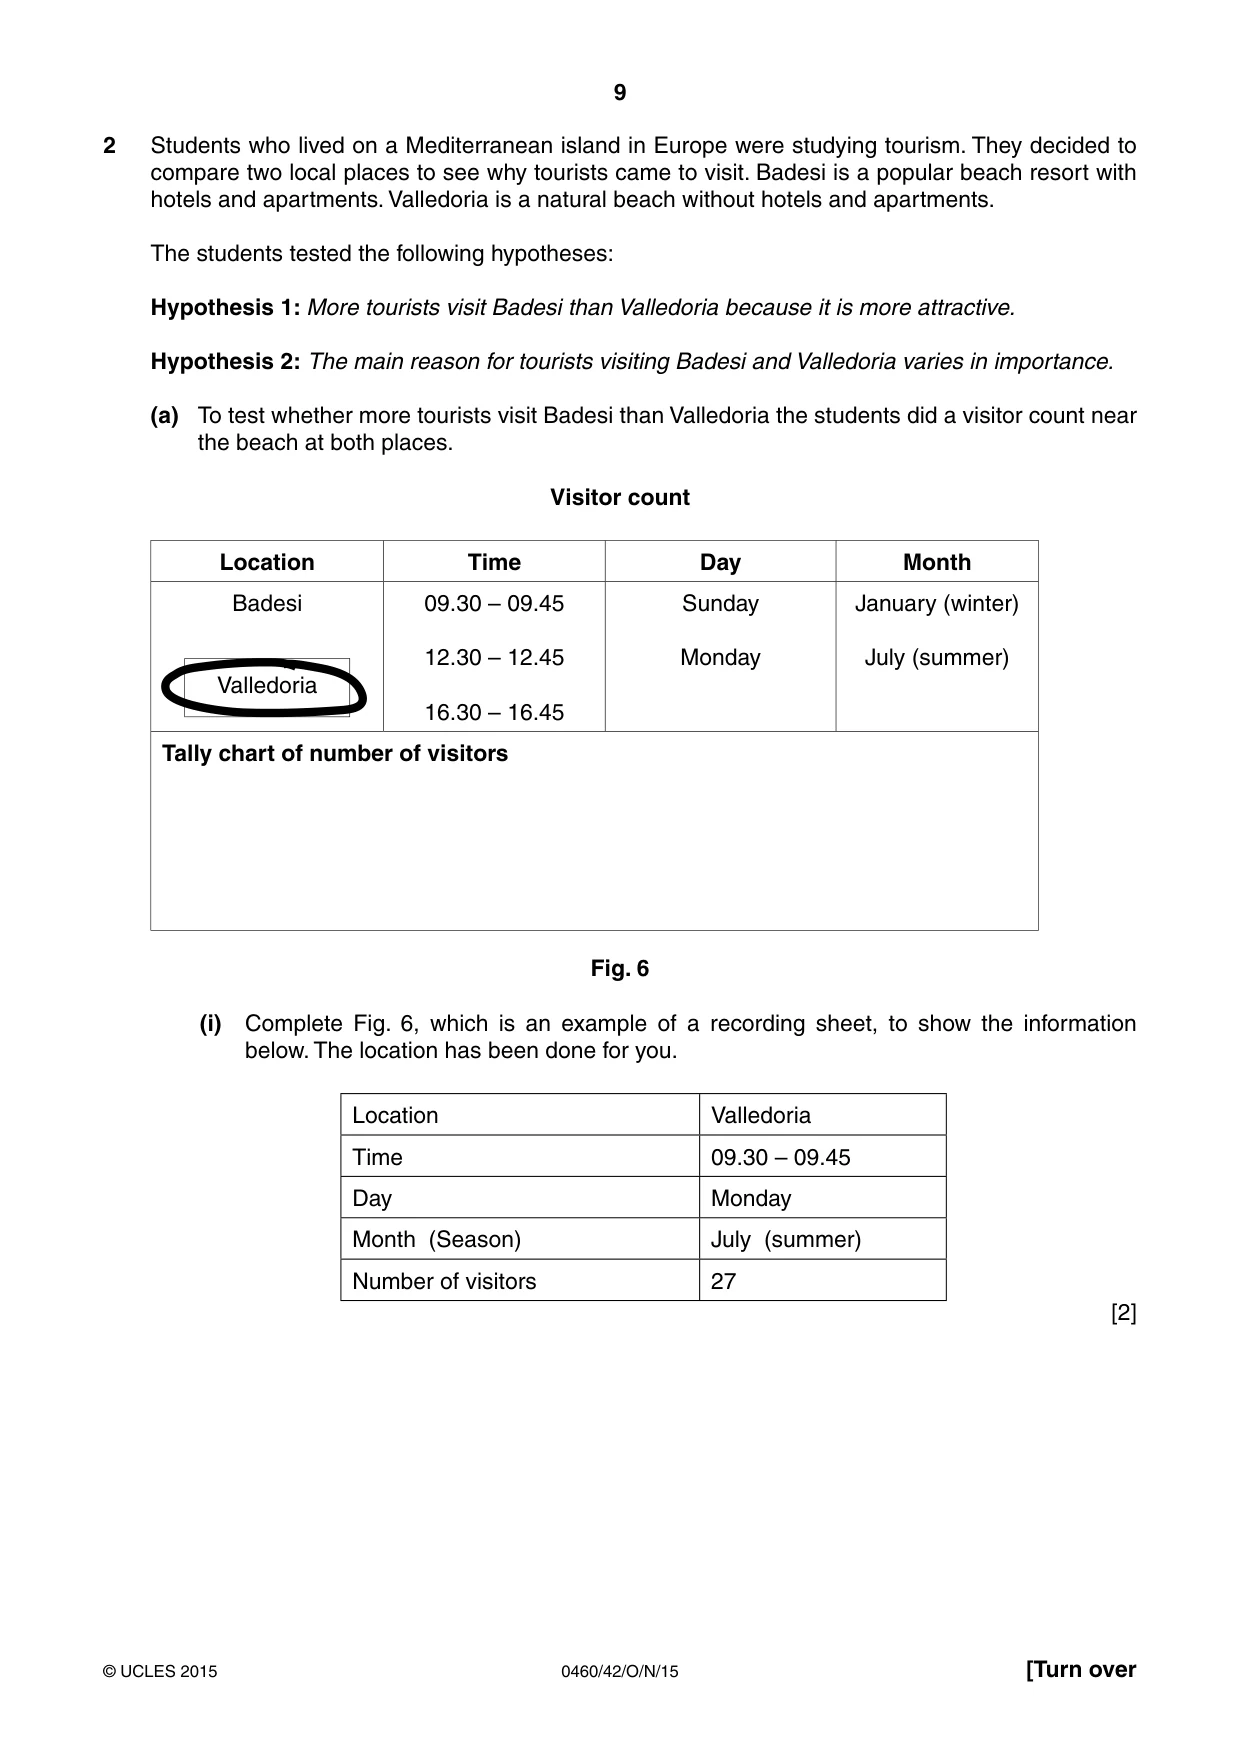
9 0460/42/O/N/15 © UCLES 2015 [Turn over 2 Students who lived on a Mediterranean island in Europe were studying tourism. They decided to compare two local places to see why tourists came to visit. Badesi is a popular beach resort with hotels and apartments. Valledoria is a natural beach without hotels and apartments. The students tested the following hypotheses: Hypothesis 1: More tourists visit Badesi than Valledoria because it is more attractive. Hypothesis 2: The main reason for tourists visiting Badesi and Valledoria varies in importance. (a) To test whether more tourists visit Badesi than Valledoria the students did a visitor count near the beach at both places. Visitor count Location Time Day Month Badesi Valledoria 09.30 – 09.45 12.30 – 12.45 16.30 – 16.45 Sunday Monday January (winter) July (summer) Tally chart of number of visitors Fig. 6 (i) Complete Fig. 6, which is an example of a recording sheet, to show the information below. The location has been done for you. Location Valledoria Time 09.30 – 09.45 Day Monday Month (Season) July (summer) Number of visitors 27 [2]
Question paper, page 10
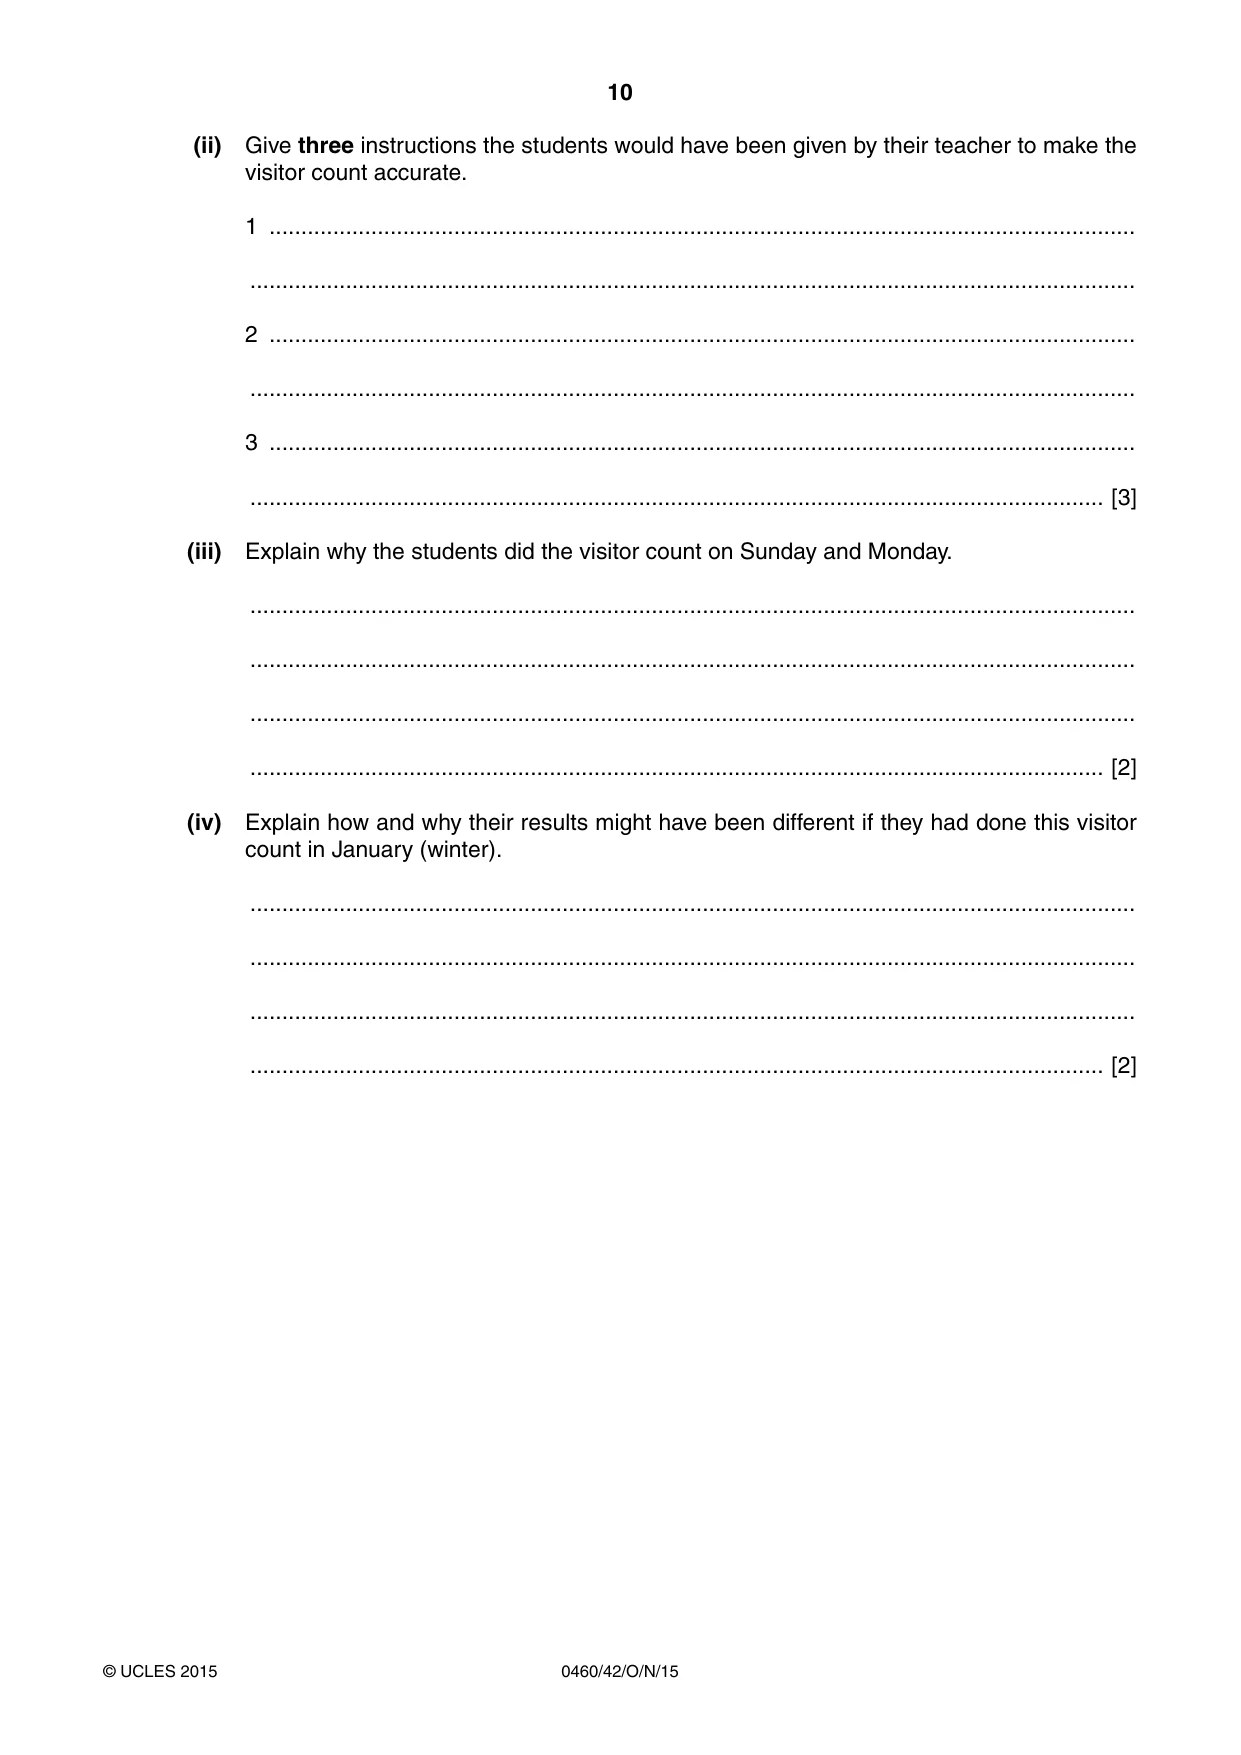
10 0460/42/O/N/15 © UCLES 2015 (ii) Give three instructions the students would have been given by their teacher to make the visitor count accurate. 1 … … 2 … … 3 … … [3] (iii) Explain why the students did the visitor count on Sunday and Monday. … … … … [2] (iv) Explain how and why their results might have been different if they had done this visitor count in January (winter). … … … … [2]
Question paper, page 11
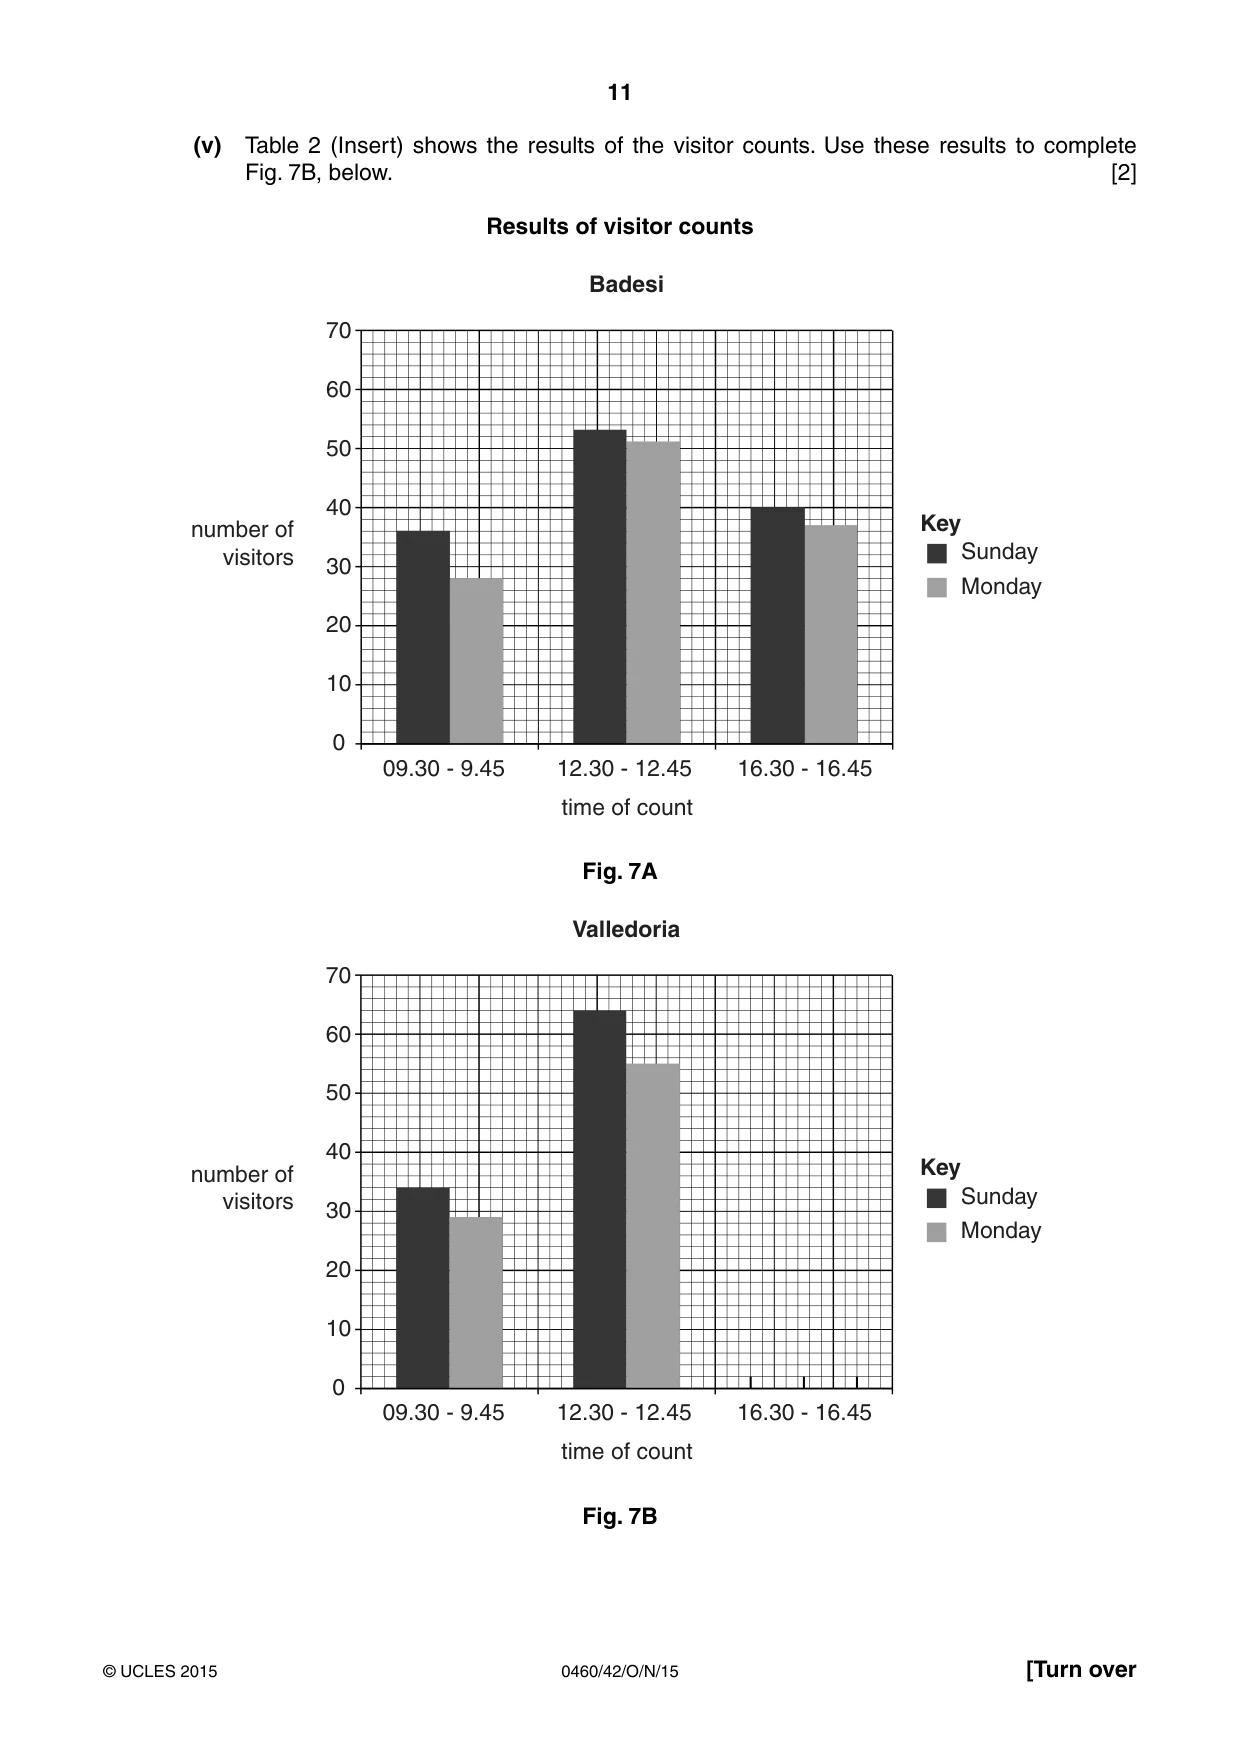
11 0460/42/O/N/15 © UCLES 2015 [Turn over (v) Table 2 (Insert) shows the results of the visitor counts. Use these results to complete Fig. 7B, below. [2] Results of visitor counts Badesi 70 60 50 40 30 20 10 0 number of visitors 09.30 - 9.45 12.30 - 12.45 16.30 - 16.45 time of count Key Sunday Monday Fig. 7A Valledoria 70 60 50 40 30 20 10 0 number of visitors 09.30 - 9.45 12.30 - 12.45 16.30 - 16.45 time of count Key Sunday Monday Fig. 7B
Question paper, page 12
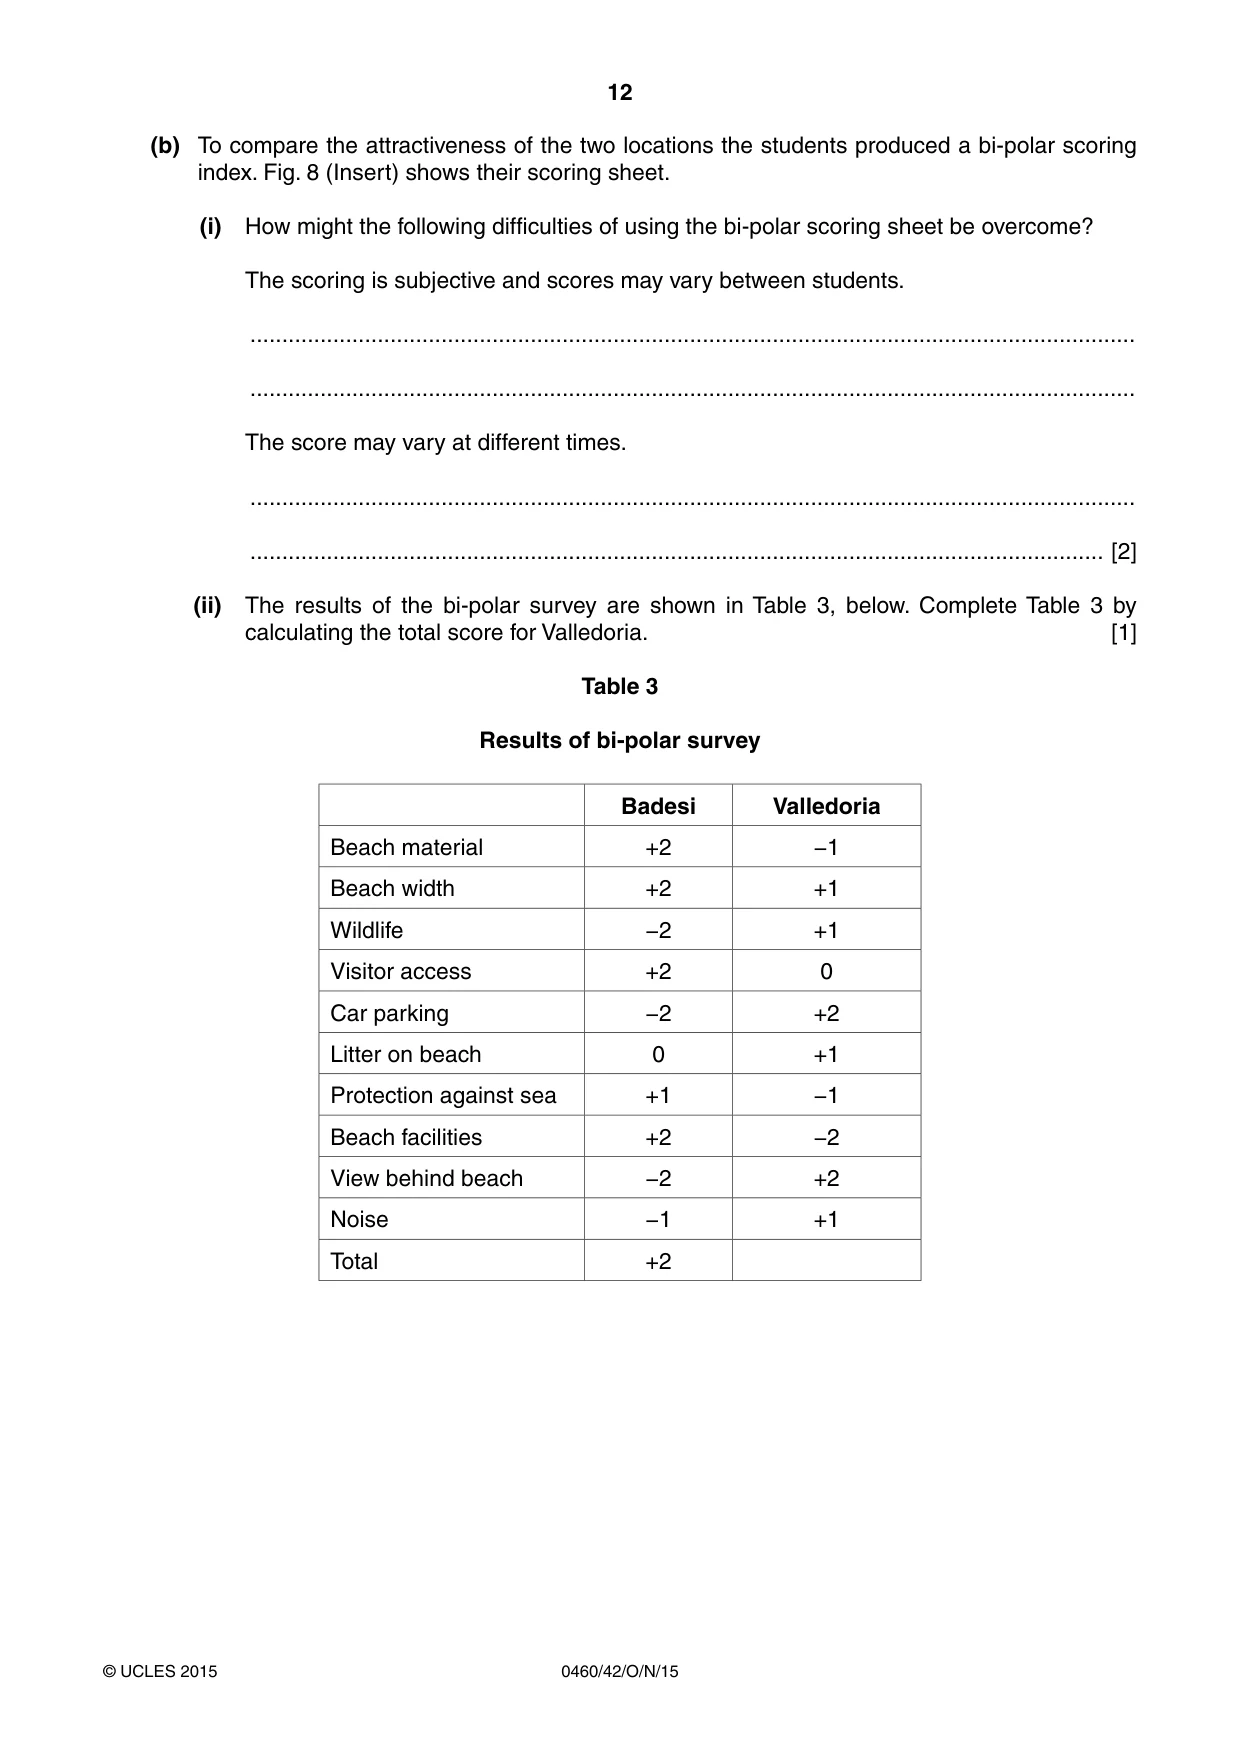
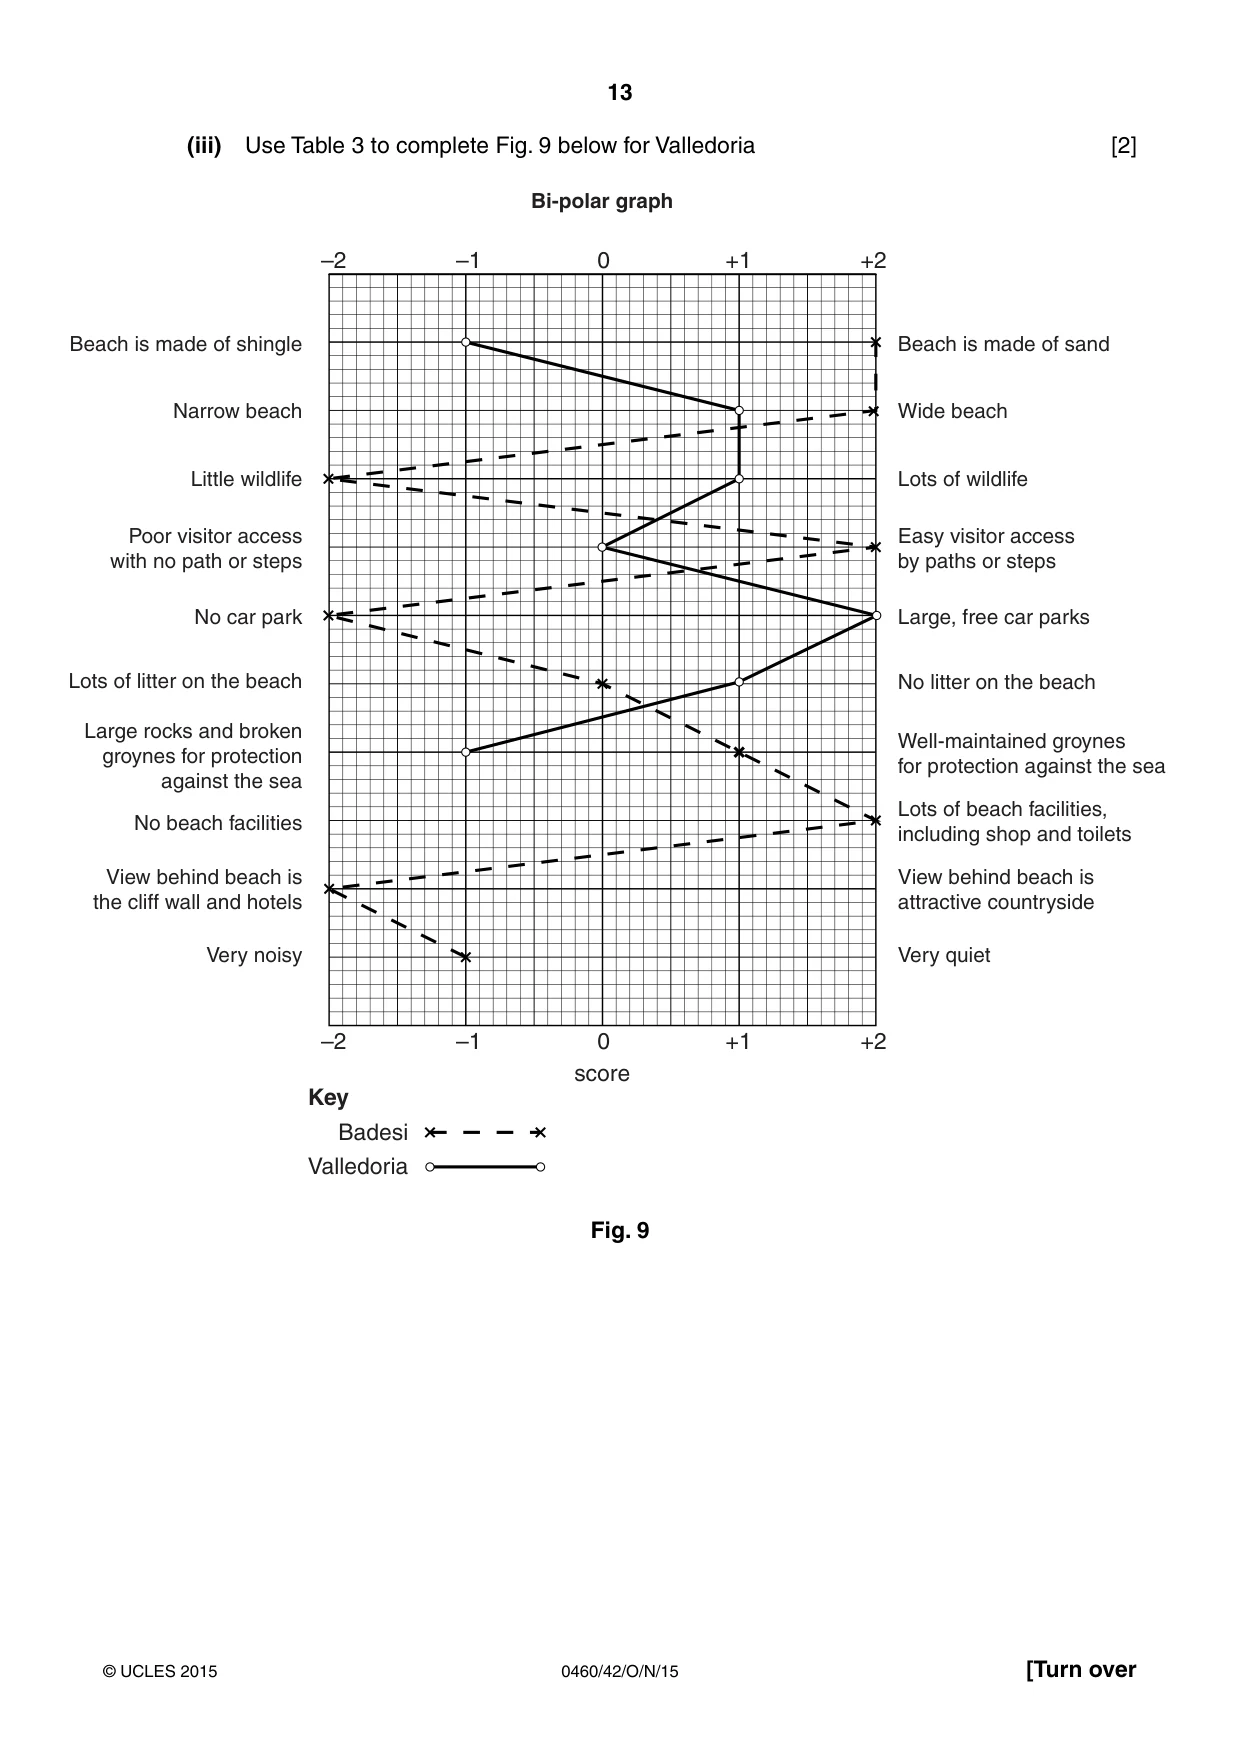
12 0460/42/O/N/15 © UCLES 2015 (b) To compare the attractiveness of the two locations the students produced a bi-polar scoring index. Fig. 8 (Insert) shows their scoring sheet. (i) How might the following difficulties of using the bi-polar scoring sheet be overcome? The scoring is subjective and scores may vary between students. … … The score may vary at different times. … … [2] (ii) The results of the bi-polar survey are shown in Table 3, below. Complete Table 3 by calculating the total score for Valledoria. [1] Table 3 Results of bi-polar survey Badesi Valledoria Beach material +2 −1 Beach width +2 +1 Wildlife −2 +1 Visitor access +2 0 Car parking −2 +2 Litter on beach 0 +1 Protection against sea +1 −1 Beach facilities +2 −2 View behind beach −2 +2 Noise −1 +1 Total +2
Question paper, page 13
13 0460/42/O/N/15 © UCLES 2015 [Turn over (iii) Use Table 3 to complete Fig. 9 below for Valledoria [2] –2 –1 0 +1 +2 –2 –1 0 +1 +2 Beach is made of sand Wide beach Lots of wildlife Easy visitor access by paths or steps Large, free car parks No litter on the beach Well-maintained groynes for protection against the sea Lots of beach facilities, including shop and toilets View behind beach is attractive countryside Very quiet Beach is made of shingle Narrow beach Little wildlife Poor visitor access with no path or steps No car park Lots of litter on the beach Large rocks and broken groynes for protection against the sea No beach facilities View behind beach is the cliff wall and hotels Very noisy Badesi Valledoria Key Bi-polar graph score Fig. 9
Question paper, page 14
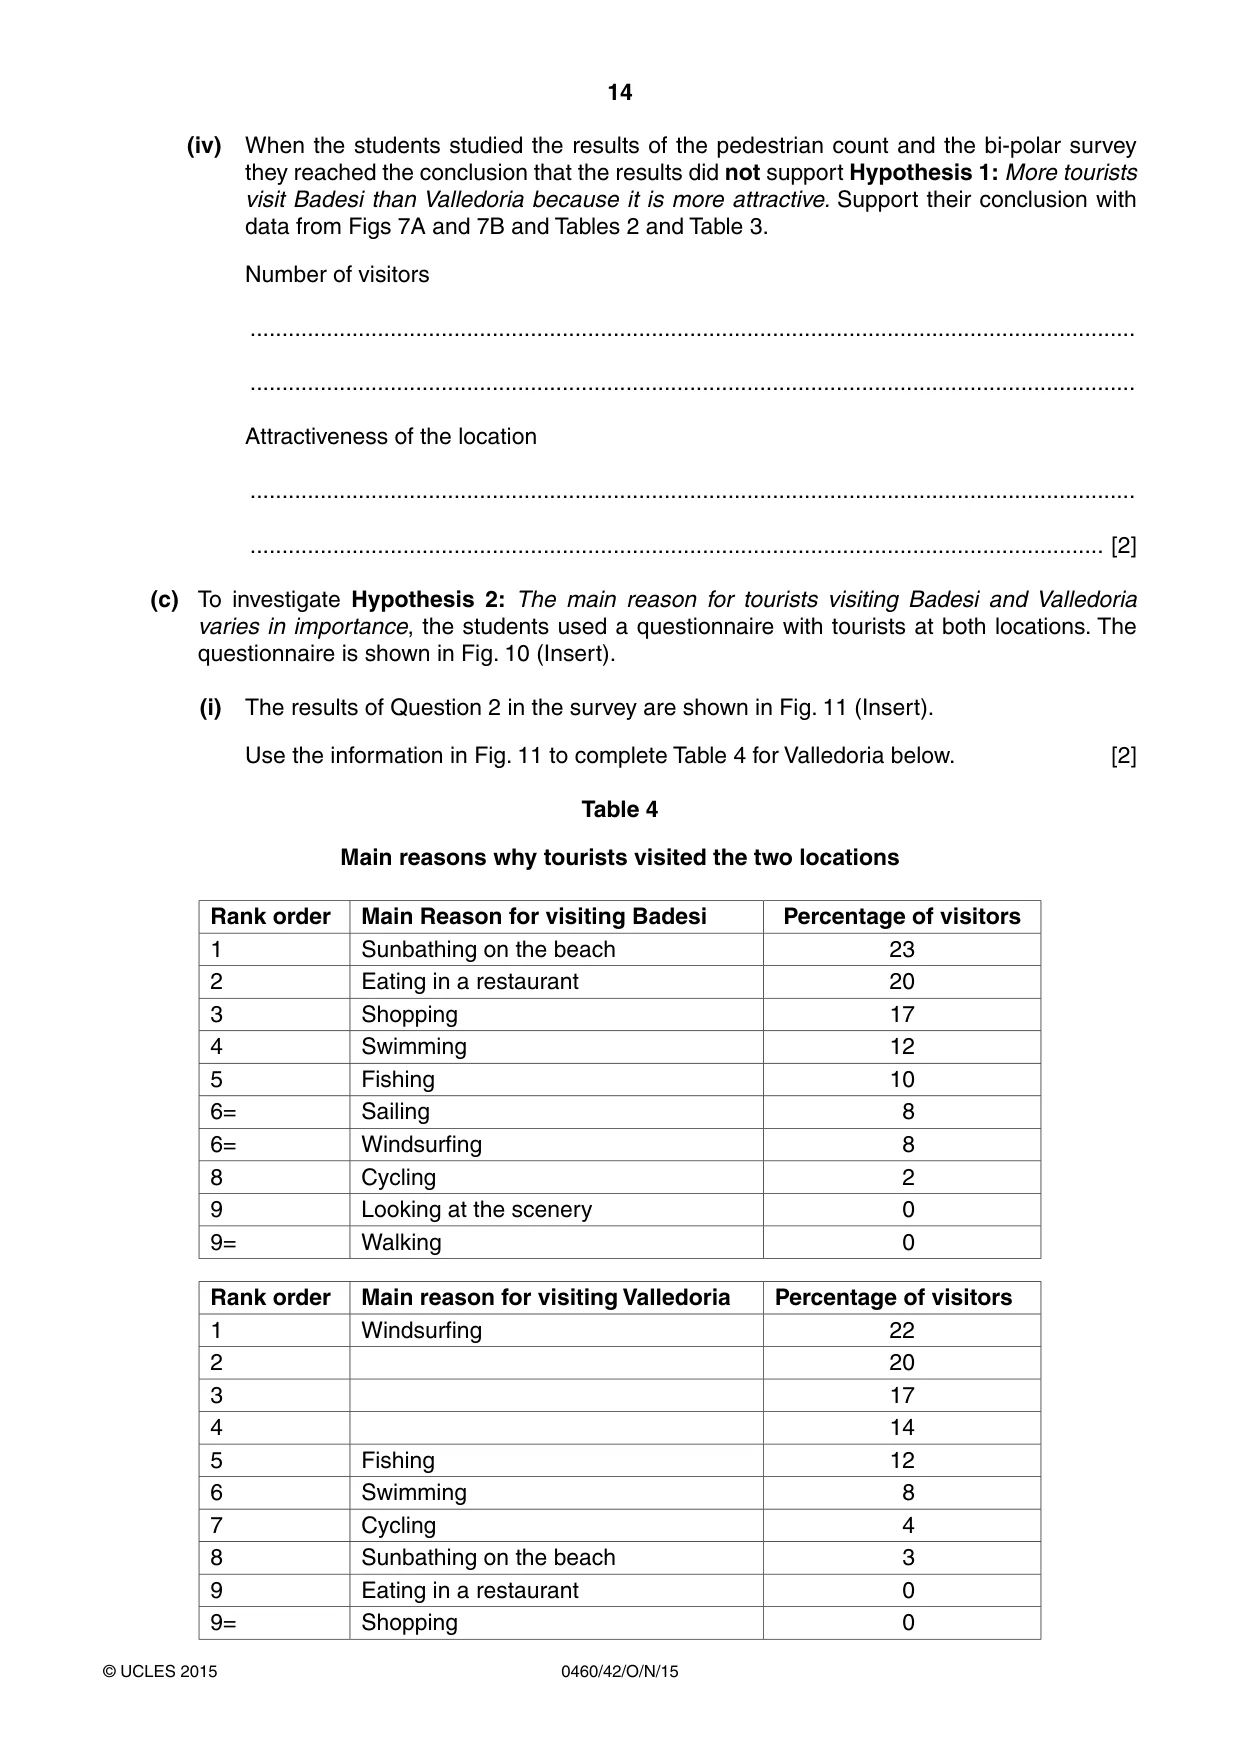
14 0460/42/O/N/15 © UCLES 2015 (iv) When the students studied the results of the pedestrian count and the bi-polar survey they reached the conclusion that the results did not support Hypothesis 1: More tourists visit Badesi than Valledoria because it is more attractive. Support their conclusion with data from Figs 7A and 7B and Tables 2 and Table 3. Number of visitors … … Attractiveness of the location … … [2] (c) To investigate Hypothesis 2: The main reason for tourists visiting Badesi and Valledoria varies in importance, the students used a questionnaire with tourists at both locations. The questionnaire is shown in Fig. 10 (Insert). (i) The results of Question 2 in the survey are shown in Fig. 11 (Insert). Use the information in Fig. 11 to complete Table 4 for Valledoria below. [2] Table 4 Main reasons why tourists visited the two locations Rank order Main Reason for visiting Badesi Percentage of visitors 1 Sunbathing on the beach 23 2 Eating in a restaurant 20 3 Shopping 17 4 Swimming 12 5 Fishing 10 6= Sailing 8 6= Windsurfing 8 8 Cycling 2 9 Looking at the scenery 0 9= Walking 0 Rank order Main reason for visiting Valledoria Percentage of visitors 1 Windsurfing 22 2 20 3 17 4 14 5 Fishing 12 6 Swimming 8 7 Cycling 4 8 Sunbathing on the beach 3 9 Eating in a restaurant 0 9= Shopping 0
Question paper, page 15
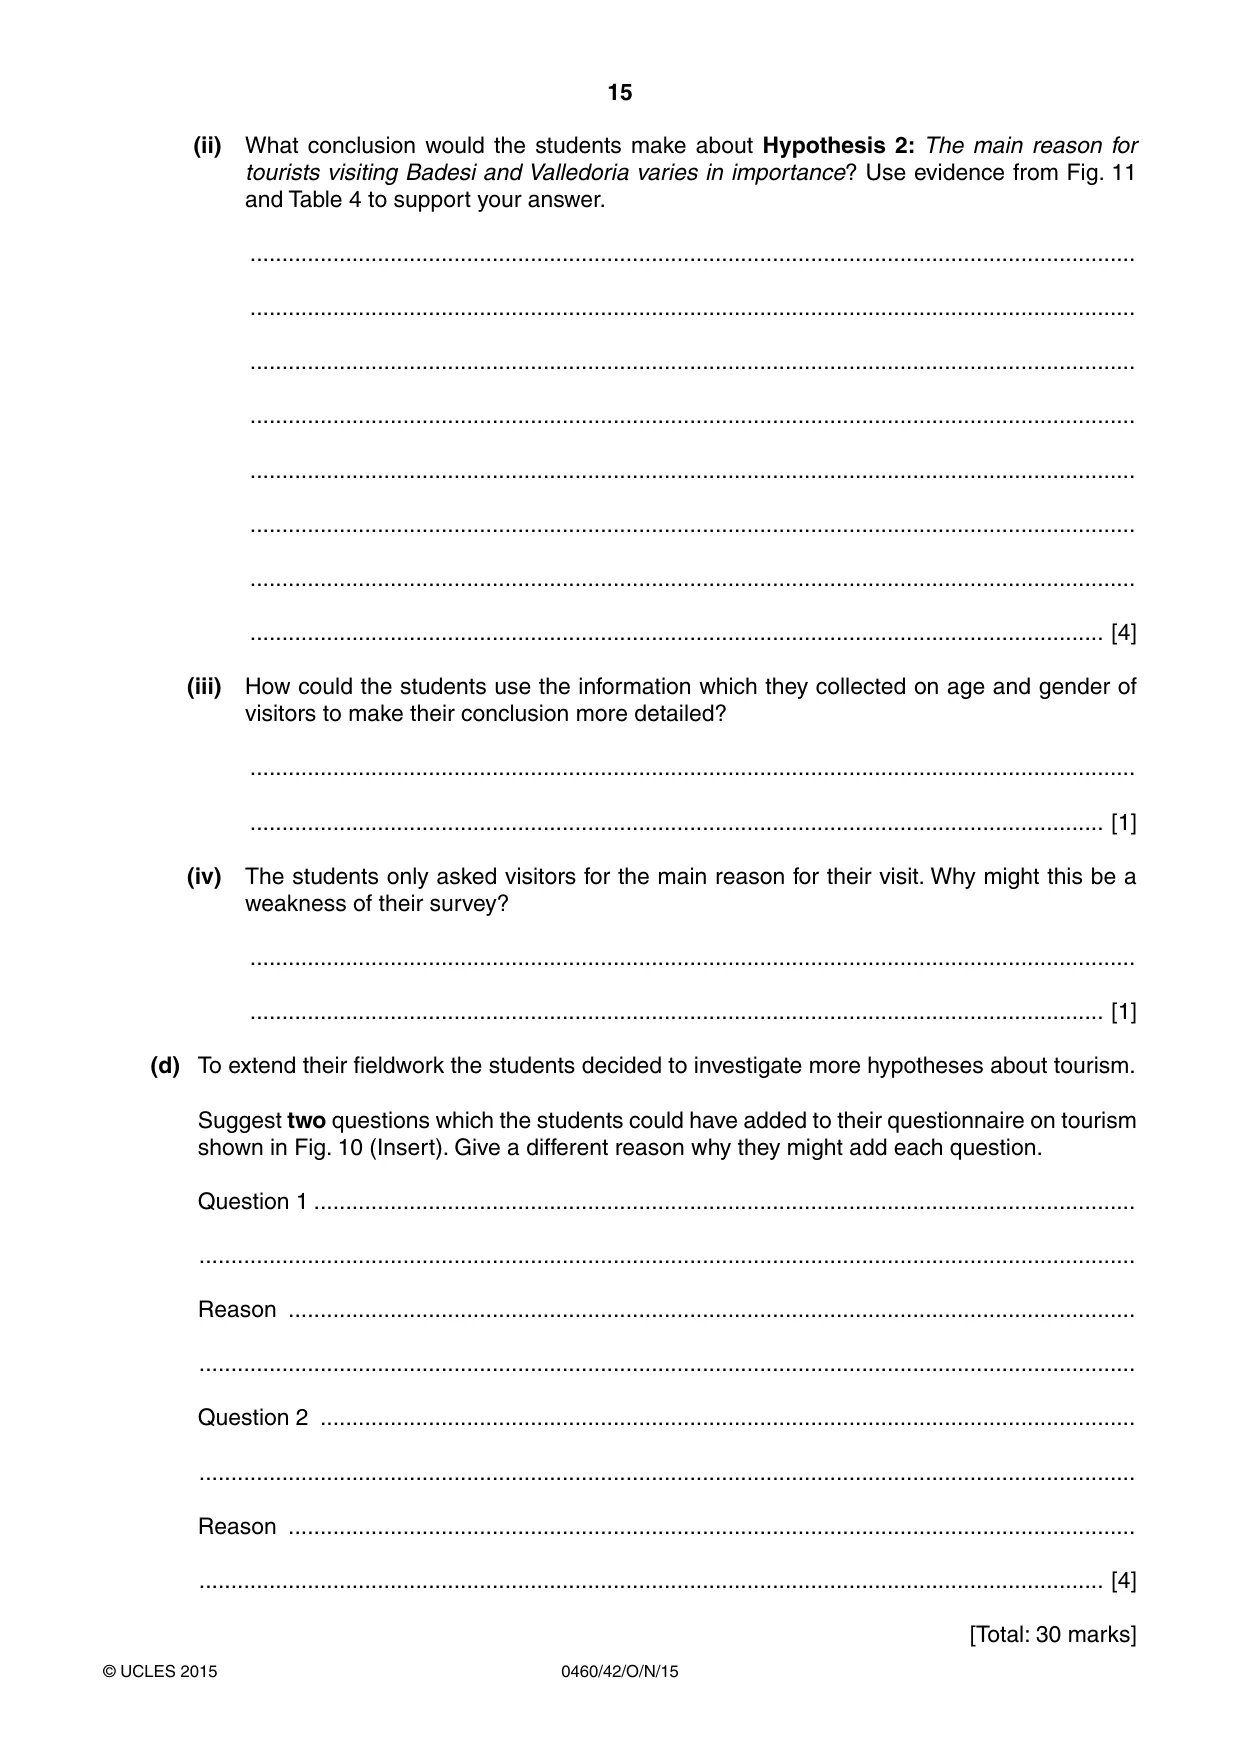
15 0460/42/O/N/15 © UCLES 2015 (ii) What conclusion would the students make about Hypothesis 2: The main reason for tourists visiting Badesi and Valledoria varies in importance? Use evidence from Fig. 11 and Table 4 to support your answer. … … … … … … … … [4] (iii) How could the students use the information which they collected on age and gender of visitors to make their conclusion more detailed? … … [1] (iv) The students only asked visitors for the main reason for their visit. Why might this be a weakness of their survey? … … [1] (d) To extend their fieldwork the students decided to investigate more hypotheses about tourism. Suggest two questions which the students could have added to their questionnaire on tourism shown in Fig. 10 (Insert). Give a different reason why they might add each question. Question 1 … … Reason … … Question 2 … … Reason … … [4] [Total: 30 marks]
Question paper, page 16
16 0460/42/O/N/15 © UCLES 2015 Additional Pages If you use the following lined page to complete the answer(s) to any question(s), the question number(s) must be clearly shown. … … … … … … … … … … … … … … … … … … … … … … … … …
Question paper, page 17
17 0460/42/O/N/15 © UCLES 2015 … … … … … … … … … … … … … … … … … … … … … … … … … …
Question paper, page 18
18 0460/42/O/N/15 © UCLES 2015 BLANK PAGE
Question paper, page 19
19 0460/42/O/N/15 © UCLES 2015 BLANK PAGE
Question paper, page 20
20 0460/42/O/N/15 © UCLES 2015 Permission to reproduce items where third-party owned material protected by copyright is included has been sought and cleared where possible. Every reasonable effort has been made by the publisher (UCLES) to trace copyright holders, but if any items requiring clearance have unwittingly been included, the publisher will be pleased to make amends at the earliest possible opportunity. To avoid the issue of disclosure of answer-related information to candidates, all copyright acknowledgements are reproduced online in the Cambridge International Examinations Copyright Acknowledgements Booklet. This is produced for each series of examinations and is freely available to download at www.cie.org.uk after the live examination series. Cambridge International Examinations is part of the Cambridge Assessment Group. Cambridge Assessment is the brand name of University of Cambridge Local Examinations Syndicate (UCLES), which is itself a department of the University of Cambridge. BLANK PAGE
Mark scheme, page 1
® IGCSE is the registered trademark of Cambridge International Examinations. CAMBRIDGE INTERNATIONAL EXAMINATIONS Cambridge International General Certificate of Secondary Education MARK SCHEME for the October/November 2015 series 0460 GEOGRAPHY 0460/42 Paper 4 (Alternative to Coursework), maximum raw mark 60 This mark scheme is published as an aid to teachers and candidates, to indicate the requirements of the examination. It shows the basis on which Examiners were instructed to award marks. It does not indicate the details of the discussions that took place at an Examiners’ meeting before marking began, which would have considered the acceptability of alternative answers. Mark schemes should be read in conjunction with the question paper and the Principal Examiner Report for Teachers. Cambridge will not enter into discussions about these mark schemes. Cambridge is publishing the mark schemes for the October/November 2015 series for most Cambridge IGCSE®, Cambridge International A and AS Level components and some Cambridge O Level components.
Mark scheme, page 2
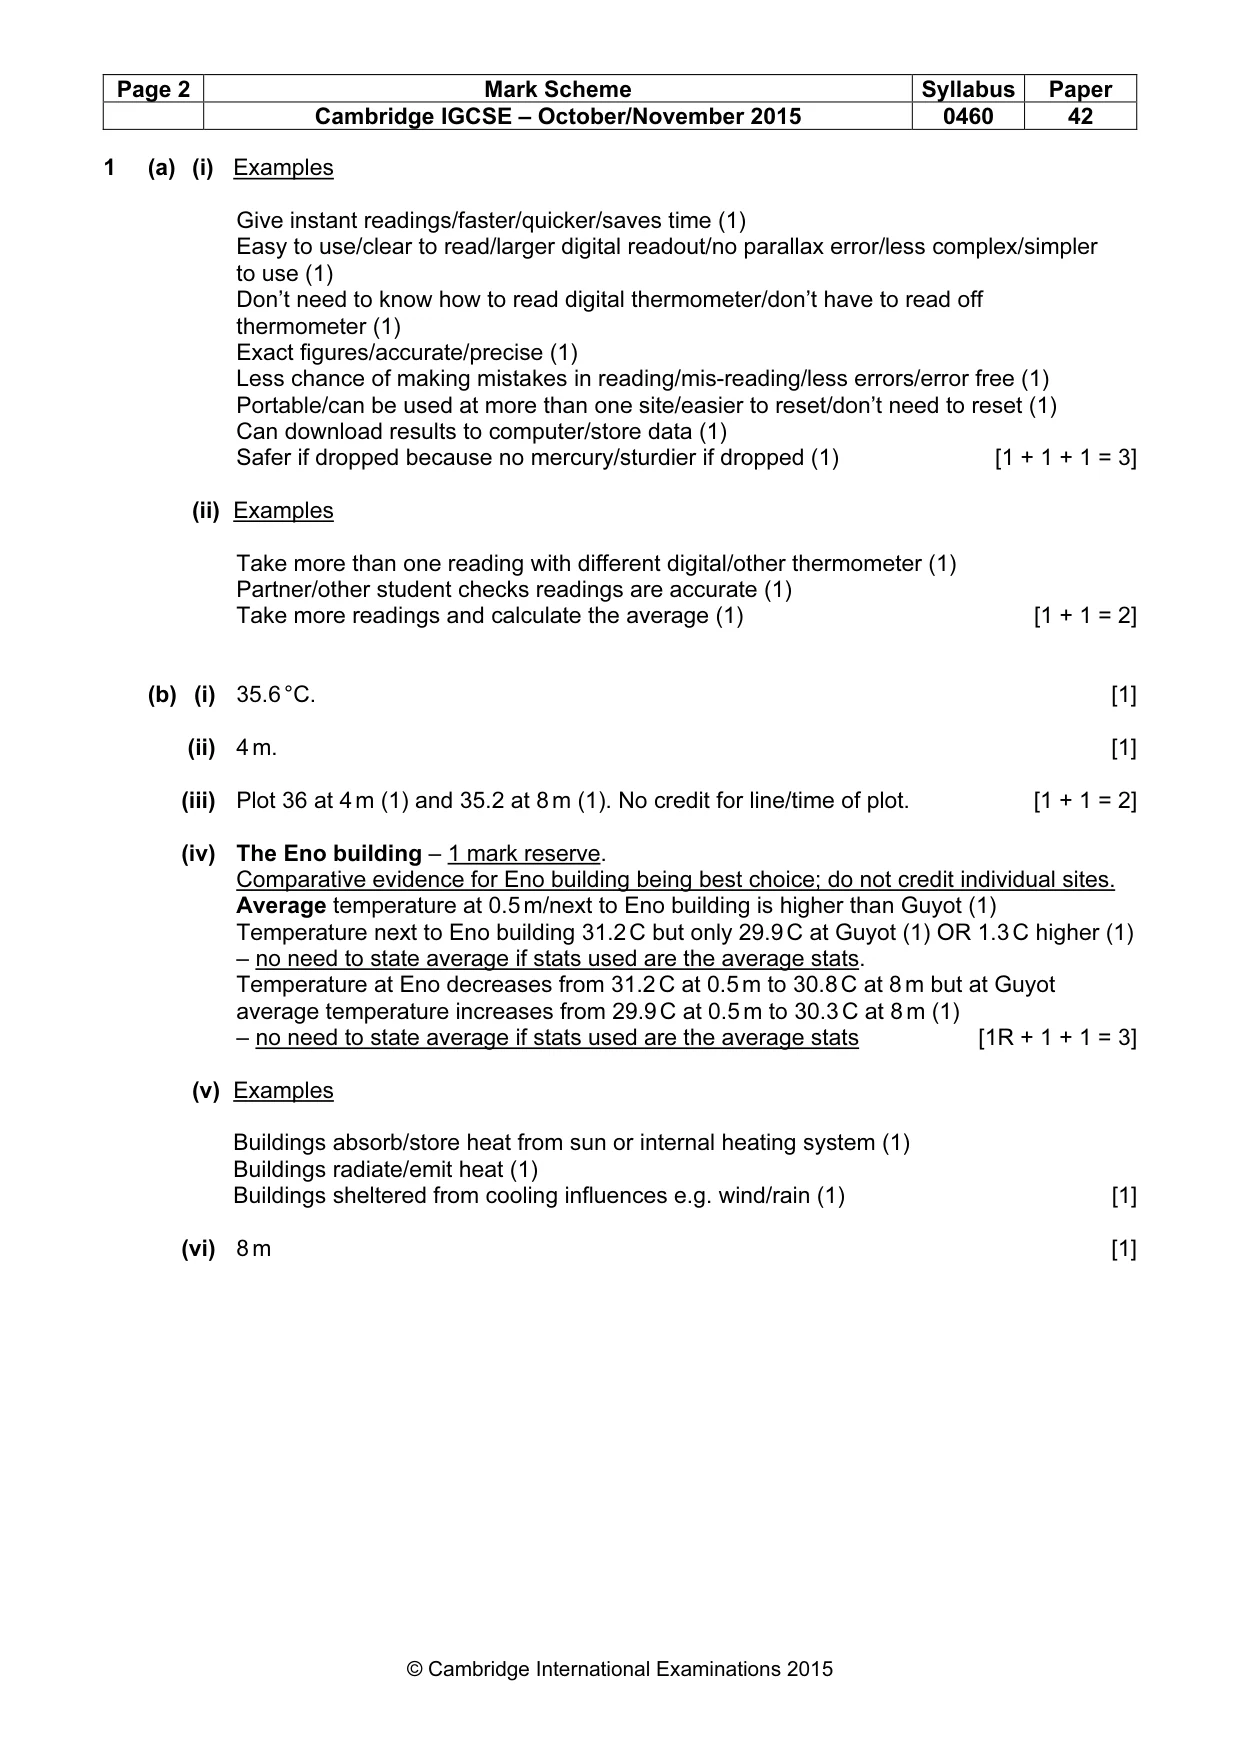
Page 2 Mark Scheme Syllabus Paper Cambridge IGCSE – October/November 2015 0460 42 © Cambridge International Examinations 2015 1 (a) (i) Examples Give instant readings/faster/quicker/saves time (1) Easy to use/clear to read/larger digital readout/no parallax error/less complex/simpler to use (1) Don’t need to know how to read digital thermometer/don’t have to read off thermometer (1) Exact figures/accurate/precise (1) Less chance of making mistakes in reading/mis-reading/less errors/error free (1) Portable/can be used at more than one site/easier to reset/don’t need to reset (1) Can download results to computer/store data (1) Safer if dropped because no mercury/sturdier if dropped (1) [1 + 1 + 1 = 3] (ii) Examples Take more than one reading with different digital/other thermometer (1) Partner/other student checks readings are accurate (1) Take more readings and calculate the average (1) [1 + 1 = 2] (b) (i) 35.6 °C. [1] (ii) 4 m. [1] (iii) Plot 36 at 4 m (1) and 35.2 at 8 m (1). No credit for line/time of plot. [1 + 1 = 2] (iv) The Eno building – 1 mark reserve. Comparative evidence for Eno building being best choice; do not credit individual sites. Average temperature at 0.5 m/next to Eno building is higher than Guyot (1) Temperature next to Eno building 31.2 C but only 29.9 C at Guyot (1) OR 1.3 C higher (1) – no need to state average if stats used are the average stats. Temperature at Eno decreases from 31.2 C at 0.5 m to 30.8 C at 8 m but at Guyot average temperature increases from 29.9 C at 0.5 m to 30.3 C at 8 m (1) – no need to state average if stats used are the average stats [1R + 1 + 1 = 3] (v) Examples Buildings absorb/store heat from sun or internal heating system (1) Buildings radiate/emit heat (1) Buildings sheltered from cooling influences e.g. wind/rain (1) [1] (vi) 8 m [1]
Mark scheme, page 3
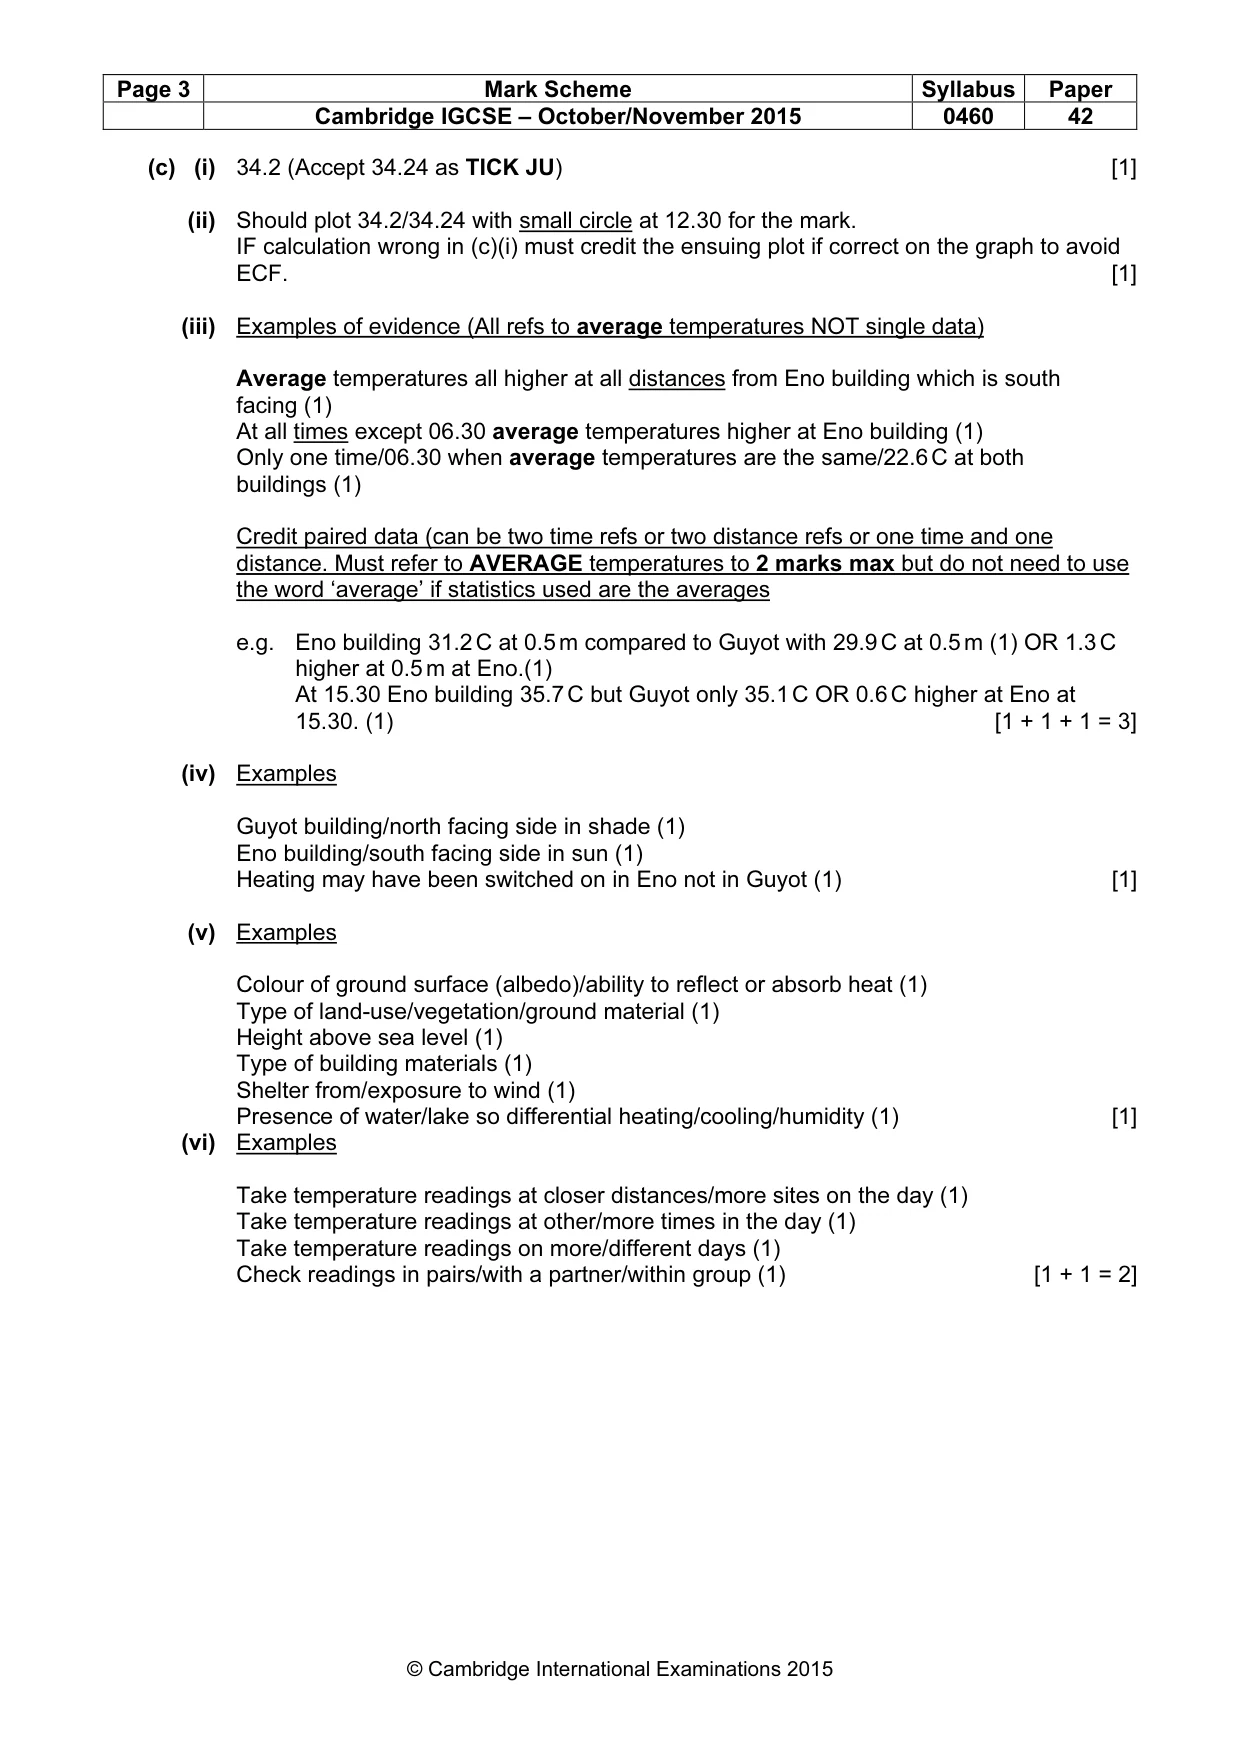
Page 3 Mark Scheme Syllabus Paper Cambridge IGCSE – October/November 2015 0460 42 © Cambridge International Examinations 2015 (c) (i) 34.2 (Accept 34.24 as TICK JU) [1] (ii) Should plot 34.2/34.24 with small circle at 12.30 for the mark. IF calculation wrong in (c)(i) must credit the ensuing plot if correct on the graph to avoid ECF. [1] (iii) Examples of evidence (All refs to average temperatures NOT single data) Average temperatures all higher at all distances from Eno building which is south facing (1) At all times except 06.30 average temperatures higher at Eno building (1) Only one time/06.30 when average temperatures are the same/22.6 C at both buildings (1) Credit paired data (can be two time refs or two distance refs or one time and one distance. Must refer to AVERAGE temperatures to 2 marks max but do not need to use the word ‘average’ if statistics used are the averages e.g. Eno building 31.2 C at 0.5 m compared to Guyot with 29.9 C at 0.5 m (1) OR 1.3 C higher at 0.5 m at Eno.(1) At 15.30 Eno building 35.7 C but Guyot only 35.1 C OR 0.6 C higher at Eno at 15.30. (1) [1 + 1 + 1 = 3] (iv) Examples Guyot building/north facing side in shade (1) Eno building/south facing side in sun (1) Heating may have been switched on in Eno not in Guyot (1) [1] (v) Examples Colour of ground surface (albedo)/ability to reflect or absorb heat (1) Type of land-use/vegetation/ground material (1) Height above sea level (1) Type of building materials (1) Shelter from/exposure to wind (1) Presence of water/lake so differential heating/cooling/humidity (1) [1] (vi) Examples Take temperature readings at closer distances/more sites on the day (1) Take temperature readings at other/more times in the day (1) Take temperature readings on more/different days (1) Check readings in pairs/with a partner/within group (1) [1 + 1 = 2]
Mark scheme, page 4
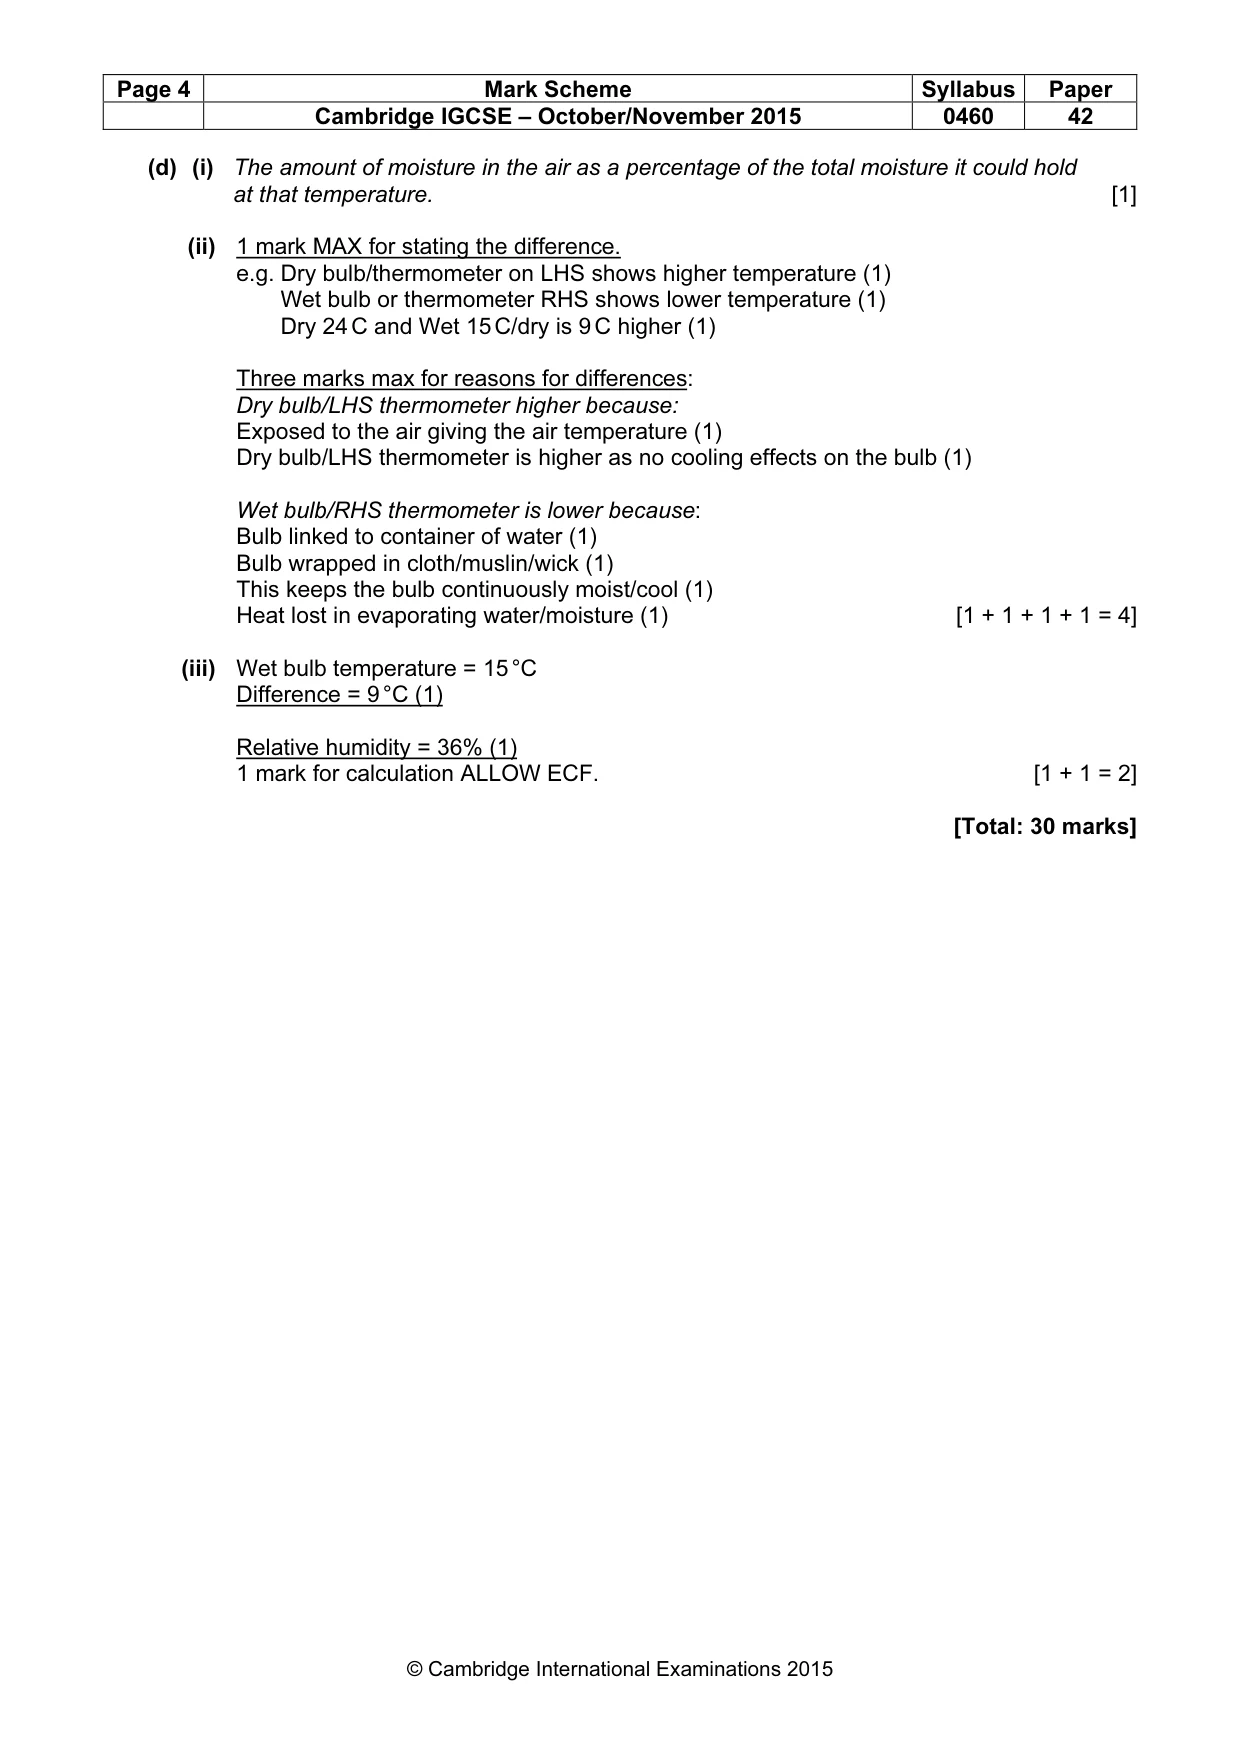
Page 4 Mark Scheme Syllabus Paper Cambridge IGCSE – October/November 2015 0460 42 © Cambridge International Examinations 2015 (d) (i) The amount of moisture in the air as a percentage of the total moisture it could hold at that temperature. [1] (ii) 1 mark MAX for stating the difference. e.g. Dry bulb/thermometer on LHS shows higher temperature (1) Wet bulb or thermometer RHS shows lower temperature (1) Dry 24 C and Wet 15 C/dry is 9 C higher (1) Three marks max for reasons for differences: Dry bulb/LHS thermometer higher because: Exposed to the air giving the air temperature (1) Dry bulb/LHS thermometer is higher as no cooling effects on the bulb (1) Wet bulb/RHS thermometer is lower because: Bulb linked to container of water (1) Bulb wrapped in cloth/muslin/wick (1) This keeps the bulb continuously moist/cool (1) Heat lost in evaporating water/moisture (1) [1 + 1 + 1 + 1 = 4] (iii) Wet bulb temperature = 15 °C Difference = 9 °C (1) Relative humidity = 36% (1) 1 mark for calculation ALLOW ECF. [1 + 1 = 2] [Total: 30 marks]
Mark scheme, page 5
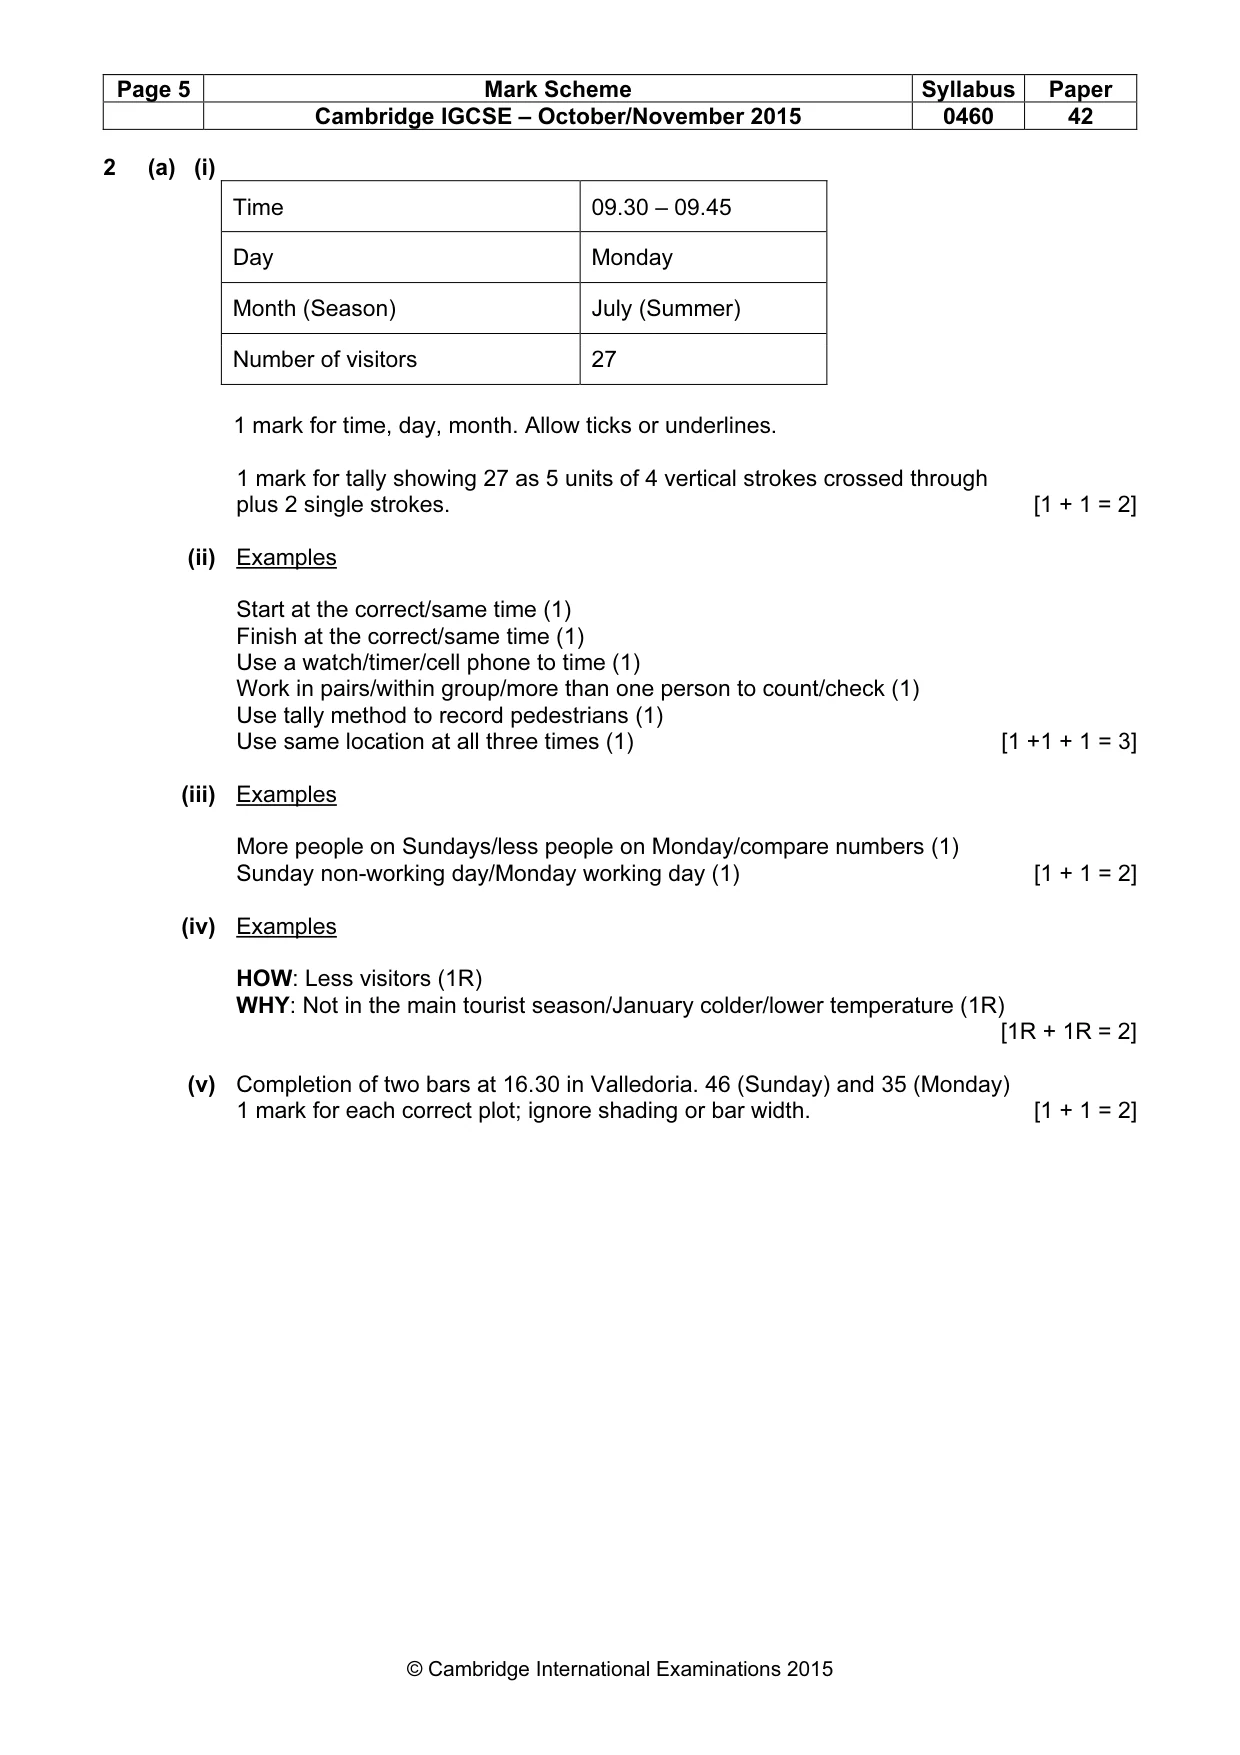
Page 5 Mark Scheme Syllabus Paper Cambridge IGCSE – October/November 2015 0460 42 © Cambridge International Examinations 2015 2 (a) (i) Time 09.30 – 09.45 Day Monday Month (Season) July (Summer) Number of visitors 27 1 mark for time, day, month. Allow ticks or underlines. 1 mark for tally showing 27 as 5 units of 4 vertical strokes crossed through plus 2 single strokes. [1 + 1 = 2] (ii) Examples Start at the correct/same time (1) Finish at the correct/same time (1) Use a watch/timer/cell phone to time (1) Work in pairs/within group/more than one person to count/check (1) Use tally method to record pedestrians (1) Use same location at all three times (1) [1 +1 + 1 = 3] (iii) Examples More people on Sundays/less people on Monday/compare numbers (1) Sunday non-working day/Monday working day (1) [1 + 1 = 2] (iv) Examples HOW: Less visitors (1R) WHY: Not in the main tourist season/January colder/lower temperature (1R) [1R + 1R = 2] (v) Completion of two bars at 16.30 in Valledoria. 46 (Sunday) and 35 (Monday) 1 mark for each correct plot; ignore shading or bar width. [1 + 1 = 2]
Mark scheme, page 6
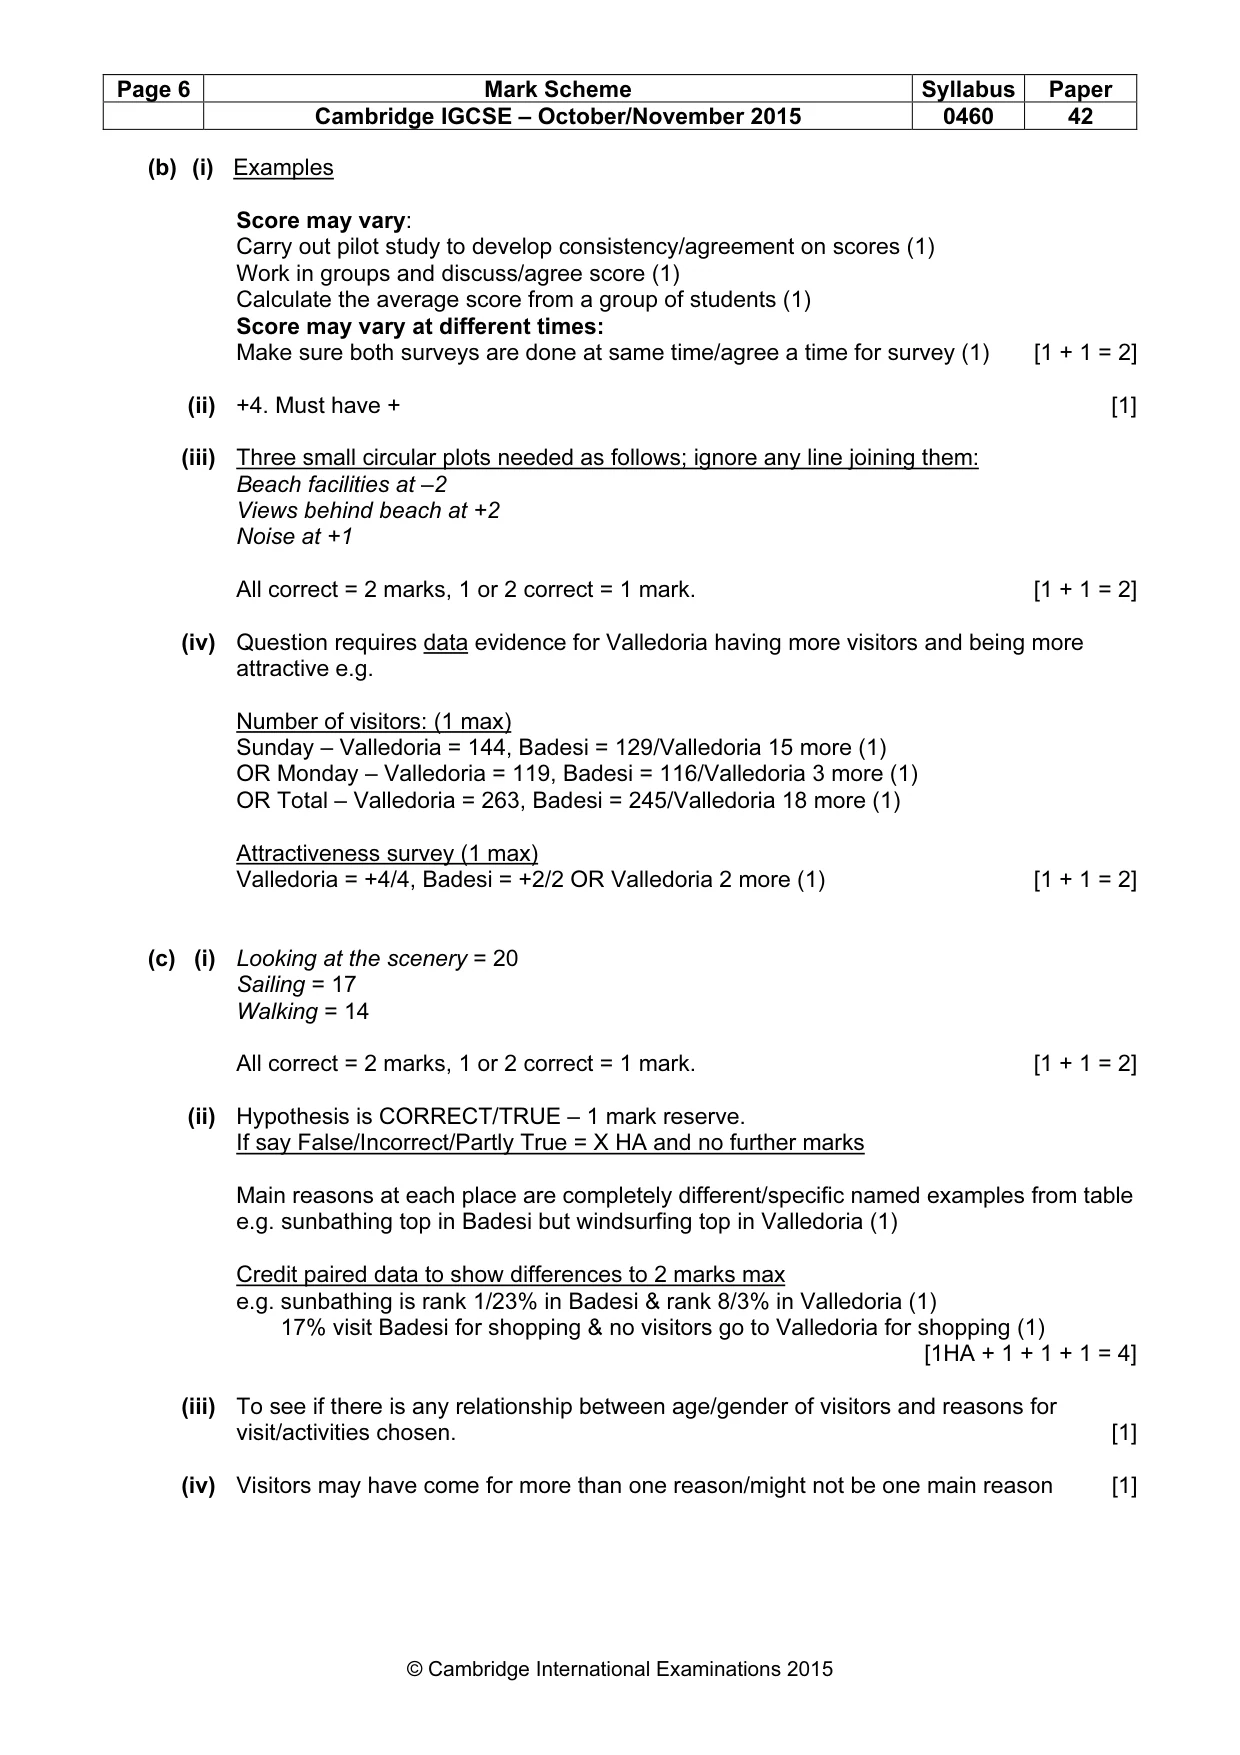
Page 6 Mark Scheme Syllabus Paper Cambridge IGCSE – October/November 2015 0460 42 © Cambridge International Examinations 2015 (b) (i) Examples Score may vary: Carry out pilot study to develop consistency/agreement on scores (1) Work in groups and discuss/agree score (1) Calculate the average score from a group of students (1) Score may vary at different times: Make sure both surveys are done at same time/agree a time for survey (1) [1 + 1 = 2] (ii) +4. Must have + [1] (iii) Three small circular plots needed as follows; ignore any line joining them: Beach facilities at –2 Views behind beach at +2 Noise at +1 All correct = 2 marks, 1 or 2 correct = 1 mark. [1 + 1 = 2] (iv) Question requires data evidence for Valledoria having more visitors and being more attractive e.g. Number of visitors: (1 max) Sunday – Valledoria = 144, Badesi = 129/Valledoria 15 more (1) OR Monday – Valledoria = 119, Badesi = 116/Valledoria 3 more (1) OR Total – Valledoria = 263, Badesi = 245/Valledoria 18 more (1) Attractiveness survey (1 max) Valledoria = +4/4, Badesi = +2/2 OR Valledoria 2 more (1) [1 + 1 = 2] (c) (i) Looking at the scenery = 20 Sailing = 17 Walking = 14 All correct = 2 marks, 1 or 2 correct = 1 mark. [1 + 1 = 2] (ii) Hypothesis is CORRECT/TRUE – 1 mark reserve. If say False/Incorrect/Partly True = X HA and no further marks Main reasons at each place are completely different/specific named examples from table e.g. sunbathing top in Badesi but windsurfing top in Valledoria (1) Credit paired data to show differences to 2 marks max e.g. sunbathing is rank 1/23% in Badesi & rank 8/3% in Valledoria (1) 17% visit Badesi for shopping & no visitors go to Valledoria for shopping (1) [1HA + 1 + 1 + 1 = 4] (iii) To see if there is any relationship between age/gender of visitors and reasons for visit/activities chosen. [1] (iv) Visitors may have come for more than one reason/might not be one main reason [1]
Mark scheme, page 7
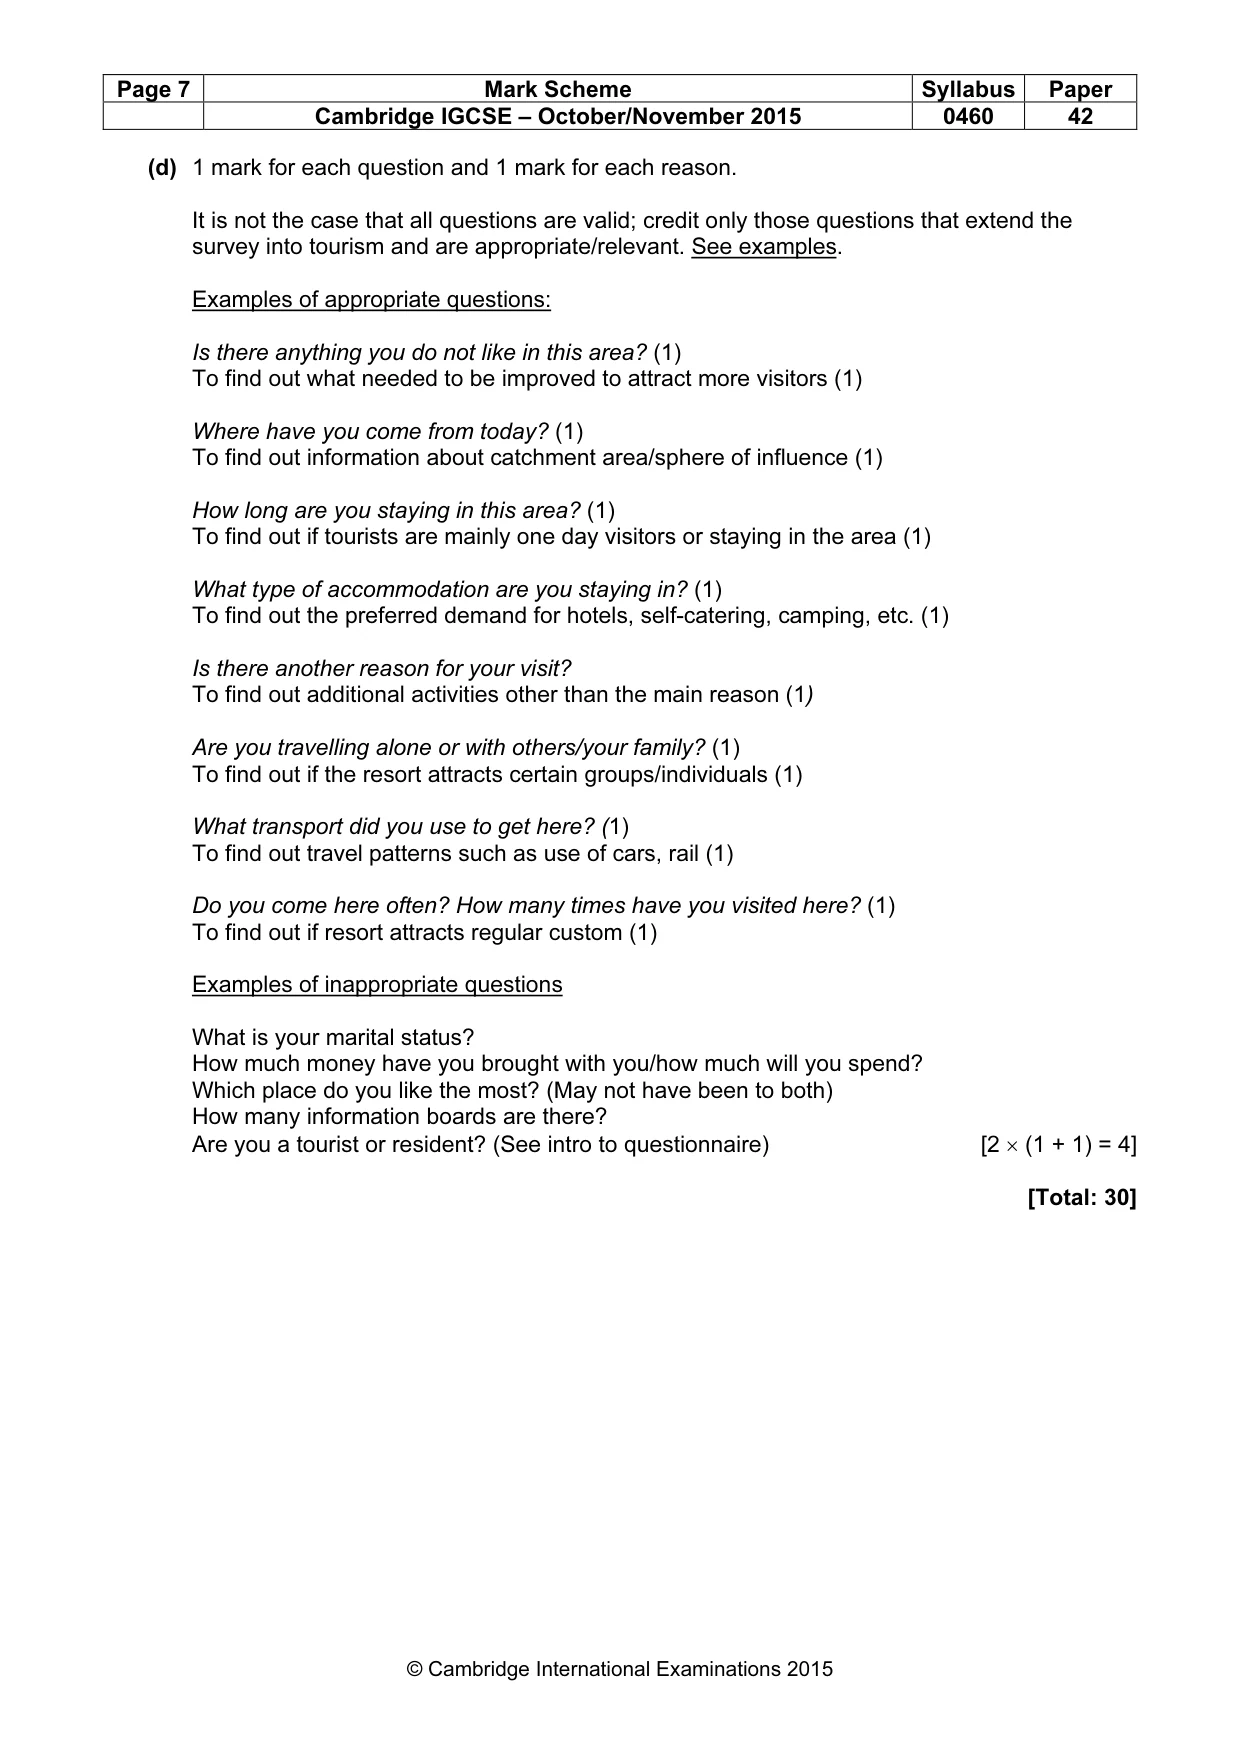
Page 7 Mark Scheme Syllabus Paper Cambridge IGCSE – October/November 2015 0460 42 © Cambridge International Examinations 2015 (d) 1 mark for each question and 1 mark for each reason. It is not the case that all questions are valid; credit only those questions that extend the survey into tourism and are appropriate/relevant. See examples. Examples of appropriate questions: Is there anything you do not like in this area? (1) To find out what needed to be improved to attract more visitors (1) Where have you come from today? (1) To find out information about catchment area/sphere of influence (1) How long are you staying in this area? (1) To find out if tourists are mainly one day visitors or staying in the area (1) What type of accommodation are you staying in? (1) To find out the preferred demand for hotels, self-catering, camping, etc. (1) Is there another reason for your visit? To find out additional activities other than the main reason (1) Are you travelling alone or with others/your family? (1) To find out if the resort attracts certain groups/individuals (1) What transport did you use to get here? (1) To find out travel patterns such as use of cars, rail (1) Do you come here often? How many times have you visited here? (1) To find out if resort attracts regular custom (1) Examples of inappropriate questions What is your marital status? How much money have you brought with you/how much will you spend? Which place do you like the most? (May not have been to both) How many information boards are there? Are you a tourist or resident? (See intro to questionnaire) [2 × (1 + 1) = 4] [Total: 30]
What you needed in this session
Cambridge’s own grade thresholds for 2015 Oct/Nov, Paper 4 · Variant 2. A higher threshold means an easier paper — the bar moves with how the cohort did.