Cambridge IGCSE Geography 0460 — 2010 May/June Paper 1 · Variant 1
0460/11/M/J/10 · 75 marks · ≈84 min
The question paper and its mark scheme, free to read here and free to download. This is Cambridge’s own paper, exactly as it was sat.
Question paper12 pages


Mark scheme14 pages
Answers below. Sit the paper first if you are practising.
Paper as text
Question paper, page 1
This document consists of 10 printed pages, 2 blank pages and 1 insert. DC (SJF5459/CGW) 11595/5 © UCLES 2010 [Turn over UNIVERSITY OF CAMBRIDGE INTERNATIONAL EXAMINATIONS International General Certificate of Secondary Education READ THESE INSTRUCTIONS FIRST If you have been given an Answer Booklet, follow the instructions on the front cover of the Booklet. Write your Centre number, candidate number and name on all the work you hand in. Write in dark blue or black pen. You may use a soft pencil for any diagrams, graphs or rough working. Do not use staples, paper clips, highlighters, glue or correction fluid. Answer three questions. Sketch maps and diagrams should be drawn whenever they serve to illustrate an answer. The Insert contains Photographs A and B for Question 2, Photographs C and D for Question 3 and Photographs E, F and Fig. 8 for Question 5. At the end of the examination, fasten all you work securely together. The number of marks is given in brackets [ ] at the end of each question or part question. * 0 3 3 1 9 1 7 3 5 0 * GEOGRAPHY 0460/11 Paper 1 May/June 2010 1 hour 45 minutes Additional Materials: Answer Booklet/Paper Ruler www.theallpapers.com
Question paper, page 2
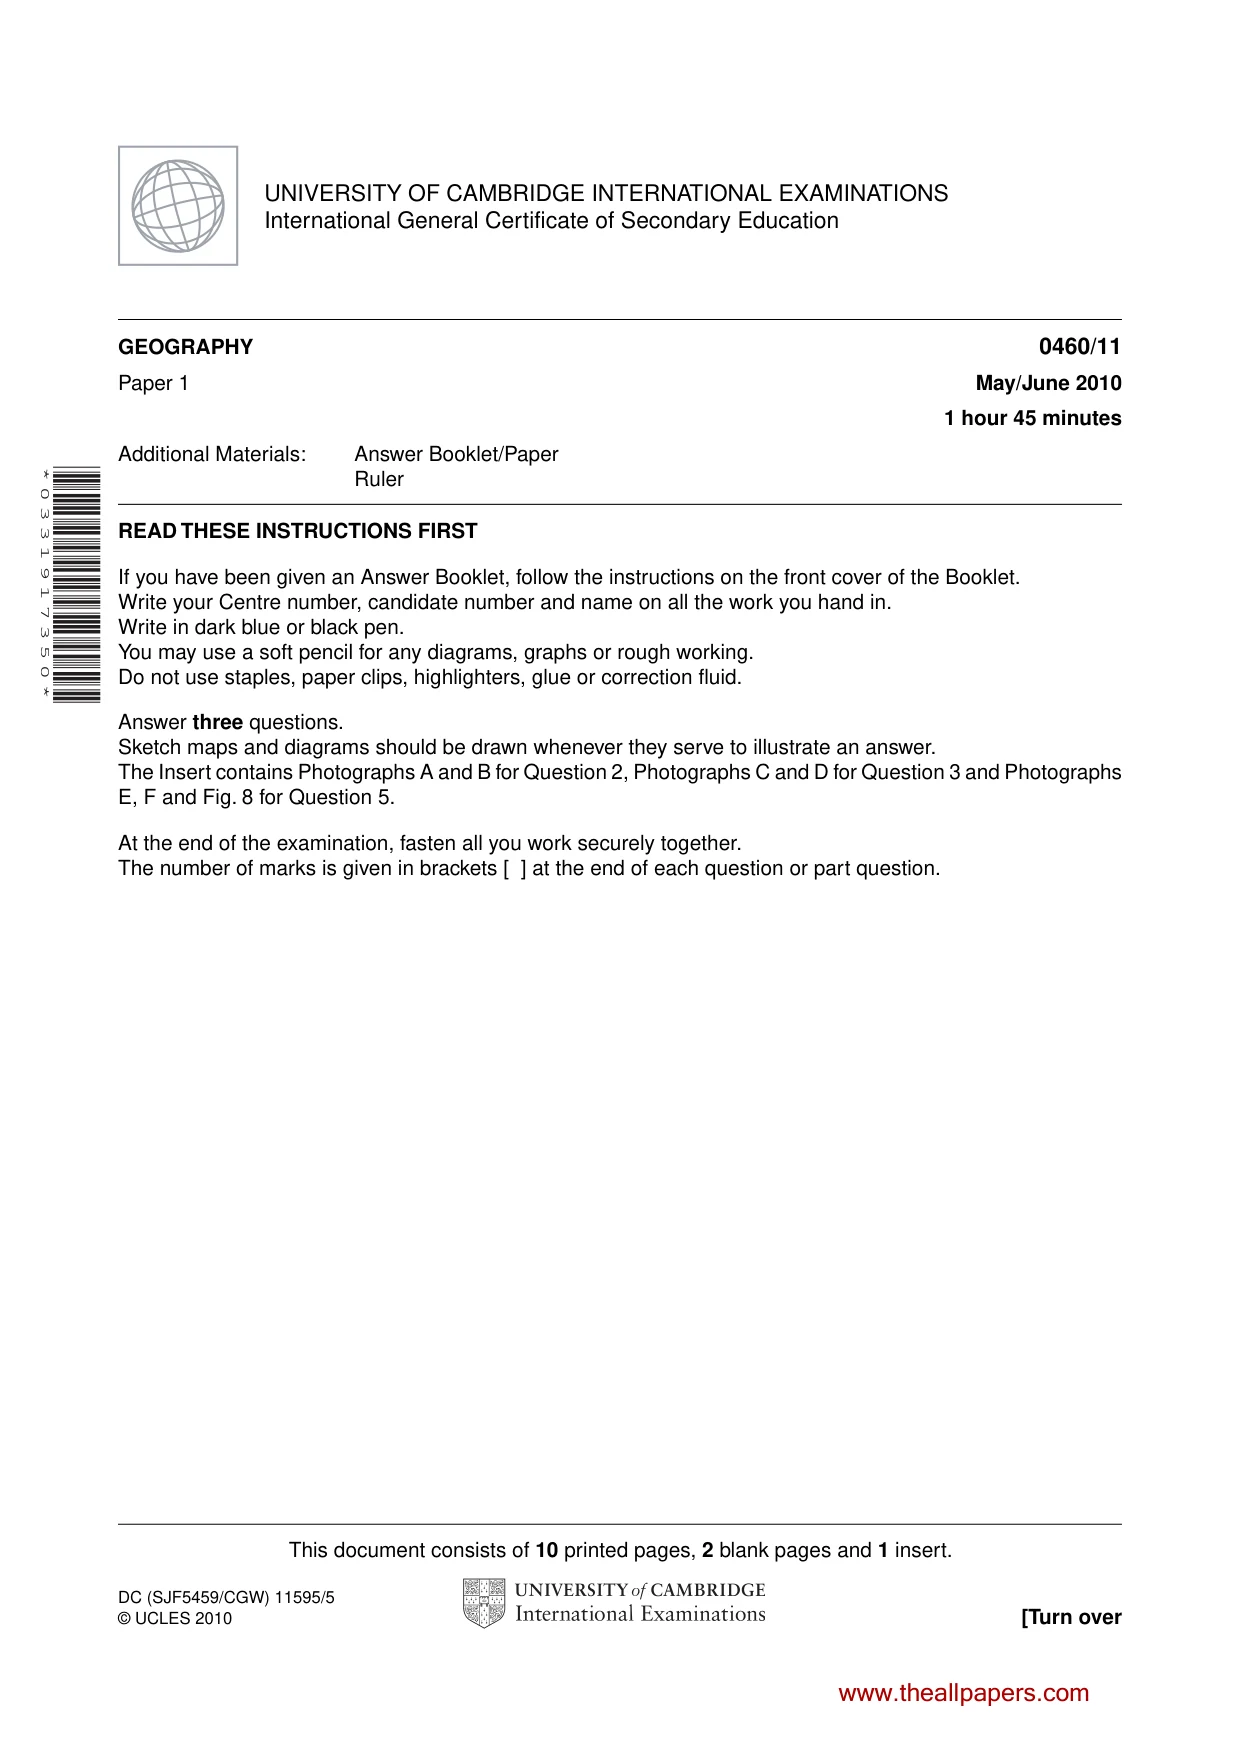
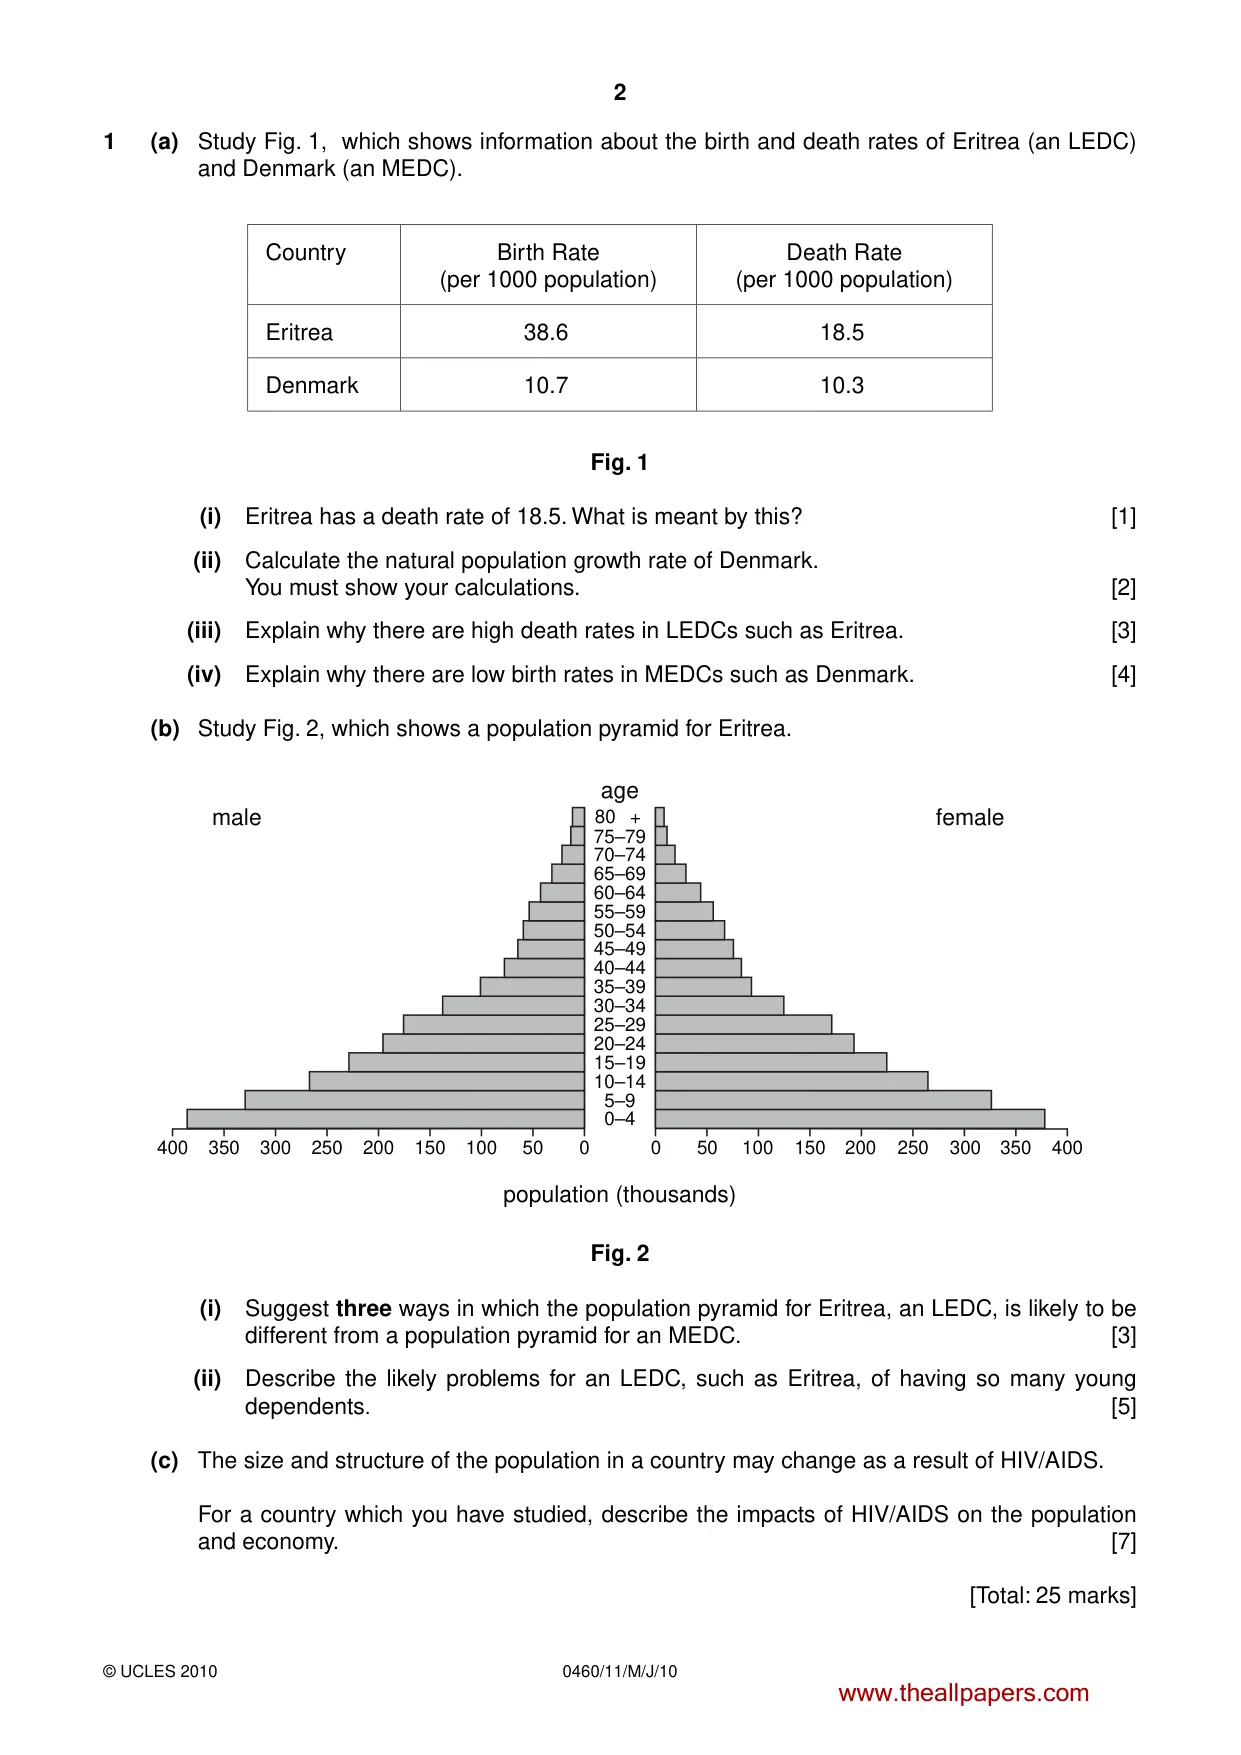
2 0460/11/M/J/10 © UCLES 2010 1 (a) Study Fig. 1, which shows information about the birth and death rates of Eritrea (an LEDC) and Denmark (an MEDC). Country Birth Rate (per 1000 population) Death Rate (per 1000 population) Eritrea 38.6 18.5 Denmark 10.7 10.3 Fig. 1 (i) Eritrea has a death rate of 18.5. What is meant by this? [1] (ii) Calculate the natural population growth rate of Denmark. You must show your calculations. [2] (iii) Explain why there are high death rates in LEDCs such as Eritrea. [3] (iv) Explain why there are low birth rates in MEDCs such as Denmark. [4] (b) Study Fig. 2, which shows a population pyramid for Eritrea. 50 0 0–4 5–9 population (thousands) 10–14 15–19 20–24 25–29 30–34 35–39 40–44 45–49 50–54 55–59 60–64 65–69 70–74 75–79 age female male 80 + 100 150 200 250 300 350 400 50 0 100 150 200 250 300 350 400 Fig. 2 (i) Suggest three ways in which the population pyramid for Eritrea, an LEDC, is likely to be different from a population pyramid for an MEDC. [3] (ii) Describe the likely problems for an LEDC, such as Eritrea, of having so many young dependents. [5] (c) The size and structure of the population in a country may change as a result of HIV/AIDS. For a country which you have studied, describe the impacts of HIV/AIDS on the population and economy. [7] [Total: 25 marks] www.theallpapers.com
Question paper, page 3
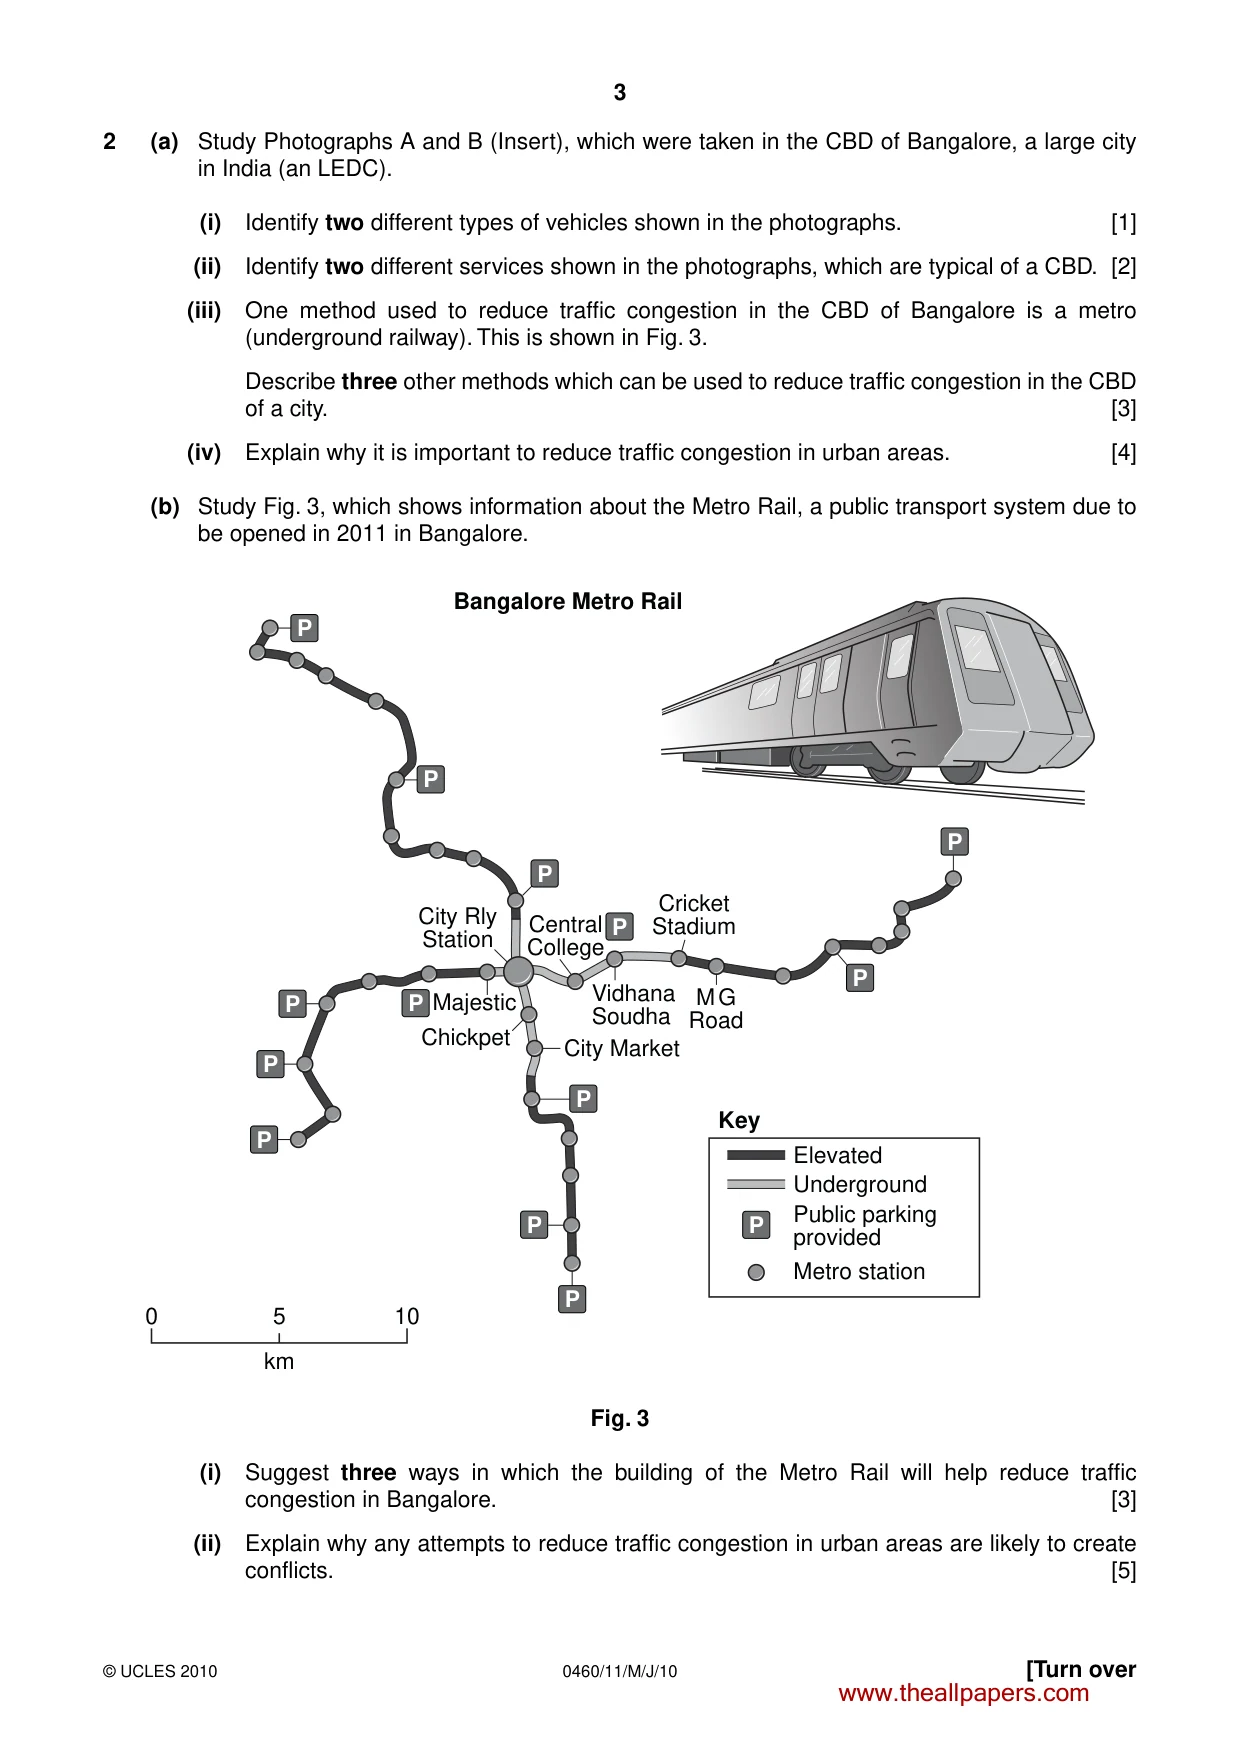
3 0460/11/M/J/10 © UCLES 2010 [Turn over 2 (a) Study Photographs A and B (Insert), which were taken in the CBD of Bangalore, a large city in India (an LEDC). (i) Identify two different types of vehicles shown in the photographs. [1] (ii) Identify two different services shown in the photographs, which are typical of a CBD. [2] (iii) One method used to reduce traffic congestion in the CBD of Bangalore is a metro (underground railway). This is shown in Fig. 3. Describe three other methods which can be used to reduce traffic congestion in the CBD of a city. [3] (iv) Explain why it is important to reduce traffic congestion in urban areas. [4] (b) Study Fig. 3, which shows information about the Metro Rail, a public transport system due to be opened in 2011 in Bangalore. Chickpet City Market 0 10 5 km Elevated Key Underground Metro station Public parking provided Vidhana Soudha Cricket Stadium Bangalore Metro Rail Central College M G Road Majestic City Rly Station P P P P P P P P P P P P P P Fig. 3 (i) Suggest three ways in which the building of the Metro Rail will help reduce traffic congestion in Bangalore. [3] (ii) Explain why any attempts to reduce traffic congestion in urban areas are likely to create conflicts. [5] www.theallpapers.com
Question paper, page 4
4 0460/11/M/J/10 © UCLES 2010 (c) Another urban problem is the growth of squatter settlements. Name a city in an LEDC and describe what has been done to improve the quality of life for the people who live in squatter settlements there. [7] [Total: 25 marks] www.theallpapers.com
Question paper, page 5
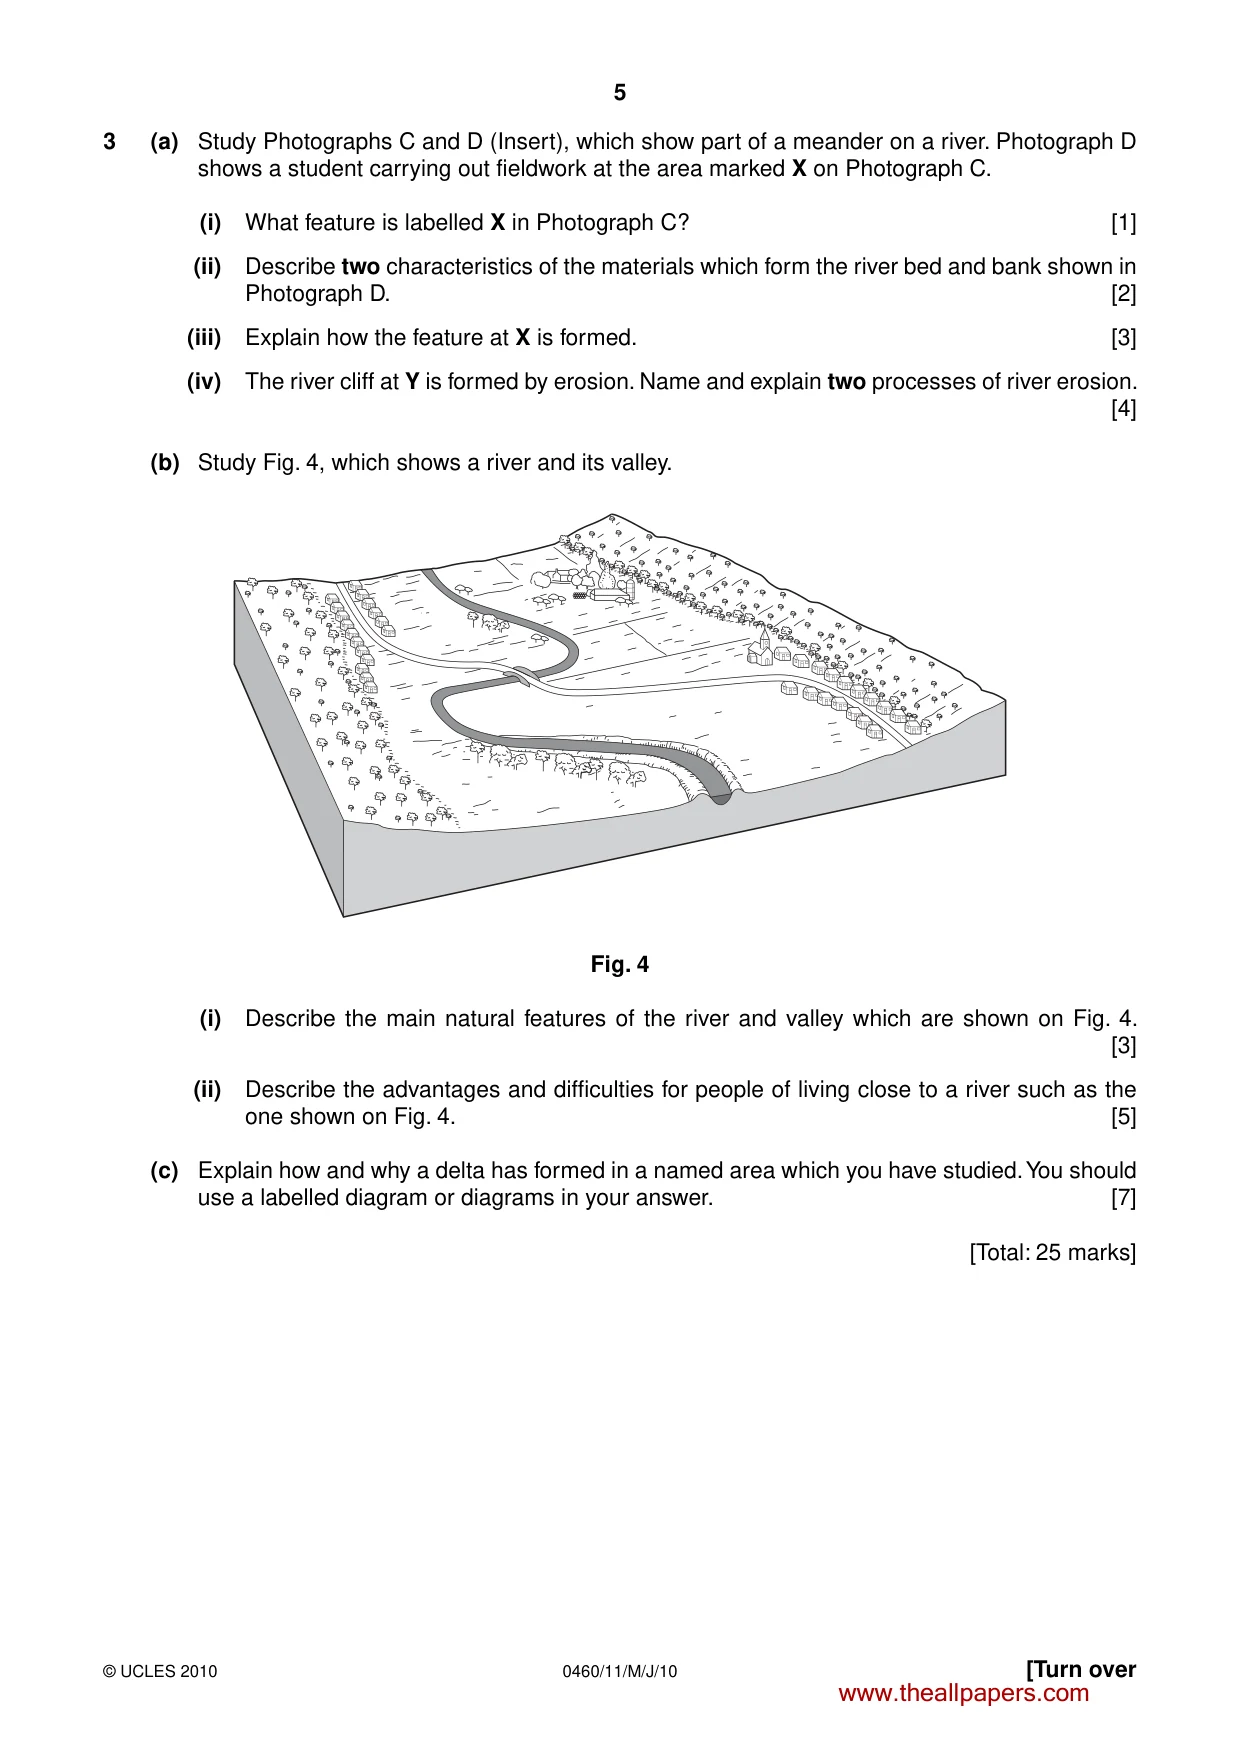
5 0460/11/M/J/10 © UCLES 2010 [Turn over 3 (a) Study Photographs C and D (Insert), which show part of a meander on a river. Photograph D shows a student carrying out fieldwork at the area marked X on Photograph C. (i) What feature is labelled X in Photograph C? [1] (ii) Describe two characteristics of the materials which form the river bed and bank shown in Photograph D. [2] (iii) Explain how the feature at X is formed. [3] (iv) The river cliff at Y is formed by erosion. Name and explain two processes of river erosion. [4] (b) Study Fig. 4, which shows a river and its valley. Fig. 4 (i) Describe the main natural features of the river and valley which are shown on Fig. 4. [3] (ii) Describe the advantages and difficulties for people of living close to a river such as the one shown on Fig. 4. [5] (c) Explain how and why a delta has formed in a named area which you have studied. You should use a labelled diagram or diagrams in your answer. [7] [Total: 25 marks] www.theallpapers.com
Question paper, page 6
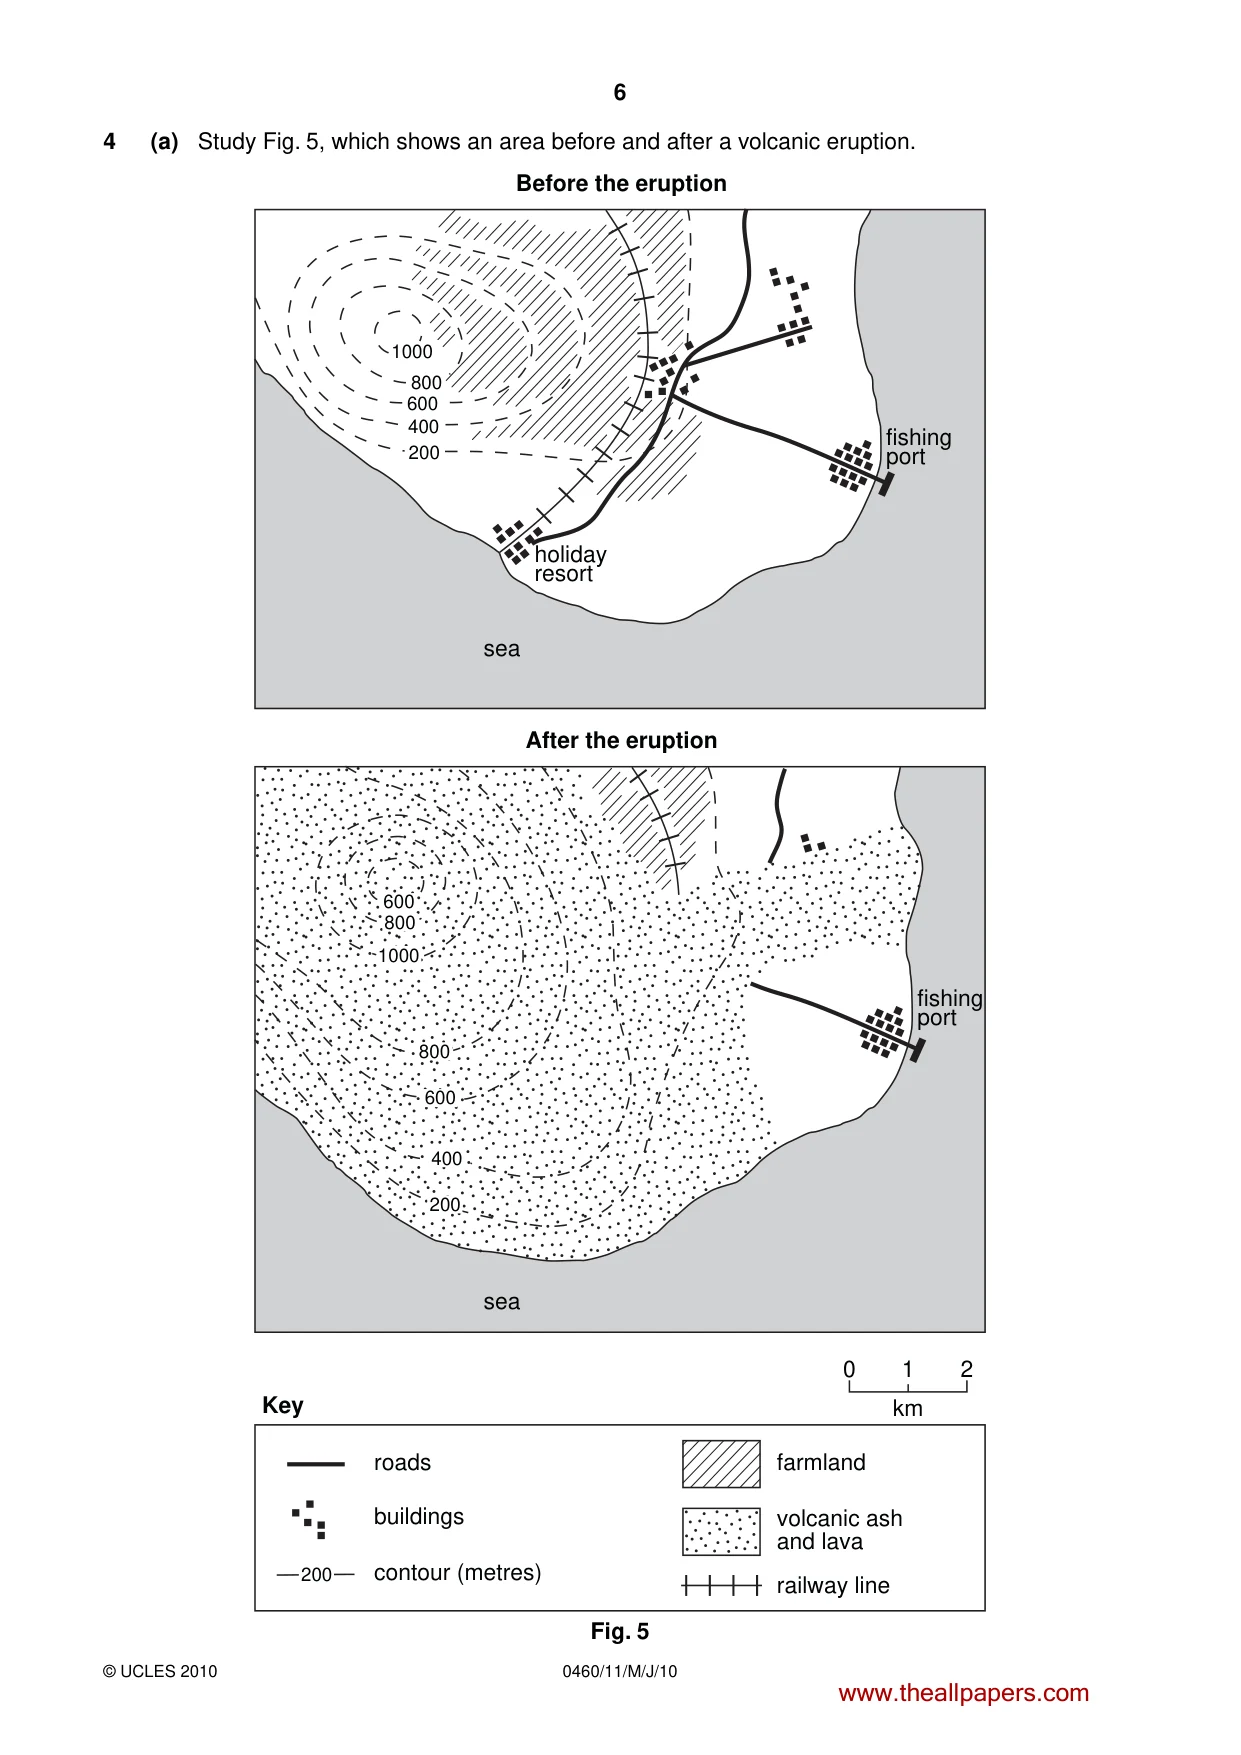
6 0460/11/M/J/10 © UCLES 2010 4 (a) Study Fig. 5, which shows an area before and after a volcanic eruption. 1000 800 600 400 200 holiday resort Before the eruption After the eruption fishing port fishing port sea sea roads Key farmland railway line volcanic ash and lava 0 2 1 km buildings contour (metres) 800 600 400 200 200 800 600 1000 Fig. 5 www.theallpapers.com
Question paper, page 7
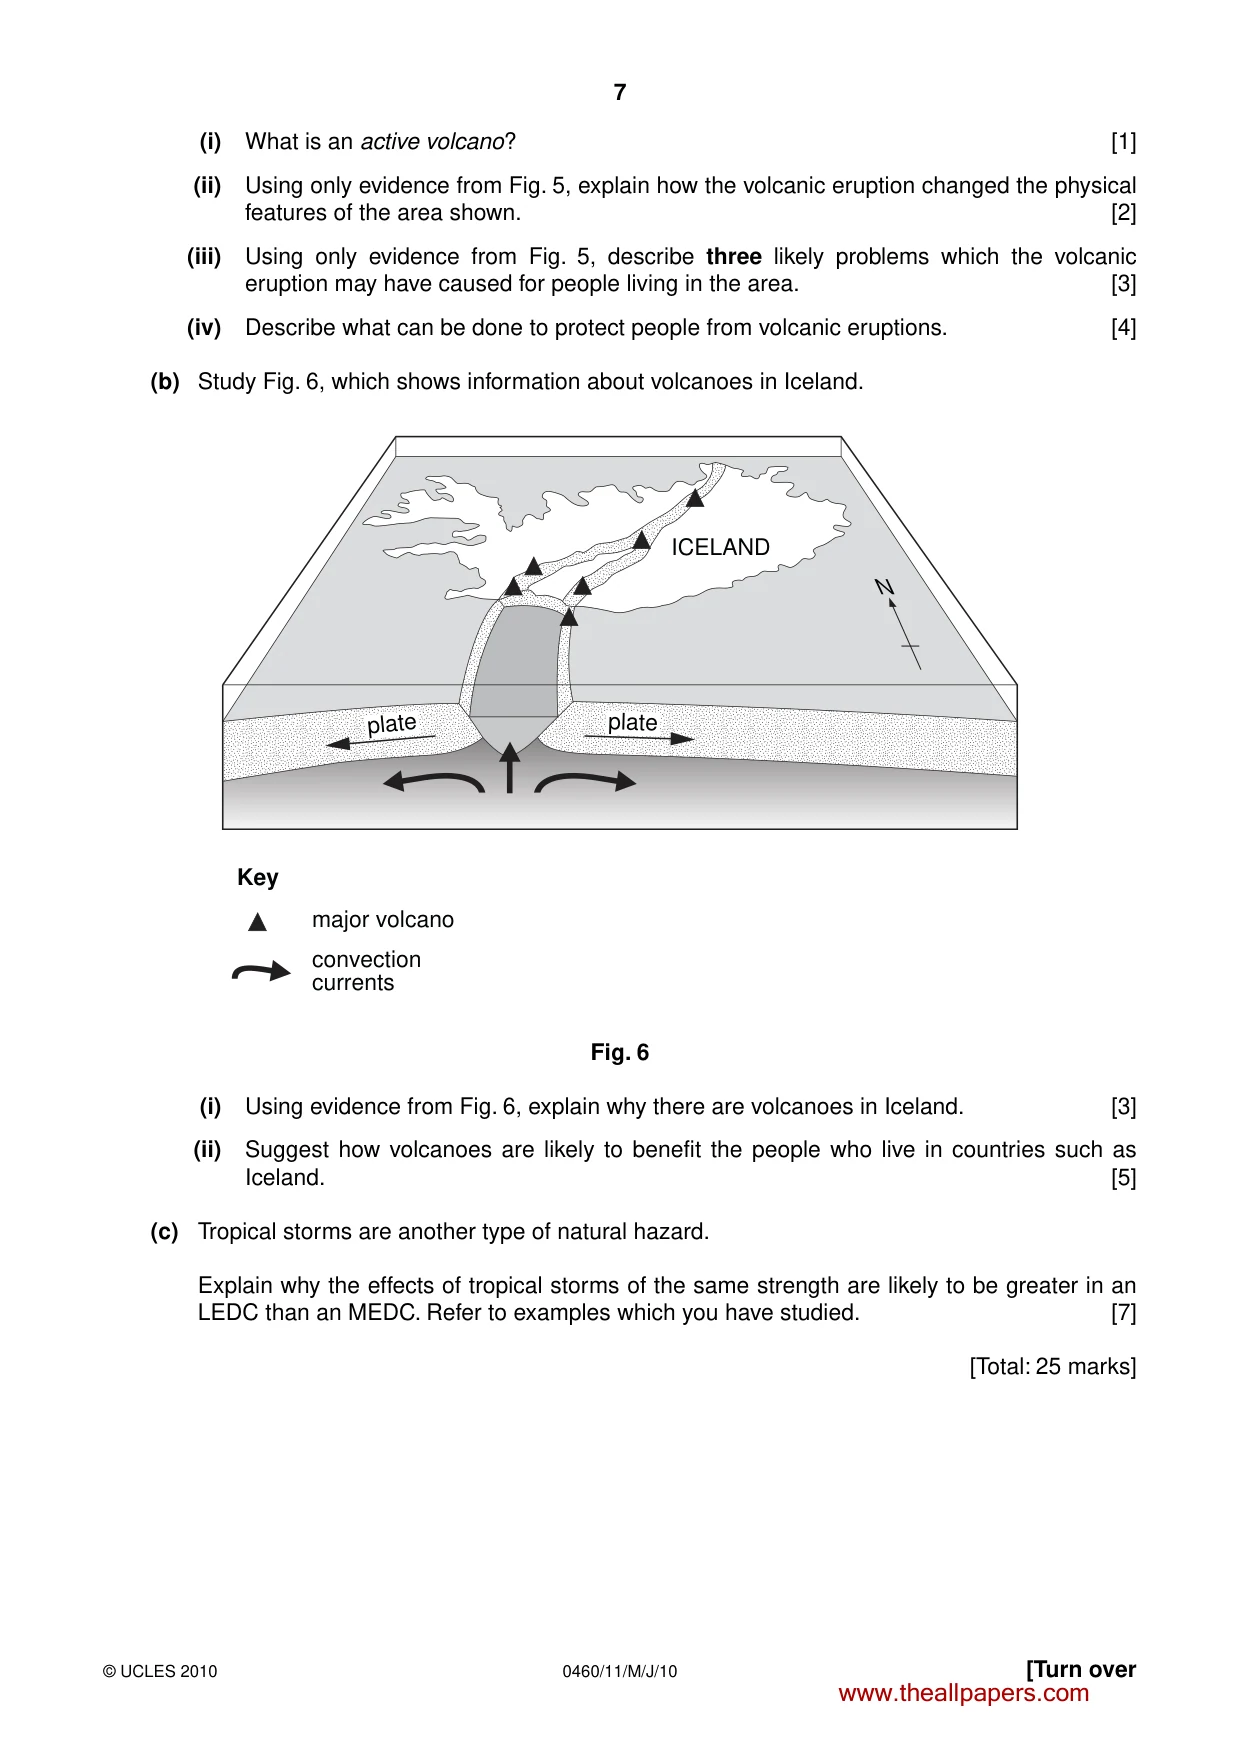
7 0460/11/M/J/10 © UCLES 2010 [Turn over (i) What is an active volcano? [1] (ii) Using only evidence from Fig. 5, explain how the volcanic eruption changed the physical features of the area shown. [2] (iii) Using only evidence from Fig. 5, describe three likely problems which the volcanic eruption may have caused for people living in the area. [3] (iv) Describe what can be done to protect people from volcanic eruptions. [4] (b) Study Fig. 6, which shows information about volcanoes in Iceland. ICELAND Key major volcano convection currents N plate plate Fig. 6 (i) Using evidence from Fig. 6, explain why there are volcanoes in Iceland. [3] (ii) Suggest how volcanoes are likely to benefit the people who live in countries such as Iceland. [5] (c) Tropical storms are another type of natural hazard. Explain why the effects of tropical storms of the same strength are likely to be greater in an LEDC than an MEDC. Refer to examples which you have studied. [7] [Total: 25 marks] www.theallpapers.com
Question paper, page 8
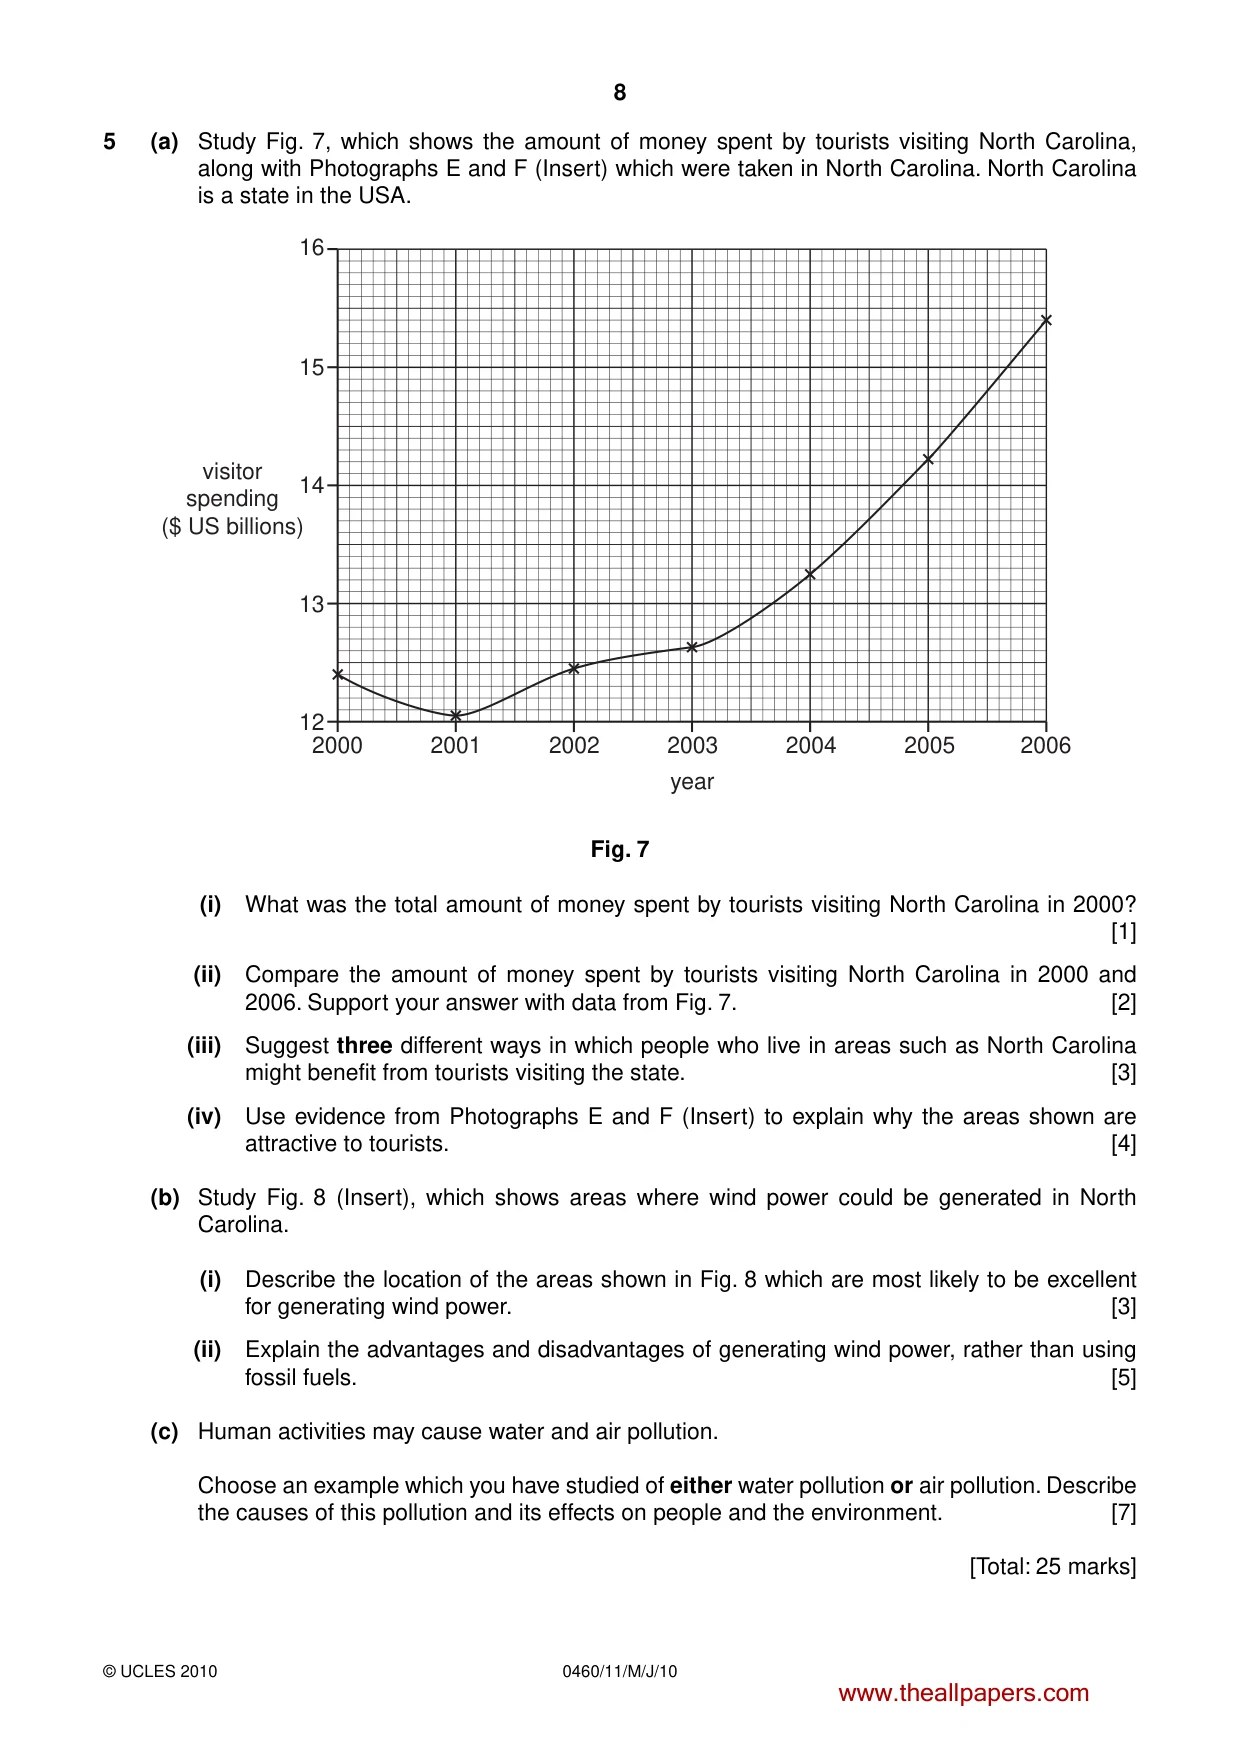
8 0460/11/M/J/10 © UCLES 2010 5 (a) Study Fig. 7, which shows the amount of money spent by tourists visiting North Carolina, along with Photographs E and F (Insert) which were taken in North Carolina. North Carolina is a state in the USA. year 2000 16 15 14 13 12 visitor spending ($ US billions) 2001 2002 2003 2004 2006 2005 Fig. 7 (i) What was the total amount of money spent by tourists visiting North Carolina in 2000? [1] (ii) Compare the amount of money spent by tourists visiting North Carolina in 2000 and 2006. Support your answer with data from Fig. 7. [2] (iii) Suggest three different ways in which people who live in areas such as North Carolina might benefit from tourists visiting the state. [3] (iv) Use evidence from Photographs E and F (Insert) to explain why the areas shown are attractive to tourists. [4] (b) Study Fig. 8 (Insert), which shows areas where wind power could be generated in North Carolina. (i) Describe the location of the areas shown in Fig. 8 which are most likely to be excellent for generating wind power. [3] (ii) Explain the advantages and disadvantages of generating wind power, rather than using fossil fuels. [5] (c) Human activities may cause water and air pollution. Choose an example which you have studied of either water pollution or air pollution. Describe the causes of this pollution and its effects on people and the environment. [7] [Total: 25 marks] www.theallpapers.com
Question paper, page 9
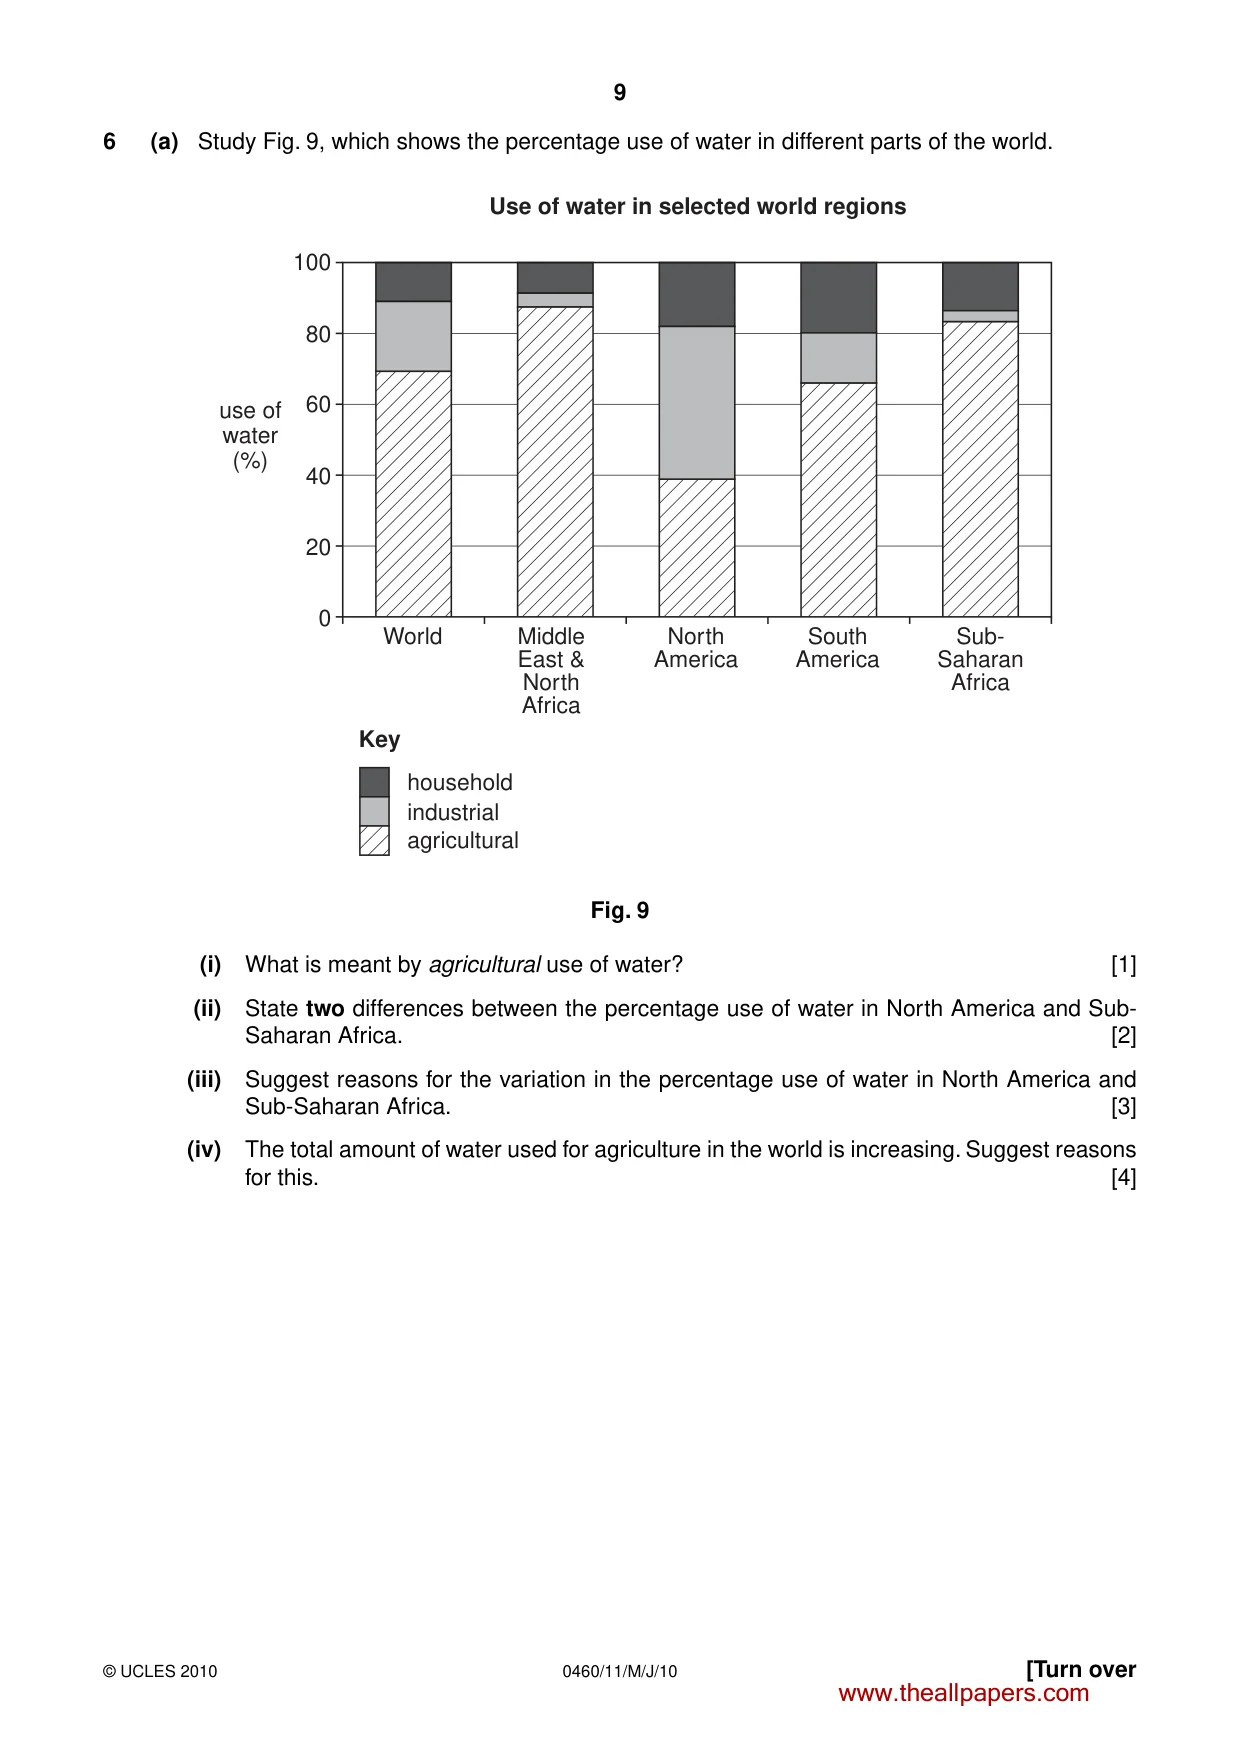
9 0460/11/M/J/10 © UCLES 2010 [Turn over 6 (a) Study Fig. 9, which shows the percentage use of water in different parts of the world. 100 Use of water in selected world regions 80 60 use of water (%) 40 20 World household Key industrial agricultural Middle East & North Africa North America South America Sub- Saharan Africa 0 Fig. 9 (i) What is meant by agricultural use of water? [1] (ii) State two differences between the percentage use of water in North America and Sub- Saharan Africa. [2] (iii) Suggest reasons for the variation in the percentage use of water in North America and Sub-Saharan Africa. [3] (iv) The total amount of water used for agriculture in the world is increasing. Suggest reasons for this. [4] www.theallpapers.com
Question paper, page 10
10 0460/11/M/J/10 © UCLES 2010 (b) Study Fig. 10, which shows information about access to safe drinking water. Key under 30 30–44 45–59 60–74 75–90 over 90 Percentage of population with access to safe drinking water Fig. 10 (i) Describe the distribution of areas where less than 60% of the population has access to safe drinking water. [3] (ii) Many areas have a shortage of water supplies. Describe the likely impacts of a water shortage on the people and development of an area. [5] (c) Describe how people can be provided with a reliable supply of safe drinking water. You should refer to an area or country which you have studied. [7] [Total: 25 marks] www.theallpapers.com
Question paper, page 11
11 0460/11/M/J/10 © UCLES 2010 BLANK PAGE www.theallpapers.com
Question paper, page 12
12 0460/11/M/J/10 © UCLES 2010 BLANK PAGE Copyright Acknowledgements: Question 2 Figure 3 © http://discoverbangalore.com/images/Bangmetro.gif. Question 2 Photograph A © S J Sibley © UCLES. Question 2 Photograph B © S J Sibley © UCLES. Question 3 Photograph C © http://stacey.peak-media.co.uk/Wales2003/Severnmeander/2031-04230055. Question 3 Photograph D © S J Sibley © UCLES. Question 5 Figure 8 © http://www.eere.energy.gov/windandhydro/windpoweringamerica/image. Question 5 Photograph E © S J Sibley © UCLES. Question 5 Photograph F © S J Sibley © UCLES. Permission to reproduce items where third-party owned material protected by copyright is included has been sought and cleared where possible. Every reasonable effort has been made by the publisher (UCLES) to trace copyright holders, but if any items requiring clearance have unwittingly been included, the publisher will be pleased to make amends at the earliest possible opportunity. University of Cambridge International Examinations is part of the Cambridge Assessment Group. Cambridge Assessment is the brand name of University of Cambridge Local Examinations Syndicate (UCLES), which is itself a department of the University of Cambridge. www.theallpapers.com
Mark scheme, page 1
UNIVERSITY OF CAMBRIDGE INTERNATIONAL EXAMINATIONS International General Certificate of Secondary Education MARK SCHEME for the May/June 2010 question paper for the guidance of teachers 0460 GEOGRAPHY 0460/11 Paper 11, maximum raw mark 75 This mark scheme is published as an aid to teachers and candidates, to indicate the requirements of the examination. It shows the basis on which Examiners were instructed to award marks. It does not indicate the details of the discussions that took place at an Examiners’ meeting before marking began, which would have considered the acceptability of alternative answers. Mark schemes must be read in conjunction with the question papers and the report on the examination. • CIE will not enter into discussions or correspondence in connection with these mark schemes. CIE is publishing the mark schemes for the May/June 2010 question papers for most IGCSE, GCE Advanced Level and Advanced Subsidiary Level syllabuses and some Ordinary Level syllabuses. www.theallpapers.com
Mark scheme, page 2
Page 2 Mark Scheme: Teachers’ version Syllabus Paper IGCSE – May/June 2010 0460 11 © UCLES 2010 The features of the marking scheme Each question carries 25 marks. Candidates cannot earn above the maximum marks available within each sub section. The marking scheme attempts to give guidance about the requirements of each answer and lists a number of responses which will earn marks along with the general principles to be applied when marking each question. It should be noted that candidates can earn marks if their answers are phrased differently provided they convey the same meaning as those in the mark scheme. THE CANDIDATES DO NOT NEED TO USE THE SAME WORDING TO EARN MARKS. The notation ‘etc’ at the end of an answer in the mark scheme signifies that there may well be other correct responses or examples that can be given credit. Providing the statement is true, relevant to the question asked and not repetition of a previous point made credit should be given. A point made within one sub-section which is an answer to the question set in a different sub-section should not be given credit as each sub-section asks different questions which require independent answers. The mark scheme uses semi colons (;) to separate marks and diagonals to separate alternative answers. During coordination the mark scheme is modified to add points agreed after discussion or to delete any points not allowed. All examiners should ensure that their modified scheme is fully up-to-date before marking begins. Marking mechanics. Point marking is used for sections (a) and (b) of each question, although marks are available in specified questions for development of appropriate points. Ticks should be used to clearly indicate the wording on a script where a mark has been allowed. Where a development point has been allowed the letter ‘D’ should be placed adjacent to the tick. The number of ticks should always be equal to the total number of marks awarded, the mark for each sub-section should be added up and placed in the margin at the end of the sub-section. The total mark for the entire question should be added and transferred to the front of the script. Where a candidate makes a point which is not quite sufficient for credit an upturned ‘V’ insert symbol should be used. If after careful consideration a mark is awarded which gives `benefit of doubt` to the candidate the letter ‘J’ should be placed adjacent to the tick (ie the candidate has `just` achieved the mark). Levels of response marking is used for section (c) of each question. Thus it is the quality of the response which determines which level an answer is achieved rather than the quantity of statements contained within it. However once assigned to a level the mark achieved within that level is determined by the number of points made. Levels 1 and 2 are distinguished by whether statements are simple (level 1) or developed/elaborated (level 2). A candidate can immediately enter L2 by making developed points without making any L1 statements. In order to achieve L3 a candidate must have already reached the top end of L2 – in addition his/her answer should have a clear example, and the answer must be place specific as well (7 marks – L3). Where statements are assigned levels by the examiner this should be indicated by the use of L1, L2 and L3 next to the statements. A summary of the overall level and mark awarded should be written at the end of the answer. Ticks should not be used on answers which are marked using levels of response marking. www.theallpapers.com
Mark scheme, page 3
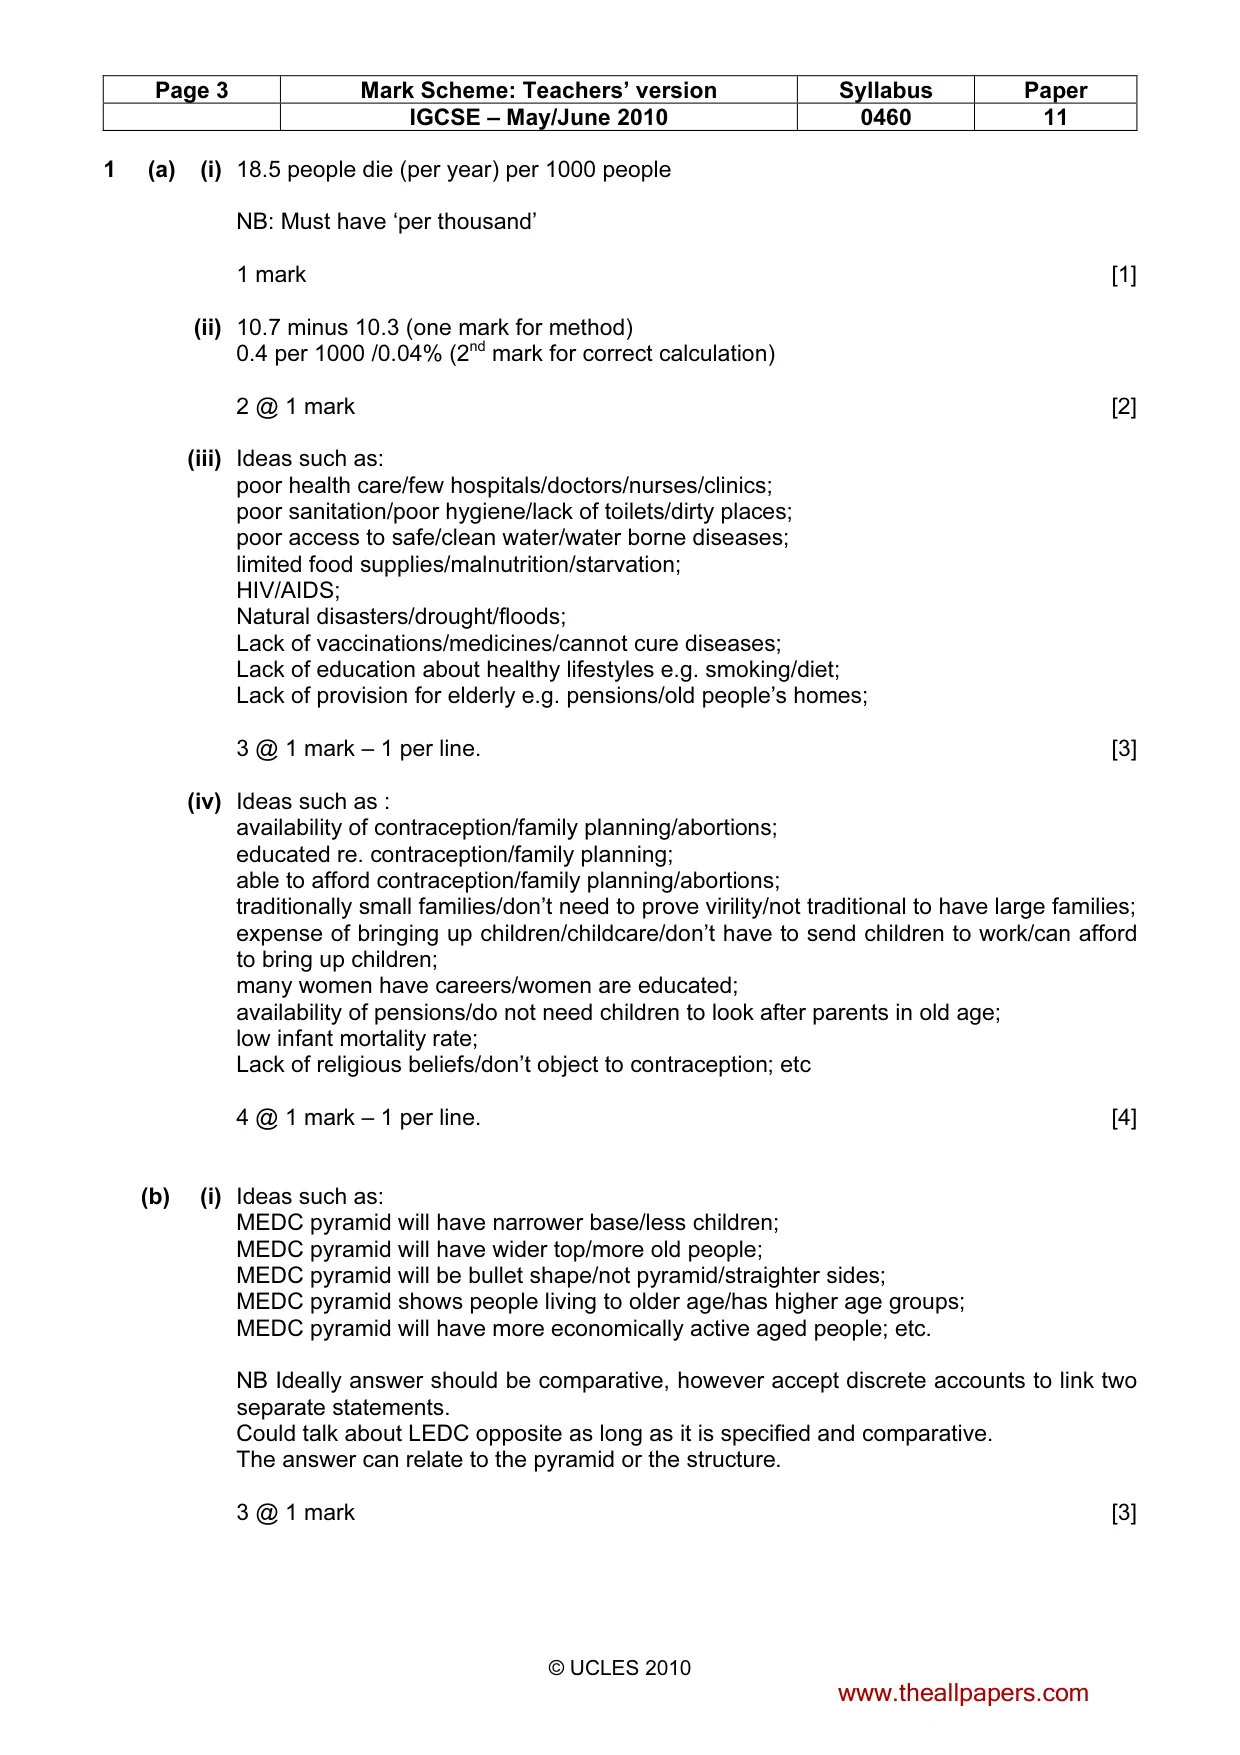
Page 3 Mark Scheme: Teachers’ version Syllabus Paper IGCSE – May/June 2010 0460 11 © UCLES 2010 1 (a) (i) 18.5 people die (per year) per 1000 people NB: Must have ‘per thousand’ 1 mark [1] (ii) 10.7 minus 10.3 (one mark for method) 0.4 per 1000 /0.04% (2nd mark for correct calculation) 2 @ 1 mark [2] (iii) Ideas such as: poor health care/few hospitals/doctors/nurses/clinics; poor sanitation/poor hygiene/lack of toilets/dirty places; poor access to safe/clean water/water borne diseases; limited food supplies/malnutrition/starvation; HIV/AIDS; Natural disasters/drought/floods; Lack of vaccinations/medicines/cannot cure diseases; Lack of education about healthy lifestyles e.g. smoking/diet; Lack of provision for elderly e.g. pensions/old people’s homes; 3 @ 1 mark – 1 per line. [3] (iv) Ideas such as : availability of contraception/family planning/abortions; educated re. contraception/family planning; able to afford contraception/family planning/abortions; traditionally small families/don’t need to prove virility/not traditional to have large families; expense of bringing up children/childcare/don’t have to send children to work/can afford to bring up children; many women have careers/women are educated; availability of pensions/do not need children to look after parents in old age; low infant mortality rate; Lack of religious beliefs/don’t object to contraception; etc 4 @ 1 mark – 1 per line. [4] (b) (i) Ideas such as: MEDC pyramid will have narrower base/less children; MEDC pyramid will have wider top/more old people; MEDC pyramid will be bullet shape/not pyramid/straighter sides; MEDC pyramid shows people living to older age/has higher age groups; MEDC pyramid will have more economically active aged people; etc. NB Ideally answer should be comparative, however accept discrete accounts to link two separate statements. Could talk about LEDC opposite as long as it is specified and comparative. The answer can relate to the pyramid or the structure. 3 @ 1 mark [3] www.theallpapers.com
Mark scheme, page 4
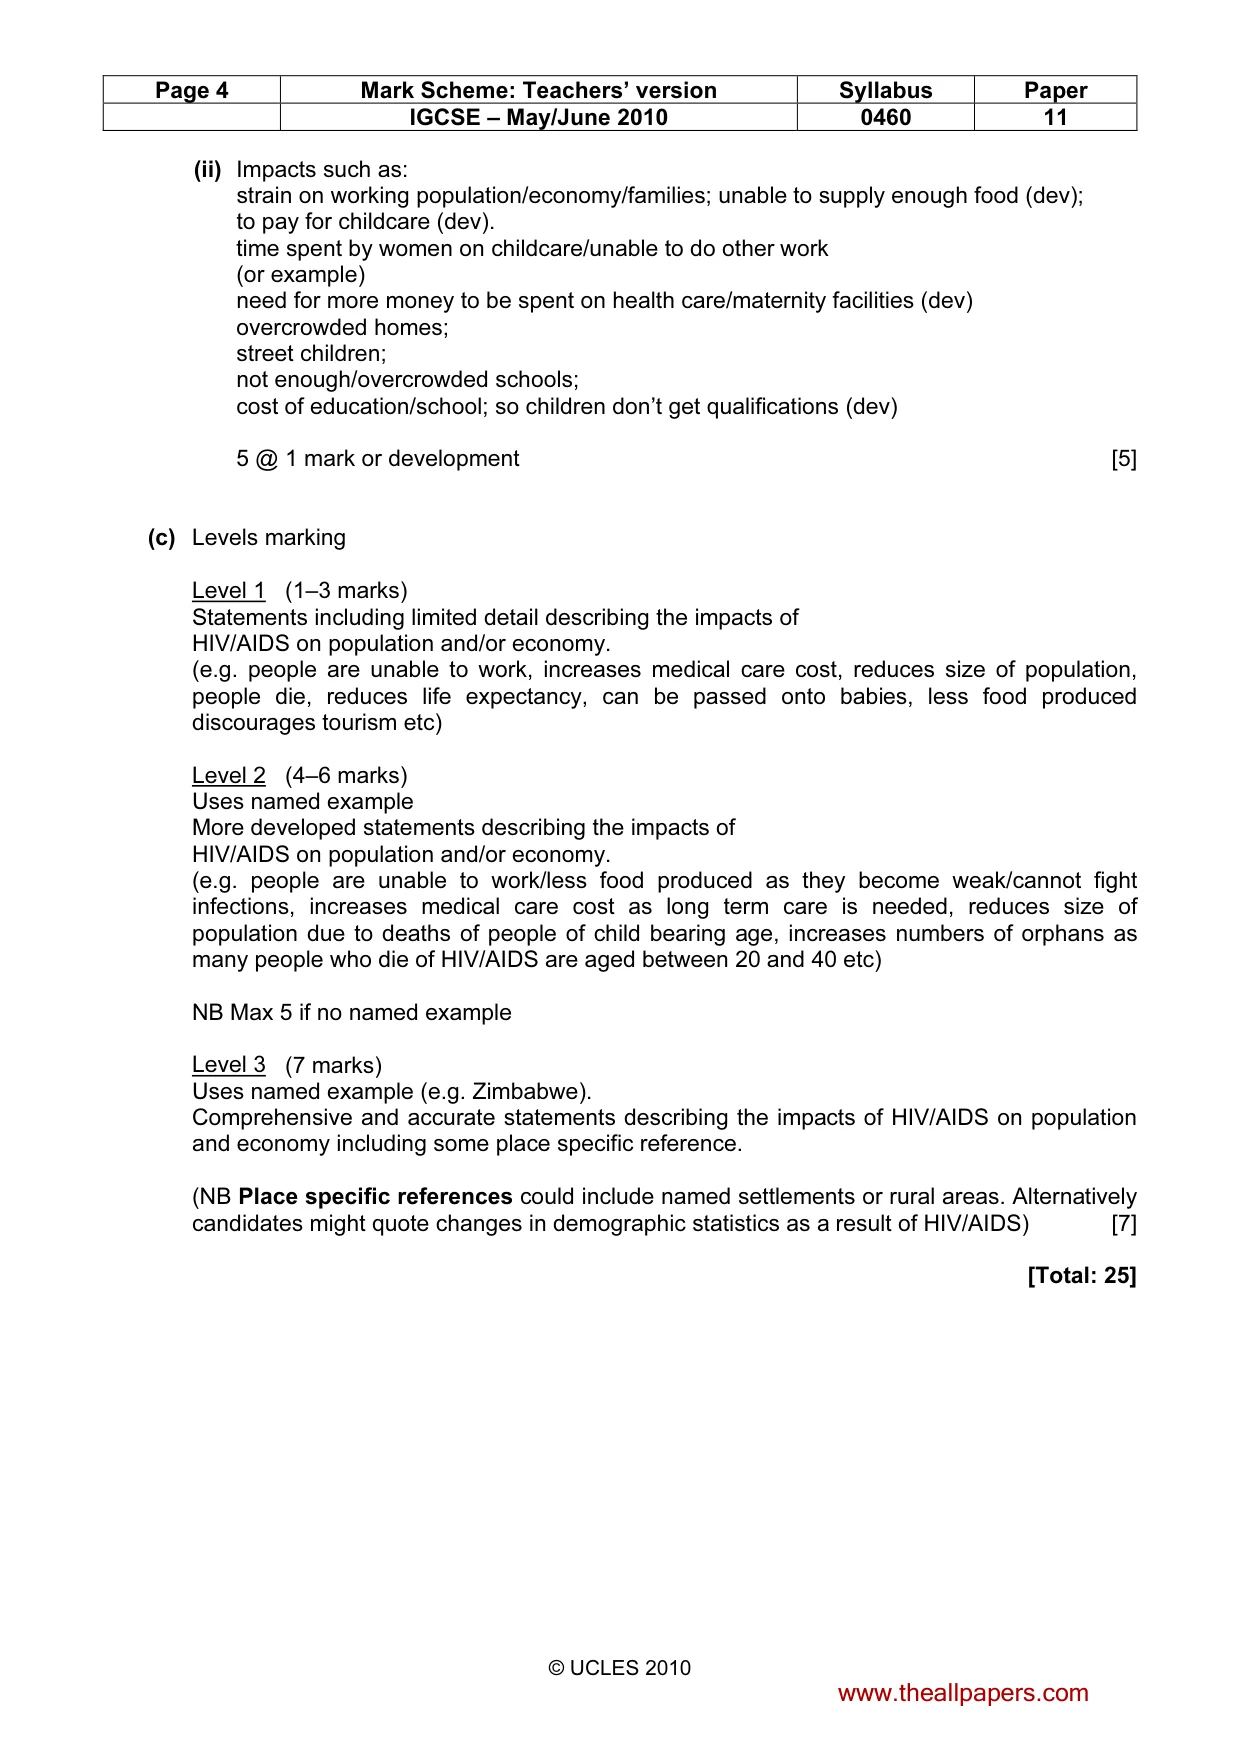
Page 4 Mark Scheme: Teachers’ version Syllabus Paper IGCSE – May/June 2010 0460 11 © UCLES 2010 (ii) Impacts such as: strain on working population/economy/families; unable to supply enough food (dev); to pay for childcare (dev). time spent by women on childcare/unable to do other work (or example) need for more money to be spent on health care/maternity facilities (dev) overcrowded homes; street children; not enough/overcrowded schools; cost of education/school; so children don’t get qualifications (dev) 5 @ 1 mark or development [5] (c) Levels marking Level 1 (1–3 marks) Statements including limited detail describing the impacts of HIV/AIDS on population and/or economy. (e.g. people are unable to work, increases medical care cost, reduces size of population, people die, reduces life expectancy, can be passed onto babies, less food produced discourages tourism etc) Level 2 (4–6 marks) Uses named example More developed statements describing the impacts of HIV/AIDS on population and/or economy. (e.g. people are unable to work/less food produced as they become weak/cannot fight infections, increases medical care cost as long term care is needed, reduces size of population due to deaths of people of child bearing age, increases numbers of orphans as many people who die of HIV/AIDS are aged between 20 and 40 etc) NB Max 5 if no named example Level 3 (7 marks) Uses named example (e.g. Zimbabwe). Comprehensive and accurate statements describing the impacts of HIV/AIDS on population and economy including some place specific reference. (NB Place specific references could include named settlements or rural areas. Alternatively candidates might quote changes in demographic statistics as a result of HIV/AIDS) [7] [Total: 25] www.theallpapers.com
Mark scheme, page 5
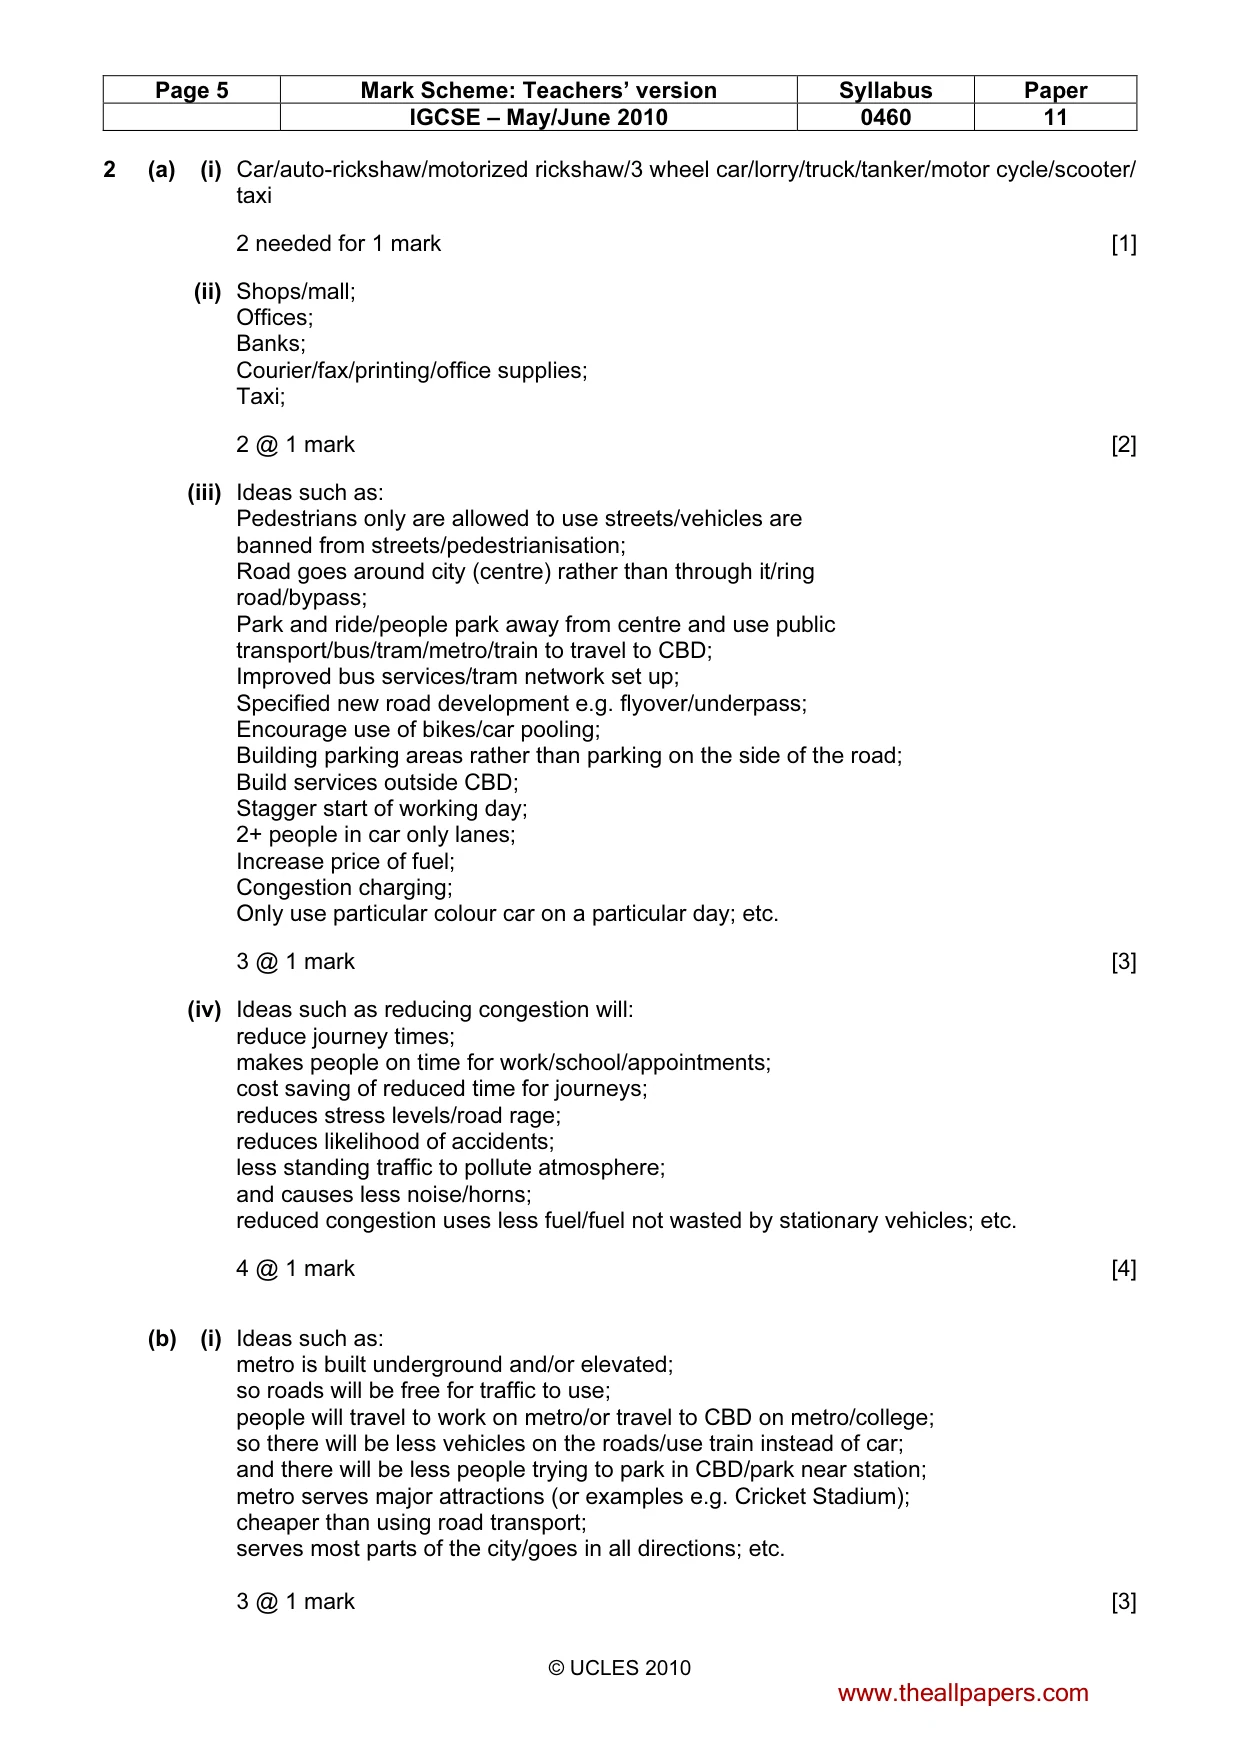
Page 5 Mark Scheme: Teachers’ version Syllabus Paper IGCSE – May/June 2010 0460 11 © UCLES 2010 2 (a) (i) Car/auto-rickshaw/motorized rickshaw/3 wheel car/lorry/truck/tanker/motor cycle/scooter/ taxi 2 needed for 1 mark [1] (ii) Shops/mall; Offices; Banks; Courier/fax/printing/office supplies; Taxi; 2 @ 1 mark [2] (iii) Ideas such as: Pedestrians only are allowed to use streets/vehicles are banned from streets/pedestrianisation; Road goes around city (centre) rather than through it/ring road/bypass; Park and ride/people park away from centre and use public transport/bus/tram/metro/train to travel to CBD; Improved bus services/tram network set up; Specified new road development e.g. flyover/underpass; Encourage use of bikes/car pooling; Building parking areas rather than parking on the side of the road; Build services outside CBD; Stagger start of working day; 2+ people in car only lanes; Increase price of fuel; Congestion charging; Only use particular colour car on a particular day; etc. 3 @ 1 mark [3] (iv) Ideas such as reducing congestion will: reduce journey times; makes people on time for work/school/appointments; cost saving of reduced time for journeys; reduces stress levels/road rage; reduces likelihood of accidents; less standing traffic to pollute atmosphere; and causes less noise/horns; reduced congestion uses less fuel/fuel not wasted by stationary vehicles; etc. 4 @ 1 mark [4] (b) (i) Ideas such as: metro is built underground and/or elevated; so roads will be free for traffic to use; people will travel to work on metro/or travel to CBD on metro/college; so there will be less vehicles on the roads/use train instead of car; and there will be less people trying to park in CBD/park near station; metro serves major attractions (or examples e.g. Cricket Stadium); cheaper than using road transport; serves most parts of the city/goes in all directions; etc. 3 @ 1 mark [3] www.theallpapers.com
Mark scheme, page 6
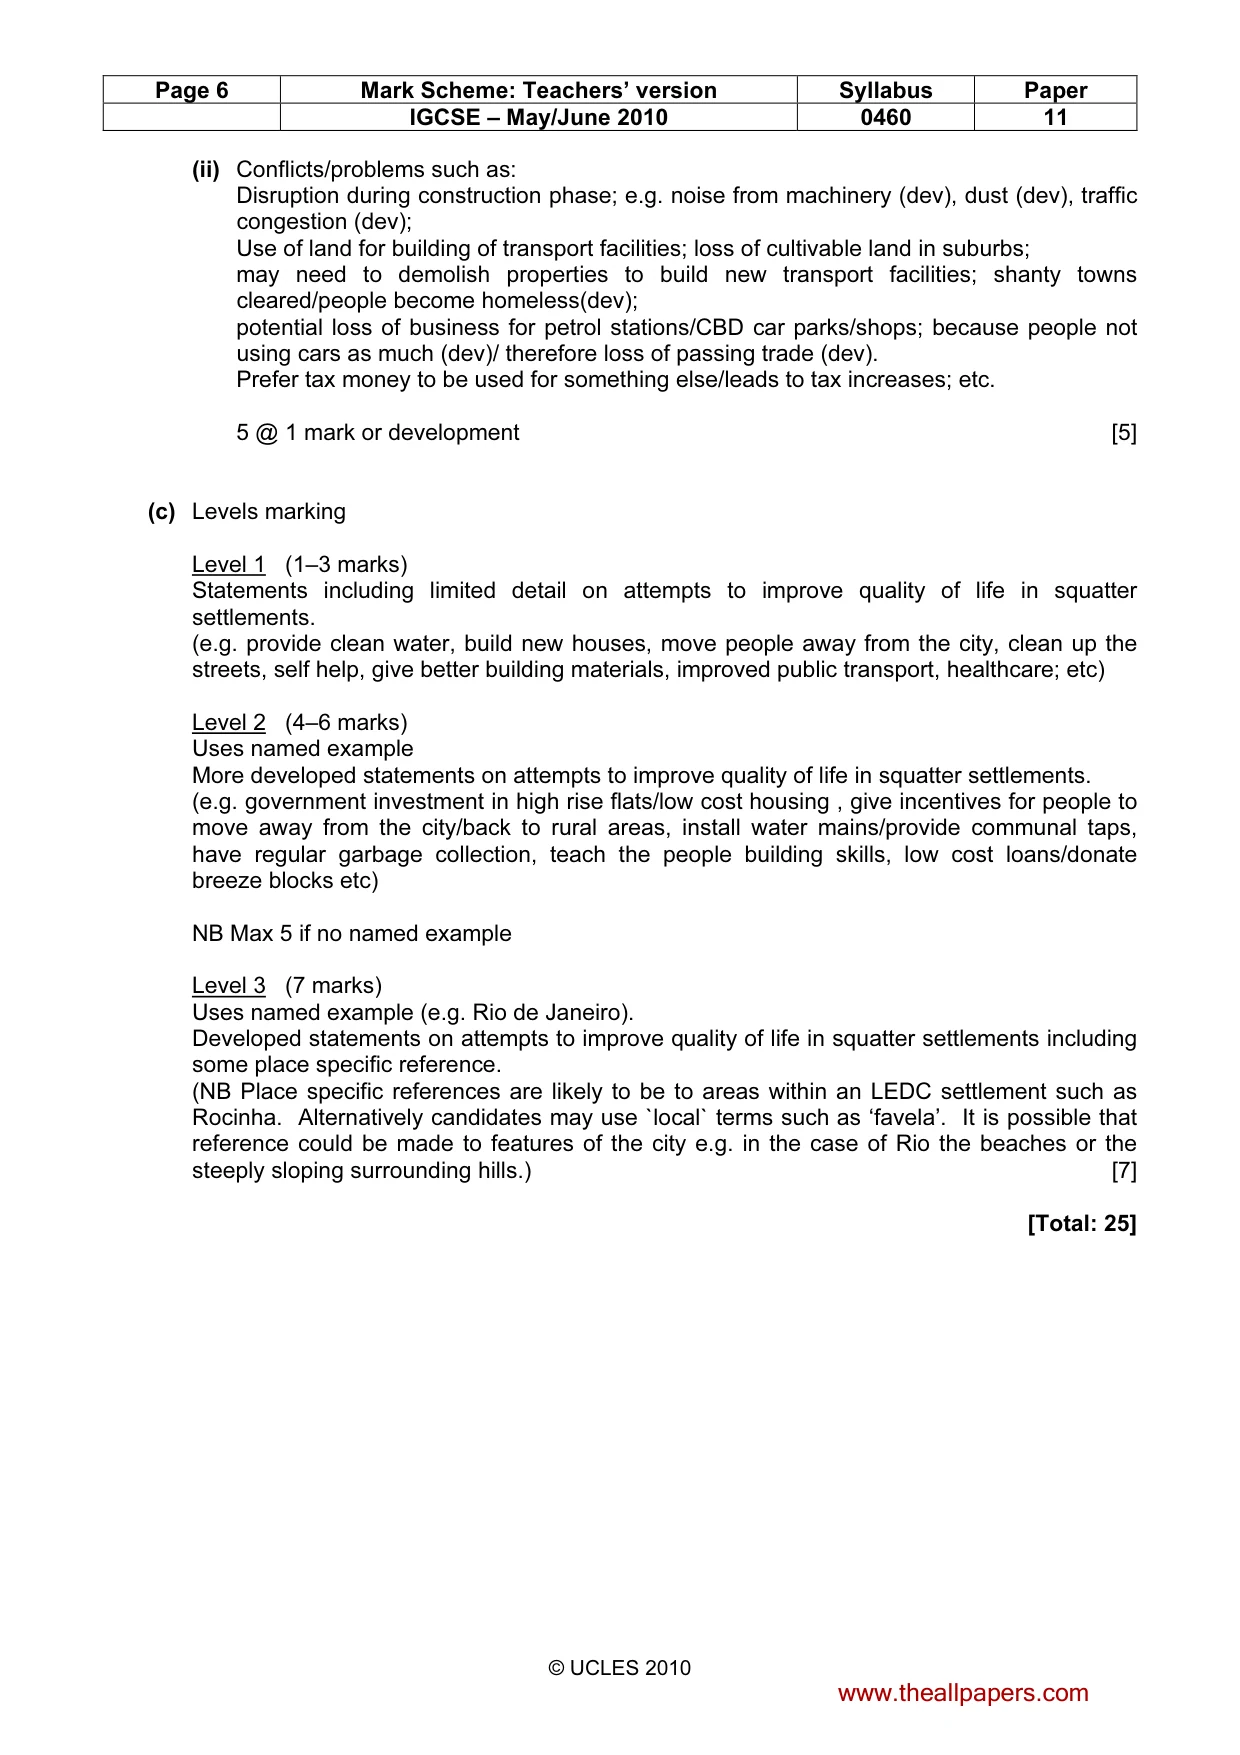
Page 6 Mark Scheme: Teachers’ version Syllabus Paper IGCSE – May/June 2010 0460 11 © UCLES 2010 (ii) Conflicts/problems such as: Disruption during construction phase; e.g. noise from machinery (dev), dust (dev), traffic congestion (dev); Use of land for building of transport facilities; loss of cultivable land in suburbs; may need to demolish properties to build new transport facilities; shanty towns cleared/people become homeless(dev); potential loss of business for petrol stations/CBD car parks/shops; because people not using cars as much (dev)/ therefore loss of passing trade (dev). Prefer tax money to be used for something else/leads to tax increases; etc. 5 @ 1 mark or development [5] (c) Levels marking Level 1 (1–3 marks) Statements including limited detail on attempts to improve quality of life in squatter settlements. (e.g. provide clean water, build new houses, move people away from the city, clean up the streets, self help, give better building materials, improved public transport, healthcare; etc) Level 2 (4–6 marks) Uses named example More developed statements on attempts to improve quality of life in squatter settlements. (e.g. government investment in high rise flats/low cost housing , give incentives for people to move away from the city/back to rural areas, install water mains/provide communal taps, have regular garbage collection, teach the people building skills, low cost loans/donate breeze blocks etc) NB Max 5 if no named example Level 3 (7 marks) Uses named example (e.g. Rio de Janeiro). Developed statements on attempts to improve quality of life in squatter settlements including some place specific reference. (NB Place specific references are likely to be to areas within an LEDC settlement such as Rocinha. Alternatively candidates may use `local` terms such as ‘favela’. It is possible that reference could be made to features of the city e.g. in the case of Rio the beaches or the steeply sloping surrounding hills.) [7] [Total: 25] www.theallpapers.com
Mark scheme, page 7
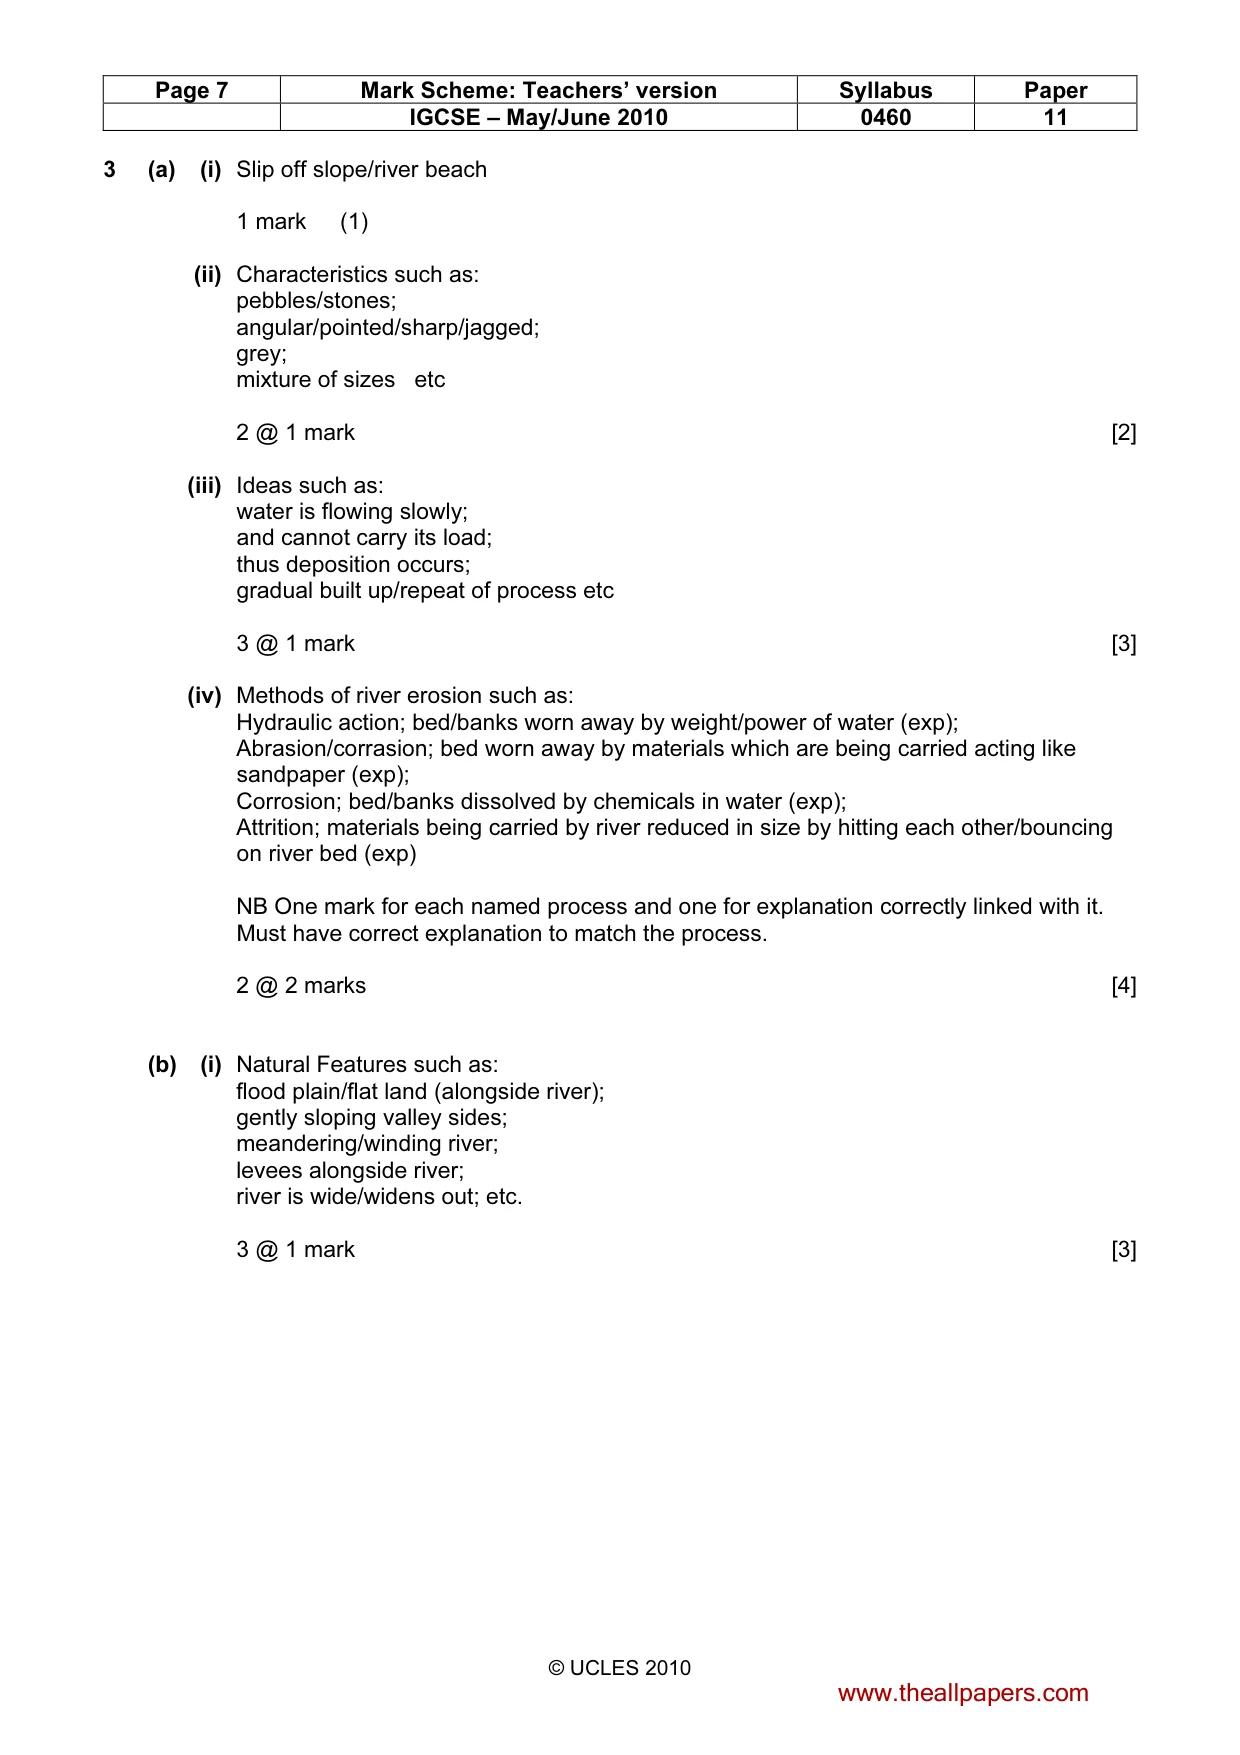
Page 7 Mark Scheme: Teachers’ version Syllabus Paper IGCSE – May/June 2010 0460 11 © UCLES 2010 3 (a) (i) Slip off slope/river beach 1 mark (1) (ii) Characteristics such as: pebbles/stones; angular/pointed/sharp/jagged; grey; mixture of sizes etc 2 @ 1 mark [2] (iii) Ideas such as: water is flowing slowly; and cannot carry its load; thus deposition occurs; gradual built up/repeat of process etc 3 @ 1 mark [3] (iv) Methods of river erosion such as: Hydraulic action; bed/banks worn away by weight/power of water (exp); Abrasion/corrasion; bed worn away by materials which are being carried acting like sandpaper (exp); Corrosion; bed/banks dissolved by chemicals in water (exp); Attrition; materials being carried by river reduced in size by hitting each other/bouncing on river bed (exp) NB One mark for each named process and one for explanation correctly linked with it. Must have correct explanation to match the process. 2 @ 2 marks [4] (b) (i) Natural Features such as: flood plain/flat land (alongside river); gently sloping valley sides; meandering/winding river; levees alongside river; river is wide/widens out; etc. 3 @ 1 mark [3] www.theallpapers.com
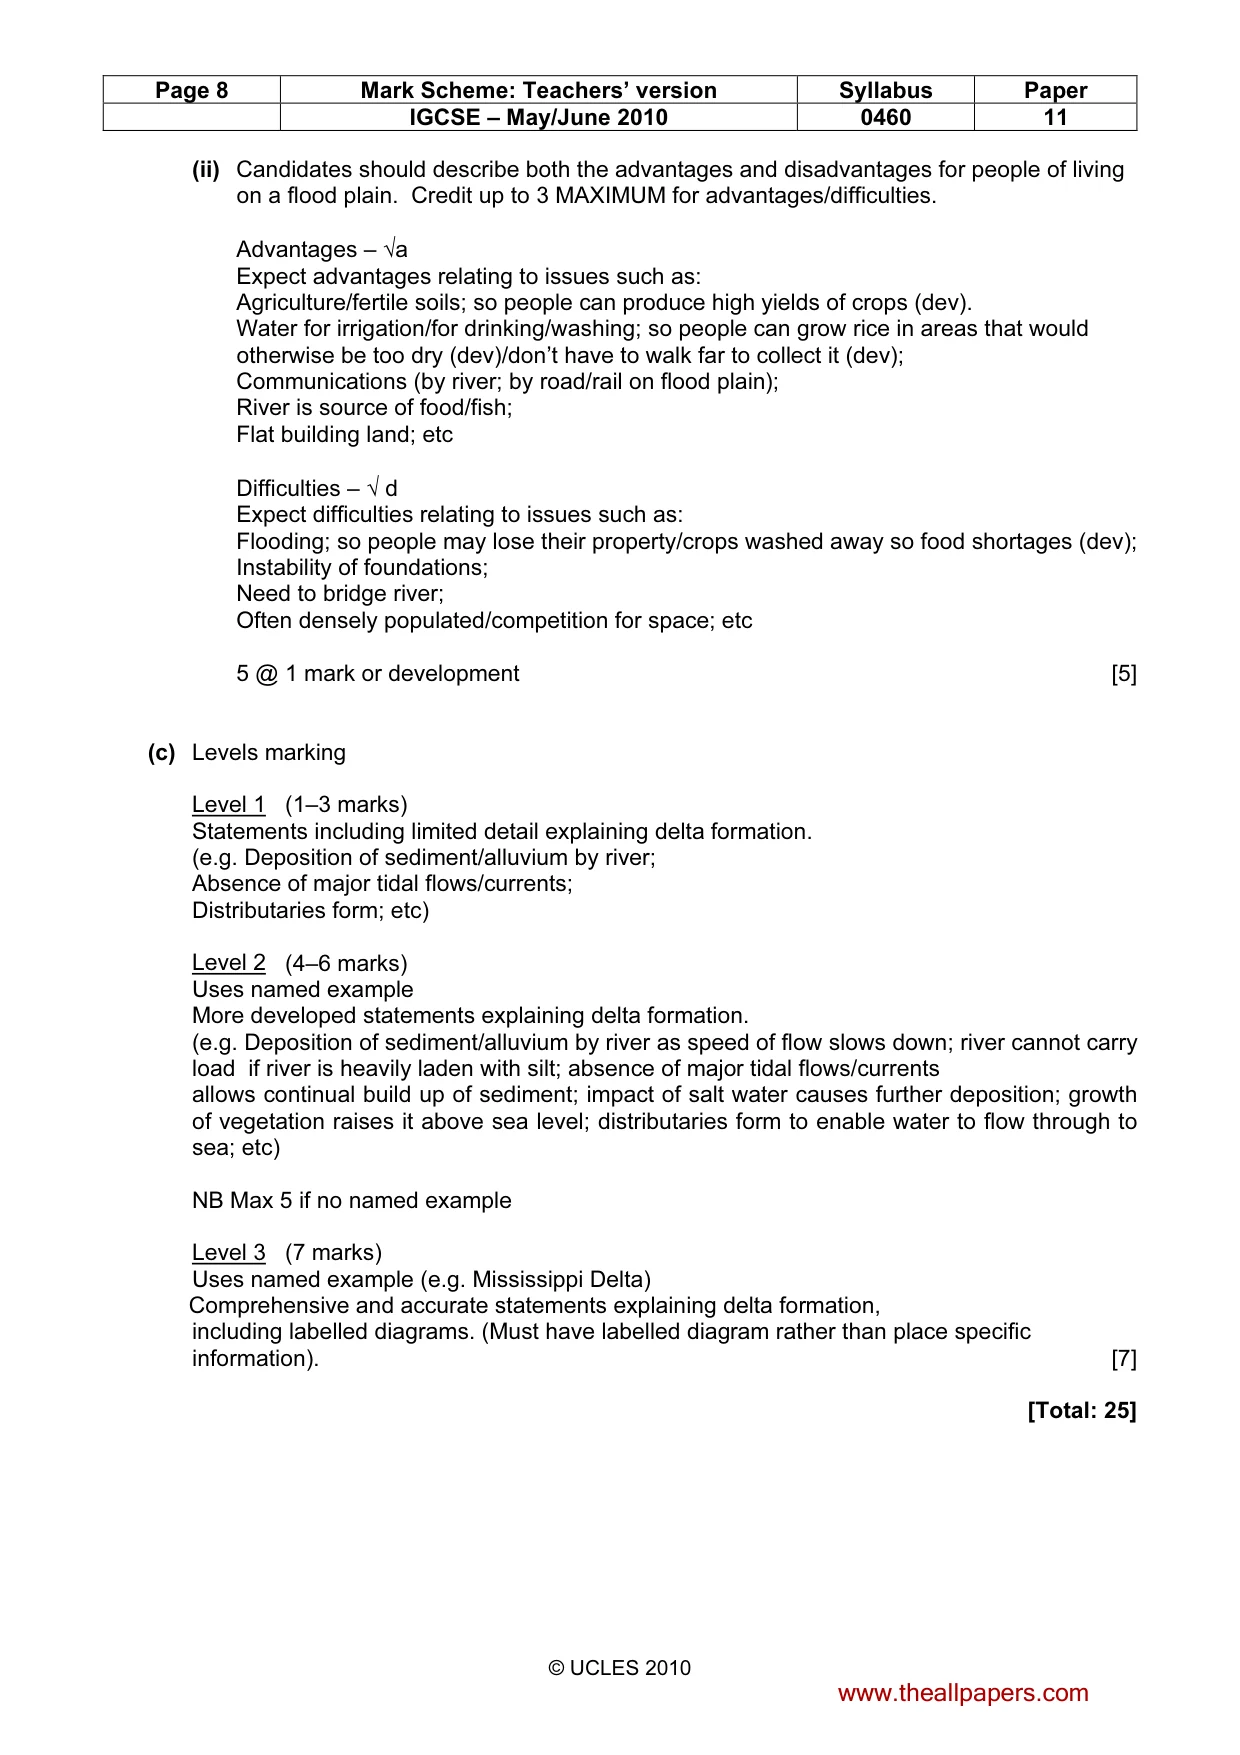
Mark scheme, page 8
Page 8 Mark Scheme: Teachers’ version Syllabus Paper IGCSE – May/June 2010 0460 11 © UCLES 2010 (ii) Candidates should describe both the advantages and disadvantages for people of living on a flood plain. Credit up to 3 MAXIMUM for advantages/difficulties. Advantages – √a Expect advantages relating to issues such as: Agriculture/fertile soils; so people can produce high yields of crops (dev). Water for irrigation/for drinking/washing; so people can grow rice in areas that would otherwise be too dry (dev)/don’t have to walk far to collect it (dev); Communications (by river; by road/rail on flood plain); River is source of food/fish; Flat building land; etc Difficulties – √ d Expect difficulties relating to issues such as: Flooding; so people may lose their property/crops washed away so food shortages (dev); Instability of foundations; Need to bridge river; Often densely populated/competition for space; etc 5 @ 1 mark or development [5] (c) Levels marking Level 1 (1–3 marks) Statements including limited detail explaining delta formation. (e.g. Deposition of sediment/alluvium by river; Absence of major tidal flows/currents; Distributaries form; etc) Level 2 (4–6 marks) Uses named example More developed statements explaining delta formation. (e.g. Deposition of sediment/alluvium by river as speed of flow slows down; river cannot carry load if river is heavily laden with silt; absence of major tidal flows/currents allows continual build up of sediment; impact of salt water causes further deposition; growth of vegetation raises it above sea level; distributaries form to enable water to flow through to sea; etc) NB Max 5 if no named example Level 3 (7 marks) Uses named example (e.g. Mississippi Delta) Comprehensive and accurate statements explaining delta formation, including labelled diagrams. (Must have labelled diagram rather than place specific information). [7] [Total: 25] www.theallpapers.com
Mark scheme, page 9
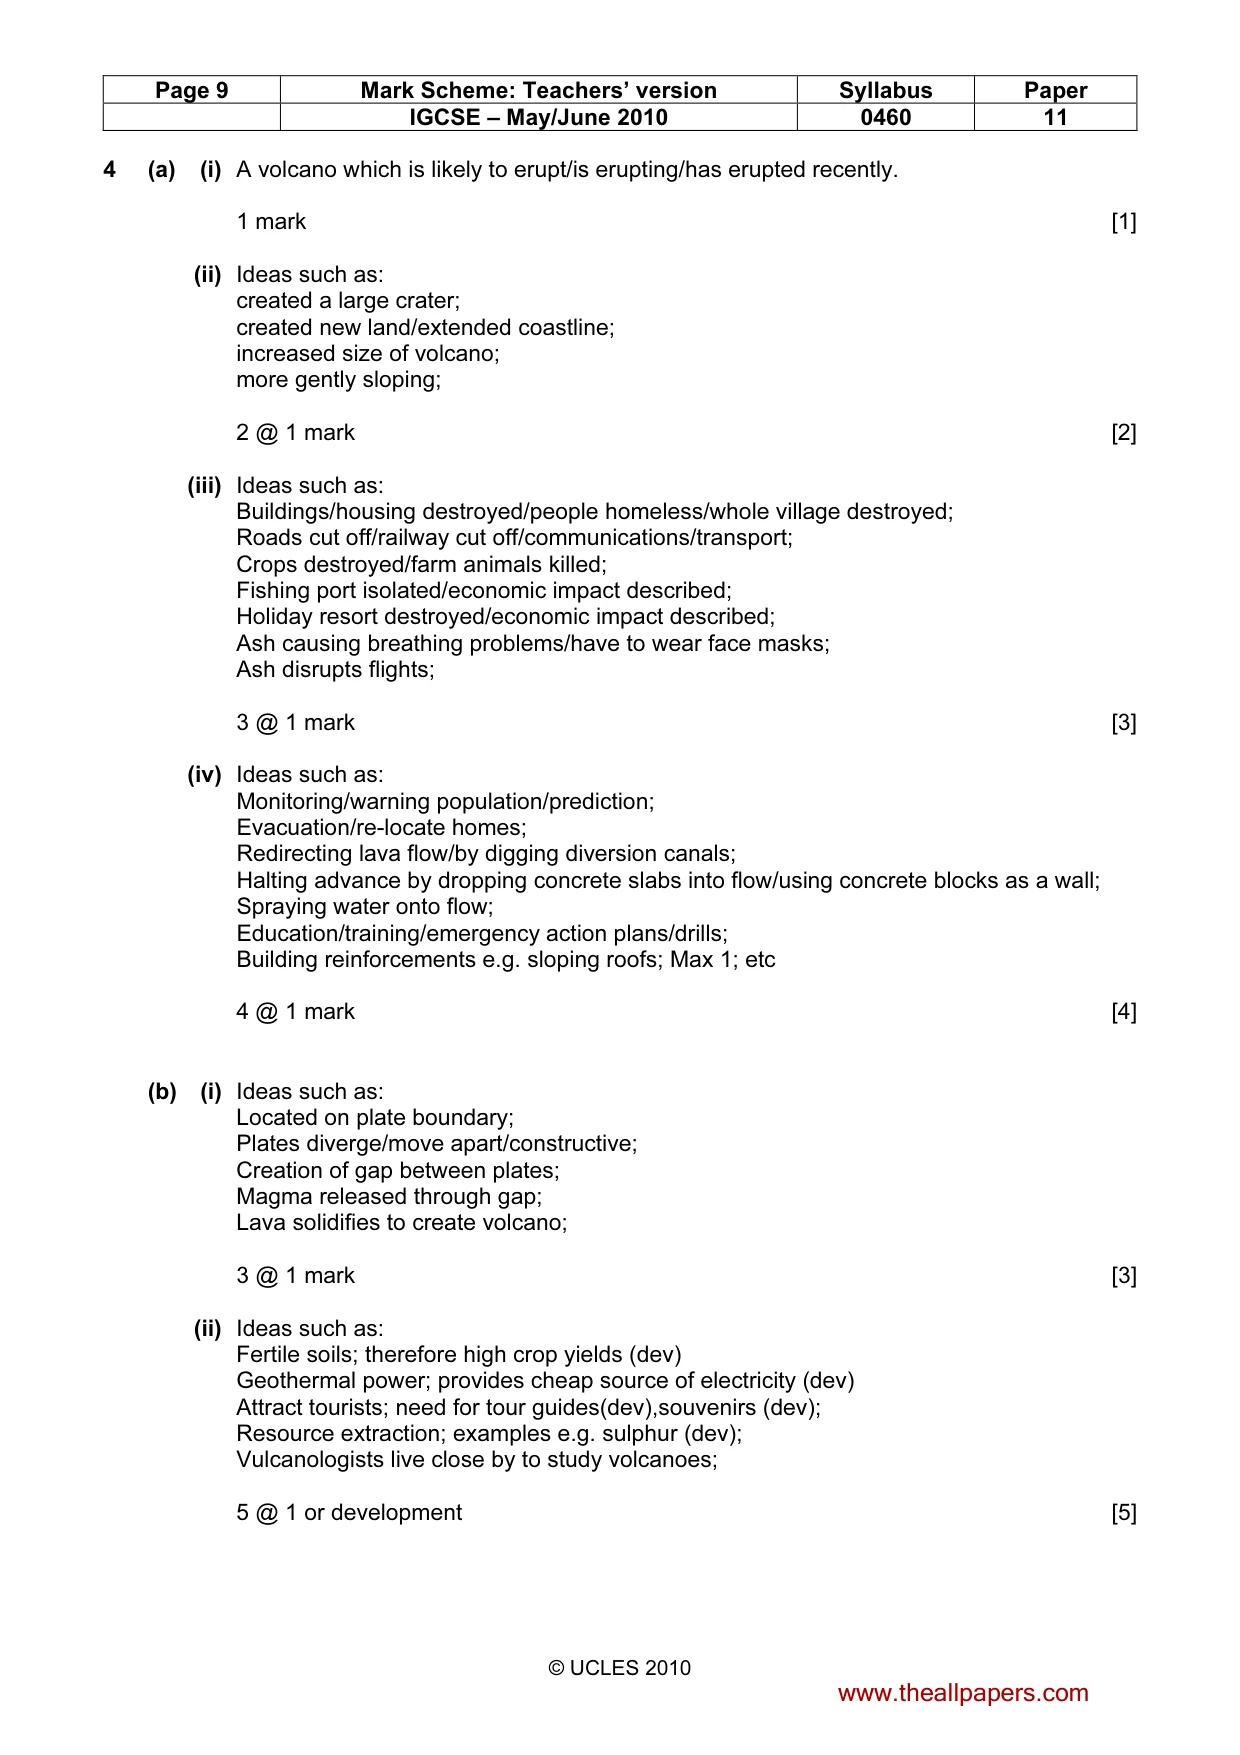
Page 9 Mark Scheme: Teachers’ version Syllabus Paper IGCSE – May/June 2010 0460 11 © UCLES 2010 4 (a) (i) A volcano which is likely to erupt/is erupting/has erupted recently. 1 mark [1] (ii) Ideas such as: created a large crater; created new land/extended coastline; increased size of volcano; more gently sloping; 2 @ 1 mark [2] (iii) Ideas such as: Buildings/housing destroyed/people homeless/whole village destroyed; Roads cut off/railway cut off/communications/transport; Crops destroyed/farm animals killed; Fishing port isolated/economic impact described; Holiday resort destroyed/economic impact described; Ash causing breathing problems/have to wear face masks; Ash disrupts flights; 3 @ 1 mark [3] (iv) Ideas such as: Monitoring/warning population/prediction; Evacuation/re-locate homes; Redirecting lava flow/by digging diversion canals; Halting advance by dropping concrete slabs into flow/using concrete blocks as a wall; Spraying water onto flow; Education/training/emergency action plans/drills; Building reinforcements e.g. sloping roofs; Max 1; etc 4 @ 1 mark [4] (b) (i) Ideas such as: Located on plate boundary; Plates diverge/move apart/constructive; Creation of gap between plates; Magma released through gap; Lava solidifies to create volcano; 3 @ 1 mark [3] (ii) Ideas such as: Fertile soils; therefore high crop yields (dev) Geothermal power; provides cheap source of electricity (dev) Attract tourists; need for tour guides(dev),souvenirs (dev); Resource extraction; examples e.g. sulphur (dev); Vulcanologists live close by to study volcanoes; 5 @ 1 or development [5] www.theallpapers.com
Mark scheme, page 10
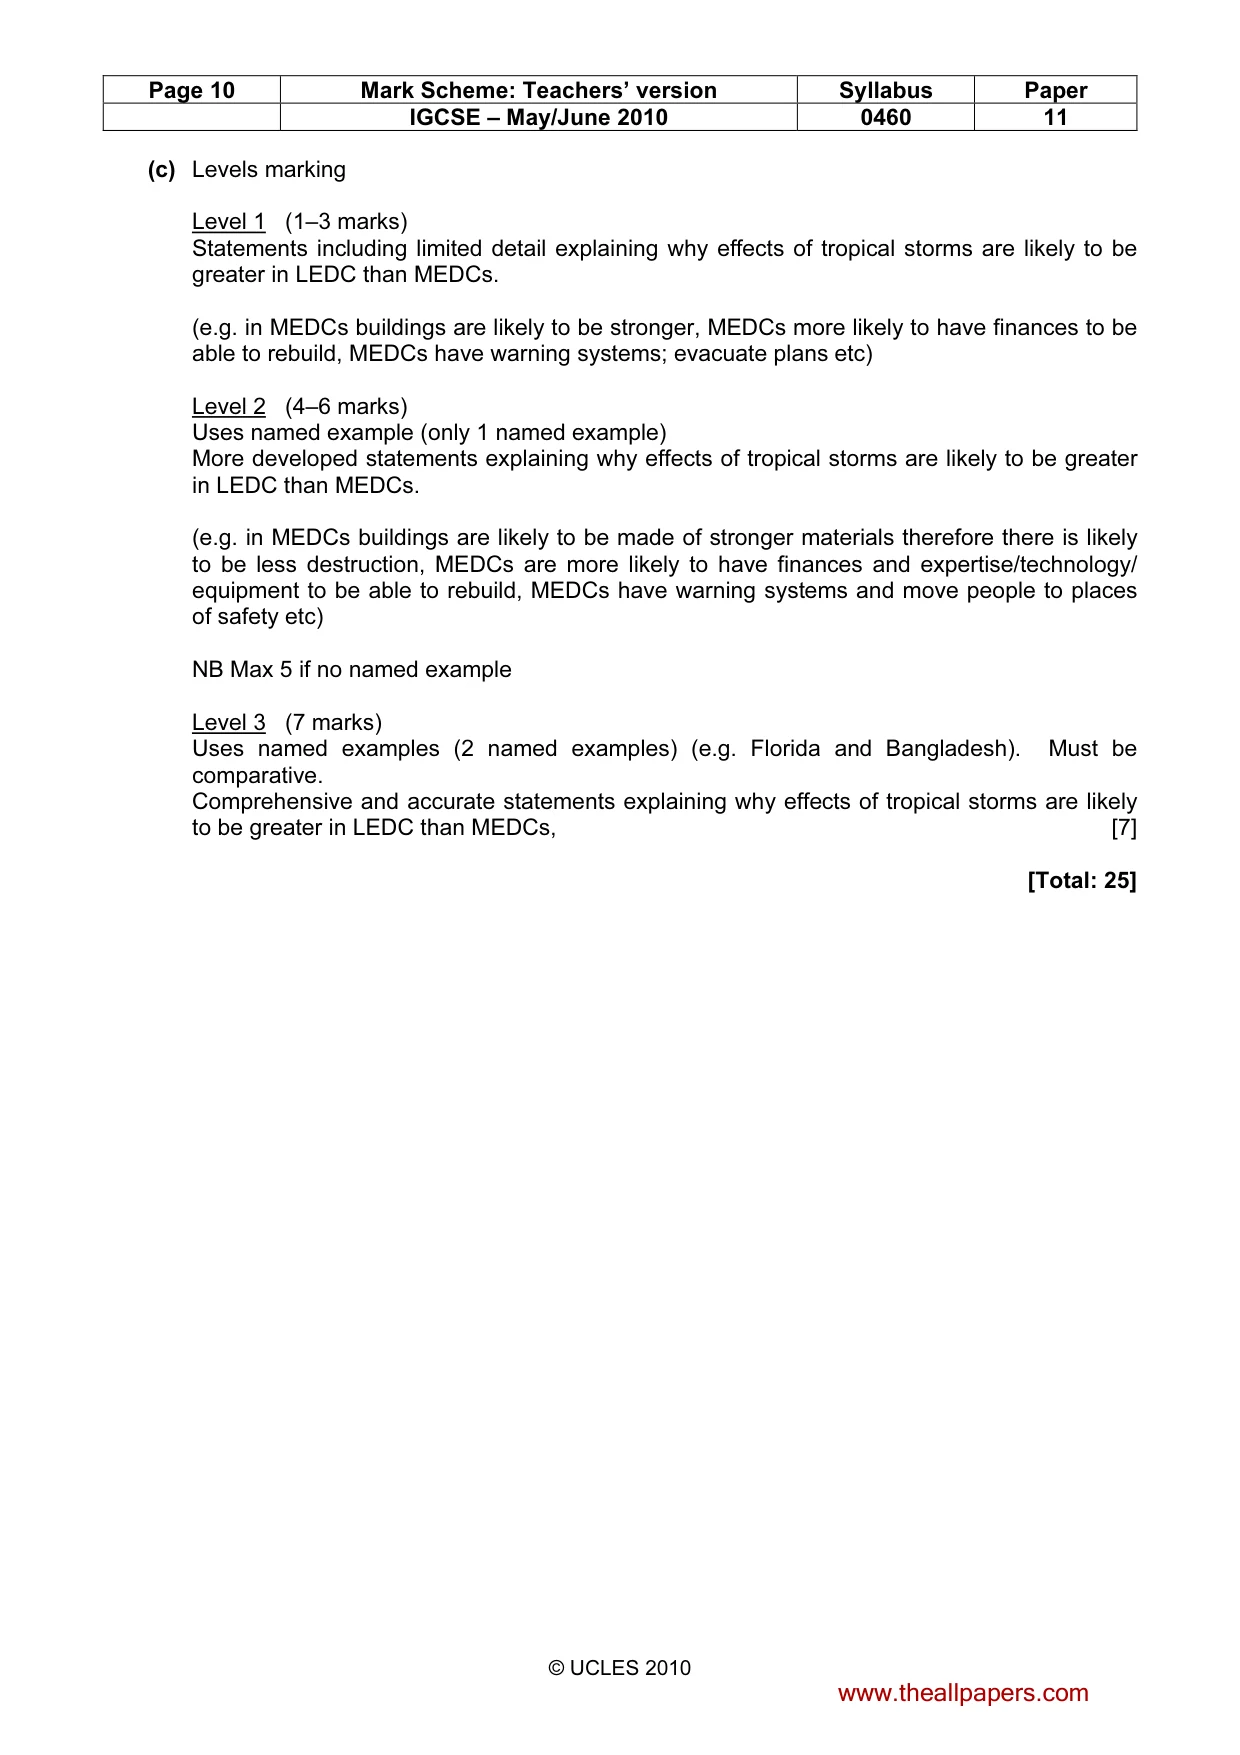
Page 10 Mark Scheme: Teachers’ version Syllabus Paper IGCSE – May/June 2010 0460 11 © UCLES 2010 (c) Levels marking Level 1 (1–3 marks) Statements including limited detail explaining why effects of tropical storms are likely to be greater in LEDC than MEDCs. (e.g. in MEDCs buildings are likely to be stronger, MEDCs more likely to have finances to be able to rebuild, MEDCs have warning systems; evacuate plans etc) Level 2 (4–6 marks) Uses named example (only 1 named example) More developed statements explaining why effects of tropical storms are likely to be greater in LEDC than MEDCs. (e.g. in MEDCs buildings are likely to be made of stronger materials therefore there is likely to be less destruction, MEDCs are more likely to have finances and expertise/technology/ equipment to be able to rebuild, MEDCs have warning systems and move people to places of safety etc) NB Max 5 if no named example Level 3 (7 marks) Uses named examples (2 named examples) (e.g. Florida and Bangladesh). Must be comparative. Comprehensive and accurate statements explaining why effects of tropical storms are likely to be greater in LEDC than MEDCs, [7] [Total: 25] www.theallpapers.com
Mark scheme, page 11
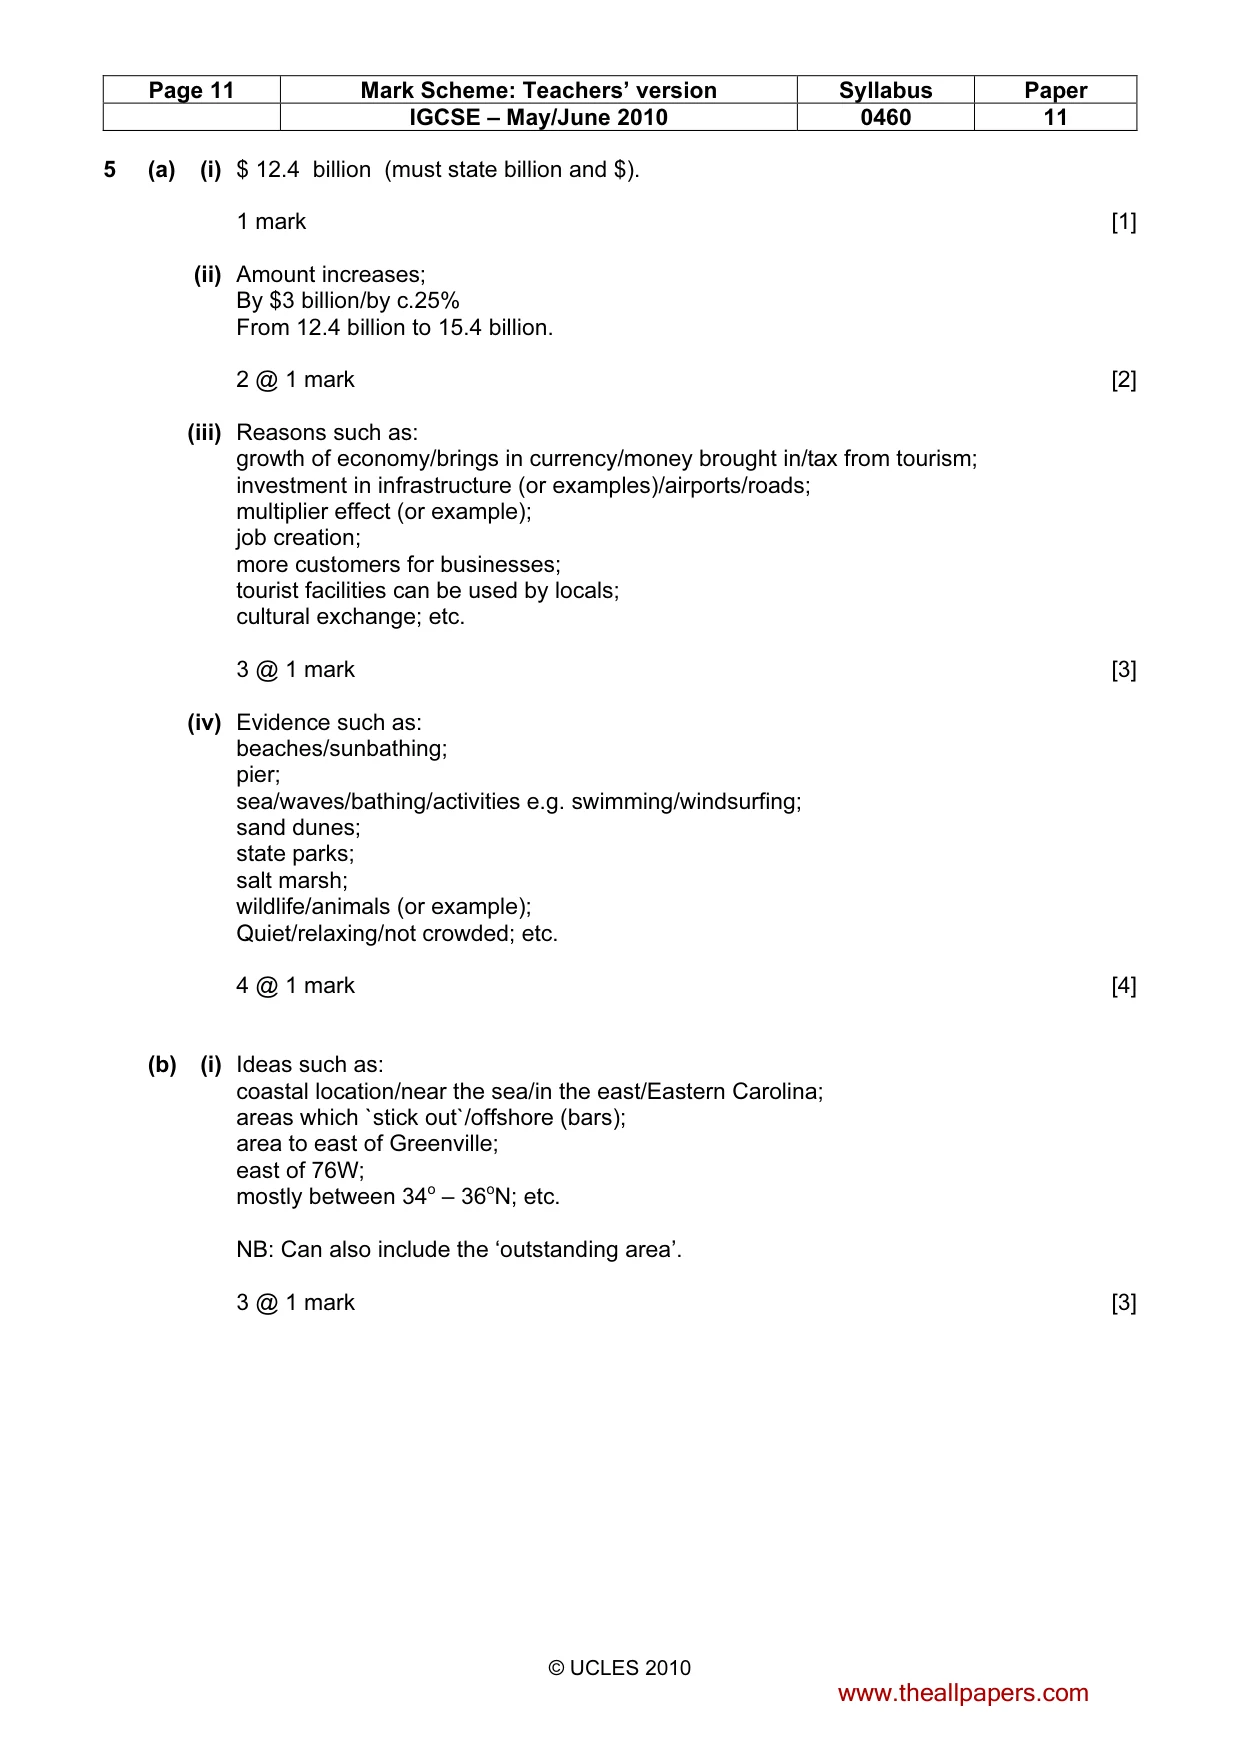
Page 11 Mark Scheme: Teachers’ version Syllabus Paper IGCSE – May/June 2010 0460 11 © UCLES 2010 5 (a) (i) $ 12.4 billion (must state billion and $). 1 mark [1] (ii) Amount increases; By $3 billion/by c.25% From 12.4 billion to 15.4 billion. 2 @ 1 mark [2] (iii) Reasons such as: growth of economy/brings in currency/money brought in/tax from tourism; investment in infrastructure (or examples)/airports/roads; multiplier effect (or example); job creation; more customers for businesses; tourist facilities can be used by locals; cultural exchange; etc. 3 @ 1 mark [3] (iv) Evidence such as: beaches/sunbathing; pier; sea/waves/bathing/activities e.g. swimming/windsurfing; sand dunes; state parks; salt marsh; wildlife/animals (or example); Quiet/relaxing/not crowded; etc. 4 @ 1 mark [4] (b) (i) Ideas such as: coastal location/near the sea/in the east/Eastern Carolina; areas which `stick out`/offshore (bars); area to east of Greenville; east of 76W; mostly between 34o – 36oN; etc. NB: Can also include the ‘outstanding area’. 3 @ 1 mark [3] www.theallpapers.com
Mark scheme, page 12
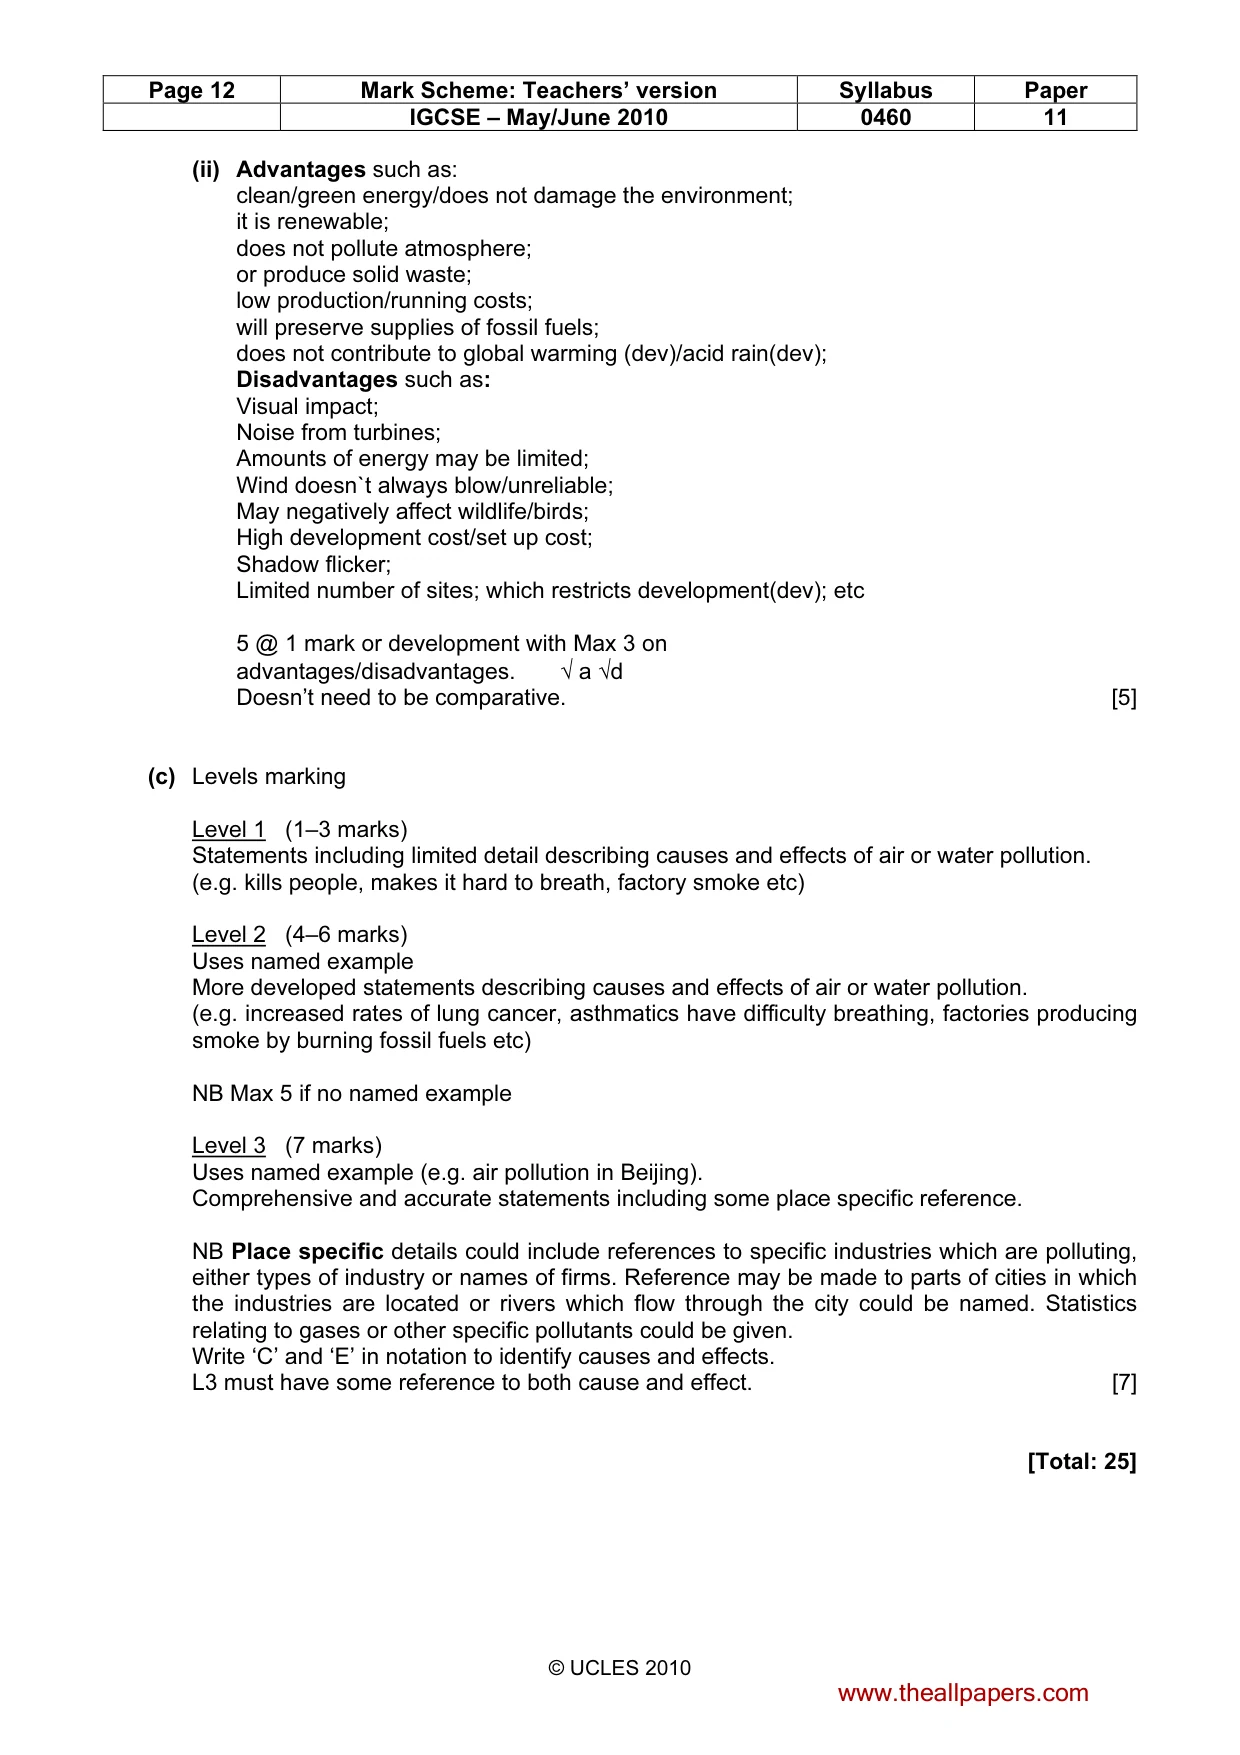
Page 12 Mark Scheme: Teachers’ version Syllabus Paper IGCSE – May/June 2010 0460 11 © UCLES 2010 (ii) Advantages such as: clean/green energy/does not damage the environment; it is renewable; does not pollute atmosphere; or produce solid waste; low production/running costs; will preserve supplies of fossil fuels; does not contribute to global warming (dev)/acid rain(dev); Disadvantages such as: Visual impact; Noise from turbines; Amounts of energy may be limited; Wind doesn`t always blow/unreliable; May negatively affect wildlife/birds; High development cost/set up cost; Shadow flicker; Limited number of sites; which restricts development(dev); etc 5 @ 1 mark or development with Max 3 on advantages/disadvantages. √ a √d Doesn’t need to be comparative. [5] (c) Levels marking Level 1 (1–3 marks) Statements including limited detail describing causes and effects of air or water pollution. (e.g. kills people, makes it hard to breath, factory smoke etc) Level 2 (4–6 marks) Uses named example More developed statements describing causes and effects of air or water pollution. (e.g. increased rates of lung cancer, asthmatics have difficulty breathing, factories producing smoke by burning fossil fuels etc) NB Max 5 if no named example Level 3 (7 marks) Uses named example (e.g. air pollution in Beijing). Comprehensive and accurate statements including some place specific reference. NB Place specific details could include references to specific industries which are polluting, either types of industry or names of firms. Reference may be made to parts of cities in which the industries are located or rivers which flow through the city could be named. Statistics relating to gases or other specific pollutants could be given. Write ‘C’ and ‘E’ in notation to identify causes and effects. L3 must have some reference to both cause and effect. [7] [Total: 25] www.theallpapers.com
Mark scheme, page 13
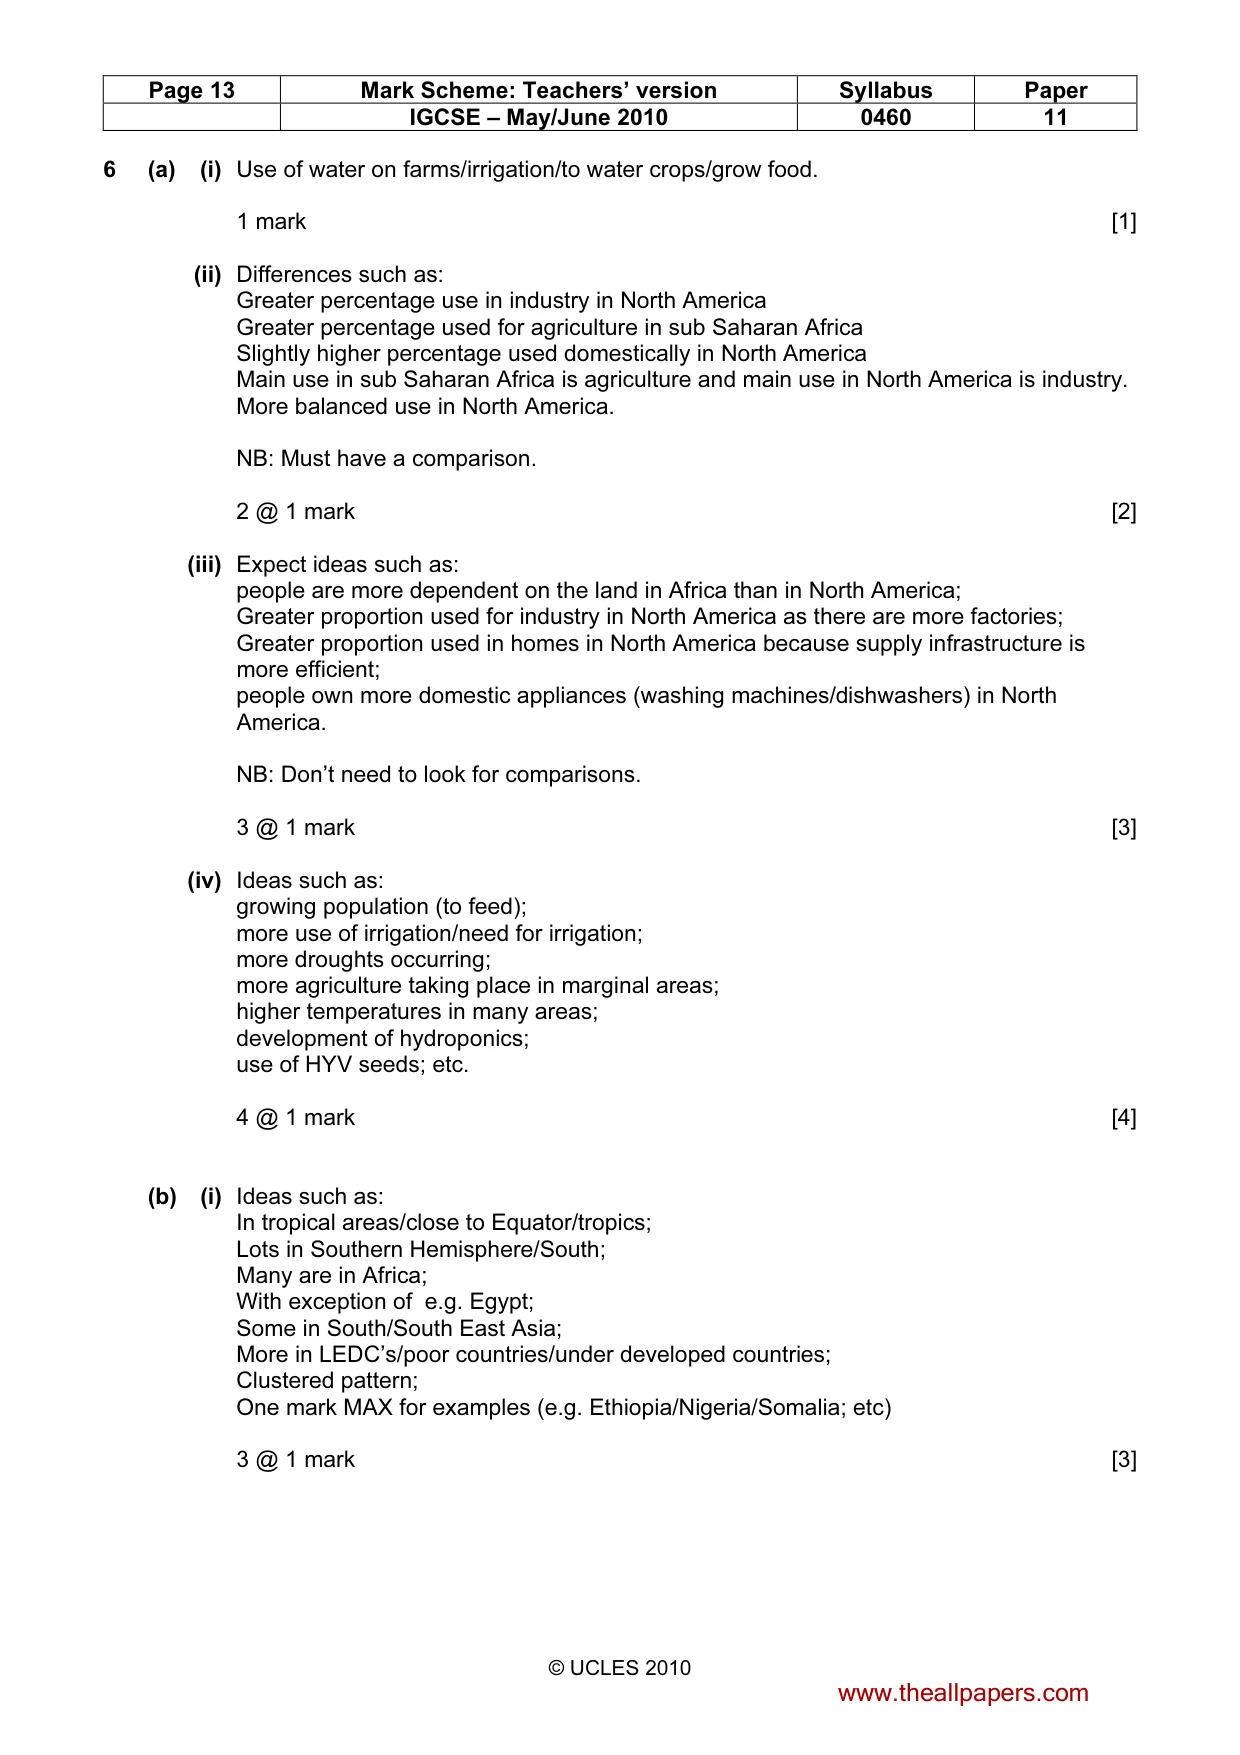
Page 13 Mark Scheme: Teachers’ version Syllabus Paper IGCSE – May/June 2010 0460 11 © UCLES 2010 6 (a) (i) Use of water on farms/irrigation/to water crops/grow food. 1 mark [1] (ii) Differences such as: Greater percentage use in industry in North America Greater percentage used for agriculture in sub Saharan Africa Slightly higher percentage used domestically in North America Main use in sub Saharan Africa is agriculture and main use in North America is industry. More balanced use in North America. NB: Must have a comparison. 2 @ 1 mark [2] (iii) Expect ideas such as: people are more dependent on the land in Africa than in North America; Greater proportion used for industry in North America as there are more factories; Greater proportion used in homes in North America because supply infrastructure is more efficient; people own more domestic appliances (washing machines/dishwashers) in North America. NB: Don’t need to look for comparisons. 3 @ 1 mark [3] (iv) Ideas such as: growing population (to feed); more use of irrigation/need for irrigation; more droughts occurring; more agriculture taking place in marginal areas; higher temperatures in many areas; development of hydroponics; use of HYV seeds; etc. 4 @ 1 mark [4] (b) (i) Ideas such as: In tropical areas/close to Equator/tropics; Lots in Southern Hemisphere/South; Many are in Africa; With exception of e.g. Egypt; Some in South/South East Asia; More in LEDC’s/poor countries/under developed countries; Clustered pattern; One mark MAX for examples (e.g. Ethiopia/Nigeria/Somalia; etc) 3 @ 1 mark [3] www.theallpapers.com
Mark scheme, page 14
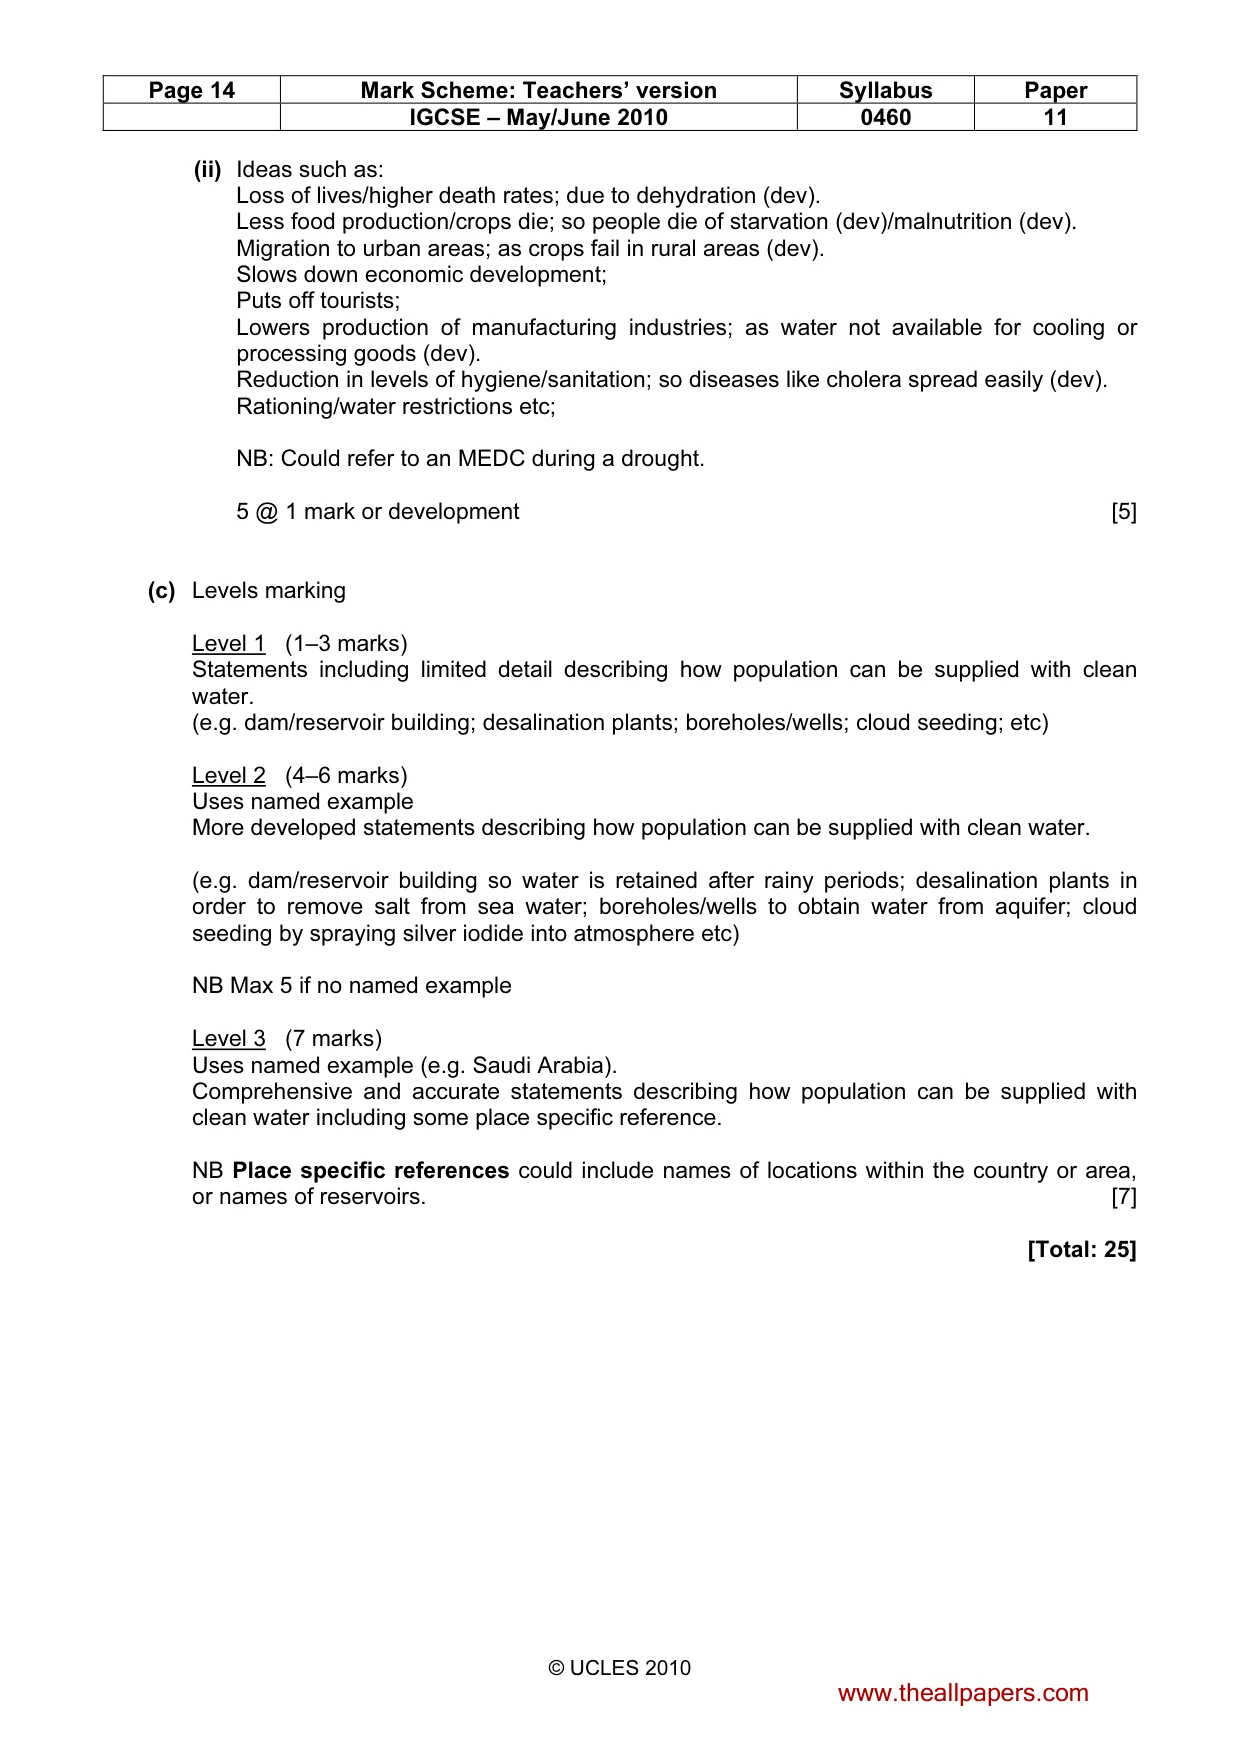
Page 14 Mark Scheme: Teachers’ version Syllabus Paper IGCSE – May/June 2010 0460 11 © UCLES 2010 (ii) Ideas such as: Loss of lives/higher death rates; due to dehydration (dev). Less food production/crops die; so people die of starvation (dev)/malnutrition (dev). Migration to urban areas; as crops fail in rural areas (dev). Slows down economic development; Puts off tourists; Lowers production of manufacturing industries; as water not available for cooling or processing goods (dev). Reduction in levels of hygiene/sanitation; so diseases like cholera spread easily (dev). Rationing/water restrictions etc; NB: Could refer to an MEDC during a drought. 5 @ 1 mark or development [5] (c) Levels marking Level 1 (1–3 marks) Statements including limited detail describing how population can be supplied with clean water. (e.g. dam/reservoir building; desalination plants; boreholes/wells; cloud seeding; etc) Level 2 (4–6 marks) Uses named example More developed statements describing how population can be supplied with clean water. (e.g. dam/reservoir building so water is retained after rainy periods; desalination plants in order to remove salt from sea water; boreholes/wells to obtain water from aquifer; cloud seeding by spraying silver iodide into atmosphere etc) NB Max 5 if no named example Level 3 (7 marks) Uses named example (e.g. Saudi Arabia). Comprehensive and accurate statements describing how population can be supplied with clean water including some place specific reference. NB Place specific references could include names of locations within the country or area, or names of reservoirs. [7] [Total: 25] www.theallpapers.com
What you needed in this session
Cambridge’s own grade thresholds for 2010 May/June, Paper 1 · Variant 1. A higher threshold means an easier paper — the bar moves with how the cohort did.