Cambridge IGCSE Geography 0460 — 2010 May/June Paper 1 · Variant 2
0460/12/M/J/10 · 75 marks · ≈84 min
The question paper and its mark scheme, free to read here and free to download. This is Cambridge’s own paper, exactly as it was sat.
Question paper12 pages

Mark scheme15 pages
Answers below. Sit the paper first if you are practising.

Paper as text
Question paper, page 1
This document consists of 11 printed pages, 1 blank page and 1 Insert. DC (CW/SW) 16990/7 © UCLES 2010 [Turn over UNIVERSITY OF CAMBRIDGE INTERNATIONAL EXAMINATIONS International General Certificate of Secondary Education READ THESE INSTRUCTIONS FIRST If you have been given an Answer Booklet, follow the instructions on the front cover of the Booklet. Write your Centre number, candidate number and name on all the work you hand in. Write in dark blue or black pen. You may use a soft pencil for any diagrams, graphs or rough working. Do not use staples, paper clips, highlighters, glue or correction fluid. Answer three questions. Sketch maps and diagrams should be drawn whenever they serve to illustrate an answer. The Insert contains Photographs A, B and C for Question 2 and Photograph D for Question 3. At the end of the examination, fasten all your work securely together. The number of marks is given in brackets [ ] at the end of each question or part question. * 9 6 8 3 5 3 1 8 2 8 * GEOGRAPHY 0460/12 Paper 1 May/June 2010 1 hour 45 minutes Additional Materials: Answer Booklet/Paper Ruler www.theallpapers.com
Question paper, page 2
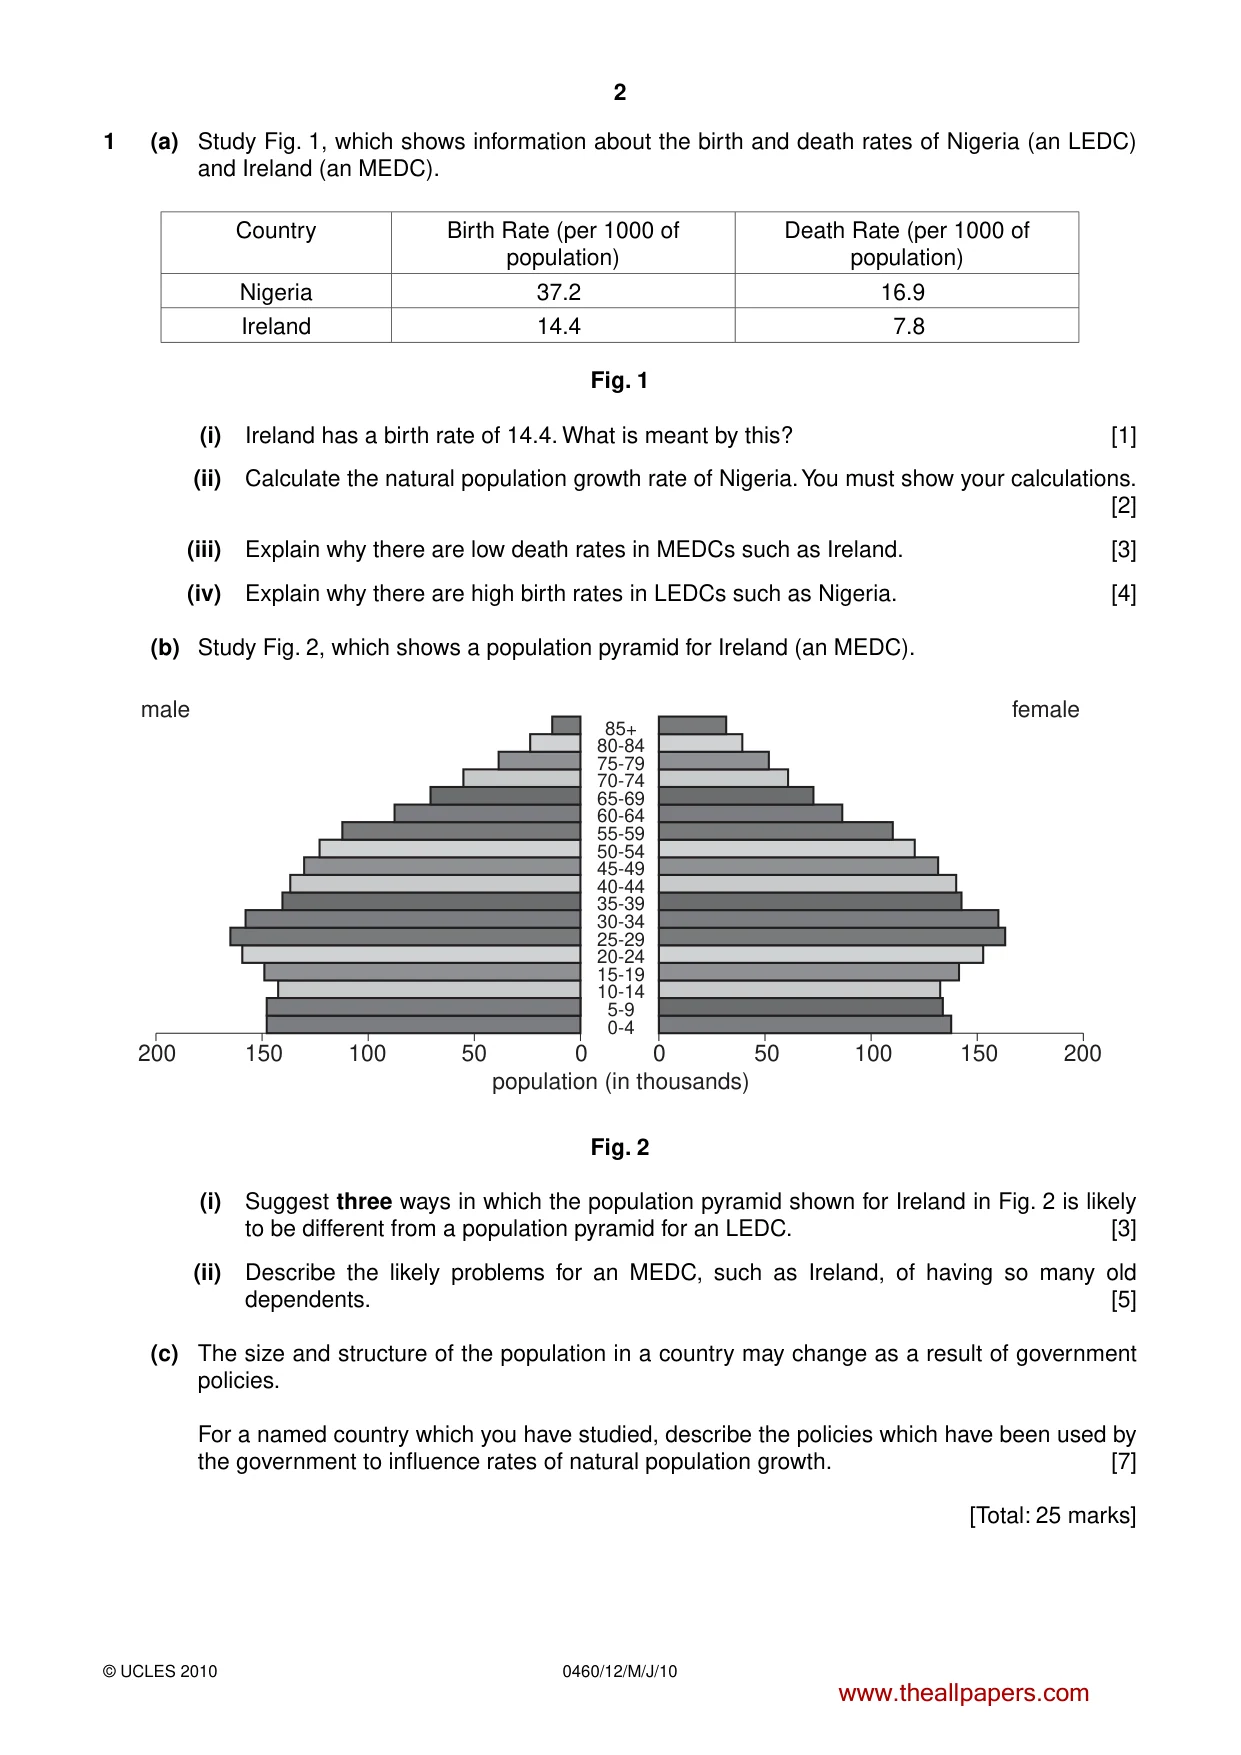
2 0460/12/M/J/10 © UCLES 2010 1 (a) Study Fig. 1, which shows information about the birth and death rates of Nigeria (an LEDC) and Ireland (an MEDC). Country Birth Rate (per 1000 of population) Death Rate (per 1000 of population) Nigeria 37.2 16.9 Ireland 14.4 7.8 Fig. 1 (i) Ireland has a birth rate of 14.4. What is meant by this? [1] (ii) Calculate the natural population growth rate of Nigeria. You must show your calculations. [2] (iii) Explain why there are low death rates in MEDCs such as Ireland. [3] (iv) Explain why there are high birth rates in LEDCs such as Nigeria. [4] (b) Study Fig. 2, which shows a population pyramid for Ireland (an MEDC). 0 0-4 population (in thousands) male female 5-9 10-14 15-19 20-24 25-29 30-34 35-39 40-44 45-49 50-54 55-59 60-64 65-69 70-74 75-79 80-84 85+ 0 50 50 100 100 150 150 200 200 Fig. 2 (i) Suggest three ways in which the population pyramid shown for Ireland in Fig. 2 is likely to be different from a population pyramid for an LEDC. [3] (ii) Describe the likely problems for an MEDC, such as Ireland, of having so many old dependents. [5] (c) The size and structure of the population in a country may change as a result of government policies. For a named country which you have studied, describe the policies which have been used by the government to influence rates of natural population growth. [7] [Total: 25 marks] www.theallpapers.com
Question paper, page 3
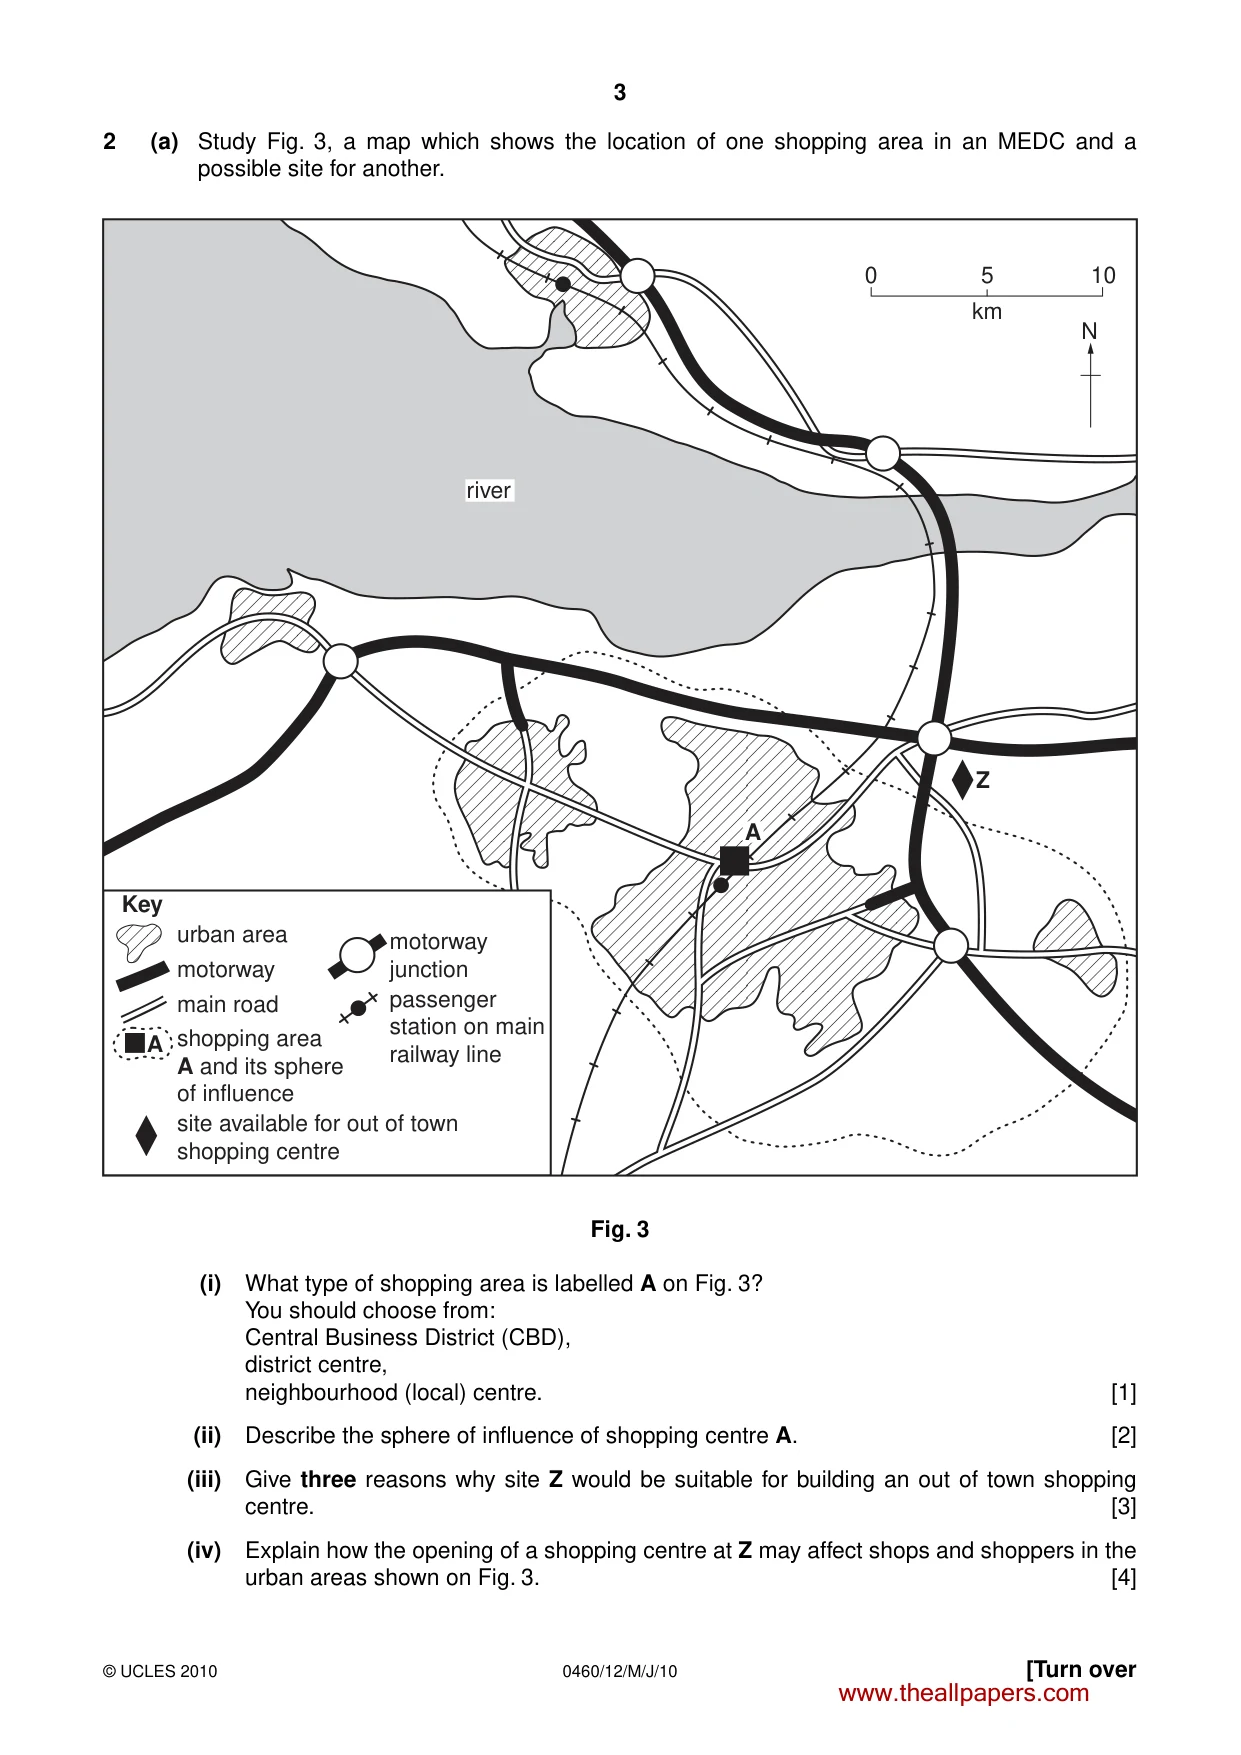
3 0460/12/M/J/10 © UCLES 2010 [Turn over 2 (a) Study Fig. 3, a map which shows the location of one shopping area in an MEDC and a possible site for another. 0 5 km river N 10 A Z A urban area motorway main road Key motorway junction passenger station on main railway line shopping area A and its sphere of influence site available for out of town shopping centre Fig. 3 (i) What type of shopping area is labelled A on Fig. 3? You should choose from: Central Business District (CBD), district centre, neighbourhood (local) centre. [1] (ii) Describe the sphere of influence of shopping centre A. [2] (iii) Give three reasons why site Z would be suitable for building an out of town shopping centre. [3] (iv) Explain how the opening of a shopping centre at Z may affect shops and shoppers in the urban areas shown on Fig. 3. [4] www.theallpapers.com
Question paper, page 4
4 0460/12/M/J/10 © UCLES 2010 (b) Study Photographs A, B and C (Insert) which show different types of shopping centre. (i) For each photograph state whether it shows a Central Business District, a neighbourhood (local) centre or an out of town shopping centre. [3] (ii) Explain why many people only travel short distances to use the shops and services in a neighbourhood (local) shopping centre. [5] (c) For a named urban area which you have studied, describe the main features of its Central Business District (CBD). [7] [Total: 25 marks] www.theallpapers.com
Question paper, page 5
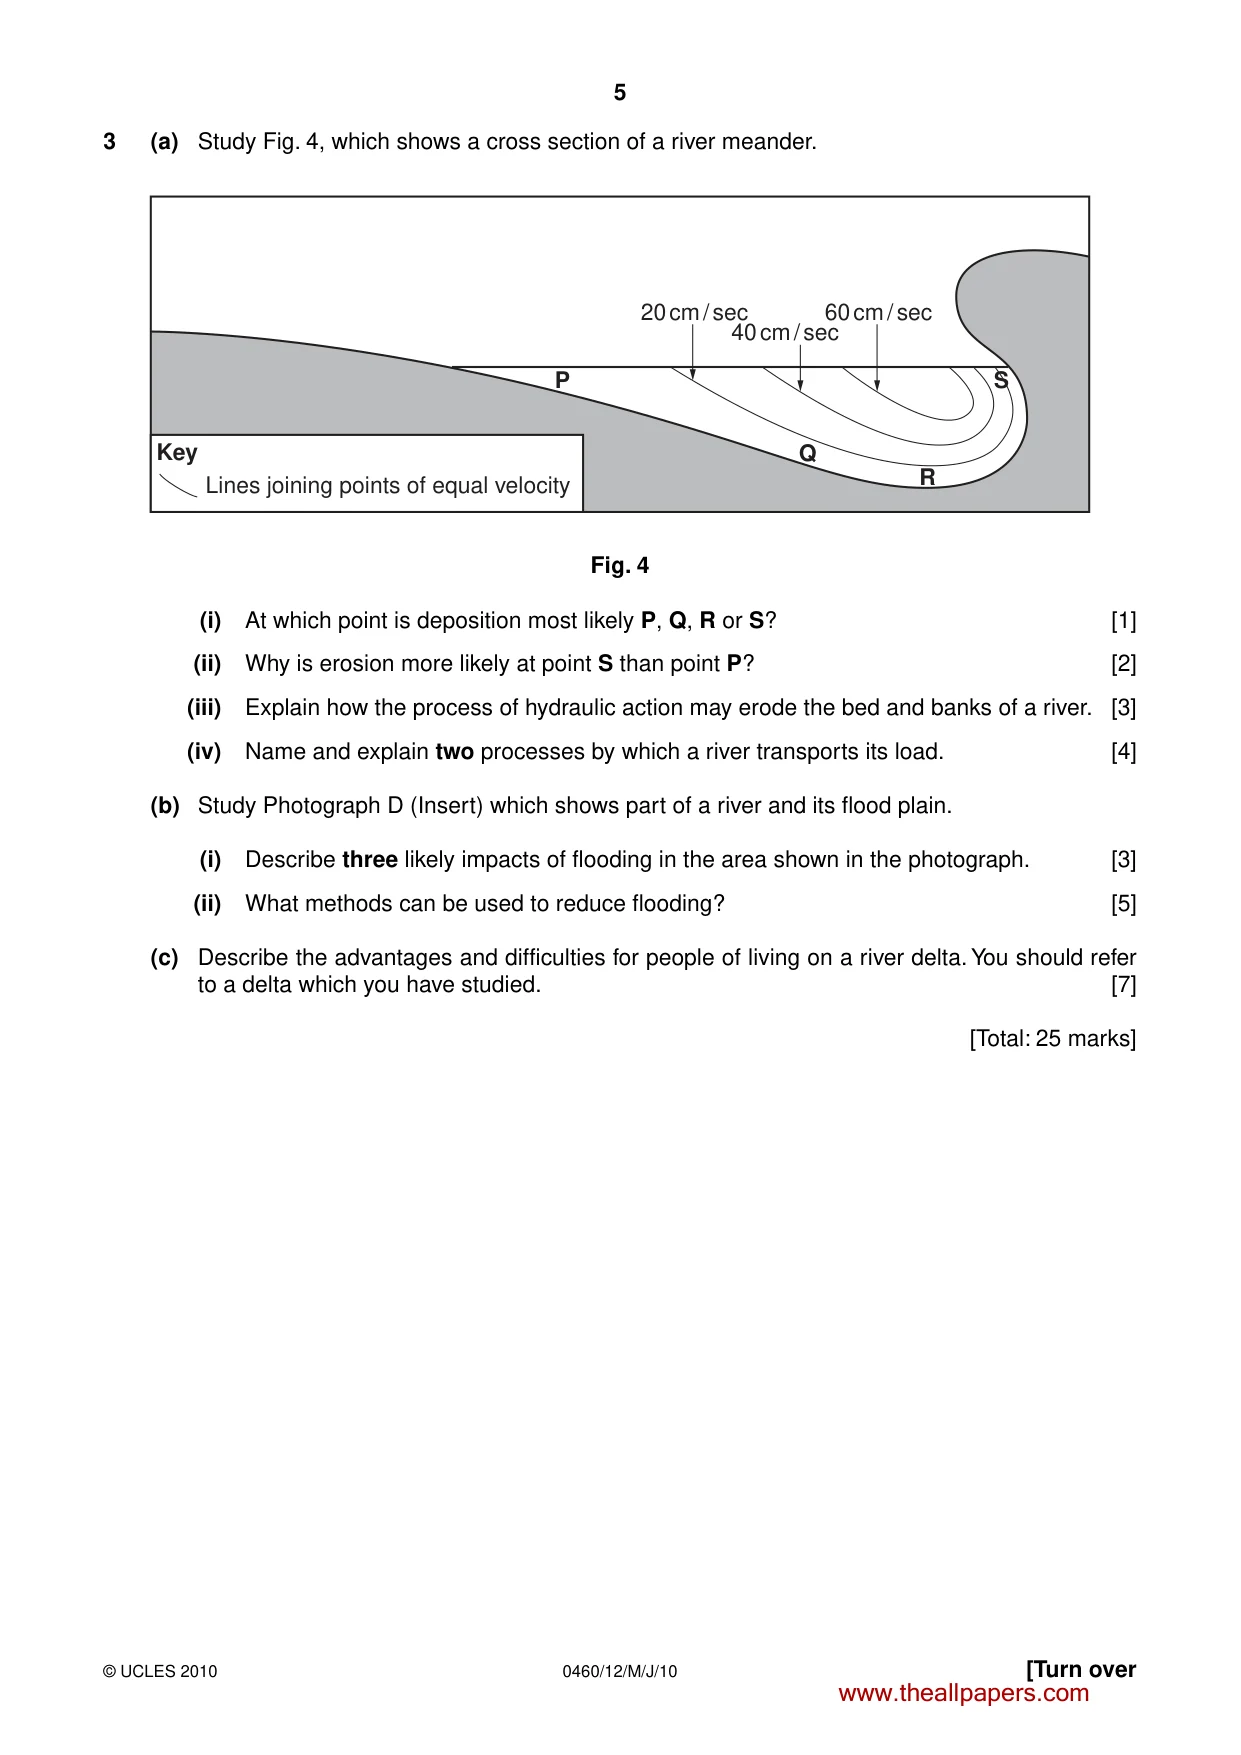
5 0460/12/M/J/10 © UCLES 2010 [Turn over 3 (a) Study Fig. 4, which shows a cross section of a river meander. 20 cm / sec 40 cm / sec 60 cm / sec P Q R S Key Lines joining points of equal velocity Fig. 4 (i) At which point is deposition most likely P, Q, R or S? [1] (ii) Why is erosion more likely at point S than point P? [2] (iii) Explain how the process of hydraulic action may erode the bed and banks of a river. [3] (iv) Name and explain two processes by which a river transports its load. [4] (b) Study Photograph D (Insert) which shows part of a river and its flood plain. (i) Describe three likely impacts of flooding in the area shown in the photograph. [3] (ii) What methods can be used to reduce flooding? [5] (c) Describe the advantages and difficulties for people of living on a river delta. You should refer to a delta which you have studied. [7] [Total: 25 marks] www.theallpapers.com
Question paper, page 6
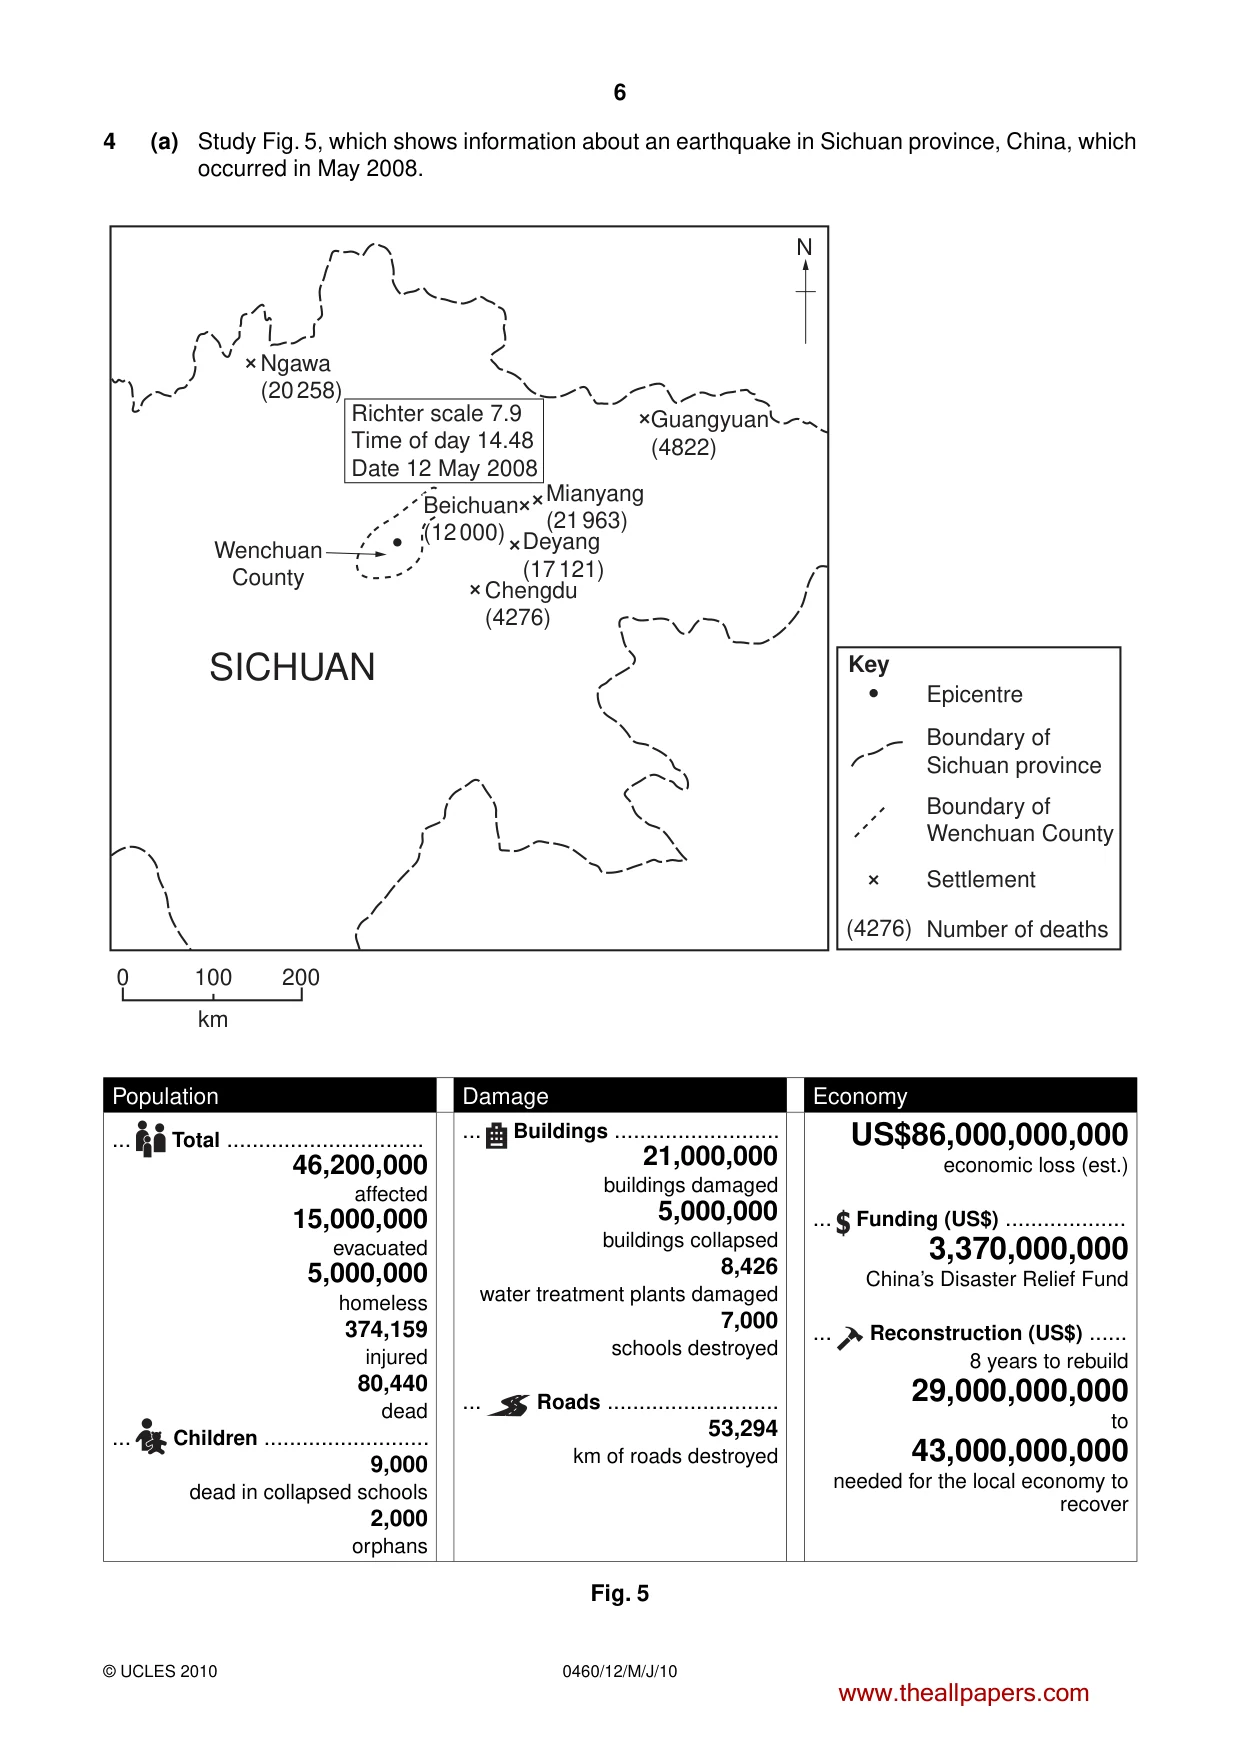
6 0460/12/M/J/10 © UCLES 2010 4 (a) Study Fig. 5, which shows information about an earthquake in Sichuan province, China, which occurred in May 2008. N Ngawa (20 258) Guangyuan (4822) Epicentre Key Boundary of Sichuan province Boundary of Wenchuan County Settlement Number of deaths Mianyang (21 963) Richter scale 7.9 Time of day 14.48 Date 12 May 2008 Deyang (17 121) (4276) 200 100 km 0 Chengdu (4276) Wenchuan County SICHUAN Beichuan (12 000) Population Damage Economy ... Total … 46,200,000 affected 15,000,000 evacuated 5,000,000 homeless 374,159 injured 80,440 dead ... Children … 9,000 dead in collapsed schools 2,000 orphans ... Buildings … 21,000,000 buildings damaged 5,000,000 buildings collapsed 8,426 water treatment plants damaged 7,000 schools destroyed ... Roads … 53,294 km of roads destroyed US$86,000,000,000 economic loss (est.) ... Funding (US$) … 3,370,000,000 China’s Disaster Relief Fund ... Reconstruction (US$) … 8 years to rebuild 29,000,000,000 to 43,000,000,000 needed for the local economy to recover Fig. 5 www.theallpapers.com
Question paper, page 7
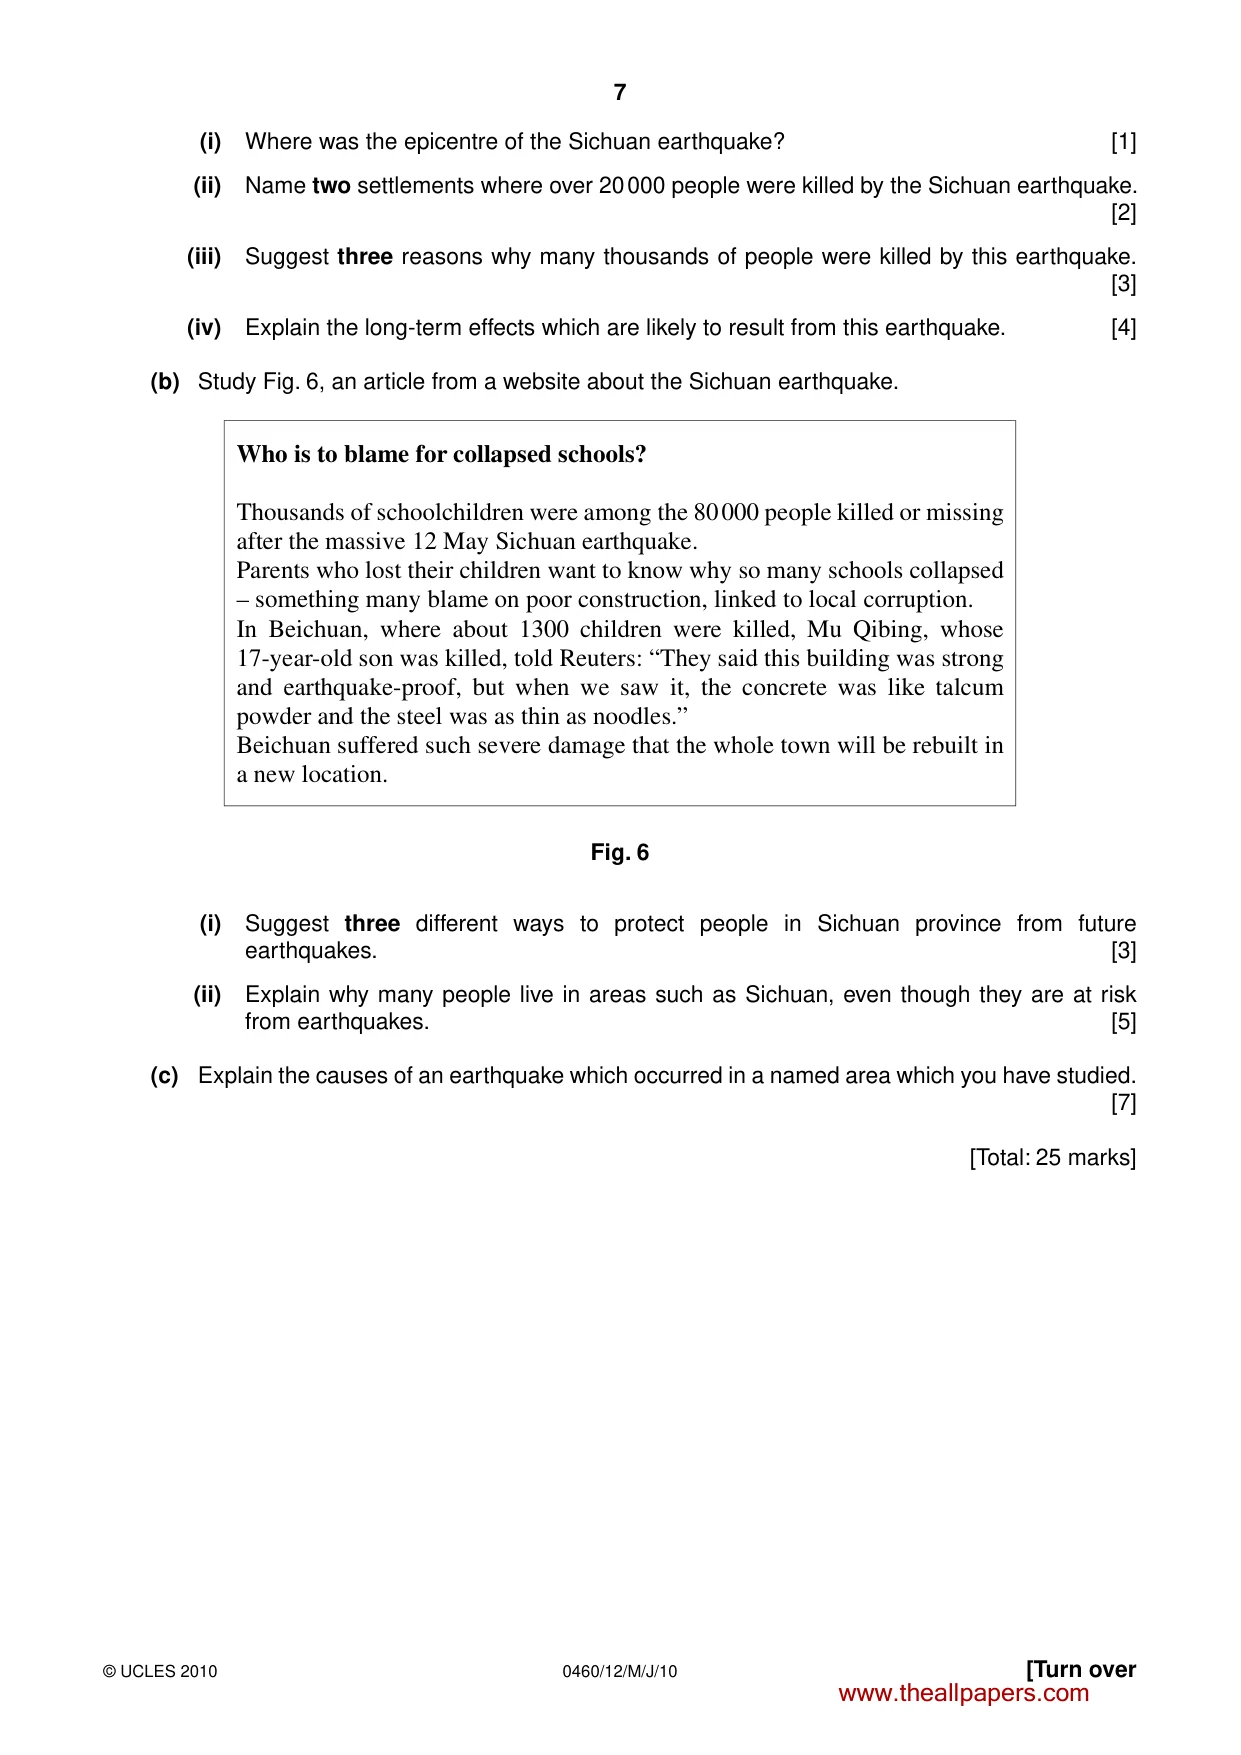
7 0460/12/M/J/10 © UCLES 2010 [Turn over (i) Where was the epicentre of the Sichuan earthquake? [1] (ii) Name two settlements where over 20 000 people were killed by the Sichuan earthquake. [2] (iii) Suggest three reasons why many thousands of people were killed by this earthquake. [3] (iv) Explain the long-term effects which are likely to result from this earthquake. [4] (b) Study Fig. 6, an article from a website about the Sichuan earthquake. Who is to blame for collapsed schools? Thousands of schoolchildren were among the 80 000 people killed or missing after the massive 12 May Sichuan earthquake. Parents who lost their children want to know why so many schools collapsed – something many blame on poor construction, linked to local corruption. In Beichuan, where about 1300 children were killed, Mu Qibing, whose 17-year-old son was killed, told Reuters: “They said this building was strong and earthquake-proof, but when we saw it, the concrete was like talcum powder and the steel was as thin as noodles.” Beichuan suffered such severe damage that the whole town will be rebuilt in a new location. Fig. 6 (i) Suggest three different ways to protect people in Sichuan province from future earthquakes. [3] (ii) Explain why many people live in areas such as Sichuan, even though they are at risk from earthquakes. [5] (c) Explain the causes of an earthquake which occurred in a named area which you have studied. [7] [Total: 25 marks] www.theallpapers.com
Question paper, page 8
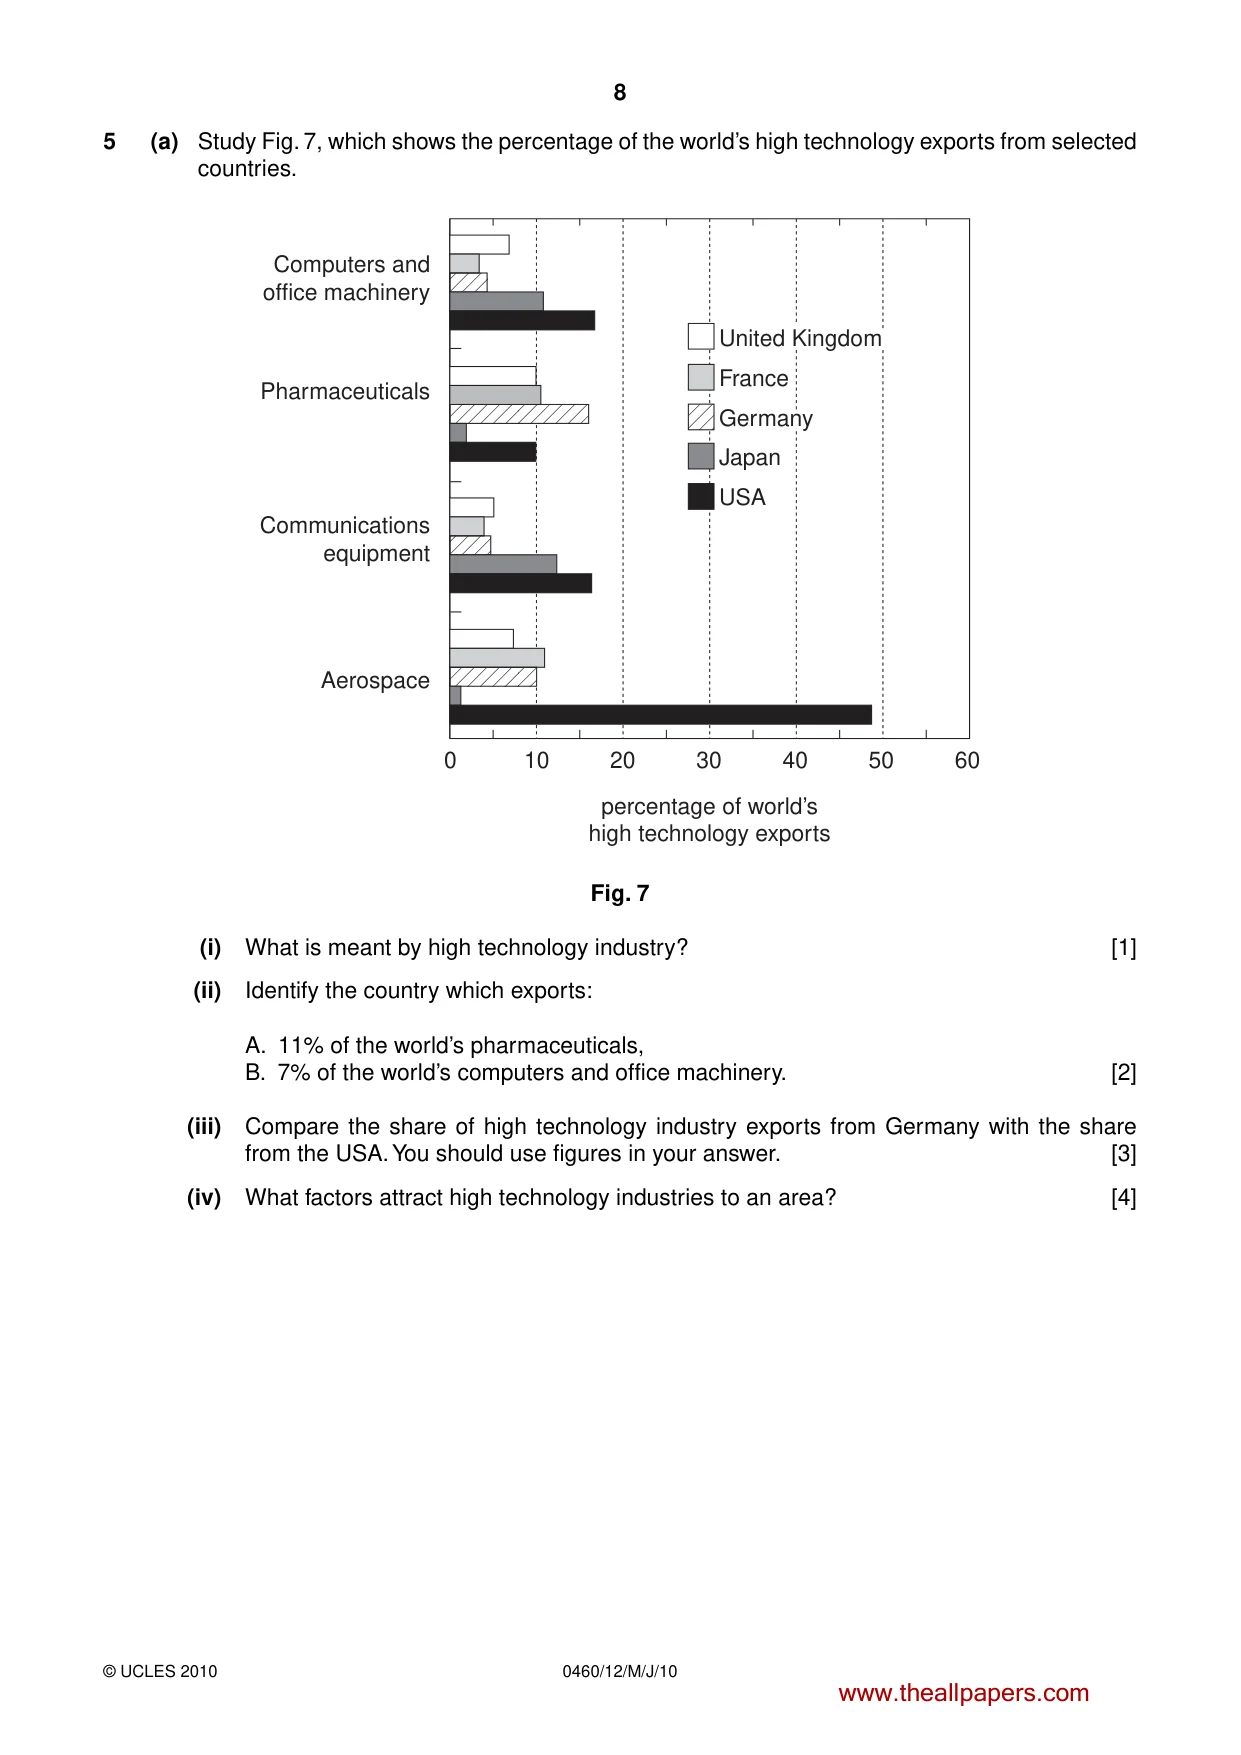
8 0460/12/M/J/10 © UCLES 2010 5 (a) Study Fig. 7, which shows the percentage of the world’s high technology exports from selected countries. United Kingdom France Germany Japan USA 0 10 20 30 percentage of world’s high technology exports Computers and office machinery Pharmaceuticals Communications equipment Aerospace 40 50 60 Fig. 7 (i) What is meant by high technology industry? [1] (ii) Identify the country which exports: A. 11% of the world’s pharmaceuticals, B. 7% of the world’s computers and office machinery. [2] (iii) Compare the share of high technology industry exports from Germany with the share from the USA. You should use figures in your answer. [3] (iv) What factors attract high technology industries to an area? [4] www.theallpapers.com
Question paper, page 9
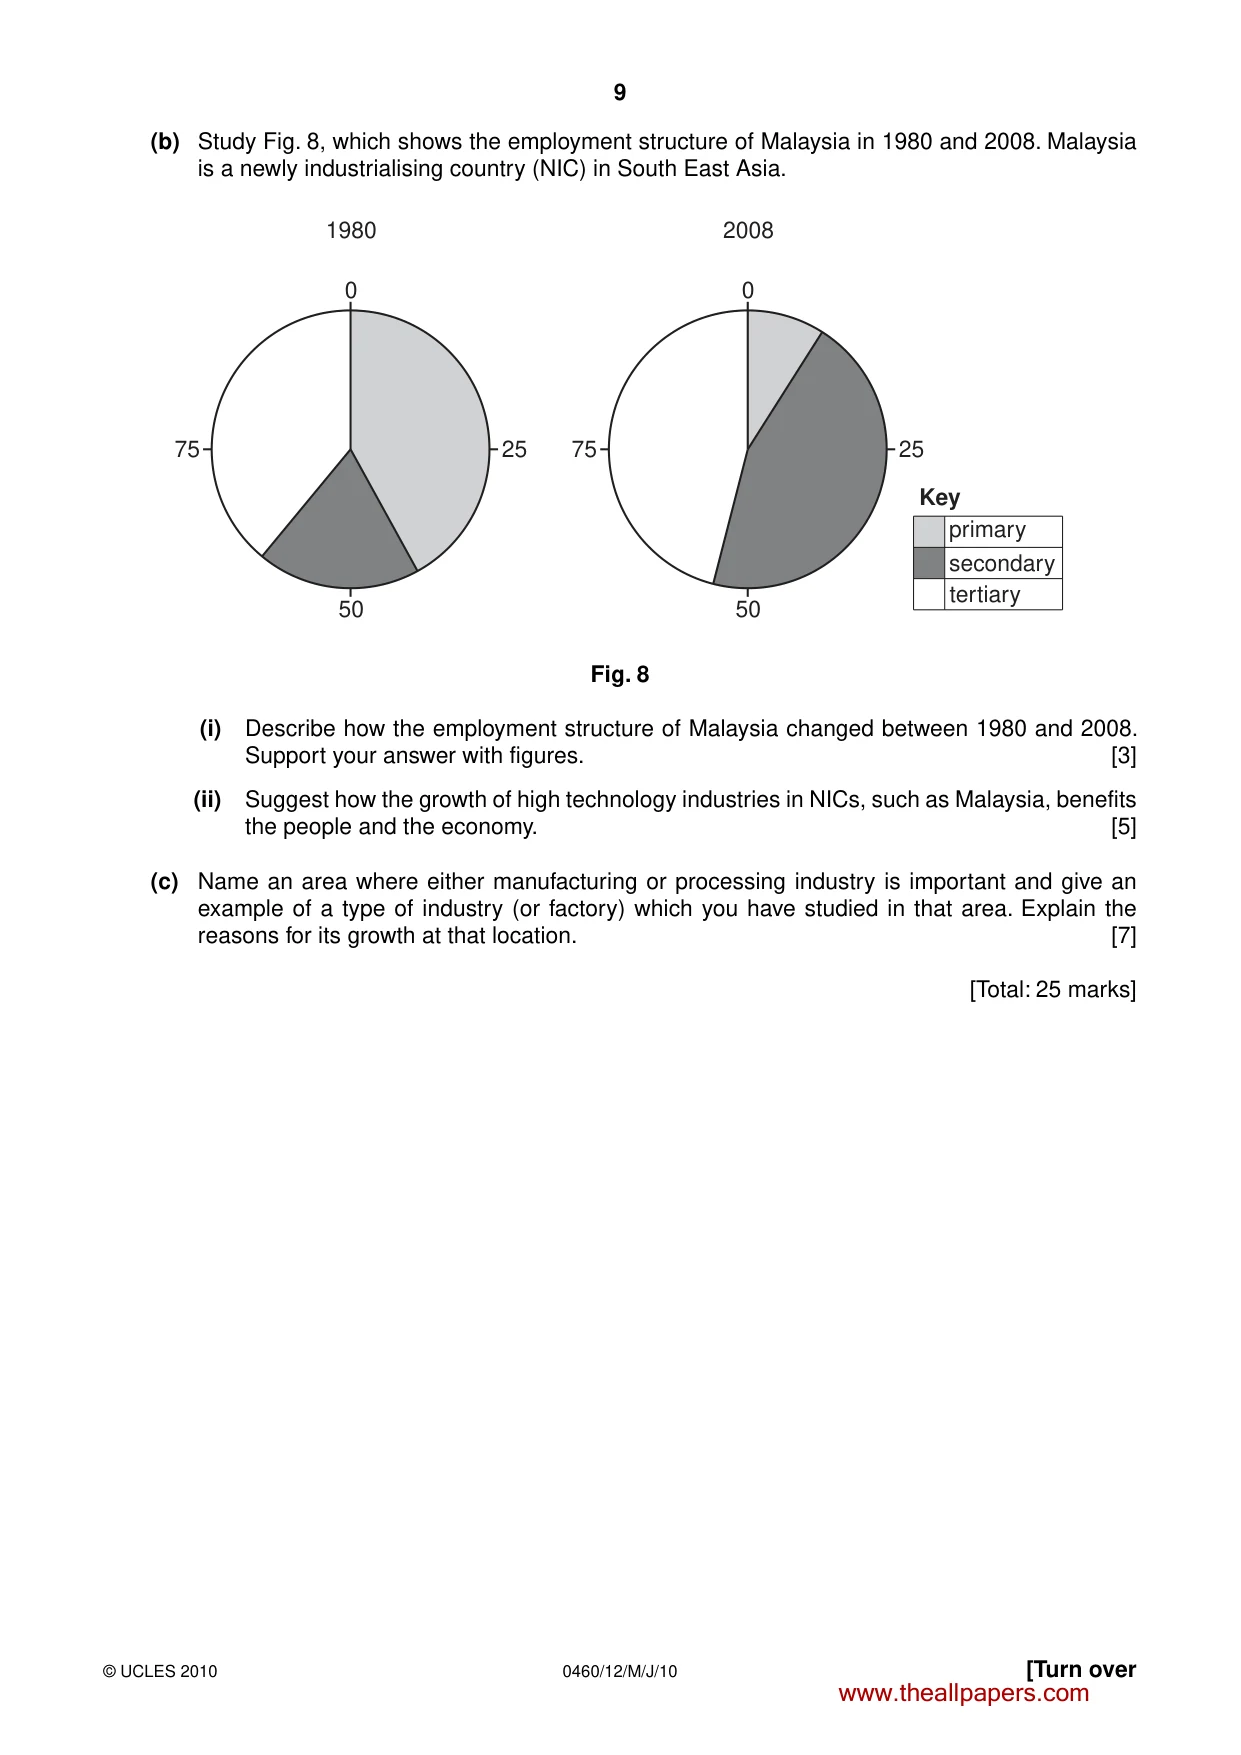
9 0460/12/M/J/10 © UCLES 2010 [Turn over (b) Study Fig. 8, which shows the employment structure of Malaysia in 1980 and 2008. Malaysia is a newly industrialising country (NIC) in South East Asia. 1980 0 50 25 75 0 50 25 75 primary Key secondary tertiary 2008 Fig. 8 (i) Describe how the employment structure of Malaysia changed between 1980 and 2008. Support your answer with figures. [3] (ii) Suggest how the growth of high technology industries in NICs, such as Malaysia, benefits the people and the economy. [5] (c) Name an area where either manufacturing or processing industry is important and give an example of a type of industry (or factory) which you have studied in that area. Explain the reasons for its growth at that location. [7] [Total: 25 marks] www.theallpapers.com
Question paper, page 10
10 0460/12/M/J/10 © UCLES 2010 6 (a) Study Fig. 9, which shows the percentage use of water in selected world regions. World Agricultural Industrial Household Asia (excluding Middle East) Europe North America Sub-Saharan Africa % use of water Fig. 9 (i) What is meant by industrial use of water? [1] (ii) State two differences between the percentage use of water in Europe and Asia. [2] (iii) Suggest reasons for the variation in the percentage use of water in Europe and Asia. [3] (iv) The total amount of water used for household purposes in the world is increasing. Suggest reasons for this. [4] www.theallpapers.com
Question paper, page 11
11 0460/12/M/J/10 © UCLES 2010 (b) Study Fig. 10, which shows information about access to clean drinking water. Key under 30 30–44 45–59 60–74 75–90 over 90 % of population with access to clean drinking water Fig. 10 (i) Describe the distribution of areas where more than 90% of the population has access to clean drinking water. [3] (ii) Describe how the population of a country can be provided with a reliable supply of clean drinking water. [5] (c) Many areas have a shortage of water supplies. Describe the likely impacts of a water shortage on the people and development of a named area which you have studied. [7] [Total: 25 marks] www.theallpapers.com
Question paper, page 12
12 0460/12/M/J/10 © UCLES 2010 BLANK PAGE Copyright Acknowledgements: Question 4 Figure 6 © http://news.bbc.co.uk/2/hi/asia-pacific/7449814.stm. Question 5 Figure 7 © http://www.nsf.gov/statistics/seind02/c6/fig06-06.htm. Photograph A Steve Sibley © UCLES. Photograph B Steve Sibley © UCLES. Photograph C Steve Sibley © UCLES. Photograph D Steve Sibley © UCLES. Permission to reproduce items where third-party owned material protected by copyright is included has been sought and cleared where possible. Every reasonable effort has been made by the publisher (UCLES) to trace copyright holders, but if any items requiring clearance have unwittingly been included, the publisher will be pleased to make amends at the earliest possible opportunity. University of Cambridge International Examinations is part of the Cambridge Assessment Group. Cambridge Assessment is the brand name of University of Cambridge Local Examinations Syndicate (UCLES), which is itself a department of the University of Cambridge. www.theallpapers.com
Mark scheme, page 1
UNIVERSITY OF CAMBRIDGE INTERNATIONAL EXAMINATIONS International General Certificate of Secondary Education MARK SCHEME for the May/June 2010 question paper for the guidance of teachers 0460 GEOGRAPHY 0460/12 Paper 12, maximum raw mark 75 This mark scheme is published as an aid to teachers and candidates, to indicate the requirements of the examination. It shows the basis on which Examiners were instructed to award marks. It does not indicate the details of the discussions that took place at an Examiners’ meeting before marking began, which would have considered the acceptability of alternative answers. Mark schemes must be read in conjunction with the question papers and the report on the examination. • CIE will not enter into discussions or correspondence in connection with these mark schemes. CIE is publishing the mark schemes for the May/June 2010 question papers for most IGCSE, GCE Advanced Level and Advanced Subsidiary Level syllabuses and some Ordinary Level syllabuses. www.theallpapers.com
Mark scheme, page 2
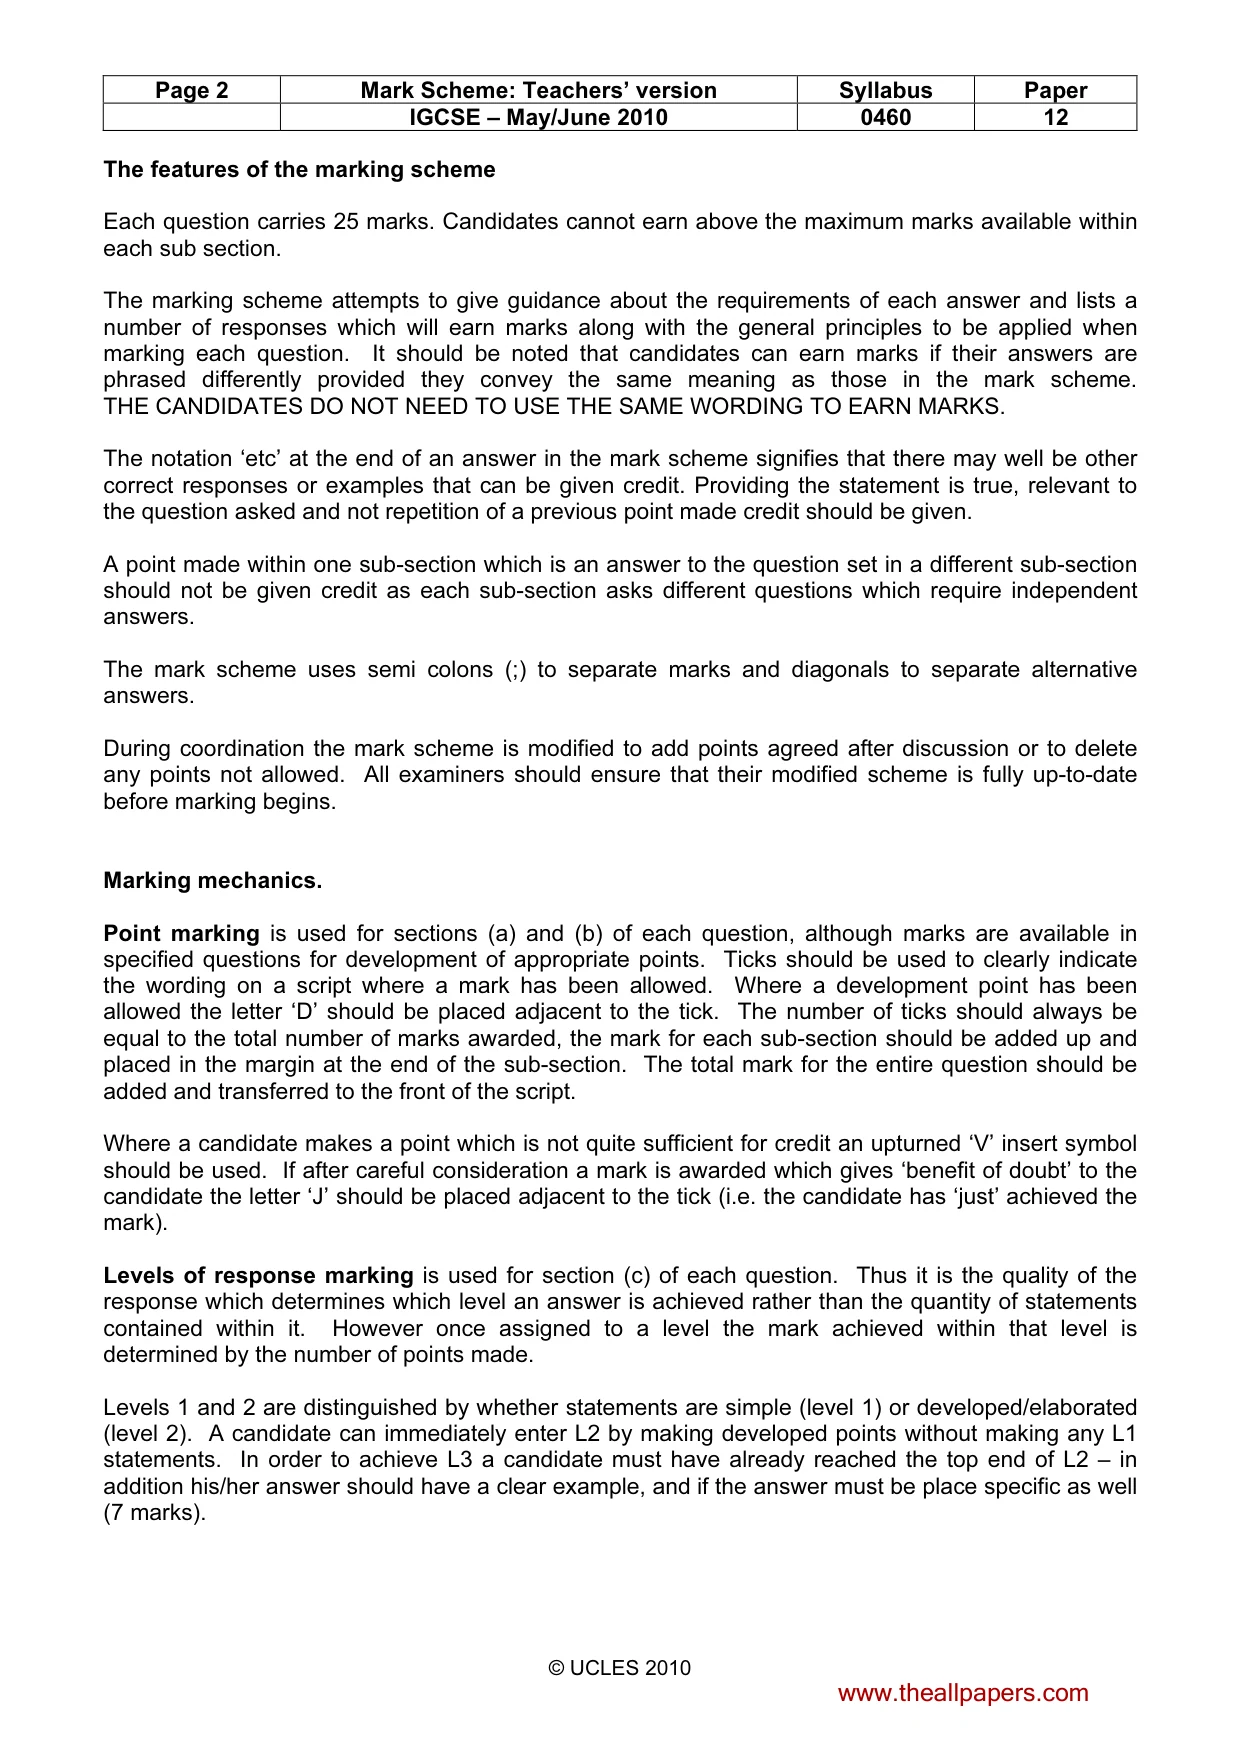
Page 2 Mark Scheme: Teachers’ version Syllabus Paper IGCSE – May/June 2010 0460 12 © UCLES 2010 The features of the marking scheme Each question carries 25 marks. Candidates cannot earn above the maximum marks available within each sub section. The marking scheme attempts to give guidance about the requirements of each answer and lists a number of responses which will earn marks along with the general principles to be applied when marking each question. It should be noted that candidates can earn marks if their answers are phrased differently provided they convey the same meaning as those in the mark scheme. THE CANDIDATES DO NOT NEED TO USE THE SAME WORDING TO EARN MARKS. The notation ‘etc’ at the end of an answer in the mark scheme signifies that there may well be other correct responses or examples that can be given credit. Providing the statement is true, relevant to the question asked and not repetition of a previous point made credit should be given. A point made within one sub-section which is an answer to the question set in a different sub-section should not be given credit as each sub-section asks different questions which require independent answers. The mark scheme uses semi colons (;) to separate marks and diagonals to separate alternative answers. During coordination the mark scheme is modified to add points agreed after discussion or to delete any points not allowed. All examiners should ensure that their modified scheme is fully up-to-date before marking begins. Marking mechanics. Point marking is used for sections (a) and (b) of each question, although marks are available in specified questions for development of appropriate points. Ticks should be used to clearly indicate the wording on a script where a mark has been allowed. Where a development point has been allowed the letter ‘D’ should be placed adjacent to the tick. The number of ticks should always be equal to the total number of marks awarded, the mark for each sub-section should be added up and placed in the margin at the end of the sub-section. The total mark for the entire question should be added and transferred to the front of the script. Where a candidate makes a point which is not quite sufficient for credit an upturned ‘V’ insert symbol should be used. If after careful consideration a mark is awarded which gives ‘benefit of doubt’ to the candidate the letter ‘J’ should be placed adjacent to the tick (i.e. the candidate has ‘just’ achieved the mark). Levels of response marking is used for section (c) of each question. Thus it is the quality of the response which determines which level an answer is achieved rather than the quantity of statements contained within it. However once assigned to a level the mark achieved within that level is determined by the number of points made. Levels 1 and 2 are distinguished by whether statements are simple (level 1) or developed/elaborated (level 2). A candidate can immediately enter L2 by making developed points without making any L1 statements. In order to achieve L3 a candidate must have already reached the top end of L2 – in addition his/her answer should have a clear example, and if the answer must be place specific as well (7 marks). www.theallpapers.com
Mark scheme, page 3
Page 3 Mark Scheme: Teachers’ version Syllabus Paper IGCSE – May/June 2010 0460 12 © UCLES 2010 Where statements are assigned levels by the examiner this should be indicated by the use of L1, L2 and L3 next to the statements. A summary of the overall level and mark awarded should be written at the end of the answer. Ticks should not be used on answers which are marked using levels of response marking. All answers, whether marked by point marking or levels, should have signs of having been assessed by the examiner. Crosses are acceptable to signify wrong answers and a red line accompanied by the letters ‘I/R’ should be used to indicate those which are irrelevant. www.theallpapers.com
Mark scheme, page 4
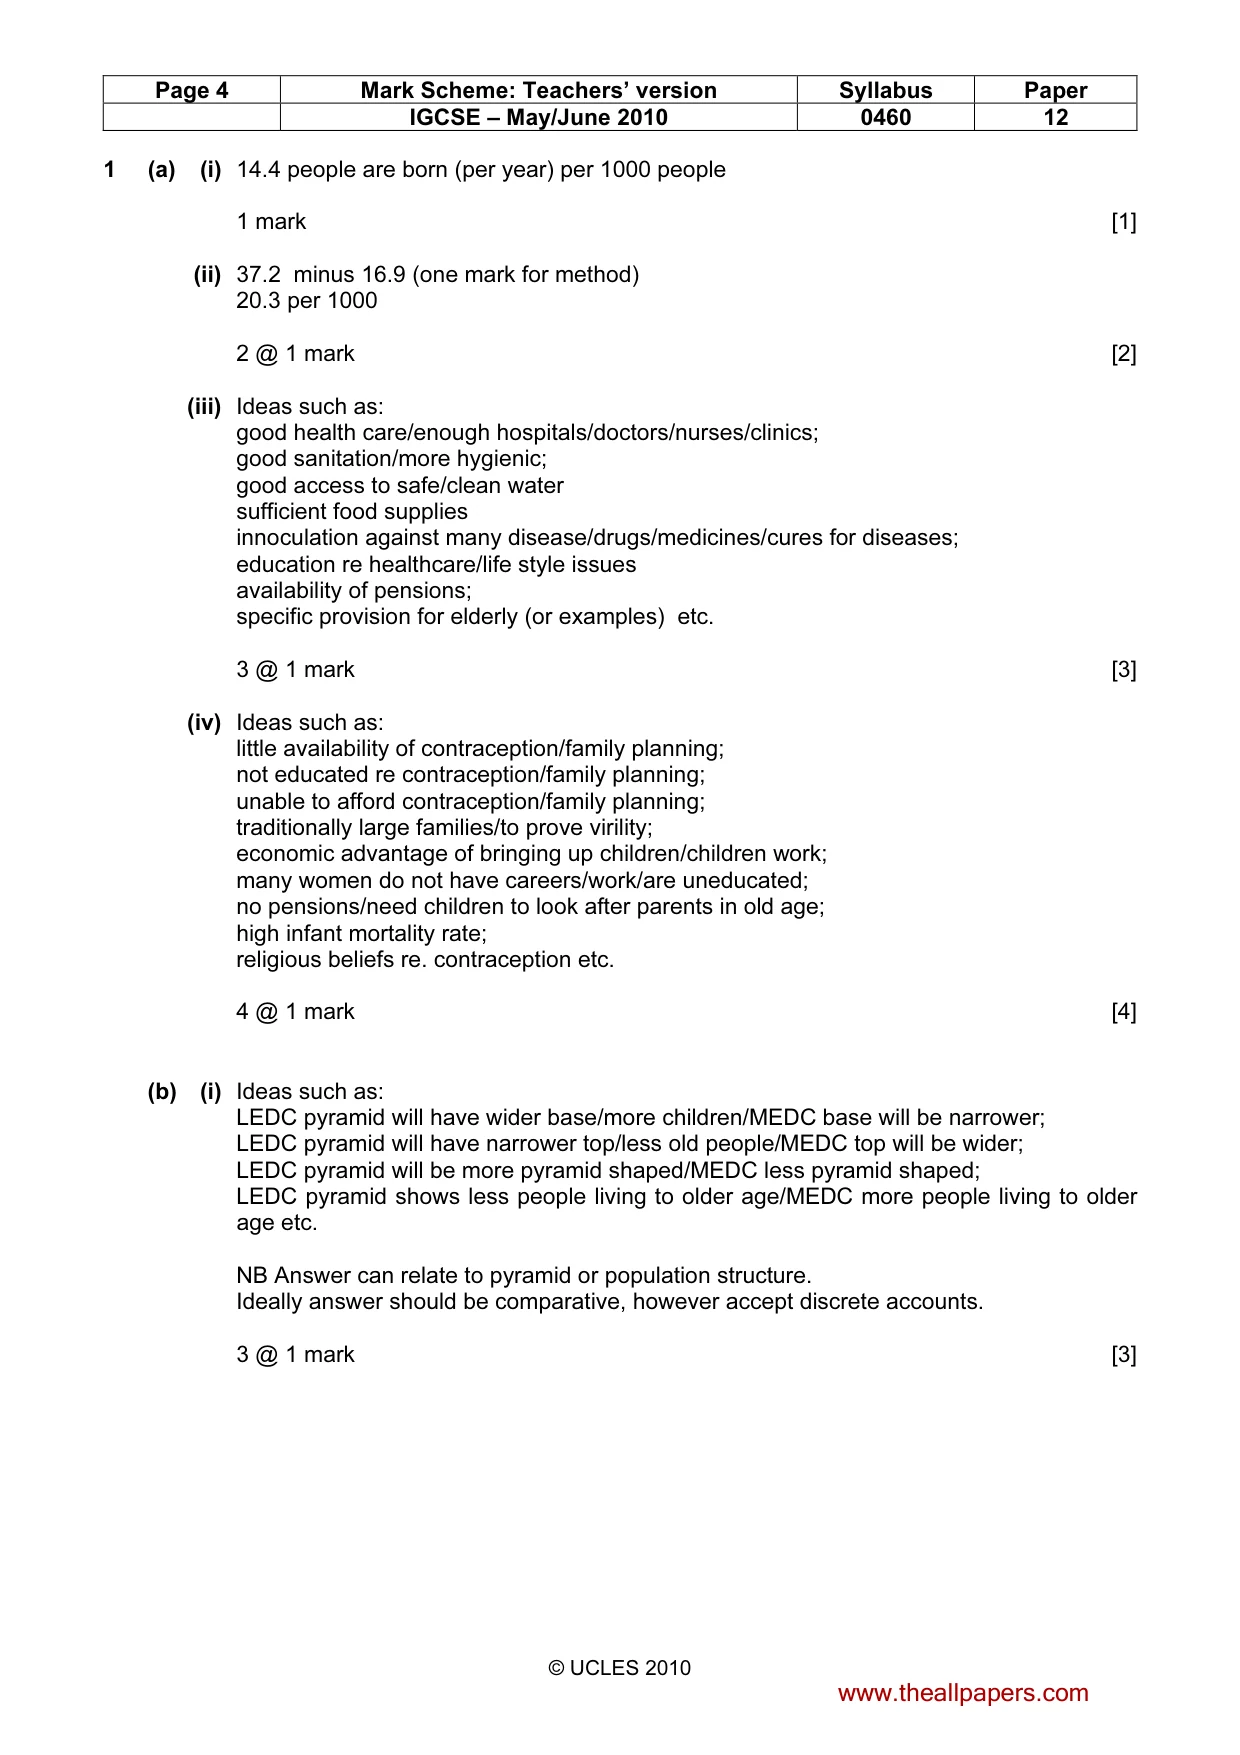
Page 4 Mark Scheme: Teachers’ version Syllabus Paper IGCSE – May/June 2010 0460 12 © UCLES 2010 1 (a) (i) 14.4 people are born (per year) per 1000 people 1 mark [1] (ii) 37.2 minus 16.9 (one mark for method) 20.3 per 1000 2 @ 1 mark [2] (iii) Ideas such as: good health care/enough hospitals/doctors/nurses/clinics; good sanitation/more hygienic; good access to safe/clean water sufficient food supplies innoculation against many disease/drugs/medicines/cures for diseases; education re healthcare/life style issues availability of pensions; specific provision for elderly (or examples) etc. 3 @ 1 mark [3] (iv) Ideas such as: little availability of contraception/family planning; not educated re contraception/family planning; unable to afford contraception/family planning; traditionally large families/to prove virility; economic advantage of bringing up children/children work; many women do not have careers/work/are uneducated; no pensions/need children to look after parents in old age; high infant mortality rate; religious beliefs re. contraception etc. 4 @ 1 mark [4] (b) (i) Ideas such as: LEDC pyramid will have wider base/more children/MEDC base will be narrower; LEDC pyramid will have narrower top/less old people/MEDC top will be wider; LEDC pyramid will be more pyramid shaped/MEDC less pyramid shaped; LEDC pyramid shows less people living to older age/MEDC more people living to older age etc. NB Answer can relate to pyramid or population structure. Ideally answer should be comparative, however accept discrete accounts. 3 @ 1 mark [3] www.theallpapers.com
Mark scheme, page 5
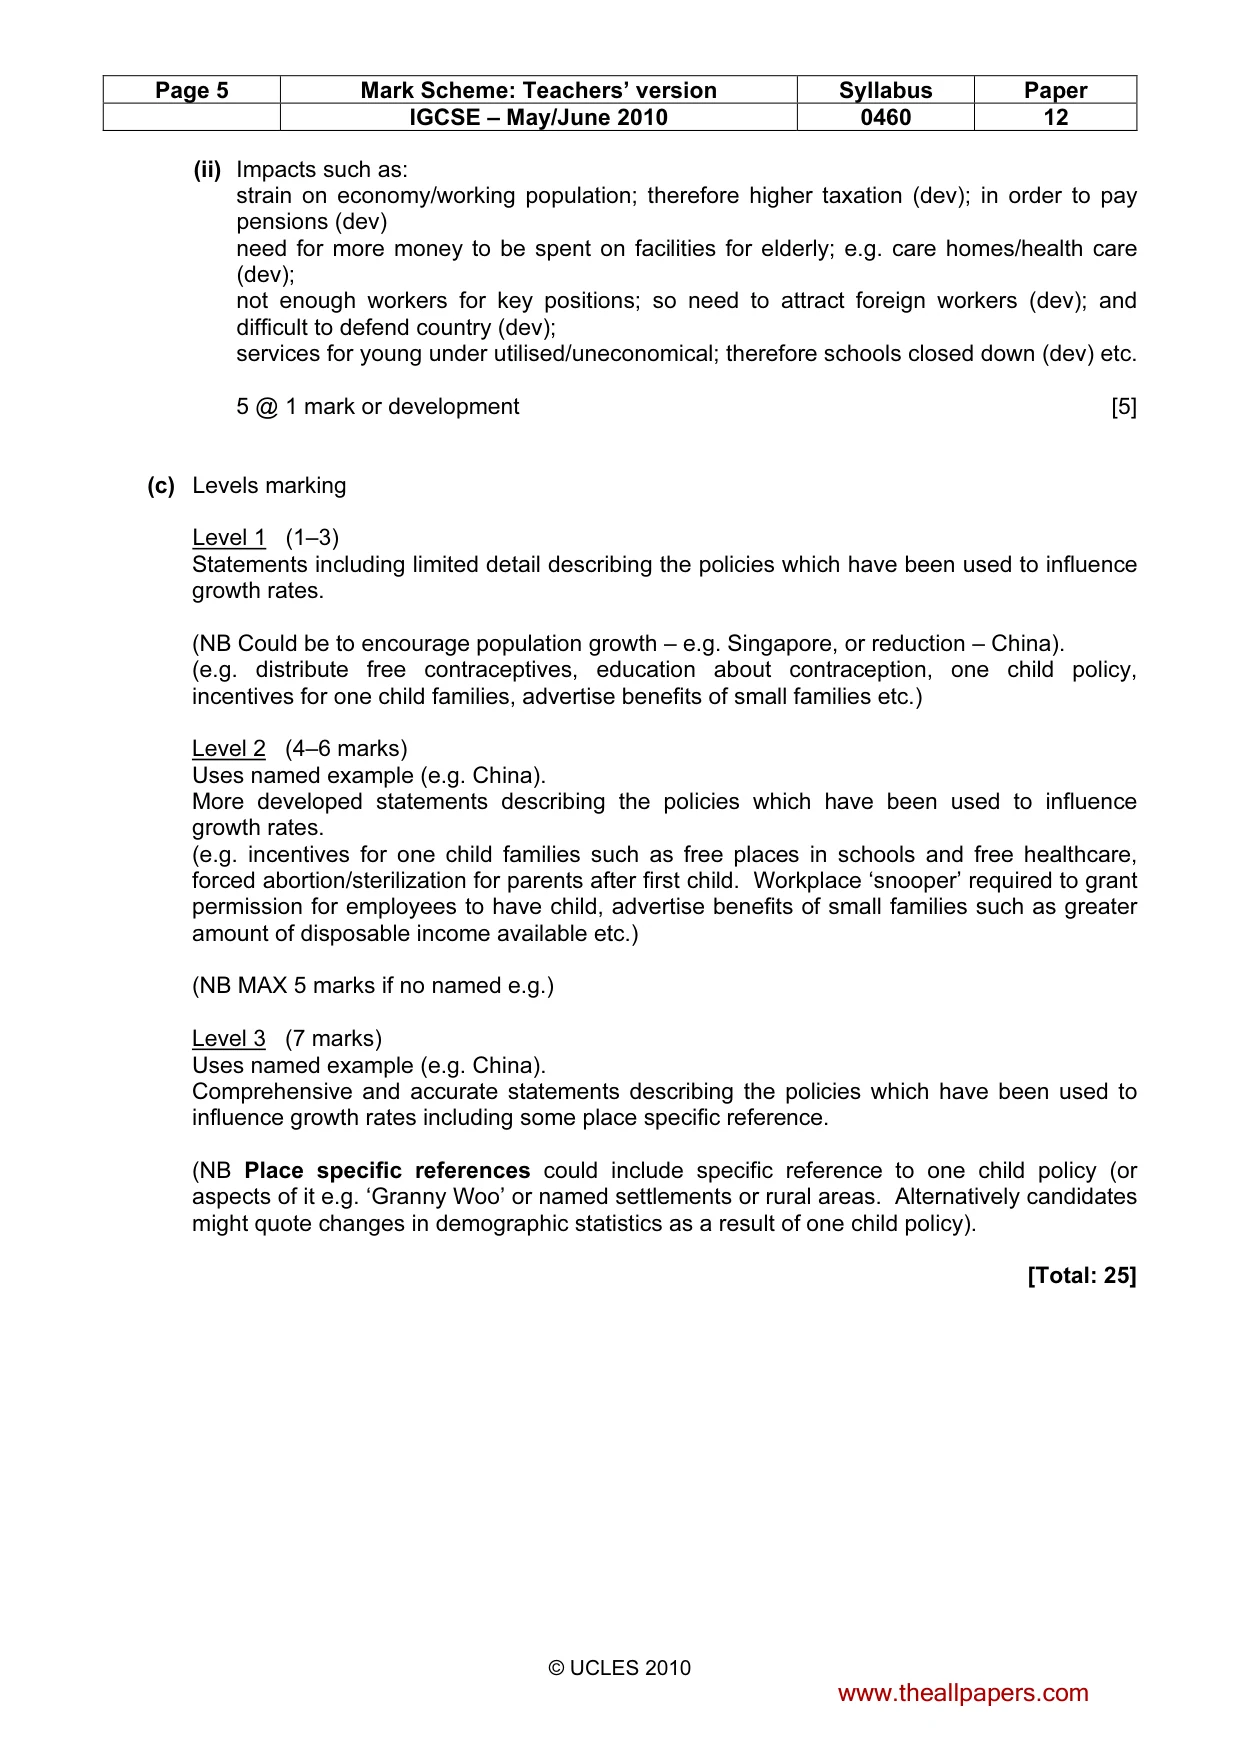
Page 5 Mark Scheme: Teachers’ version Syllabus Paper IGCSE – May/June 2010 0460 12 © UCLES 2010 (ii) Impacts such as: strain on economy/working population; therefore higher taxation (dev); in order to pay pensions (dev) need for more money to be spent on facilities for elderly; e.g. care homes/health care (dev); not enough workers for key positions; so need to attract foreign workers (dev); and difficult to defend country (dev); services for young under utilised/uneconomical; therefore schools closed down (dev) etc. 5 @ 1 mark or development [5] (c) Levels marking Level 1 (1–3) Statements including limited detail describing the policies which have been used to influence growth rates. (NB Could be to encourage population growth – e.g. Singapore, or reduction – China). (e.g. distribute free contraceptives, education about contraception, one child policy, incentives for one child families, advertise benefits of small families etc.) Level 2 (4–6 marks) Uses named example (e.g. China). More developed statements describing the policies which have been used to influence growth rates. (e.g. incentives for one child families such as free places in schools and free healthcare, forced abortion/sterilization for parents after first child. Workplace ‘snooper’ required to grant permission for employees to have child, advertise benefits of small families such as greater amount of disposable income available etc.) (NB MAX 5 marks if no named e.g.) Level 3 (7 marks) Uses named example (e.g. China). Comprehensive and accurate statements describing the policies which have been used to influence growth rates including some place specific reference. (NB Place specific references could include specific reference to one child policy (or aspects of it e.g. ‘Granny Woo’ or named settlements or rural areas. Alternatively candidates might quote changes in demographic statistics as a result of one child policy). [Total: 25] www.theallpapers.com
Mark scheme, page 6
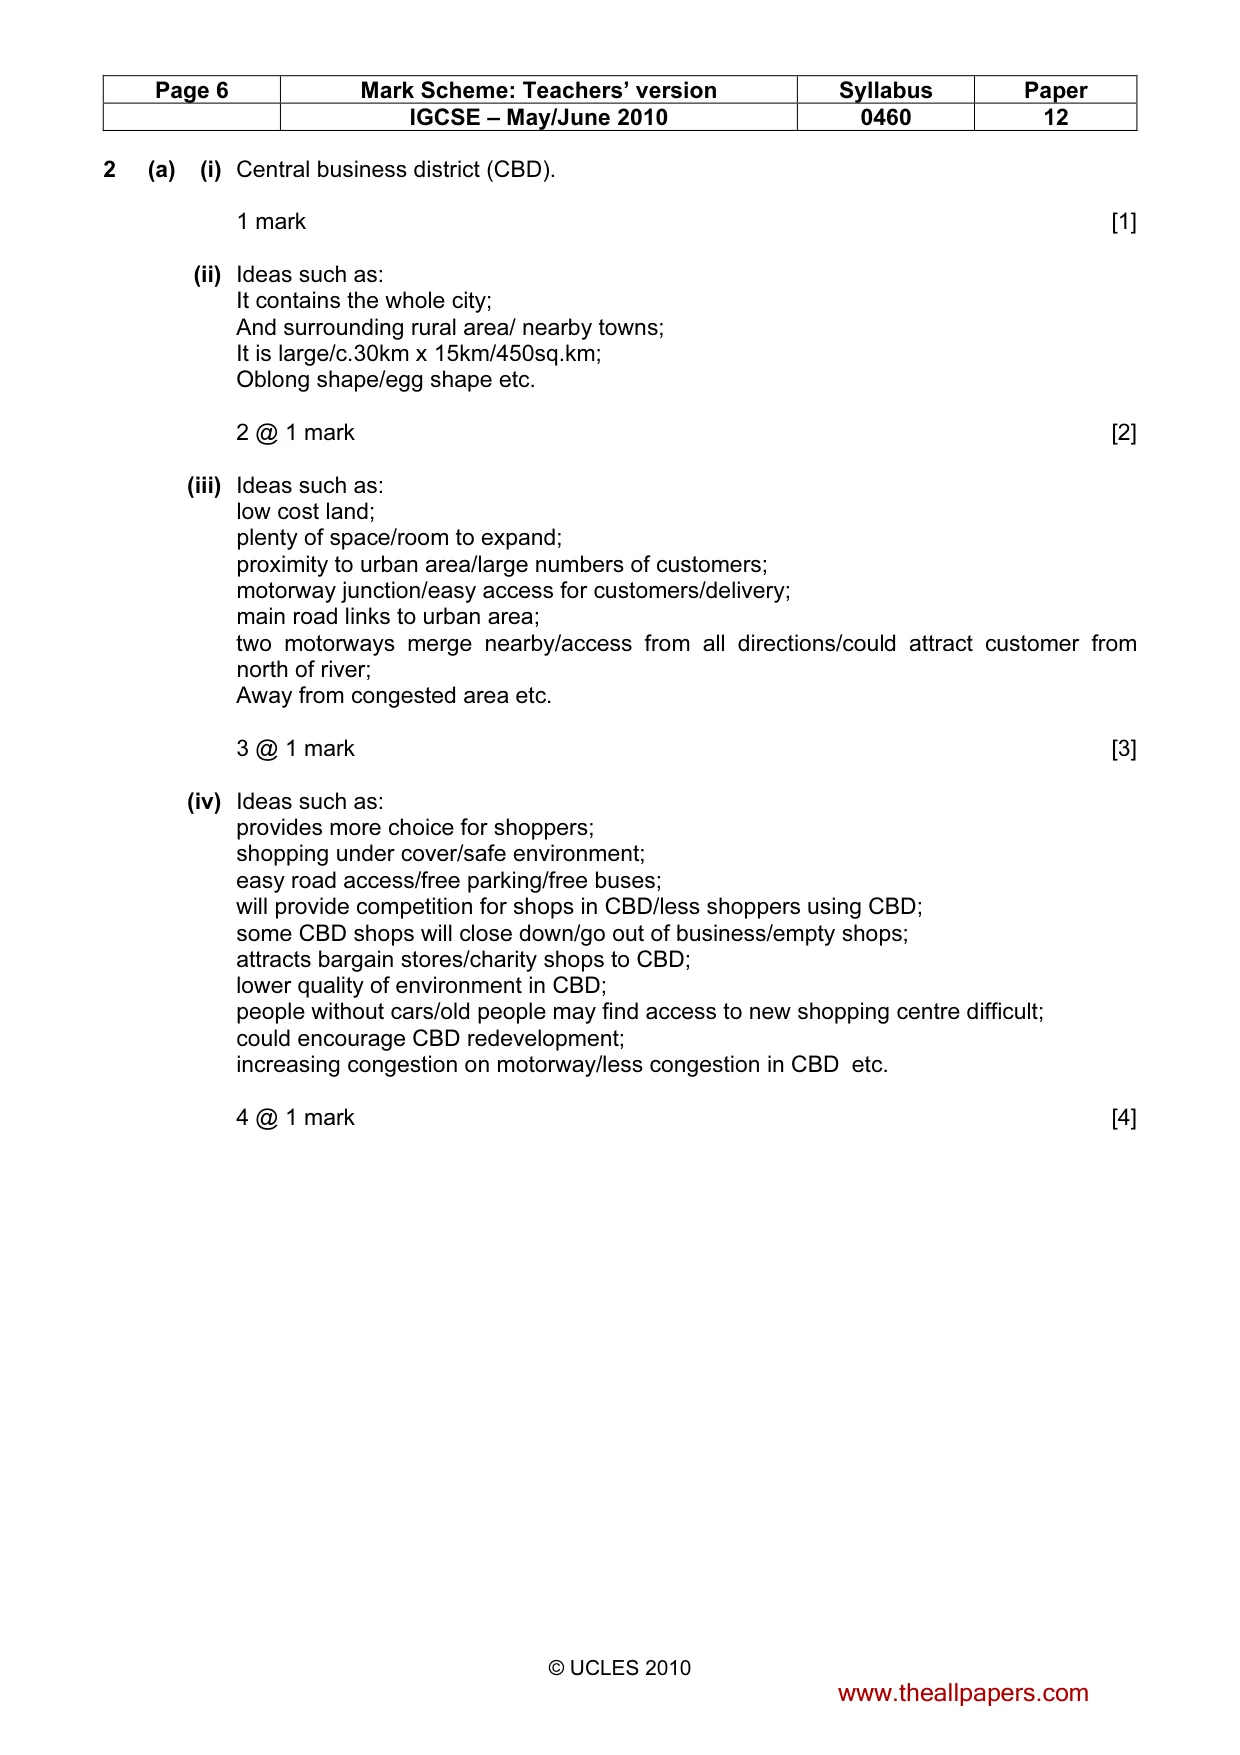
Page 6 Mark Scheme: Teachers’ version Syllabus Paper IGCSE – May/June 2010 0460 12 © UCLES 2010 2 (a) (i) Central business district (CBD). 1 mark [1] (ii) Ideas such as: It contains the whole city; And surrounding rural area/ nearby towns; It is large/c.30km x 15km/450sq.km; Oblong shape/egg shape etc. 2 @ 1 mark [2] (iii) Ideas such as: low cost land; plenty of space/room to expand; proximity to urban area/large numbers of customers; motorway junction/easy access for customers/delivery; main road links to urban area; two motorways merge nearby/access from all directions/could attract customer from north of river; Away from congested area etc. 3 @ 1 mark [3] (iv) Ideas such as: provides more choice for shoppers; shopping under cover/safe environment; easy road access/free parking/free buses; will provide competition for shops in CBD/less shoppers using CBD; some CBD shops will close down/go out of business/empty shops; attracts bargain stores/charity shops to CBD; lower quality of environment in CBD; people without cars/old people may find access to new shopping centre difficult; could encourage CBD redevelopment; increasing congestion on motorway/less congestion in CBD etc. 4 @ 1 mark [4] www.theallpapers.com
Mark scheme, page 7
Page 7 Mark Scheme: Teachers’ version Syllabus Paper IGCSE – May/June 2010 0460 12 © UCLES 2010 (b) (i) Photograph A = out of town shopping centre Photograph B = CBD Photograph C = neighbourhood centre 3 @ 1 mark [3] (ii) Ideas such as: There are large numbers of people living nearby; The services will be of low order/people will only travel short distances for low order services; People will not travel far to buy convenience goods (or examples); Services in neighbourhood centres are likely to be used frequently; So people would not want to travel far every day (or e.g. for a daily newspaper) (dev); The shops/services in neighbourhood centres are found in almost all shopping areas; So people do not have to travel far as similar shops are nearby (dev); The shops/services may have a small sphere of influence; People are only likely to buy low cost items there (or examples); It is not worth the cost of transport to travel far for these (dev) 5 @ 1 or development [5] (c) Levels marking Level 1 (1–3 marks) Statements including limited detail describing the main features of a CBD. (e.g. shops, leisure facilities, high rise buildings, offices, high rents, busy/crowded, congested, accessible, lots of traffic; lots of air pollution etc.) Level 2 (4–6 marks) Uses named example (e.g. London). More developed statements describing the main features of a CBD. (e.g. high order shops/services, department stores, shoe shops/jewellers etc, cinemas and theatres, high rise buildings such as offices of major companies, pedestrianised streets, indoor malls, high rents due to competition for space, congested therefore large amount of air pollution/traffic noise, area from which all main roads radiate etc.) (NB MAX 5 marks if no named e.g.) Level 3 (7 marks) Uses named example (e.g. London). More developed statements describing the main features of a CBD, including some place specific reference. (e.g. high order shops/services all along major streets like Oxford Street, department stores such as Harrods/Selfridges, shoe shops/jewellers etc, cinemas and theatres in the West End, high rise buildings such as offices of major companies, pedestrianised streets/markets such as Covent Garden, indoor malls etc.) [7] [Total: 25] www.theallpapers.com
Mark scheme, page 8
Page 8 Mark Scheme: Teachers’ version Syllabus Paper IGCSE – May/June 2010 0460 12 © UCLES 2010 3 (b) (i) P 1 mark [1] (ii) Ideas such as: Greater amount/volume of water; water is faster flowing/has more energy; as it has further to travel; centrifugal forces pushes water to outer bank/helicoidal flow. 2 @ 1 mark [2] (iii) Ideas such as: weight/power/force of water; removes unconsolidated/soft materials/soil/clay; pushes air/water into cracks in rock; and breaks it apart/cavitation/undercuts bank; repeat of process etc. 3 @ 1 mark [3] (iv) Methods of river transportation such as: traction; large materials being pushed/rolled along bed (exp); saltation; pebbles being picked up by water and bounced along the bed/series of hops (exp); suspension; light materials carried within the water (exp); solution; materials dissolved in the water (exp); NB One mark for each named process and one for explanation correctly linked with it. 2 @ 2 marks [4] (b) (i) Impacts such as: loss of life; flooding of roads/disruption of road transport; flooding of farmland/damage to crops/death of farm livestock; damage to houses/property/evacuation of residents; damage to/flooding of businesses/pub/restaurant; boats damaged/swept away; contamination of land/dwellings by pollutants; damage to trees; loss of recreational land etc. 3 @ 1 mark [3] (ii) Methods such as: build higher banks/artificial levees; so it will hold more water (dev) afforestation; so less water will reach river (dev) build dams/barriers; to regulate flow of water (dev) straighten river; so water is removed from drainage basin more quickly (dev); widen/deepen/regular dredging; so less water is displaced by accumulated sediment (dev); artificial drainage channels/overflow channels; restrict building on flood plain etc. 5 @ 1 mark or development [5] www.theallpapers.com
Mark scheme, page 9
Page 9 Mark Scheme: Teachers’ version Syllabus Paper IGCSE – May/June 2010 0460 12 © UCLES 2010 (c) Levels marking Level 1 (1–3 marks) Statements including limited detail describing advantages and/or difficulties of living on a delta. (e.g. Good for agriculture/fertile soils; Water for irrigation; easy to build road/rail; source of food/fish; flat building land; flooding; instability of foundations; need to bridge rivers; competition for space etc.) Level 2 (4–6 marks) Uses named example (e.g. Mississippi Delta). More developed statements describing advantages and/or difficulties of living on a delta. (e.g. fertile soils therefore high crop yields; Water for irrigation enables cultivation in dry periods; easy to build road on flood plain; source of food/fish to vary diet; flat building land so construction is easy; flooding may regularly damage homes; need to bridge rivers makes cost of road construction expensive; competition for space due to high population density etc.) (NB MAX 5 if no named e.g.) Level 3 (7 marks) Uses named example (e.g. Mississippi Delta). Comprehensive and accurate statements describing advantages and difficulties of living on a delta. (NB Place specific references could include settlements or rural areas in delta region, alternatively area of sea into which it flows.) [7] [TOTAL: 25] www.theallpapers.com
Mark scheme, page 10
Page 10 Mark Scheme: Teachers’ version Syllabus Paper IGCSE – May/June 2010 0460 12 © UCLES 2010 4 (a) (i) Wenchuan (county) 1 mark [1] (ii) Mianyang; Ngawa 2 @ 1 mark [2] (iii) Ideas such as: 7.9 on Richter Scale/powerful earthquake; It occurred in mid-afternoon/during the day; children were at school/people were at work ; Many buildings/infrastructure collapsed/destroyed; Buildings may have been poorly constructed/they were not earthquake proof; It affected a wide area; Which contained large settlements/it was densely populated; Gas leaks/fires; Roads blocked/delaying emergency services; Contamination of water/lack of water; Poor preparation of population/education re. earthquakes; Poor emergency services etc. 3 @ 1 mark [3] (iv) Ideas such as: damage to workplaces/people are unable to earn a living; negative impact on economy/production; damage to roads; economic implications of rebuilding; damage to schools/disruption of education; decaying bodies/polluted water/damaged water treatment plants so spread of disease/ further loss of life; psychological trauma; homelessness etc. 4 @ 1 mark [4] (b) (i) Ideas such as: build houses/schools which are more stable/designed to sway not collapse (or any other design related point); ensure planning regulations adhered to; Deep foundations; Flexible water/gas pipes/Automatic gas switch off; Earthquake drills/education re. procedures/stockpile supplies; Build on solid ground; Better preparation of emergency services; Restrict building heights etc. 3 @ 1 mark [3] www.theallpapers.com
Mark scheme, page 11
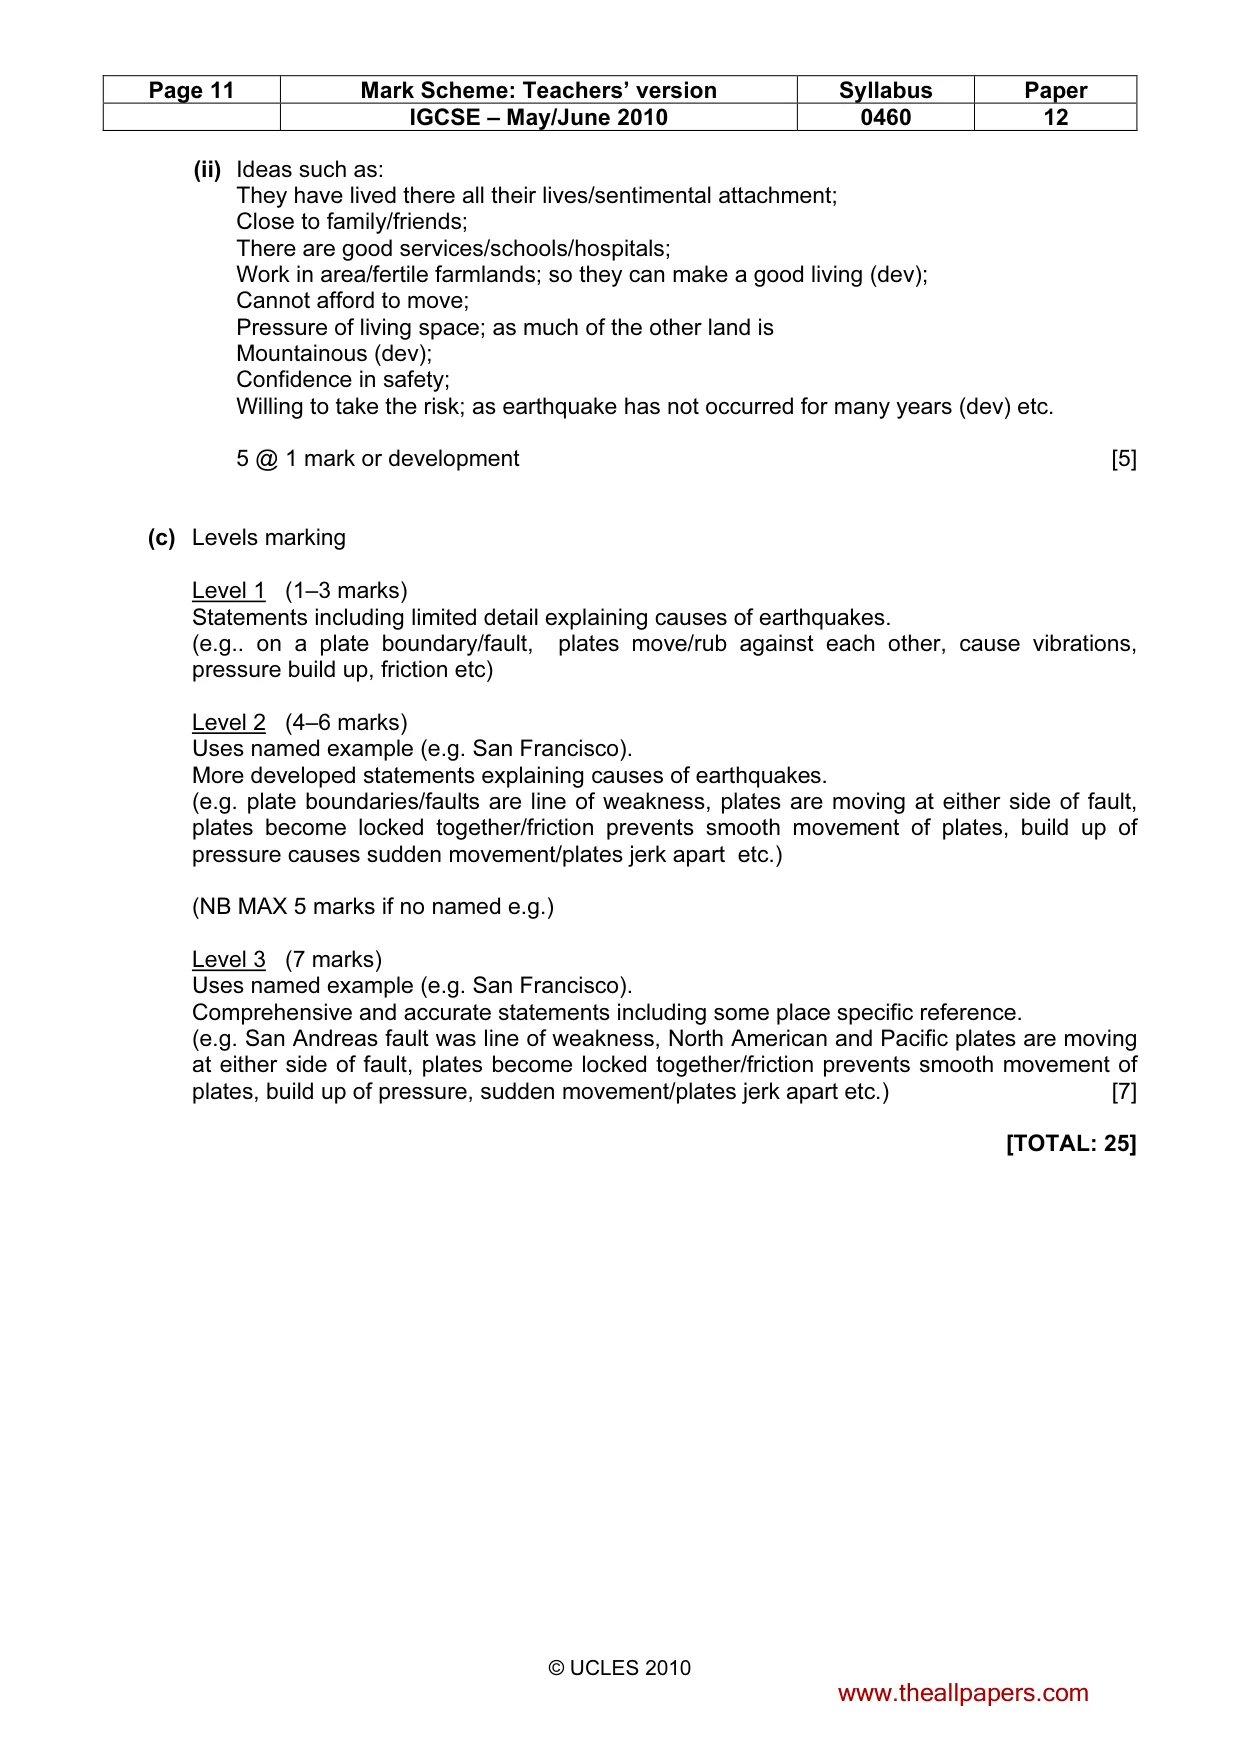
Page 11 Mark Scheme: Teachers’ version Syllabus Paper IGCSE – May/June 2010 0460 12 © UCLES 2010 (ii) Ideas such as: They have lived there all their lives/sentimental attachment; Close to family/friends; There are good services/schools/hospitals; Work in area/fertile farmlands; so they can make a good living (dev); Cannot afford to move; Pressure of living space; as much of the other land is Mountainous (dev); Confidence in safety; Willing to take the risk; as earthquake has not occurred for many years (dev) etc. 5 @ 1 mark or development [5] (c) Levels marking Level 1 (1–3 marks) Statements including limited detail explaining causes of earthquakes. (e.g.. on a plate boundary/fault, plates move/rub against each other, cause vibrations, pressure build up, friction etc) Level 2 (4–6 marks) Uses named example (e.g. San Francisco). More developed statements explaining causes of earthquakes. (e.g. plate boundaries/faults are line of weakness, plates are moving at either side of fault, plates become locked together/friction prevents smooth movement of plates, build up of pressure causes sudden movement/plates jerk apart etc.) (NB MAX 5 marks if no named e.g.) Level 3 (7 marks) Uses named example (e.g. San Francisco). Comprehensive and accurate statements including some place specific reference. (e.g. San Andreas fault was line of weakness, North American and Pacific plates are moving at either side of fault, plates become locked together/friction prevents smooth movement of plates, build up of pressure, sudden movement/plates jerk apart etc.) [7] [TOTAL: 25] www.theallpapers.com
Mark scheme, page 12
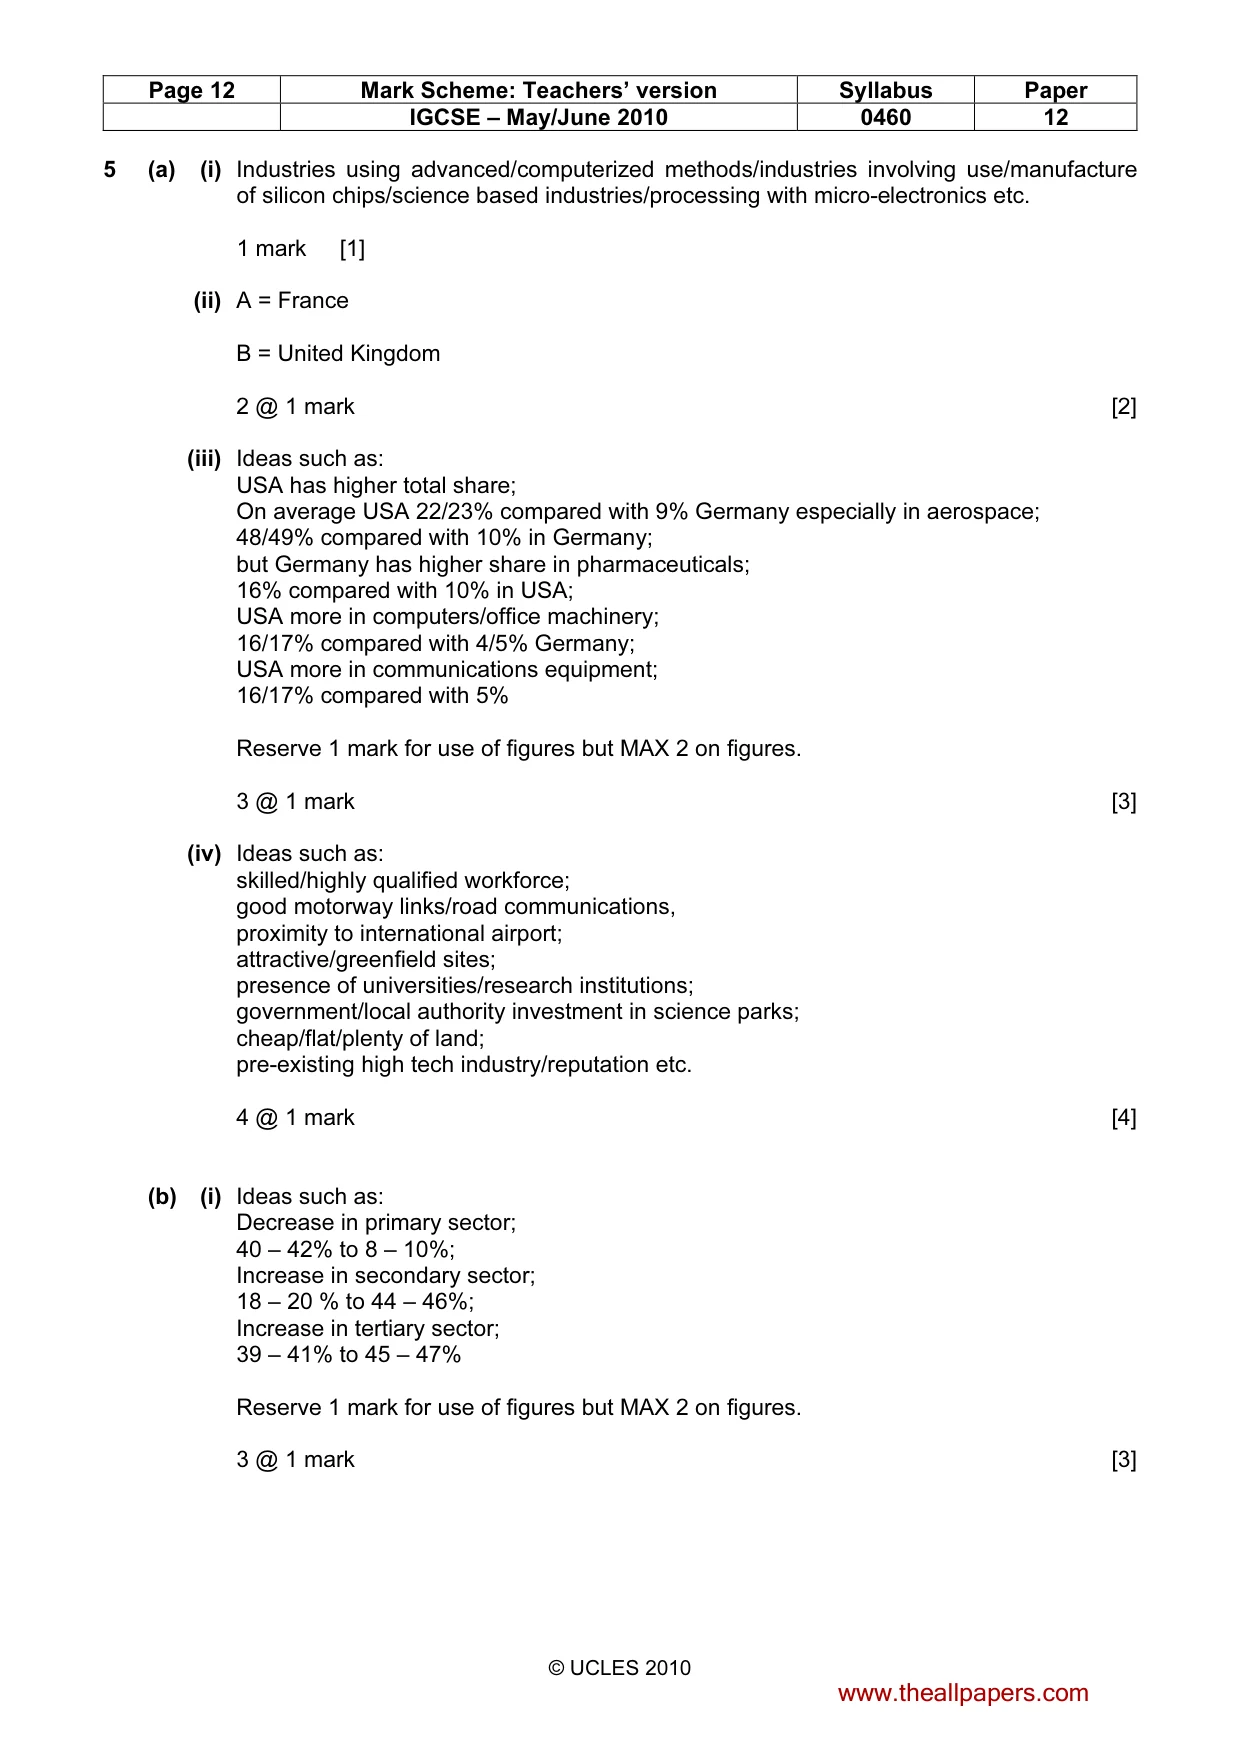
Page 12 Mark Scheme: Teachers’ version Syllabus Paper IGCSE – May/June 2010 0460 12 © UCLES 2010 5 (a) (i) Industries using advanced/computerized methods/industries involving use/manufacture of silicon chips/science based industries/processing with micro-electronics etc. 1 mark [1] (ii) A = France B = United Kingdom 2 @ 1 mark [2] (iii) Ideas such as: USA has higher total share; On average USA 22/23% compared with 9% Germany especially in aerospace; 48/49% compared with 10% in Germany; but Germany has higher share in pharmaceuticals; 16% compared with 10% in USA; USA more in computers/office machinery; 16/17% compared with 4/5% Germany; USA more in communications equipment; 16/17% compared with 5% Reserve 1 mark for use of figures but MAX 2 on figures. 3 @ 1 mark [3] (iv) Ideas such as: skilled/highly qualified workforce; good motorway links/road communications, proximity to international airport; attractive/greenfield sites; presence of universities/research institutions; government/local authority investment in science parks; cheap/flat/plenty of land; pre-existing high tech industry/reputation etc. 4 @ 1 mark [4] (b) (i) Ideas such as: Decrease in primary sector; 40 – 42% to 8 – 10%; Increase in secondary sector; 18 – 20 % to 44 – 46%; Increase in tertiary sector; 39 – 41% to 45 – 47% Reserve 1 mark for use of figures but MAX 2 on figures. 3 @ 1 mark [3] www.theallpapers.com
Mark scheme, page 13
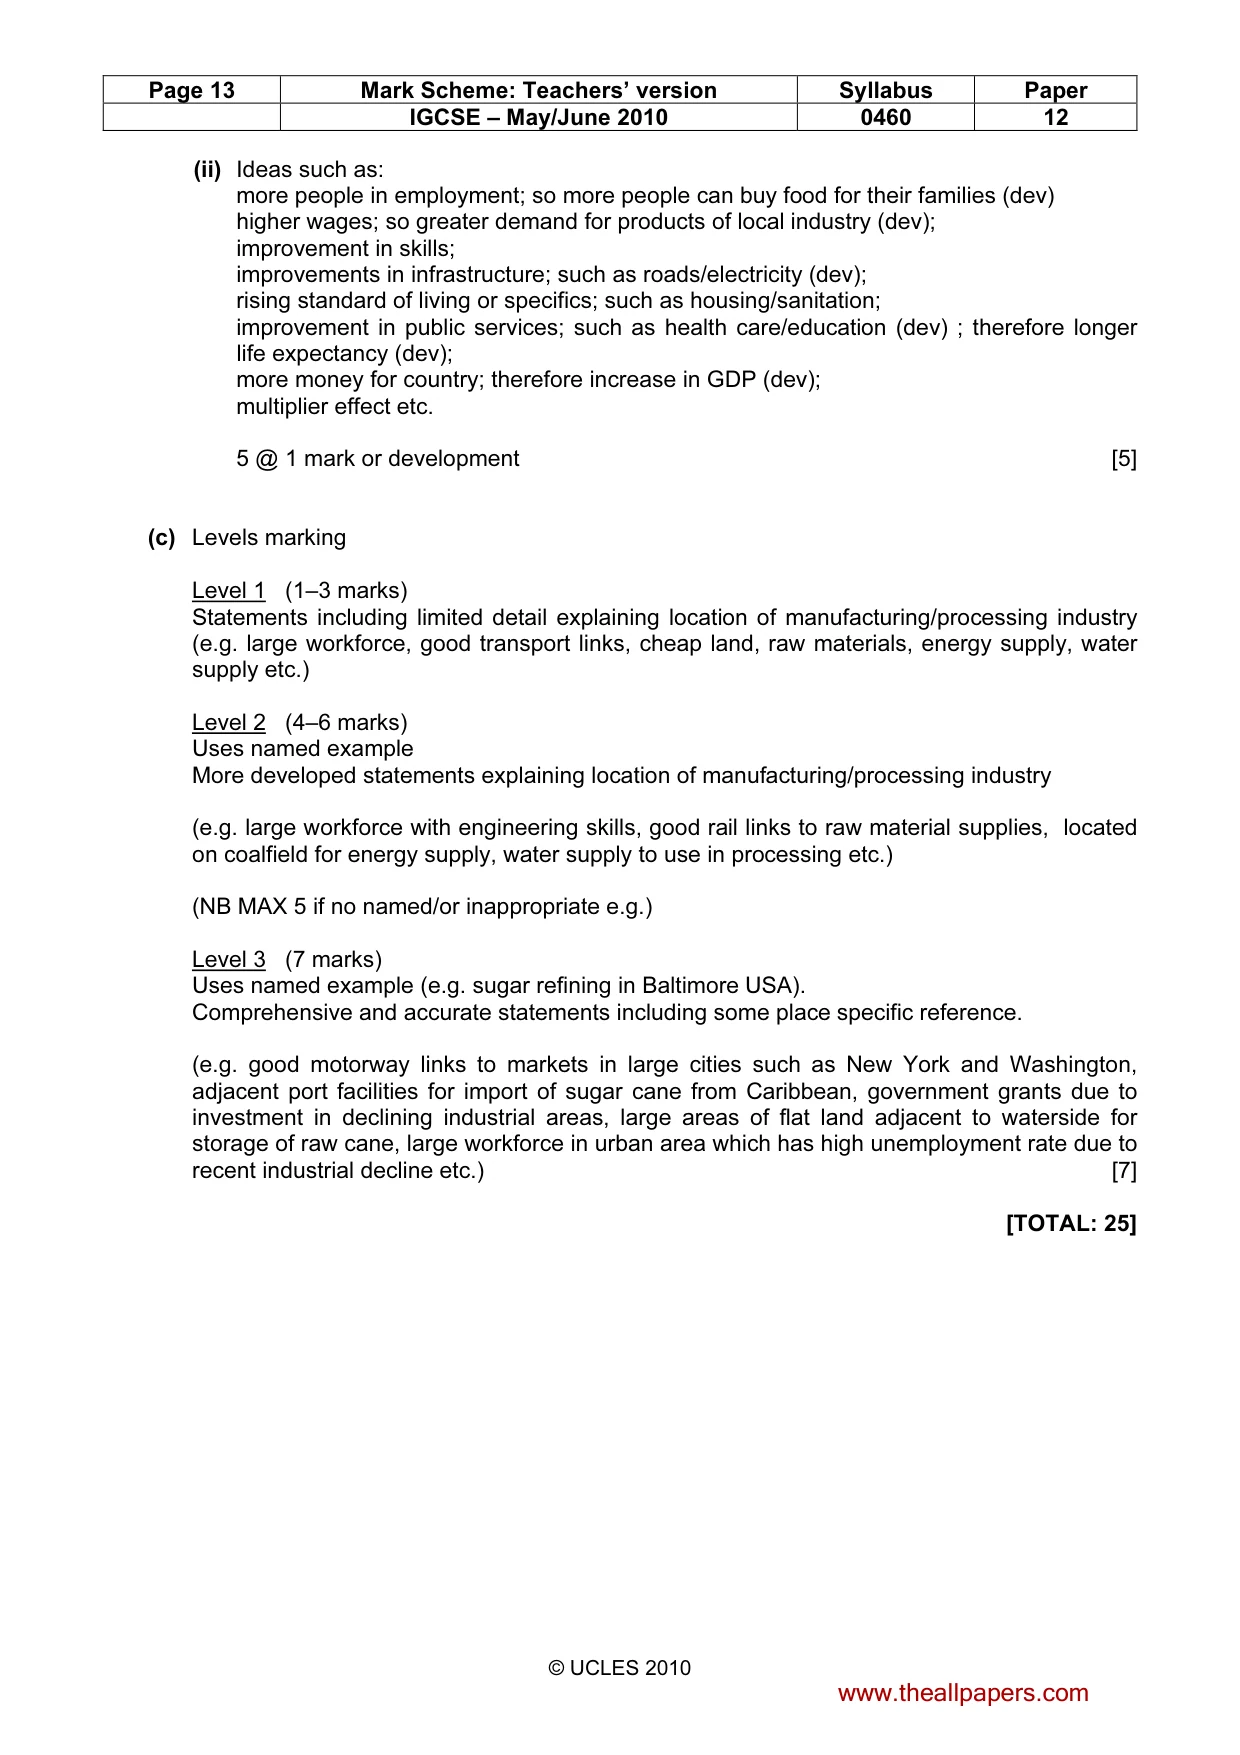
Page 13 Mark Scheme: Teachers’ version Syllabus Paper IGCSE – May/June 2010 0460 12 © UCLES 2010 (ii) Ideas such as: more people in employment; so more people can buy food for their families (dev) higher wages; so greater demand for products of local industry (dev); improvement in skills; improvements in infrastructure; such as roads/electricity (dev); rising standard of living or specifics; such as housing/sanitation; improvement in public services; such as health care/education (dev) ; therefore longer life expectancy (dev); more money for country; therefore increase in GDP (dev); multiplier effect etc. 5 @ 1 mark or development [5] (c) Levels marking Level 1 (1–3 marks) Statements including limited detail explaining location of manufacturing/processing industry (e.g. large workforce, good transport links, cheap land, raw materials, energy supply, water supply etc.) Level 2 (4–6 marks) Uses named example More developed statements explaining location of manufacturing/processing industry (e.g. large workforce with engineering skills, good rail links to raw material supplies, located on coalfield for energy supply, water supply to use in processing etc.) (NB MAX 5 if no named/or inappropriate e.g.) Level 3 (7 marks) Uses named example (e.g. sugar refining in Baltimore USA). Comprehensive and accurate statements including some place specific reference. (e.g. good motorway links to markets in large cities such as New York and Washington, adjacent port facilities for import of sugar cane from Caribbean, government grants due to investment in declining industrial areas, large areas of flat land adjacent to waterside for storage of raw cane, large workforce in urban area which has high unemployment rate due to recent industrial decline etc.) [7] [TOTAL: 25] www.theallpapers.com
Mark scheme, page 14
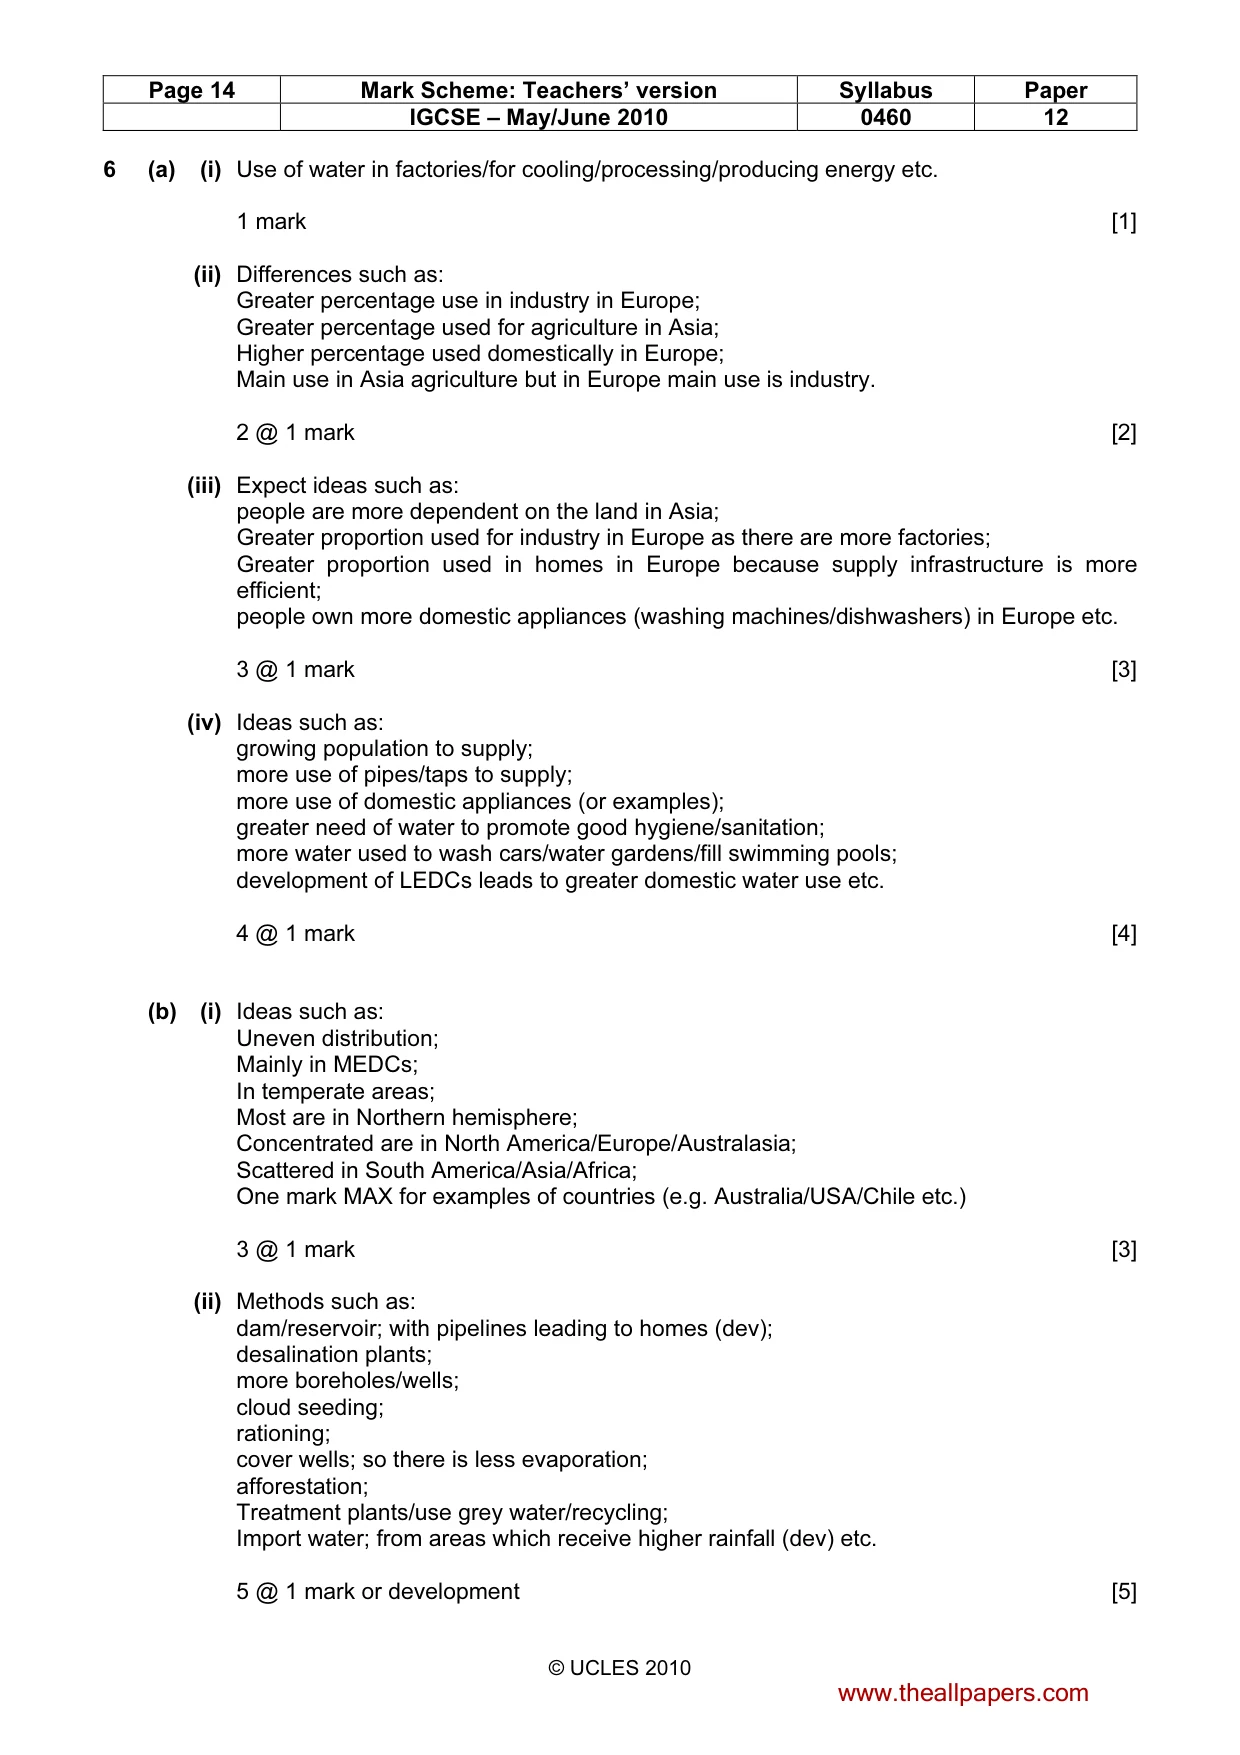
Page 14 Mark Scheme: Teachers’ version Syllabus Paper IGCSE – May/June 2010 0460 12 © UCLES 2010 6 (a) (i) Use of water in factories/for cooling/processing/producing energy etc. 1 mark [1] (ii) Differences such as: Greater percentage use in industry in Europe; Greater percentage used for agriculture in Asia; Higher percentage used domestically in Europe; Main use in Asia agriculture but in Europe main use is industry. 2 @ 1 mark [2] (iii) Expect ideas such as: people are more dependent on the land in Asia; Greater proportion used for industry in Europe as there are more factories; Greater proportion used in homes in Europe because supply infrastructure is more efficient; people own more domestic appliances (washing machines/dishwashers) in Europe etc. 3 @ 1 mark [3] (iv) Ideas such as: growing population to supply; more use of pipes/taps to supply; more use of domestic appliances (or examples); greater need of water to promote good hygiene/sanitation; more water used to wash cars/water gardens/fill swimming pools; development of LEDCs leads to greater domestic water use etc. 4 @ 1 mark [4] (b) (i) Ideas such as: Uneven distribution; Mainly in MEDCs; In temperate areas; Most are in Northern hemisphere; Concentrated are in North America/Europe/Australasia; Scattered in South America/Asia/Africa; One mark MAX for examples of countries (e.g. Australia/USA/Chile etc.) 3 @ 1 mark [3] (ii) Methods such as: dam/reservoir; with pipelines leading to homes (dev); desalination plants; more boreholes/wells; cloud seeding; rationing; cover wells; so there is less evaporation; afforestation; Treatment plants/use grey water/recycling; Import water; from areas which receive higher rainfall (dev) etc. 5 @ 1 mark or development [5] www.theallpapers.com
Mark scheme, page 15
Page 15 Mark Scheme: Teachers’ version Syllabus Paper IGCSE – May/June 2010 0460 12 © UCLES 2010 (c) Levels marking Level 1 (1–3 marks) Statements including limited detail describing impacts of a water shortage. (e.g. Loss of lives/higher death rates; less food production/crops die; malnutrition/starvation; migration to urban areas/many refugees; reduction in levels of hygiene/sanitation; Rationing/water restrictions, water conflicts etc.) Level 2 (4–6 marks) Uses named example (e.g. Ethiopia). More developed statements describing impacts of a water shortage. (e.g. Loss of lives/higher death rates due to malnutrition/starvation; less food is produced as crops die due to insufficient water; As they cannot make a living from farming people migrate to urban areas; rise in diseases such as typhoid as people use same water for drinking, bathing and waste disposal etc.) (NB MAX 5 marks if no named e.g.) Level 3 (7 marks) Uses named example (e.g. Ethiopia). Comprehensive and accurate statements including some place specific reference. NB Place specific references may be to particular parts of the country affected, named rivers/reservoirs/lakes which have dried up or areas/cities to which people are migrating. Alternatively candidates might quote statistics relating to the length of a drought or the rainfall figures. [7] [TOTAL: 25] www.theallpapers.com
What you needed in this session
Cambridge’s own grade thresholds for 2010 May/June, Paper 1 · Variant 2. A higher threshold means an easier paper — the bar moves with how the cohort did.