Cambridge IGCSE Geography 0460 — 2009 Oct/Nov Paper 1 · Variant 1
0460/11/O/N/09 · 75 marks · ≈84 min
The question paper and its mark scheme, free to read here and free to download. This is Cambridge’s own paper, exactly as it was sat.
Question paper12 pages
Mark scheme13 pages
Answers below. Sit the paper first if you are practising.
Paper as text
Question paper, page 1
This document consists of 11 printed pages, 1 blank page and 1 Insert. DC (NF/CGW) 11689/7 © UCLES 2009 [Turn over UNIVERSITY OF CAMBRIDGE INTERNATIONAL EXAMINATIONS International General Certificate of Secondary Education READ THESE INSTRUCTIONS FIRST If you have been given an Answer Booklet, follow the instructions on the front cover of the Booklet. Write your Centre number, candidate number and name on all the work you hand in. Write in dark blue or black pen. You may use a soft pencil for any diagrams, graphs, or rough working. Do not use staples, paper clips, highlighters, glue or correction fluid. Answer three questions. Sketch maps and diagrams should be drawn whenever they serve to illustrate an answer. The Insert contains Photographs A and B for Question 2 and Photographs C, D and E for Question 5. At the end of the examination, fasten all your work securely together. The number of marks is given in brackets [ ] at the end of each question or part question. * 4 6 3 7 9 3 6 0 8 3 * GEOGRAPHY 0460/11 Paper 1 October/November 2009 1 hour 45 minutes Additional Materials: Answer Booklet/Paper www.theallpapers.com
Question paper, page 2
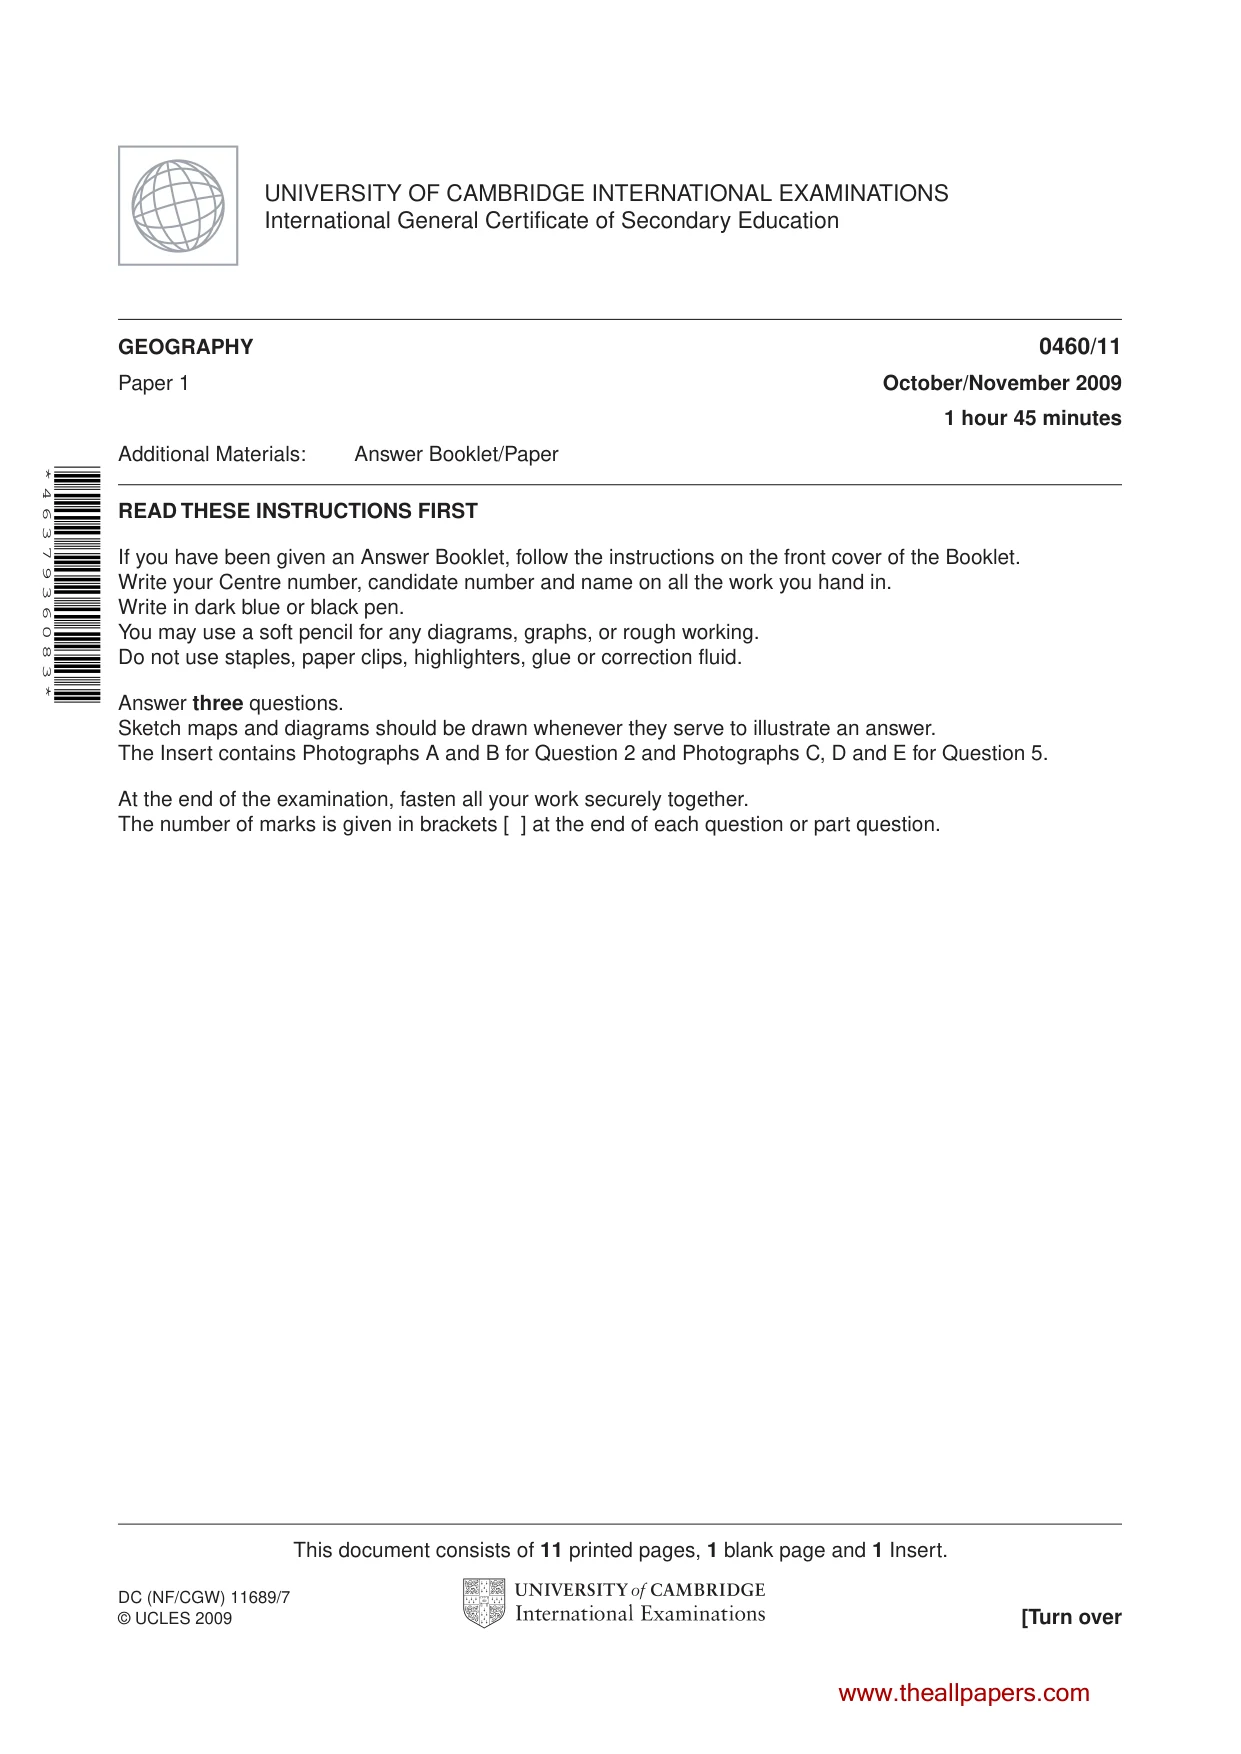
2 0460/11/O/N/09 © UCLES 2009 1 (a) Study Fig. 1, which shows information about the population of Russia between 1980 and 2005. 20 18 16 14 12 births and deaths per 1000 total population (millions) 10 8 6 4 2 1980 1985 1990 1995 year 2000 2005 0 200 180 160 140 120 100 80 60 40 20 0 birth rate death rate total population Fig. 1 (i) What was the total population of Russia in 1980? [1] (ii) Calculate the natural population growth rate of Russia in 1980. You must show your calculations. [2] (iii) Use evidence from the birth and death rates shown in Fig. 1 to explain why the total population of Russia: A increased between 1980 and 1990; B declined between 2000 and 2005; C did not change much in 1991 and 1992. [3] (iv) In 2005 Russia’s population was 140 million. By 2050 it could fall as low as 77 million. The average life expectancy has dropped to 59 years. Explain why in some countries there is a decline in life expectancy. [4] www.theallpapers.com
Question paper, page 3
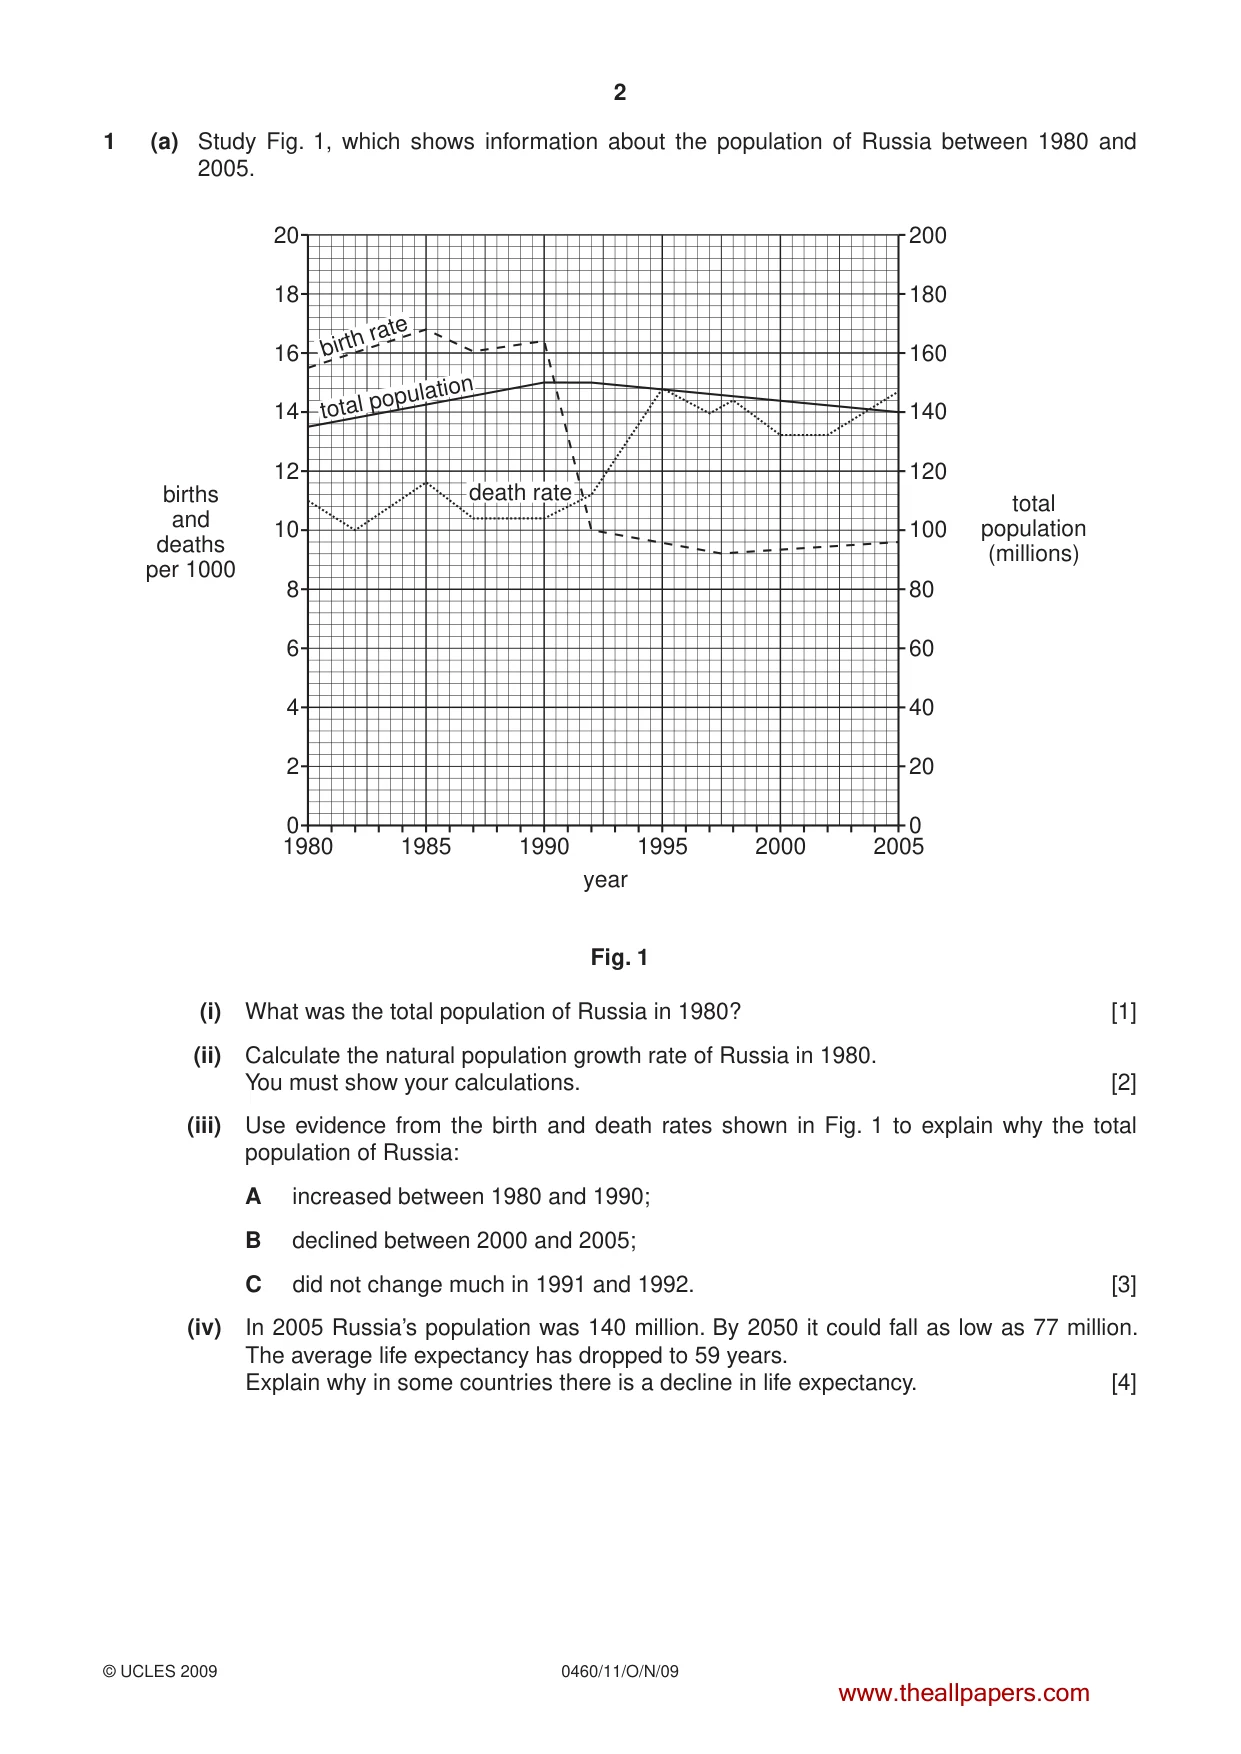
3 0460/11/O/N/09 © UCLES 2009 [Turn over (b) Study Fig. 2, which shows a newspaper extract published in 2007. President Putin promises cash for more babies MOSCOW — Russian President Vladimir Putin offered women cash to have more babies yesterday as he tackled a decline in population that is leaving much of the country deserted and threatening to slow economic growth. Putin said each year Russia’s population fell by about 700,000. He proposed new financial incentives to increase the birth rate. His measures were similar to those used in the past. Women with large families had the title “Hero Mother” and were given medals and expensive gifts. Putin proposed more than doubling monthly payouts to families for their first baby to 1,500 roubles (US$55) — over half the average wage. Many Russian parents choose to have only one child. But if they have a second child the parents will be given 3,000 roubles a month. And he said the state should pay women who give up work to have a child not less than 40% of what they used to earn. Fig. 2 (i) Identify three incentives offered in Russia to increase the birth rate. [3] (ii) Describe the problems which could be caused in a country by under-population. [5] (c) The size of the population in a country may change as a result of natural increase and international migration. For a country which you have studied, explain why the rate of population growth is high. [7] [Total: 25 marks] www.theallpapers.com
Question paper, page 4
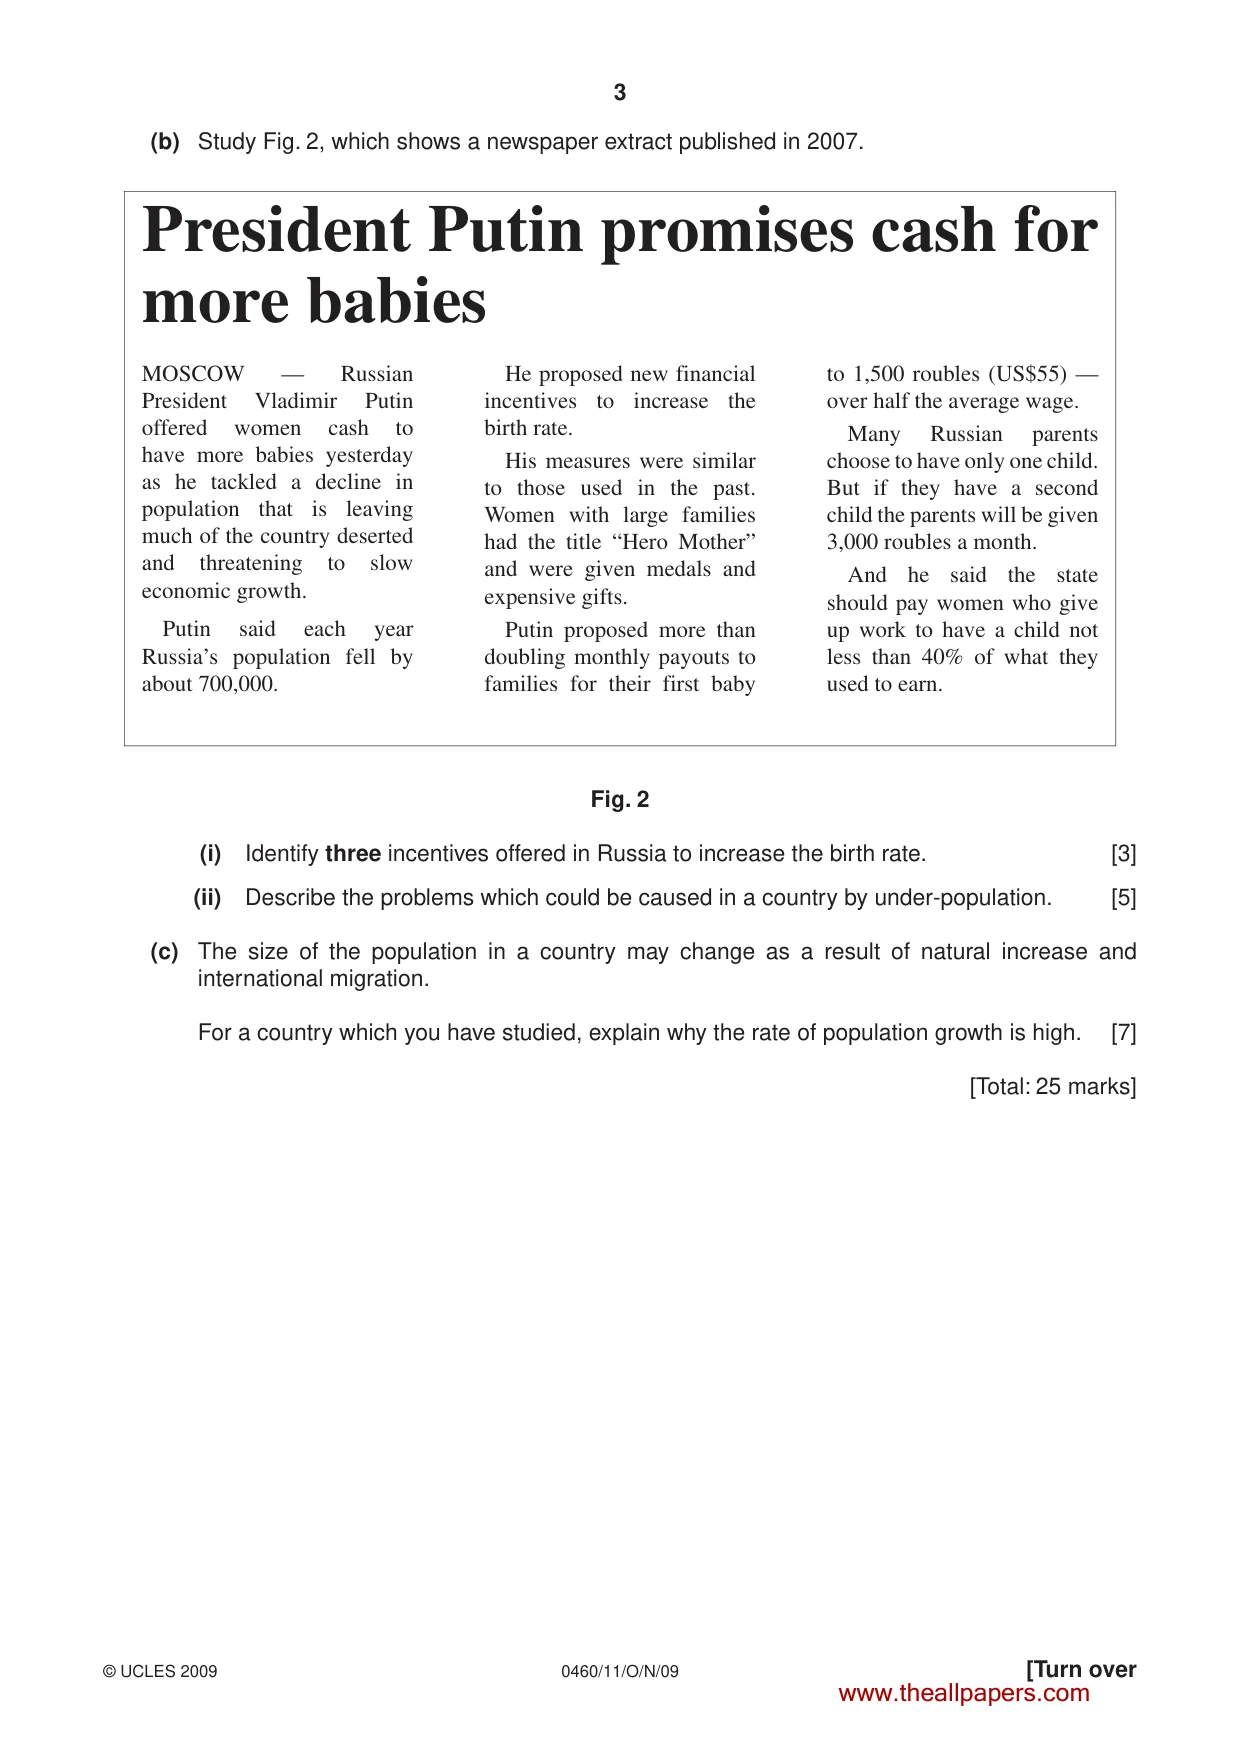
4 0460/11/O/N/09 © UCLES 2009 2 (a) Study Photographs A and B (Insert), which show the urban settlement of Nice, in France (an MEDC). Also study Fig. 3, which shows its location. A L P S Germany N Spain Netherlands Switzerland Italy Corsica UK Belgium Sardinia 400 200 km 0 Mediterranean Sea France Nice Paris Marseille Fig. 3 (i) What is meant by urban settlement? [1] (ii) Describe the location of Nice. [2] (iii) Suggest three likely functions of this settlement. [3] (iv) Select one of the functions which you have given in (iii). Suggest why this function has developed at this settlement. [4] www.theallpapers.com
Question paper, page 5
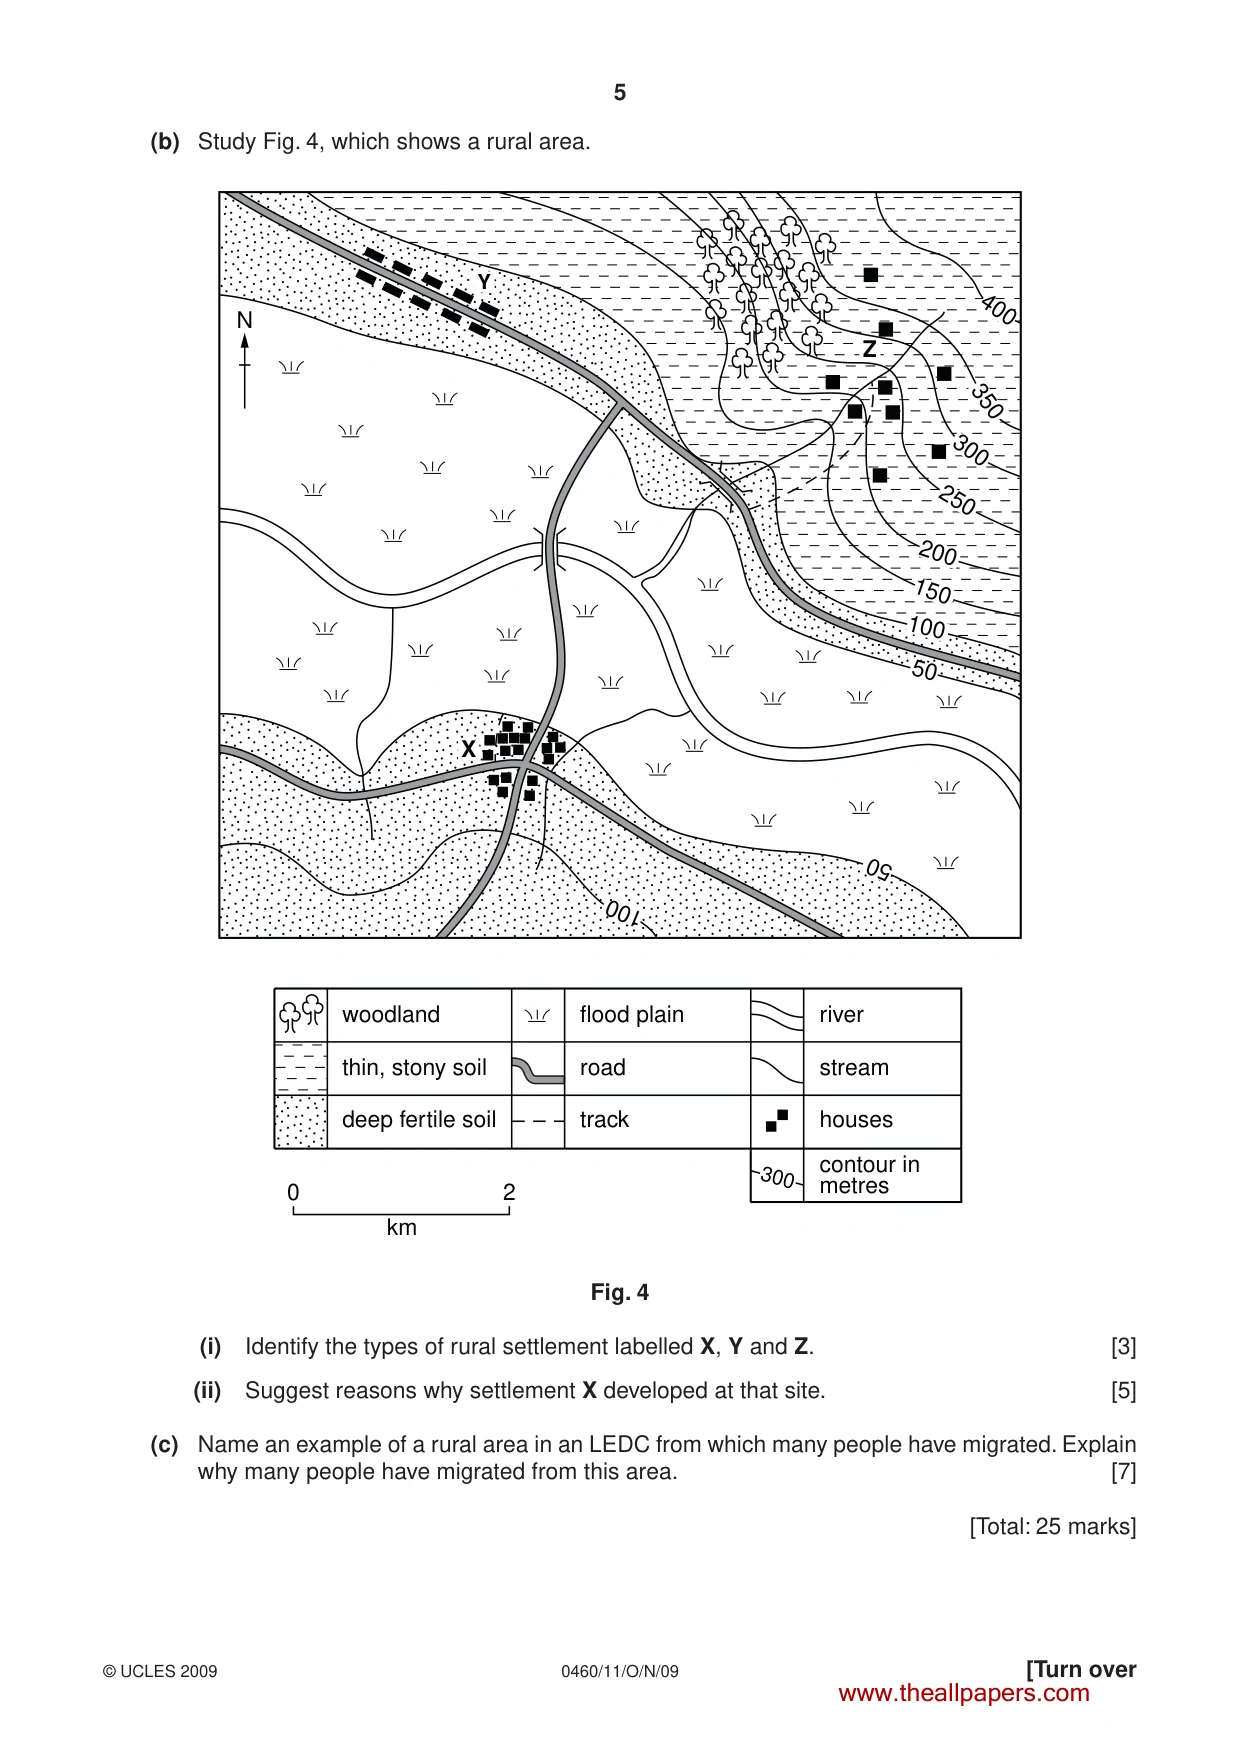
5 0460/11/O/N/09 © UCLES 2009 [Turn over (b) Study Fig. 4, which shows a rural area. N 50 100 X Y Z 200 150 100 50 300 250 300 350 400 0 2 km woodland thin, stony soil deep fertile soil flood plain road track river stream houses contour in metres Fig. 4 (i) Identify the types of rural settlement labelled X, Y and Z. [3] (ii) Suggest reasons why settlement X developed at that site. [5] (c) Name an example of a rural area in an LEDC from which many people have migrated. Explain why many people have migrated from this area. [7] [Total: 25 marks] www.theallpapers.com
Question paper, page 6
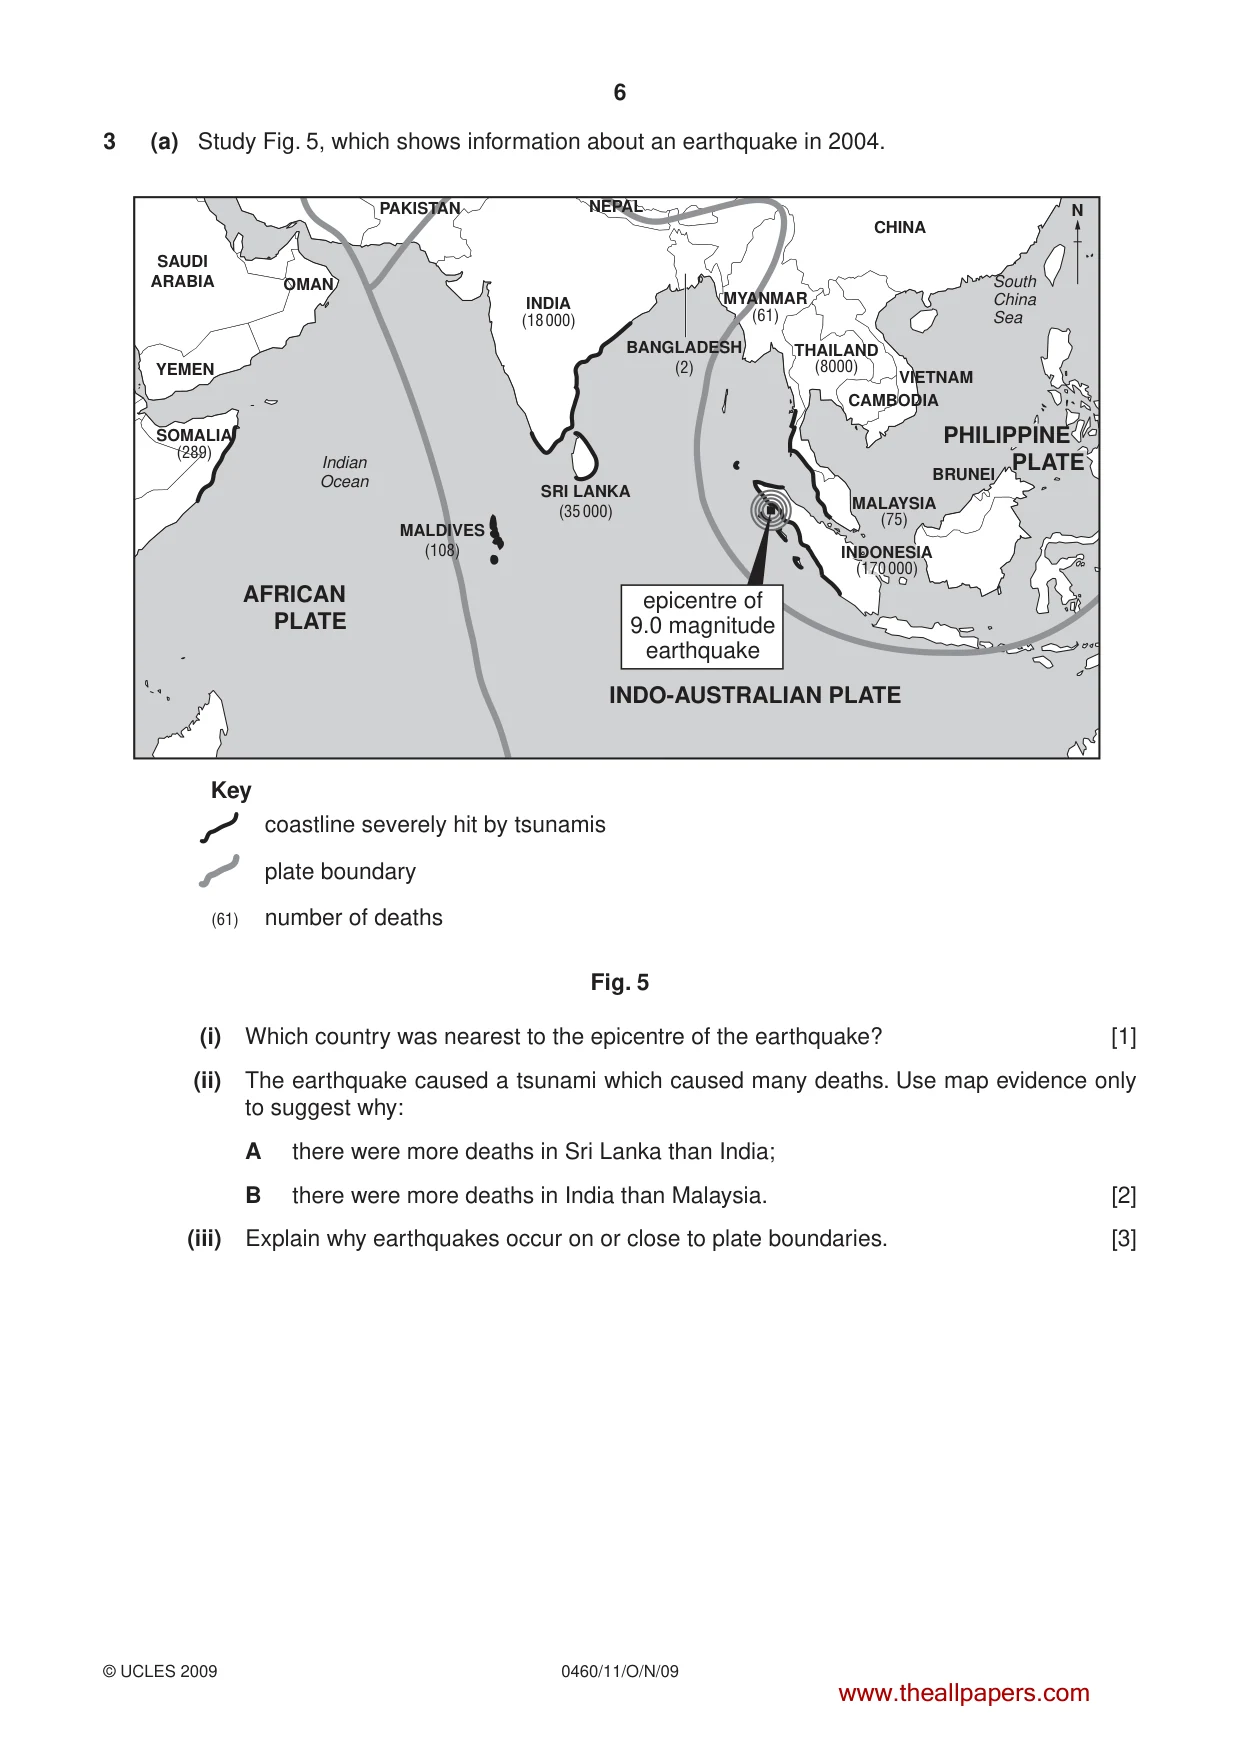
6 0460/11/O/N/09 © UCLES 2009 3 (a) Study Fig. 5, which shows information about an earthquake in 2004. SOMALIA (289) YEMEN OMAN SAUDI ARABIA INDIA (18 000) MYANMAR (61) CHINA THAILAND (8000) VIETNAM N CAMBODIA SRI LANKA (35 000) MALDIVES (108) (61) Indian Ocean South China Sea BANGLADESH (2) MALAYSIA (75) BRUNEI INDO-AUSTRALIAN PLATE AFRICAN PLATE PAKISTAN NEPAL PHILIPPINE PLATE epicentre of 9.0 magnitude earthquake Key coastline severely hit by tsunamis plate boundary number of deaths INDONESIA (170 000) Fig. 5 (i) Which country was nearest to the epicentre of the earthquake? [1] (ii) The earthquake caused a tsunami which caused many deaths. Use map evidence only to suggest why: A there were more deaths in Sri Lanka than India; B there were more deaths in India than Malaysia. [2] (iii) Explain why earthquakes occur on or close to plate boundaries. [3] www.theallpapers.com
Question paper, page 7
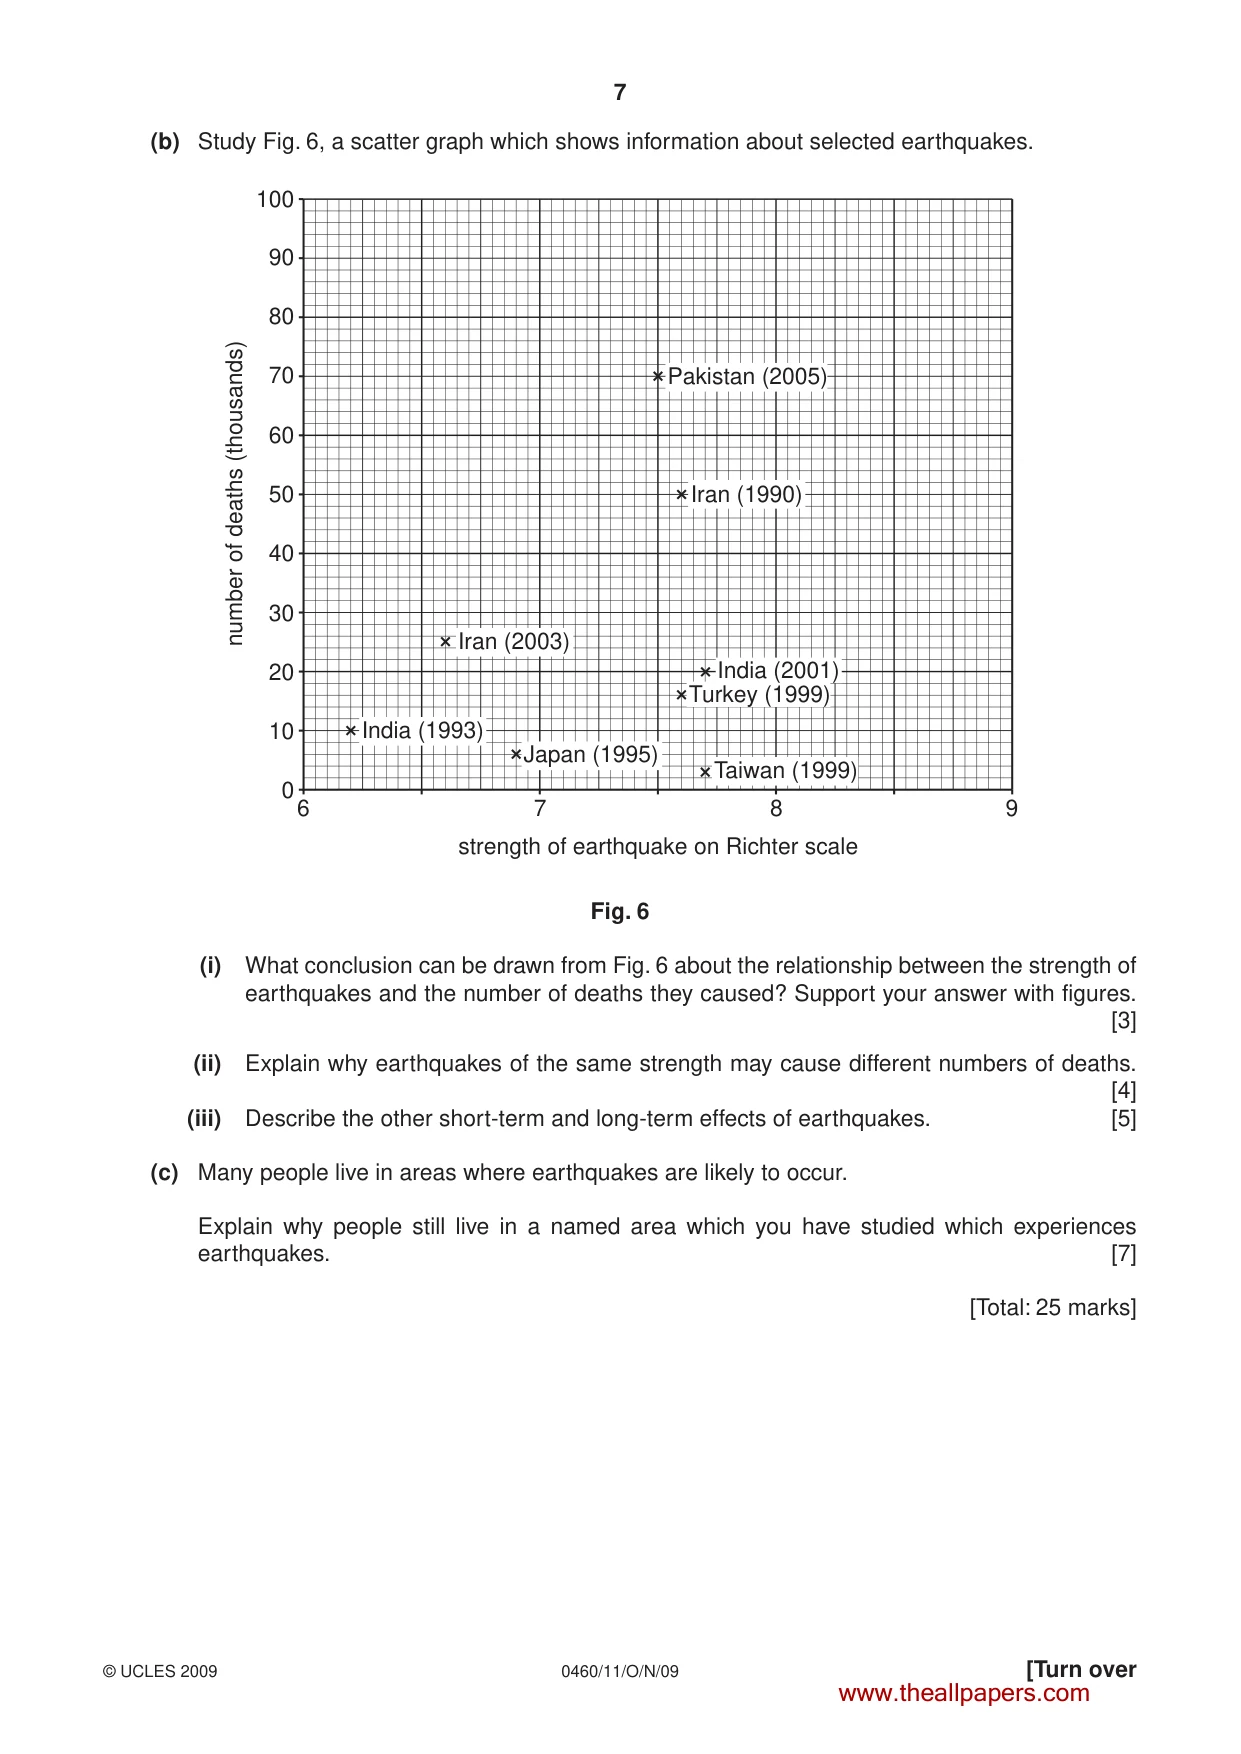
7 0460/11/O/N/09 © UCLES 2009 [Turn over (b) Study Fig. 6, a scatter graph which shows information about selected earthquakes. 100 90 80 70 60 50 number of deaths (thousands) 40 30 6 7 8 strength of earthquake on Richter scale 9 20 10 0 Pakistan (2005) Iran (1990) Iran (2003) India (1993) Taiwan (1999) Japan (1995) India (2001) Turkey (1999) Fig. 6 (i) What conclusion can be drawn from Fig. 6 about the relationship between the strength of earthquakes and the number of deaths they caused? Support your answer with figures. [3] (ii) Explain why earthquakes of the same strength may cause different numbers of deaths. [4] (iii) Describe the other short-term and long-term effects of earthquakes. [5] (c) Many people live in areas where earthquakes are likely to occur. Explain why people still live in a named area which you have studied which experiences earthquakes. [7] [Total: 25 marks] www.theallpapers.com
Question paper, page 8
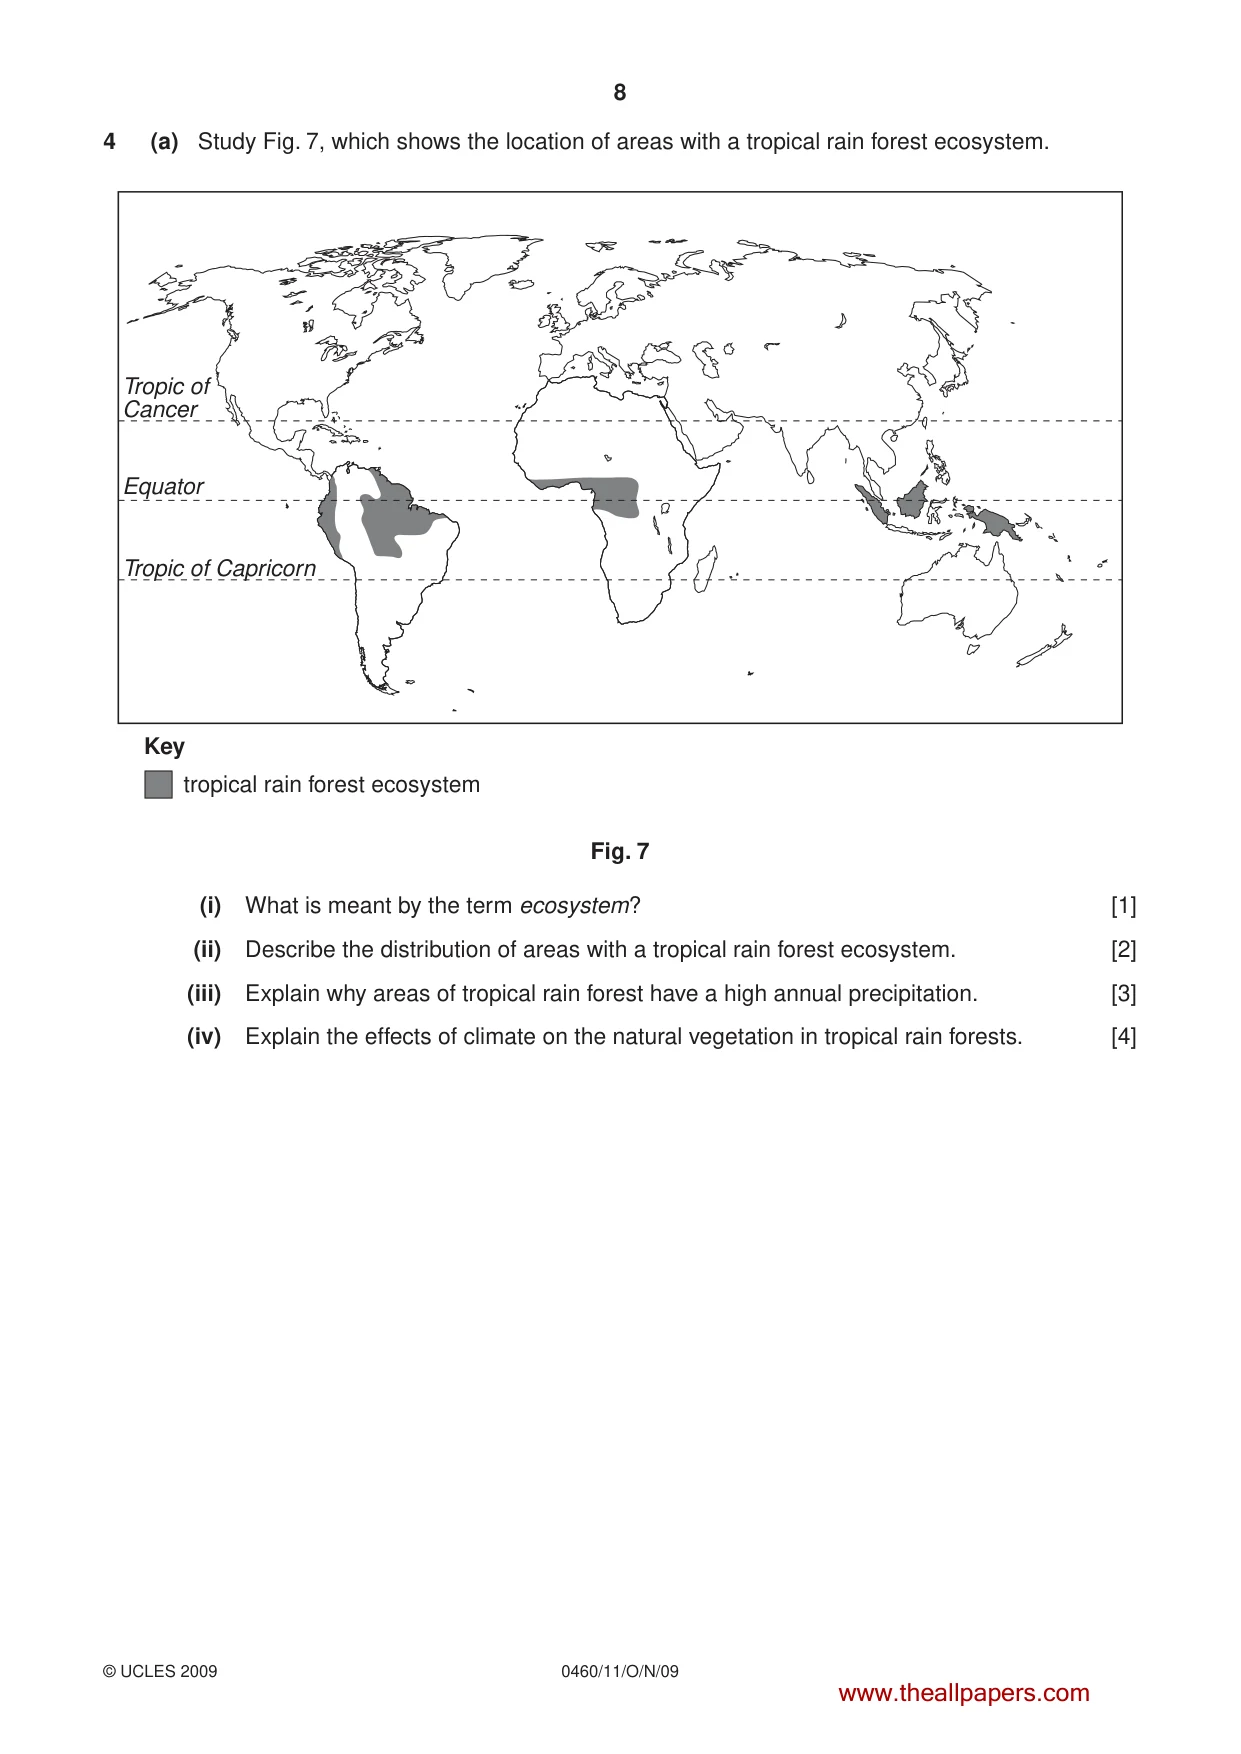
8 0460/11/O/N/09 © UCLES 2009 4 (a) Study Fig. 7, which shows the location of areas with a tropical rain forest ecosystem. Key tropical rain forest ecosystem Tropic of Cancer Tropic of Capricorn Equator Fig. 7 (i) What is meant by the term ecosystem? [1] (ii) Describe the distribution of areas with a tropical rain forest ecosystem. [2] (iii) Explain why areas of tropical rain forest have a high annual precipitation. [3] (iv) Explain the effects of climate on the natural vegetation in tropical rain forests. [4] www.theallpapers.com
Question paper, page 9
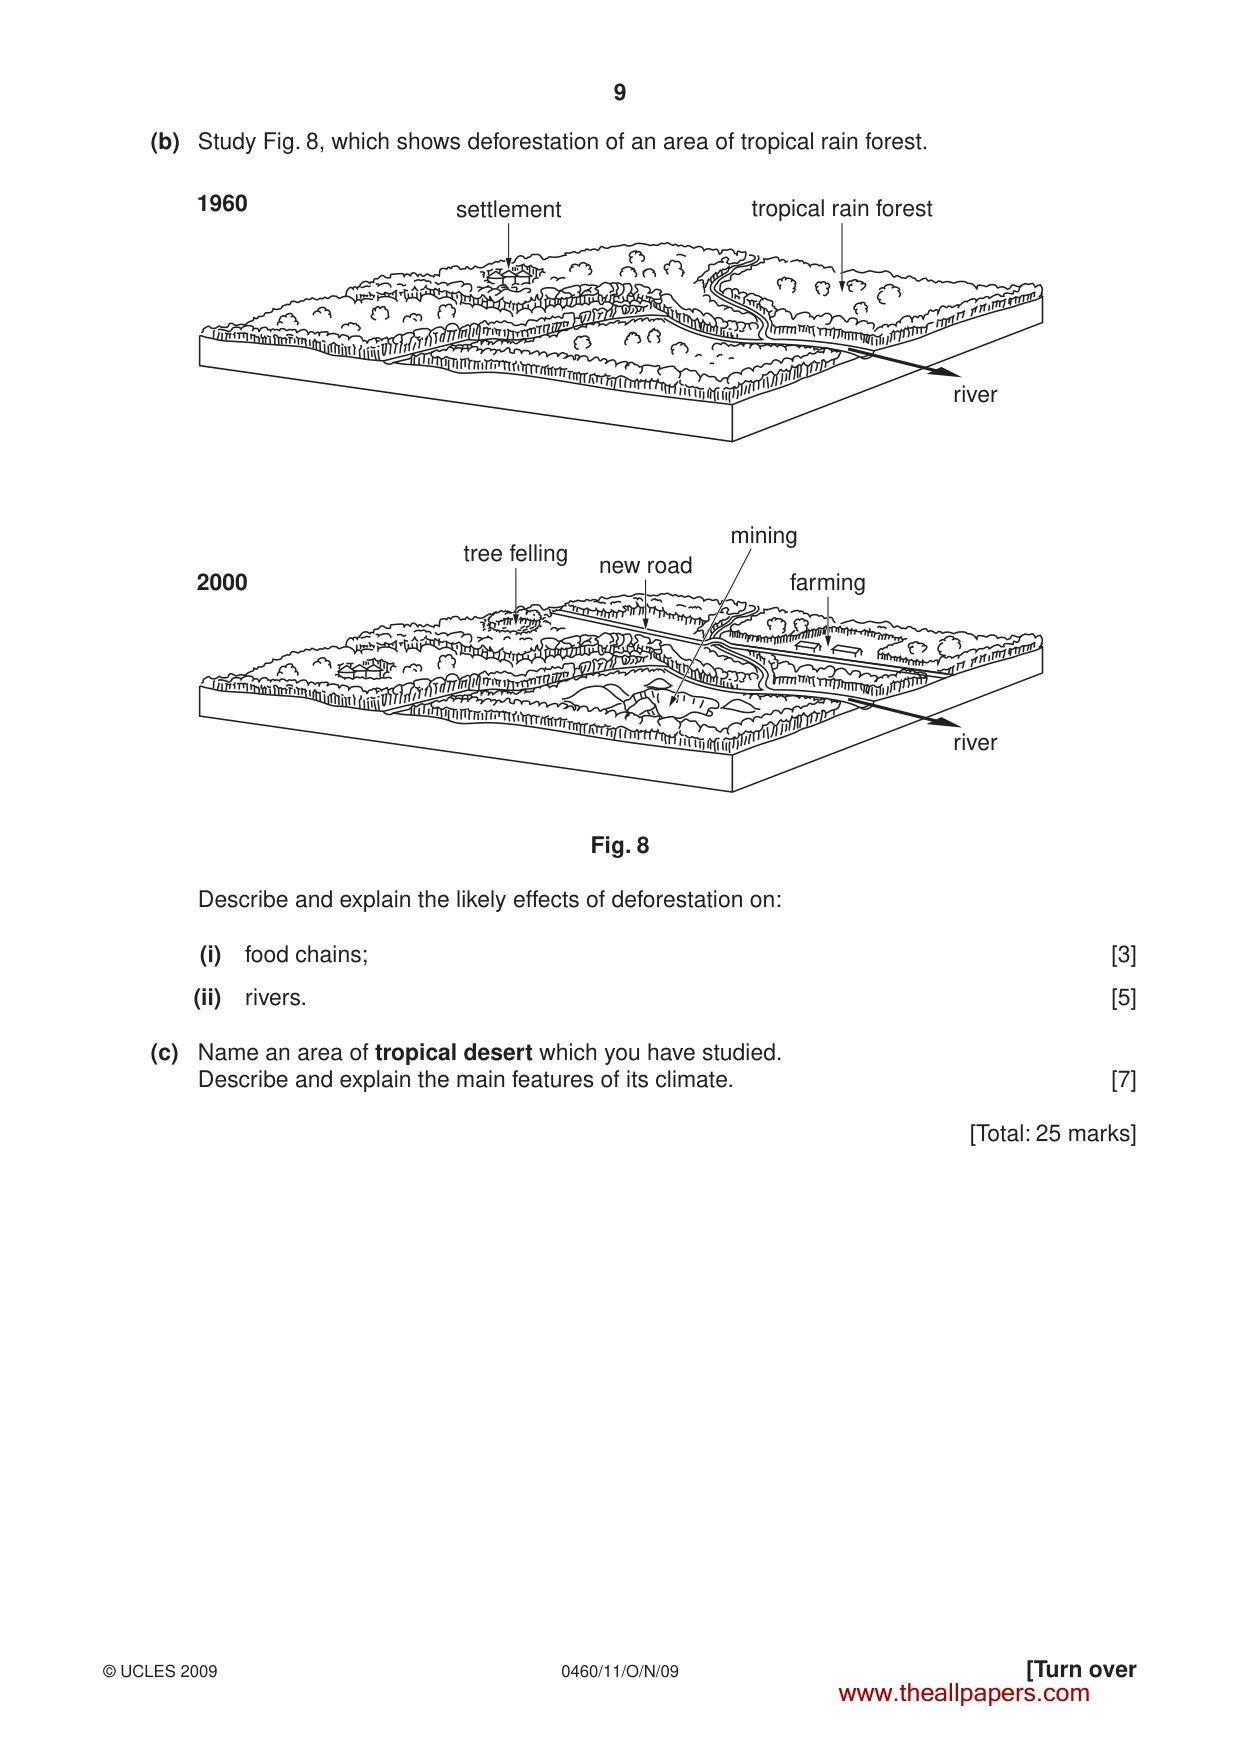
9 0460/11/O/N/09 © UCLES 2009 [Turn over (b) Study Fig. 8, which shows deforestation of an area of tropical rain forest. 1960 settlement river river 2000 tree felling new road farming mining tropical rain forest Fig. 8 Describe and explain the likely effects of deforestation on: (i) food chains; [3] (ii) rivers. [5] (c) Name an area of tropical desert which you have studied. Describe and explain the main features of its climate. [7] [Total: 25 marks] www.theallpapers.com
Question paper, page 10
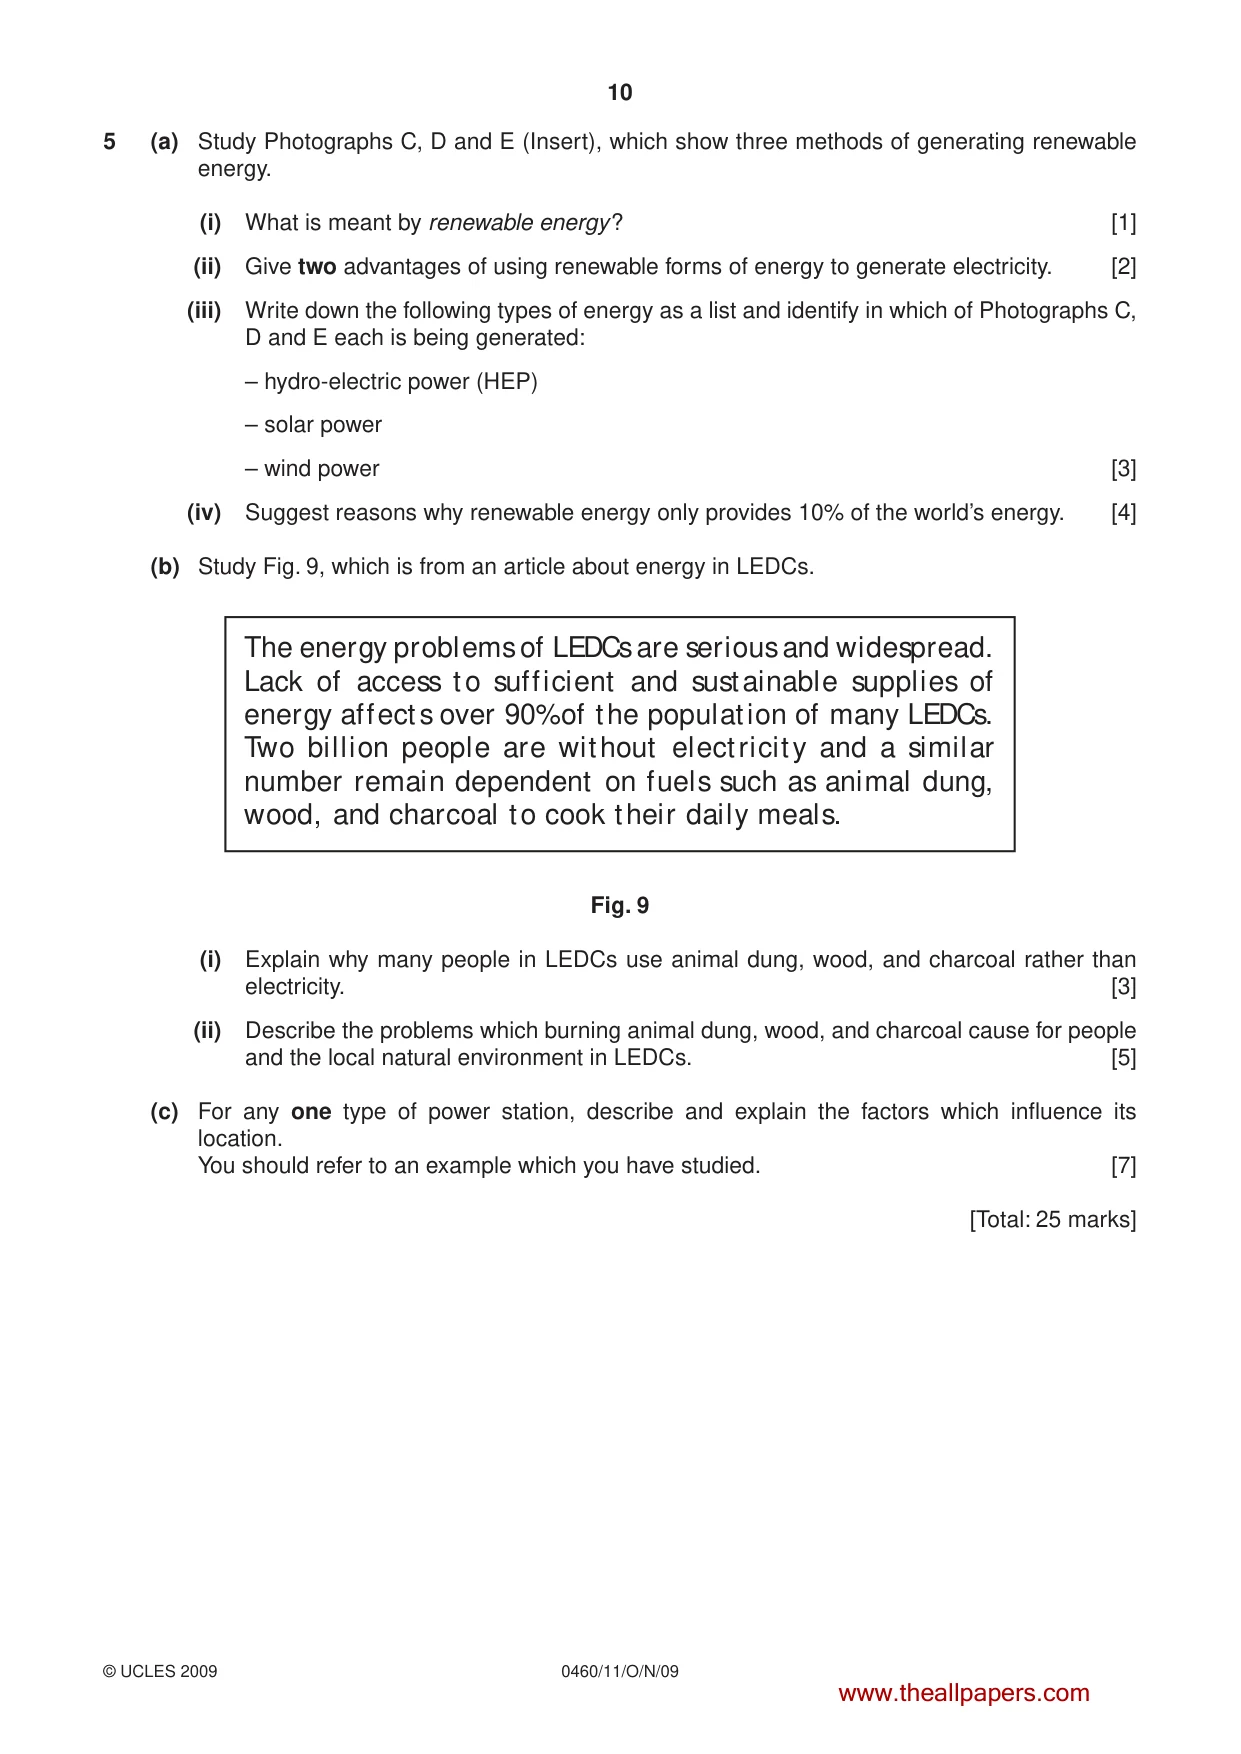
10 0460/11/O/N/09 © UCLES 2009 5 (a) Study Photographs C, D and E (Insert), which show three methods of generating renewable energy. (i) What is meant by renewable energy? [1] (ii) Give two advantages of using renewable forms of energy to generate electricity. [2] (iii) Write down the following types of energy as a list and identify in which of Photographs C, D and E each is being generated: – hydro-electric power (HEP) – solar power – wind power [3] (iv) Suggest reasons why renewable energy only provides 10% of the world’s energy. [4] (b) Study Fig. 9, which is from an article about energy in LEDCs. The energy problems of LEDCs are serious and widespread. Lack of access to sufficient and sustainable supplies of energy affects over 90% of the population of many LEDCs. Two billion people are without electricity and a similar number remain dependent on fuels such as animal dung, wood, and charcoal to cook their daily meals. Fig. 9 (i) Explain why many people in LEDCs use animal dung, wood, and charcoal rather than electricity. [3] (ii) Describe the problems which burning animal dung, wood, and charcoal cause for people and the local natural environment in LEDCs. [5] (c) For any one type of power station, describe and explain the factors which influence its location. You should refer to an example which you have studied. [7] [Total: 25 marks] www.theallpapers.com
Question paper, page 11
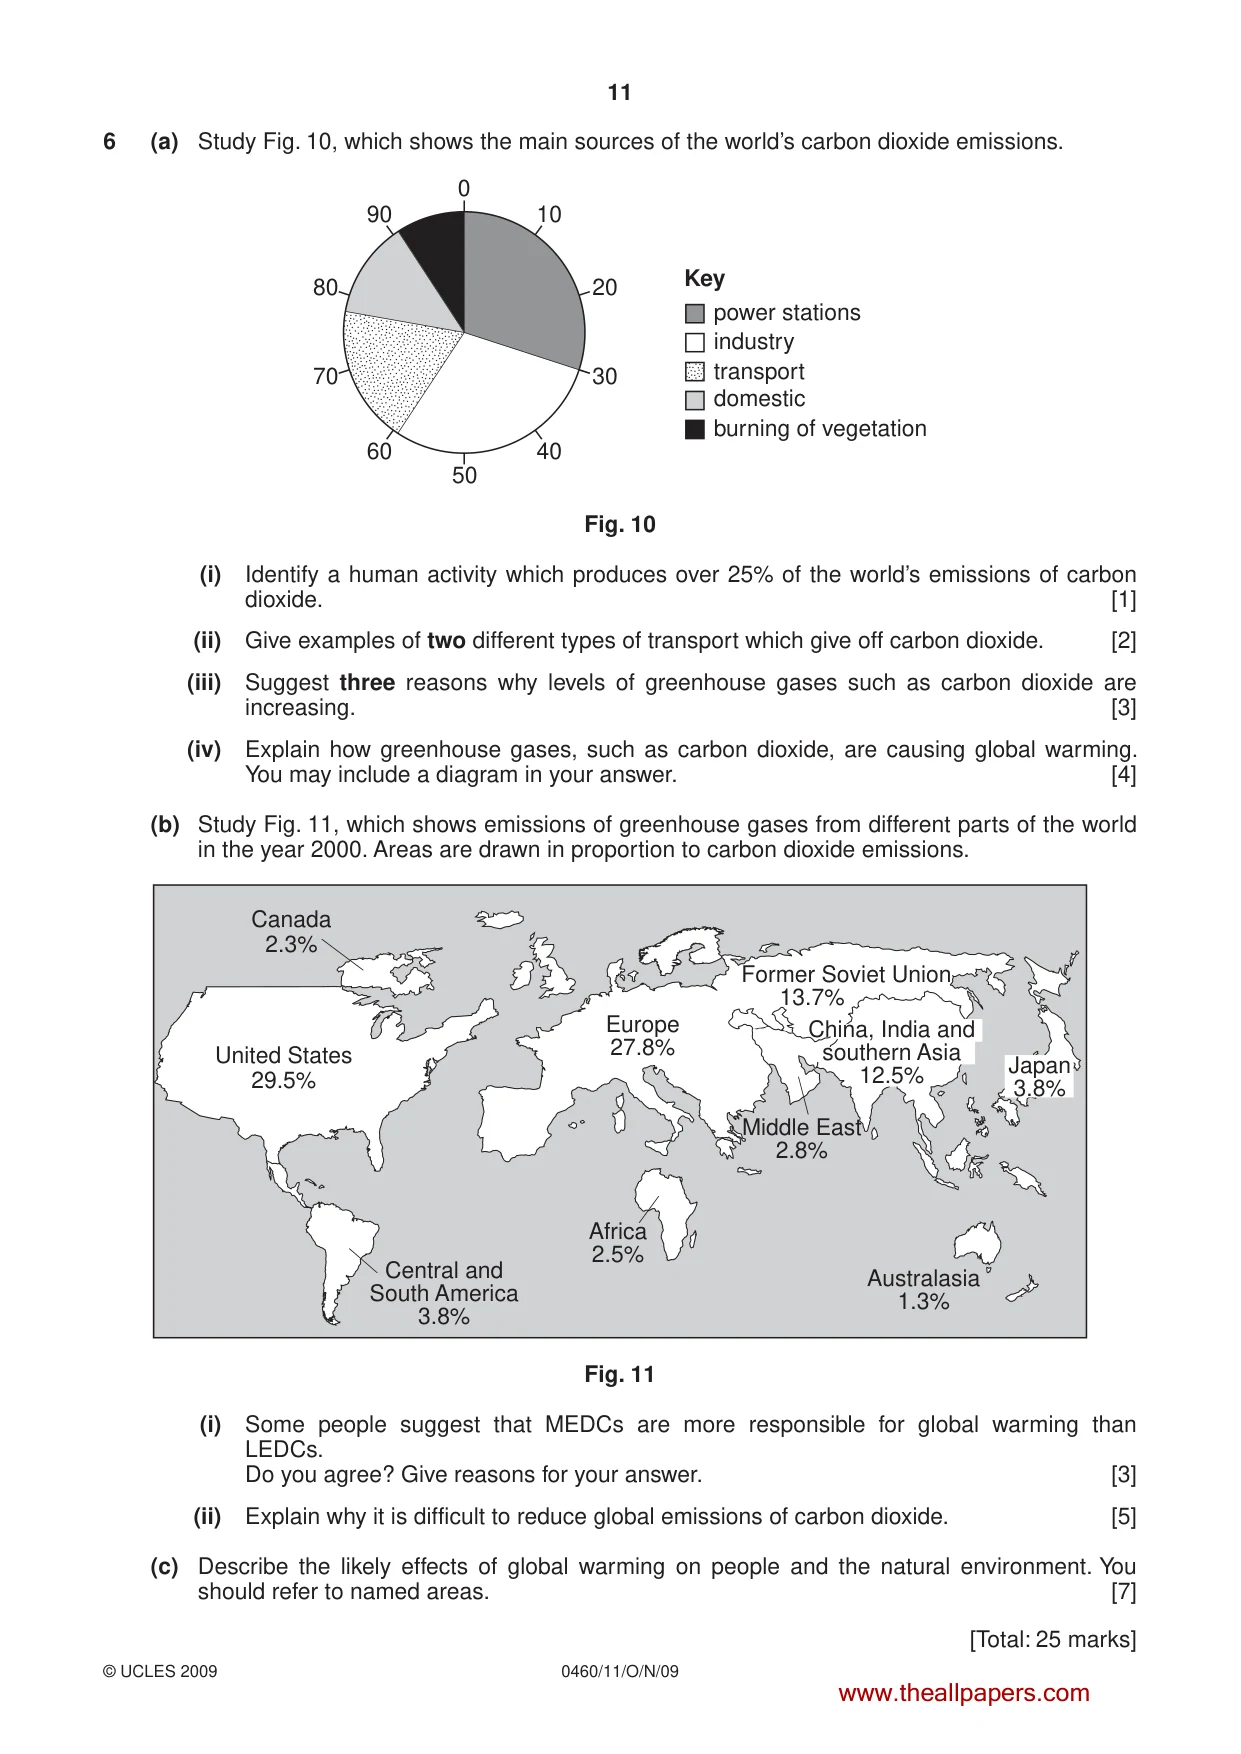
11 0460/11/O/N/09 © UCLES 2009 6 (a) Study Fig. 10, which shows the main sources of the world’s carbon dioxide emissions. 90 power stations Key industry transport domestic burning of vegetation 10 0 50 60 70 80 30 20 40 Fig. 10 (i) Identify a human activity which produces over 25% of the world’s emissions of carbon dioxide. [1] (ii) Give examples of two different types of transport which give off carbon dioxide. [2] (iii) Suggest three reasons why levels of greenhouse gases such as carbon dioxide are increasing. [3] (iv) Explain how greenhouse gases, such as carbon dioxide, are causing global warming. You may include a diagram in your answer. [4] (b) Study Fig. 11, which shows emissions of greenhouse gases from different parts of the world in the year 2000. Areas are drawn in proportion to carbon dioxide emissions. Canada 2.3% United States 29.5% Africa 2.5% Europe 27.8% Former Soviet Union 13.7% Central and South America 3.8% Japan 3.8% Australasia 1.3% Middle East 2.8% China, India and southern Asia 12.5% Fig. 11 (i) Some people suggest that MEDCs are more responsible for global warming than LEDCs. Do you agree? Give reasons for your answer. [3] (ii) Explain why it is difficult to reduce global emissions of carbon dioxide. [5] (c) Describe the likely effects of global warming on people and the natural environment. You should refer to named areas. [7] [Total: 25 marks] www.theallpapers.com
Question paper, page 12
12 0460/11/O/N/09 BLANK PAGE Copyright Acknowledgements: Question 1 Fig. 2 © Oman Daily Observer Question 2 Photograph A S. Sibley; © UCLES Question 2 Photograph B S. Sibley; © UCLES Question 5 Photograph C © www.rainorshinepower.com Question 5 Photograph D S. Sibley; © UCLES Question 5 Photograph E S. Sibley; © UCLES Question 5 Fig. 9 © D. F. Barnes, W. M. Floor, Rural Energy in Developing Countries. A Challenge for Economic Development. Annual Review of Energy and the Environment; November 1996. Question 6 Fig. 11 © World Resources Institute, www.images.wri.org/map_cartogram_global.warming-large.gif. Permission to reproduce items where third-party owned material protected by copyright is included has been sought and cleared where possible. Every reasonable effort has been made by the publisher (UCLES) to trace copyright holders, but if any items requiring clearance have unwittingly been included, the publisher will be pleased to make amends at the earliest possible opportunity. University of Cambridge International Examinations is part of the Cambridge Assessment Group. Cambridge Assessment is the brand name of University of Cambridge Local Examinations Syndicate (UCLES), which is itself a department of the University of Cambridge. www.theallpapers.com
Mark scheme, page 1
UNIVERSITY OF CAMBRIDGE INTERNATIONAL EXAMINATIONS International General Certificate of Secondary Education MARK SCHEME for the October/November 2009 question paper for the guidance of teachers 0460 GEOGRAPHY 0460/11 Paper 11, maximum raw mark 75 This mark scheme is published as an aid to teachers and candidates, to indicate the requirements of the examination. It shows the basis on which Examiners were instructed to award marks. It does not indicate the details of the discussions that took place at an Examiners’ meeting before marking began, which would have considered the acceptability of alternative answers. Mark schemes must be read in conjunction with the question papers and the report on the examination. • CIE will not enter into discussions or correspondence in connection with these mark schemes. CIE is publishing the mark schemes for the October/November 2009 question papers for most IGCSE, GCE Advanced Level and Advanced Subsidiary Level syllabuses and some Ordinary Level syllabuses. www.theallpapers.com
Mark scheme, page 2
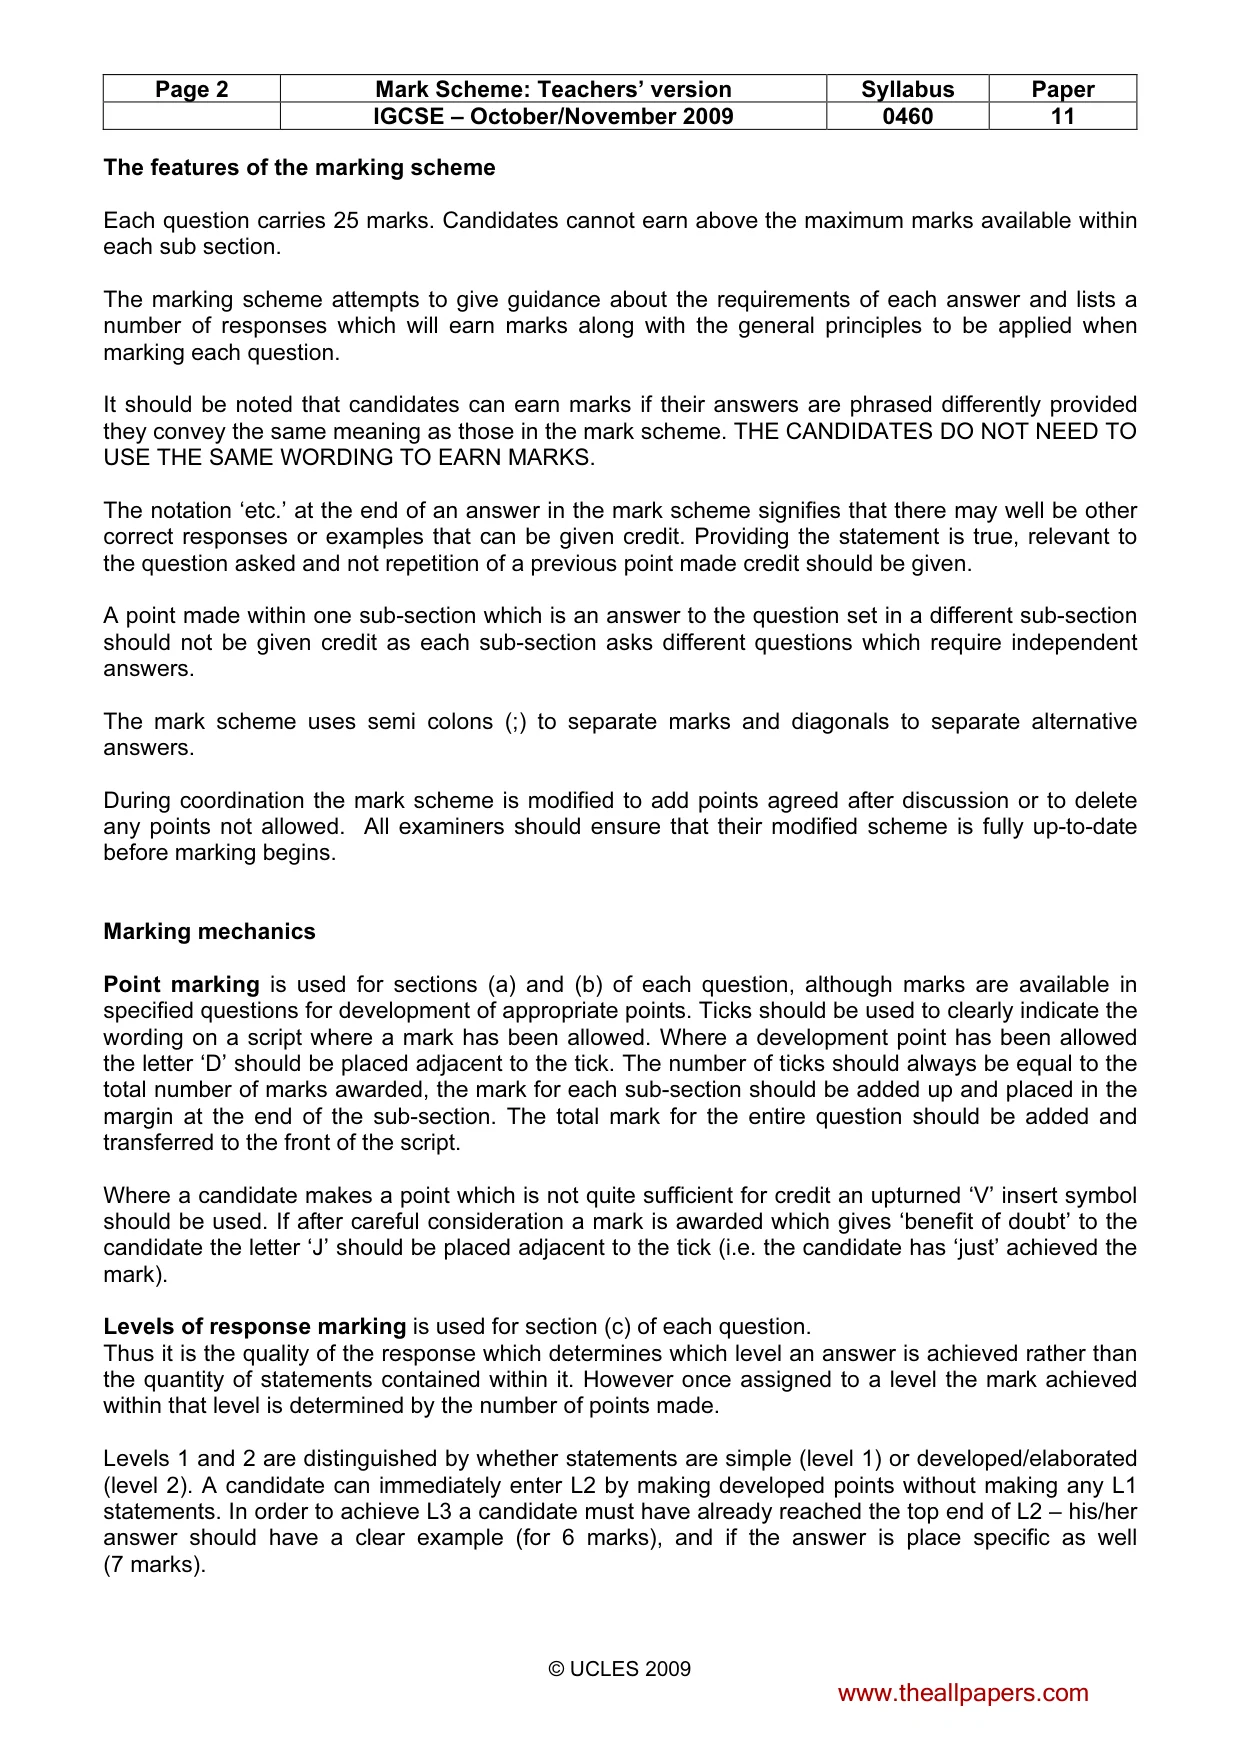
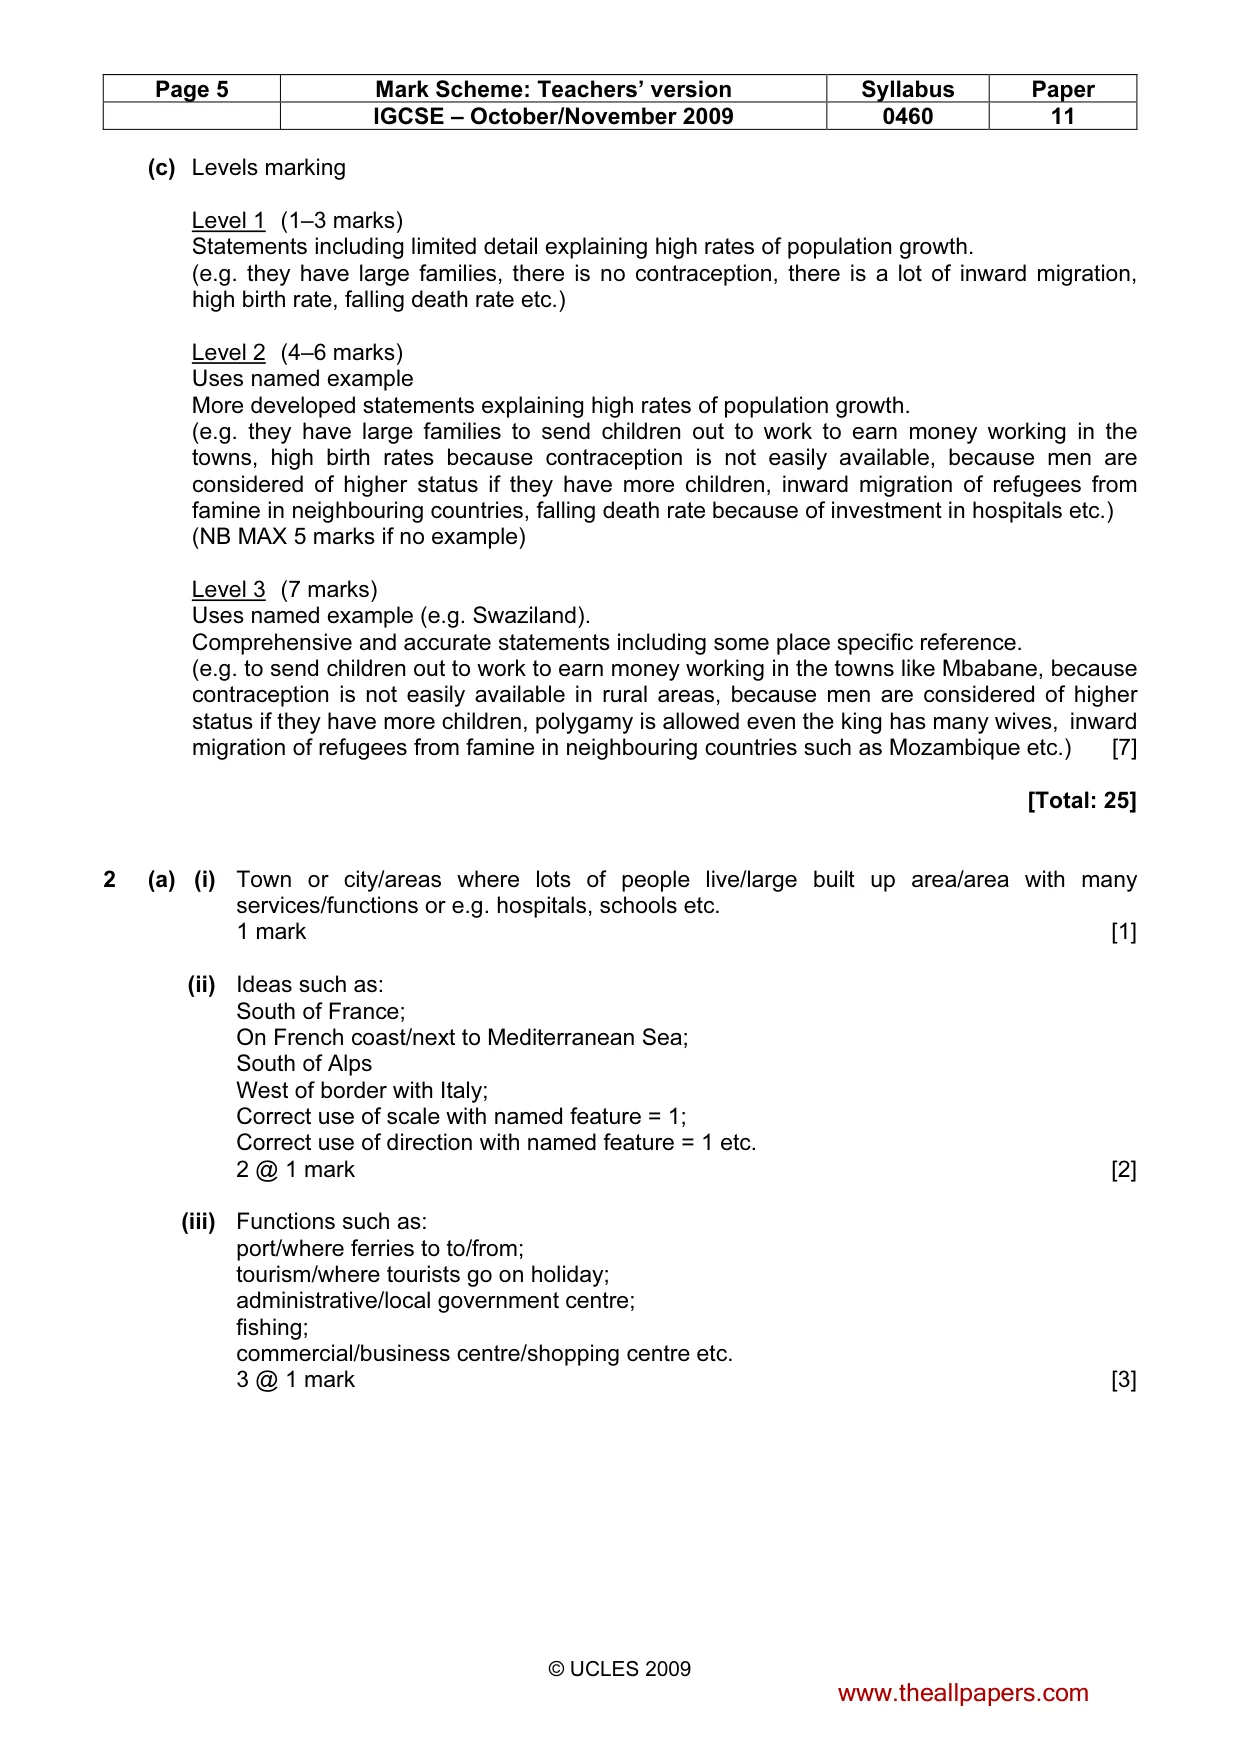
Page 2 Mark Scheme: Teachers’ version Syllabus Paper IGCSE – October/November 2009 0460 11 © UCLES 2009 The features of the marking scheme Each question carries 25 marks. Candidates cannot earn above the maximum marks available within each sub section. The marking scheme attempts to give guidance about the requirements of each answer and lists a number of responses which will earn marks along with the general principles to be applied when marking each question. It should be noted that candidates can earn marks if their answers are phrased differently provided they convey the same meaning as those in the mark scheme. THE CANDIDATES DO NOT NEED TO USE THE SAME WORDING TO EARN MARKS. The notation ‘etc.’ at the end of an answer in the mark scheme signifies that there may well be other correct responses or examples that can be given credit. Providing the statement is true, relevant to the question asked and not repetition of a previous point made credit should be given. A point made within one sub-section which is an answer to the question set in a different sub-section should not be given credit as each sub-section asks different questions which require independent answers. The mark scheme uses semi colons (;) to separate marks and diagonals to separate alternative answers. During coordination the mark scheme is modified to add points agreed after discussion or to delete any points not allowed. All examiners should ensure that their modified scheme is fully up-to-date before marking begins. Marking mechanics Point marking is used for sections (a) and (b) of each question, although marks are available in specified questions for development of appropriate points. Ticks should be used to clearly indicate the wording on a script where a mark has been allowed. Where a development point has been allowed the letter ‘D’ should be placed adjacent to the tick. The number of ticks should always be equal to the total number of marks awarded, the mark for each sub-section should be added up and placed in the margin at the end of the sub-section. The total mark for the entire question should be added and transferred to the front of the script. Where a candidate makes a point which is not quite sufficient for credit an upturned ‘V’ insert symbol should be used. If after careful consideration a mark is awarded which gives ‘benefit of doubt’ to the candidate the letter ‘J’ should be placed adjacent to the tick (i.e. the candidate has ‘just’ achieved the mark). Levels of response marking is used for section (c) of each question. Thus it is the quality of the response which determines which level an answer is achieved rather than the quantity of statements contained within it. However once assigned to a level the mark achieved within that level is determined by the number of points made. Levels 1 and 2 are distinguished by whether statements are simple (level 1) or developed/elaborated (level 2). A candidate can immediately enter L2 by making developed points without making any L1 statements. In order to achieve L3 a candidate must have already reached the top end of L2 – his/her answer should have a clear example (for 6 marks), and if the answer is place specific as well (7 marks). www.theallpapers.com
Mark scheme, page 3
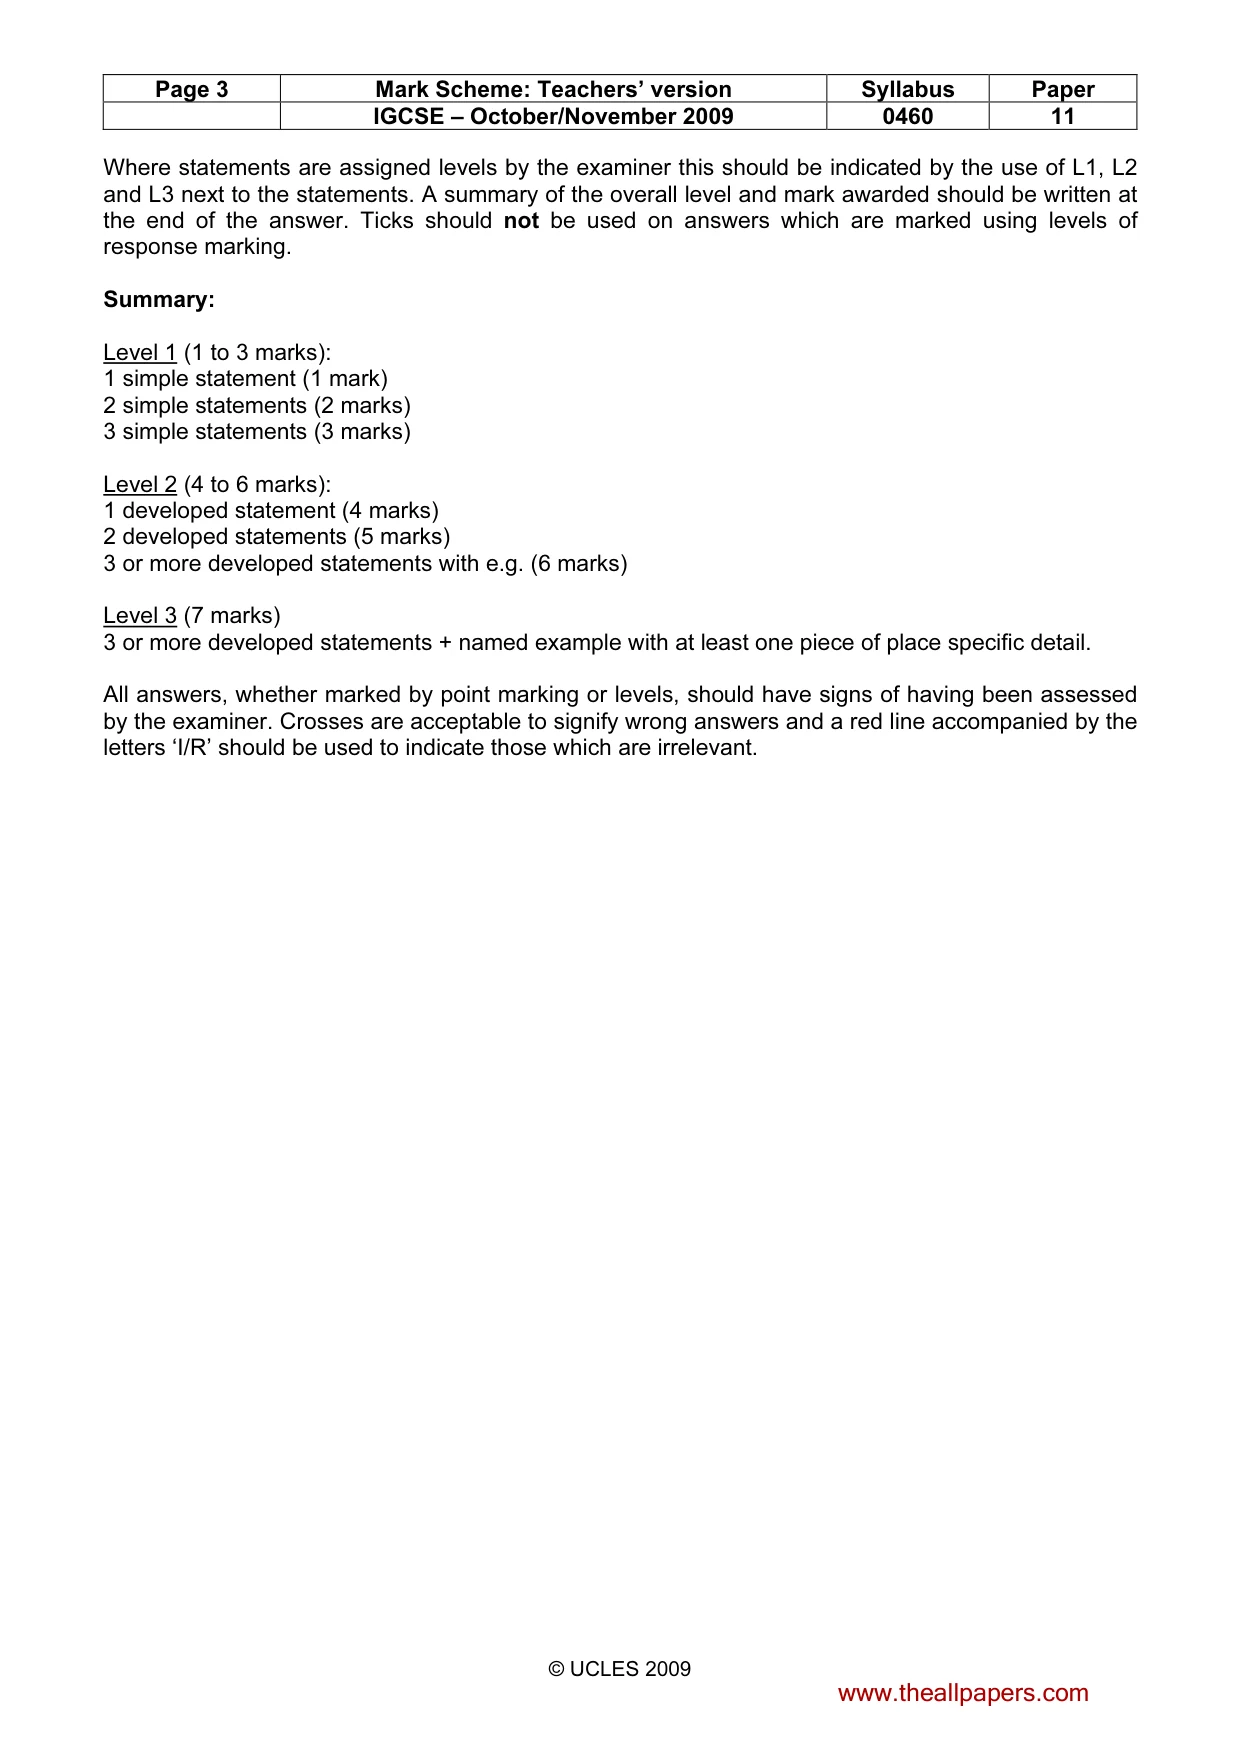
Page 3 Mark Scheme: Teachers’ version Syllabus Paper IGCSE – October/November 2009 0460 11 © UCLES 2009 Where statements are assigned levels by the examiner this should be indicated by the use of L1, L2 and L3 next to the statements. A summary of the overall level and mark awarded should be written at the end of the answer. Ticks should not be used on answers which are marked using levels of response marking. Summary: Level 1 (1 to 3 marks): 1 simple statement (1 mark) 2 simple statements (2 marks) 3 simple statements (3 marks) Level 2 (4 to 6 marks): 1 developed statement (4 marks) 2 developed statements (5 marks) 3 or more developed statements with e.g. (6 marks) Level 3 (7 marks) 3 or more developed statements + named example with at least one piece of place specific detail. All answers, whether marked by point marking or levels, should have signs of having been assessed by the examiner. Crosses are acceptable to signify wrong answers and a red line accompanied by the letters ‘I/R’ should be used to indicate those which are irrelevant. www.theallpapers.com
Mark scheme, page 4
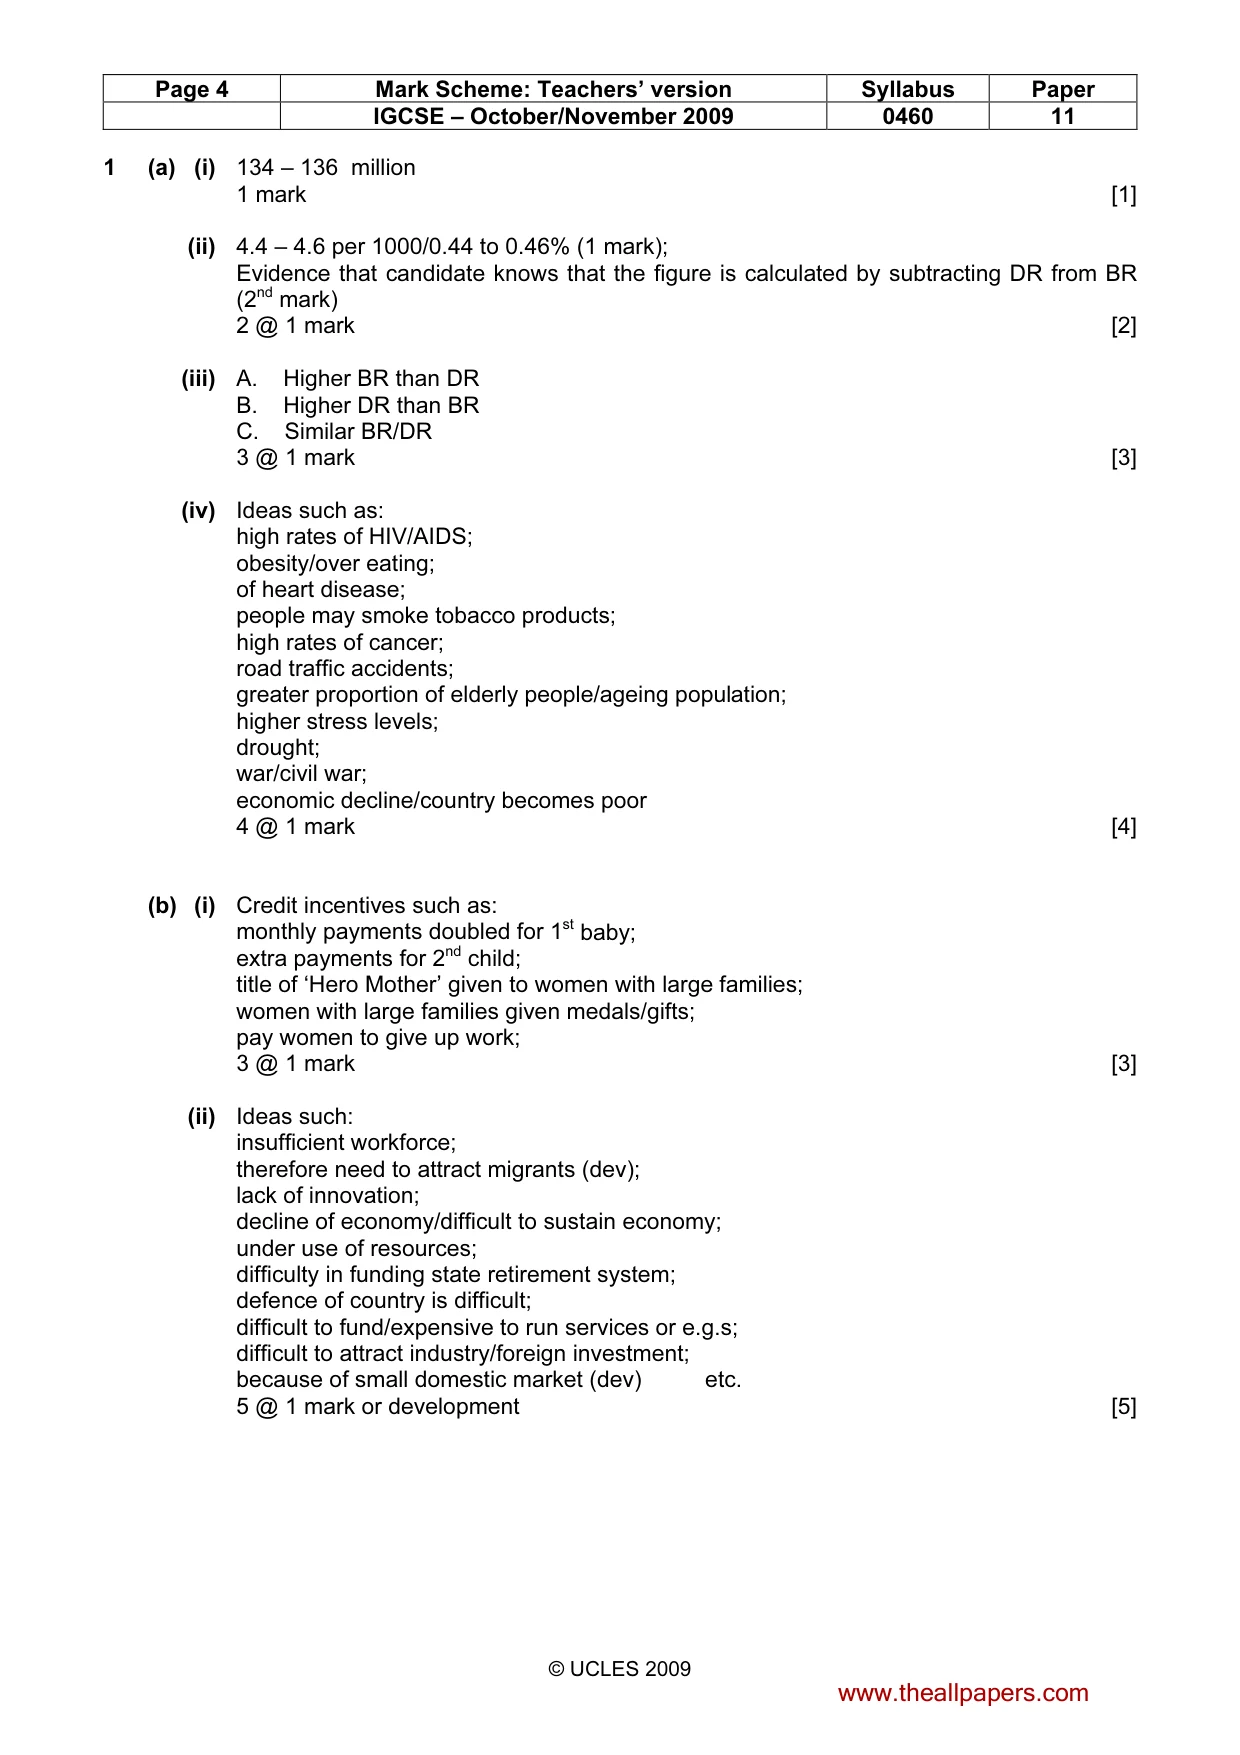
Page 4 Mark Scheme: Teachers’ version Syllabus Paper IGCSE – October/November 2009 0460 11 © UCLES 2009 1 (a) (i) 134 – 136 million 1 mark [1] (ii) 4.4 – 4.6 per 1000/0.44 to 0.46% (1 mark); Evidence that candidate knows that the figure is calculated by subtracting DR from BR (2nd mark) 2 @ 1 mark [2] (iii) A. Higher BR than DR B. Higher DR than BR C. Similar BR/DR 3 @ 1 mark [3] (iv) Ideas such as: high rates of HIV/AIDS; obesity/over eating; of heart disease; people may smoke tobacco products; high rates of cancer; road traffic accidents; greater proportion of elderly people/ageing population; higher stress levels; drought; war/civil war; economic decline/country becomes poor 4 @ 1 mark [4] (b) (i) Credit incentives such as: monthly payments doubled for 1st baby; extra payments for 2nd child; title of ‘Hero Mother’ given to women with large families; women with large families given medals/gifts; pay women to give up work; 3 @ 1 mark [3] (ii) Ideas such: insufficient workforce; therefore need to attract migrants (dev); lack of innovation; decline of economy/difficult to sustain economy; under use of resources; difficulty in funding state retirement system; defence of country is difficult; difficult to fund/expensive to run services or e.g.s; difficult to attract industry/foreign investment; because of small domestic market (dev) etc. 5 @ 1 mark or development [5] www.theallpapers.com
Mark scheme, page 5
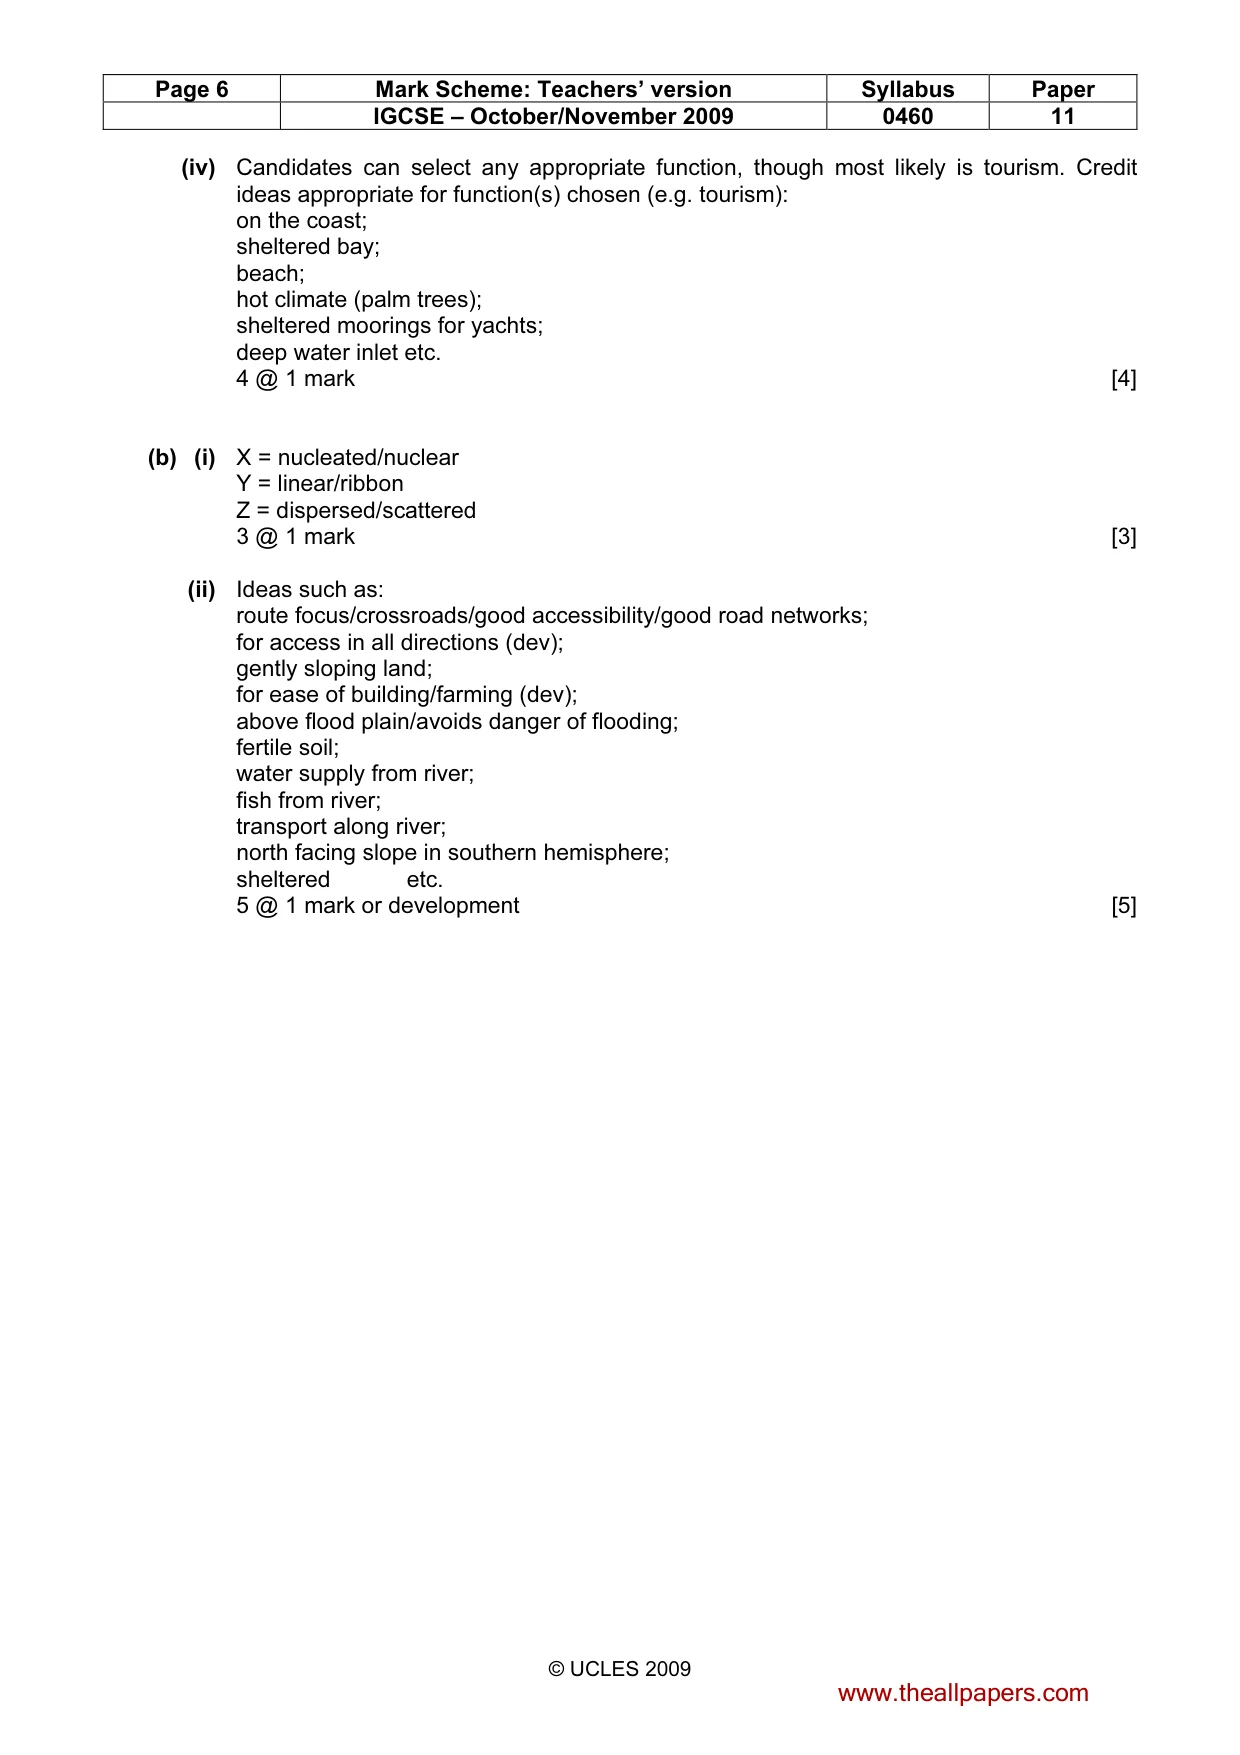
Page 5 Mark Scheme: Teachers’ version Syllabus Paper IGCSE – October/November 2009 0460 11 © UCLES 2009 (c) Levels marking Level 1 (1–3 marks) Statements including limited detail explaining high rates of population growth. (e.g. they have large families, there is no contraception, there is a lot of inward migration, high birth rate, falling death rate etc.) Level 2 (4–6 marks) Uses named example More developed statements explaining high rates of population growth. (e.g. they have large families to send children out to work to earn money working in the towns, high birth rates because contraception is not easily available, because men are considered of higher status if they have more children, inward migration of refugees from famine in neighbouring countries, falling death rate because of investment in hospitals etc.) (NB MAX 5 marks if no example) Level 3 (7 marks) Uses named example (e.g. Swaziland). Comprehensive and accurate statements including some place specific reference. (e.g. to send children out to work to earn money working in the towns like Mbabane, because contraception is not easily available in rural areas, because men are considered of higher status if they have more children, polygamy is allowed even the king has many wives, inward migration of refugees from famine in neighbouring countries such as Mozambique etc.) [7] [Total: 25] 2 (a) (i) Town or city/areas where lots of people live/large built up area/area with many services/functions or e.g. hospitals, schools etc. 1 mark [1] (ii) Ideas such as: South of France; On French coast/next to Mediterranean Sea; South of Alps West of border with Italy; Correct use of scale with named feature = 1; Correct use of direction with named feature = 1 etc. 2 @ 1 mark [2] (iii) Functions such as: port/where ferries to to/from; tourism/where tourists go on holiday; administrative/local government centre; fishing; commercial/business centre/shopping centre etc. 3 @ 1 mark [3] www.theallpapers.com
Mark scheme, page 6
Page 6 Mark Scheme: Teachers’ version Syllabus Paper IGCSE – October/November 2009 0460 11 © UCLES 2009 (iv) Candidates can select any appropriate function, though most likely is tourism. Credit ideas appropriate for function(s) chosen (e.g. tourism): on the coast; sheltered bay; beach; hot climate (palm trees); sheltered moorings for yachts; deep water inlet etc. 4 @ 1 mark [4] (b) (i) X = nucleated/nuclear Y = linear/ribbon Z = dispersed/scattered 3 @ 1 mark [3] (ii) Ideas such as: route focus/crossroads/good accessibility/good road networks; for access in all directions (dev); gently sloping land; for ease of building/farming (dev); above flood plain/avoids danger of flooding; fertile soil; water supply from river; fish from river; transport along river; north facing slope in southern hemisphere; sheltered etc. 5 @ 1 mark or development [5] www.theallpapers.com
Mark scheme, page 7
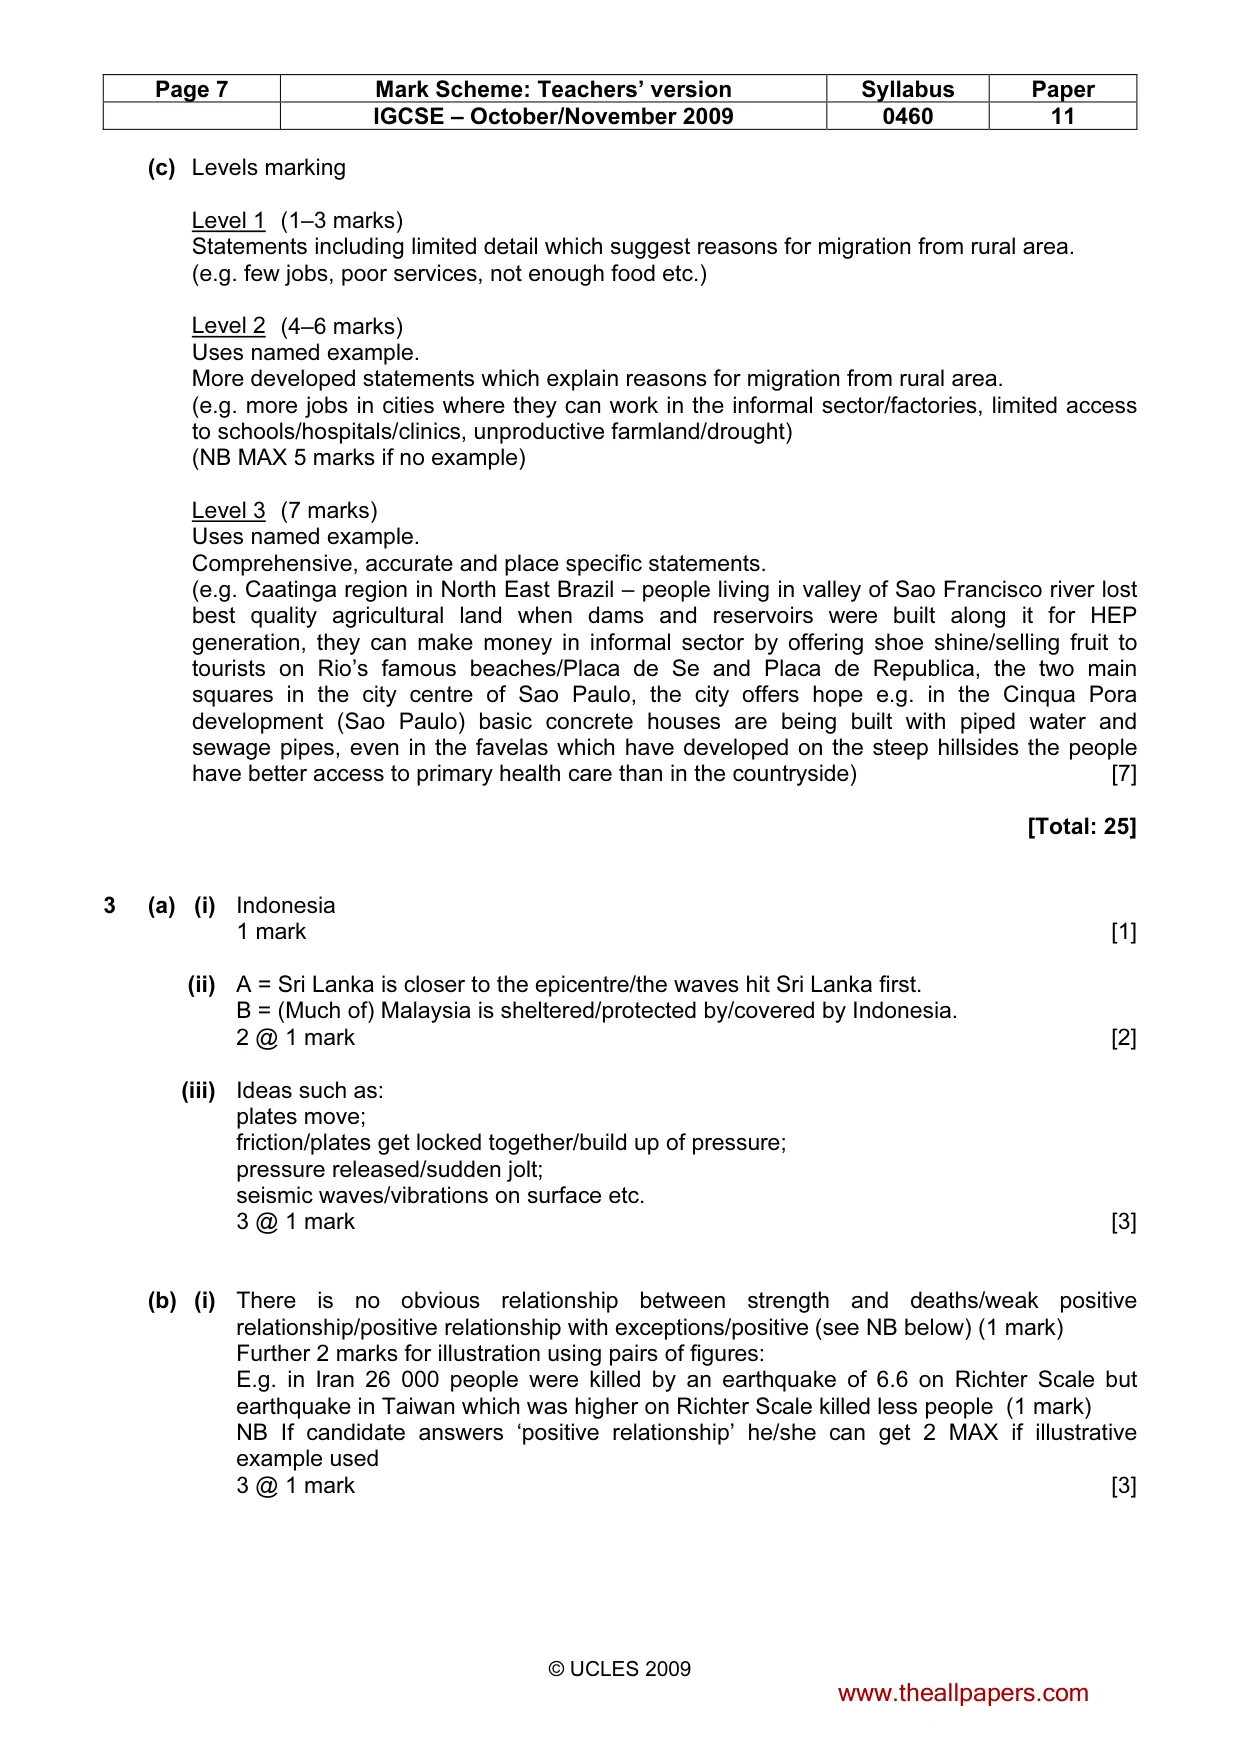
Page 7 Mark Scheme: Teachers’ version Syllabus Paper IGCSE – October/November 2009 0460 11 © UCLES 2009 (c) Levels marking Level 1 (1–3 marks) Statements including limited detail which suggest reasons for migration from rural area. (e.g. few jobs, poor services, not enough food etc.) Level 2 (4–6 marks) Uses named example. More developed statements which explain reasons for migration from rural area. (e.g. more jobs in cities where they can work in the informal sector/factories, limited access to schools/hospitals/clinics, unproductive farmland/drought) (NB MAX 5 marks if no example) Level 3 (7 marks) Uses named example. Comprehensive, accurate and place specific statements. (e.g. Caatinga region in North East Brazil – people living in valley of Sao Francisco river lost best quality agricultural land when dams and reservoirs were built along it for HEP generation, they can make money in informal sector by offering shoe shine/selling fruit to tourists on Rio’s famous beaches/Placa de Se and Placa de Republica, the two main squares in the city centre of Sao Paulo, the city offers hope e.g. in the Cinqua Pora development (Sao Paulo) basic concrete houses are being built with piped water and sewage pipes, even in the favelas which have developed on the steep hillsides the people have better access to primary health care than in the countryside) [7] [Total: 25] 3 (a) (i) Indonesia 1 mark [1] (ii) A = Sri Lanka is closer to the epicentre/the waves hit Sri Lanka first. B = (Much of) Malaysia is sheltered/protected by/covered by Indonesia. 2 @ 1 mark [2] (iii) Ideas such as: plates move; friction/plates get locked together/build up of pressure; pressure released/sudden jolt; seismic waves/vibrations on surface etc. 3 @ 1 mark [3] (b) (i) There is no obvious relationship between strength and deaths/weak positive relationship/positive relationship with exceptions/positive (see NB below) (1 mark) Further 2 marks for illustration using pairs of figures: E.g. in Iran 26 000 people were killed by an earthquake of 6.6 on Richter Scale but earthquake in Taiwan which was higher on Richter Scale killed less people (1 mark) NB If candidate answers ‘positive relationship’ he/she can get 2 MAX if illustrative example used 3 @ 1 mark [3] www.theallpapers.com
Mark scheme, page 8
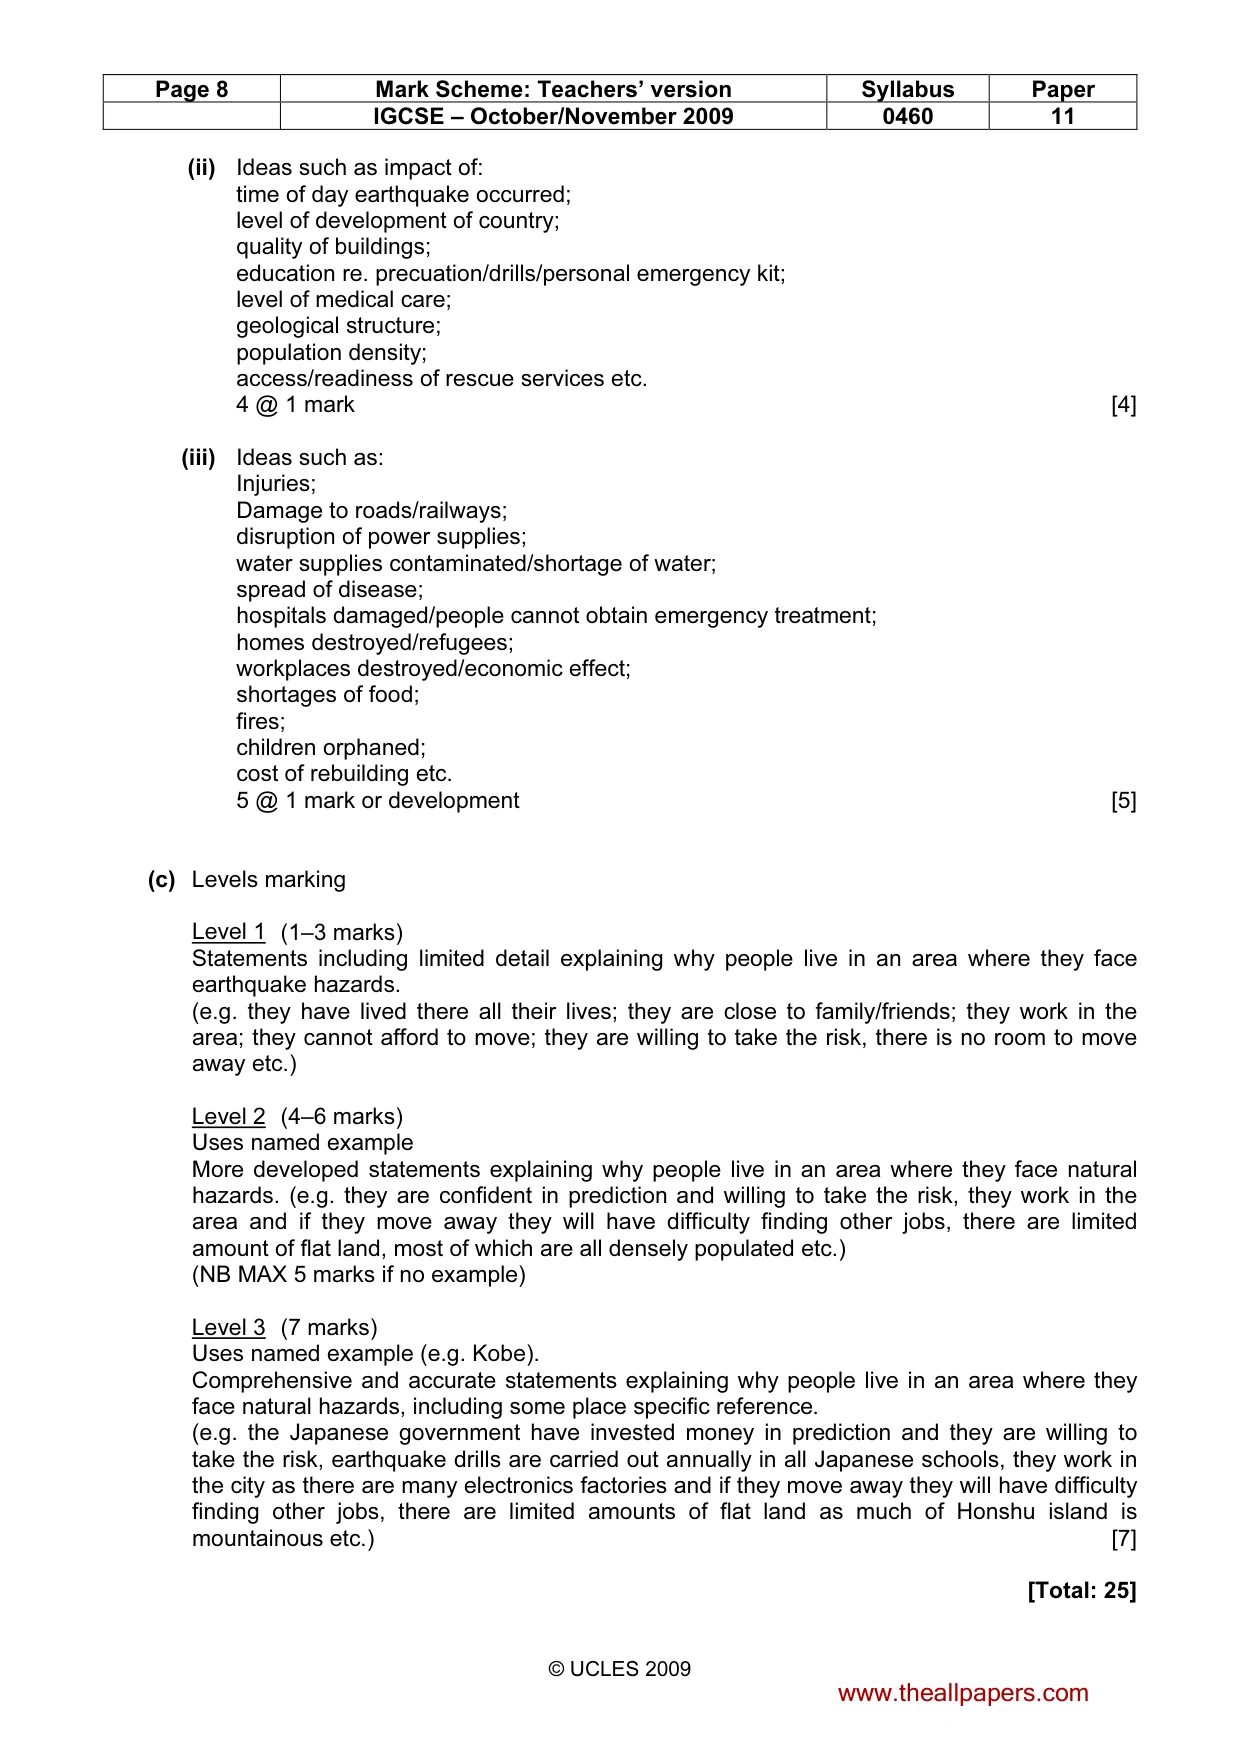
Page 8 Mark Scheme: Teachers’ version Syllabus Paper IGCSE – October/November 2009 0460 11 © UCLES 2009 (ii) Ideas such as impact of: time of day earthquake occurred; level of development of country; quality of buildings; education re. precuation/drills/personal emergency kit; level of medical care; geological structure; population density; access/readiness of rescue services etc. 4 @ 1 mark [4] (iii) Ideas such as: Injuries; Damage to roads/railways; disruption of power supplies; water supplies contaminated/shortage of water; spread of disease; hospitals damaged/people cannot obtain emergency treatment; homes destroyed/refugees; workplaces destroyed/economic effect; shortages of food; fires; children orphaned; cost of rebuilding etc. 5 @ 1 mark or development [5] (c) Levels marking Level 1 (1–3 marks) Statements including limited detail explaining why people live in an area where they face earthquake hazards. (e.g. they have lived there all their lives; they are close to family/friends; they work in the area; they cannot afford to move; they are willing to take the risk, there is no room to move away etc.) Level 2 (4–6 marks) Uses named example More developed statements explaining why people live in an area where they face natural hazards. (e.g. they are confident in prediction and willing to take the risk, they work in the area and if they move away they will have difficulty finding other jobs, there are limited amount of flat land, most of which are all densely populated etc.) (NB MAX 5 marks if no example) Level 3 (7 marks) Uses named example (e.g. Kobe). Comprehensive and accurate statements explaining why people live in an area where they face natural hazards, including some place specific reference. (e.g. the Japanese government have invested money in prediction and they are willing to take the risk, earthquake drills are carried out annually in all Japanese schools, they work in the city as there are many electronics factories and if they move away they will have difficulty finding other jobs, there are limited amounts of flat land as much of Honshu island is mountainous etc.) [7] [Total: 25] www.theallpapers.com
Mark scheme, page 9
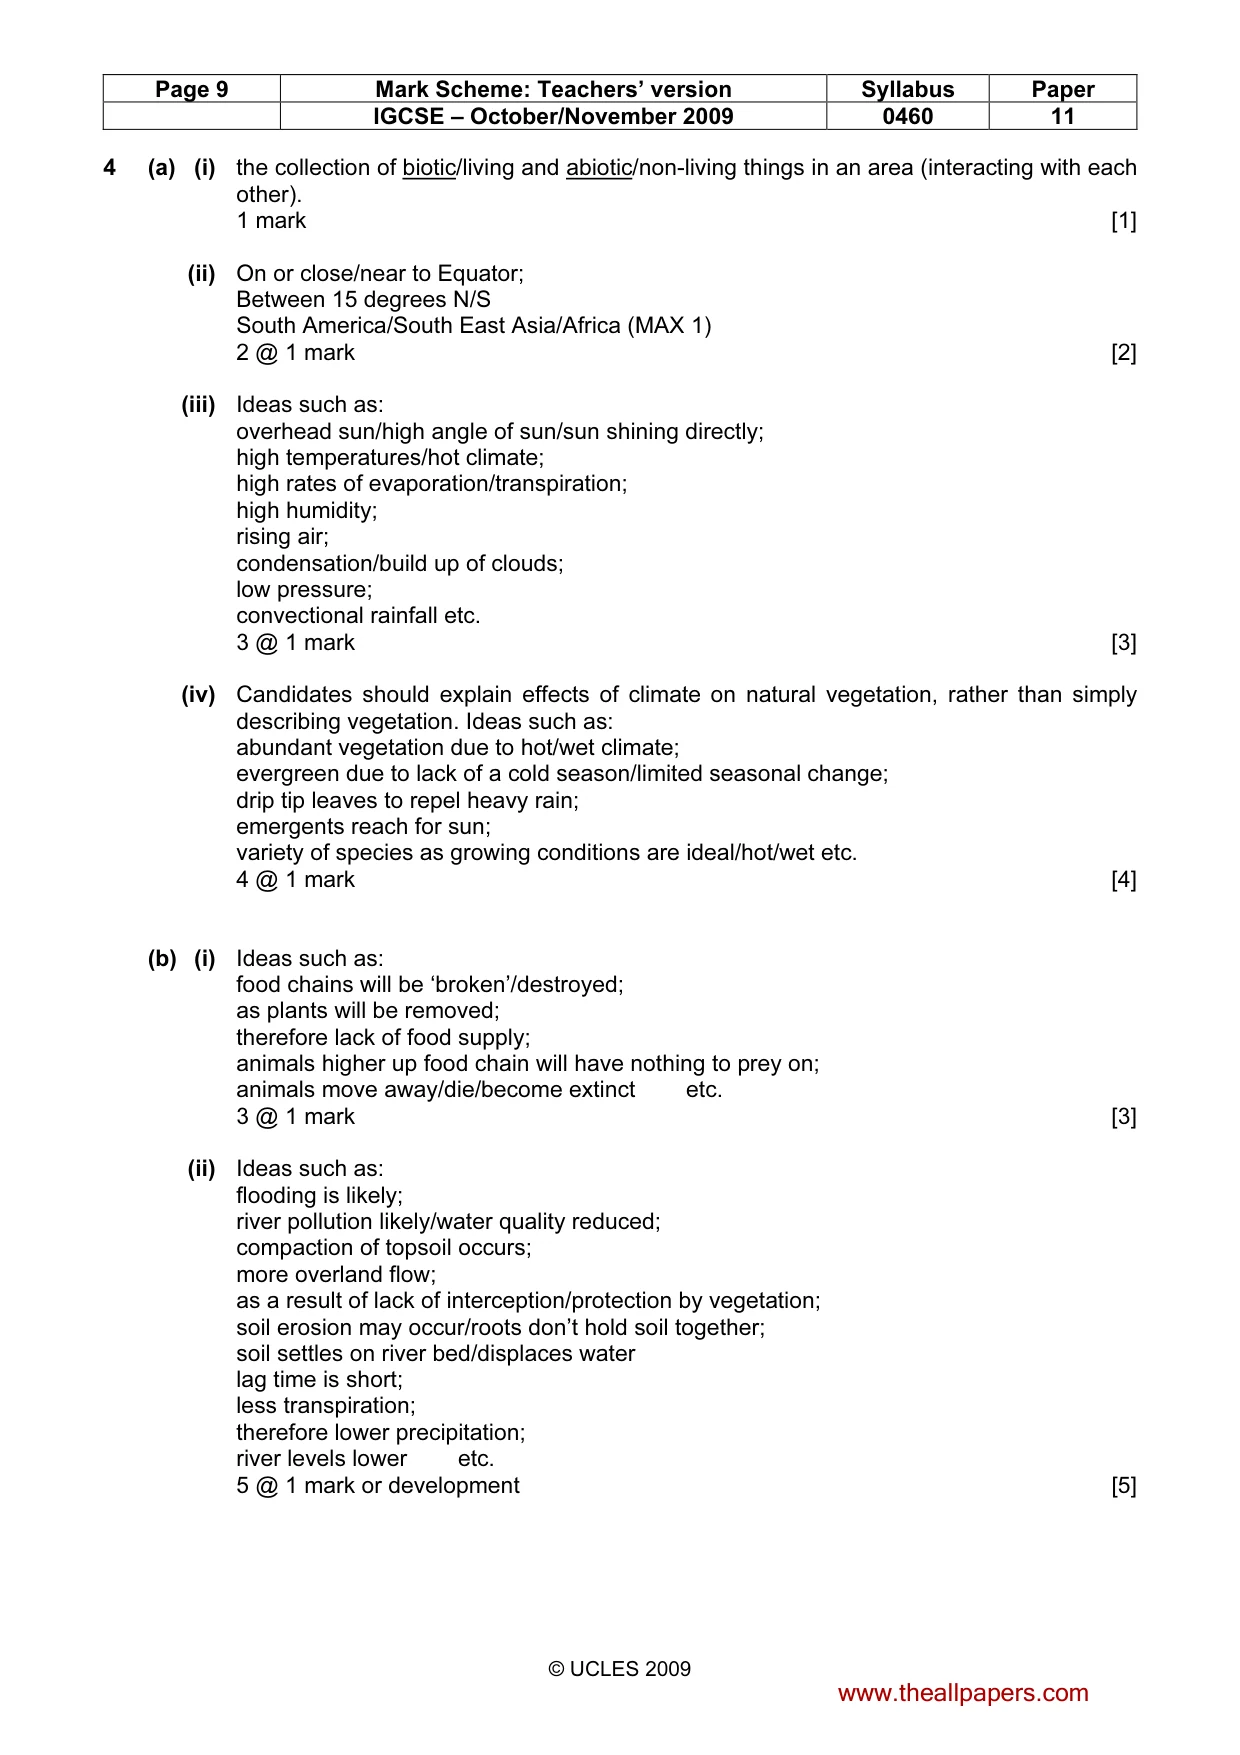
Page 9 Mark Scheme: Teachers’ version Syllabus Paper IGCSE – October/November 2009 0460 11 © UCLES 2009 4 (a) (i) the collection of biotic/living and abiotic/non-living things in an area (interacting with each other). 1 mark [1] (ii) On or close/near to Equator; Between 15 degrees N/S South America/South East Asia/Africa (MAX 1) 2 @ 1 mark [2] (iii) Ideas such as: overhead sun/high angle of sun/sun shining directly; high temperatures/hot climate; high rates of evaporation/transpiration; high humidity; rising air; condensation/build up of clouds; low pressure; convectional rainfall etc. 3 @ 1 mark [3] (iv) Candidates should explain effects of climate on natural vegetation, rather than simply describing vegetation. Ideas such as: abundant vegetation due to hot/wet climate; evergreen due to lack of a cold season/limited seasonal change; drip tip leaves to repel heavy rain; emergents reach for sun; variety of species as growing conditions are ideal/hot/wet etc. 4 @ 1 mark [4] (b) (i) Ideas such as: food chains will be ‘broken’/destroyed; as plants will be removed; therefore lack of food supply; animals higher up food chain will have nothing to prey on; animals move away/die/become extinct etc. 3 @ 1 mark [3] (ii) Ideas such as: flooding is likely; river pollution likely/water quality reduced; compaction of topsoil occurs; more overland flow; as a result of lack of interception/protection by vegetation; soil erosion may occur/roots don’t hold soil together; soil settles on river bed/displaces water lag time is short; less transpiration; therefore lower precipitation; river levels lower etc. 5 @ 1 mark or development [5] www.theallpapers.com
Mark scheme, page 10
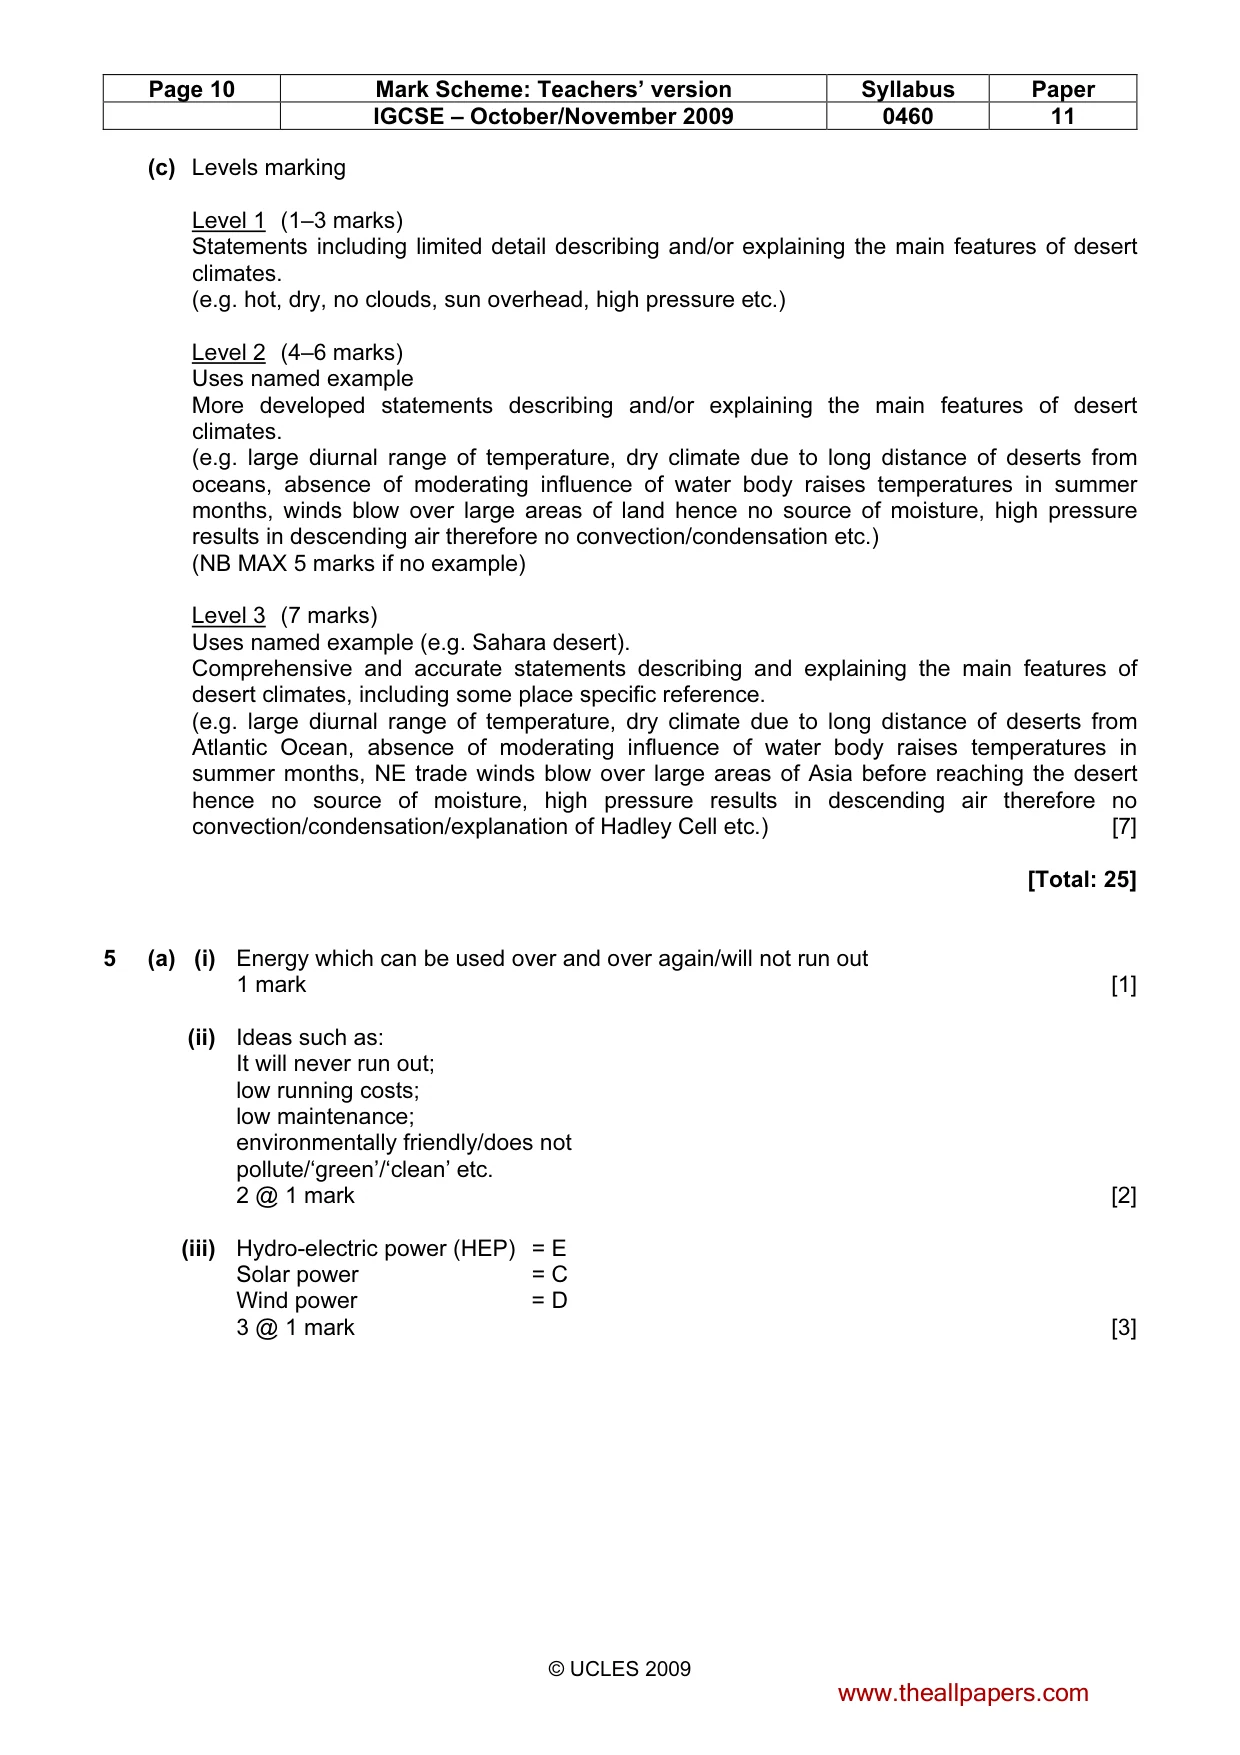
Page 10 Mark Scheme: Teachers’ version Syllabus Paper IGCSE – October/November 2009 0460 11 © UCLES 2009 (c) Levels marking Level 1 (1–3 marks) Statements including limited detail describing and/or explaining the main features of desert climates. (e.g. hot, dry, no clouds, sun overhead, high pressure etc.) Level 2 (4–6 marks) Uses named example More developed statements describing and/or explaining the main features of desert climates. (e.g. large diurnal range of temperature, dry climate due to long distance of deserts from oceans, absence of moderating influence of water body raises temperatures in summer months, winds blow over large areas of land hence no source of moisture, high pressure results in descending air therefore no convection/condensation etc.) (NB MAX 5 marks if no example) Level 3 (7 marks) Uses named example (e.g. Sahara desert). Comprehensive and accurate statements describing and explaining the main features of desert climates, including some place specific reference. (e.g. large diurnal range of temperature, dry climate due to long distance of deserts from Atlantic Ocean, absence of moderating influence of water body raises temperatures in summer months, NE trade winds blow over large areas of Asia before reaching the desert hence no source of moisture, high pressure results in descending air therefore no convection/condensation/explanation of Hadley Cell etc.) [7] [Total: 25] 5 (a) (i) Energy which can be used over and over again/will not run out 1 mark [1] (ii) Ideas such as: It will never run out; low running costs; low maintenance; environmentally friendly/does not pollute/‘green’/‘clean’ etc. 2 @ 1 mark [2] (iii) Hydro-electric power (HEP) = E Solar power = C Wind power = D 3 @ 1 mark [3] www.theallpapers.com
Mark scheme, page 11
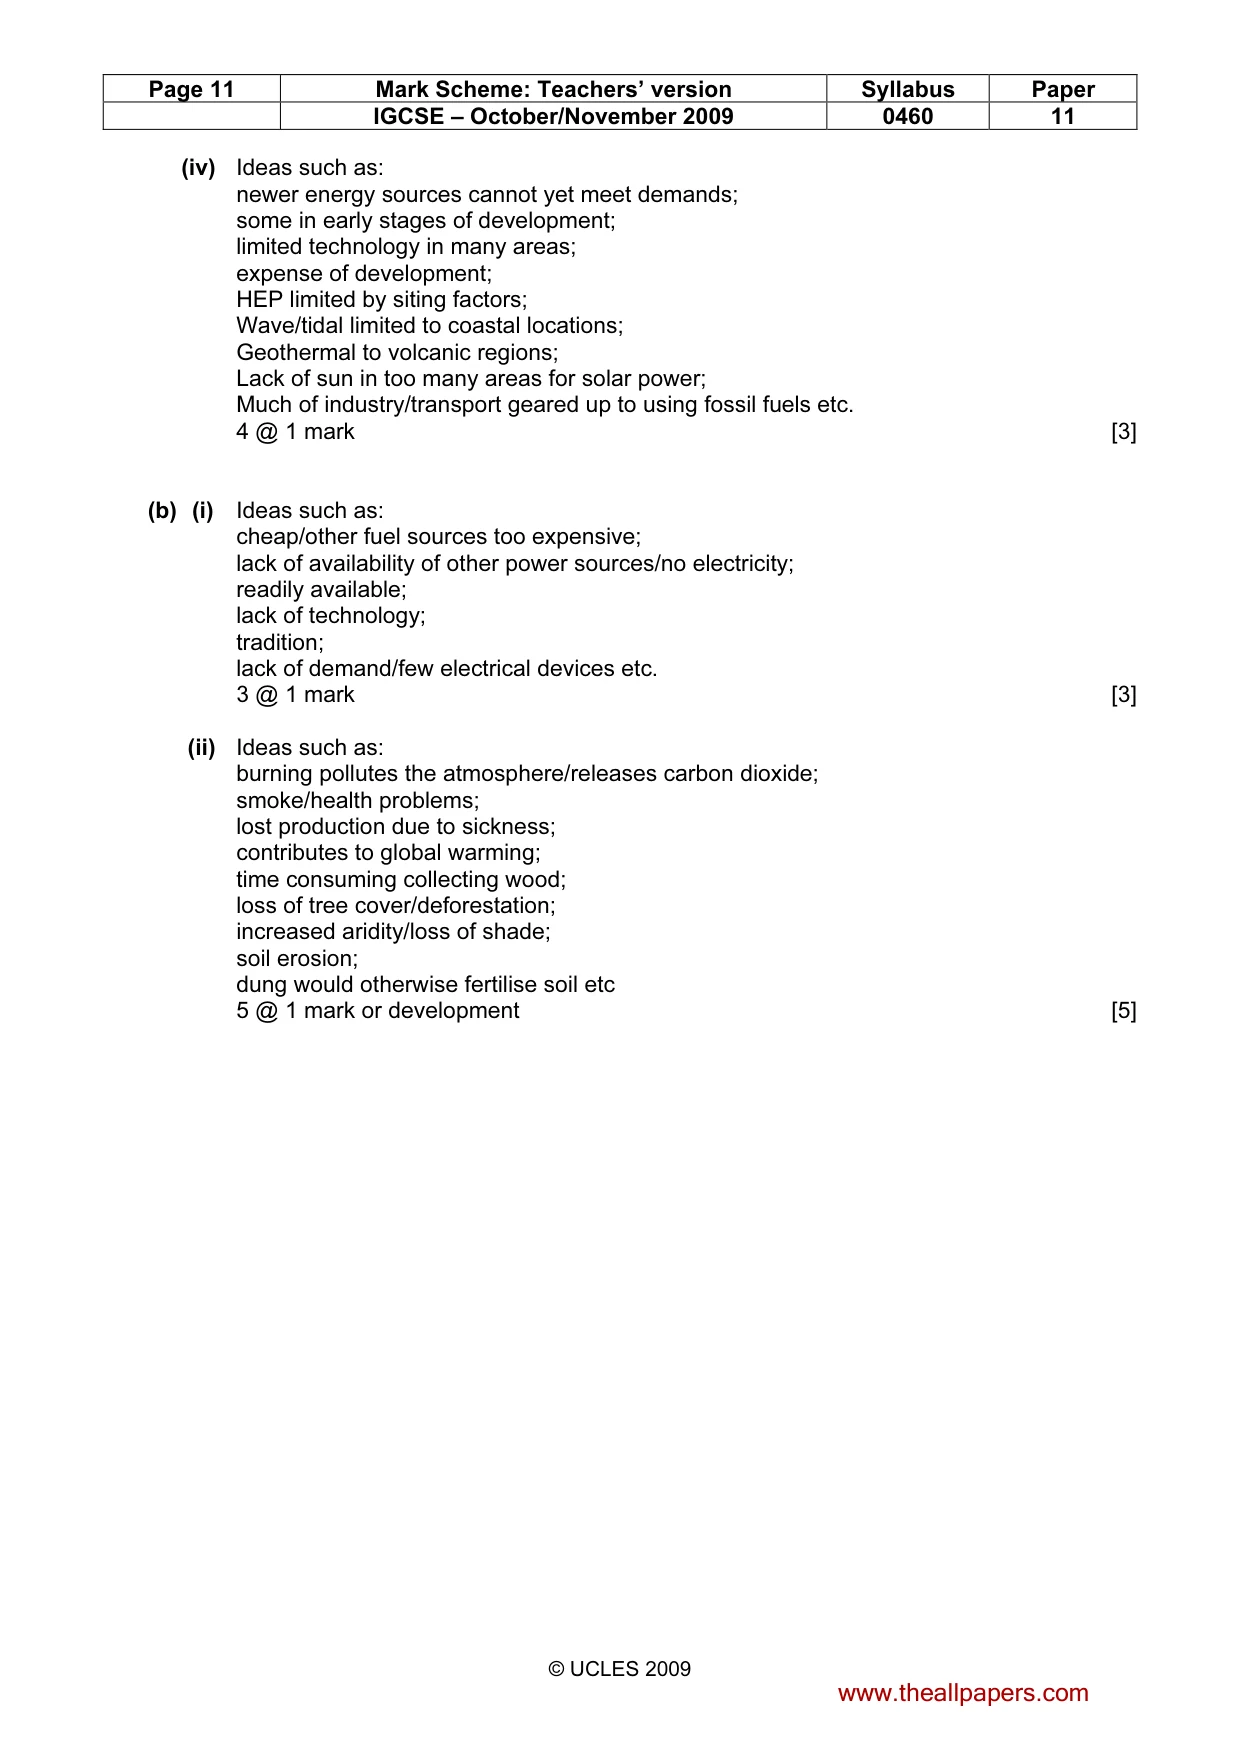
Page 11 Mark Scheme: Teachers’ version Syllabus Paper IGCSE – October/November 2009 0460 11 © UCLES 2009 (iv) Ideas such as: newer energy sources cannot yet meet demands; some in early stages of development; limited technology in many areas; expense of development; HEP limited by siting factors; Wave/tidal limited to coastal locations; Geothermal to volcanic regions; Lack of sun in too many areas for solar power; Much of industry/transport geared up to using fossil fuels etc. 4 @ 1 mark [3] (b) (i) Ideas such as: cheap/other fuel sources too expensive; lack of availability of other power sources/no electricity; readily available; lack of technology; tradition; lack of demand/few electrical devices etc. 3 @ 1 mark [3] (ii) Ideas such as: burning pollutes the atmosphere/releases carbon dioxide; smoke/health problems; lost production due to sickness; contributes to global warming; time consuming collecting wood; loss of tree cover/deforestation; increased aridity/loss of shade; soil erosion; dung would otherwise fertilise soil etc 5 @ 1 mark or development [5] www.theallpapers.com
Mark scheme, page 12
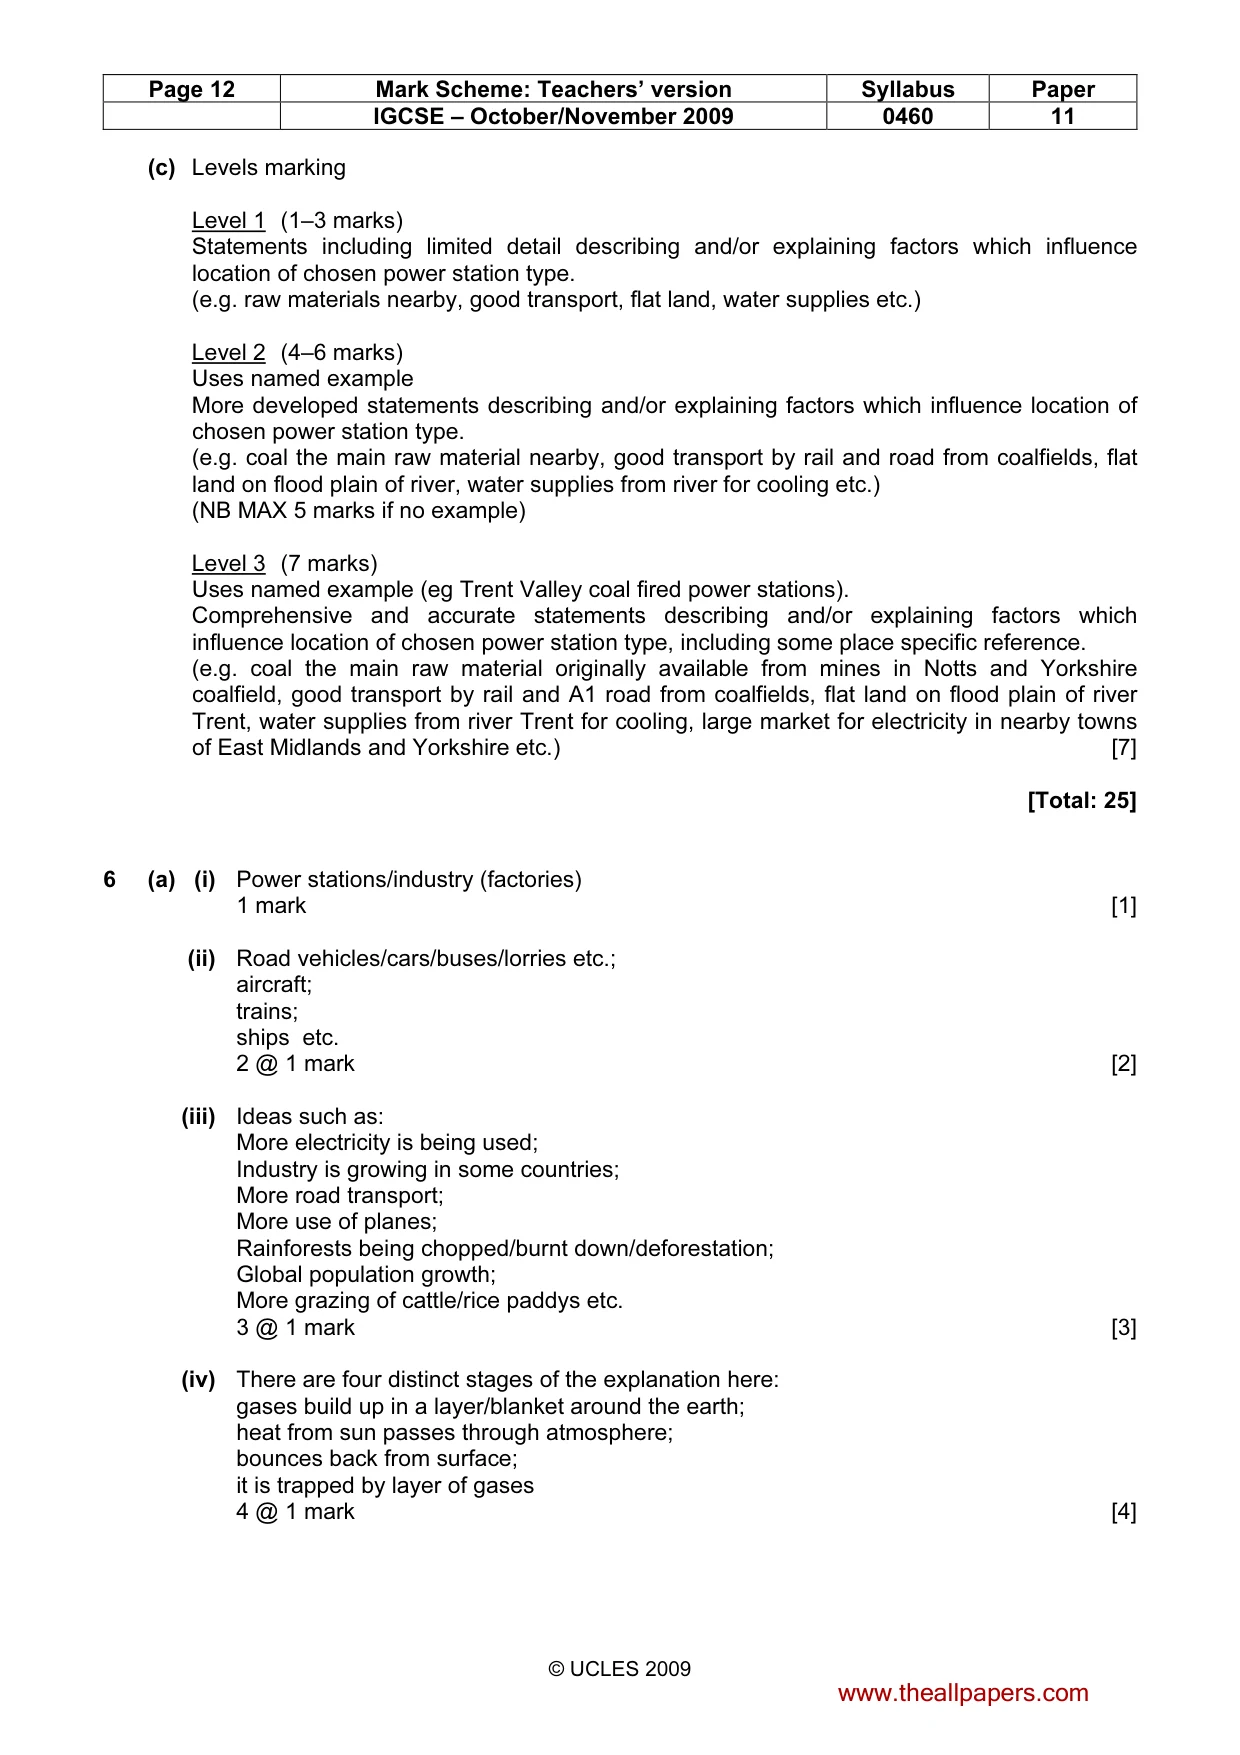
Page 12 Mark Scheme: Teachers’ version Syllabus Paper IGCSE – October/November 2009 0460 11 © UCLES 2009 (c) Levels marking Level 1 (1–3 marks) Statements including limited detail describing and/or explaining factors which influence location of chosen power station type. (e.g. raw materials nearby, good transport, flat land, water supplies etc.) Level 2 (4–6 marks) Uses named example More developed statements describing and/or explaining factors which influence location of chosen power station type. (e.g. coal the main raw material nearby, good transport by rail and road from coalfields, flat land on flood plain of river, water supplies from river for cooling etc.) (NB MAX 5 marks if no example) Level 3 (7 marks) Uses named example (eg Trent Valley coal fired power stations). Comprehensive and accurate statements describing and/or explaining factors which influence location of chosen power station type, including some place specific reference. (e.g. coal the main raw material originally available from mines in Notts and Yorkshire coalfield, good transport by rail and A1 road from coalfields, flat land on flood plain of river Trent, water supplies from river Trent for cooling, large market for electricity in nearby towns of East Midlands and Yorkshire etc.) [7] [Total: 25] 6 (a) (i) Power stations/industry (factories) 1 mark [1] (ii) Road vehicles/cars/buses/lorries etc.; aircraft; trains; ships etc. 2 @ 1 mark [2] (iii) Ideas such as: More electricity is being used; Industry is growing in some countries; More road transport; More use of planes; Rainforests being chopped/burnt down/deforestation; Global population growth; More grazing of cattle/rice paddys etc. 3 @ 1 mark [3] (iv) There are four distinct stages of the explanation here: gases build up in a layer/blanket around the earth; heat from sun passes through atmosphere; bounces back from surface; it is trapped by layer of gases 4 @ 1 mark [4] www.theallpapers.com
Mark scheme, page 13
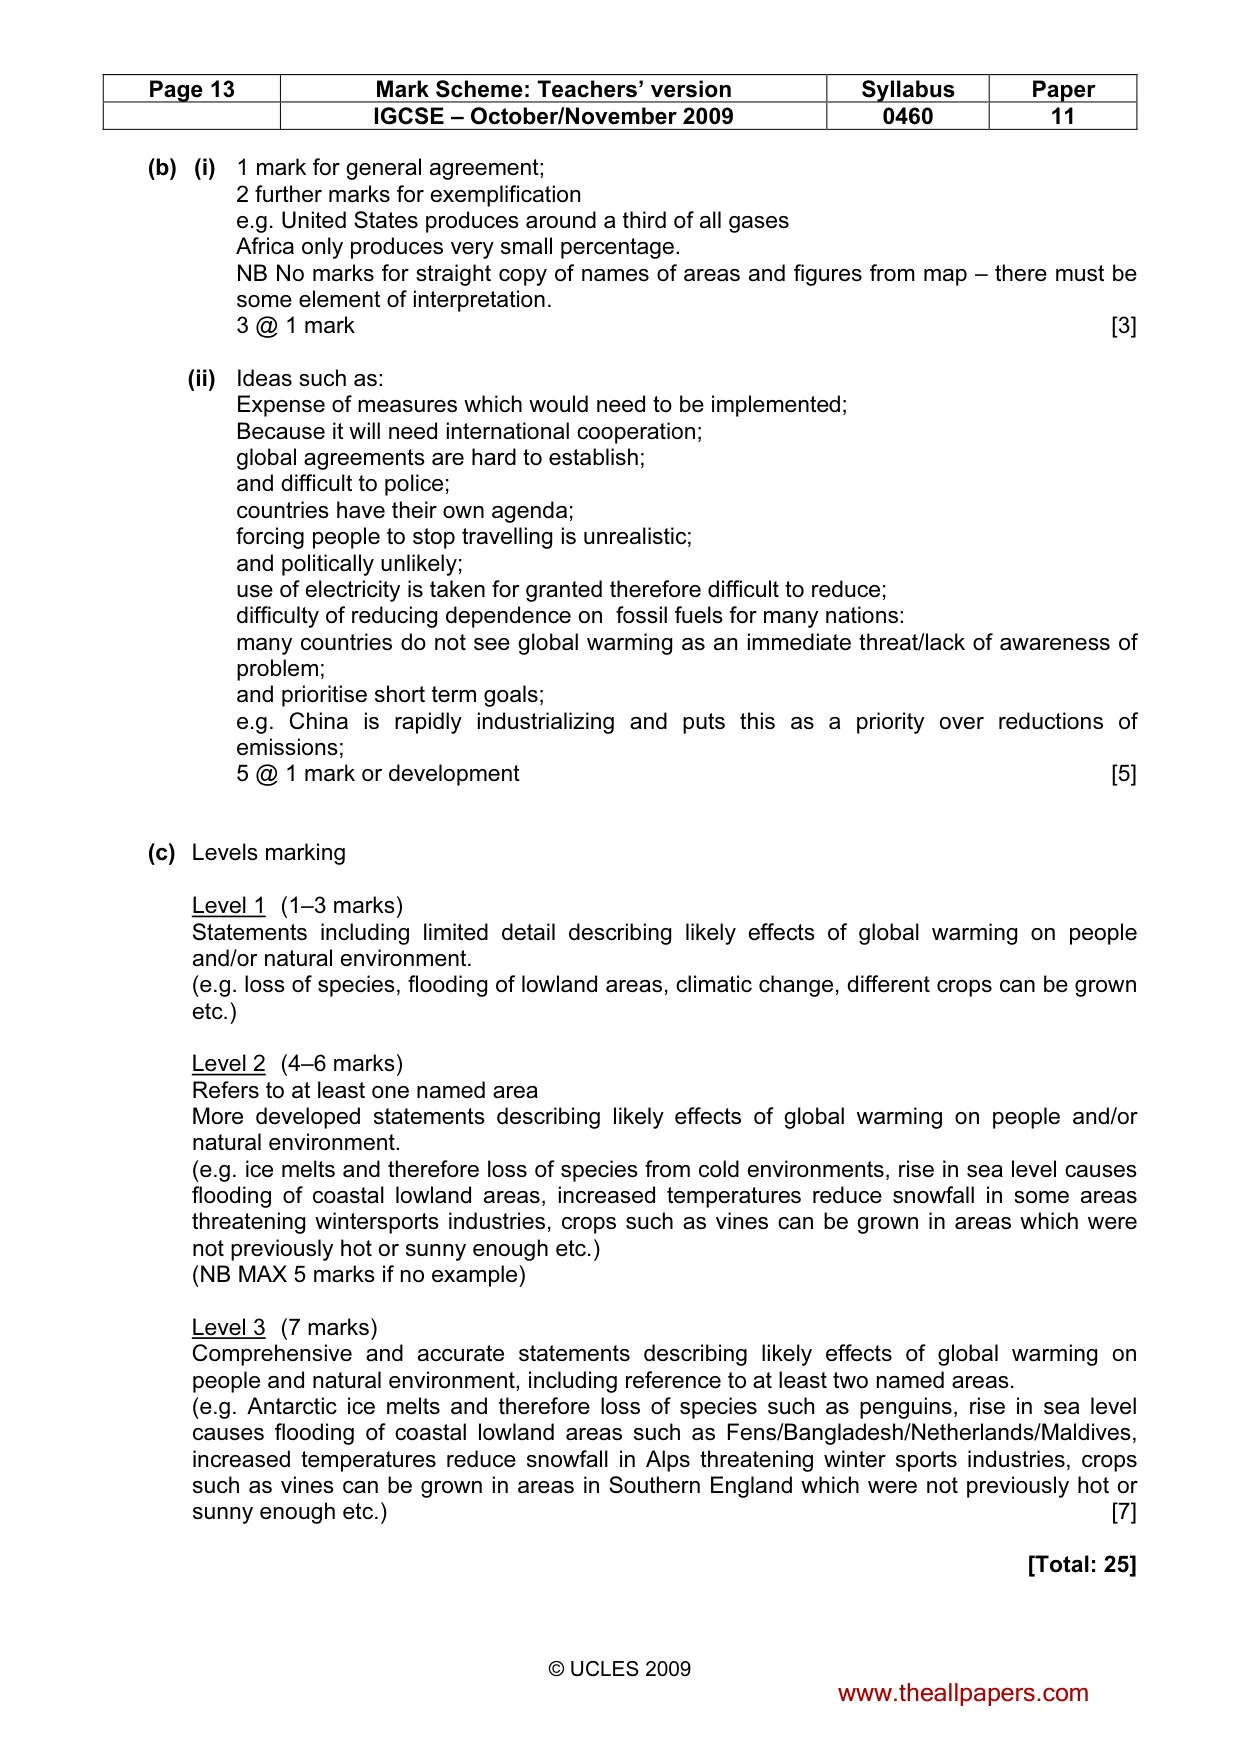
Page 13 Mark Scheme: Teachers’ version Syllabus Paper IGCSE – October/November 2009 0460 11 © UCLES 2009 (b) (i) 1 mark for general agreement; 2 further marks for exemplification e.g. United States produces around a third of all gases Africa only produces very small percentage. NB No marks for straight copy of names of areas and figures from map – there must be some element of interpretation. 3 @ 1 mark [3] (ii) Ideas such as: Expense of measures which would need to be implemented; Because it will need international cooperation; global agreements are hard to establish; and difficult to police; countries have their own agenda; forcing people to stop travelling is unrealistic; and politically unlikely; use of electricity is taken for granted therefore difficult to reduce; difficulty of reducing dependence on fossil fuels for many nations: many countries do not see global warming as an immediate threat/lack of awareness of problem; and prioritise short term goals; e.g. China is rapidly industrializing and puts this as a priority over reductions of emissions; 5 @ 1 mark or development [5] (c) Levels marking Level 1 (1–3 marks) Statements including limited detail describing likely effects of global warming on people and/or natural environment. (e.g. loss of species, flooding of lowland areas, climatic change, different crops can be grown etc.) Level 2 (4–6 marks) Refers to at least one named area More developed statements describing likely effects of global warming on people and/or natural environment. (e.g. ice melts and therefore loss of species from cold environments, rise in sea level causes flooding of coastal lowland areas, increased temperatures reduce snowfall in some areas threatening wintersports industries, crops such as vines can be grown in areas which were not previously hot or sunny enough etc.) (NB MAX 5 marks if no example) Level 3 (7 marks) Comprehensive and accurate statements describing likely effects of global warming on people and natural environment, including reference to at least two named areas. (e.g. Antarctic ice melts and therefore loss of species such as penguins, rise in sea level causes flooding of coastal lowland areas such as Fens/Bangladesh/Netherlands/Maldives, increased temperatures reduce snowfall in Alps threatening winter sports industries, crops such as vines can be grown in areas in Southern England which were not previously hot or sunny enough etc.) [7] [Total: 25] www.theallpapers.com
What you needed in this session
Cambridge’s own grade thresholds for 2009 Oct/Nov, Paper 1 · Variant 1. A higher threshold means an easier paper — the bar moves with how the cohort did.