Cambridge IGCSE Geography 0460 — 2009 Oct/Nov Paper 1 · Variant 2
0460/12/O/N/09 · 75 marks · ≈84 min
The question paper and its mark scheme, free to read here and free to download. This is Cambridge’s own paper, exactly as it was sat.
Question paper16 pages



Mark scheme12 pages
Answers below. Sit the paper first if you are practising.
Paper as text
Question paper, page 1
This document consists of 13 printed pages and 3 blank pages and 1 Insert. DC (NF/CGW) 11733/8 © UCLES 2009 [Turn over UNIVERSITY OF CAMBRIDGE INTERNATIONAL EXAMINATIONS International General Certificate of Secondary Education READ THESE INSTRUCTIONS FIRST If you have been given an Answer Booklet, follow the instructions on the front cover of the Booklet. Write your Centre number, candidate number and name on all the work you hand in. Write in dark blue or black pen. You may use a soft pencil for any diagrams, graphs, or rough working. Do not use staples, paper clips, highlighters, glue or correction fluid. Answer three questions. Sketch maps and diagrams should be drawn whenever they serve to illustrate an answer. The Insert contains Photographs A, B and C for Question 2 and Photographs D, E and F for Question 5. At the end of the examination, fasten all your work securely together. The number of marks is given in brackets [ ] at the end of each question or part question. * 6 3 9 8 7 1 2 8 8 9 * GEOGRAPHY 0460/12 Paper 1 October/November 2009 1 hour 45 minutes Additional Materials: Answer Booklet/Paper www.theallpapers.com
Question paper, page 2
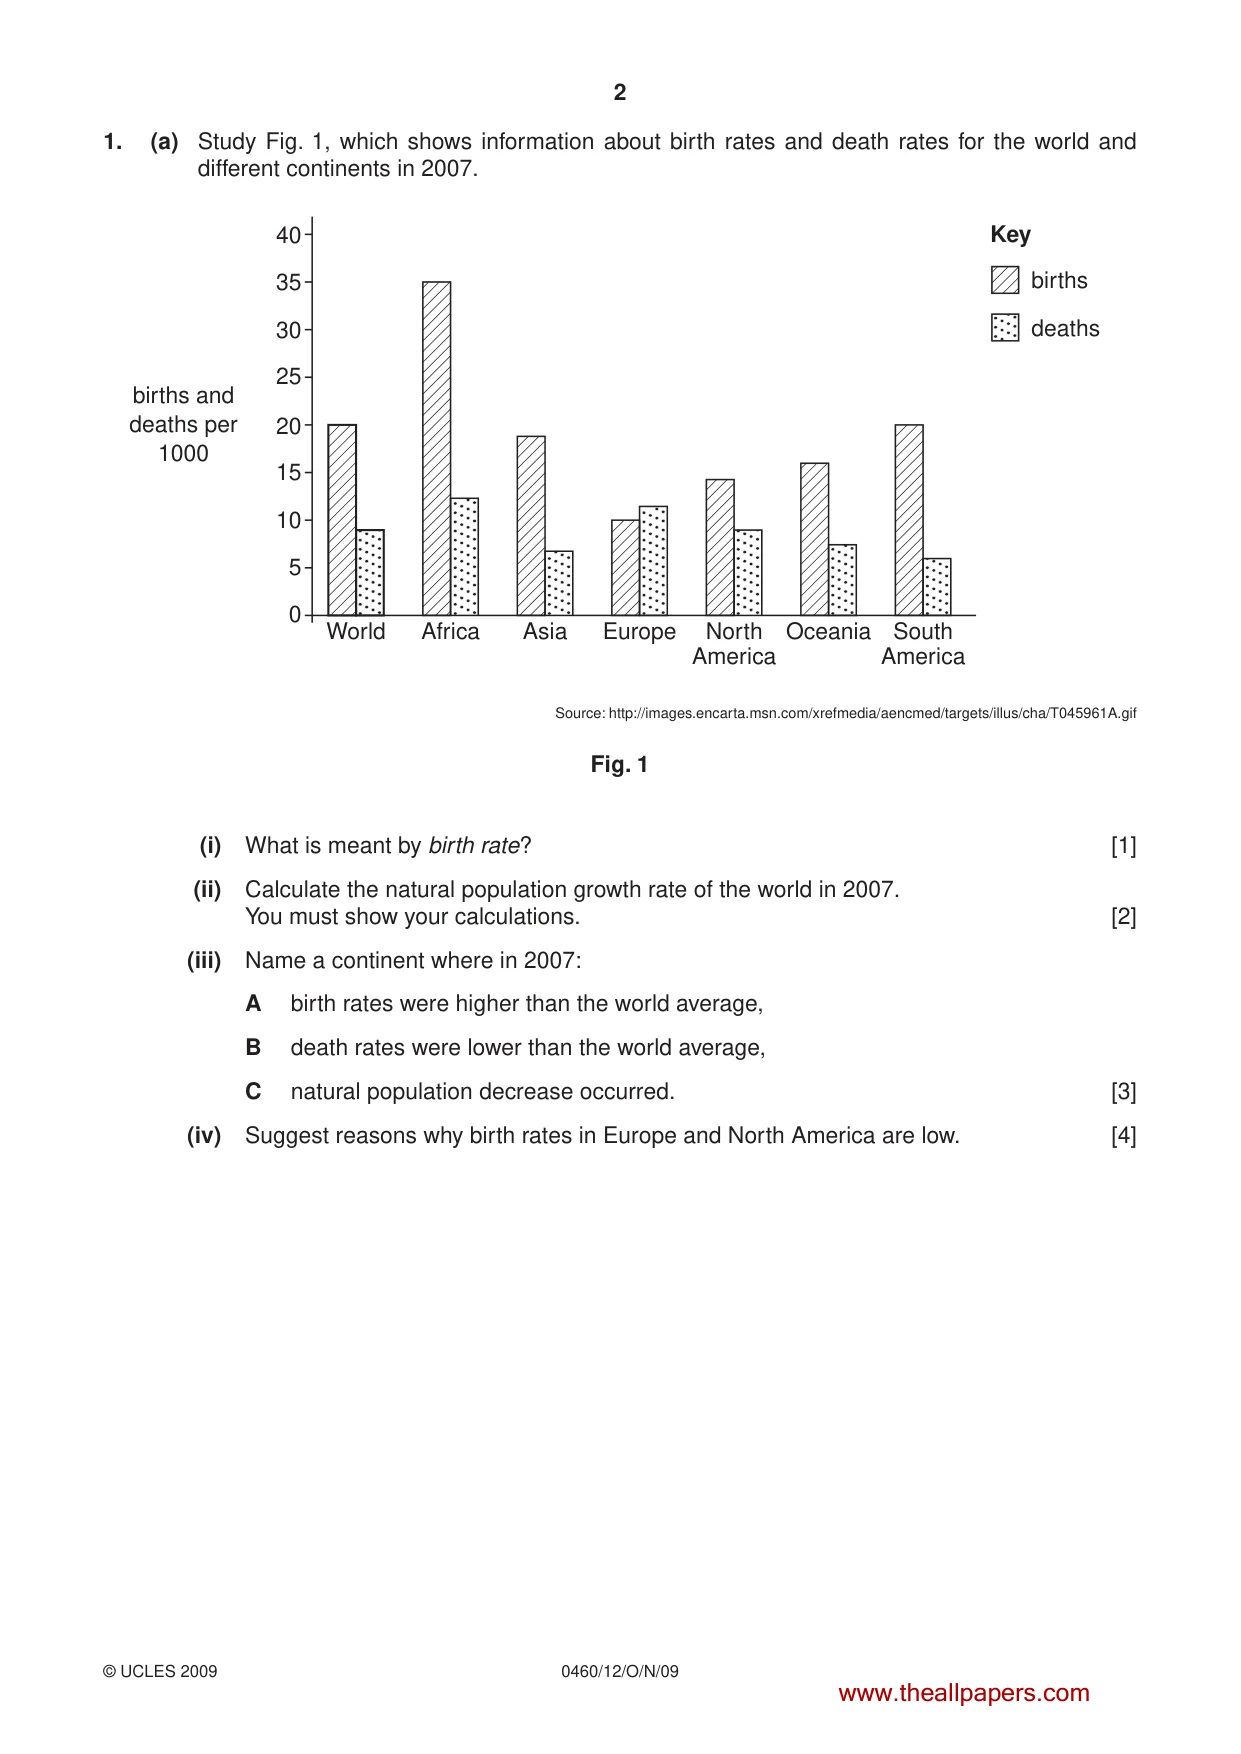
2 0460/12/O/N/09 © UCLES 2009 1. (a) Study Fig. 1, which shows information about birth rates and death rates for the world and different continents in 2007. 40 35 30 25 World Africa Asia births Key deaths North America South America births and deaths per 1000 20 15 10 0 5 Europe Oceania Source: http://images.encarta.msn.com/xrefmedia/aencmed/targets/illus/cha/T045961A.gif Fig. 1 (i) What is meant by birth rate? [1] (ii) Calculate the natural population growth rate of the world in 2007. You must show your calculations. [2] (iii) Name a continent where in 2007: A birth rates were higher than the world average, B death rates were lower than the world average, C natural population decrease occurred. [3] (iv) Suggest reasons why birth rates in Europe and North America are low. [4] www.theallpapers.com
Question paper, page 3
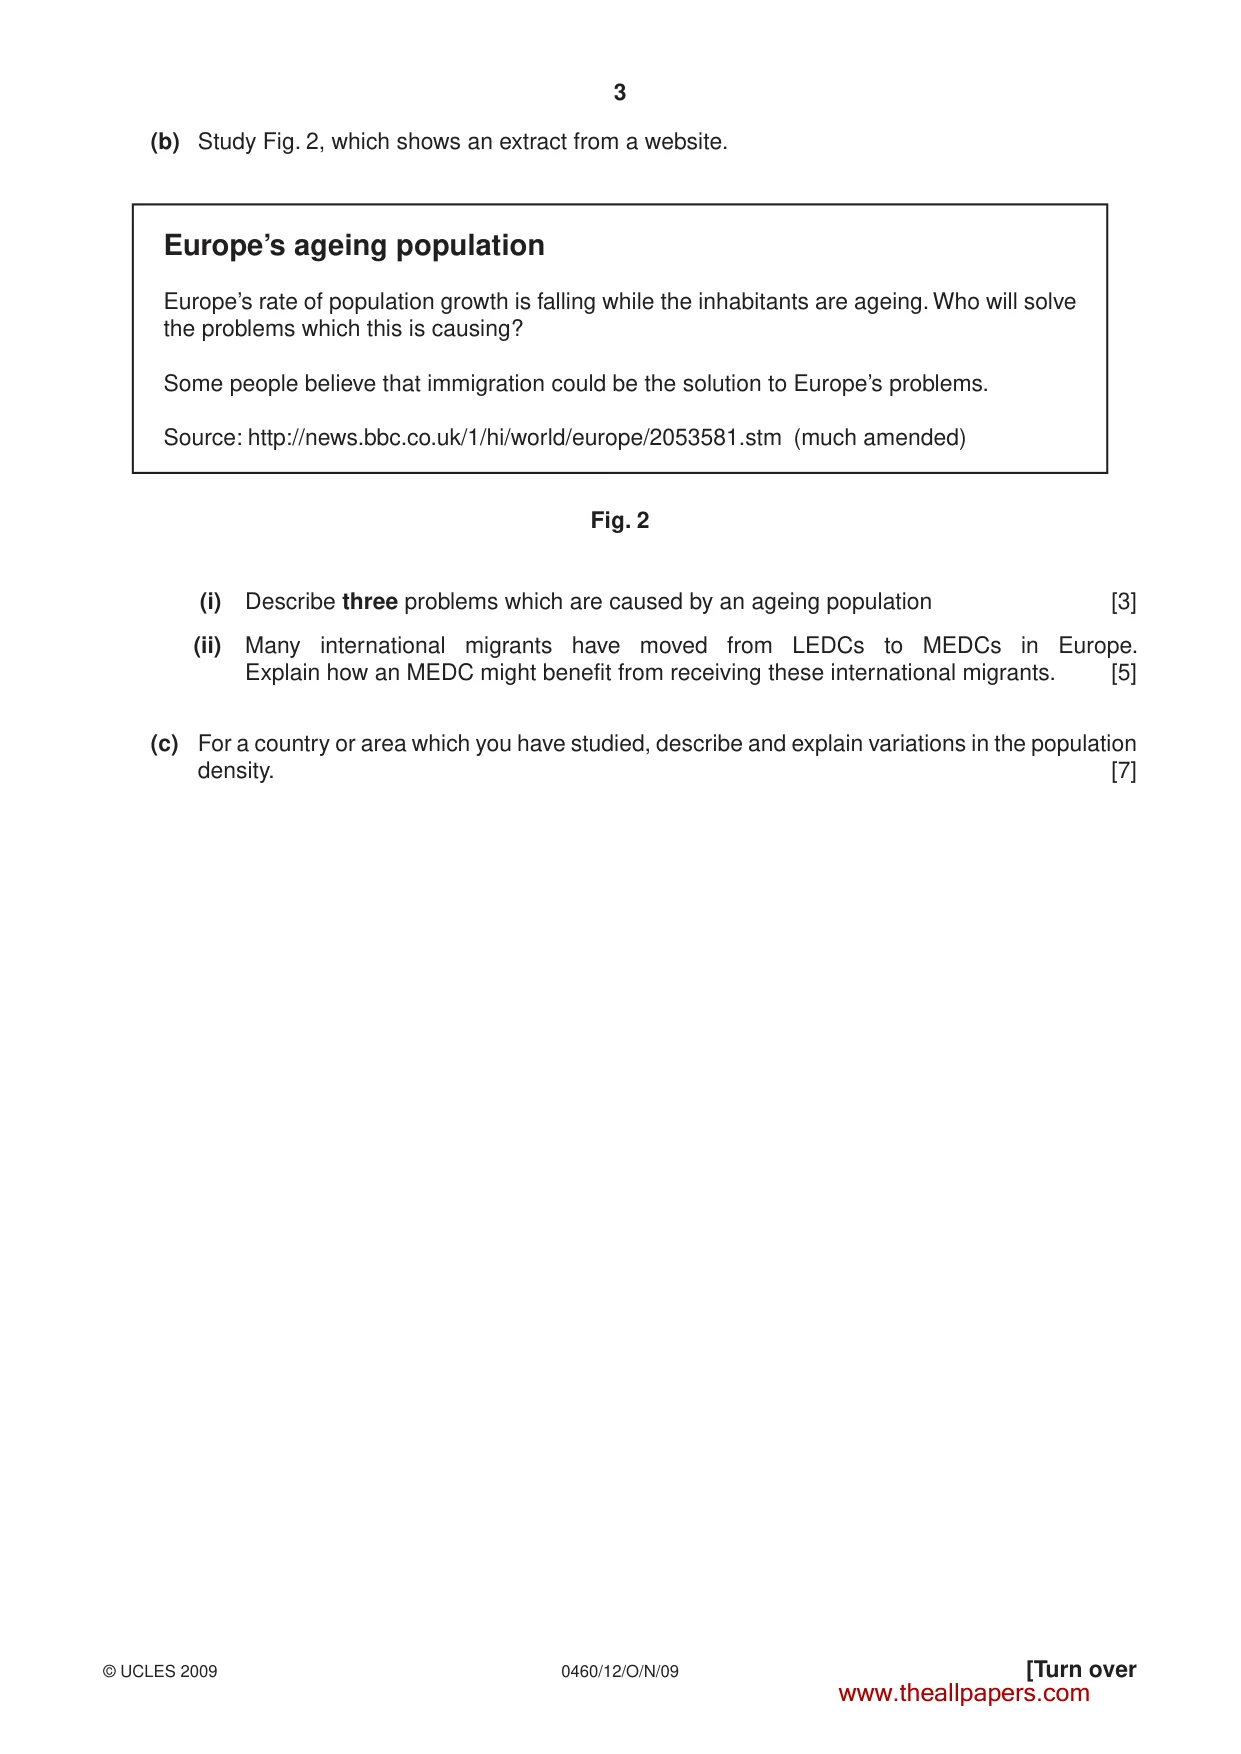
3 0460/12/O/N/09 © UCLES 2009 [Turn over (b) Study Fig. 2, which shows an extract from a website. Europe’s ageing population Europe’s rate of population growth is falling while the inhabitants are ageing. Who will solve the problems which this is causing? Some people believe that immigration could be the solution to Europe’s problems. Source: http://news.bbc.co.uk/1/hi/world/europe/2053581.stm (much amended) Fig. 2 (i) Describe three problems which are caused by an ageing population [3] (ii) Many international migrants have moved from LEDCs to MEDCs in Europe. Explain how an MEDC might benefit from receiving these international migrants. [5] (c) For a country or area which you have studied, describe and explain variations in the population density. [7] www.theallpapers.com
Question paper, page 4
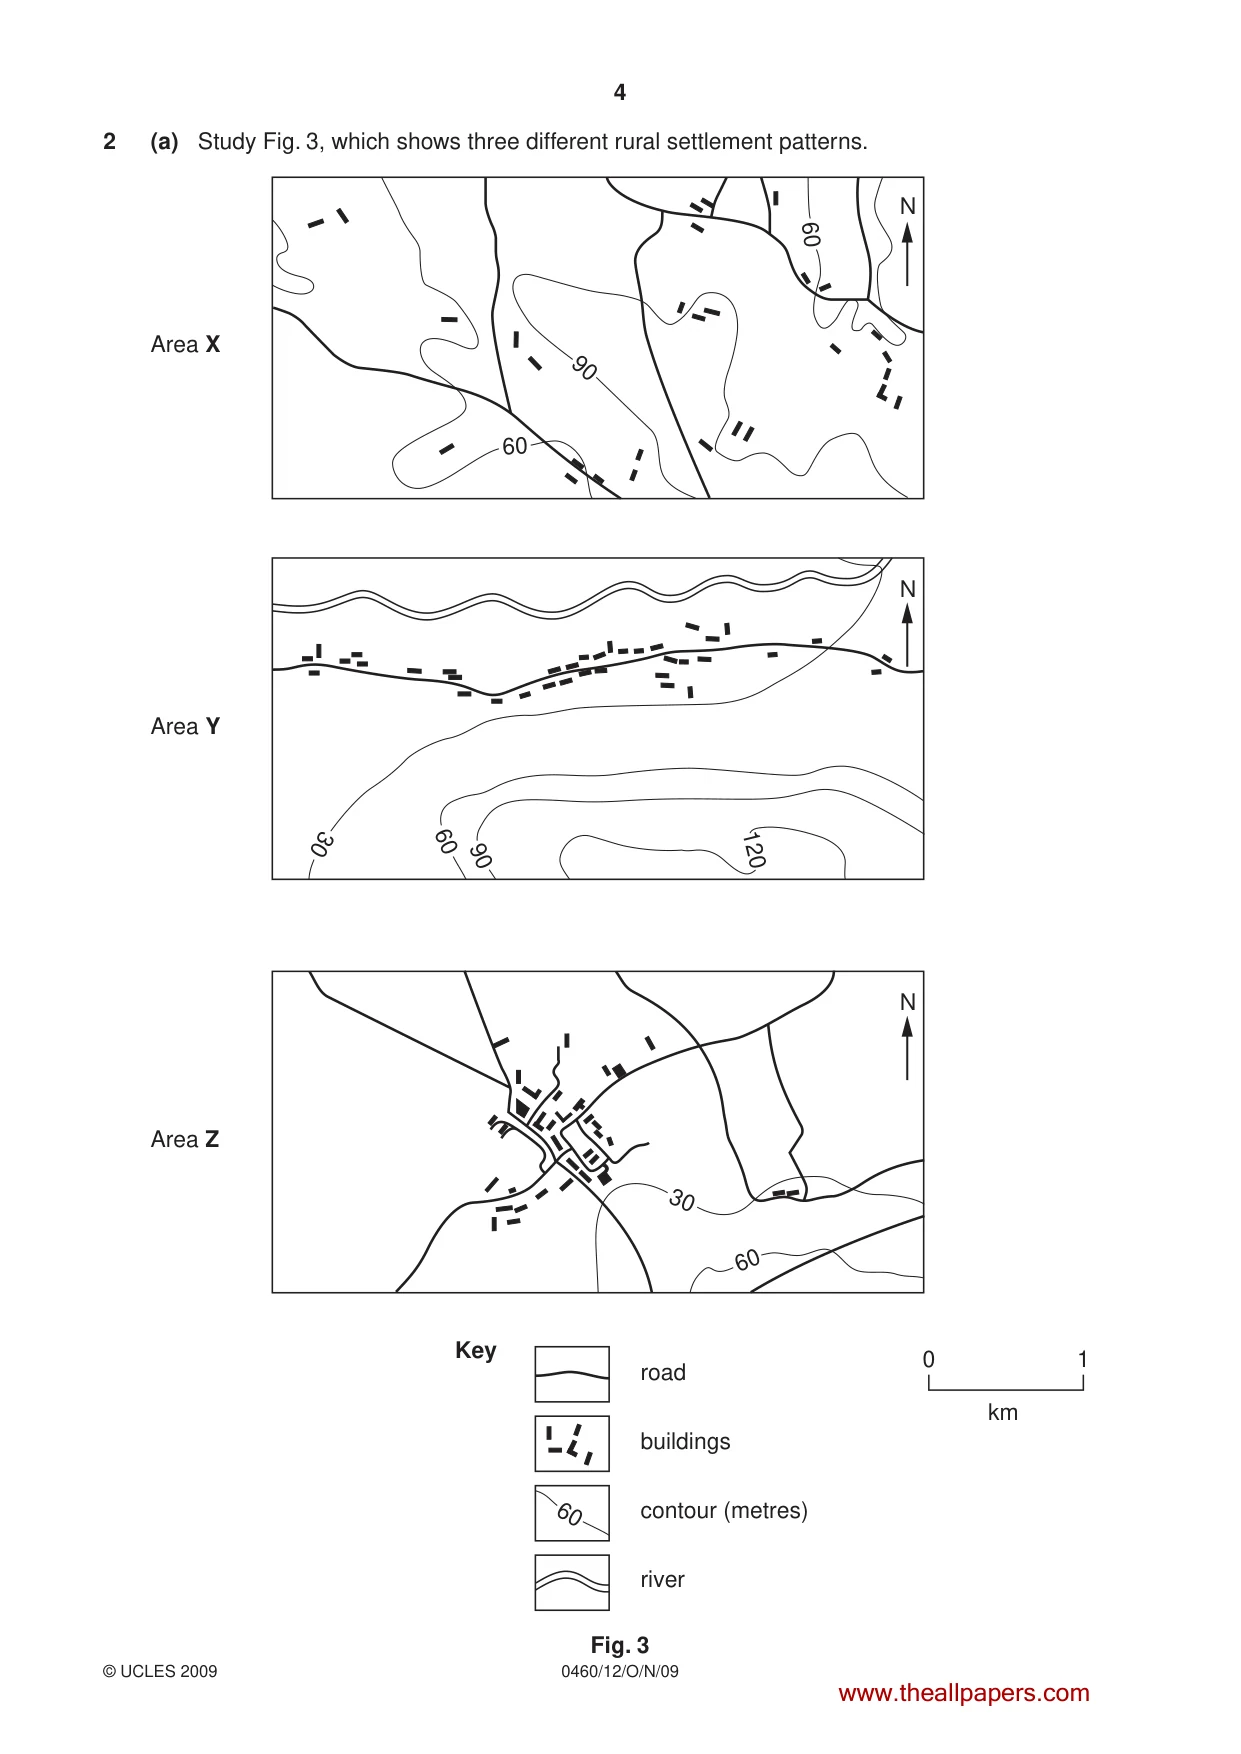
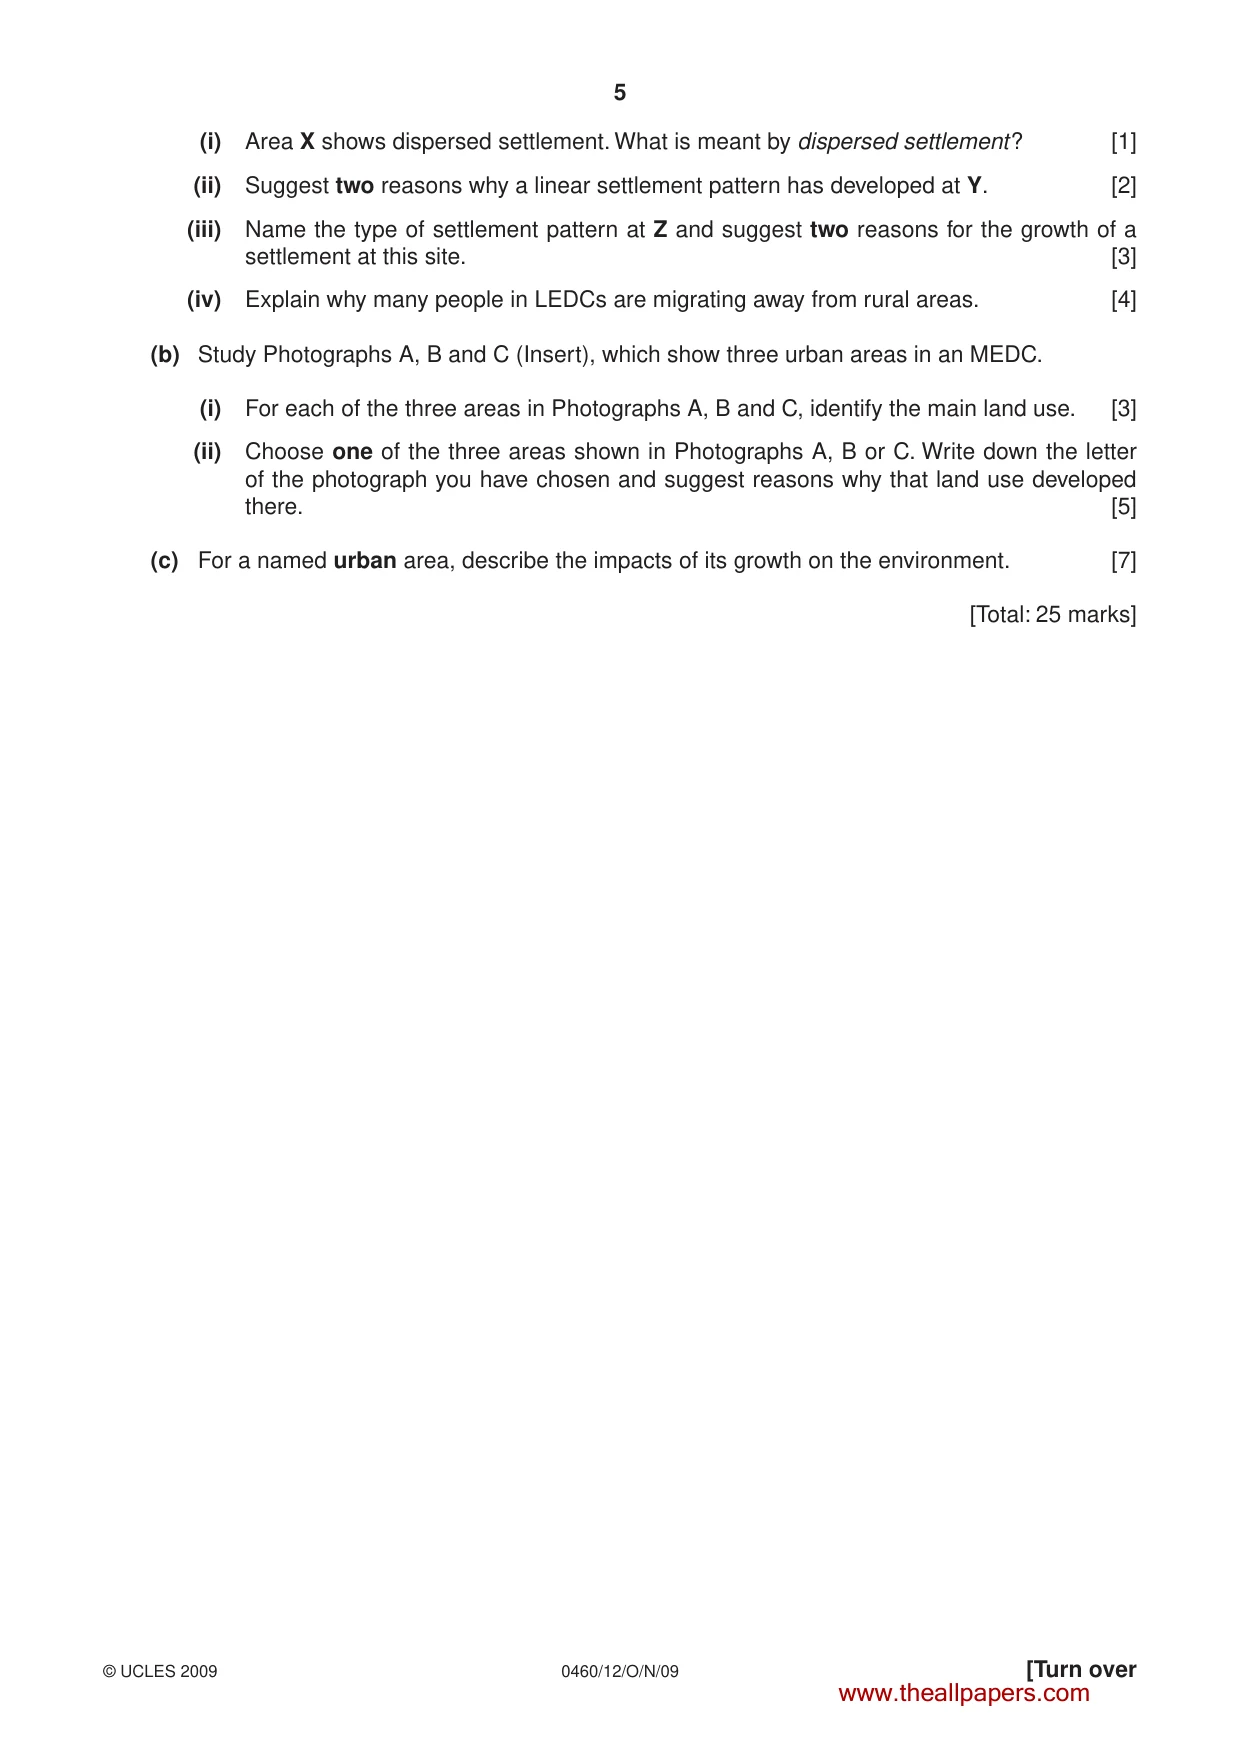
4 0460/12/O/N/09 © UCLES 2009 2 (a) Study Fig. 3, which shows three different rural settlement patterns. Area X 90 30 60 60 90 120 60 60 Area Y Area Z road Key 0 km 1 buildings contour (metres) river N 60 30 N N Fig. 3 www.theallpapers.com
Question paper, page 5
5 0460/12/O/N/09 © UCLES 2009 [Turn over (i) Area X shows dispersed settlement. What is meant by dispersed settlement? [1] (ii) Suggest two reasons why a linear settlement pattern has developed at Y. [2] (iii) Name the type of settlement pattern at Z and suggest two reasons for the growth of a settlement at this site. [3] (iv) Explain why many people in LEDCs are migrating away from rural areas. [4] (b) Study Photographs A, B and C (Insert), which show three urban areas in an MEDC. (i) For each of the three areas in Photographs A, B and C, identify the main land use. [3] (ii) Choose one of the three areas shown in Photographs A, B or C. Write down the letter of the photograph you have chosen and suggest reasons why that land use developed there. [5] (c) For a named urban area, describe the impacts of its growth on the environment. [7] [Total: 25 marks] www.theallpapers.com
Question paper, page 6
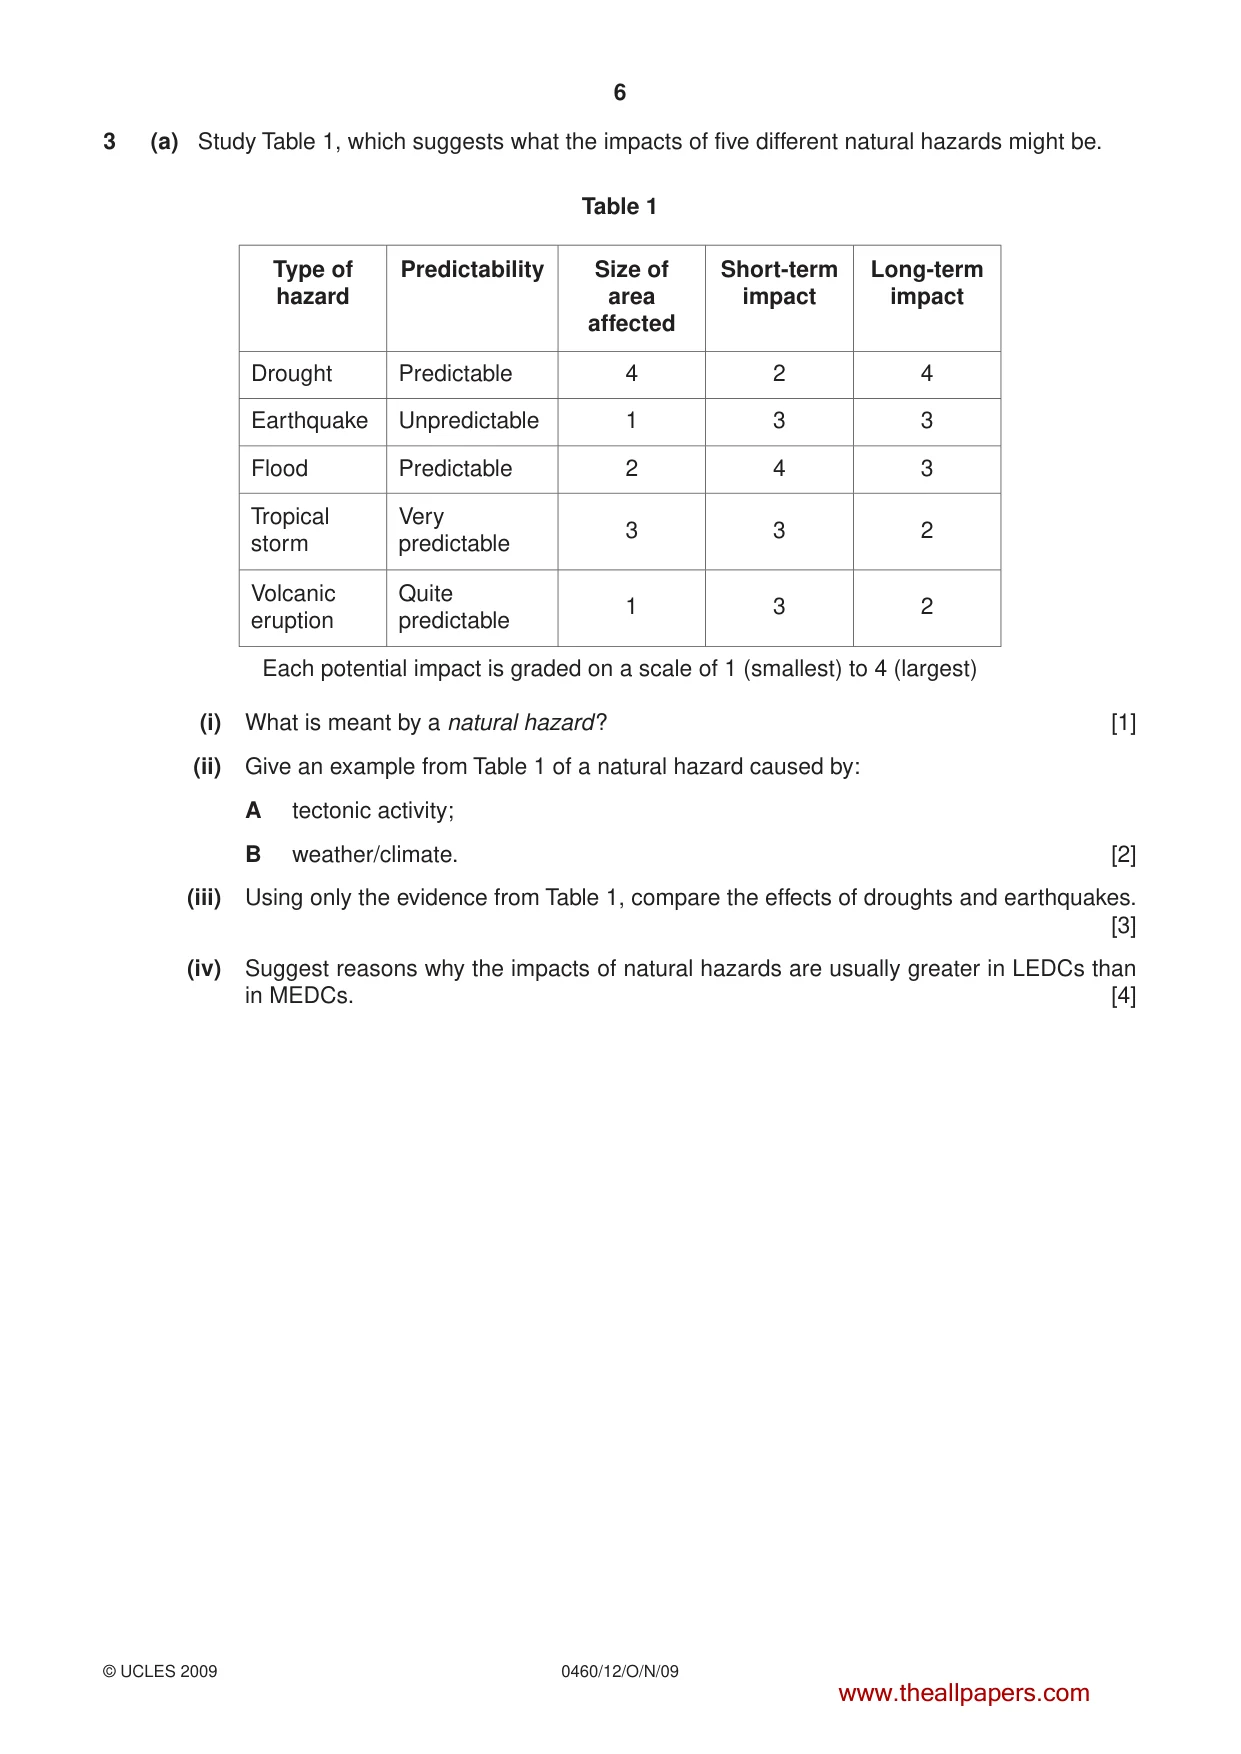
6 0460/12/O/N/09 © UCLES 2009 3 (a) Study Table 1, which suggests what the impacts of five different natural hazards might be. Table 1 Type of hazard Predictability Size of area affected Short-term impact Long-term impact Drought Predictable 4 2 4 Earthquake Unpredictable 1 3 3 Flood Predictable 2 4 3 Tropical storm Very predictable 3 3 2 Volcanic eruption Quite predictable 1 3 2 Each potential impact is graded on a scale of 1 (smallest) to 4 (largest) (i) What is meant by a natural hazard? [1] (ii) Give an example from Table 1 of a natural hazard caused by: A tectonic activity; B weather/climate. [2] (iii) Using only the evidence from Table 1, compare the effects of droughts and earthquakes. [3] (iv) Suggest reasons why the impacts of natural hazards are usually greater in LEDCs than in MEDCs. [4] www.theallpapers.com
Question paper, page 7
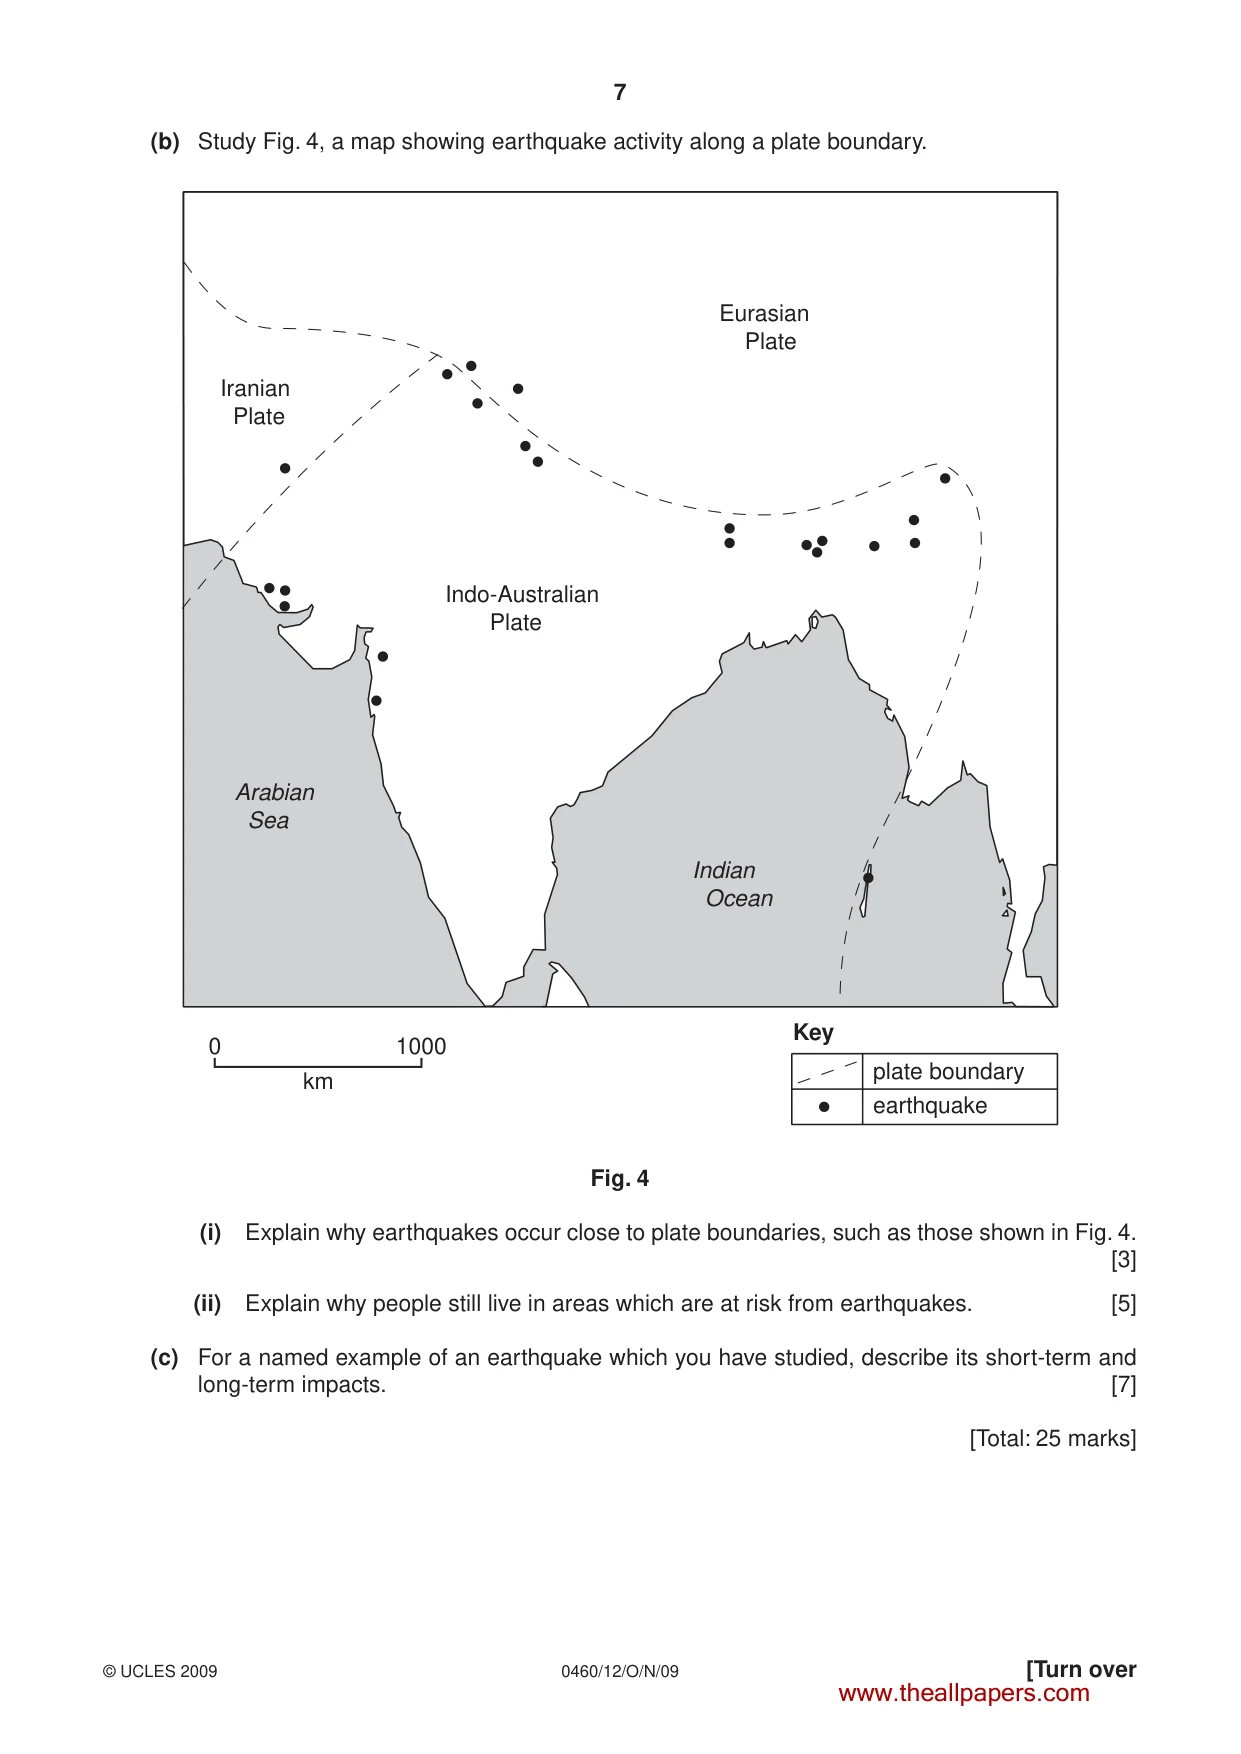
7 0460/12/O/N/09 © UCLES 2009 [Turn over (b) Study Fig. 4, a map showing earthquake activity along a plate boundary. Arabian Sea Indian Ocean Eurasian Plate Indo-Australian Plate 0 1000 km Iranian Plate plate boundary Key earthquake Fig. 4 (i) Explain why earthquakes occur close to plate boundaries, such as those shown in Fig. 4. [3] (ii) Explain why people still live in areas which are at risk from earthquakes. [5] (c) For a named example of an earthquake which you have studied, describe its short-term and long-term impacts. [7] [Total: 25 marks] www.theallpapers.com
Question paper, page 8
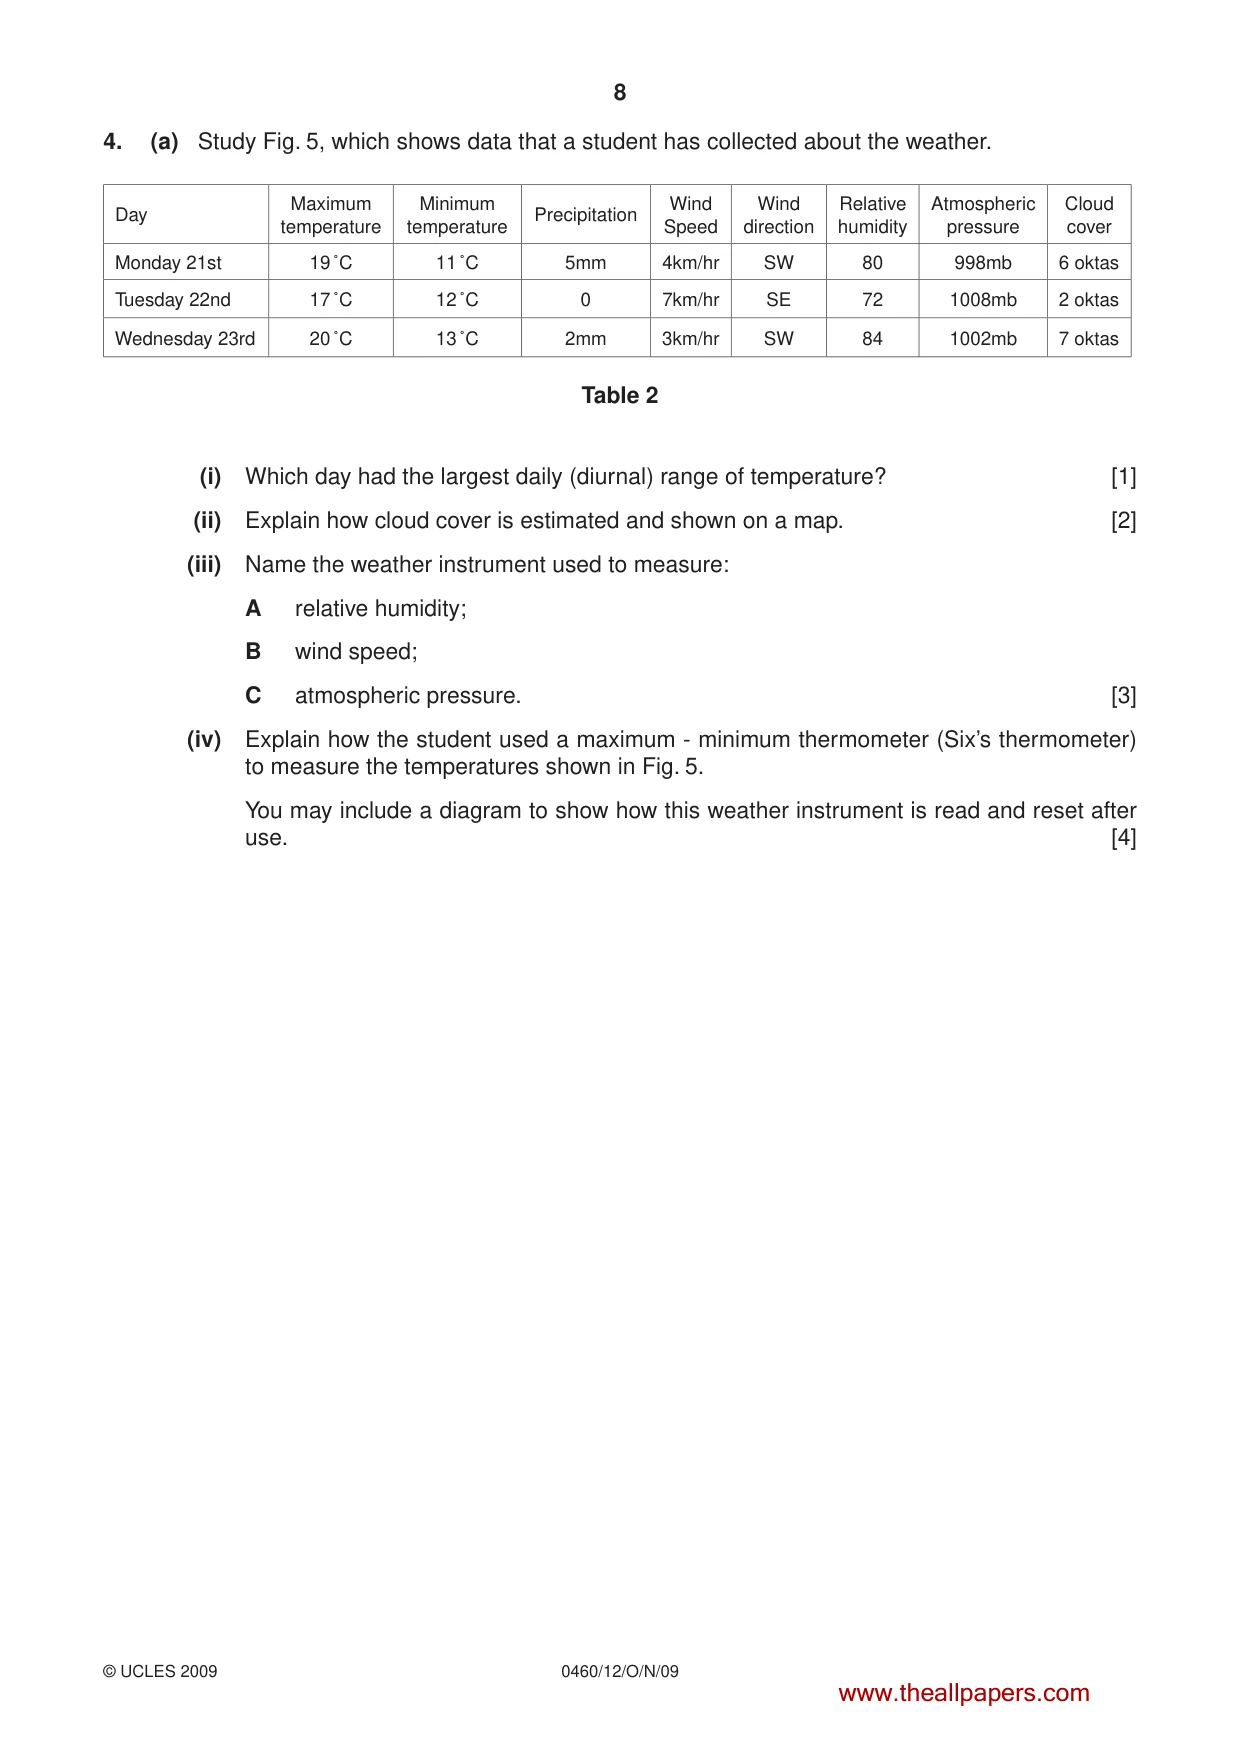
8 0460/12/O/N/09 © UCLES 2009 4. (a) Study Fig. 5, which shows data that a student has collected about the weather. Day Maximum temperature Minimum temperature Precipitation Wind Speed Wind direction Relative humidity Atmospheric pressure Cloud cover Monday 21st 19 ˚C 11 ˚C 5mm 4km/hr SW 80 998mb 6 oktas Tuesday 22nd 17 ˚C 12 ˚C 0 7km/hr SE 72 1008mb 2 oktas Wednesday 23rd 20 ˚C 13 ˚C 2mm 3km/hr SW 84 1002mb 7 oktas Table 2 (i) Which day had the largest daily (diurnal) range of temperature? [1] (ii) Explain how cloud cover is estimated and shown on a map. [2] (iii) Name the weather instrument used to measure: A relative humidity; B wind speed; C atmospheric pressure. [3] (iv) Explain how the student used a maximum - minimum thermometer (Six’s thermometer) to measure the temperatures shown in Fig. 5. You may include a diagram to show how this weather instrument is read and reset after use. [4] www.theallpapers.com
Question paper, page 9
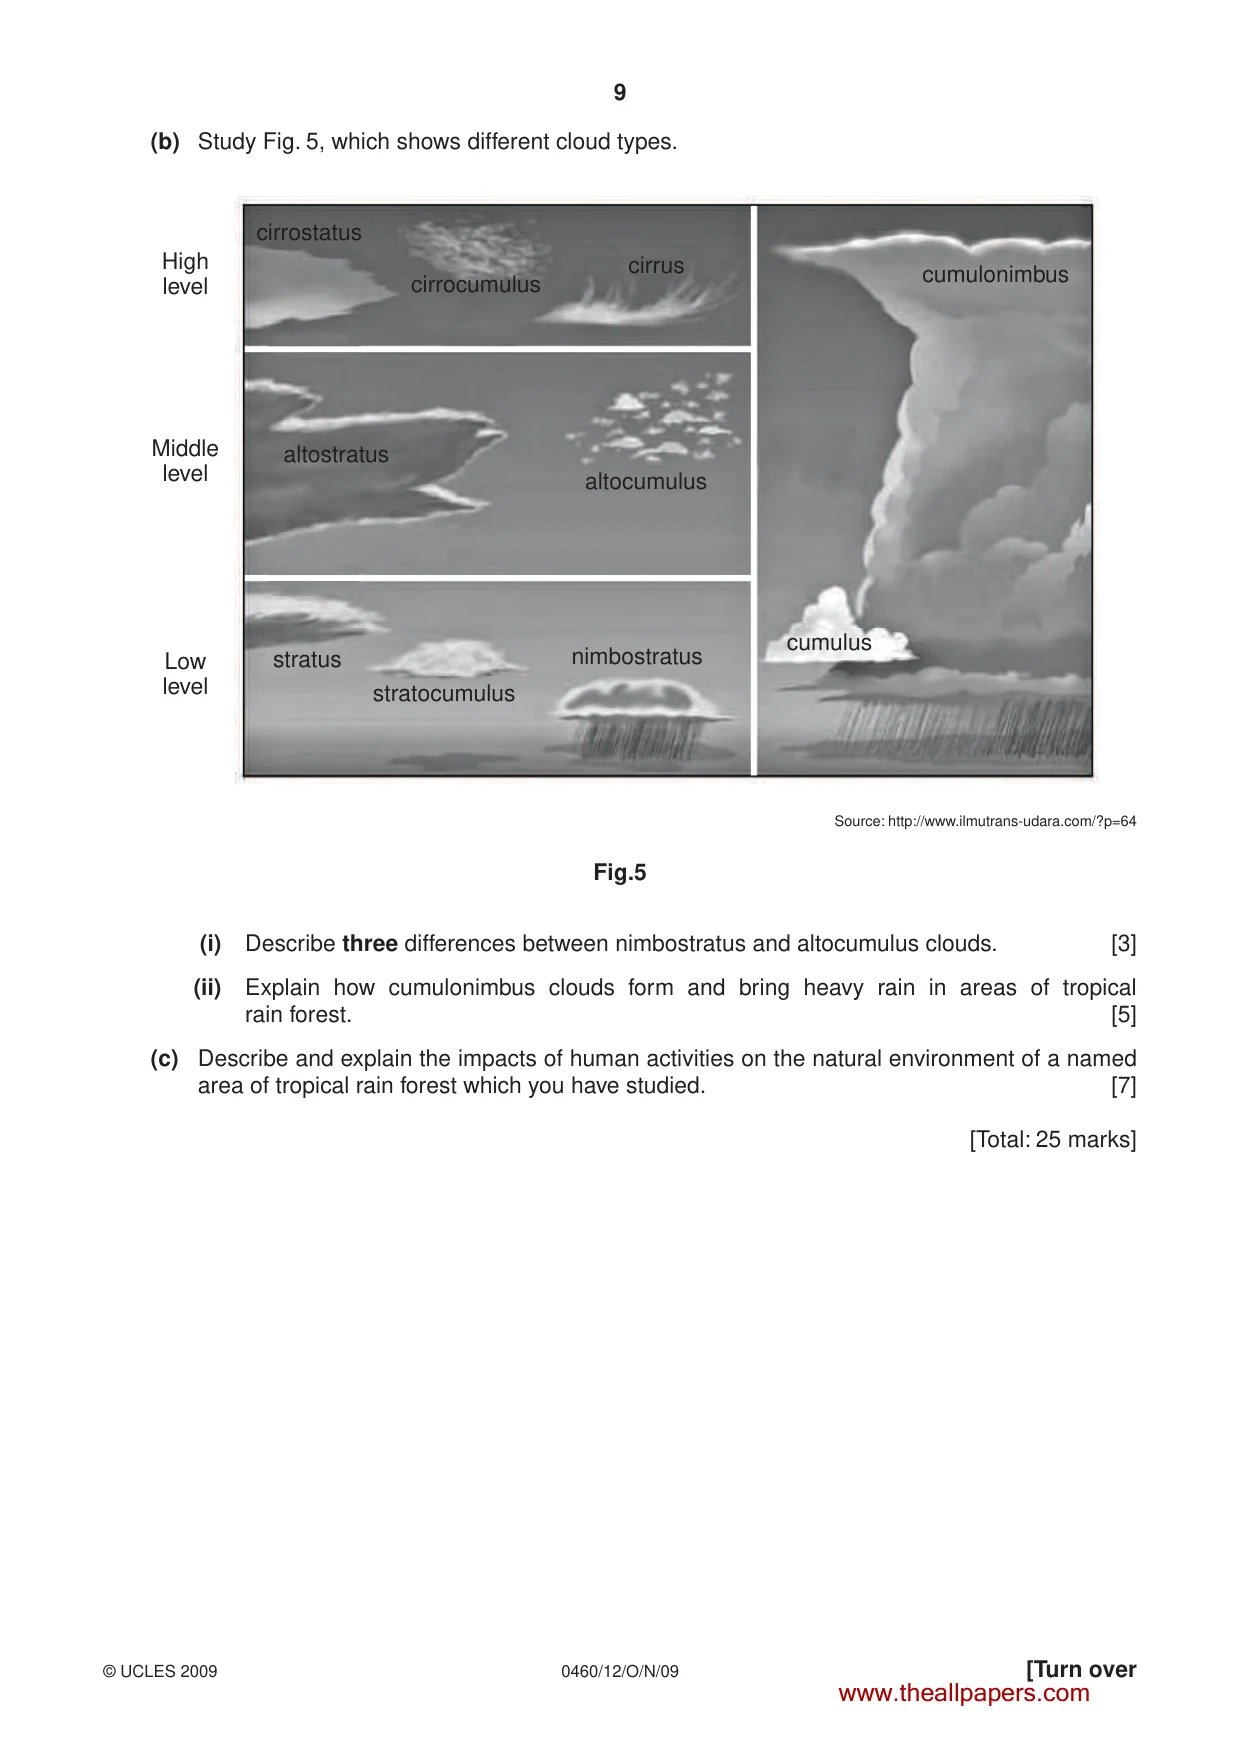
9 0460/12/O/N/09 © UCLES 2009 [Turn over (b) Study Fig. 5, which shows different cloud types. High level Middle level cumulus nimbostratus stratocumulus stratus altostratus altocumulus cirrus cirrocumulus cirrostatus cumulonimbus Low level Source: http://www.ilmutrans-udara.com/?p=64 Fig.5 (i) Describe three differences between nimbostratus and altocumulus clouds. [3] (ii) Explain how cumulonimbus clouds form and bring heavy rain in areas of tropical rain forest. [5] (c) Describe and explain the impacts of human activities on the natural environment of a named area of tropical rain forest which you have studied. [7] [Total: 25 marks] www.theallpapers.com
Question paper, page 10
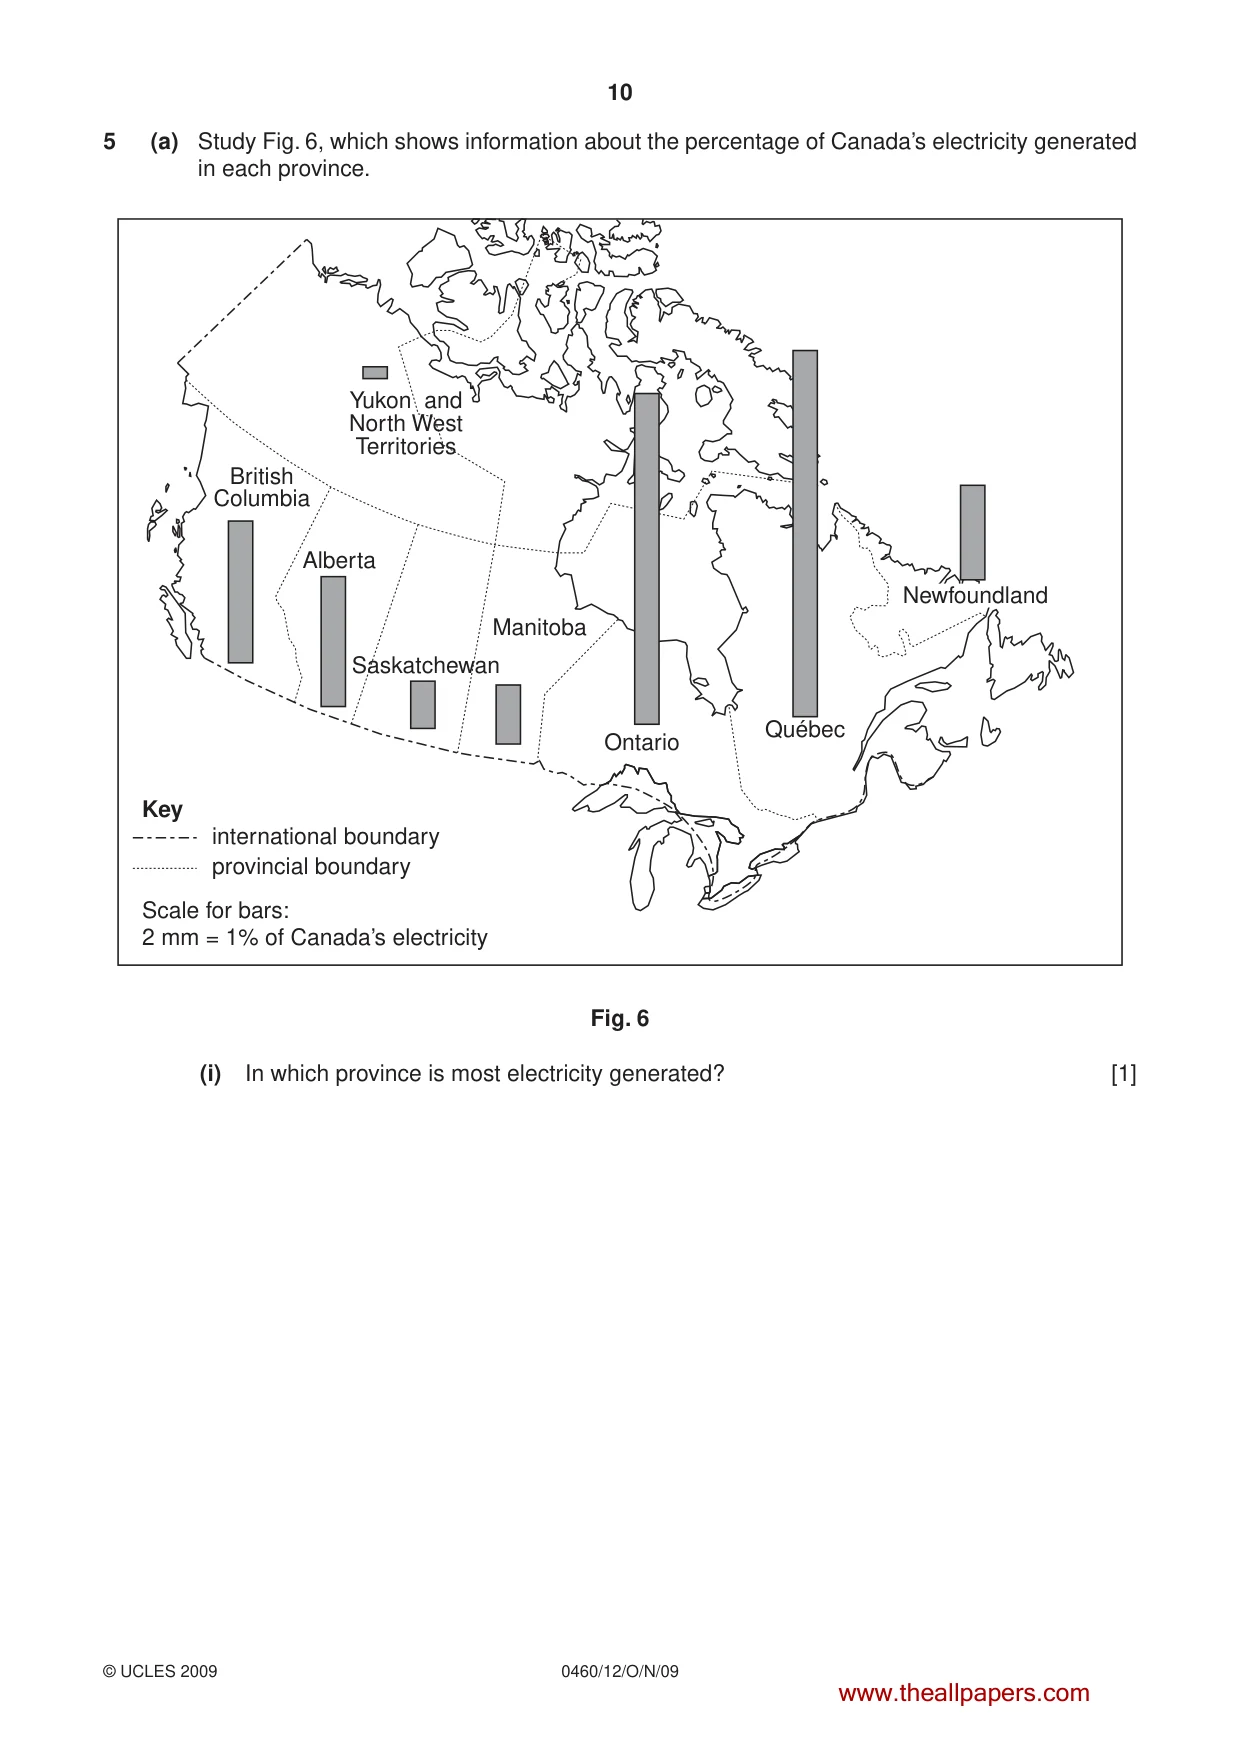
10 0460/12/O/N/09 © UCLES 2009 5 (a) Study Fig. 6, which shows information about the percentage of Canada’s electricity generated in each province. Yukon and North West Territories British Columbia Alberta Scale for bars: 2 mm = 1% of Canada’s electricity international boundary provincial boundary Key Saskatchewan Manitoba Ontario Québec Newfoundland Fig. 6 (i) In which province is most electricity generated? [1] www.theallpapers.com
Question paper, page 11
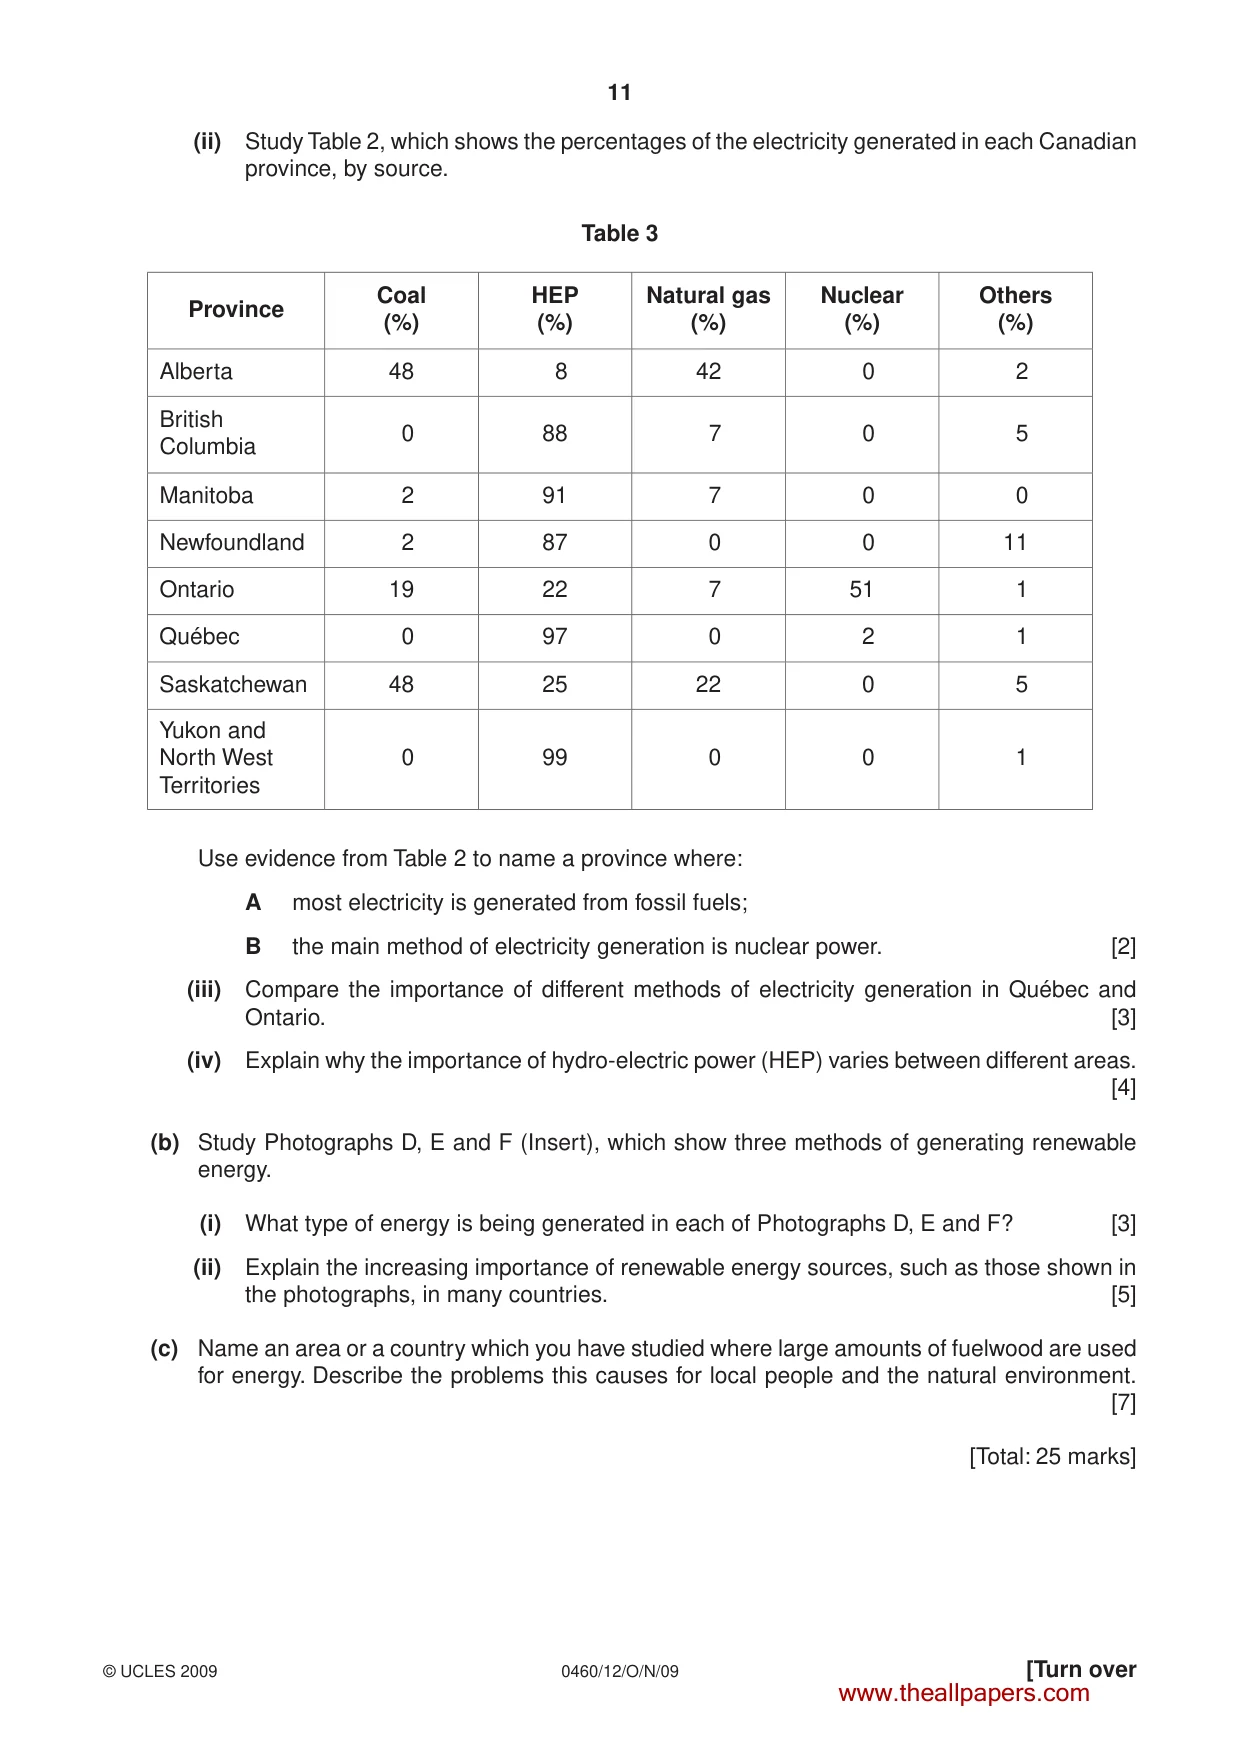
11 0460/12/O/N/09 © UCLES 2009 [Turn over (ii) Study Table 2, which shows the percentages of the electricity generated in each Canadian province, by source. Table 3 Province Coal (%) HEP (%) Natural gas (%) Nuclear (%) Others (%) Alberta 48 8 42 0 2 British Columbia 0 88 7 0 5 Manitoba 2 91 7 0 0 Newfoundland 2 87 0 0 11 Ontario 19 22 7 51 1 Québec 0 97 0 2 1 Saskatchewan 48 25 22 0 5 Yukon and North West Territories 0 99 0 0 1 Use evidence from Table 2 to name a province where: A most electricity is generated from fossil fuels; B the main method of electricity generation is nuclear power. [2] (iii) Compare the importance of different methods of electricity generation in Québec and Ontario. [3] (iv) Explain why the importance of hydro-electric power (HEP) varies between different areas. [4] (b) Study Photographs D, E and F (Insert), which show three methods of generating renewable energy. (i) What type of energy is being generated in each of Photographs D, E and F? [3] (ii) Explain the increasing importance of renewable energy sources, such as those shown in the photographs, in many countries. [5] (c) Name an area or a country which you have studied where large amounts of fuelwood are used for energy. Describe the problems this causes for local people and the natural environment. [7] [Total: 25 marks] www.theallpapers.com
Question paper, page 12
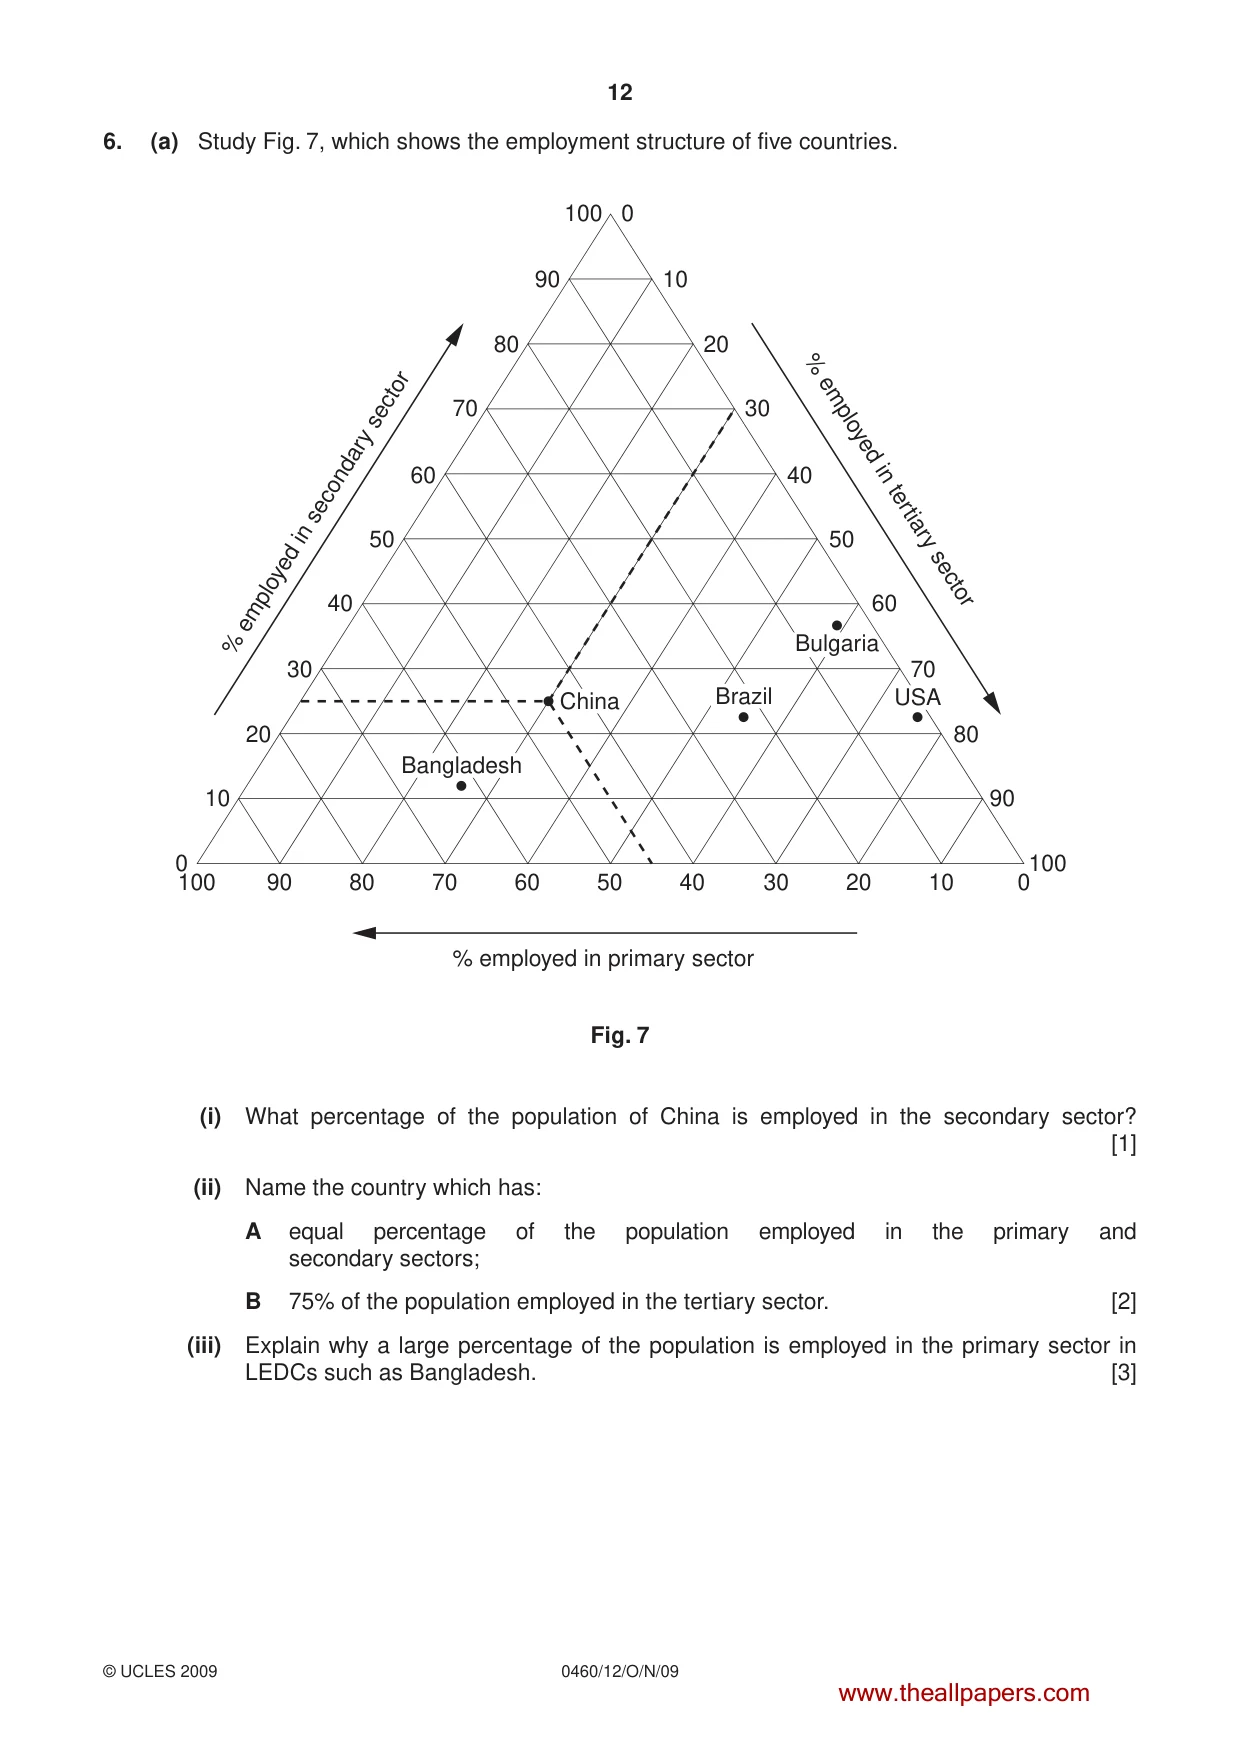
12 0460/12/O/N/09 © UCLES 2009 6. (a) Study Fig. 7, which shows the employment structure of five countries. 90 100 80 70 60 50 40 % employed in secondary sector % employed in tertiary sector % employed in primary sector 30 20 10 0 10 0 20 30 40 50 60 70 80 90 100 0 10 20 30 40 50 80 100 90 60 70 Brazil China Bangladesh Bulgaria USA Fig. 7 (i) What percentage of the population of China is employed in the secondary sector? [1] (ii) Name the country which has: A equal percentage of the population employed in the primary and secondary sectors; B 75% of the population employed in the tertiary sector. [2] (iii) Explain why a large percentage of the population is employed in the primary sector in LEDCs such as Bangladesh. [3] www.theallpapers.com
Question paper, page 13
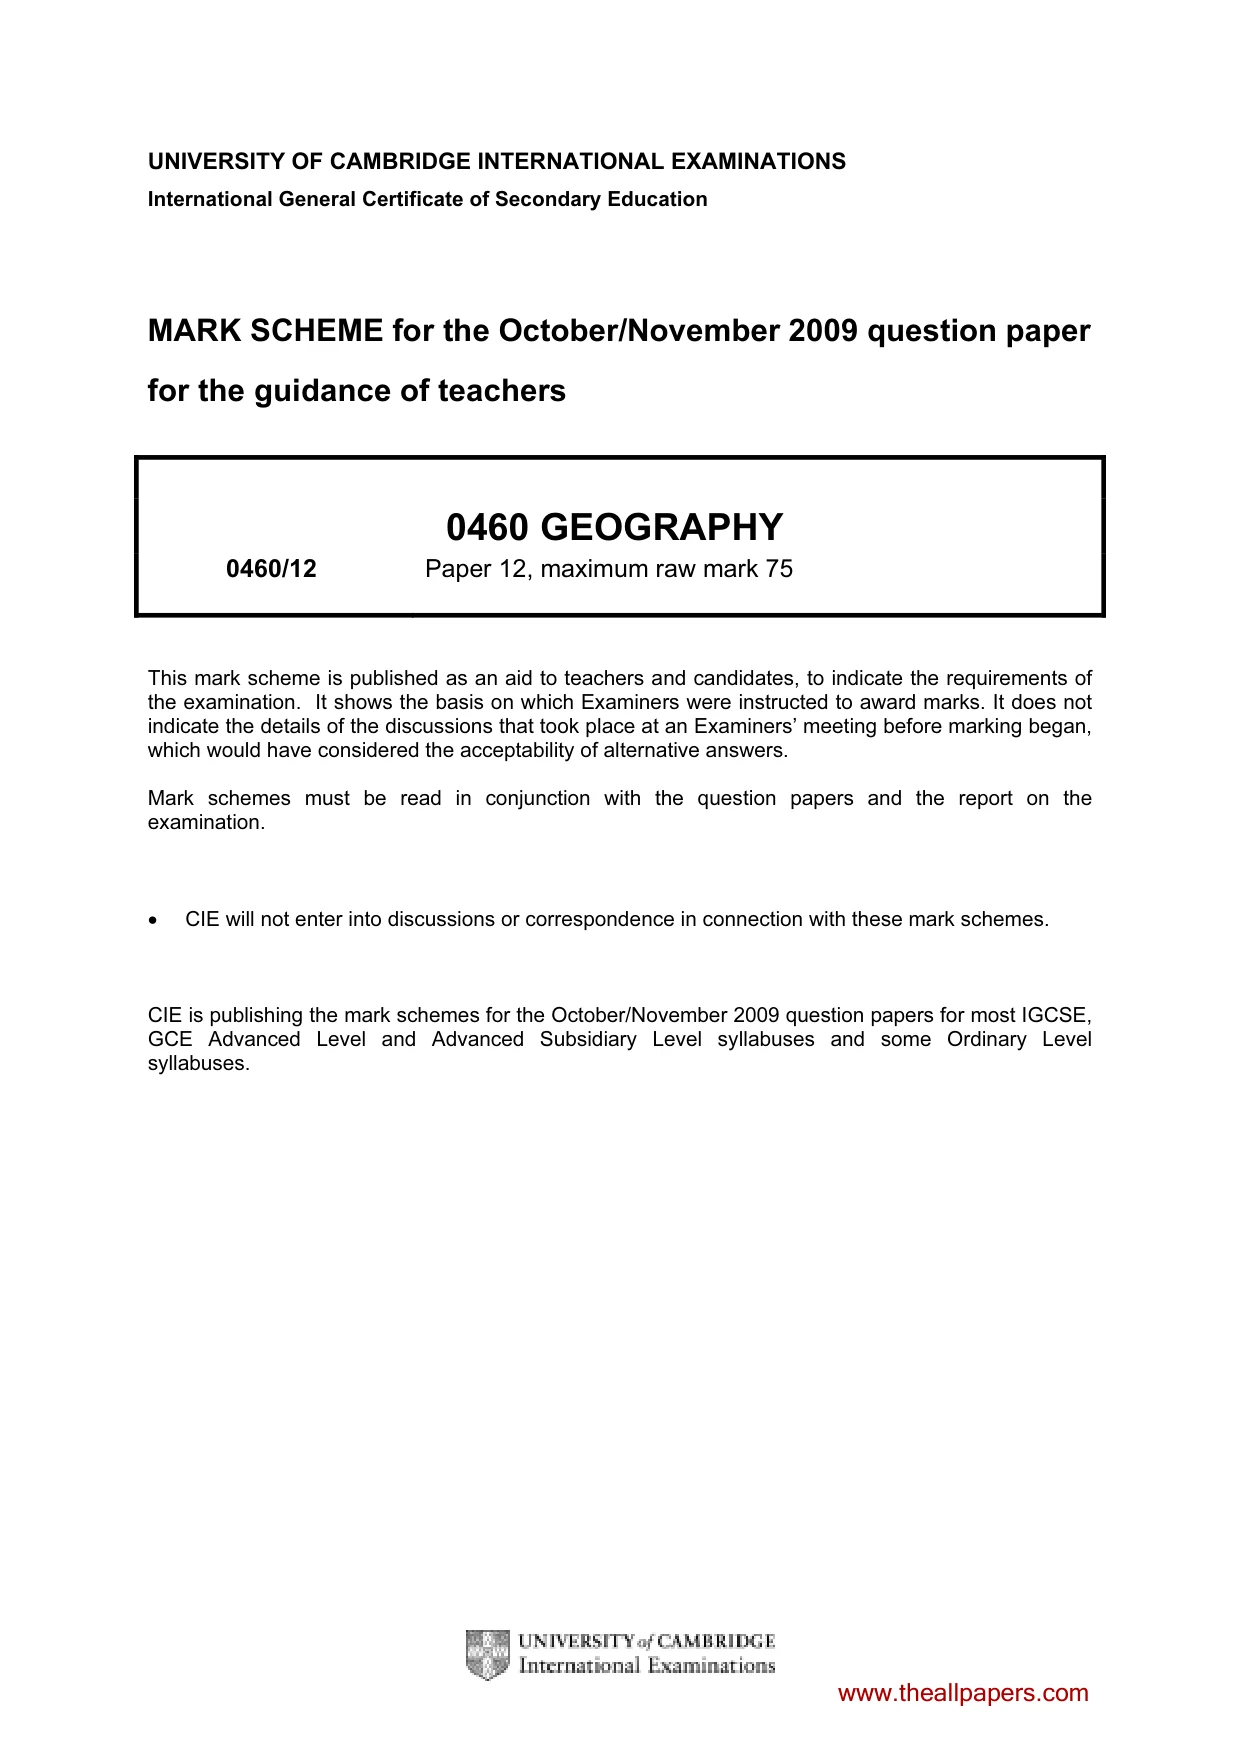
13 0460/12/O/N/09 © UCLES 2009 (b) Study Fig. 8, which shows how cement is made. fuel gypsum clinker is crushed to powder clinker is roasted in kilns 1900°C Clinker Cement Clay Limestone Fig. 8 (i) Using Fig. 8, identify: A a raw material; B a process; C an output. [3] (ii) A cement factory was opened in 2007 at Buipe (a town in Ghana.) Suggest how the cement factory may benefit local people. [4] (iii) Describe the problems which manufacturing industries, such as the cement factory, might cause for the natural environment in and around Buipe. [5] (c) Name an area where high technology industry has been located and explain the factors which attracted this type of industry to the area. [7] [Total: 25 marks] www.theallpapers.com
Question paper, page 14
14 0460/12/O/N/09 BLANK PAGE www.theallpapers.com
Question paper, page 15
15 0460/12/O/N/09 BLANK PAGE www.theallpapers.com
Question paper, page 16
16 0460/12/O/N/09 Copyright Acknowledgements: Question 1 Fig. 2 © Oman Daily Observer Question 2 Photographs A, B and C S. Sibley, © UCLES Question 5 Photograph D © www.rainorshinepower.com Question 5 Photographs E and F S. Sibley, © UCLES Question 6 Fig. 8 © World Resources Institute, www.images.wri.org/map_cartogram_global_warming-large.gif Permission to reproduce items where third-party owned material protected by copyright is included has been sought and cleared where possible. Every reasonable effort has been made by the publisher (UCLES) to trace copyright holders, but if any items requiring clearance have unwittingly been included, the publisher will be pleased to make amends at the earliest possible opportunity. University of Cambridge International Examinations is part of the Cambridge Assessment Group. Cambridge Assessment is the brand name of University of Cambridge Local Examinations Syndicate (UCLES), which is itself a department of the University of Cambridge. BLANK PAGE www.theallpapers.com
Mark scheme, page 1
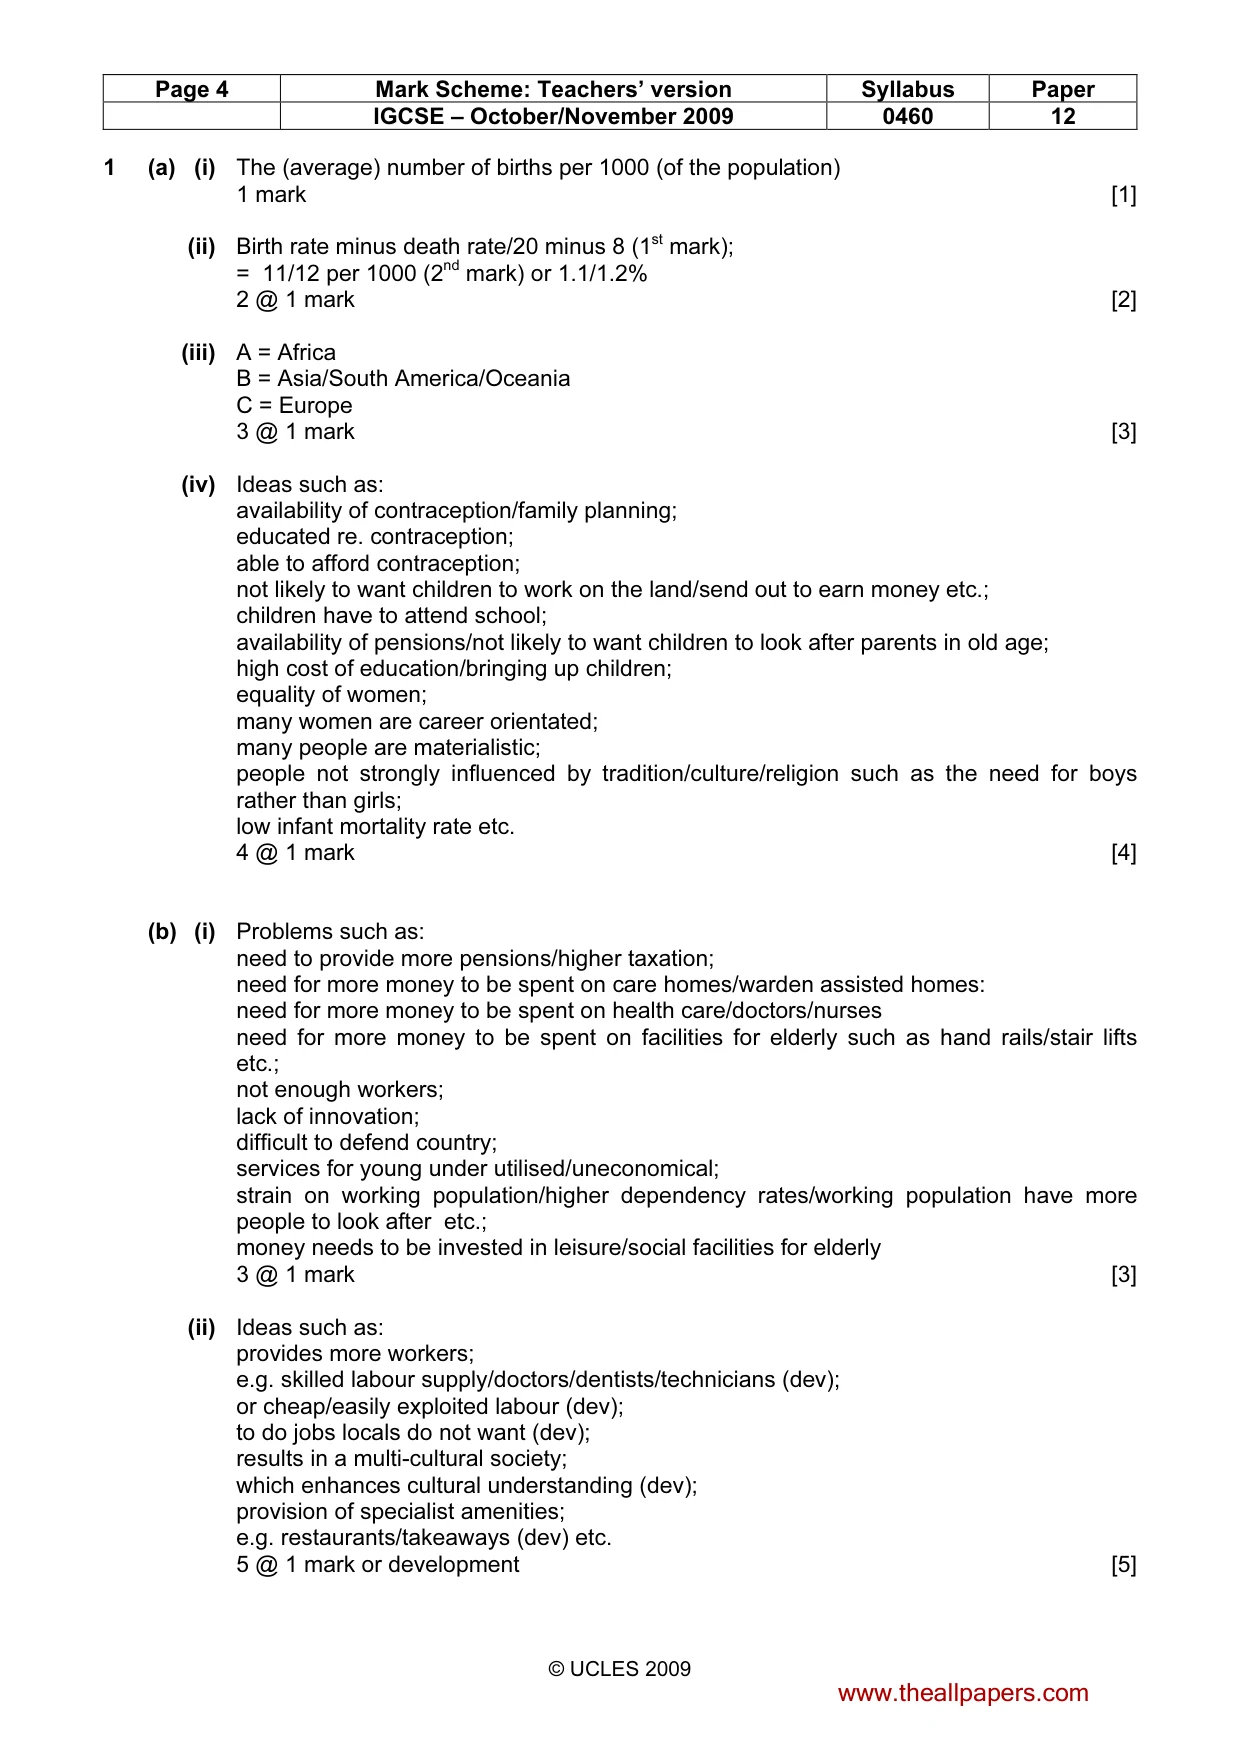
UNIVERSITY OF CAMBRIDGE INTERNATIONAL EXAMINATIONS International General Certificate of Secondary Education MARK SCHEME for the October/November 2009 question paper for the guidance of teachers 0460 GEOGRAPHY 0460/12 Paper 12, maximum raw mark 75 This mark scheme is published as an aid to teachers and candidates, to indicate the requirements of the examination. It shows the basis on which Examiners were instructed to award marks. It does not indicate the details of the discussions that took place at an Examiners’ meeting before marking began, which would have considered the acceptability of alternative answers. Mark schemes must be read in conjunction with the question papers and the report on the examination. • CIE will not enter into discussions or correspondence in connection with these mark schemes. CIE is publishing the mark schemes for the October/November 2009 question papers for most IGCSE, GCE Advanced Level and Advanced Subsidiary Level syllabuses and some Ordinary Level syllabuses. www.theallpapers.com
Mark scheme, page 2
Page 2 Mark Scheme: Teachers’ version Syllabus Paper IGCSE – October/November 2009 0460 12 © UCLES 2009 The features of the marking scheme Each question carries 25 marks. Candidates cannot earn above the maximum marks available within each sub section. The marking scheme attempts to give guidance about the requirements of each answer and lists a number of responses which will earn marks along with the general principles to be applied when marking each question. It should be noted that candidates can earn marks if their answers are phrased differently provided they convey the same meaning as those in the mark scheme. THE CANDIDATES DO NOT NEED TO USE THE SAME WORDING TO EARN MARKS. The notation ‘etc’ at the end of an answer in the mark scheme signifies that there may well be other correct responses or examples that can be given credit. Providing the statement is true, relevant to the question asked and not repetition of a previous point made credit should be given. A point made within one sub-section which is an answer to the question set in a different sub-section should not be given credit as each sub-section asks different questions which require independent answers. The mark scheme uses semi colons (;) to separate marks and diagonals to separate alternative answers. During coordination the mark scheme is modified to add points agreed after discussion or to delete any points not allowed. All examiners should ensure that their modified scheme is fully up-to-date before marking begins. Marking mechanics. Point marking is used for sections (a) and (b) of each question, although marks are available in specified questions for development of appropriate points. Ticks should be used to clearly indicate the wording on a script where a mark has been allowed. Where a development point has been allowed the letter ‘D’ should be placed adjacent to the tick. The number of ticks should always be equal to the total number of marks awarded, the mark for each sub-section should be added up and placed in the margin at the end of the sub-section. The total mark for the entire question should be added and transferred to the front of the script. Where a candidate makes a point which is not quite sufficient for credit an upturned ‘V’ insert symbol should be used. If after careful consideration a mark is awarded which gives ‘benefit of doubt’ to the candidate the letter ‘J’ should be placed adjacent to the tick (i.e. the candidate has ‘just’ achieved the mark). Levels of response marking is used for section (c) of each question. Thus it is the quality of the response which determines which level an answer is achieved rather than the quantity of statements contained within it. However once assigned to a level the mark achieved within that level is determined by the number of points made. Levels 1 and 2 are distinguished by whether statements are simple (level 1) or developed/elaborated (level 2). A candidate can immediately enter L2 by making developed points without making any L1 statements. In order to achieve L3 a candidate must have already reached the top end of L2 – in addition his/her answer should have a clear example (for 6 marks), and if the answer is place specific as well (7 marks). www.theallpapers.com
Mark scheme, page 3
Page 3 Mark Scheme: Teachers’ version Syllabus Paper IGCSE – October/November 2009 0460 12 © UCLES 2009 Where statements are assigned levels by the examiner this should be indicated by the use of L1, L2 and L3 next to the statements. A summary of the overall level and mark awarded should be written at the end of the answer. Ticks should not be used on answers which are marked using levels of response marking. Summary: Level 1 (1 to 3 marks): 1 simple statement (1 mark) 2 simple statements (2 marks) 3 simple statements (3 marks) Level 2 (4 to 6 marks): 1 developed statement (4 marks) 2 developed statements (5 marks) 3 or more developed statements with e.g. (6 marks) Level 3 (7 marks) 3 or more developed statements + named example with at least one piece of place specific detail. All answers, whether marked by point marking or levels, should have signs of having been assessed by the examiner. Crosses are acceptable to signify wrong answers and a red line accompanied by the letters ‘I/R’ should be used to indicate those which are irrelevant. www.theallpapers.com
Mark scheme, page 4
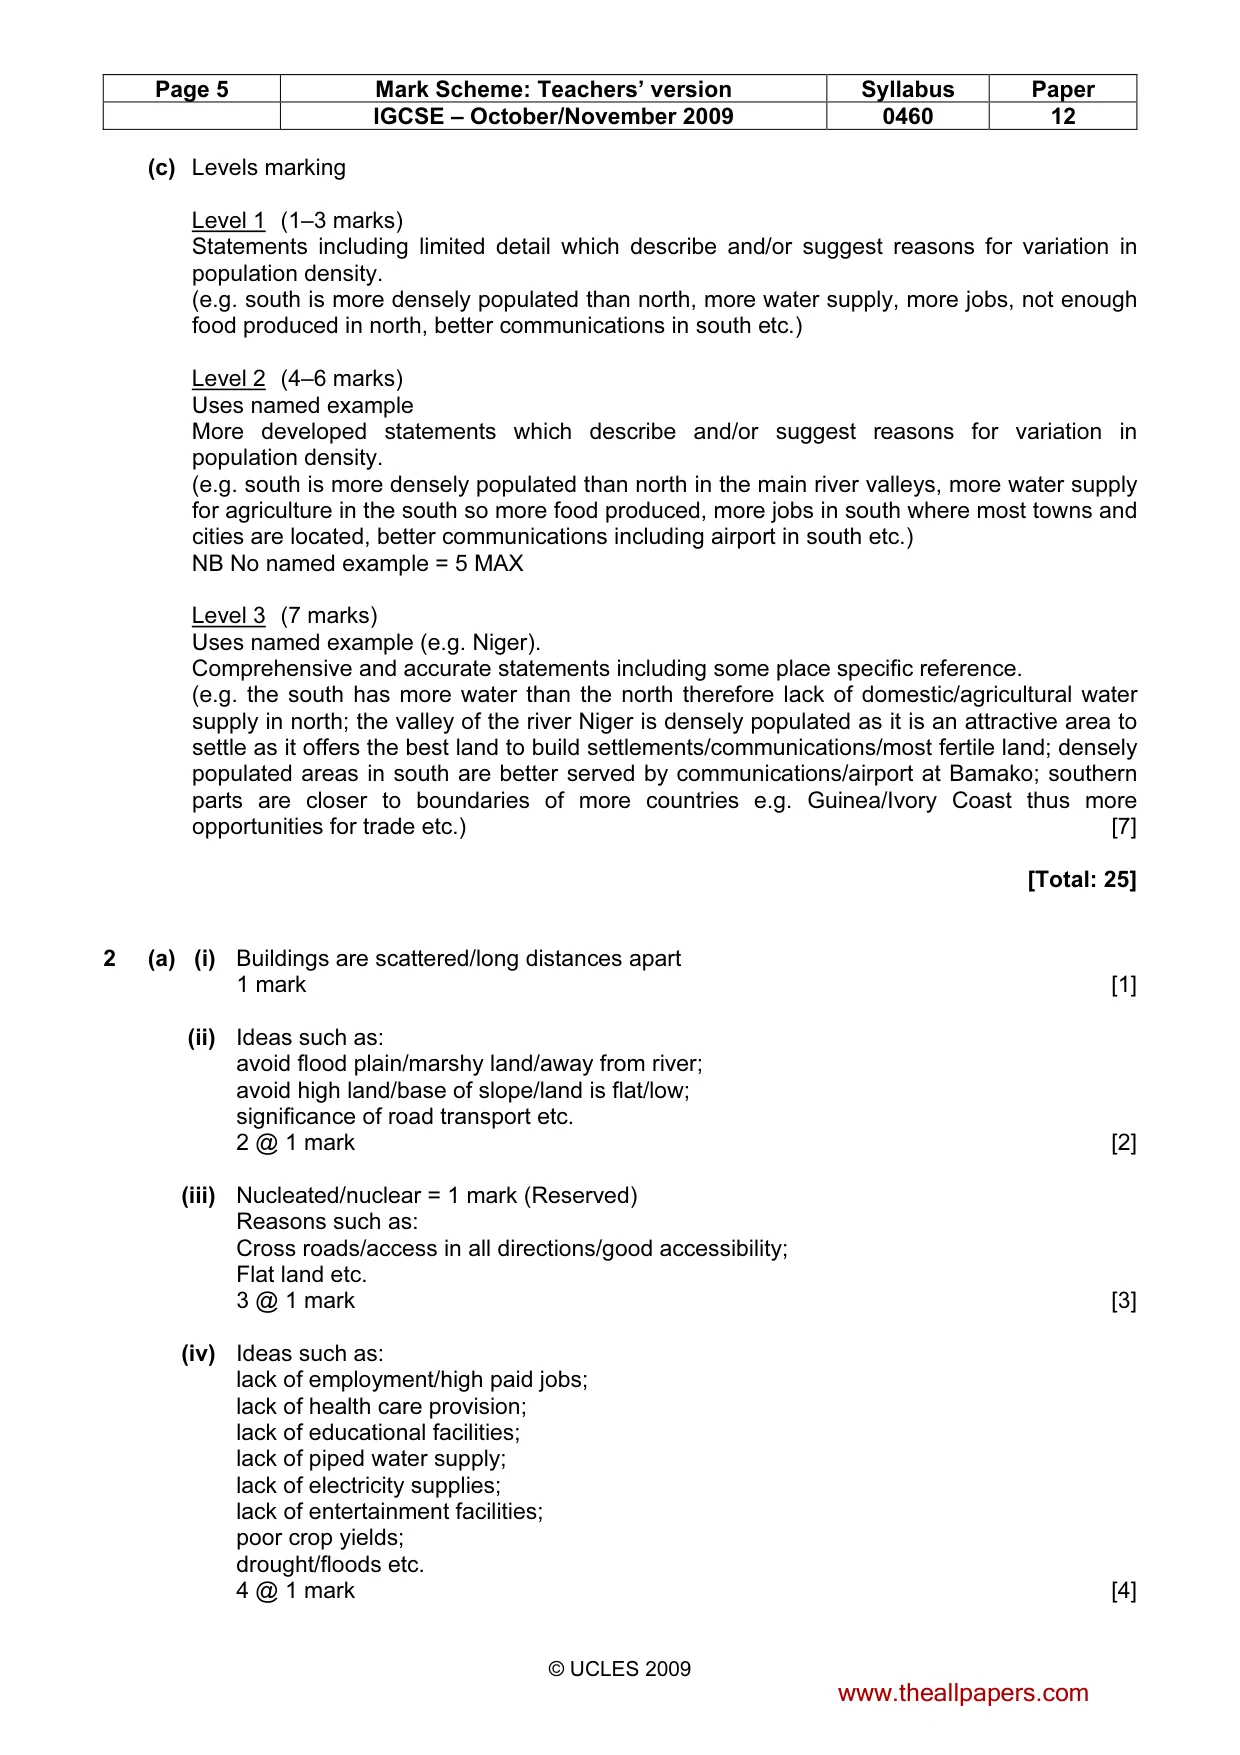
Page 4 Mark Scheme: Teachers’ version Syllabus Paper IGCSE – October/November 2009 0460 12 © UCLES 2009 1 (a) (i) The (average) number of births per 1000 (of the population) 1 mark [1] (ii) Birth rate minus death rate/20 minus 8 (1st mark); = 11/12 per 1000 (2nd mark) or 1.1/1.2% 2 @ 1 mark [2] (iii) A = Africa B = Asia/South America/Oceania C = Europe 3 @ 1 mark [3] (iv) Ideas such as: availability of contraception/family planning; educated re. contraception; able to afford contraception; not likely to want children to work on the land/send out to earn money etc.; children have to attend school; availability of pensions/not likely to want children to look after parents in old age; high cost of education/bringing up children; equality of women; many women are career orientated; many people are materialistic; people not strongly influenced by tradition/culture/religion such as the need for boys rather than girls; low infant mortality rate etc. 4 @ 1 mark [4] (b) (i) Problems such as: need to provide more pensions/higher taxation; need for more money to be spent on care homes/warden assisted homes: need for more money to be spent on health care/doctors/nurses need for more money to be spent on facilities for elderly such as hand rails/stair lifts etc.; not enough workers; lack of innovation; difficult to defend country; services for young under utilised/uneconomical; strain on working population/higher dependency rates/working population have more people to look after etc.; money needs to be invested in leisure/social facilities for elderly 3 @ 1 mark [3] (ii) Ideas such as: provides more workers; e.g. skilled labour supply/doctors/dentists/technicians (dev); or cheap/easily exploited labour (dev); to do jobs locals do not want (dev); results in a multi-cultural society; which enhances cultural understanding (dev); provision of specialist amenities; e.g. restaurants/takeaways (dev) etc. 5 @ 1 mark or development [5] www.theallpapers.com
Mark scheme, page 5
Page 5 Mark Scheme: Teachers’ version Syllabus Paper IGCSE – October/November 2009 0460 12 © UCLES 2009 (c) Levels marking Level 1 (1–3 marks) Statements including limited detail which describe and/or suggest reasons for variation in population density. (e.g. south is more densely populated than north, more water supply, more jobs, not enough food produced in north, better communications in south etc.) Level 2 (4–6 marks) Uses named example More developed statements which describe and/or suggest reasons for variation in population density. (e.g. south is more densely populated than north in the main river valleys, more water supply for agriculture in the south so more food produced, more jobs in south where most towns and cities are located, better communications including airport in south etc.) NB No named example = 5 MAX Level 3 (7 marks) Uses named example (e.g. Niger). Comprehensive and accurate statements including some place specific reference. (e.g. the south has more water than the north therefore lack of domestic/agricultural water supply in north; the valley of the river Niger is densely populated as it is an attractive area to settle as it offers the best land to build settlements/communications/most fertile land; densely populated areas in south are better served by communications/airport at Bamako; southern parts are closer to boundaries of more countries e.g. Guinea/Ivory Coast thus more opportunities for trade etc.) [7] [Total: 25] 2 (a) (i) Buildings are scattered/long distances apart 1 mark [1] (ii) Ideas such as: avoid flood plain/marshy land/away from river; avoid high land/base of slope/land is flat/low; significance of road transport etc. 2 @ 1 mark [2] (iii) Nucleated/nuclear = 1 mark (Reserved) Reasons such as: Cross roads/access in all directions/good accessibility; Flat land etc. 3 @ 1 mark [3] (iv) Ideas such as: lack of employment/high paid jobs; lack of health care provision; lack of educational facilities; lack of piped water supply; lack of electricity supplies; lack of entertainment facilities; poor crop yields; drought/floods etc. 4 @ 1 mark [4] www.theallpapers.com
Mark scheme, page 6
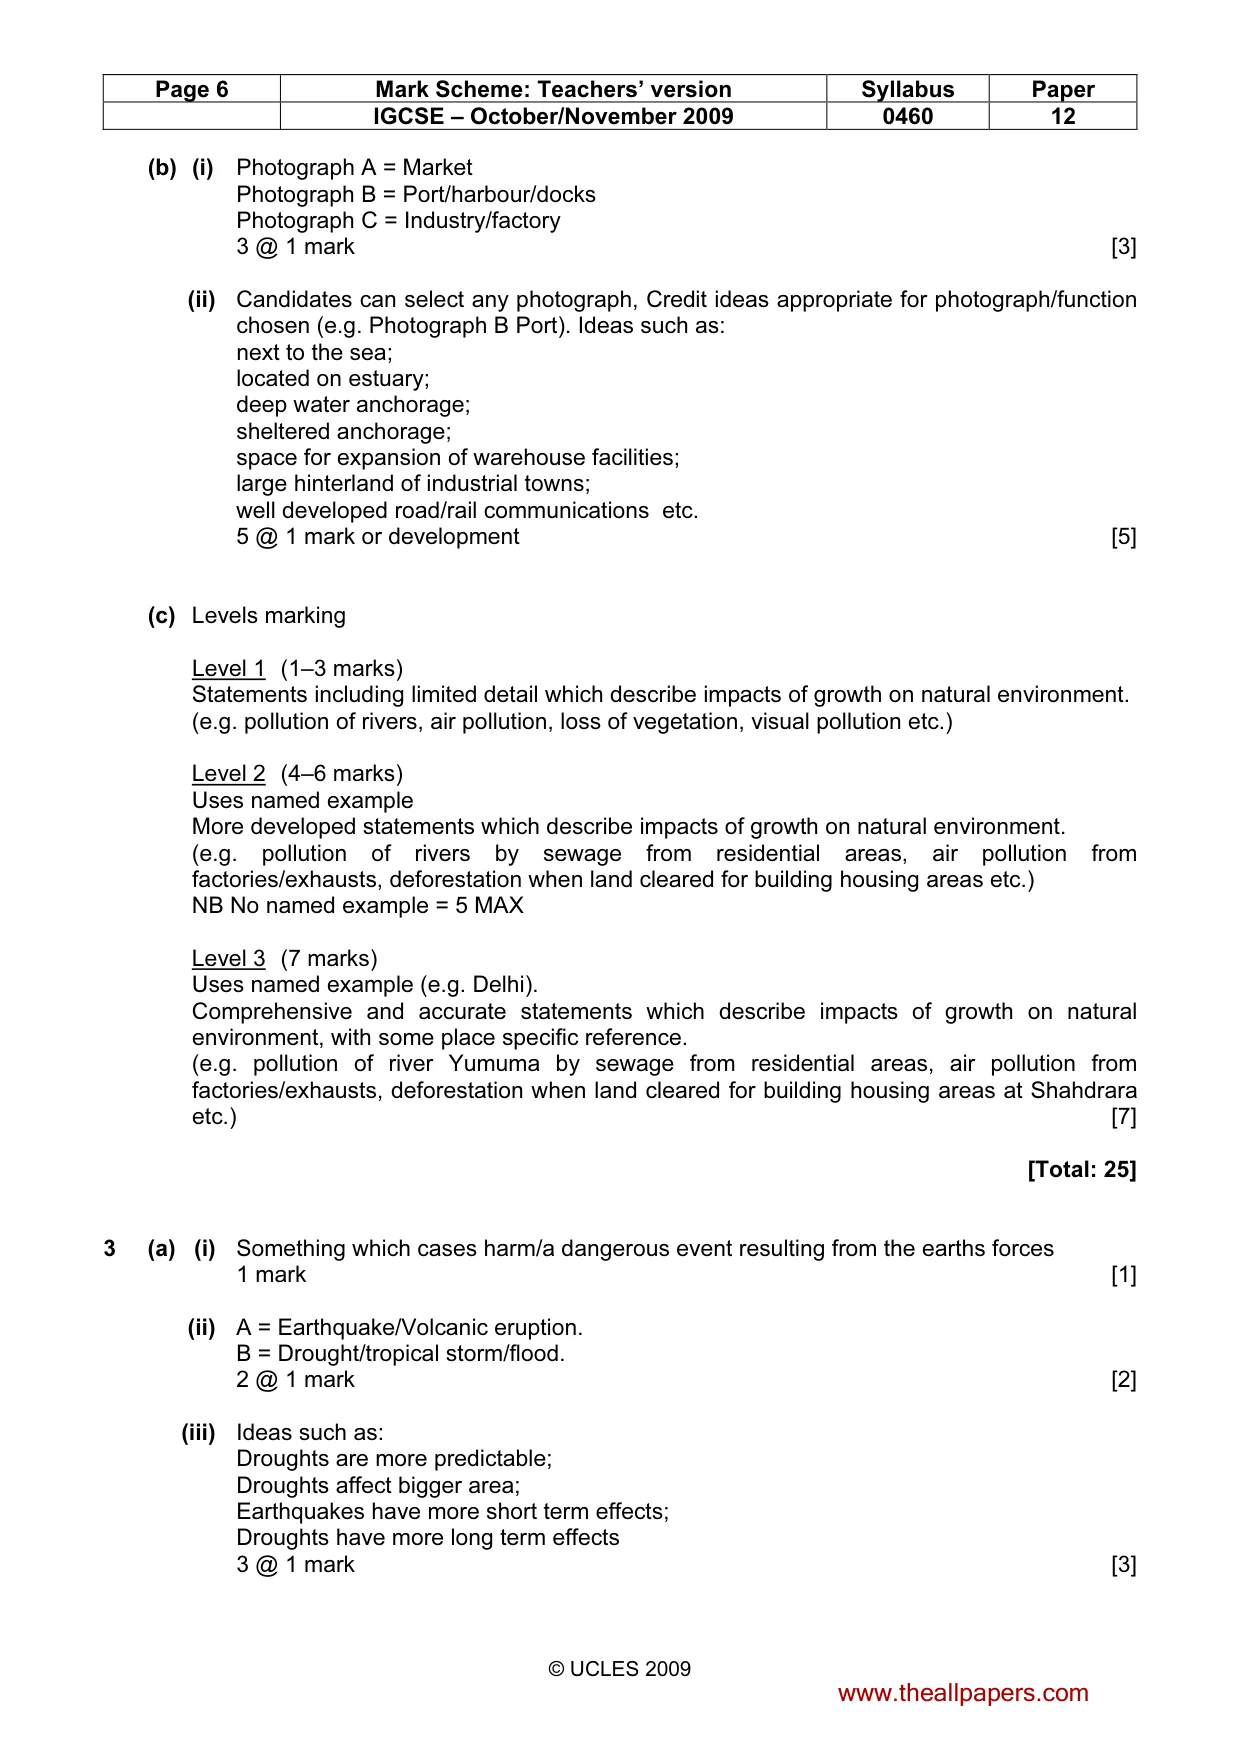
Page 6 Mark Scheme: Teachers’ version Syllabus Paper IGCSE – October/November 2009 0460 12 © UCLES 2009 (b) (i) Photograph A = Market Photograph B = Port/harbour/docks Photograph C = Industry/factory 3 @ 1 mark [3] (ii) Candidates can select any photograph, Credit ideas appropriate for photograph/function chosen (e.g. Photograph B Port). Ideas such as: next to the sea; located on estuary; deep water anchorage; sheltered anchorage; space for expansion of warehouse facilities; large hinterland of industrial towns; well developed road/rail communications etc. 5 @ 1 mark or development [5] (c) Levels marking Level 1 (1–3 marks) Statements including limited detail which describe impacts of growth on natural environment. (e.g. pollution of rivers, air pollution, loss of vegetation, visual pollution etc.) Level 2 (4–6 marks) Uses named example More developed statements which describe impacts of growth on natural environment. (e.g. pollution of rivers by sewage from residential areas, air pollution from factories/exhausts, deforestation when land cleared for building housing areas etc.) NB No named example = 5 MAX Level 3 (7 marks) Uses named example (e.g. Delhi). Comprehensive and accurate statements which describe impacts of growth on natural environment, with some place specific reference. (e.g. pollution of river Yumuma by sewage from residential areas, air pollution from factories/exhausts, deforestation when land cleared for building housing areas at Shahdrara etc.) [7] [Total: 25] 3 (a) (i) Something which cases harm/a dangerous event resulting from the earths forces 1 mark [1] (ii) A = Earthquake/Volcanic eruption. B = Drought/tropical storm/flood. 2 @ 1 mark [2] (iii) Ideas such as: Droughts are more predictable; Droughts affect bigger area; Earthquakes have more short term effects; Droughts have more long term effects 3 @ 1 mark [3] www.theallpapers.com
Mark scheme, page 7
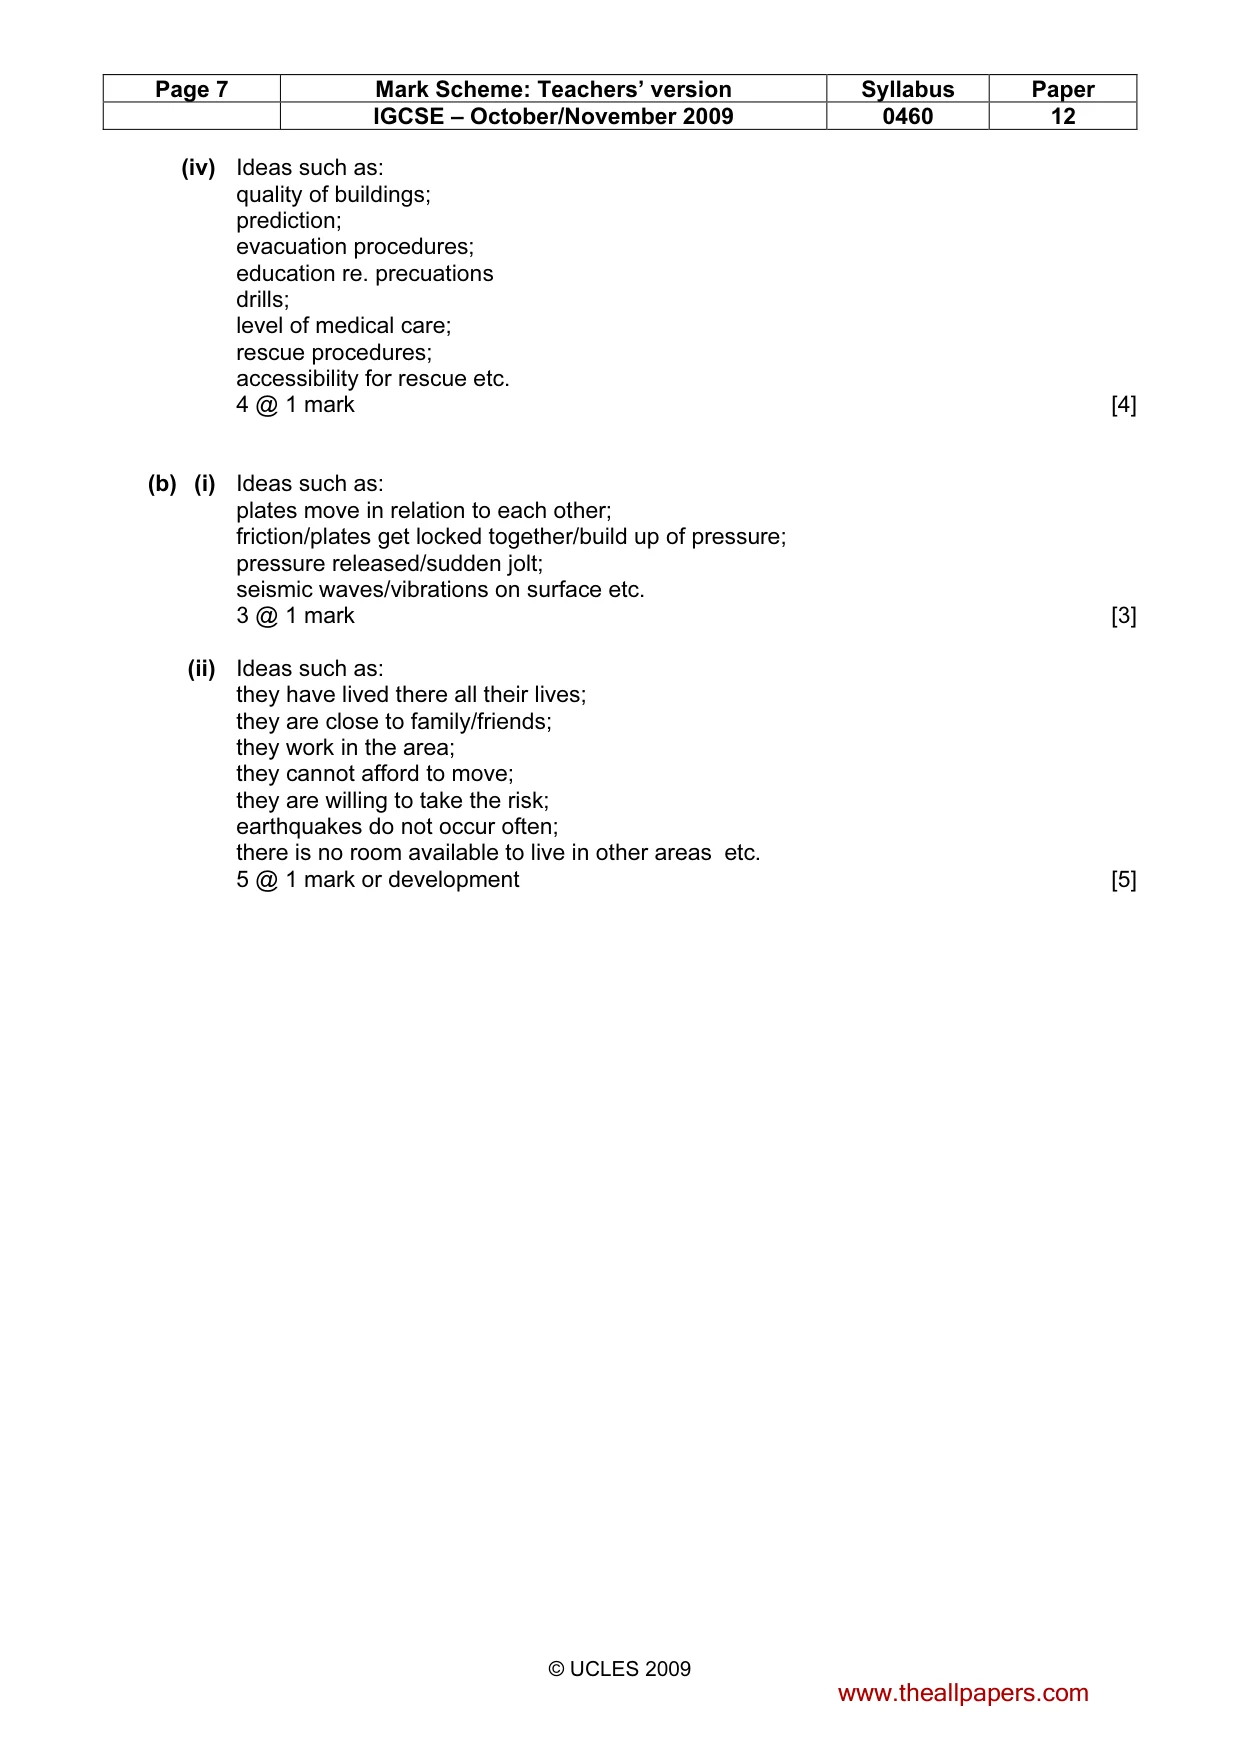
Page 7 Mark Scheme: Teachers’ version Syllabus Paper IGCSE – October/November 2009 0460 12 © UCLES 2009 (iv) Ideas such as: quality of buildings; prediction; evacuation procedures; education re. precuations drills; level of medical care; rescue procedures; accessibility for rescue etc. 4 @ 1 mark [4] (b) (i) Ideas such as: plates move in relation to each other; friction/plates get locked together/build up of pressure; pressure released/sudden jolt; seismic waves/vibrations on surface etc. 3 @ 1 mark [3] (ii) Ideas such as: they have lived there all their lives; they are close to family/friends; they work in the area; they cannot afford to move; they are willing to take the risk; earthquakes do not occur often; there is no room available to live in other areas etc. 5 @ 1 mark or development [5] www.theallpapers.com
Mark scheme, page 8
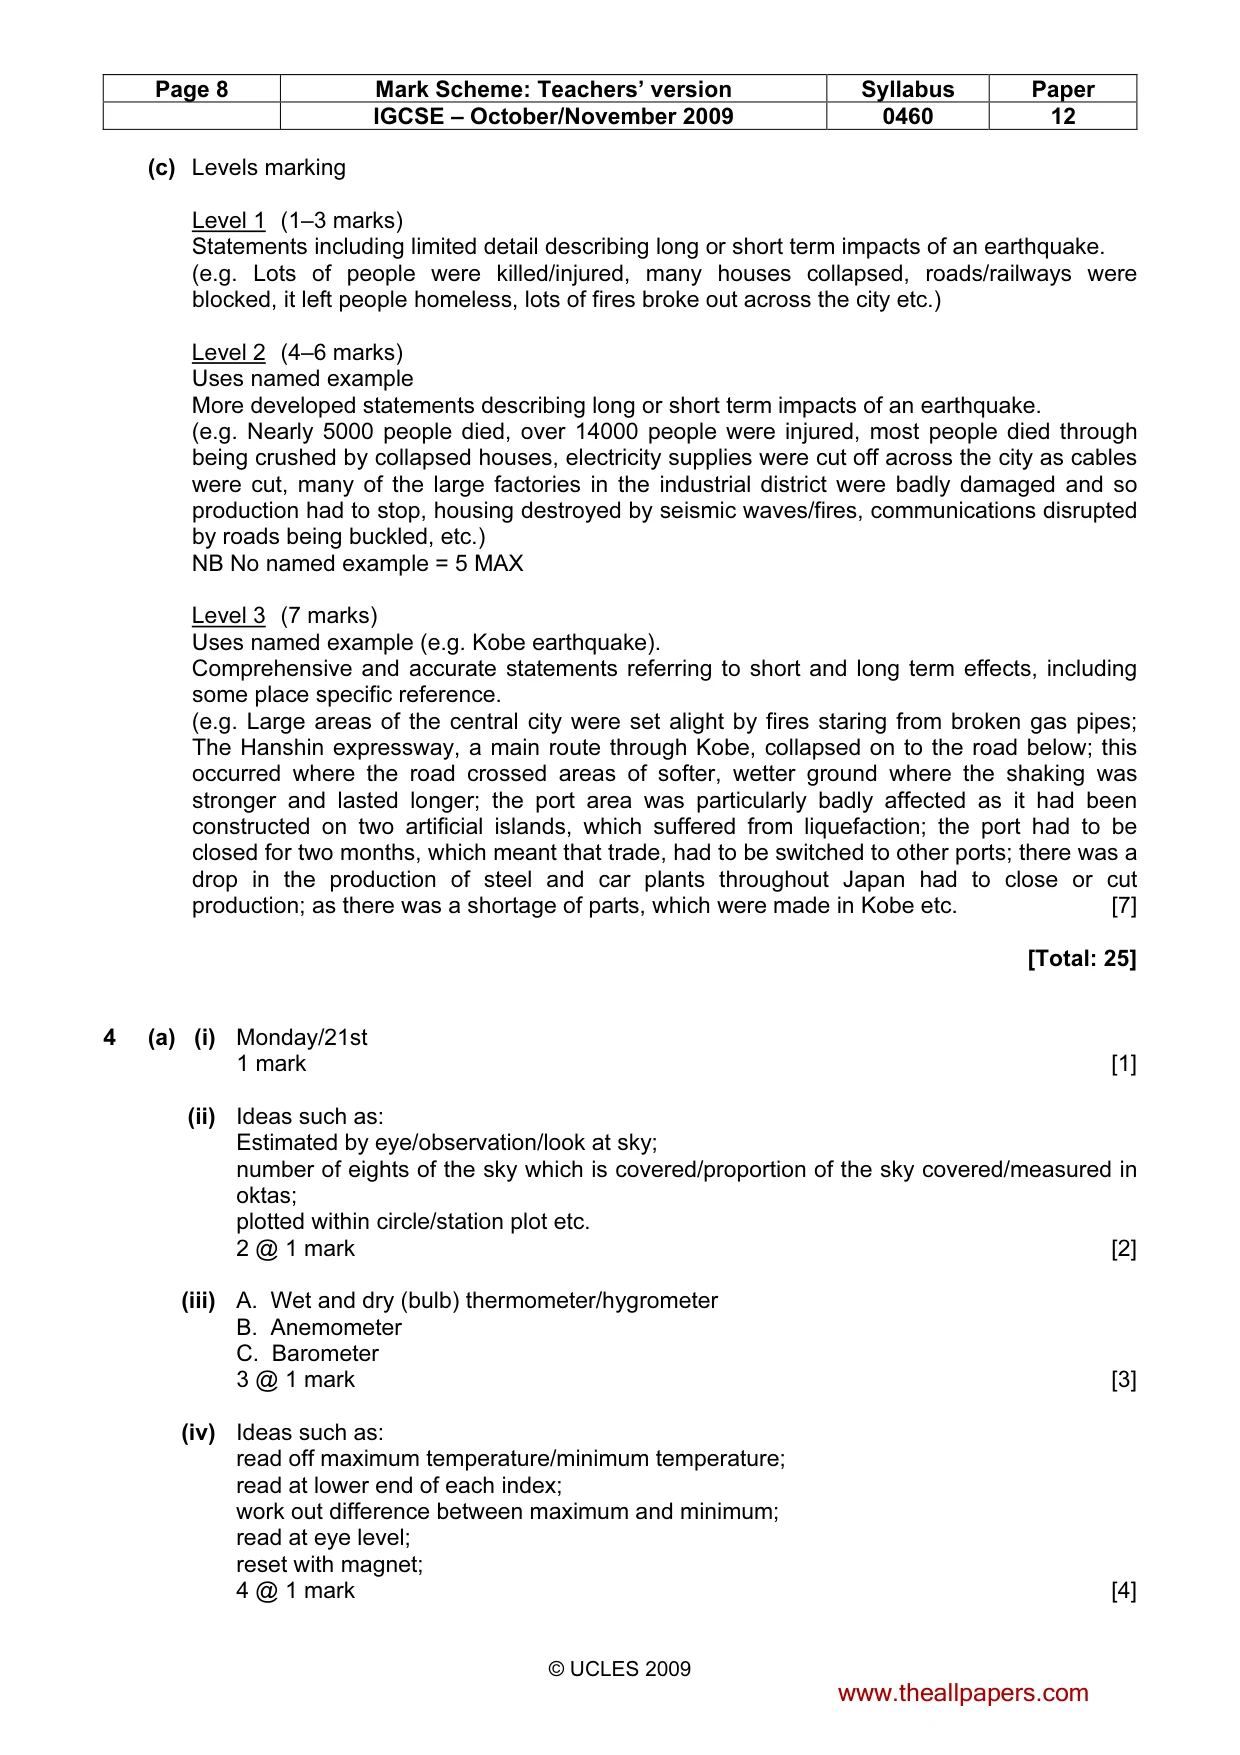
Page 8 Mark Scheme: Teachers’ version Syllabus Paper IGCSE – October/November 2009 0460 12 © UCLES 2009 (c) Levels marking Level 1 (1–3 marks) Statements including limited detail describing long or short term impacts of an earthquake. (e.g. Lots of people were killed/injured, many houses collapsed, roads/railways were blocked, it left people homeless, lots of fires broke out across the city etc.) Level 2 (4–6 marks) Uses named example More developed statements describing long or short term impacts of an earthquake. (e.g. Nearly 5000 people died, over 14000 people were injured, most people died through being crushed by collapsed houses, electricity supplies were cut off across the city as cables were cut, many of the large factories in the industrial district were badly damaged and so production had to stop, housing destroyed by seismic waves/fires, communications disrupted by roads being buckled, etc.) NB No named example = 5 MAX Level 3 (7 marks) Uses named example (e.g. Kobe earthquake). Comprehensive and accurate statements referring to short and long term effects, including some place specific reference. (e.g. Large areas of the central city were set alight by fires staring from broken gas pipes; The Hanshin expressway, a main route through Kobe, collapsed on to the road below; this occurred where the road crossed areas of softer, wetter ground where the shaking was stronger and lasted longer; the port area was particularly badly affected as it had been constructed on two artificial islands, which suffered from liquefaction; the port had to be closed for two months, which meant that trade, had to be switched to other ports; there was a drop in the production of steel and car plants throughout Japan had to close or cut production; as there was a shortage of parts, which were made in Kobe etc. [7] [Total: 25] 4 (a) (i) Monday/21st 1 mark [1] (ii) Ideas such as: Estimated by eye/observation/look at sky; number of eights of the sky which is covered/proportion of the sky covered/measured in oktas; plotted within circle/station plot etc. 2 @ 1 mark [2] (iii) A. Wet and dry (bulb) thermometer/hygrometer B. Anemometer C. Barometer 3 @ 1 mark [3] (iv) Ideas such as: read off maximum temperature/minimum temperature; read at lower end of each index; work out difference between maximum and minimum; read at eye level; reset with magnet; 4 @ 1 mark [4] www.theallpapers.com
Mark scheme, page 9
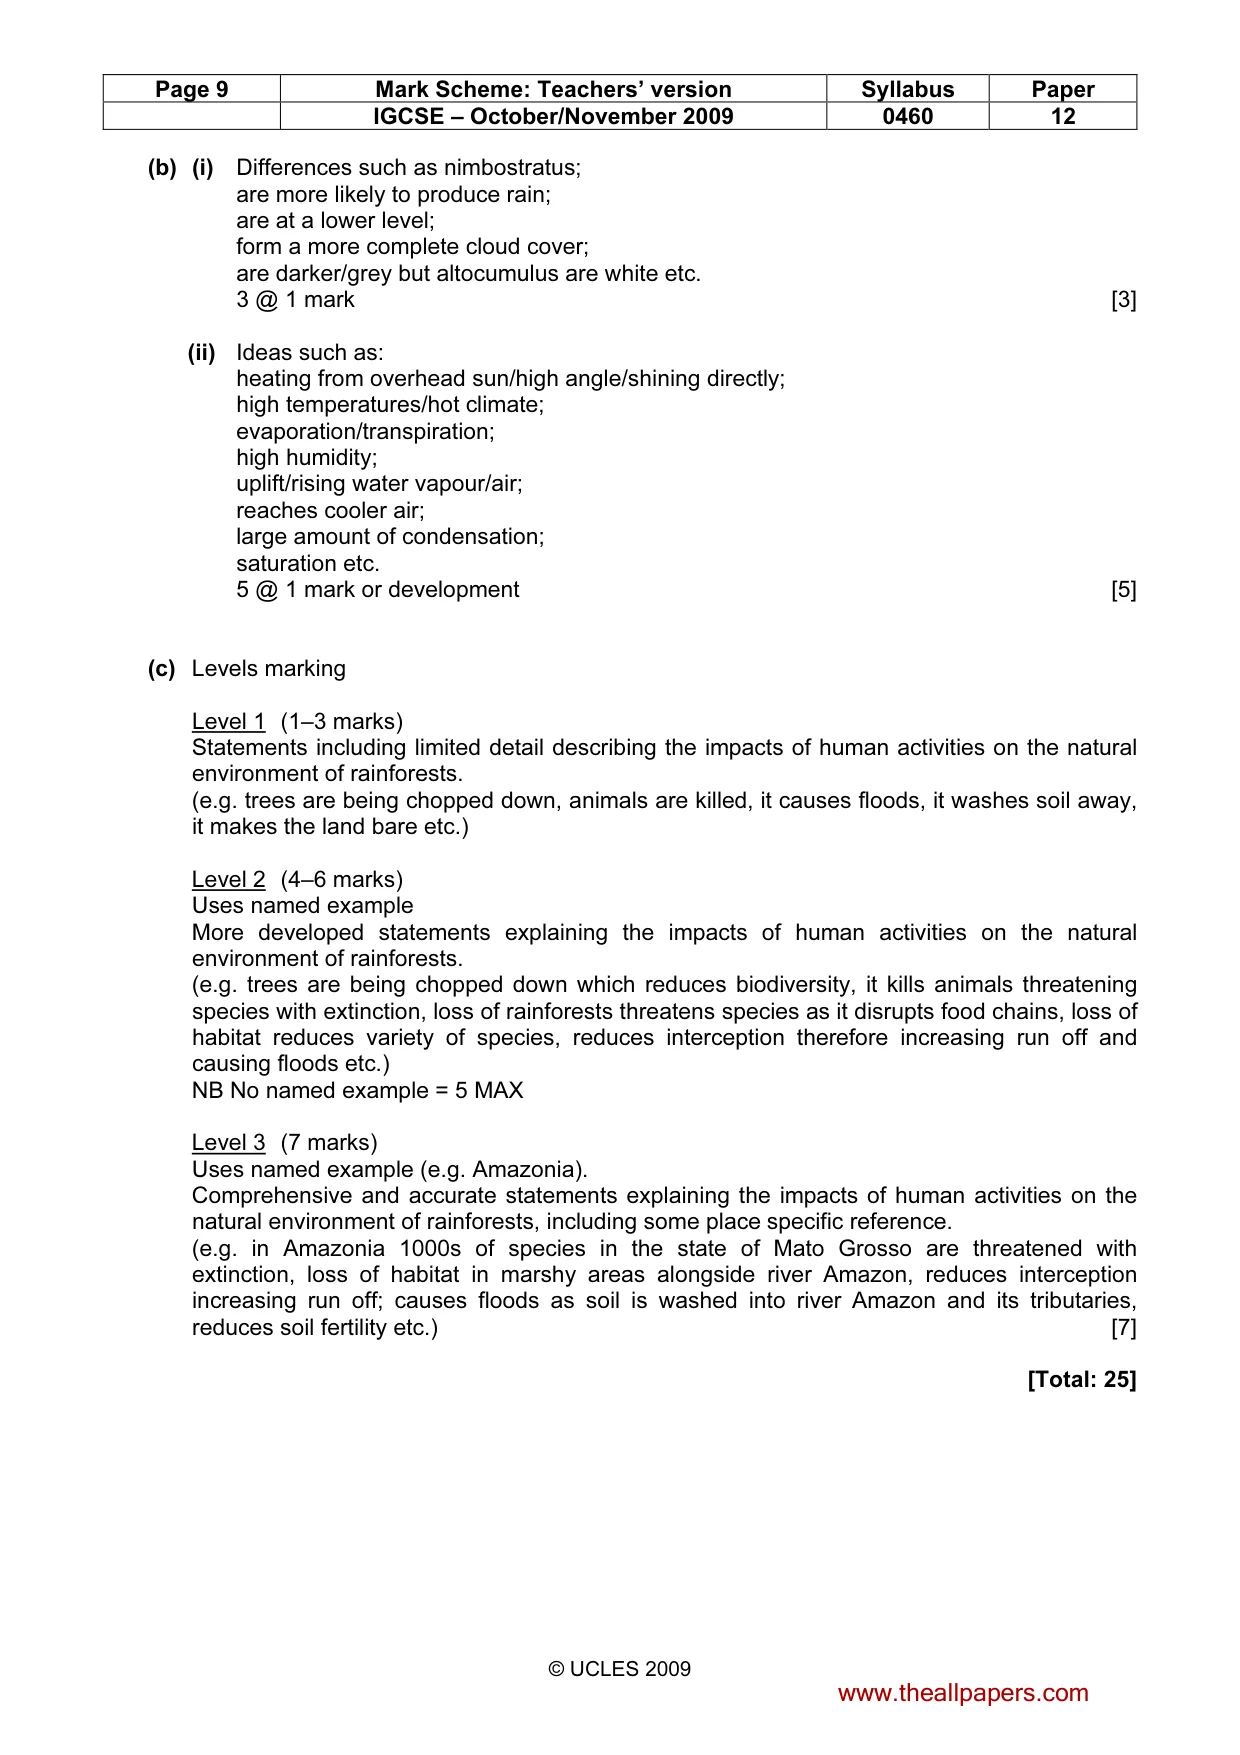
Page 9 Mark Scheme: Teachers’ version Syllabus Paper IGCSE – October/November 2009 0460 12 © UCLES 2009 (b) (i) Differences such as nimbostratus; are more likely to produce rain; are at a lower level; form a more complete cloud cover; are darker/grey but altocumulus are white etc. 3 @ 1 mark [3] (ii) Ideas such as: heating from overhead sun/high angle/shining directly; high temperatures/hot climate; evaporation/transpiration; high humidity; uplift/rising water vapour/air; reaches cooler air; large amount of condensation; saturation etc. 5 @ 1 mark or development [5] (c) Levels marking Level 1 (1–3 marks) Statements including limited detail describing the impacts of human activities on the natural environment of rainforests. (e.g. trees are being chopped down, animals are killed, it causes floods, it washes soil away, it makes the land bare etc.) Level 2 (4–6 marks) Uses named example More developed statements explaining the impacts of human activities on the natural environment of rainforests. (e.g. trees are being chopped down which reduces biodiversity, it kills animals threatening species with extinction, loss of rainforests threatens species as it disrupts food chains, loss of habitat reduces variety of species, reduces interception therefore increasing run off and causing floods etc.) NB No named example = 5 MAX Level 3 (7 marks) Uses named example (e.g. Amazonia). Comprehensive and accurate statements explaining the impacts of human activities on the natural environment of rainforests, including some place specific reference. (e.g. in Amazonia 1000s of species in the state of Mato Grosso are threatened with extinction, loss of habitat in marshy areas alongside river Amazon, reduces interception increasing run off; causes floods as soil is washed into river Amazon and its tributaries, reduces soil fertility etc.) [7] [Total: 25] www.theallpapers.com
Mark scheme, page 10
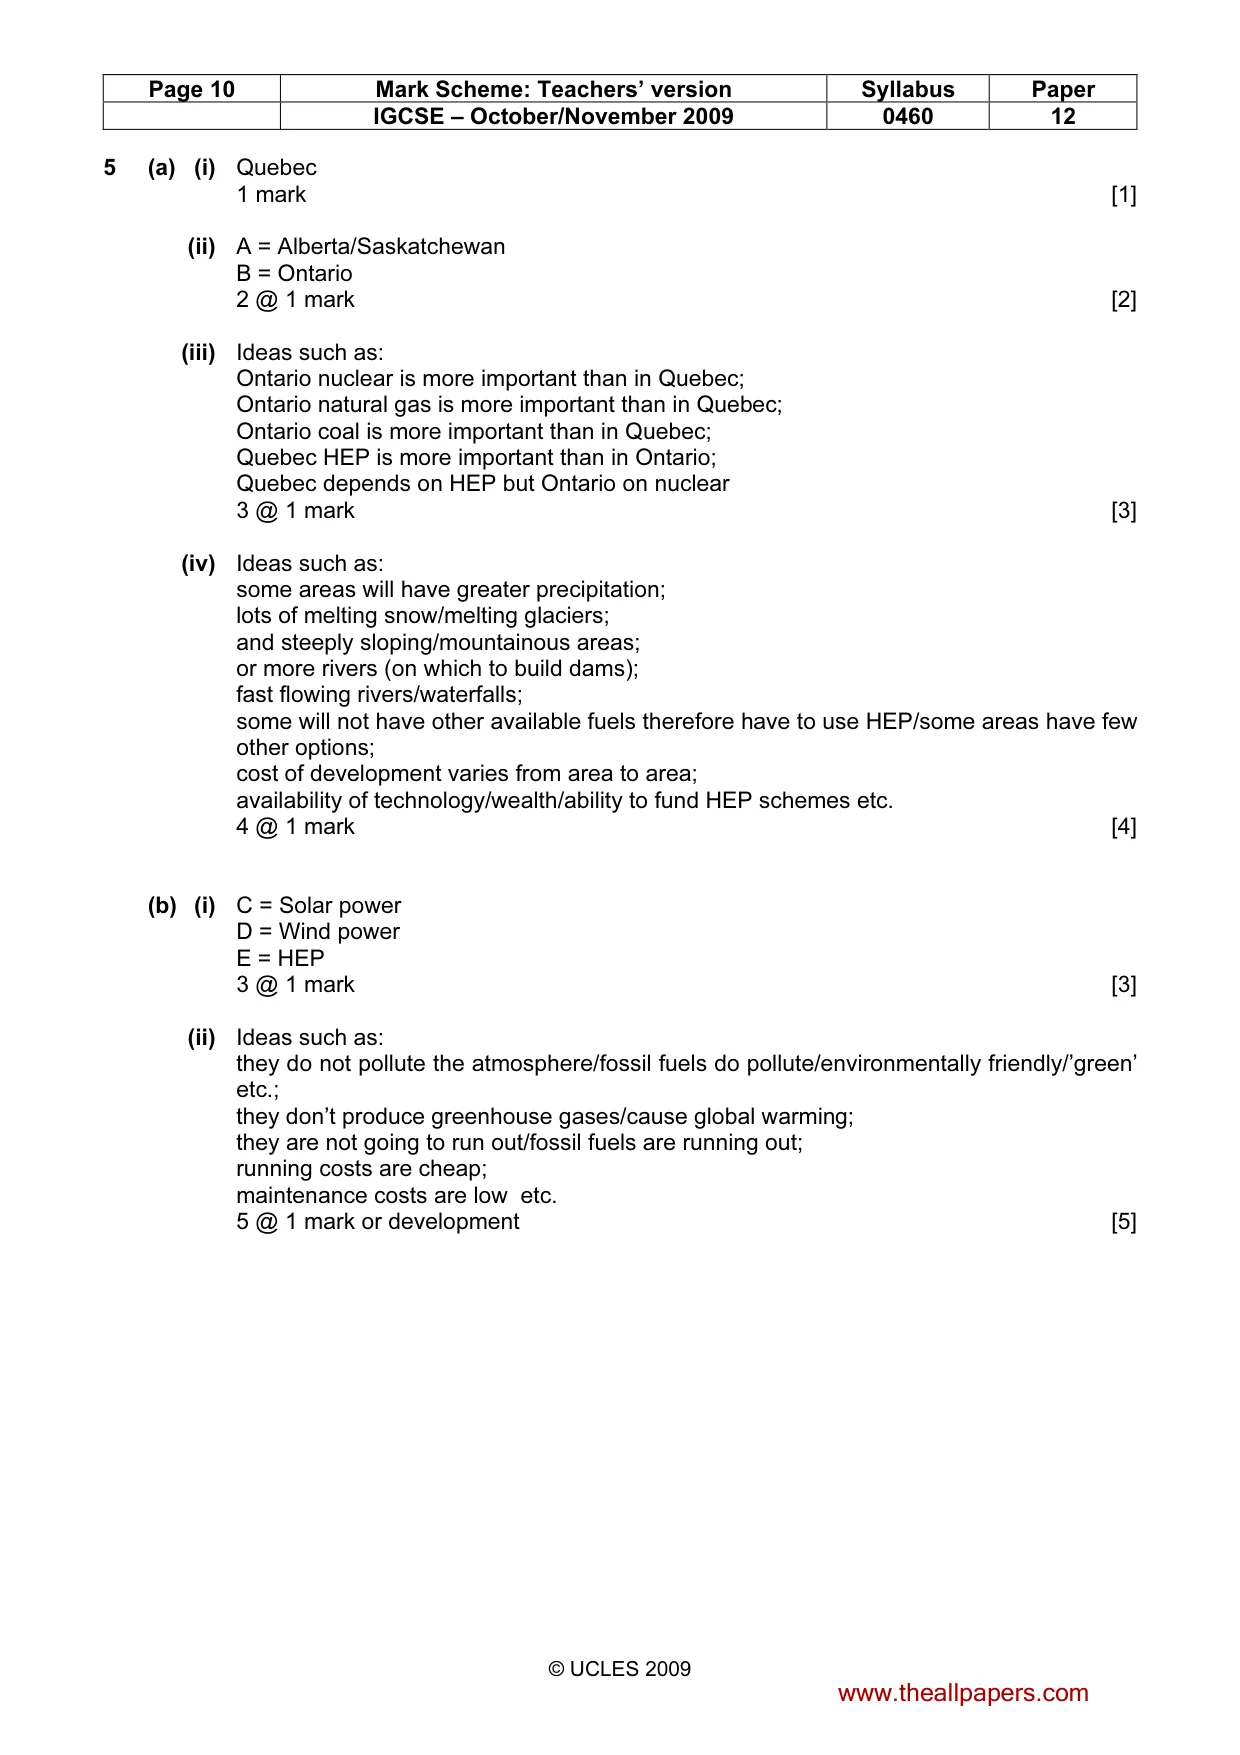
Page 10 Mark Scheme: Teachers’ version Syllabus Paper IGCSE – October/November 2009 0460 12 © UCLES 2009 5 (a) (i) Quebec 1 mark [1] (ii) A = Alberta/Saskatchewan B = Ontario 2 @ 1 mark [2] (iii) Ideas such as: Ontario nuclear is more important than in Quebec; Ontario natural gas is more important than in Quebec; Ontario coal is more important than in Quebec; Quebec HEP is more important than in Ontario; Quebec depends on HEP but Ontario on nuclear 3 @ 1 mark [3] (iv) Ideas such as: some areas will have greater precipitation; lots of melting snow/melting glaciers; and steeply sloping/mountainous areas; or more rivers (on which to build dams); fast flowing rivers/waterfalls; some will not have other available fuels therefore have to use HEP/some areas have few other options; cost of development varies from area to area; availability of technology/wealth/ability to fund HEP schemes etc. 4 @ 1 mark [4] (b) (i) C = Solar power D = Wind power E = HEP 3 @ 1 mark [3] (ii) Ideas such as: they do not pollute the atmosphere/fossil fuels do pollute/environmentally friendly/’green’ etc.; they don’t produce greenhouse gases/cause global warming; they are not going to run out/fossil fuels are running out; running costs are cheap; maintenance costs are low etc. 5 @ 1 mark or development [5] www.theallpapers.com
Mark scheme, page 11
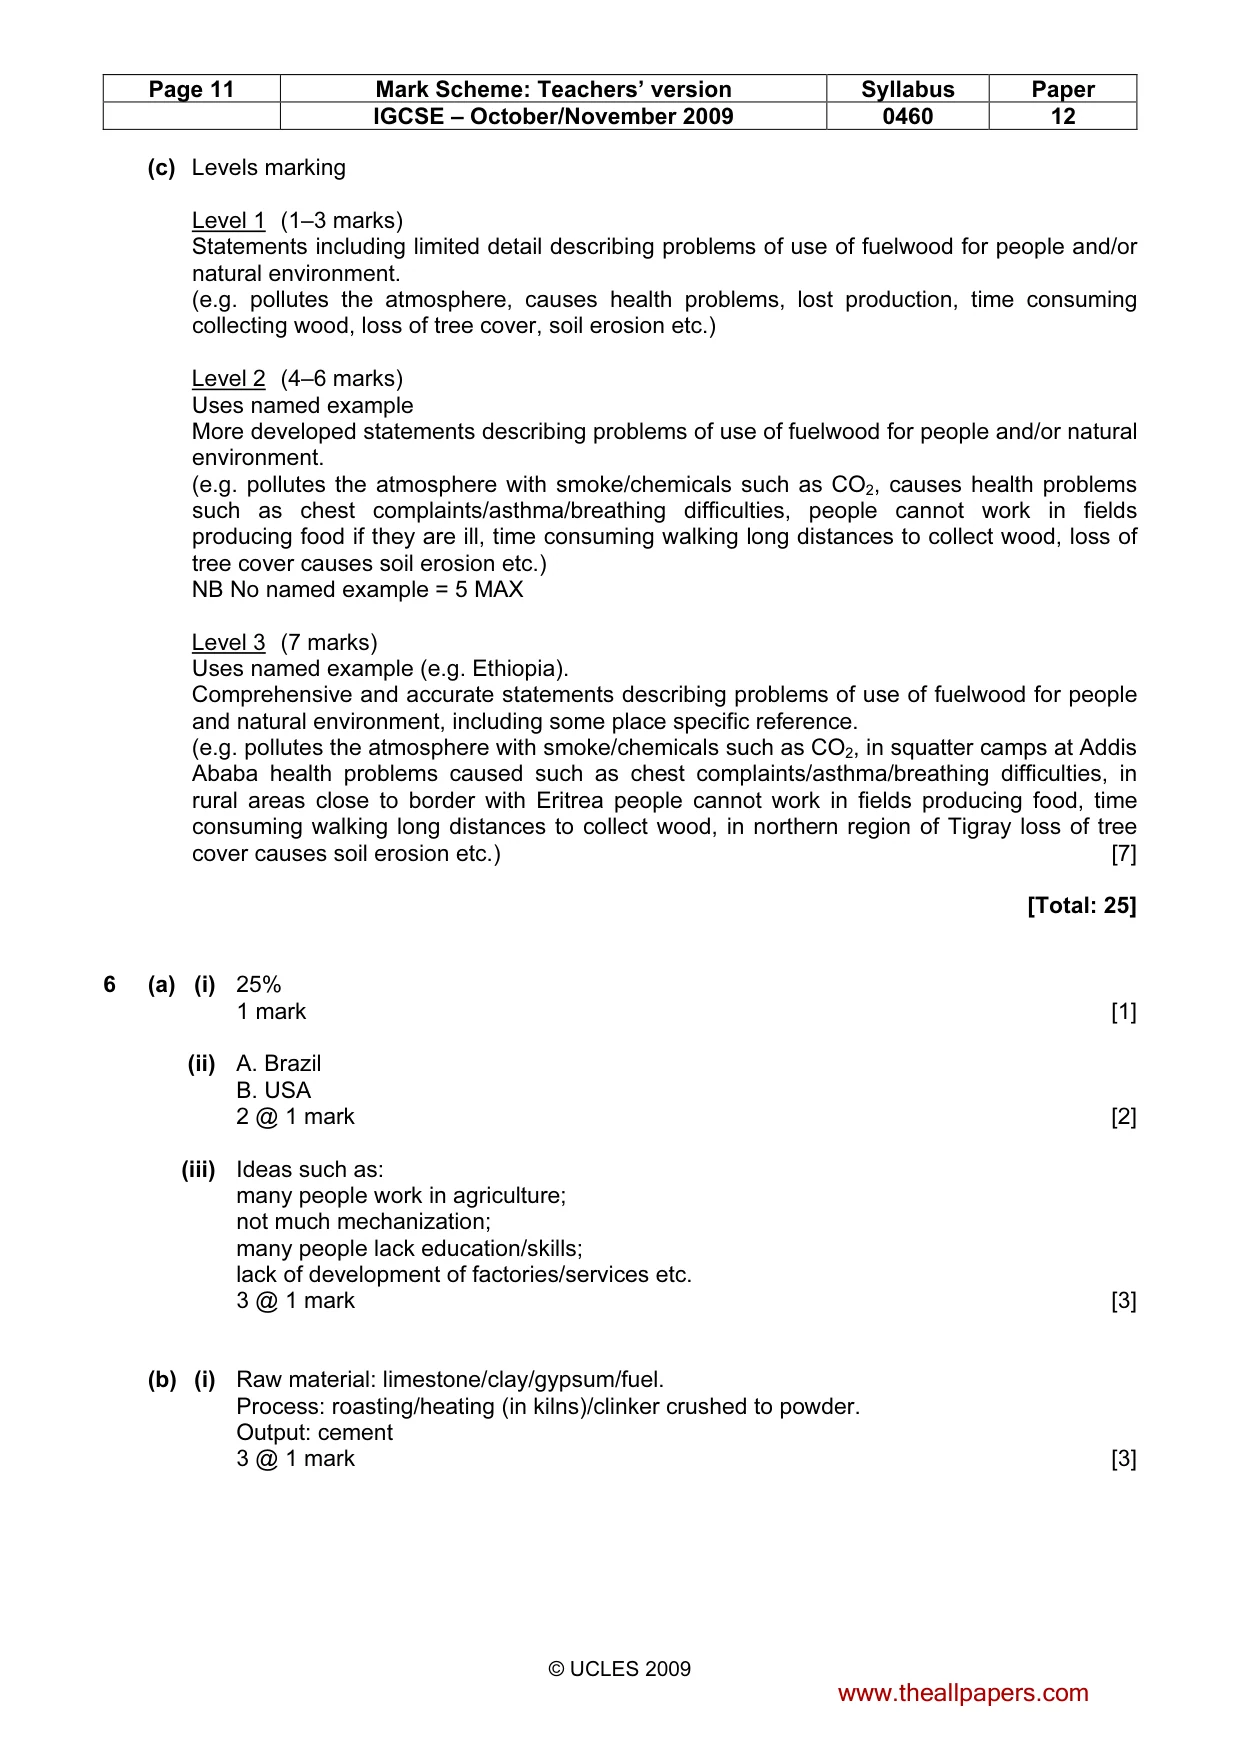
Page 11 Mark Scheme: Teachers’ version Syllabus Paper IGCSE – October/November 2009 0460 12 © UCLES 2009 (c) Levels marking Level 1 (1–3 marks) Statements including limited detail describing problems of use of fuelwood for people and/or natural environment. (e.g. pollutes the atmosphere, causes health problems, lost production, time consuming collecting wood, loss of tree cover, soil erosion etc.) Level 2 (4–6 marks) Uses named example More developed statements describing problems of use of fuelwood for people and/or natural environment. (e.g. pollutes the atmosphere with smoke/chemicals such as CO2, causes health problems such as chest complaints/asthma/breathing difficulties, people cannot work in fields producing food if they are ill, time consuming walking long distances to collect wood, loss of tree cover causes soil erosion etc.) NB No named example = 5 MAX Level 3 (7 marks) Uses named example (e.g. Ethiopia). Comprehensive and accurate statements describing problems of use of fuelwood for people and natural environment, including some place specific reference. (e.g. pollutes the atmosphere with smoke/chemicals such as CO2, in squatter camps at Addis Ababa health problems caused such as chest complaints/asthma/breathing difficulties, in rural areas close to border with Eritrea people cannot work in fields producing food, time consuming walking long distances to collect wood, in northern region of Tigray loss of tree cover causes soil erosion etc.) [7] [Total: 25] 6 (a) (i) 25% 1 mark [1] (ii) A. Brazil B. USA 2 @ 1 mark [2] (iii) Ideas such as: many people work in agriculture; not much mechanization; many people lack education/skills; lack of development of factories/services etc. 3 @ 1 mark [3] (b) (i) Raw material: limestone/clay/gypsum/fuel. Process: roasting/heating (in kilns)/clinker crushed to powder. Output: cement 3 @ 1 mark [3] www.theallpapers.com
Mark scheme, page 12
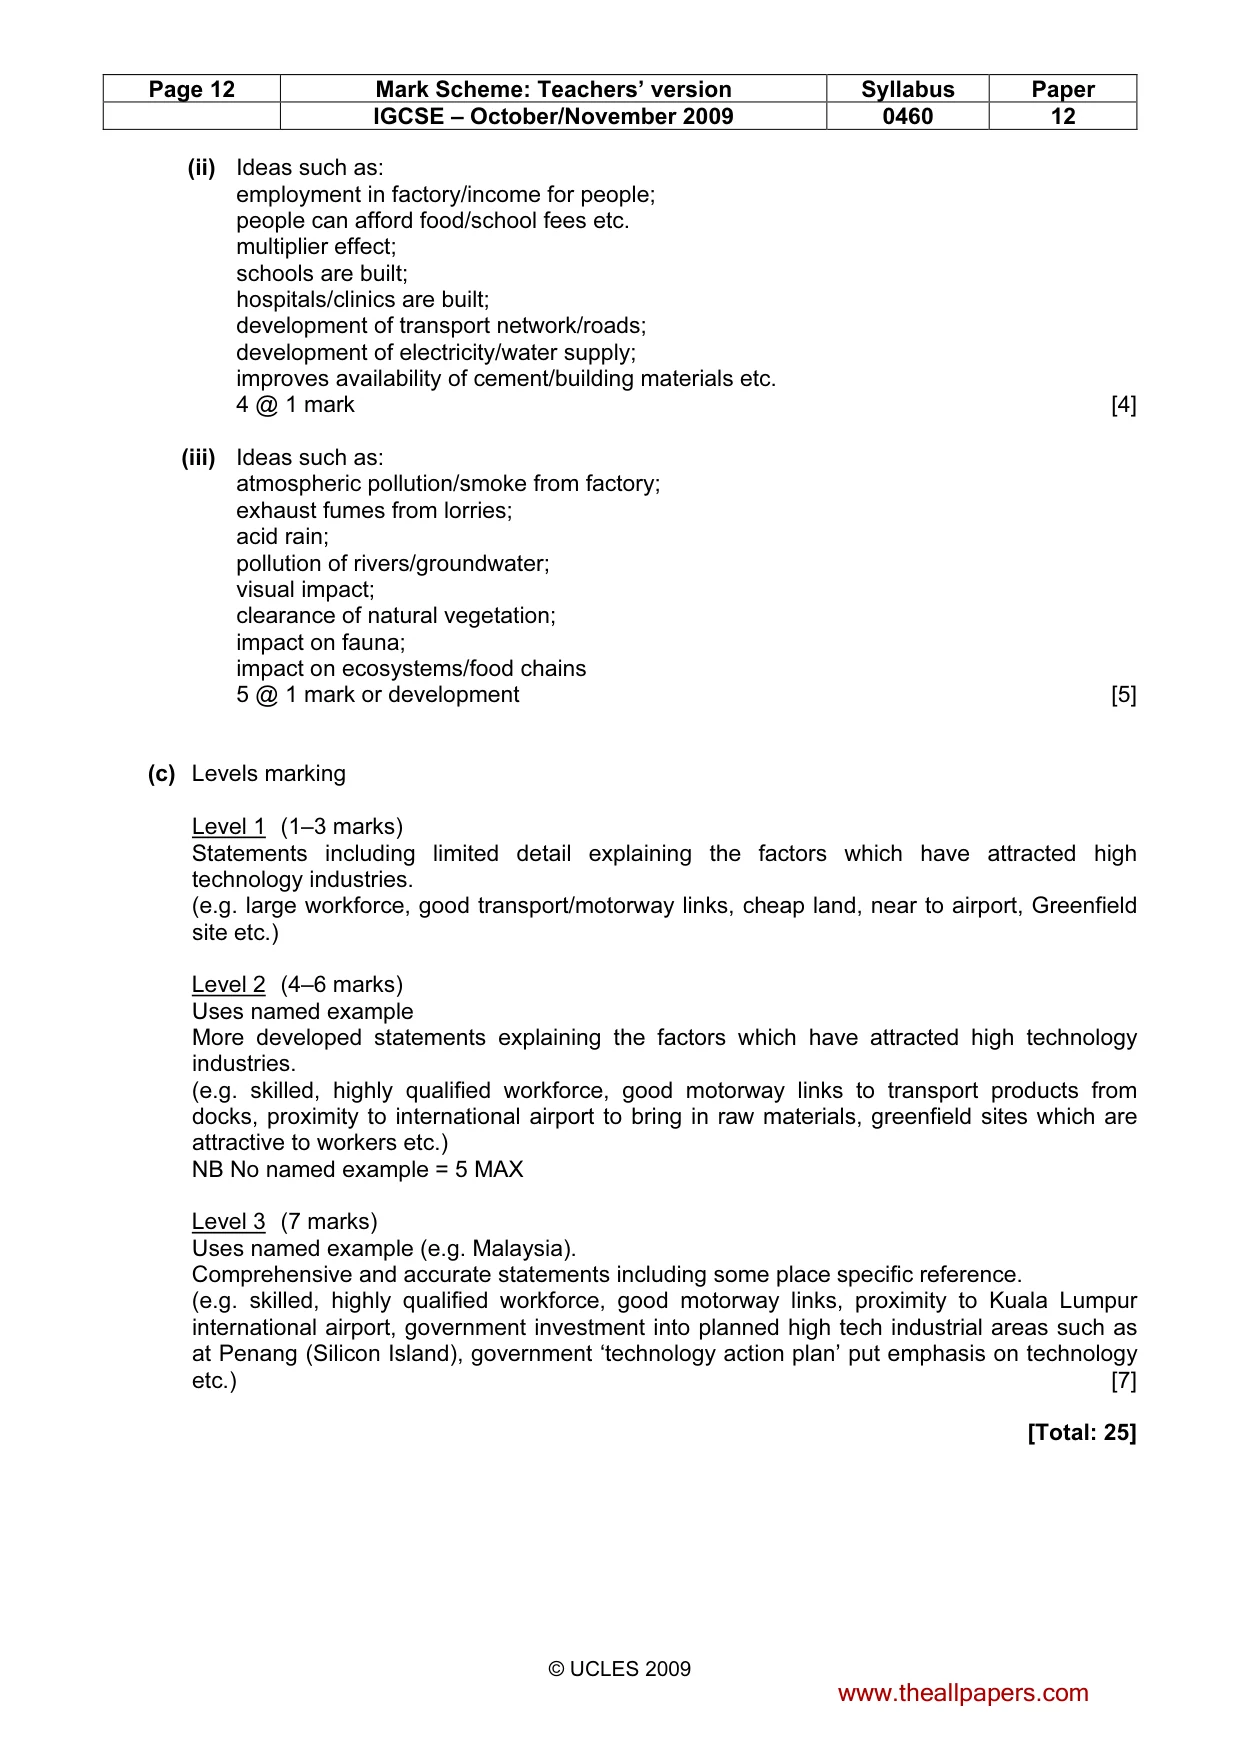
Page 12 Mark Scheme: Teachers’ version Syllabus Paper IGCSE – October/November 2009 0460 12 © UCLES 2009 (ii) Ideas such as: employment in factory/income for people; people can afford food/school fees etc. multiplier effect; schools are built; hospitals/clinics are built; development of transport network/roads; development of electricity/water supply; improves availability of cement/building materials etc. 4 @ 1 mark [4] (iii) Ideas such as: atmospheric pollution/smoke from factory; exhaust fumes from lorries; acid rain; pollution of rivers/groundwater; visual impact; clearance of natural vegetation; impact on fauna; impact on ecosystems/food chains 5 @ 1 mark or development [5] (c) Levels marking Level 1 (1–3 marks) Statements including limited detail explaining the factors which have attracted high technology industries. (e.g. large workforce, good transport/motorway links, cheap land, near to airport, Greenfield site etc.) Level 2 (4–6 marks) Uses named example More developed statements explaining the factors which have attracted high technology industries. (e.g. skilled, highly qualified workforce, good motorway links to transport products from docks, proximity to international airport to bring in raw materials, greenfield sites which are attractive to workers etc.) NB No named example = 5 MAX Level 3 (7 marks) Uses named example (e.g. Malaysia). Comprehensive and accurate statements including some place specific reference. (e.g. skilled, highly qualified workforce, good motorway links, proximity to Kuala Lumpur international airport, government investment into planned high tech industrial areas such as at Penang (Silicon Island), government ‘technology action plan’ put emphasis on technology etc.) [7] [Total: 25] www.theallpapers.com
What you needed in this session
Cambridge’s own grade thresholds for 2009 Oct/Nov, Paper 1 · Variant 2. A higher threshold means an easier paper — the bar moves with how the cohort did.