Cambridge IGCSE Environmental Management 0680 — 2019 May/June Paper 1 · Variant 2
0680/12/M/J/19 · 80 marks · ≈90 min
The question paper and its mark scheme, free to read here and free to download. This is Cambridge’s own paper, exactly as it was sat.
Question paper20 pages


Mark scheme13 pages
Answers below. Sit the paper first if you are practising.
Paper as text
Question paper, page 1
This document consists of 17 printed pages and 3 blank pages. DC (KN/CB) 168045/2 © UCLES 2019 [Turn over * 1 0 2 5 2 7 6 1 4 2 * ENVIRONMENTAL MANAGEMENT 0680/12 Paper 1 Theory May/June 2019 1 hour 45 minutes Candidates answer on the Question Paper. No Additional Materials are required. READ THESE INSTRUCTIONS FIRST Write your centre number, candidate number and name in the spaces at the top of this page. Write in dark blue or black pen. You may use an HB pencil for any diagrams or graphs. Do not use staples, paper clips, glue or correction fluid. DO NOT WRITE IN ANY BARCODES. Answer all questions. Electronic calculators may be used. You may lose marks if you do not show your working or if you do not use appropriate units. At the end of the examination, fasten all your work securely together. The number of marks is given in brackets [ ] at the end of each question or part question. Cambridge Assessment International Education Cambridge International General Certificate of Secondary Education
Question paper, page 2
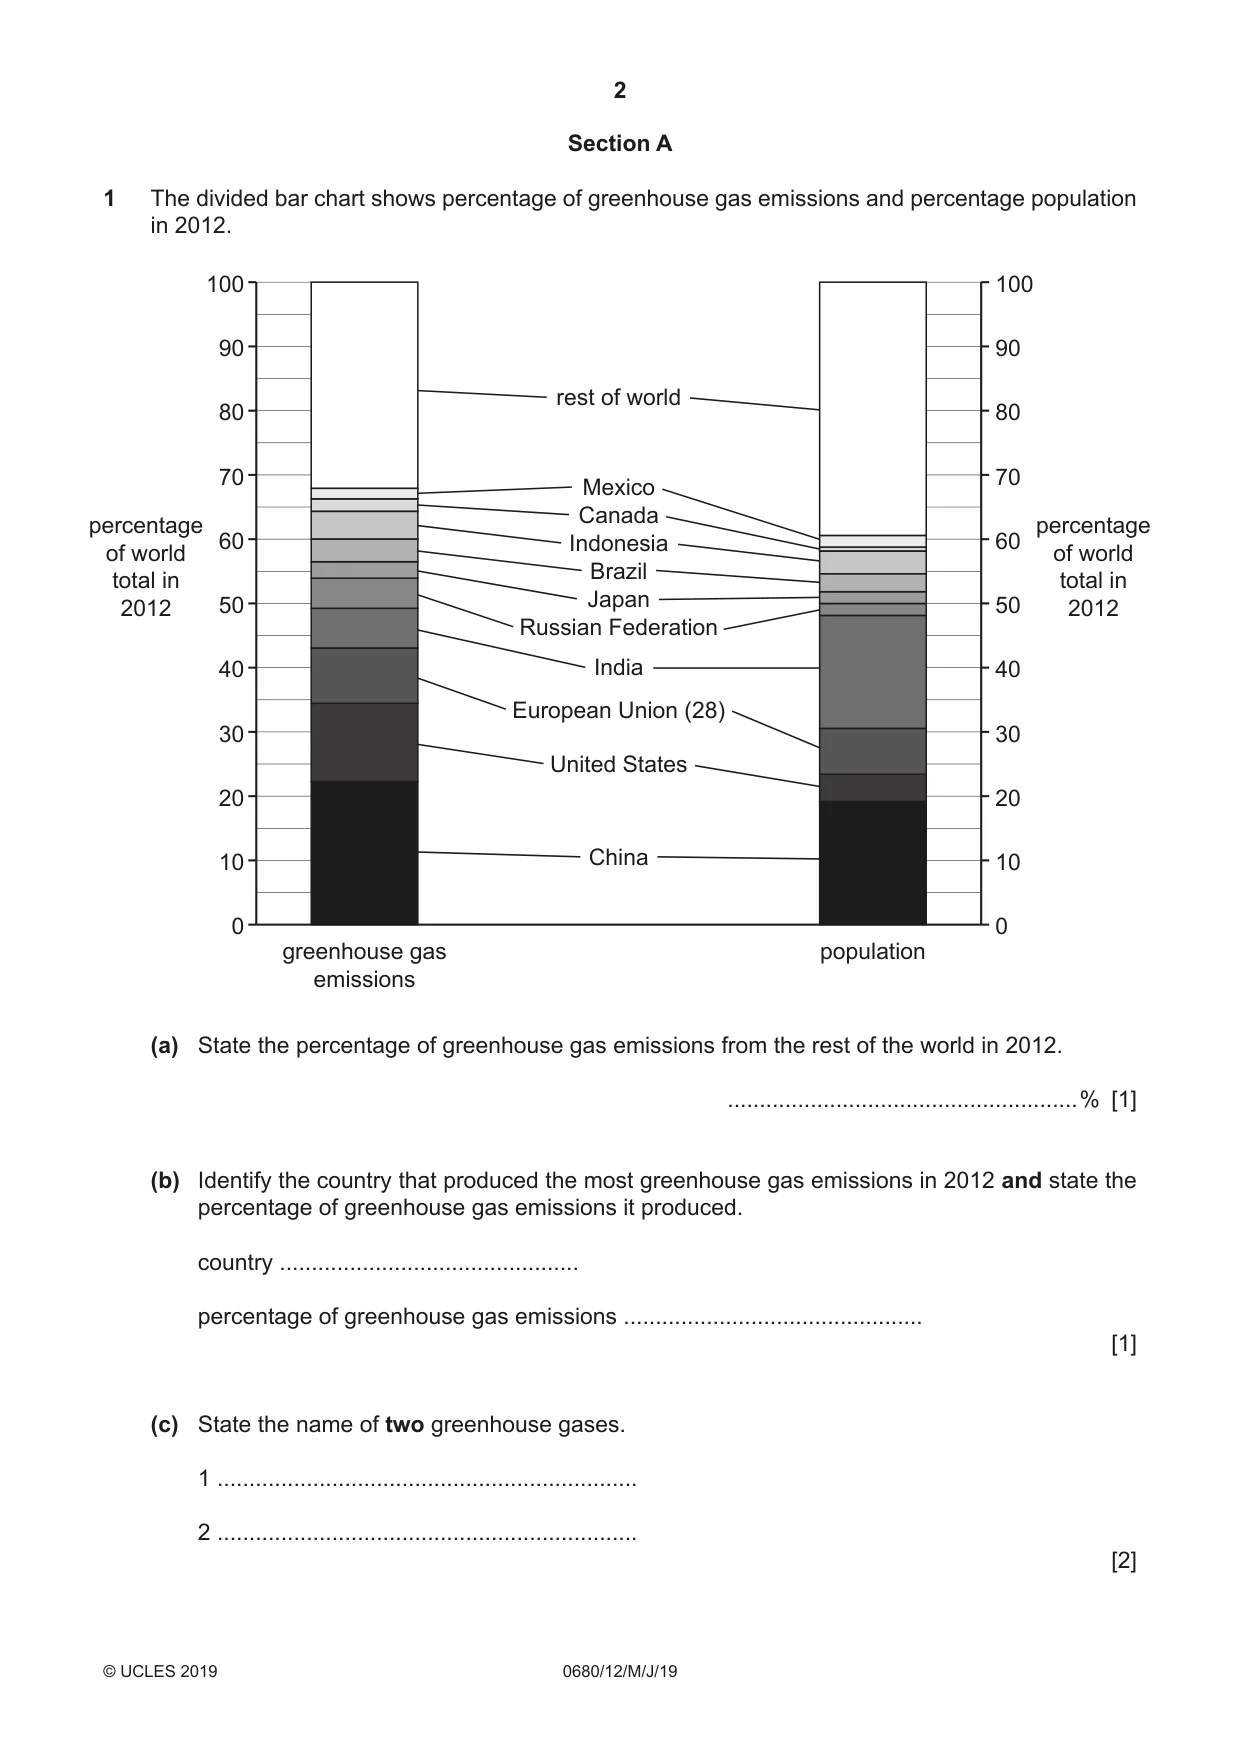
2 0680/12/M/J/19 © UCLES 2019 Section A 1 The divided bar chart shows percentage of greenhouse gas emissions and percentage population in 2012. 0 10 20 30 40 50 percentage of world total in 2012 greenhouse gas emissions population rest of world Mexico Canada Russian Federation China Indonesia Brazil European Union (28) India Japan United States 60 70 80 90 100 0 10 20 30 40 50 percentage of world total in 2012 60 70 80 90 100 (a) State the percentage of greenhouse gas emissions from the rest of the world in 2012. …% [1] (b) Identify the country that produced the most greenhouse gas emissions in 2012 and state the percentage of greenhouse gas emissions it produced. country … percentage of greenhouse gas emissions … [1] (c) State the name of two greenhouse gases. 1 … 2 … [2]
Question paper, page 3
3 0680/12/M/J/19 © UCLES 2019 [Turn over (d) India contains nearly 19% of the world’s population, but contributes only 6% of the world’s greenhouse gases. Suggest reasons why. … … … … … … [3] [Total: 7]
Question paper, page 4
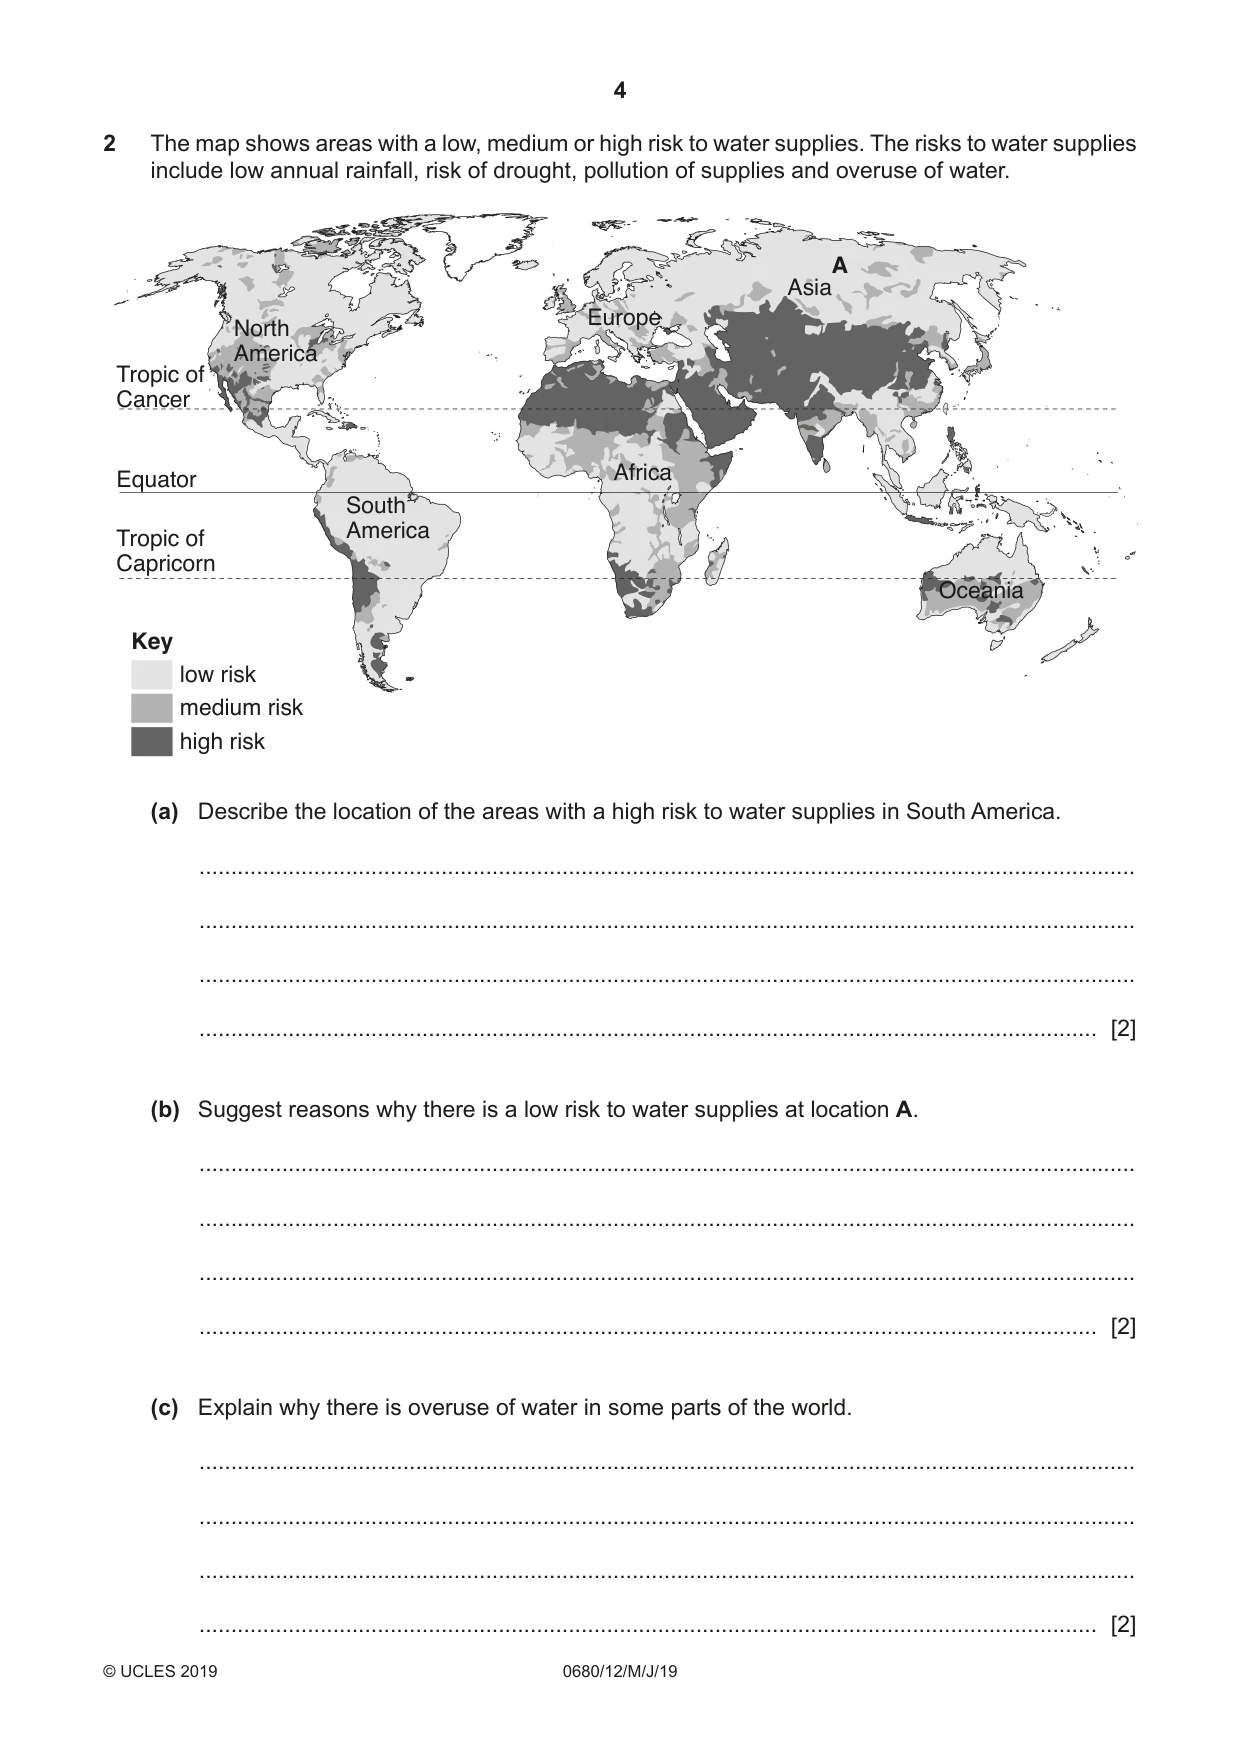
4 0680/12/M/J/19 © UCLES 2019 2 The map shows areas with a low, medium or high risk to water supplies. The risks to water supplies include low annual rainfall, risk of drought, pollution of supplies and overuse of water. Key low risk medium risk high risk Equator Tropic of Capricorn Tropic of Cancer North America South America Africa Europe Asia A Oceania (a) Describe the location of the areas with a high risk to water supplies in South America. … … … … [2] (b) Suggest reasons why there is a low risk to water supplies at location A. … … … … [2] (c) Explain why there is overuse of water in some parts of the world. … … … … [2]
Question paper, page 5
5 0680/12/M/J/19 © UCLES 2019 [Turn over (d) State two strategies farmers can use to prepare for the impacts of drought. 1 … … 2 … … [2] [Total: 8]
Question paper, page 6
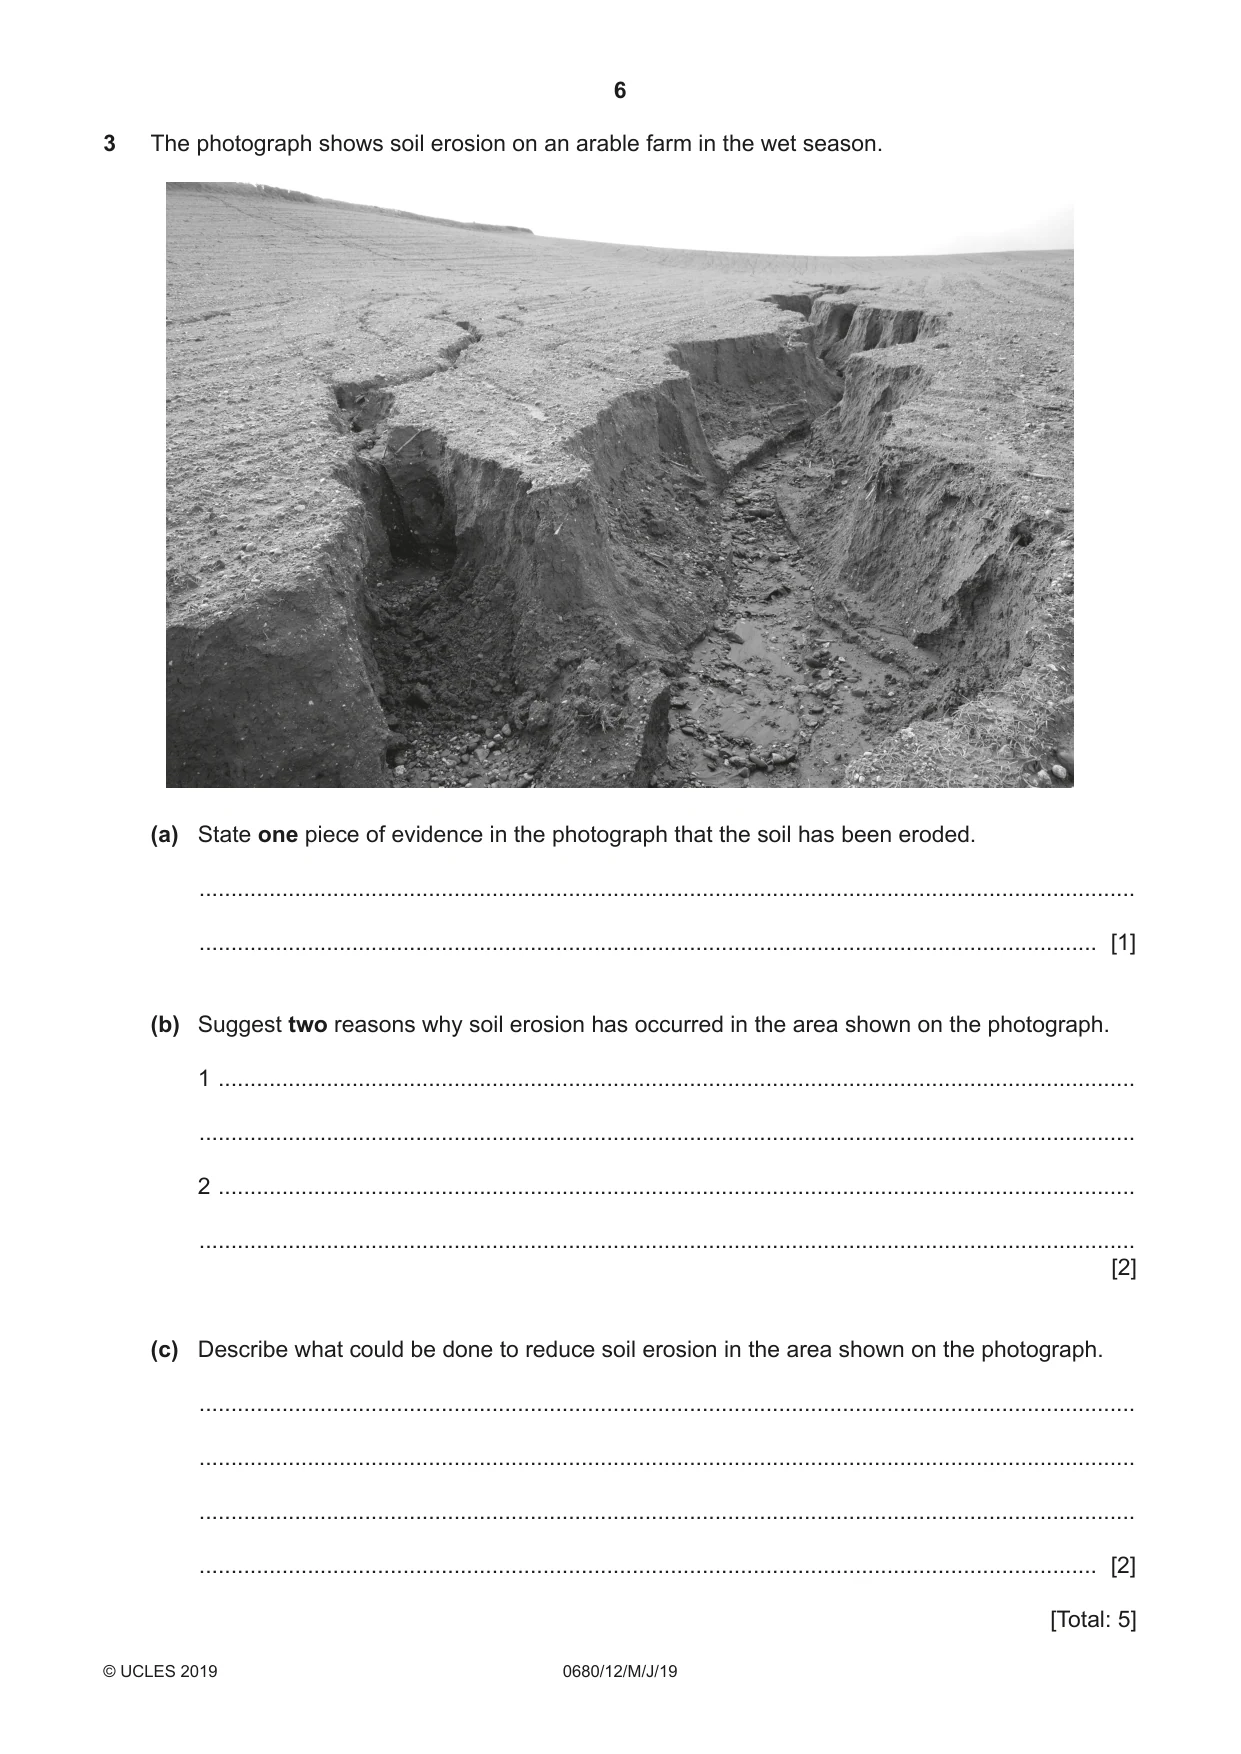
6 0680/12/M/J/19 © UCLES 2019 3 The photograph shows soil erosion on an arable farm in the wet season. (a) State one piece of evidence in the photograph that the soil has been eroded. … … [1] (b) Suggest two reasons why soil erosion has occurred in the area shown on the photograph. 1 … … 2 … … [2] (c) Describe what could be done to reduce soil erosion in the area shown on the photograph. … … … … [2] [Total: 5]
Question paper, page 7
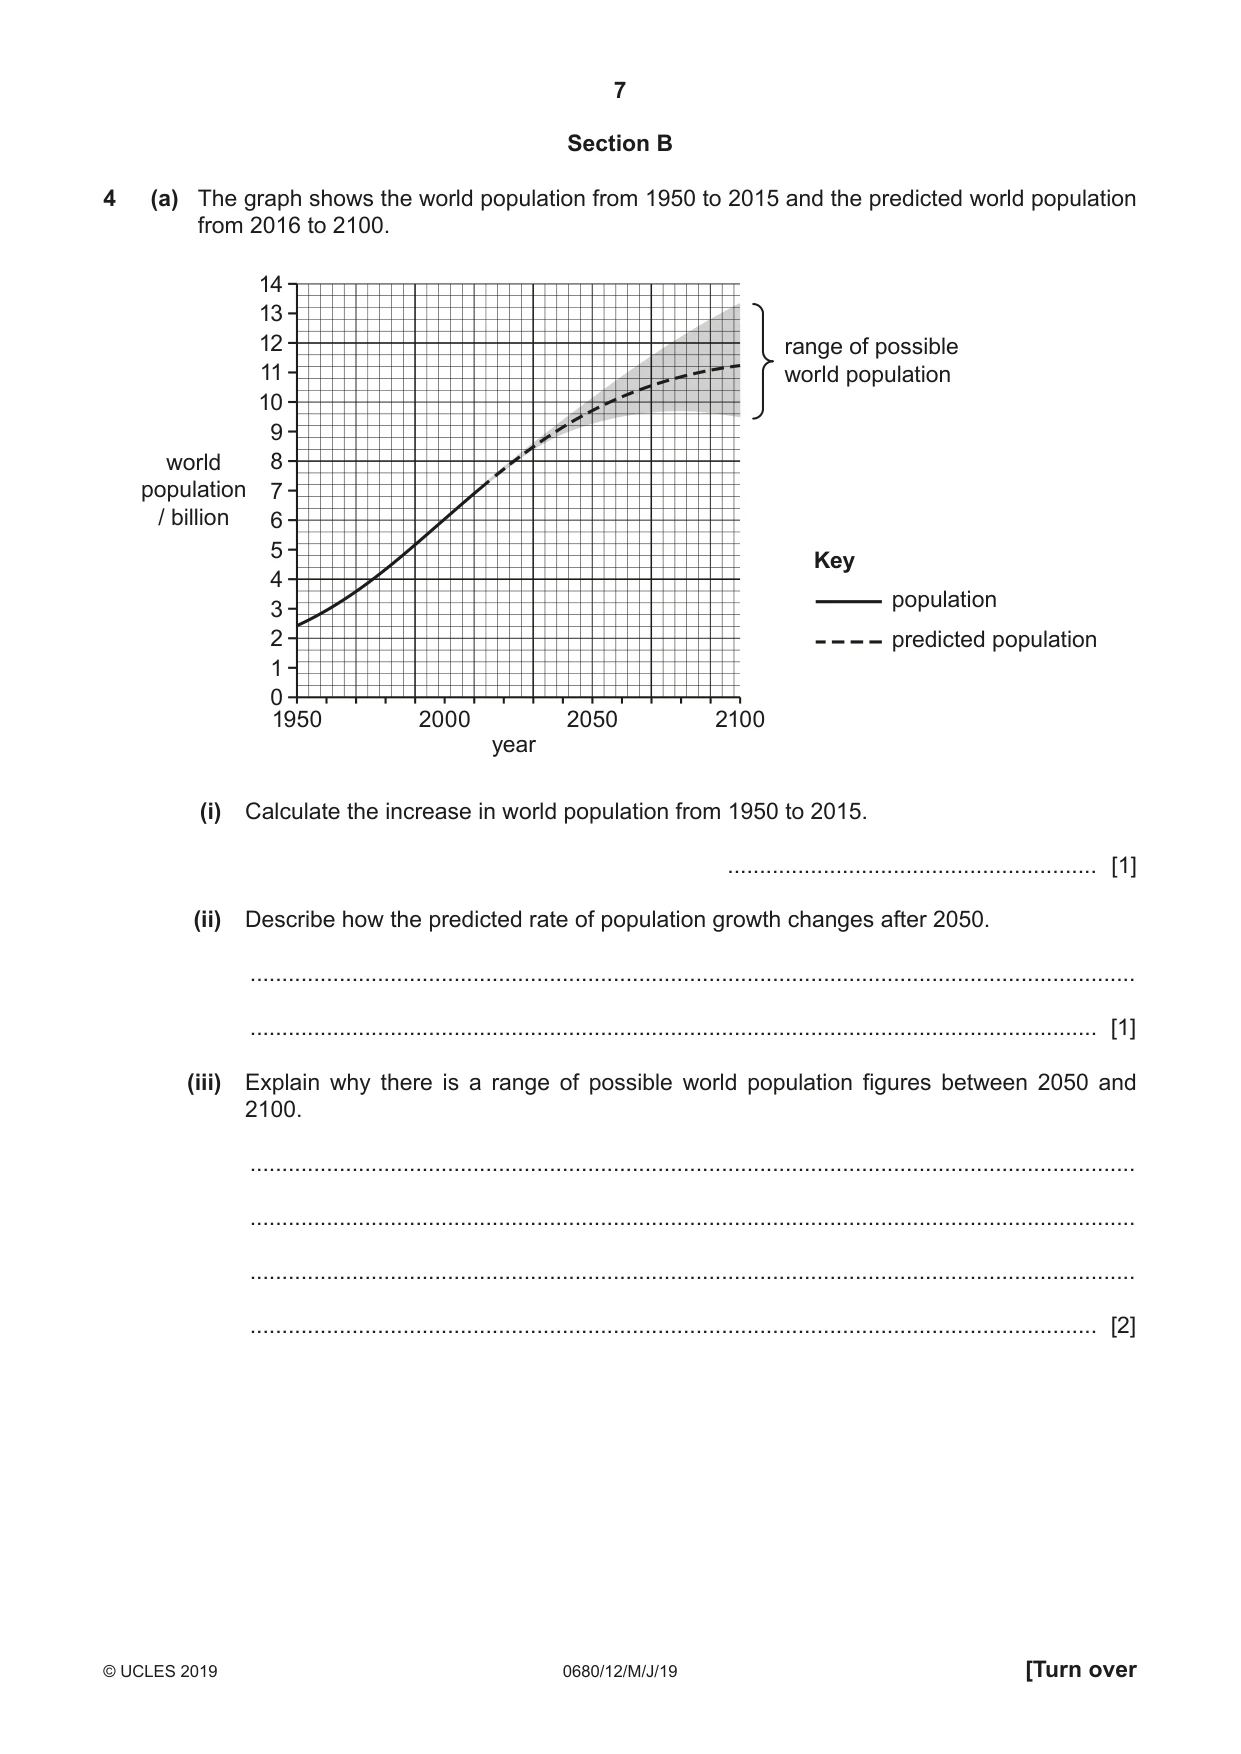
7 0680/12/M/J/19 © UCLES 2019 [Turn over Section B 4 (a) The graph shows the world population from 1950 to 2015 and the predicted world population from 2016 to 2100. 1950 0 1 2 3 4 5 6 7 8 9 10 11 12 13 14 2000 2050 2100 world population / billion year range of possible world population Key population predicted population (i) Calculate the increase in world population from 1950 to 2015. … [1] (ii) Describe how the predicted rate of population growth changes after 2050. … … [1] (iii) Explain why there is a range of possible world population figures between 2050 and 2100. … … … … [2]
Question paper, page 8
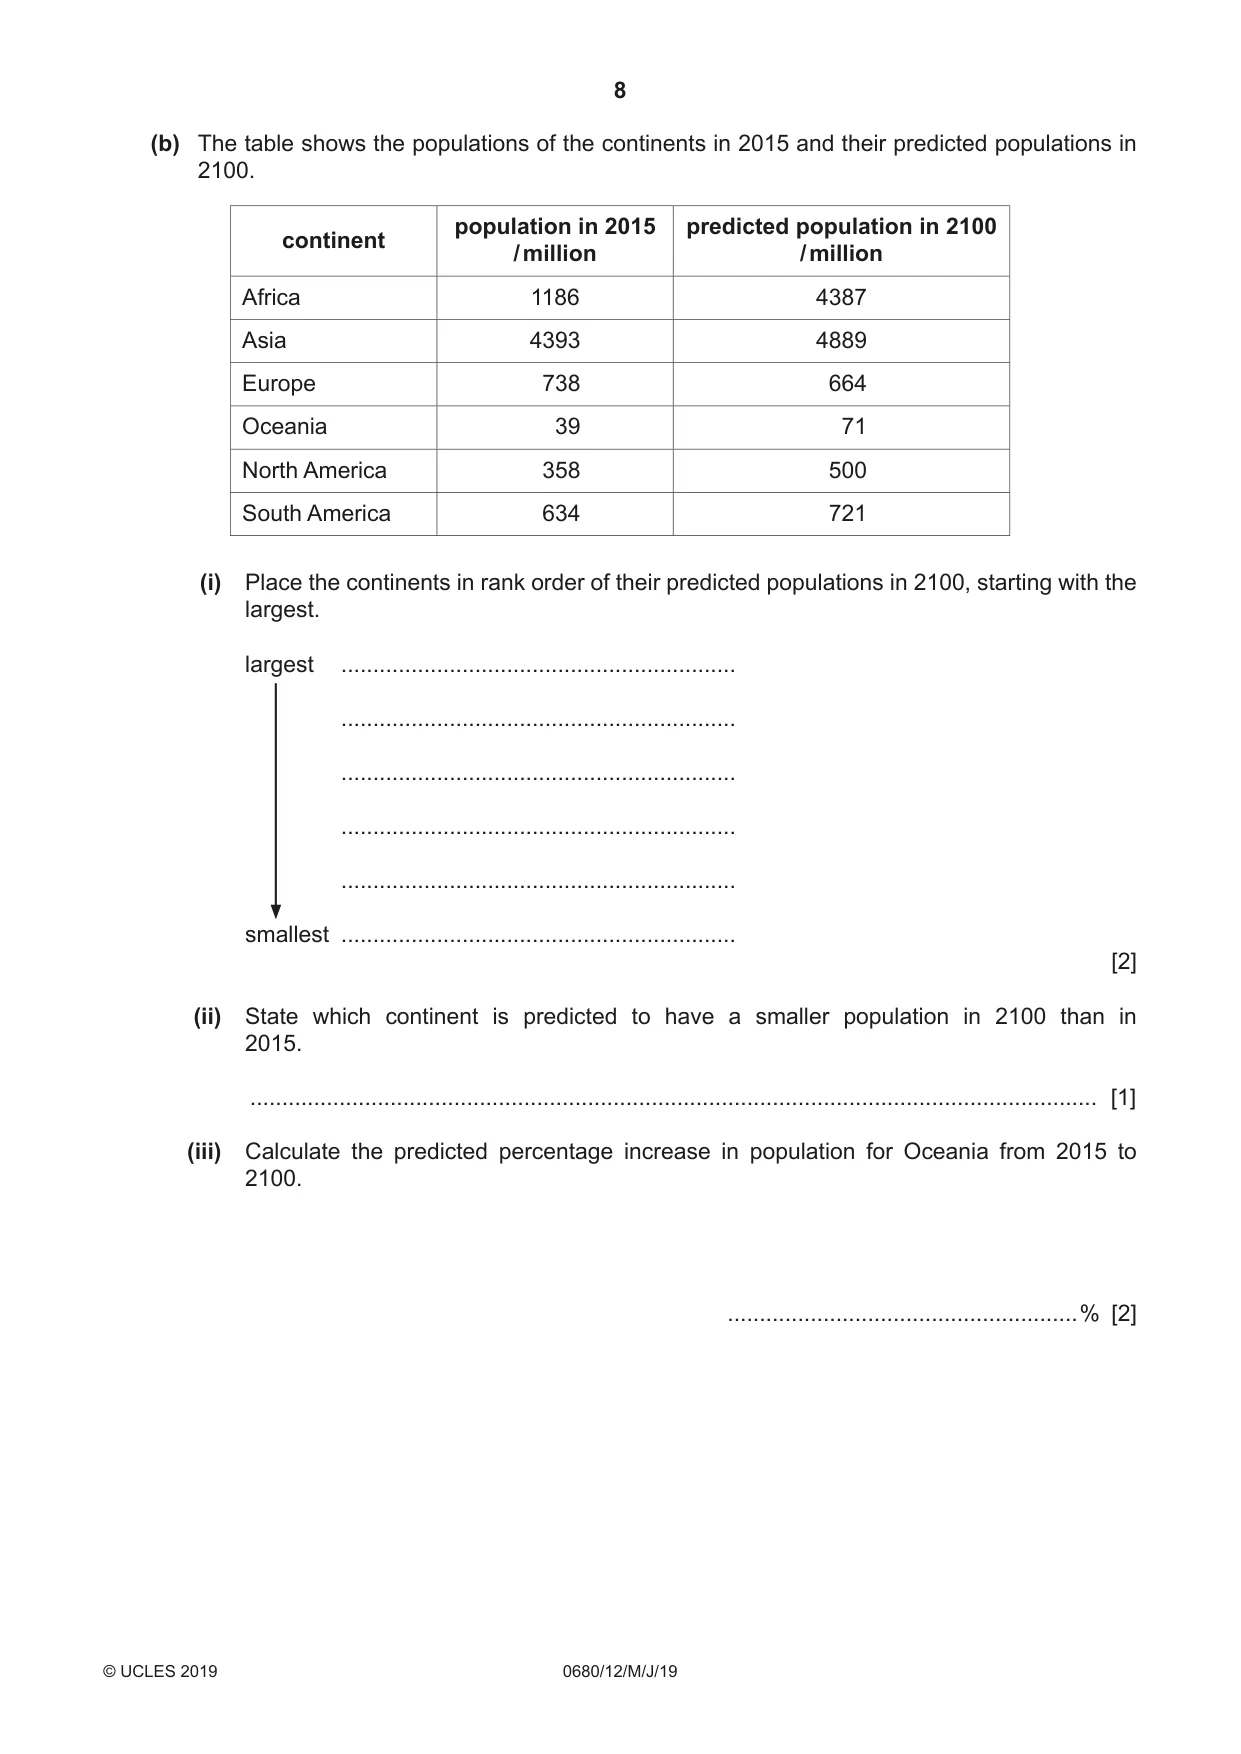
8 0680/12/M/J/19 © UCLES 2019 (b) The table shows the populations of the continents in 2015 and their predicted populations in 2100. continent population in 2015 / million predicted population in 2100 / million Africa 1186 4387 Asia 4393 4889 Europe 738 664 Oceania 39 71 North America 358 500 South America 634 721 (i) Place the continents in rank order of their predicted populations in 2100, starting with the largest. largest … … … … … smallest … [2] (ii) State which continent is predicted to have a smaller population in 2100 than in 2015. … [1] (iii) Calculate the predicted percentage increase in population for Oceania from 2015 to 2100. …% [2]
Question paper, page 9
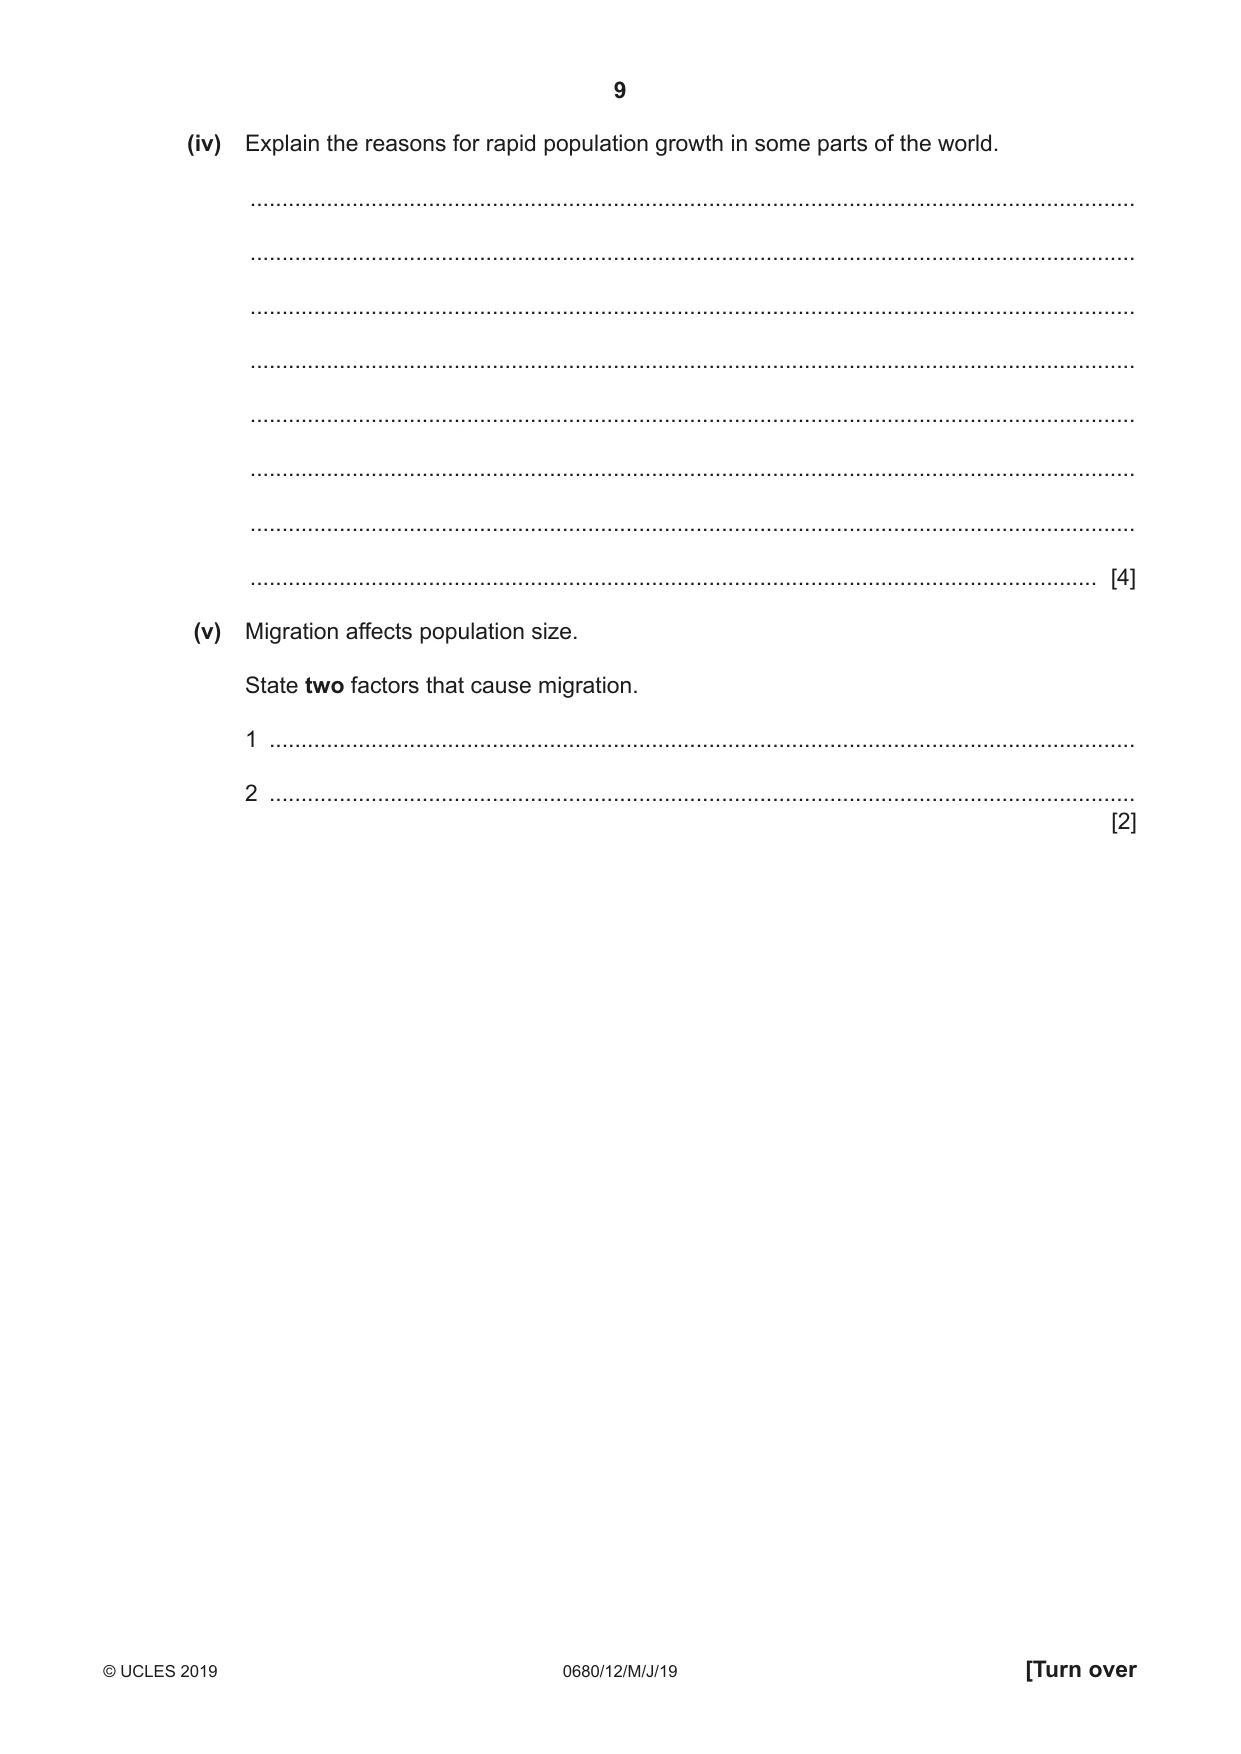
9 0680/12/M/J/19 © UCLES 2019 [Turn over (iv) Explain the reasons for rapid population growth in some parts of the world. … … … … … … … … [4] (v) Migration affects population size. State two factors that cause migration. 1 … 2 … [2]
Question paper, page 10
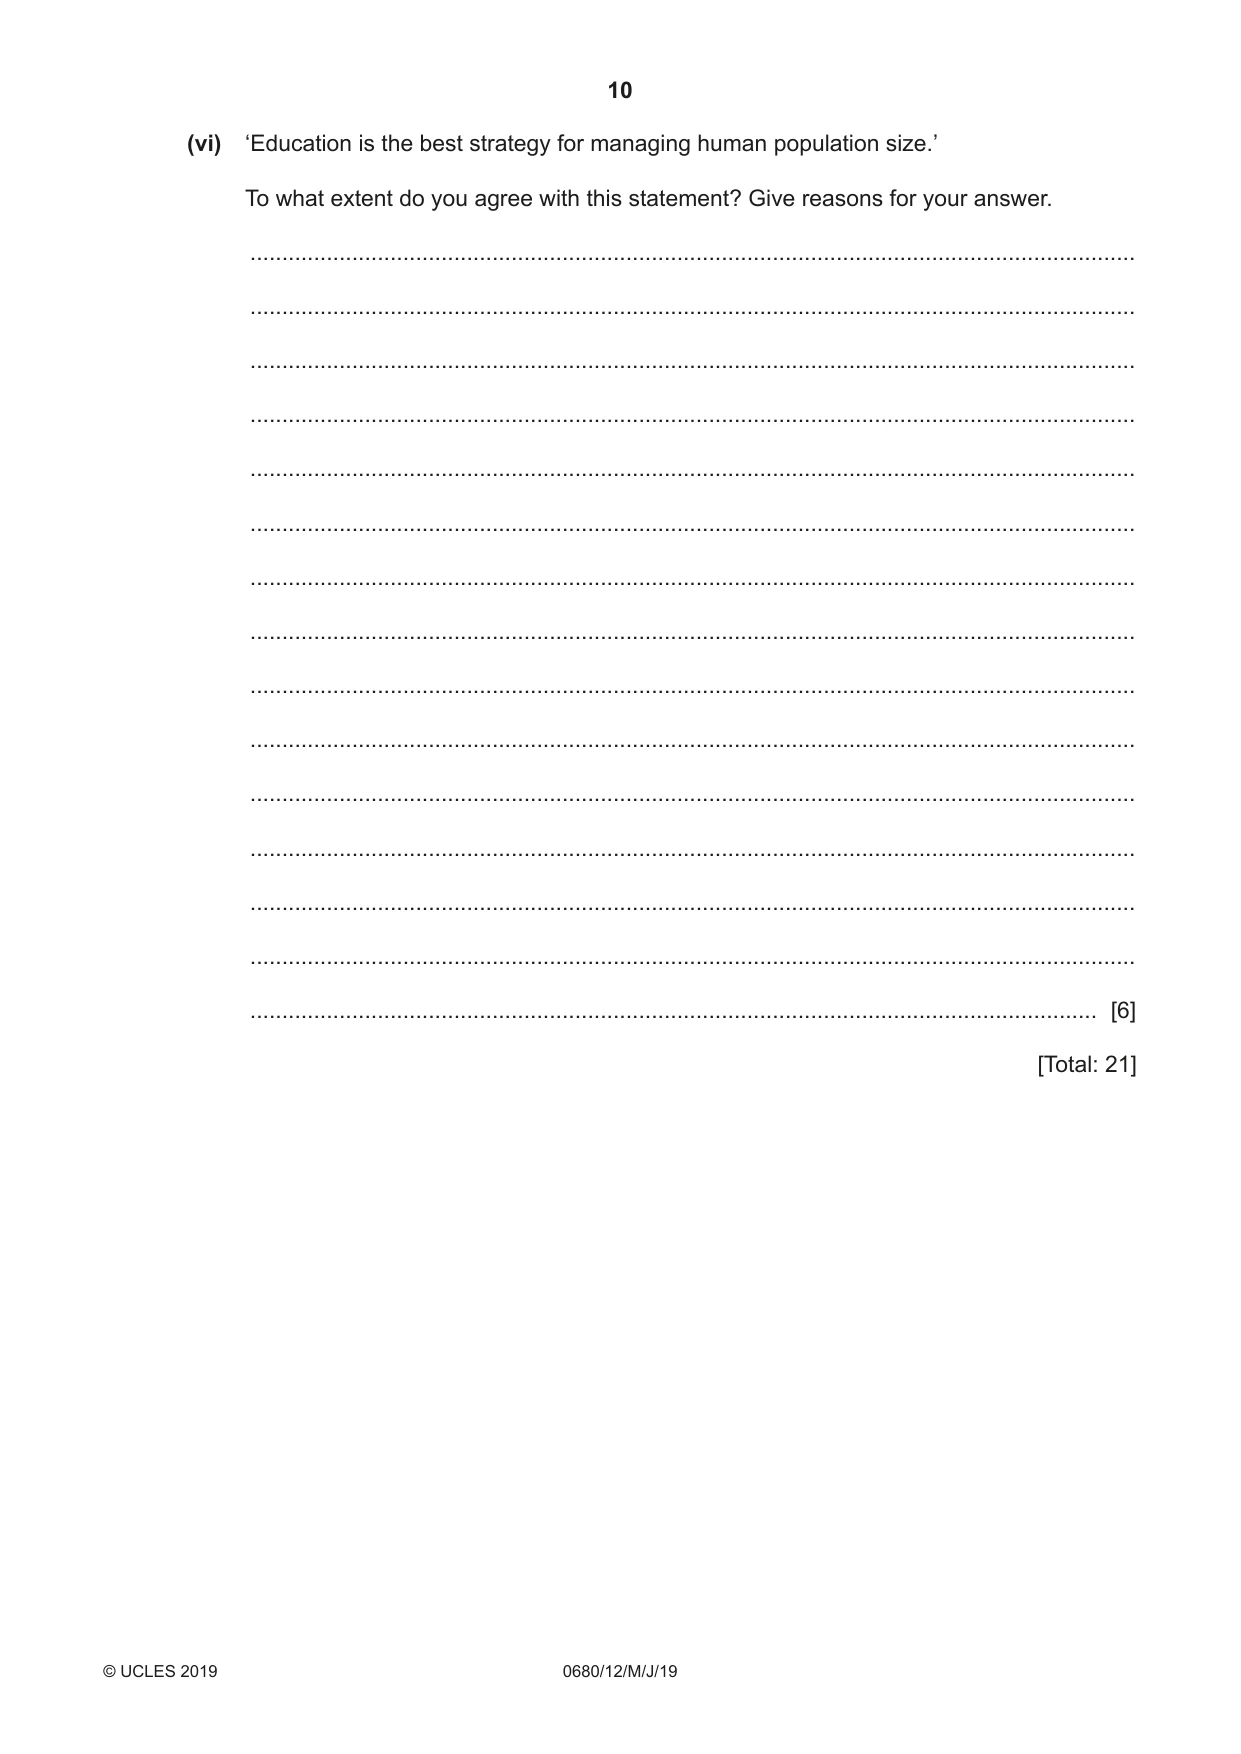
10 0680/12/M/J/19 © UCLES 2019 (vi) ‘Education is the best strategy for managing human population size.’ To what extent do you agree with this statement? Give reasons for your answer. … … … … … … … … … … … … … … … [6] [Total: 21]
Question paper, page 11
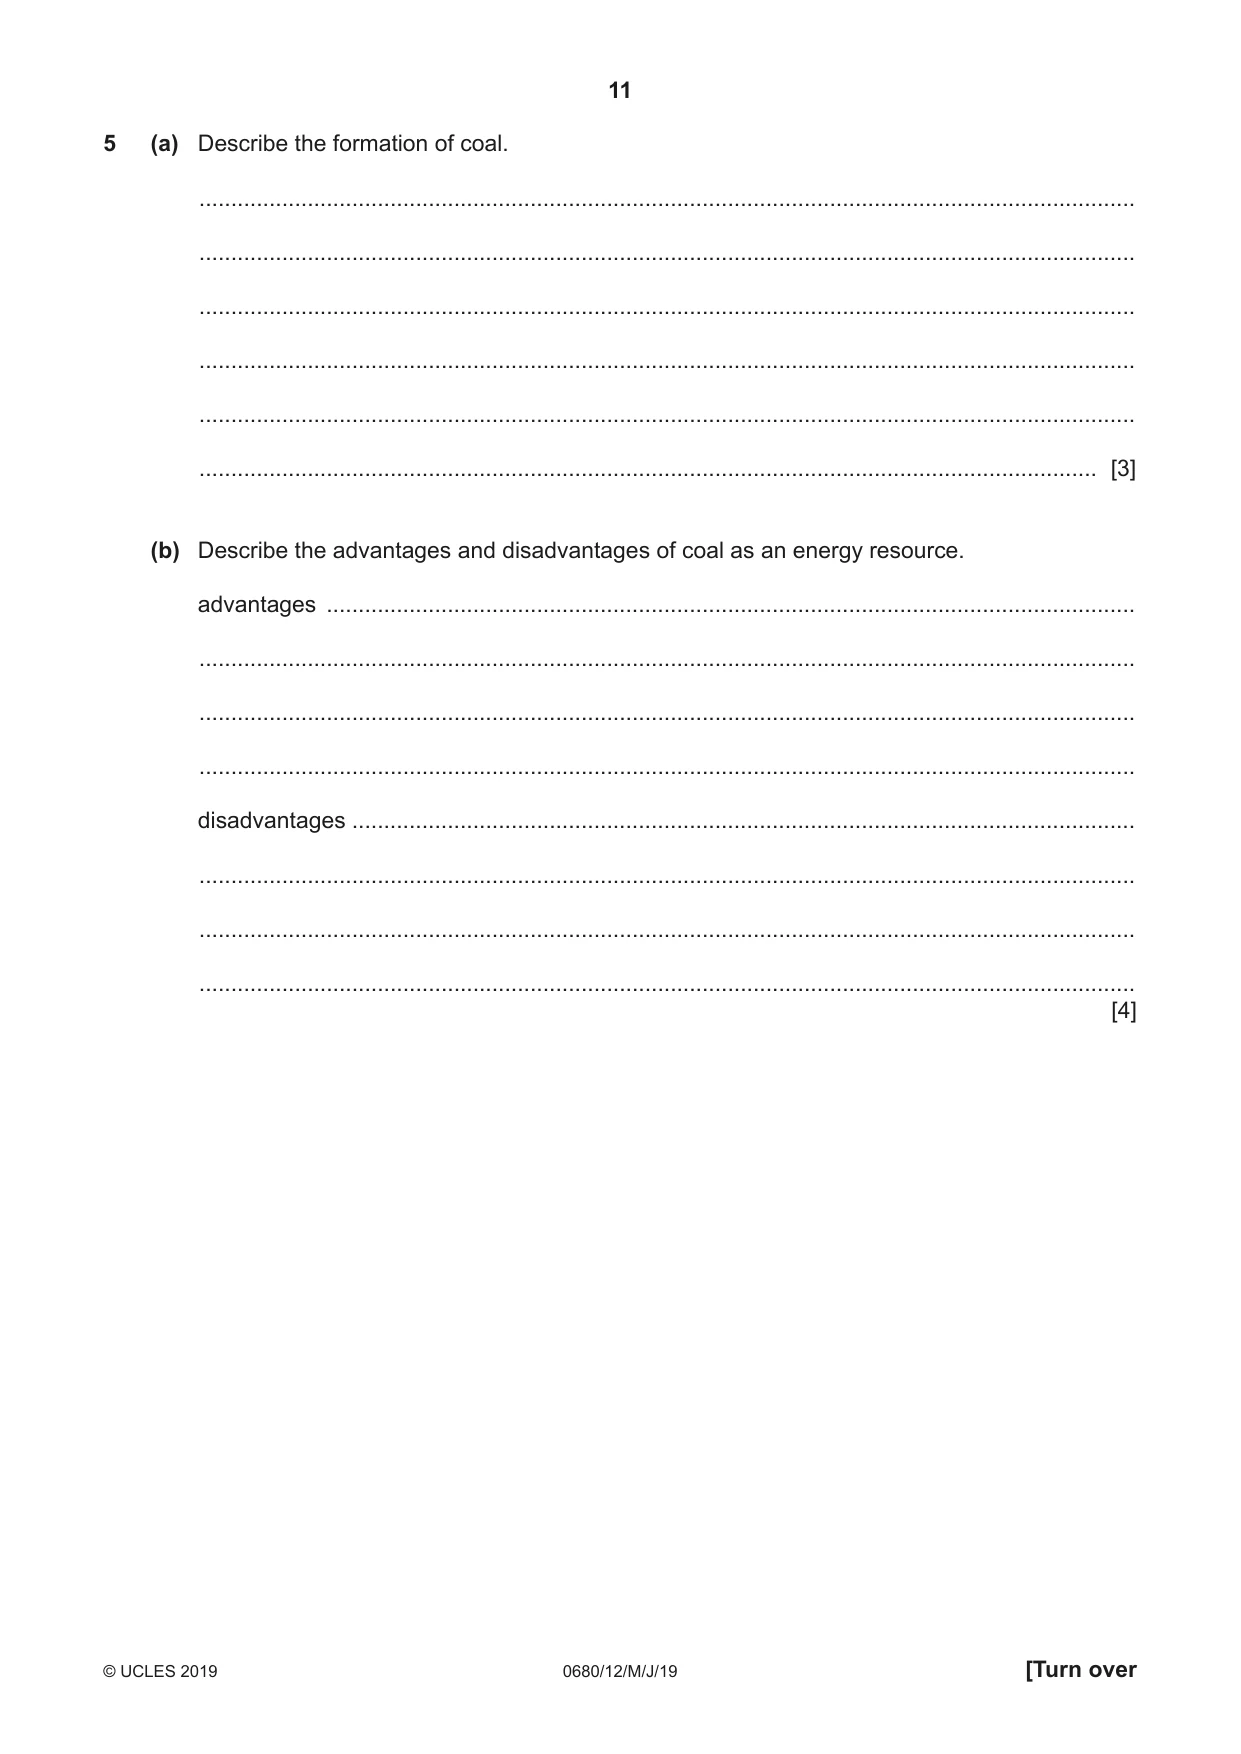
11 0680/12/M/J/19 © UCLES 2019 [Turn over 5 (a) Describe the formation of coal. … … … … … … [3] (b) Describe the advantages and disadvantages of coal as an energy resource. advantages … … … … disadvantages … … … … [4]
Question paper, page 12
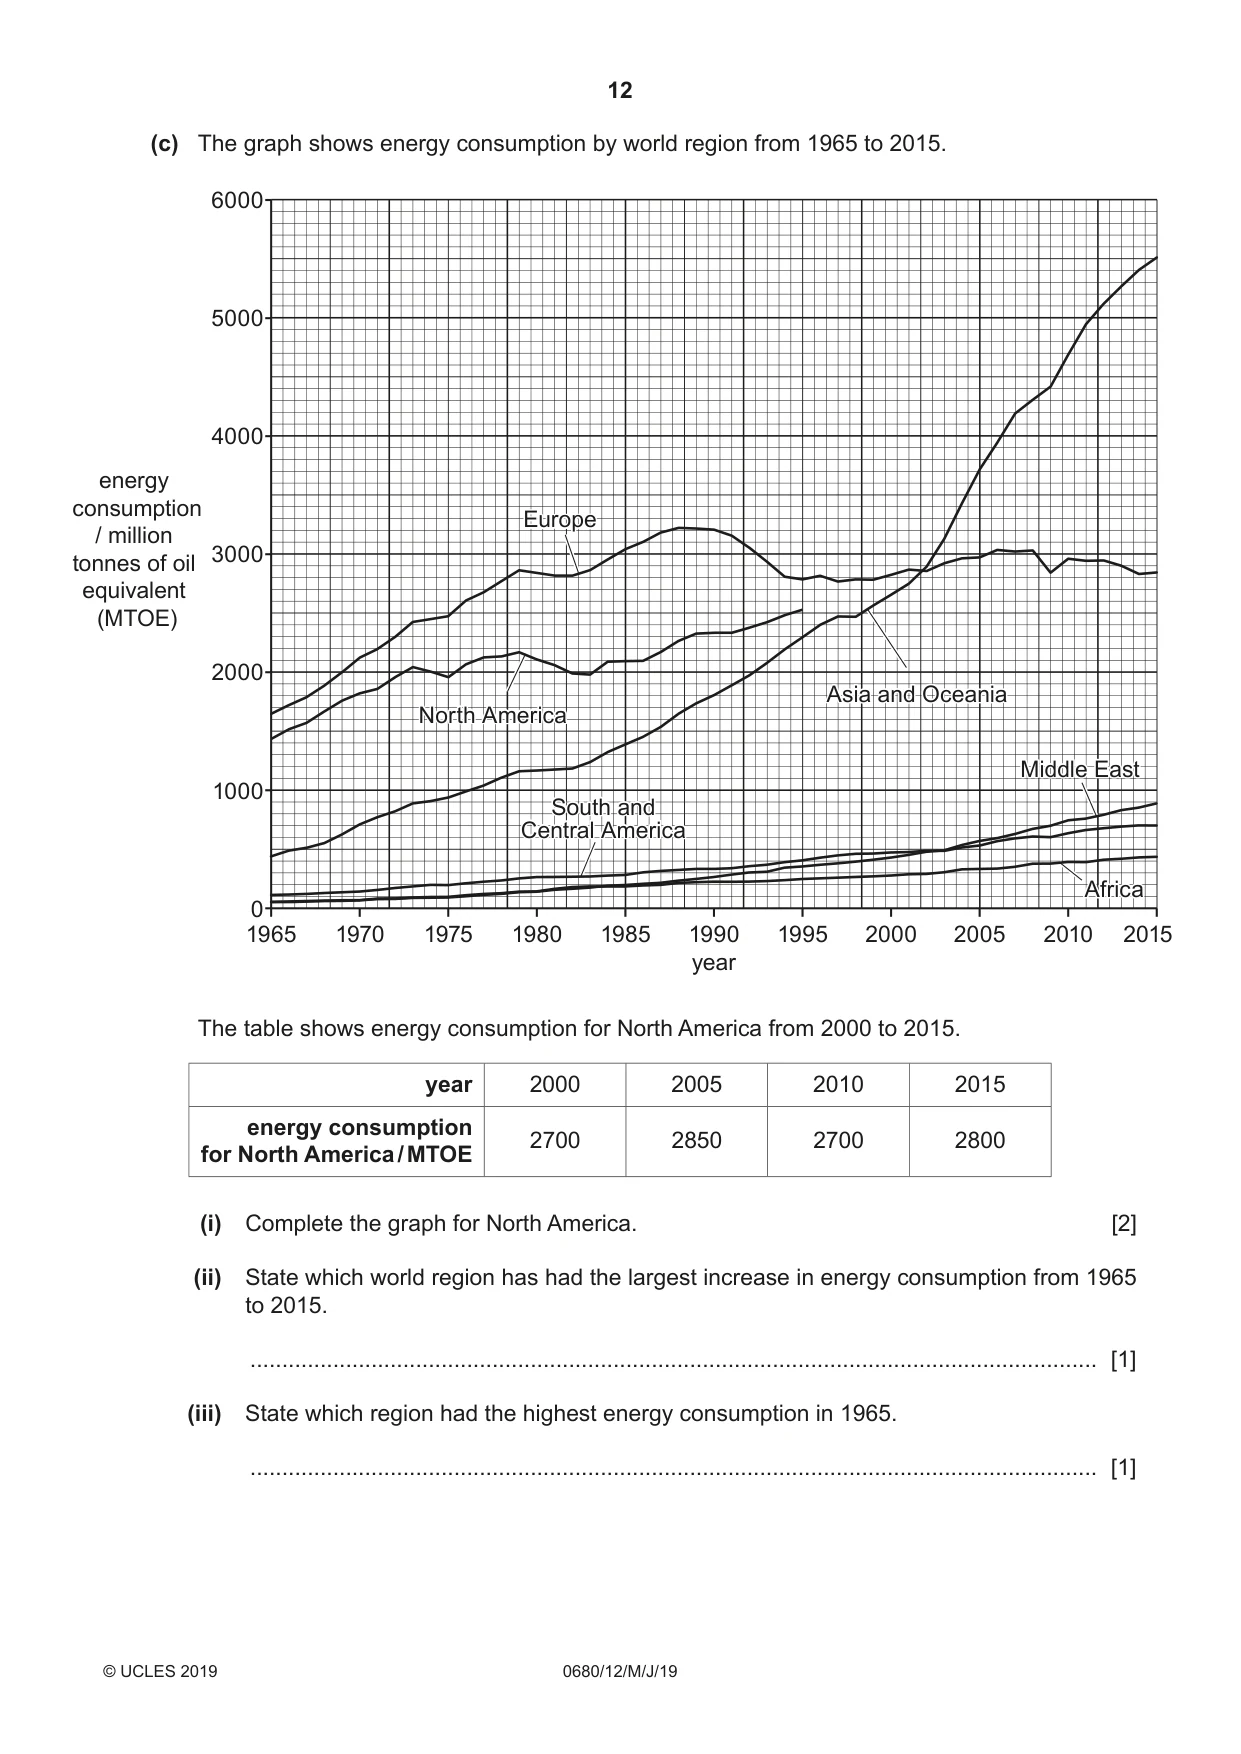
12 0680/12/M/J/19 © UCLES 2019 (c) The graph shows energy consumption by world region from 1965 to 2015. energy consumption / million tonnes of oil equivalent (MTOE) 0 1965 1970 1975 1980 1985 1990 1995 year 2000 2005 2010 2015 1000 2000 3000 4000 5000 6000 North America South and Central America Europe Middle East Africa Asia and Oceania The table shows energy consumption for North America from 2000 to 2015. year 2000 2005 2010 2015 energy consumption for North America / MTOE 2700 2850 2700 2800 (i) Complete the graph for North America. [2] (ii) State which world region has had the largest increase in energy consumption from 1965 to 2015. … [1] (iii) State which region had the highest energy consumption in 1965. … [1]
Question paper, page 13
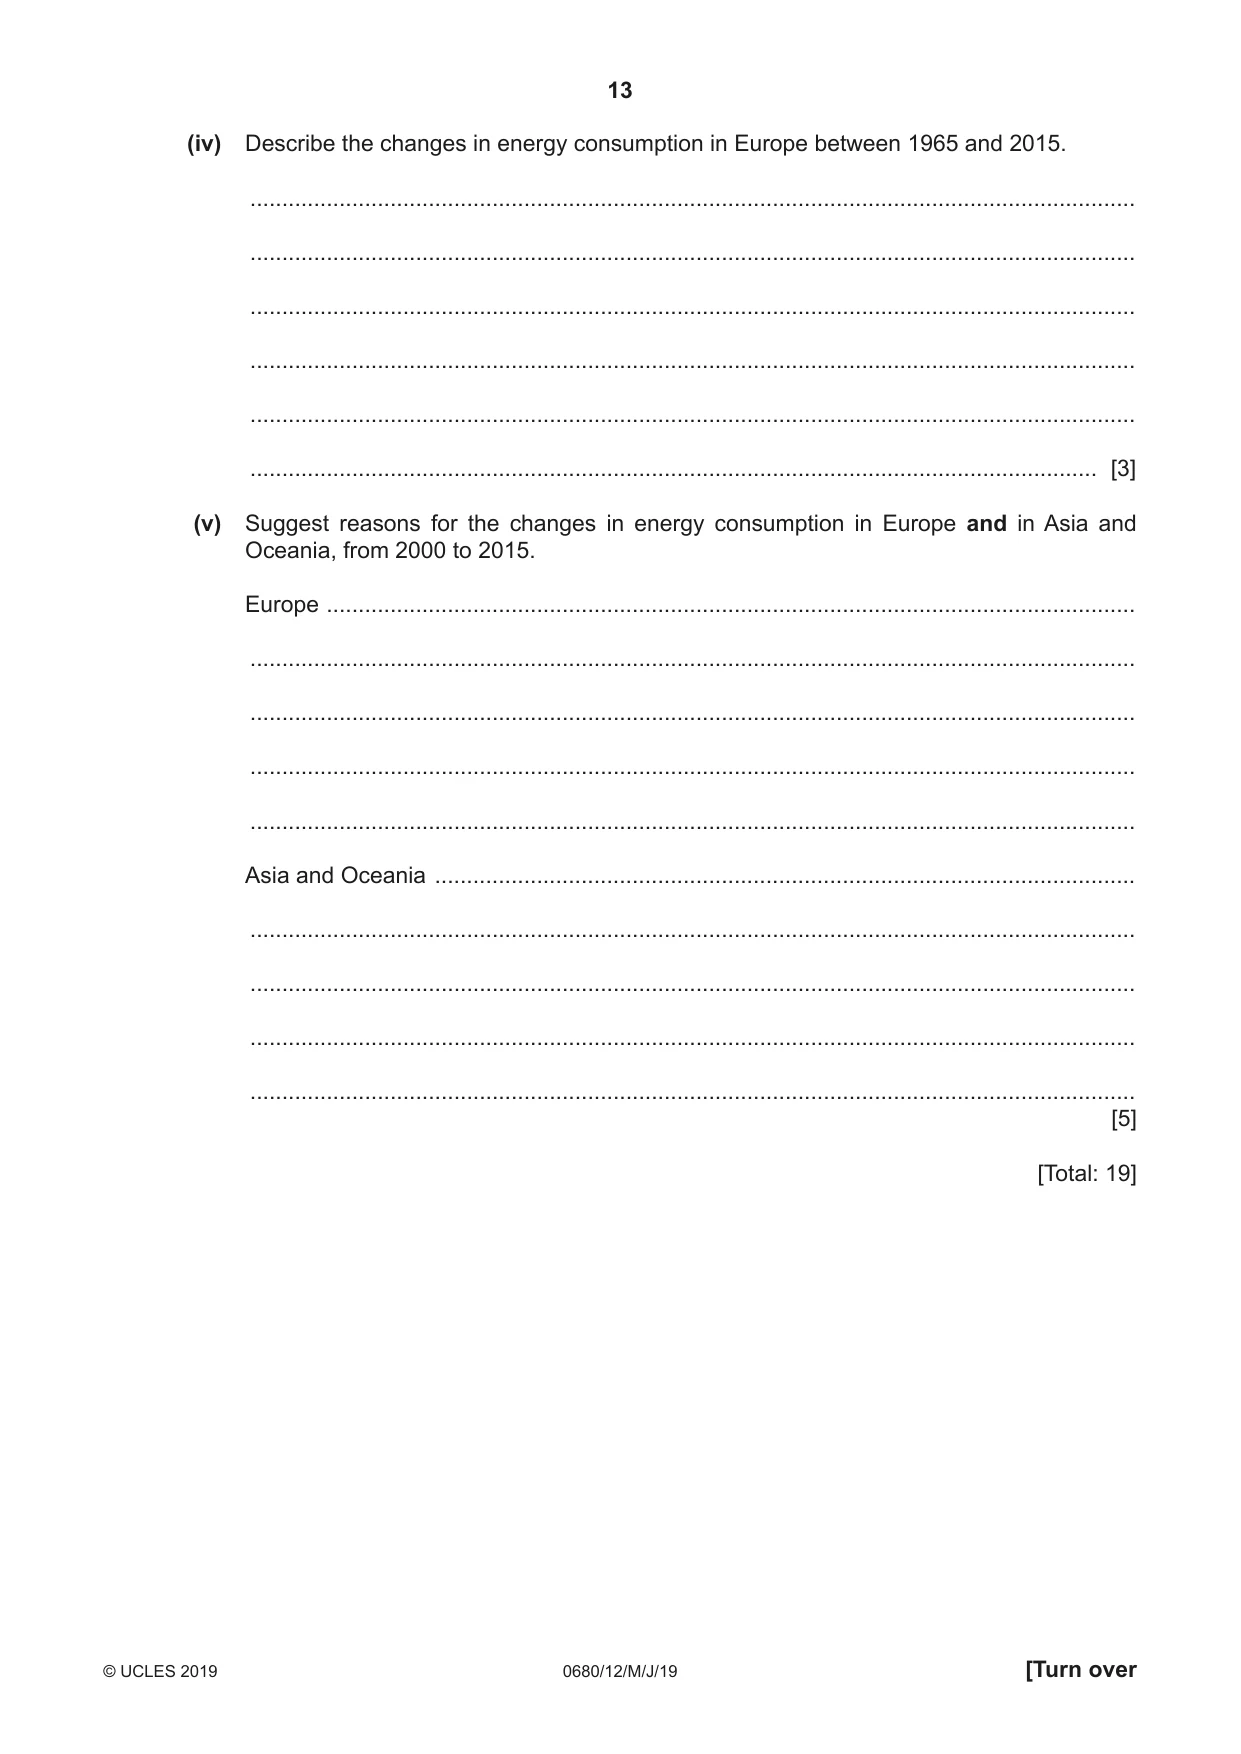
13 0680/12/M/J/19 © UCLES 2019 [Turn over (iv) Describe the changes in energy consumption in Europe between 1965 and 2015. … … … … … … [3] (v) Suggest reasons for the changes in energy consumption in Europe and in Asia and Oceania, from 2000 to 2015. Europe … … … … … Asia and Oceania … … … … … [5] [Total: 19]
Question paper, page 14
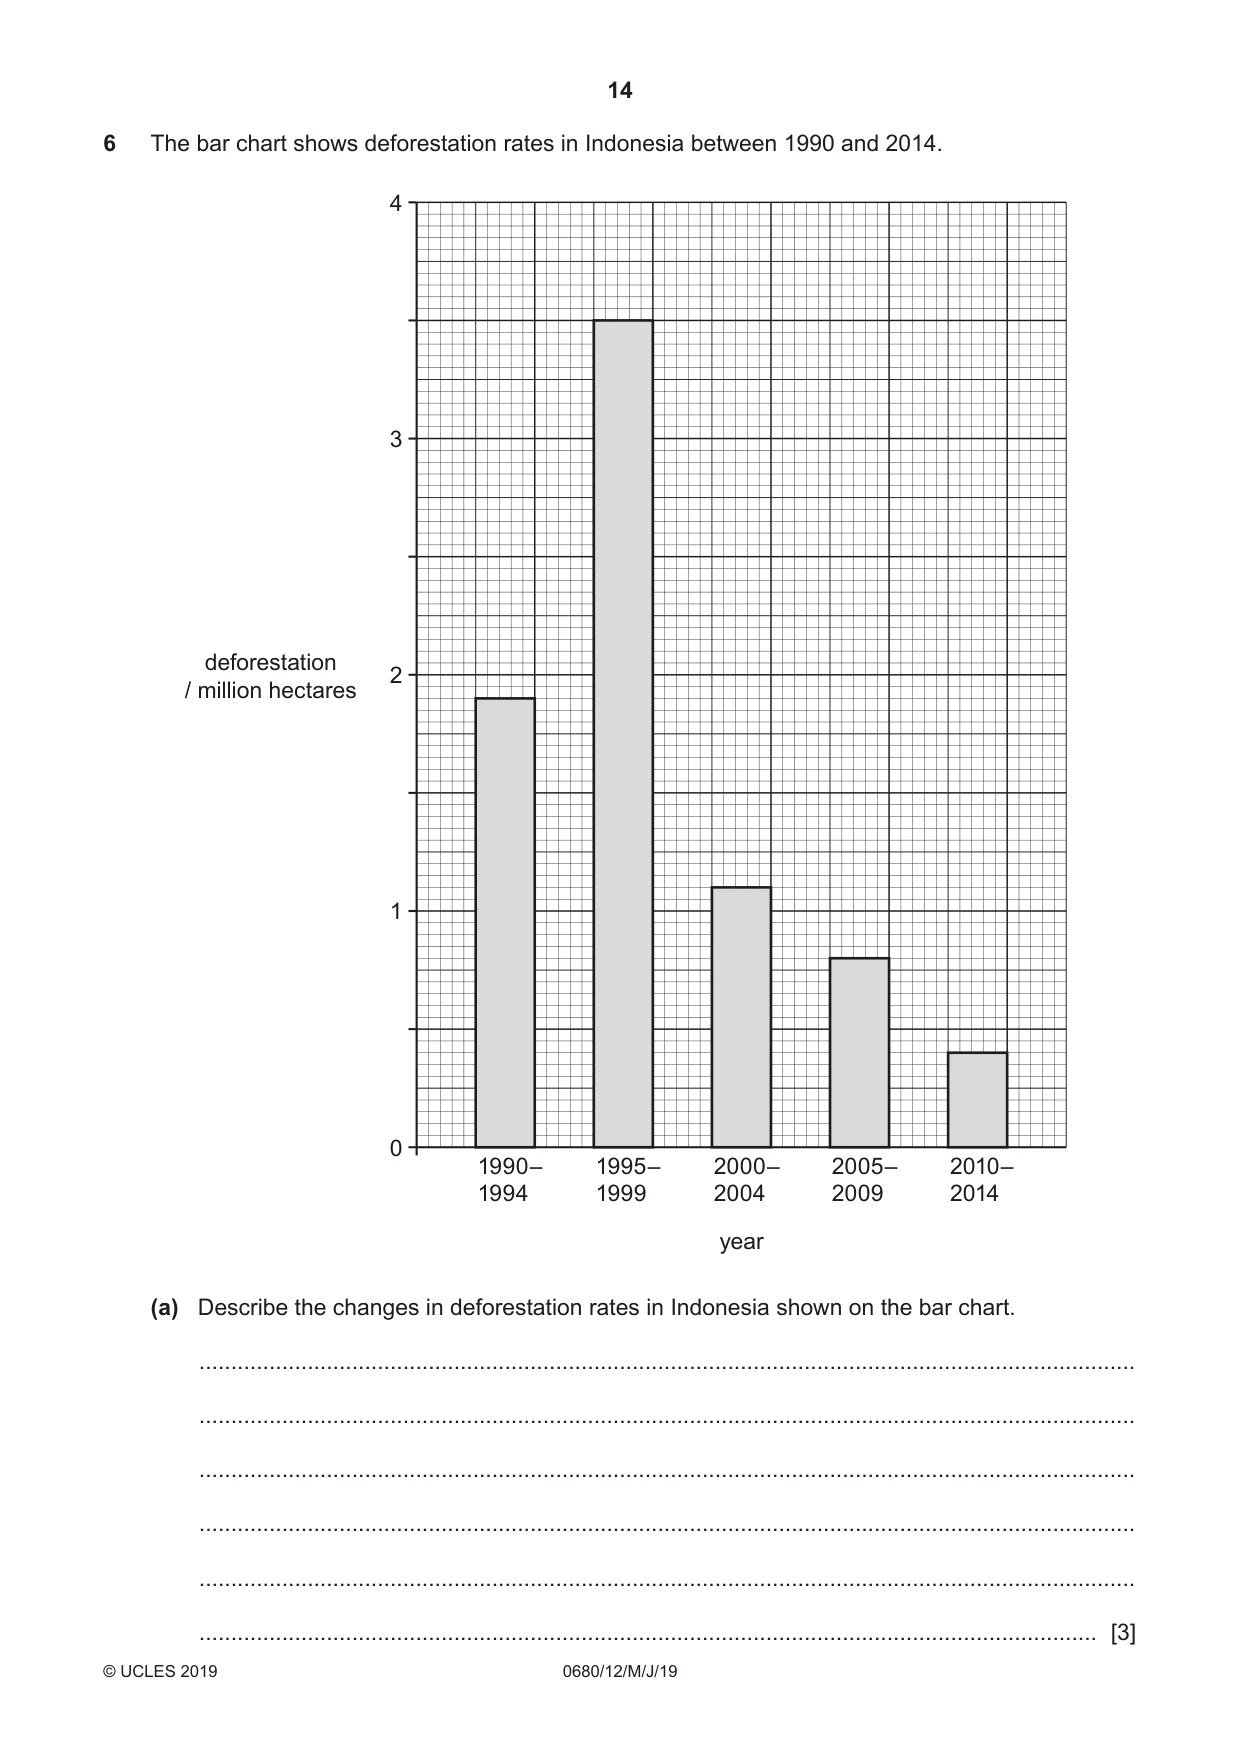
14 0680/12/M/J/19 © UCLES 2019 6 The bar chart shows deforestation rates in Indonesia between 1990 and 2014. 0 1 2 deforestation / million hectares 3 4 1990– 1994 1995– 1999 2000– 2004 year 2005– 2009 2010– 2014 (a) Describe the changes in deforestation rates in Indonesia shown on the bar chart. … … … … … … [3]
Question paper, page 15
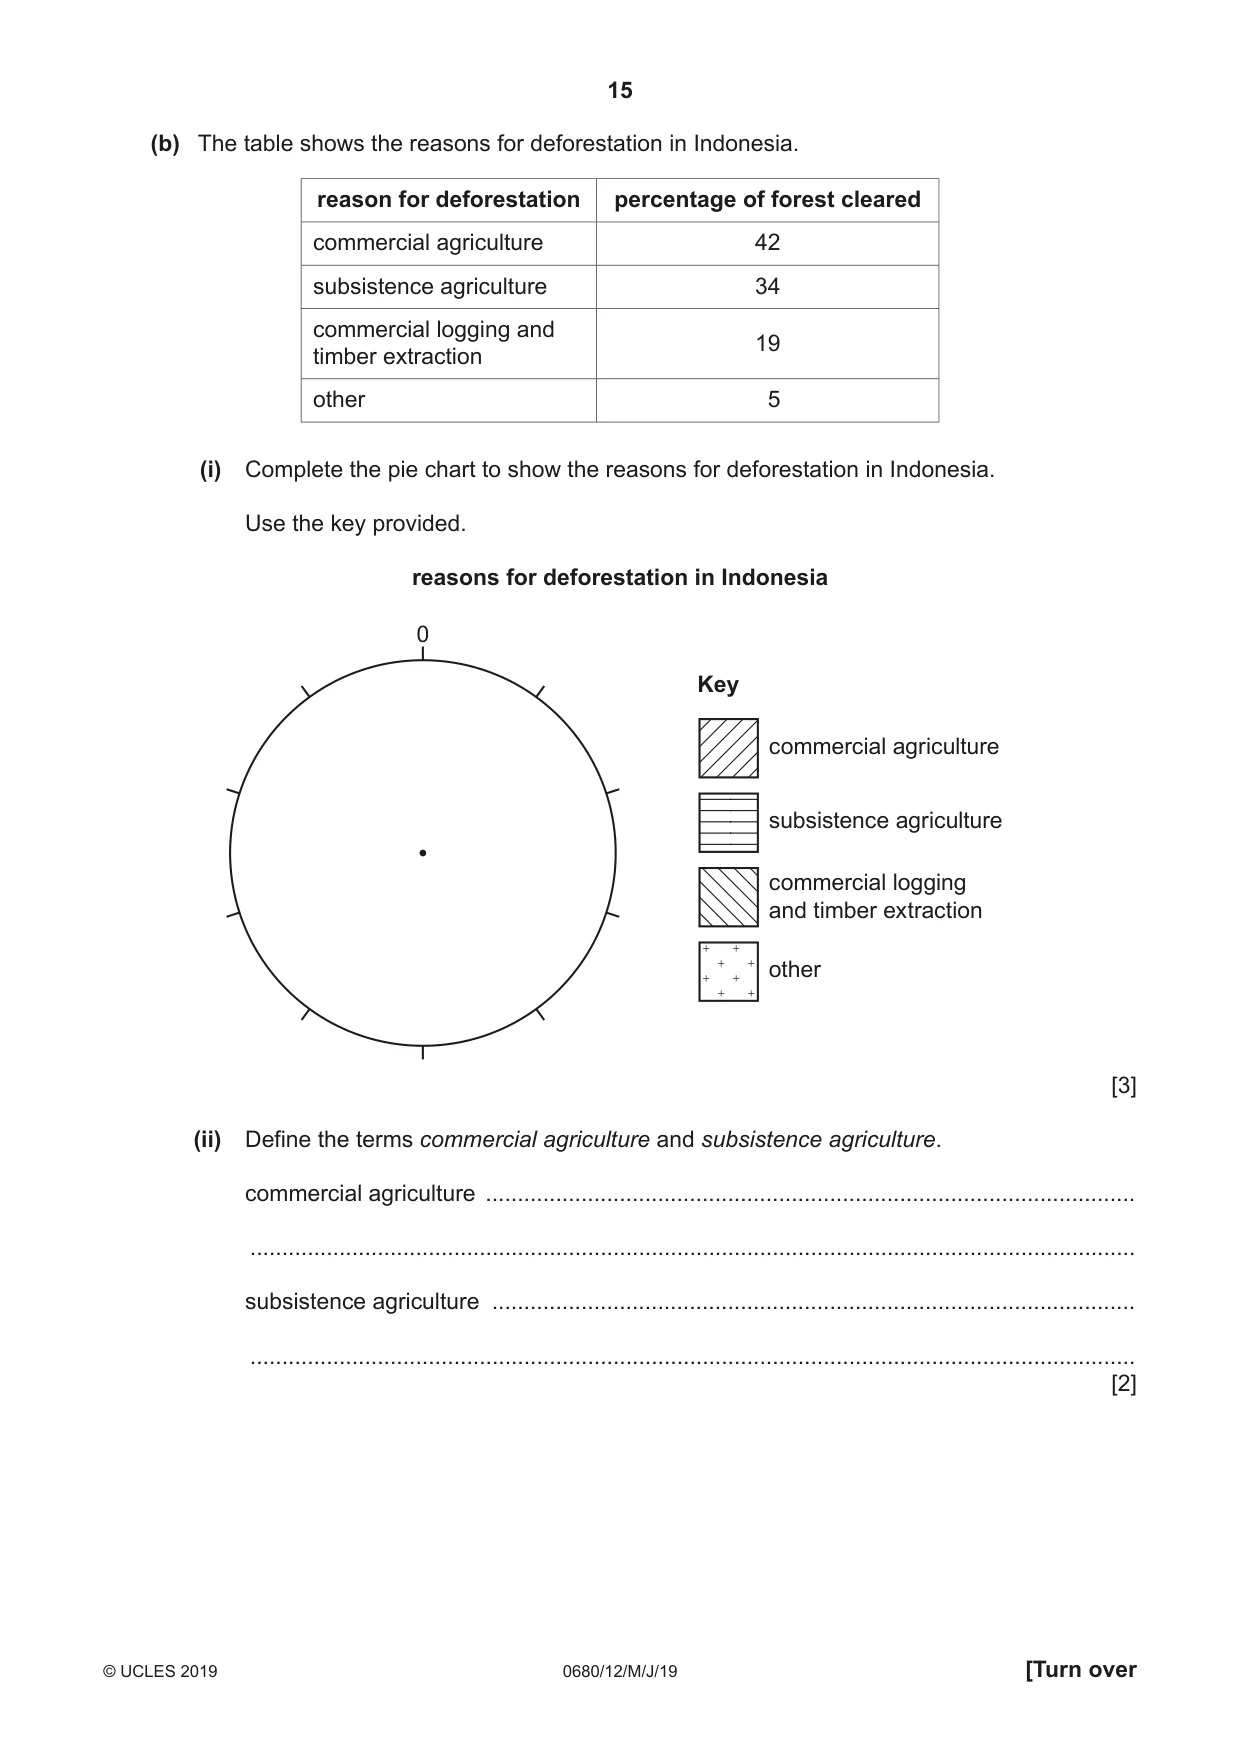
15 0680/12/M/J/19 © UCLES 2019 [Turn over (b) The table shows the reasons for deforestation in Indonesia. reason for deforestation percentage of forest cleared commercial agriculture 42 subsistence agriculture 34 commercial logging and timber extraction 19 other 5 (i) Complete the pie chart to show the reasons for deforestation in Indonesia. Use the key provided. reasons for deforestation in Indonesia 0 Key commercial agriculture subsistence agriculture commercial logging and timber extraction other [3] (ii) Define the terms commercial agriculture and subsistence agriculture. commercial agriculture … … subsistence agriculture … … [2]
Question paper, page 16
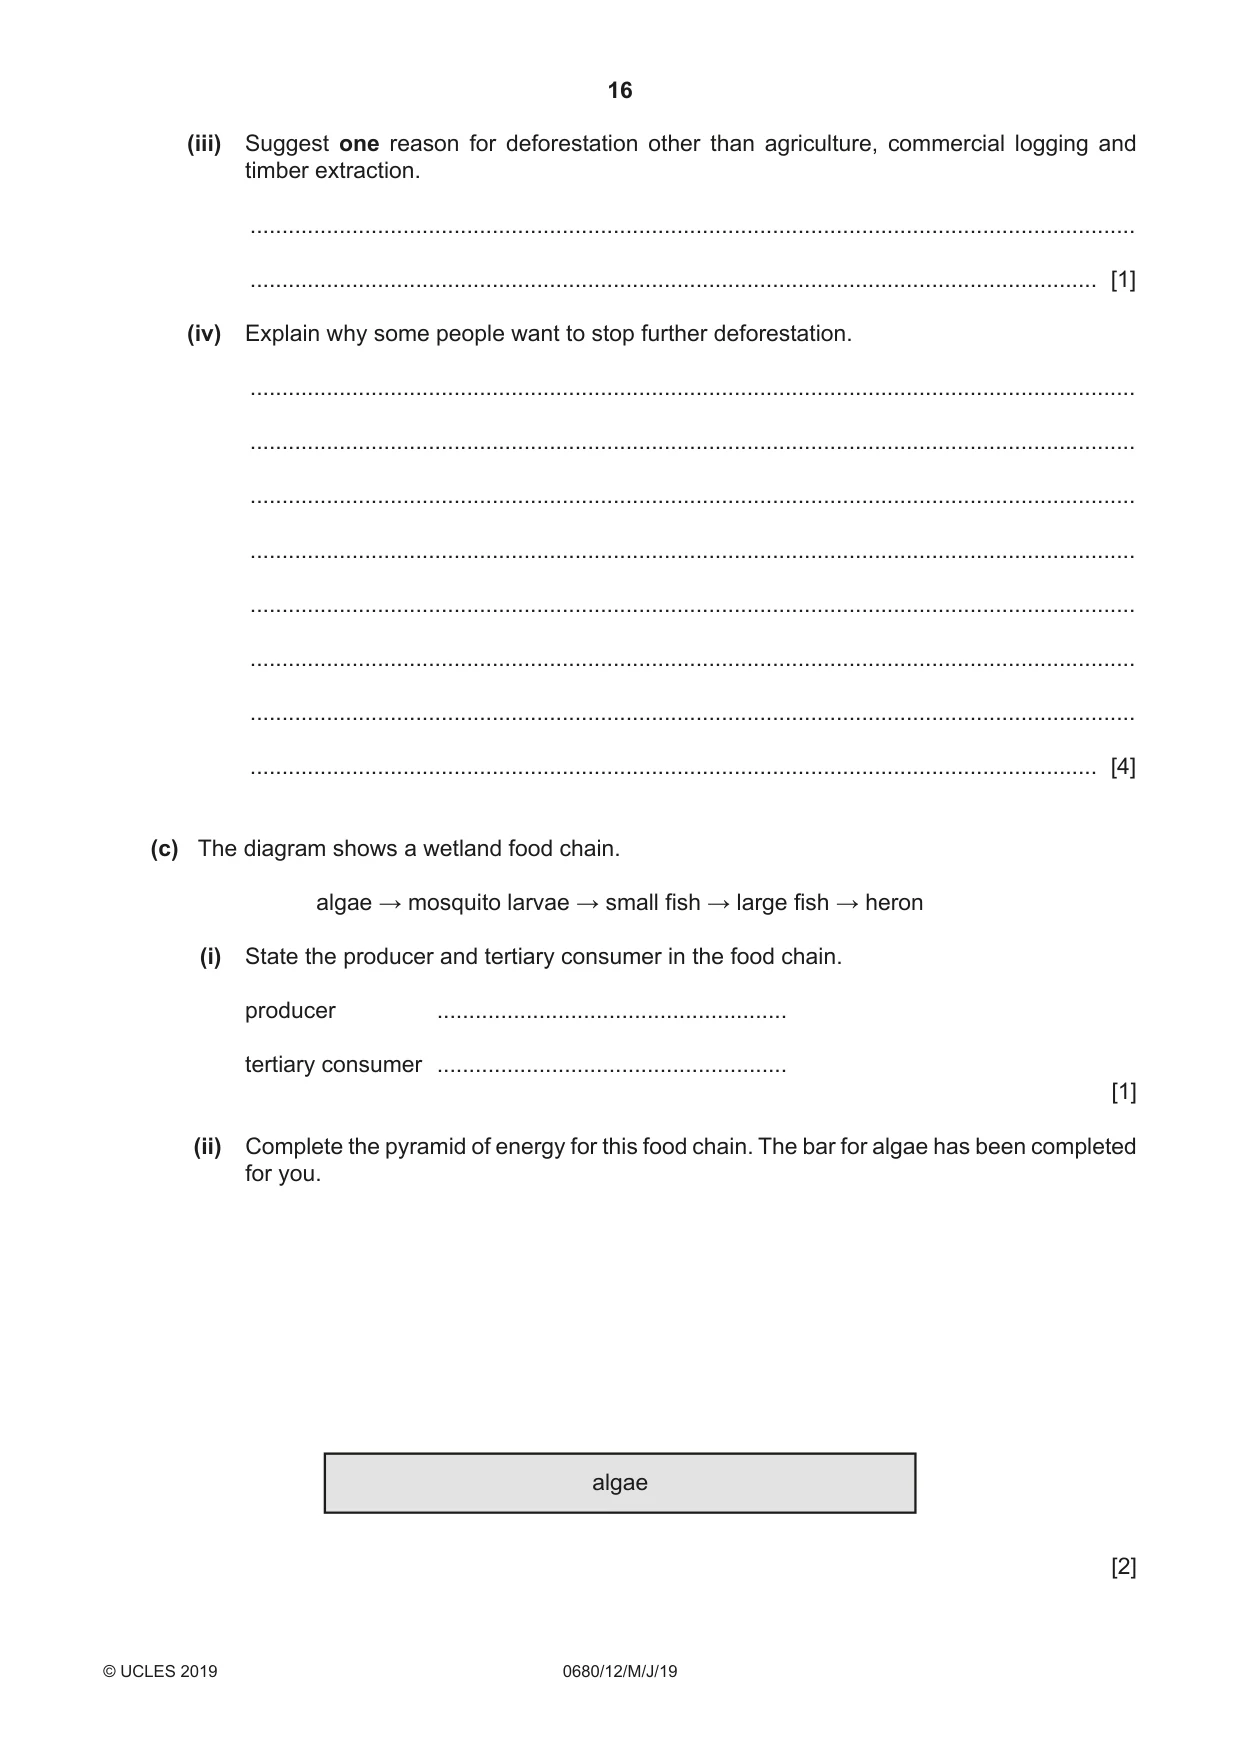
16 0680/12/M/J/19 © UCLES 2019 (iii) Suggest one reason for deforestation other than agriculture, commercial logging and timber extraction. … … [1] (iv) Explain why some people want to stop further deforestation. … … … … … … … … [4] (c) The diagram shows a wetland food chain. algae → mosquito larvae → small fish → large fish → heron (i) State the producer and tertiary consumer in the food chain. producer … tertiary consumer … [1] (ii) Complete the pyramid of energy for this food chain. The bar for algae has been completed for you. algae [2]
Question paper, page 17
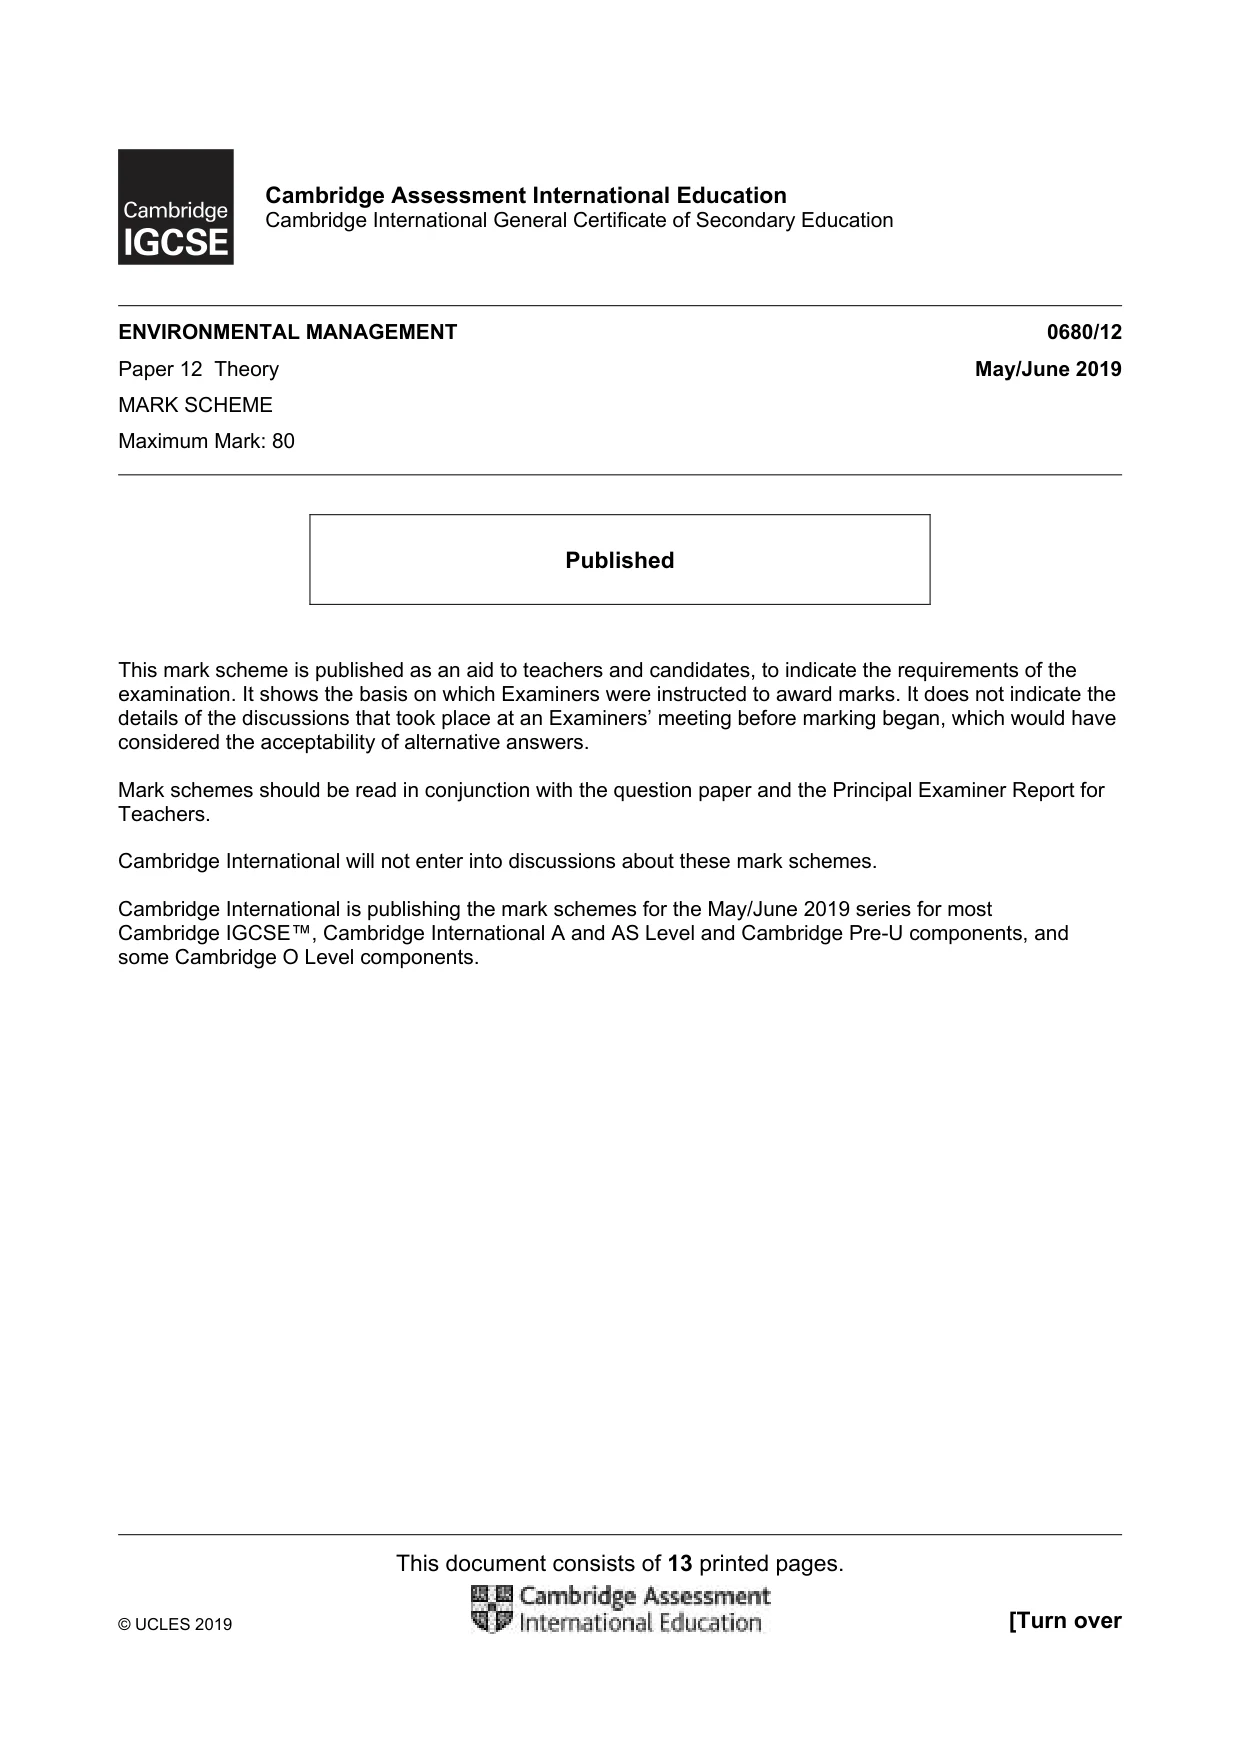
17 0680/12/M/J/19 © UCLES 2019 (iii) Describe the process of photosynthesis. … … … … [2] (d) The table shows the percentage rate of loss of wetlands between 1900 and 2010 for a country. period percentage loss of inland wetlands per year percentage loss of coastal wetlands per year 1900–1940 0.85 0.39 1941–1974 1.48 1.73 1975–1990 1.63 1.44 1991–2010 0.48 0.85 Compare the percentage rate of loss of inland wetlands with that of coastal wetlands between 1900 and 2010. … … … … [2] [Total: 20]
Question paper, page 18
18 0680/12/M/J/19 © UCLES 2019 BLANK PAGE
Question paper, page 19
19 0680/12/M/J/19 © UCLES 2019 BLANK PAGE
Question paper, page 20
20 0680/12/M/J/19 © UCLES 2019 Permission to reproduce items where third-party owned material protected by copyright is included has been sought and cleared where possible. Every reasonable effort has been made by the publisher (UCLES) to trace copyright holders, but if any items requiring clearance have unwittingly been included, the publisher will be pleased to make amends at the earliest possible opportunity. To avoid the issue of disclosure of answer-related information to candidates, all copyright acknowledgements are reproduced online in the Cambridge Assessment International Education Copyright Acknowledgements Booklet. This is produced for each series of examinations and is freely available to download at www.cambridgeinternational.org after the live examination series. Cambridge Assessment International Education is part of the Cambridge Assessment Group. Cambridge Assessment is the brand name of the University of Cambridge Local Examinations Syndicate (UCLES), which itself is a department of the University of Cambridge. BLANK PAGE
Mark scheme, page 1
This document consists of 13 printed pages. © UCLES 2019 [Turn over Cambridge Assessment International Education Cambridge International General Certificate of Secondary Education ENVIRONMENTAL MANAGEMENT 0680/12 Paper 12 Theory May/June 2019 MARK SCHEME Maximum Mark: 80 Published This mark scheme is published as an aid to teachers and candidates, to indicate the requirements of the examination. It shows the basis on which Examiners were instructed to award marks. It does not indicate the details of the discussions that took place at an Examiners’ meeting before marking began, which would have considered the acceptability of alternative answers. Mark schemes should be read in conjunction with the question paper and the Principal Examiner Report for Teachers. Cambridge International will not enter into discussions about these mark schemes. Cambridge International is publishing the mark schemes for the May/June 2019 series for most Cambridge IGCSE™, Cambridge International A and AS Level and Cambridge Pre-U components, and some Cambridge O Level components.
Mark scheme, page 2
0680/12 Cambridge IGCSE – Mark Scheme PUBLISHED May/June 2019 © UCLES 2019 Page 2 of 13 Generic Marking Principles These general marking principles must be applied by all examiners when marking candidate answers. They should be applied alongside the specific content of the mark scheme or generic level descriptors for a question. Each question paper and mark scheme will also comply with these marking principles. GENERIC MARKING PRINCIPLE 1: Marks must be awarded in line with: • the specific content of the mark scheme or the generic level descriptors for the question • the specific skills defined in the mark scheme or in the generic level descriptors for the question • the standard of response required by a candidate as exemplified by the standardisation scripts. GENERIC MARKING PRINCIPLE 2: Marks awarded are always whole marks (not half marks, or other fractions). GENERIC MARKING PRINCIPLE 3: Marks must be awarded positively: • marks are awarded for correct/valid answers, as defined in the mark scheme. However, credit is given for valid answers which go beyond the scope of the syllabus and mark scheme, referring to your Team Leader as appropriate • marks are awarded when candidates clearly demonstrate what they know and can do • marks are not deducted for errors • marks are not deducted for omissions • answers should only be judged on the quality of spelling, punctuation and grammar when these features are specifically assessed by the question as indicated by the mark scheme. The meaning, however, should be unambiguous. GENERIC MARKING PRINCIPLE 4: Rules must be applied consistently e.g. in situations where candidates have not followed instructions or in the application of generic level descriptors.
Mark scheme, page 3
0680/12 Cambridge IGCSE – Mark Scheme PUBLISHED May/June 2019 © UCLES 2019 Page 3 of 13 GENERIC MARKING PRINCIPLE 5: Marks should be awarded using the full range of marks defined in the mark scheme for the question (however; the use of the full mark range may be limited according to the quality of the candidate responses seen). GENERIC MARKING PRINCIPLE 6: Marks awarded are based solely on the requirements as defined in the mark scheme. Marks should not be awarded with grade thresholds or grade descriptors in mind.
Mark scheme, page 4
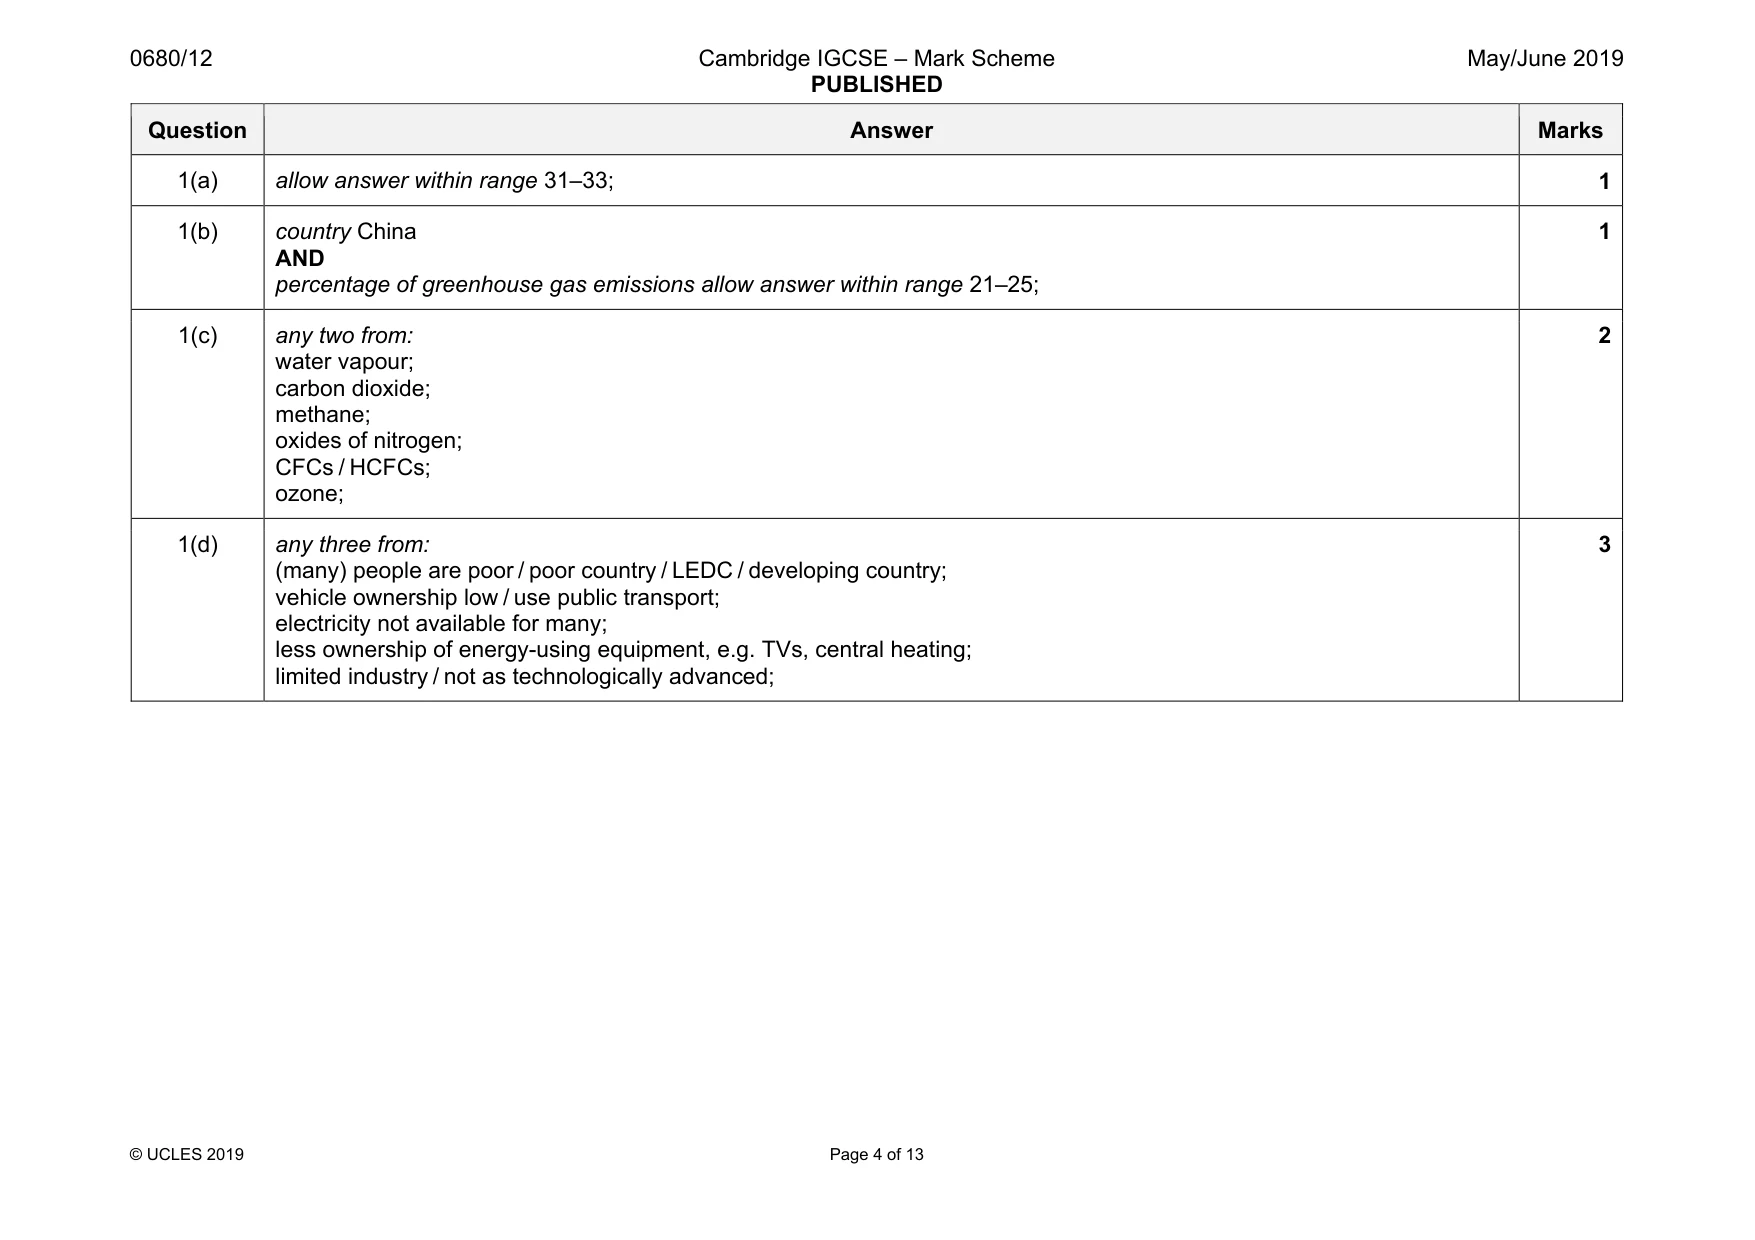
0680/12 Cambridge IGCSE – Mark Scheme PUBLISHED May/June 2019 © UCLES 2019 Page 4 of 13 Question Answer Marks 1(a) allow answer within range 31–33; 1 1(b) country China AND percentage of greenhouse gas emissions allow answer within range 21–25; 1 1(c) any two from: water vapour; carbon dioxide; methane; oxides of nitrogen; CFCs / HCFCs; ozone; 2 1(d) any three from: (many) people are poor / poor country / LEDC / developing country; vehicle ownership low / use public transport; electricity not available for many; less ownership of energy-using equipment, e.g. TVs, central heating; limited industry / not as technologically advanced; 3
Mark scheme, page 5
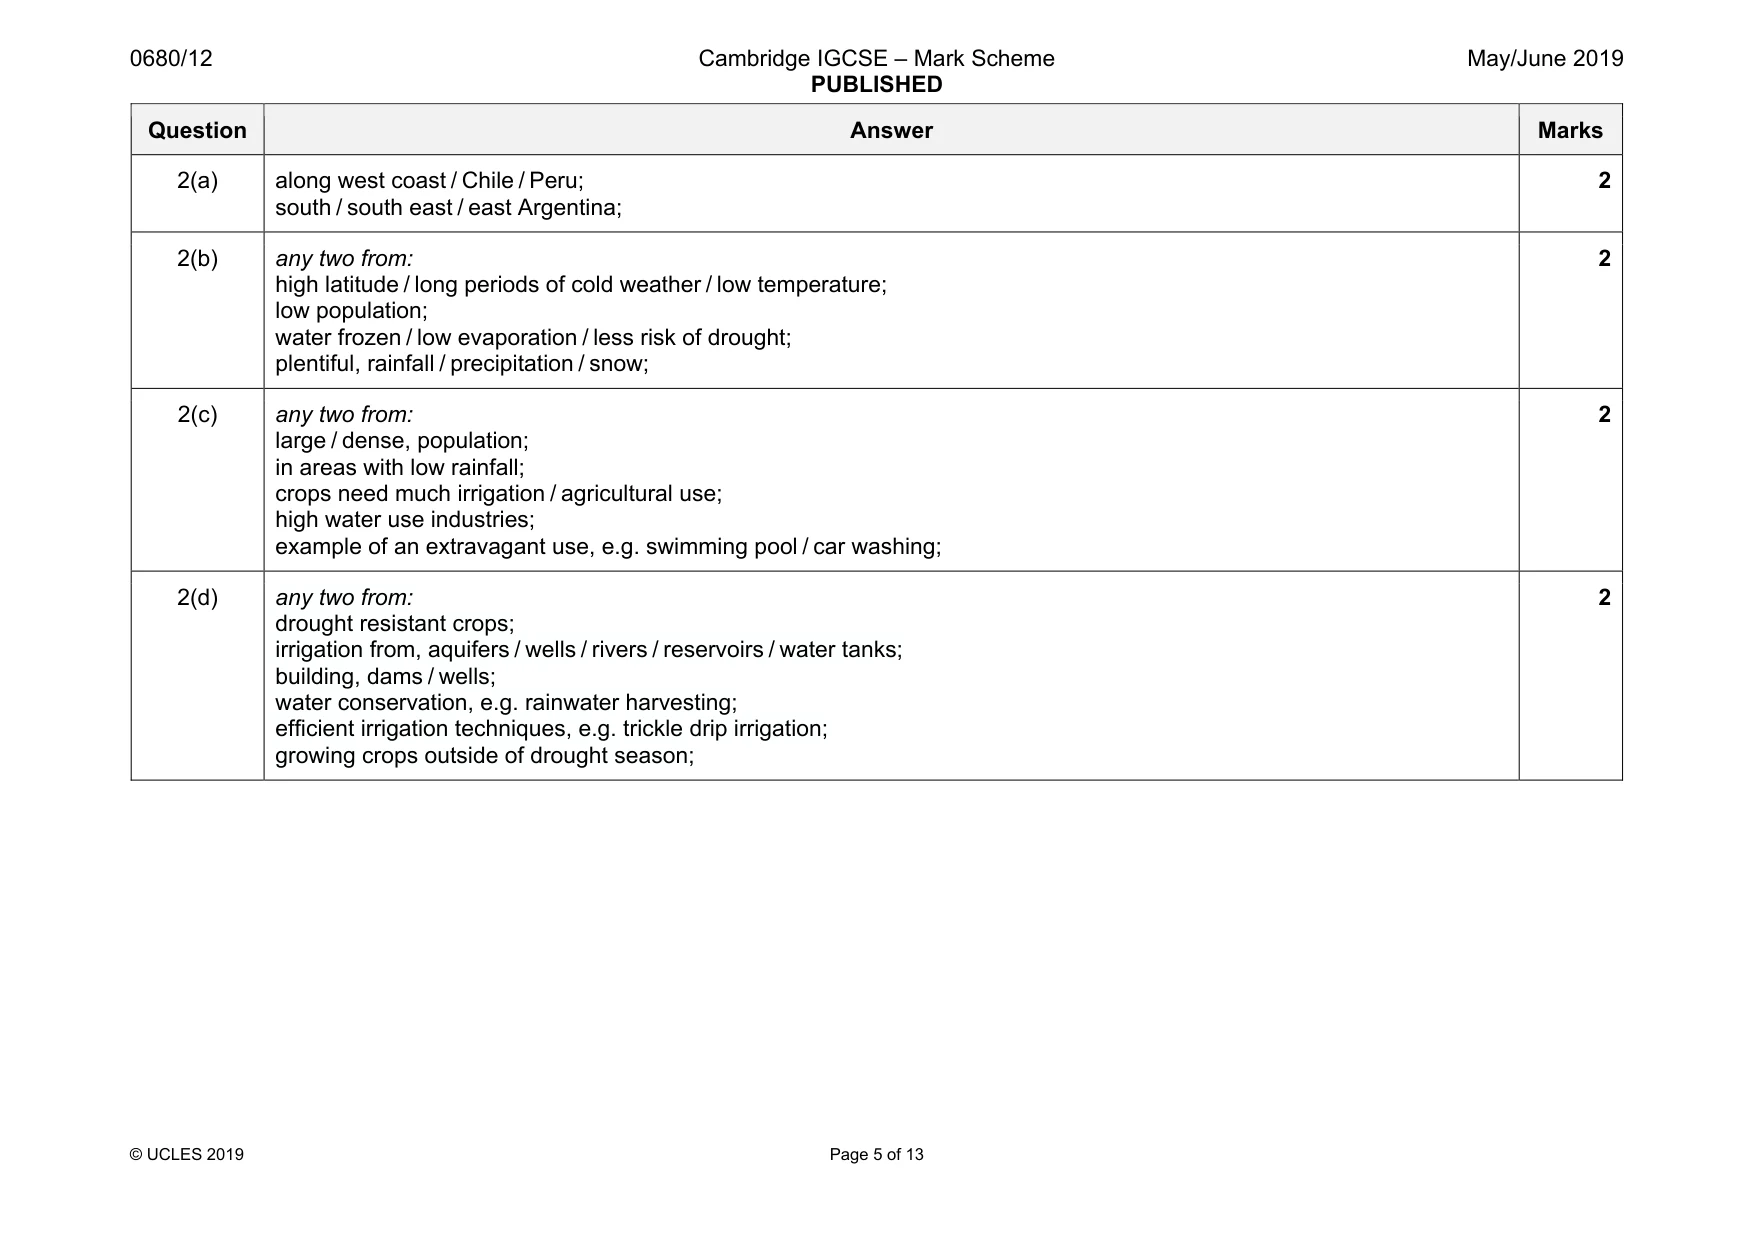
0680/12 Cambridge IGCSE – Mark Scheme PUBLISHED May/June 2019 © UCLES 2019 Page 5 of 13 Question Answer Marks 2(a) along west coast / Chile / Peru; south / south east / east Argentina; 2 2(b) any two from: high latitude / long periods of cold weather / low temperature; low population; water frozen / low evaporation / less risk of drought; plentiful, rainfall / precipitation / snow; 2 2(c) any two from: large / dense, population; in areas with low rainfall; crops need much irrigation / agricultural use; high water use industries; example of an extravagant use, e.g. swimming pool / car washing; 2 2(d) any two from: drought resistant crops; irrigation from, aquifers / wells / rivers / reservoirs / water tanks; building, dams / wells; water conservation, e.g. rainwater harvesting; efficient irrigation techniques, e.g. trickle drip irrigation; growing crops outside of drought season; 2
Mark scheme, page 6
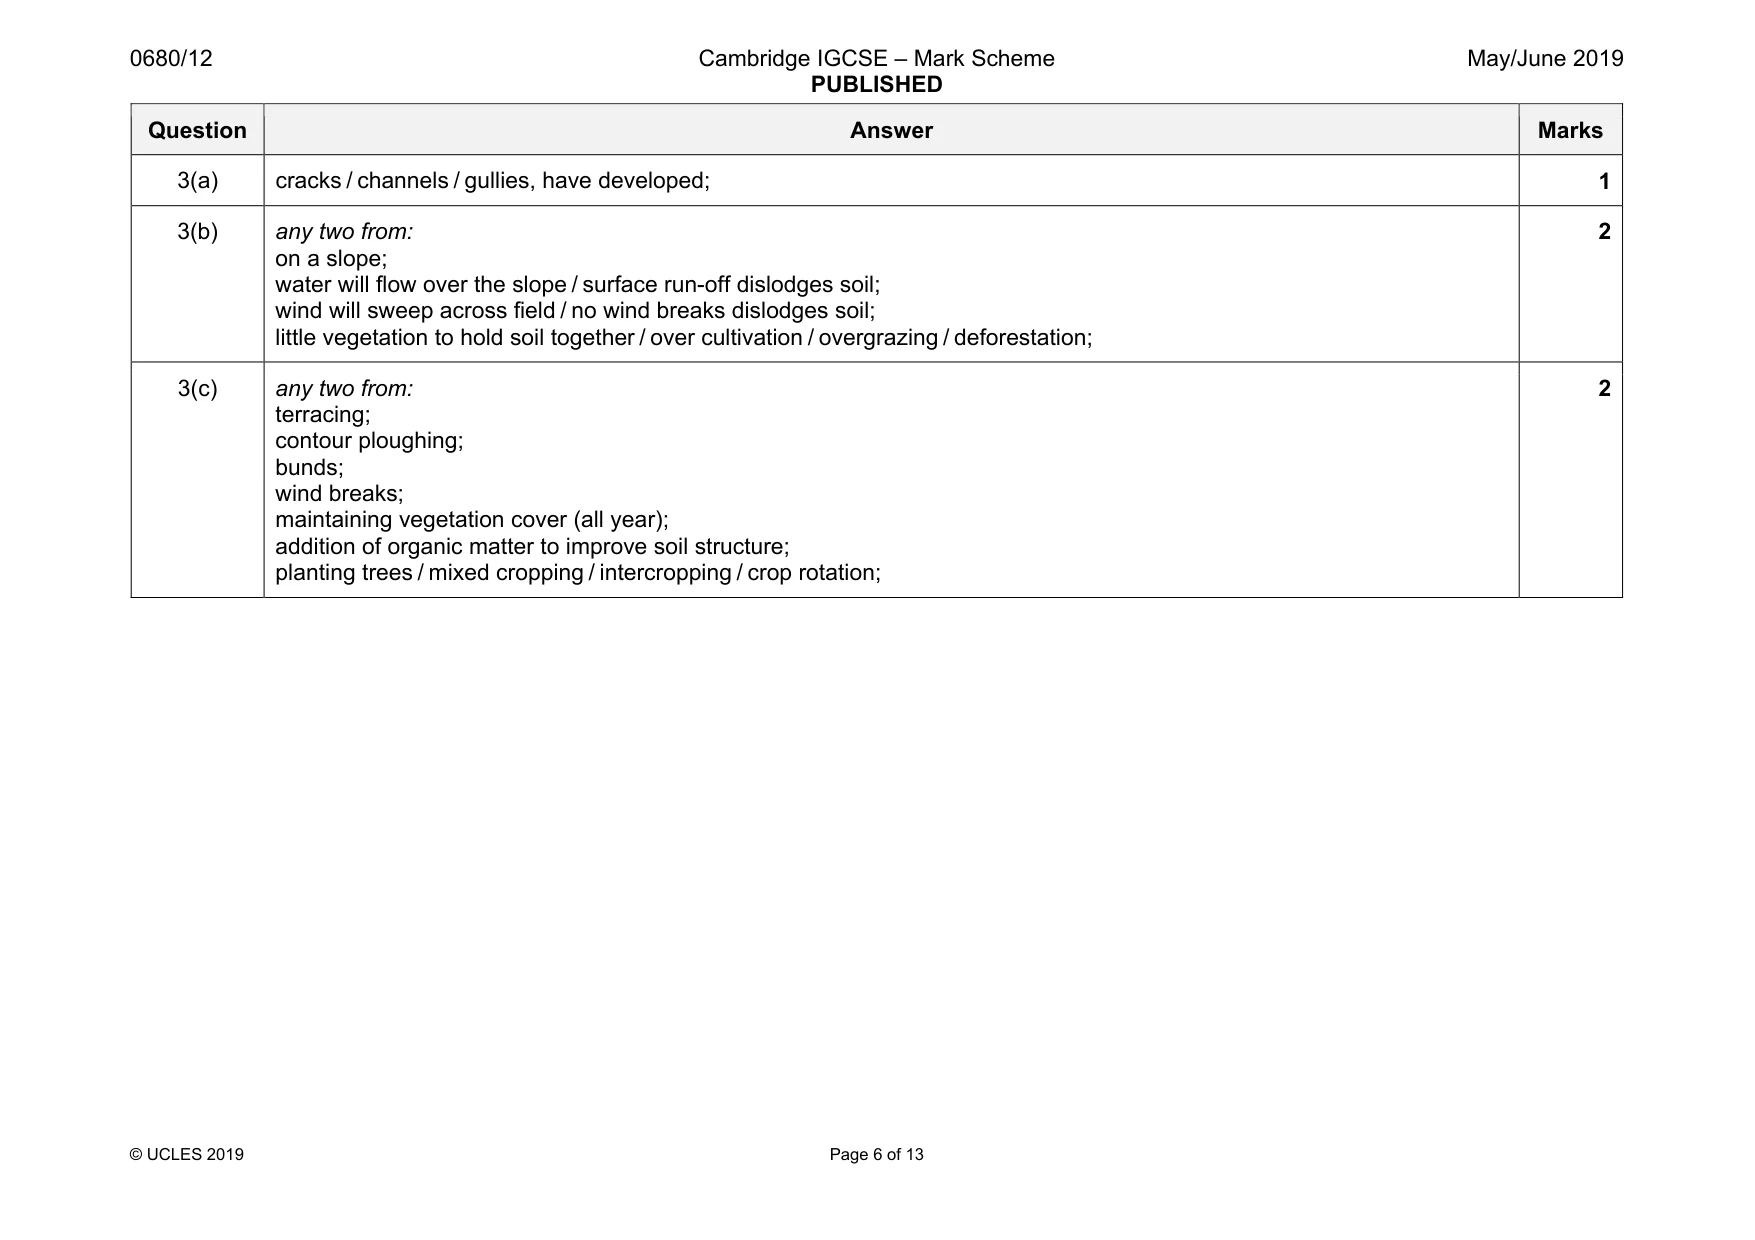
0680/12 Cambridge IGCSE – Mark Scheme PUBLISHED May/June 2019 © UCLES 2019 Page 6 of 13 Question Answer Marks 3(a) cracks / channels / gullies, have developed; 1 3(b) any two from: on a slope; water will flow over the slope / surface run-off dislodges soil; wind will sweep across field / no wind breaks dislodges soil; little vegetation to hold soil together / over cultivation / overgrazing / deforestation; 2 3(c) any two from: terracing; contour ploughing; bunds; wind breaks; maintaining vegetation cover (all year); addition of organic matter to improve soil structure; planting trees / mixed cropping / intercropping / crop rotation; 2
Mark scheme, page 7
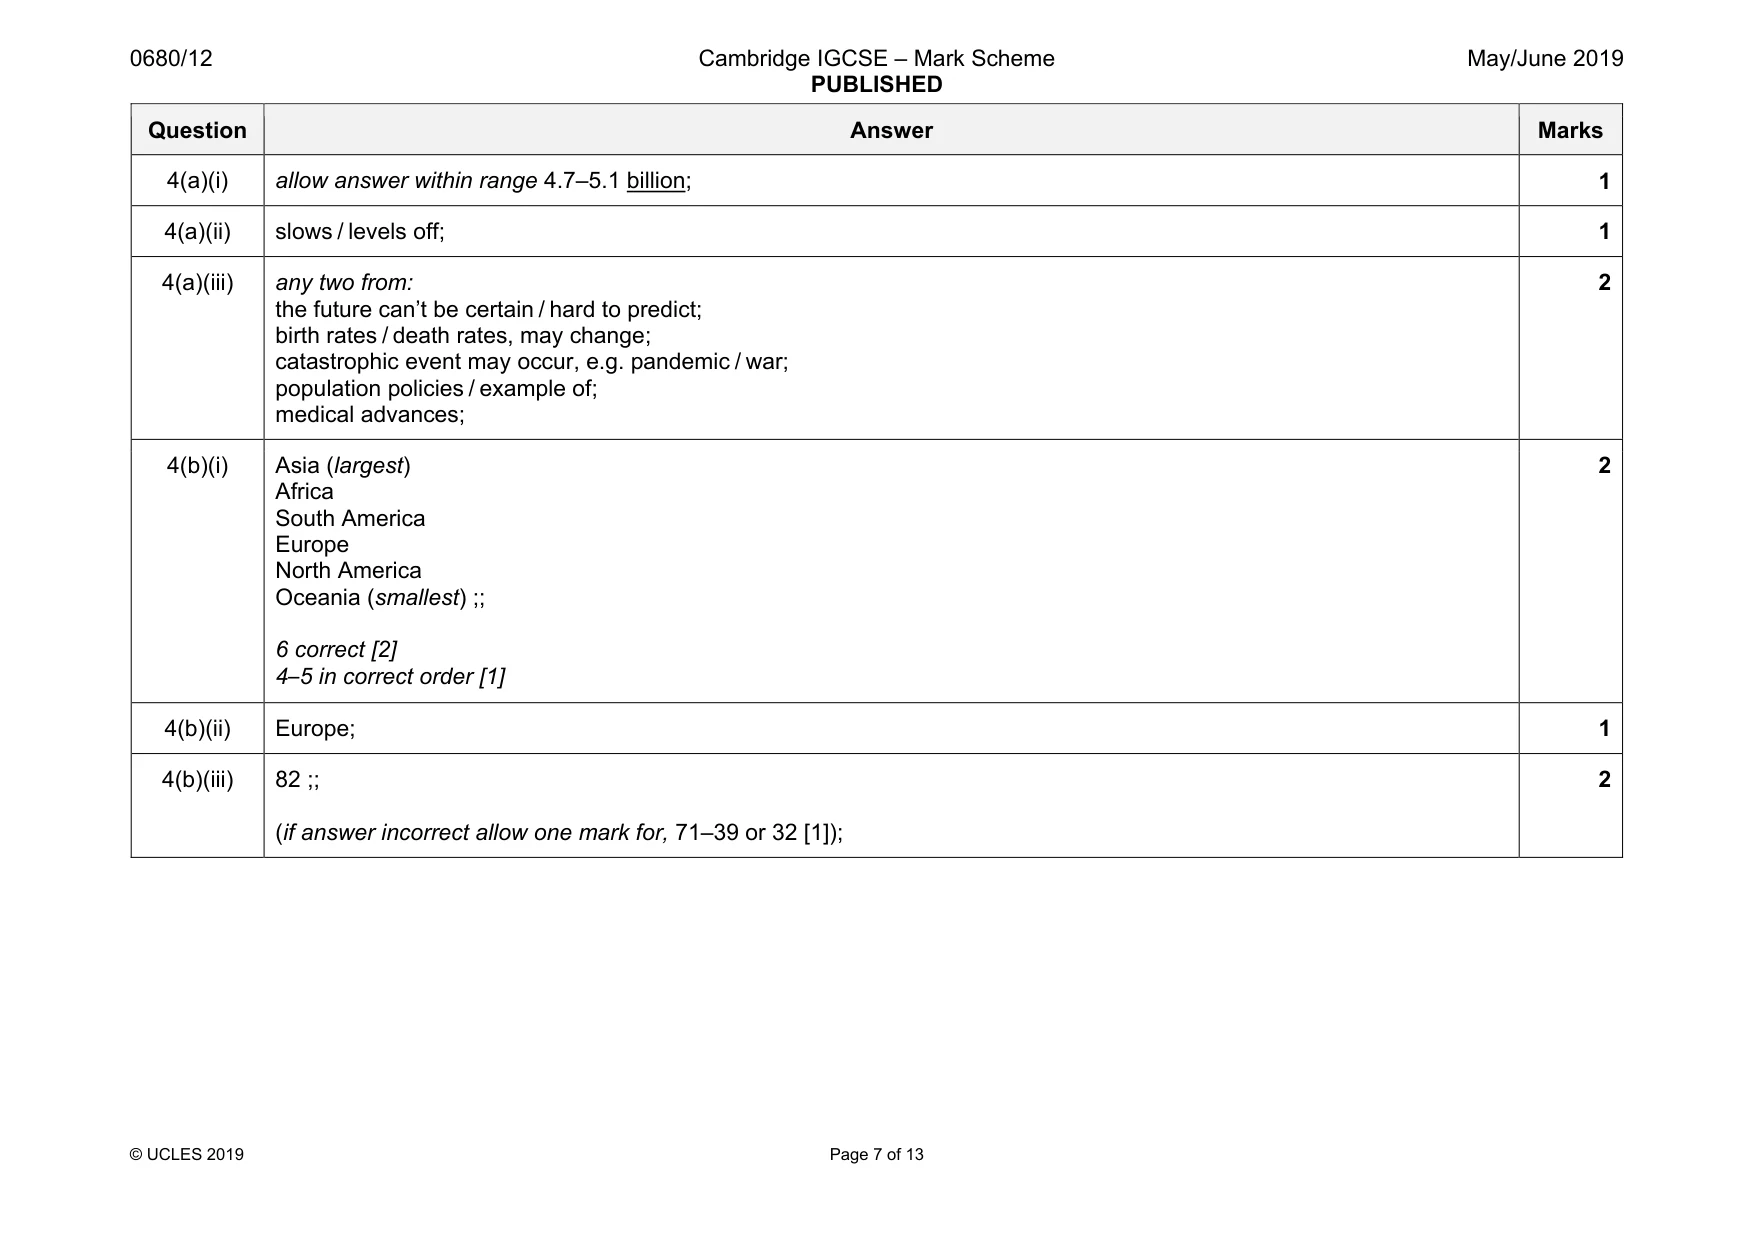
0680/12 Cambridge IGCSE – Mark Scheme PUBLISHED May/June 2019 © UCLES 2019 Page 7 of 13 Question Answer Marks 4(a)(i) allow answer within range 4.7–5.1 billion; 1 4(a)(ii) slows / levels off; 1 4(a)(iii) any two from: the future can’t be certain / hard to predict; birth rates / death rates, may change; catastrophic event may occur, e.g. pandemic / war; population policies / example of; medical advances; 2 4(b)(i) Asia (largest) Africa South America Europe North America Oceania (smallest) ;; 6 correct [2] 4–5 in correct order [1] 2 4(b)(ii) Europe; 1 4(b)(iii) 82 ;; (if answer incorrect allow one mark for, 71–39 or 32 [1]); 2
Mark scheme, page 8
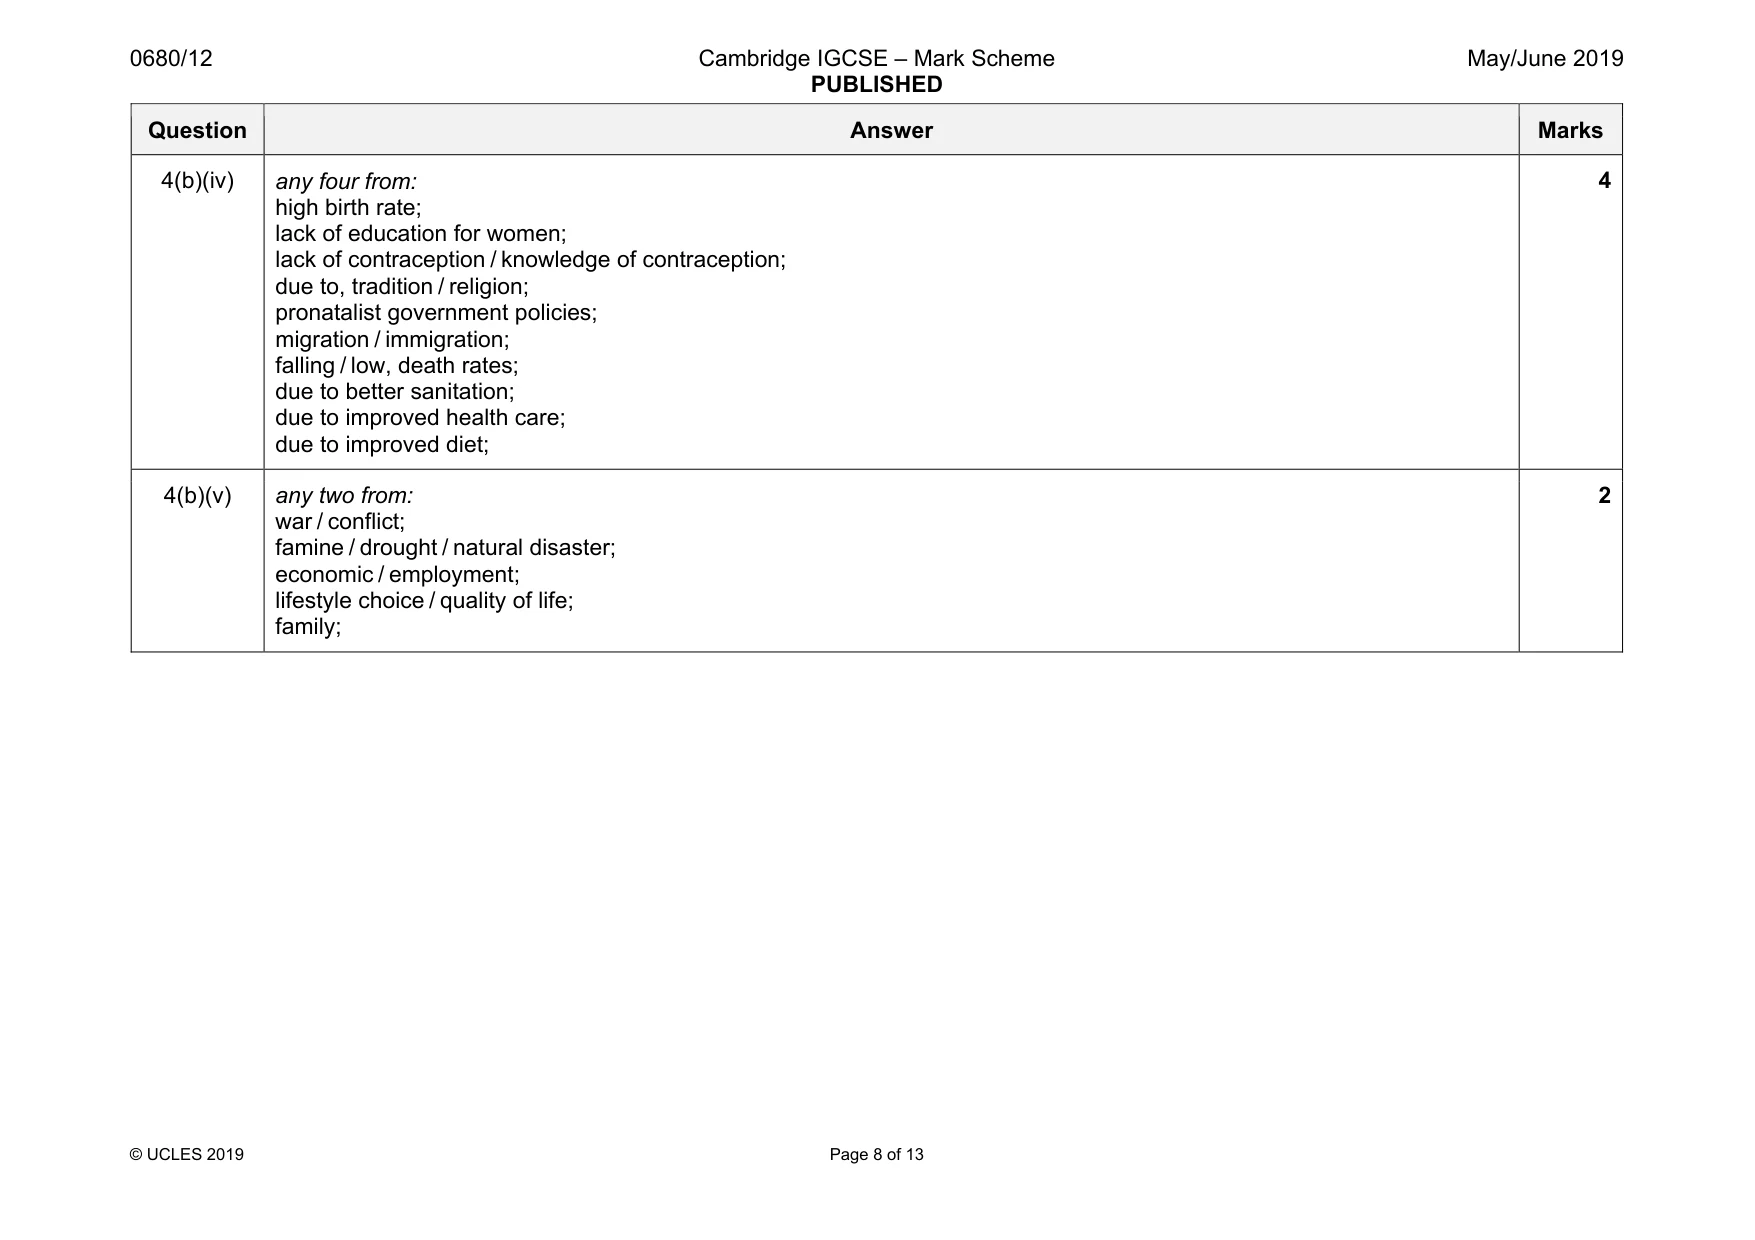
0680/12 Cambridge IGCSE – Mark Scheme PUBLISHED May/June 2019 © UCLES 2019 Page 8 of 13 Question Answer Marks 4(b)(iv) any four from: high birth rate; lack of education for women; lack of contraception / knowledge of contraception; due to, tradition / religion; pronatalist government policies; migration / immigration; falling / low, death rates; due to better sanitation; due to improved health care; due to improved diet; 4 4(b)(v) any two from: war / conflict; famine / drought / natural disaster; economic / employment; lifestyle choice / quality of life; family; 2
Mark scheme, page 9
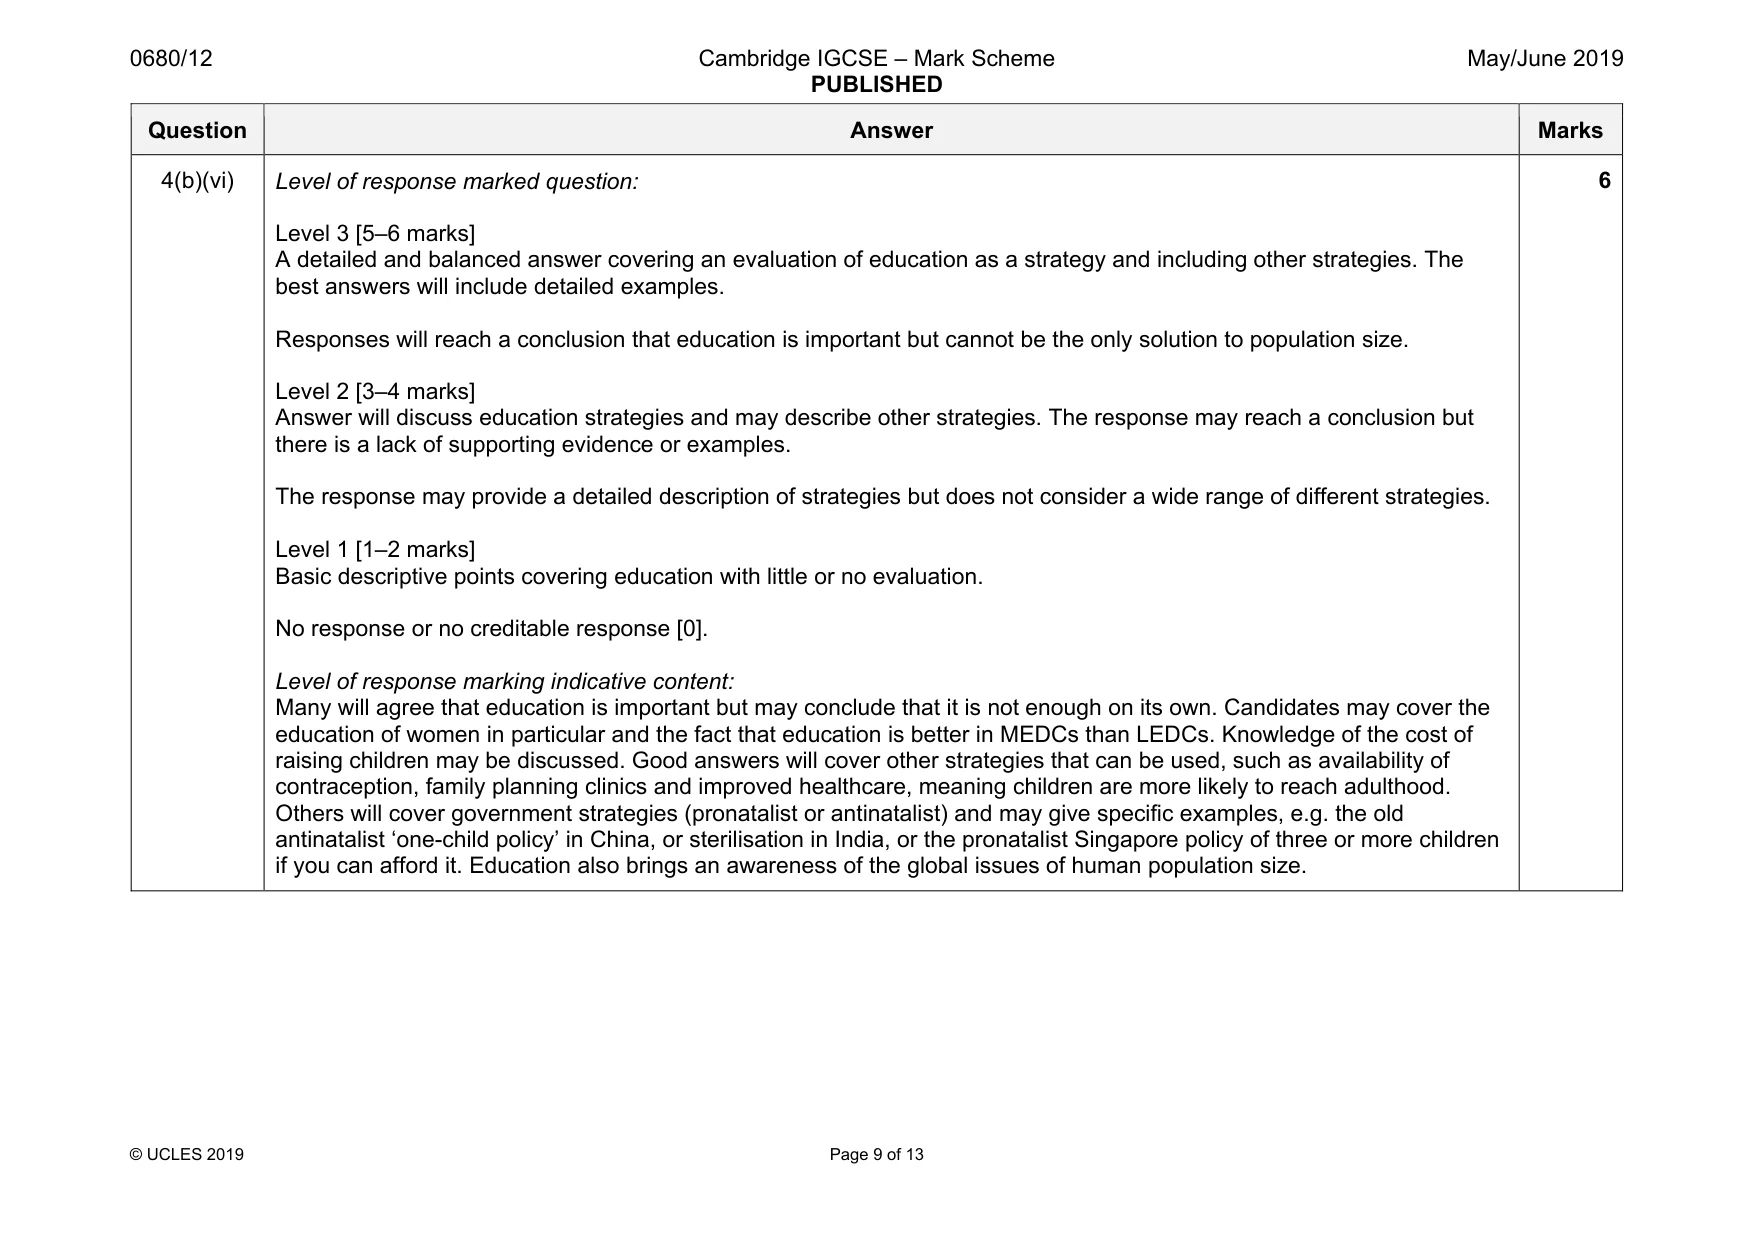
0680/12 Cambridge IGCSE – Mark Scheme PUBLISHED May/June 2019 © UCLES 2019 Page 9 of 13 Question Answer Marks 4(b)(vi) Level of response marked question: Level 3 [5–6 marks] A detailed and balanced answer covering an evaluation of education as a strategy and including other strategies. The best answers will include detailed examples. Responses will reach a conclusion that education is important but cannot be the only solution to population size. Level 2 [3–4 marks] Answer will discuss education strategies and may describe other strategies. The response may reach a conclusion but there is a lack of supporting evidence or examples. The response may provide a detailed description of strategies but does not consider a wide range of different strategies. Level 1 [1–2 marks] Basic descriptive points covering education with little or no evaluation. No response or no creditable response [0]. Level of response marking indicative content: Many will agree that education is important but may conclude that it is not enough on its own. Candidates may cover the education of women in particular and the fact that education is better in MEDCs than LEDCs. Knowledge of the cost of raising children may be discussed. Good answers will cover other strategies that can be used, such as availability of contraception, family planning clinics and improved healthcare, meaning children are more likely to reach adulthood. Others will cover government strategies (pronatalist or antinatalist) and may give specific examples, e.g. the old antinatalist ‘one-child policy’ in China, or sterilisation in India, or the pronatalist Singapore policy of three or more children if you can afford it. Education also brings an awareness of the global issues of human population size. 6
Mark scheme, page 10
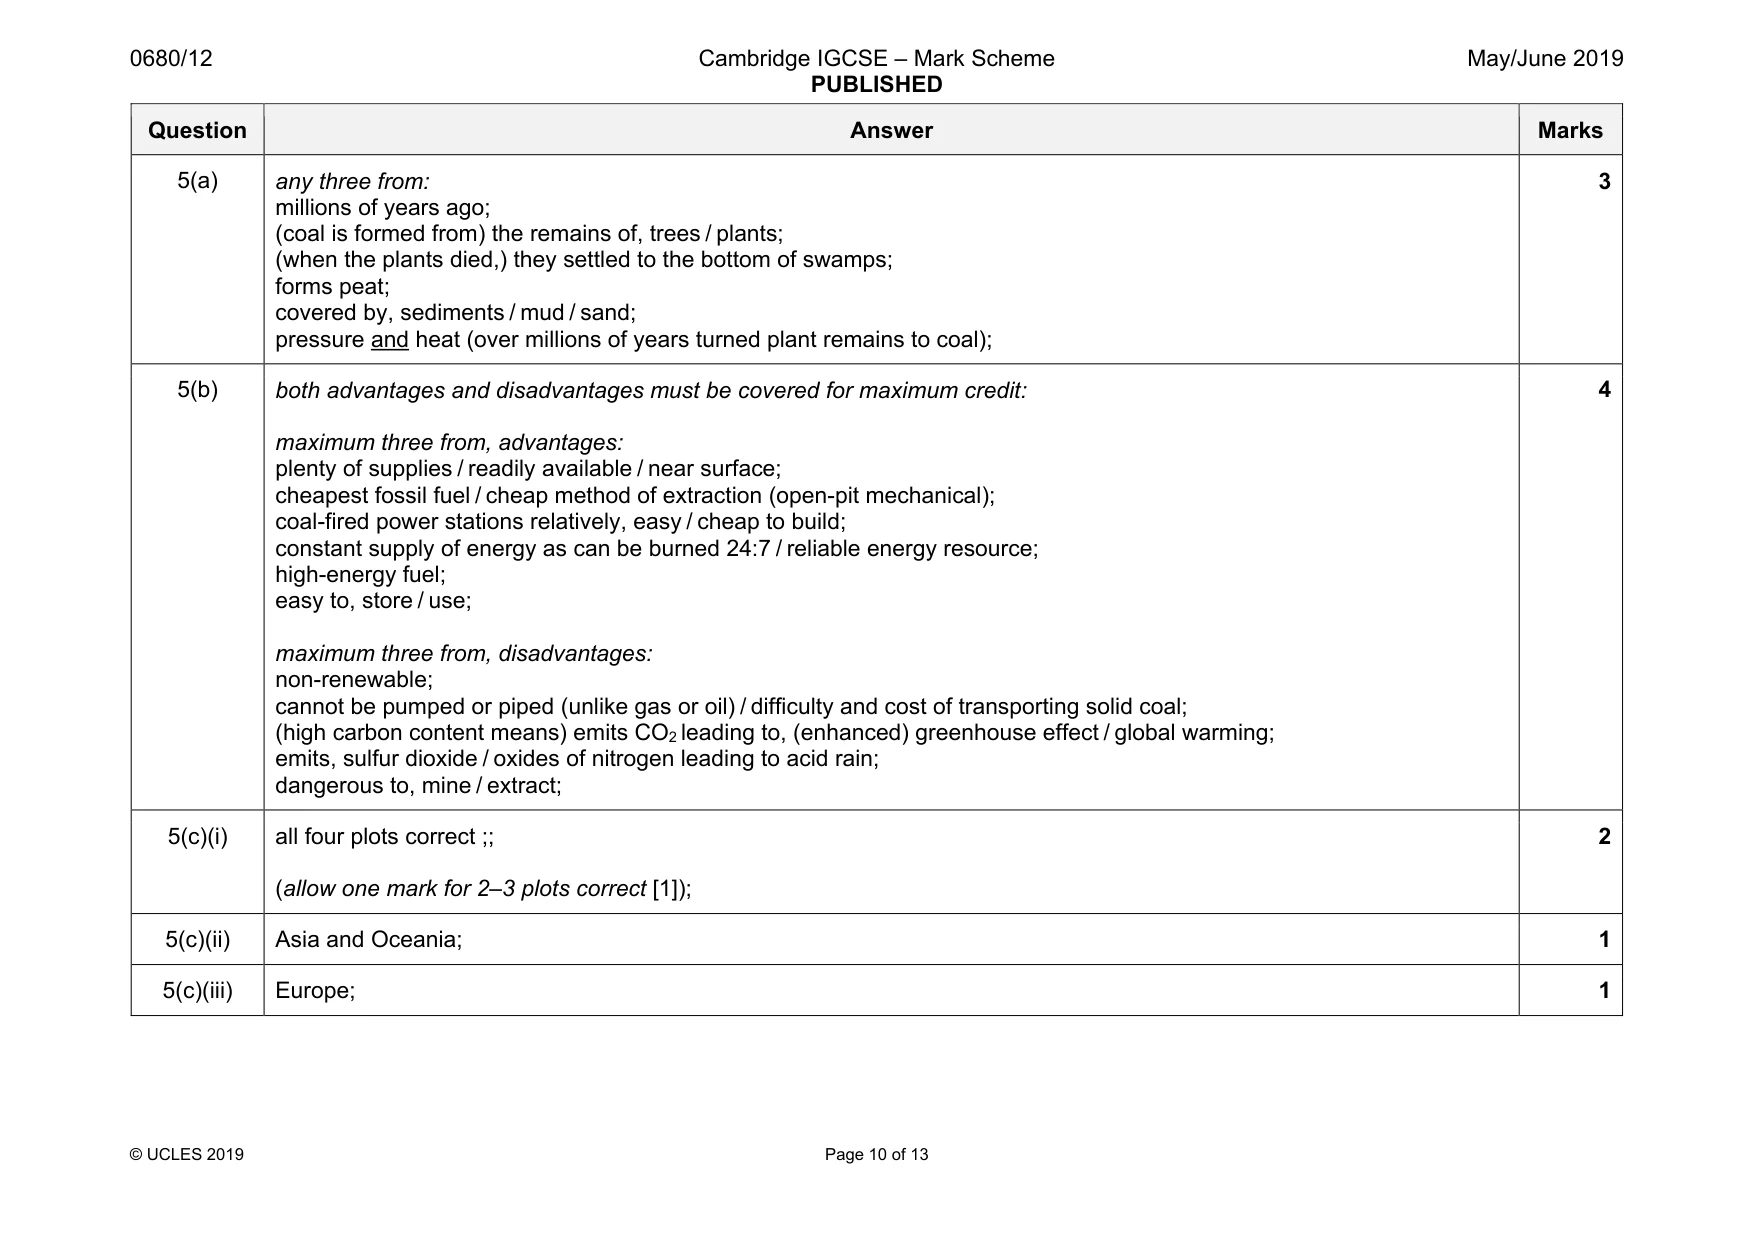
0680/12 Cambridge IGCSE – Mark Scheme PUBLISHED May/June 2019 © UCLES 2019 Page 10 of 13 Question Answer Marks 5(a) any three from: millions of years ago; (coal is formed from) the remains of, trees / plants; (when the plants died,) they settled to the bottom of swamps; forms peat; covered by, sediments / mud / sand; pressure and heat (over millions of years turned plant remains to coal); 3 5(b) both advantages and disadvantages must be covered for maximum credit: maximum three from, advantages: plenty of supplies / readily available / near surface; cheapest fossil fuel / cheap method of extraction (open-pit mechanical); coal-fired power stations relatively, easy / cheap to build; constant supply of energy as can be burned 24:7 / reliable energy resource; high-energy fuel; easy to, store / use; maximum three from, disadvantages: non-renewable; cannot be pumped or piped (unlike gas or oil) / difficulty and cost of transporting solid coal; (high carbon content means) emits CO2 leading to, (enhanced) greenhouse effect / global warming; emits, sulfur dioxide / oxides of nitrogen leading to acid rain; dangerous to, mine / extract; 4 5(c)(i) all four plots correct ;; (allow one mark for 2–3 plots correct [1]); 2 5(c)(ii) Asia and Oceania; 1 5(c)(iii) Europe; 1
Mark scheme, page 11
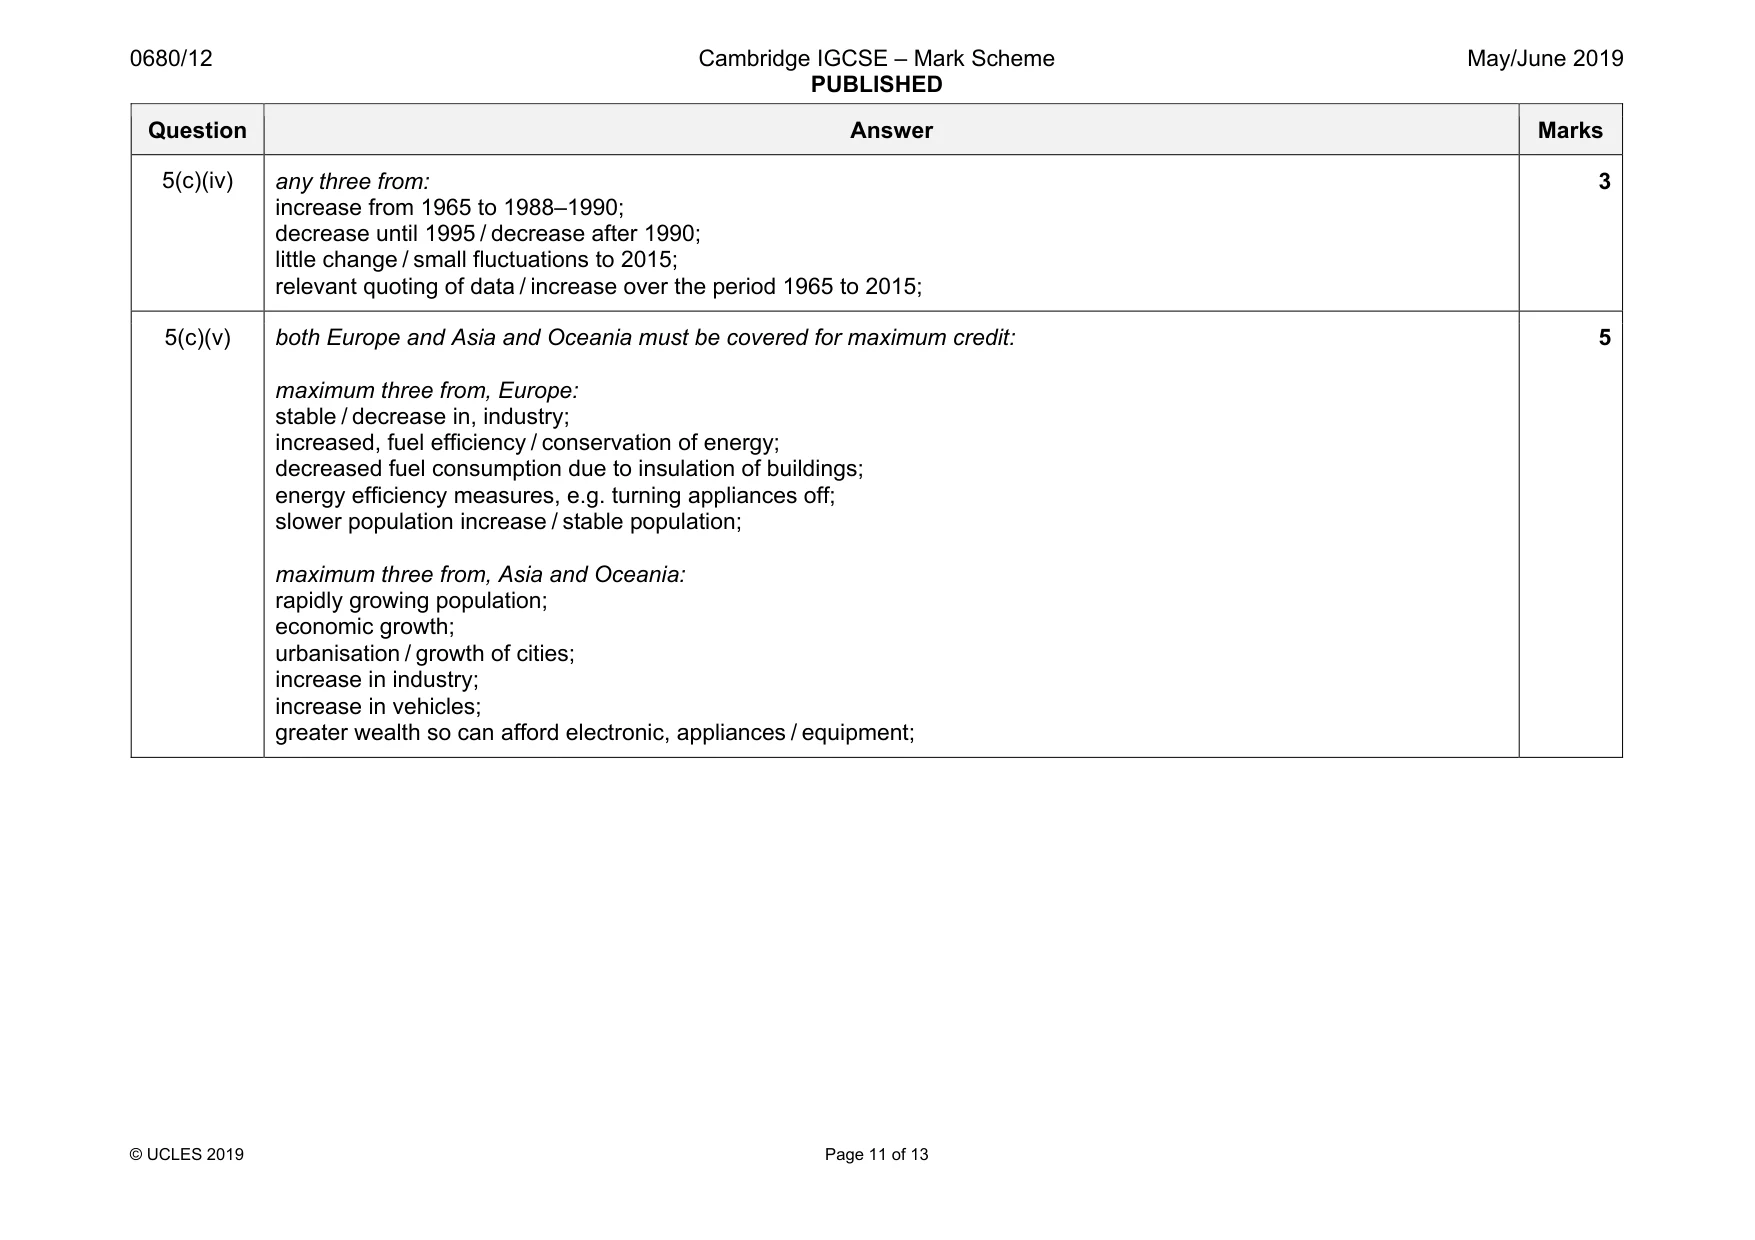
0680/12 Cambridge IGCSE – Mark Scheme PUBLISHED May/June 2019 © UCLES 2019 Page 11 of 13 Question Answer Marks 5(c)(iv) any three from: increase from 1965 to 1988–1990; decrease until 1995 / decrease after 1990; little change / small fluctuations to 2015; relevant quoting of data / increase over the period 1965 to 2015; 3 5(c)(v) both Europe and Asia and Oceania must be covered for maximum credit: maximum three from, Europe: stable / decrease in, industry; increased, fuel efficiency / conservation of energy; decreased fuel consumption due to insulation of buildings; energy efficiency measures, e.g. turning appliances off; slower population increase / stable population; maximum three from, Asia and Oceania: rapidly growing population; economic growth; urbanisation / growth of cities; increase in industry; increase in vehicles; greater wealth so can afford electronic, appliances / equipment; 5
Mark scheme, page 12
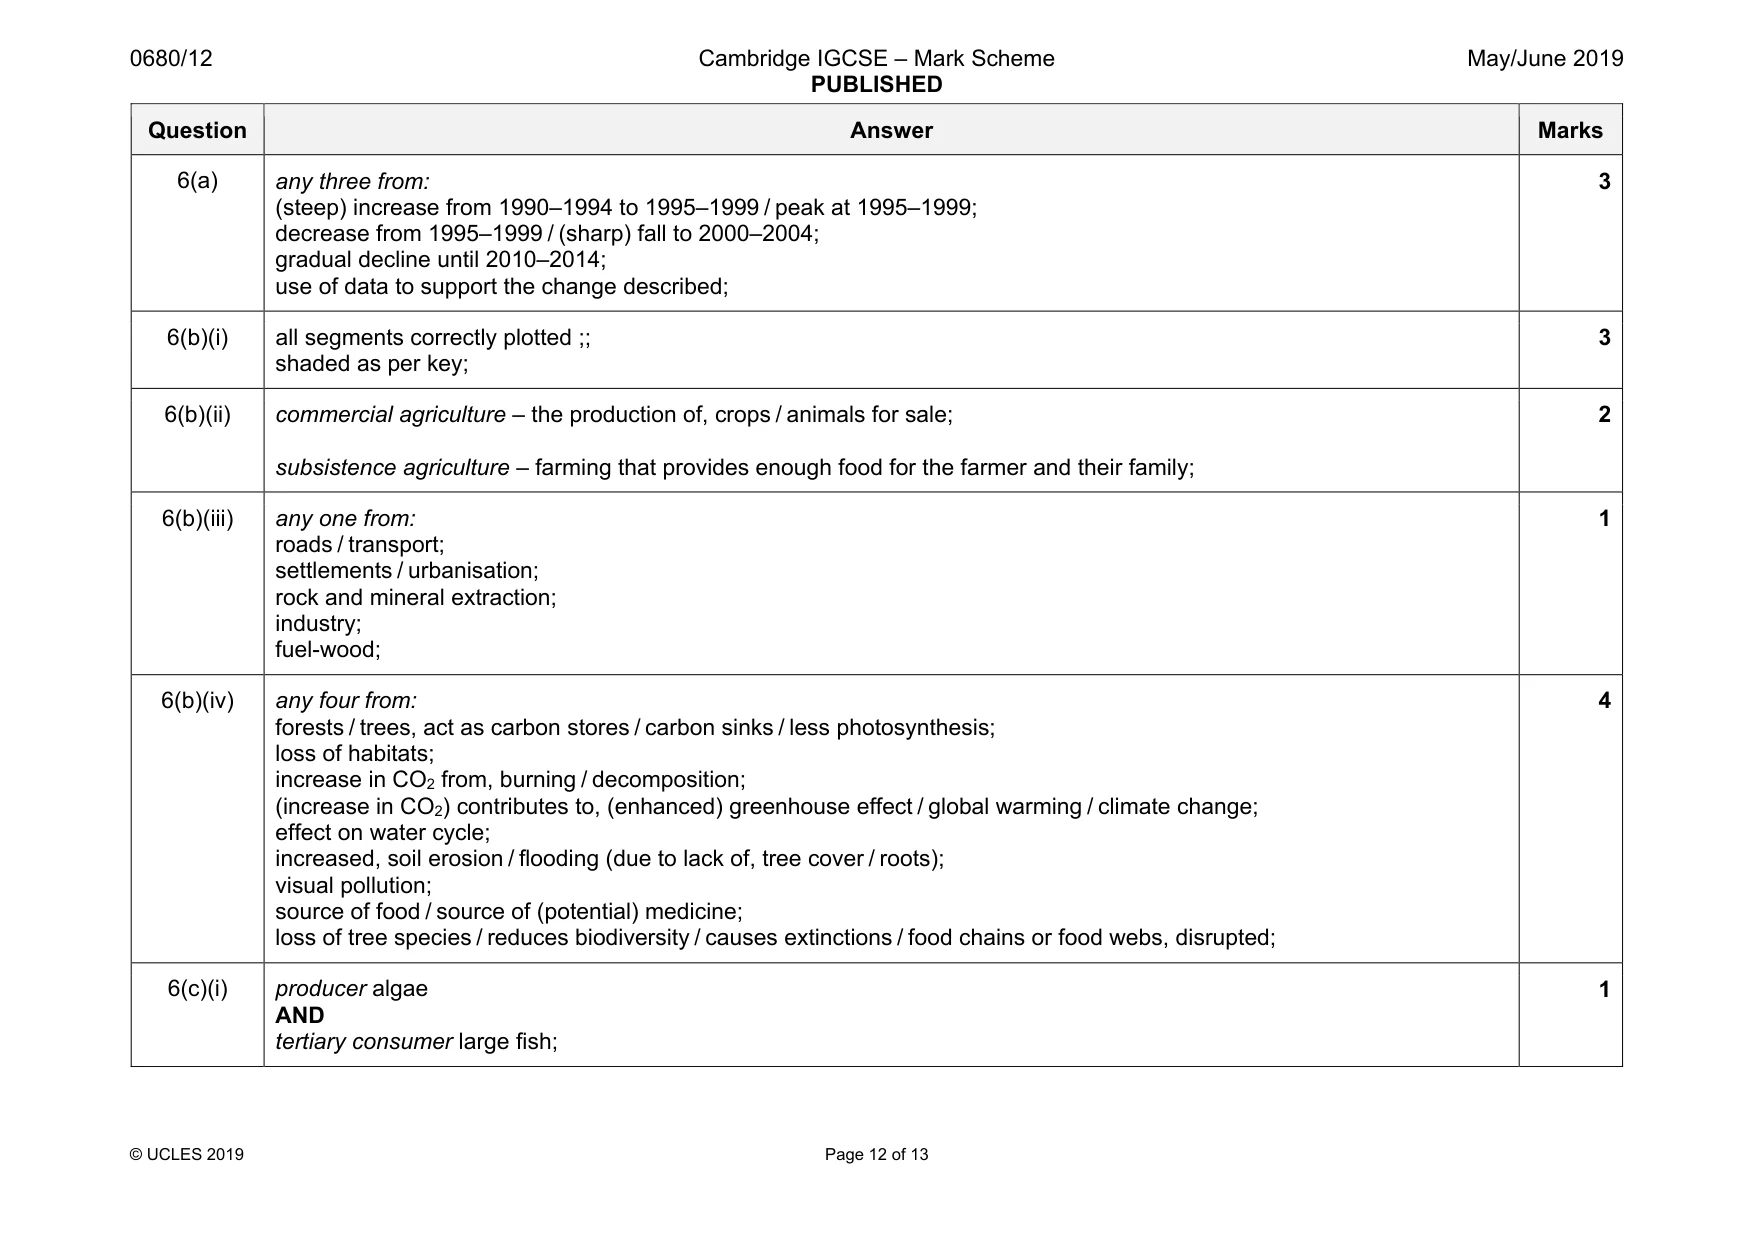
0680/12 Cambridge IGCSE – Mark Scheme PUBLISHED May/June 2019 © UCLES 2019 Page 12 of 13 Question Answer Marks 6(a) any three from: (steep) increase from 1990–1994 to 1995–1999 / peak at 1995–1999; decrease from 1995–1999 / (sharp) fall to 2000–2004; gradual decline until 2010–2014; use of data to support the change described; 3 6(b)(i) all segments correctly plotted ;; shaded as per key; 3 6(b)(ii) commercial agriculture – the production of, crops / animals for sale; subsistence agriculture – farming that provides enough food for the farmer and their family; 2 6(b)(iii) any one from: roads / transport; settlements / urbanisation; rock and mineral extraction; industry; fuel-wood; 1 6(b)(iv) any four from: forests / trees, act as carbon stores / carbon sinks / less photosynthesis; loss of habitats; increase in CO2 from, burning / decomposition; (increase in CO2) contributes to, (enhanced) greenhouse effect / global warming / climate change; effect on water cycle; increased, soil erosion / flooding (due to lack of, tree cover / roots); visual pollution; source of food / source of (potential) medicine; loss of tree species / reduces biodiversity / causes extinctions / food chains or food webs, disrupted; 4 6(c)(i) producer algae AND tertiary consumer large fish; 1
Mark scheme, page 13
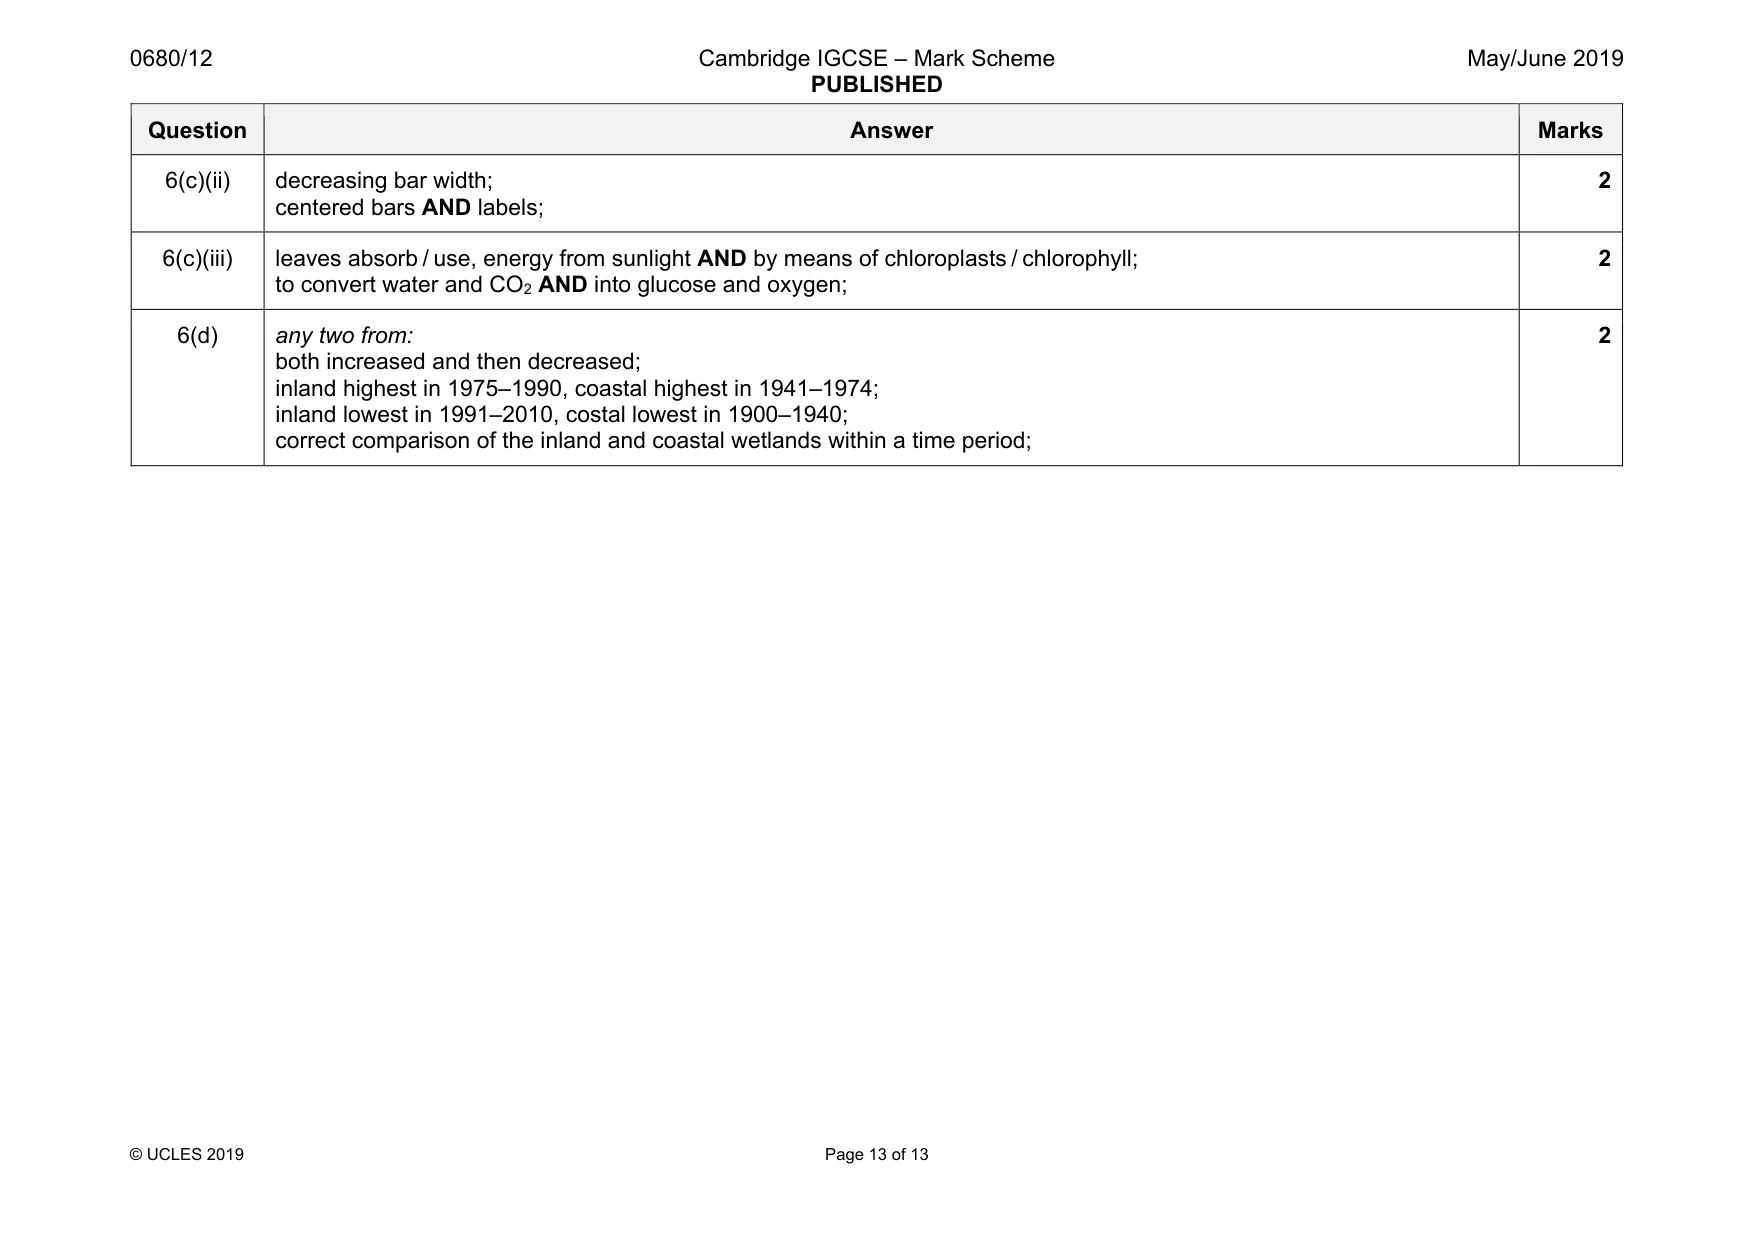
0680/12 Cambridge IGCSE – Mark Scheme PUBLISHED May/June 2019 © UCLES 2019 Page 13 of 13 Question Answer Marks 6(c)(ii) decreasing bar width; centered bars AND labels; 2 6(c)(iii) leaves absorb / use, energy from sunlight AND by means of chloroplasts / chlorophyll; to convert water and CO2 AND into glucose and oxygen; 2 6(d) any two from: both increased and then decreased; inland highest in 1975–1990, coastal highest in 1941–1974; inland lowest in 1991–2010, costal lowest in 1900–1940; correct comparison of the inland and coastal wetlands within a time period; 2
What you needed in this session
Cambridge’s own grade thresholds for 2019 May/June, Paper 1 · Variant 2. A higher threshold means an easier paper — the bar moves with how the cohort did.