Cambridge IGCSE Environmental Management 0680 — 2019 May/June Paper 1 · Variant 1
0680/11/M/J/19 · 80 marks · ≈90 min
The question paper and its mark scheme, free to read here and free to download. This is Cambridge’s own paper, exactly as it was sat.
Question paper16 pages
Mark scheme13 pages
Answers below. Sit the paper first if you are practising.
Paper as text
Question paper, page 1
This document consists of 16 printed pages. DC (KS/SG) 168046/2 © UCLES 2019 [Turn over * 0 6 5 8 7 2 4 2 3 2 * Cambridge Assessment International Education Cambridge International General Certificate of Secondary Education ENVIRONMENTAL MANAGEMENT 0680/11 Paper 1 Theory May/June 2019 1 hour 45 minutes Candidates answer on the Question Paper. No Additional Materials are required. READ THESE INSTRUCTIONS FIRST Write your centre number, candidate number and name in the spaces at the top of this page. Write in dark blue or black pen. You may use an HB pencil for any diagrams or graphs. Do not use staples, paper clips, glue or correction fluid. DO NOT WRITE IN ANY BARCODES. Answer all questions. Electronic calculators may be used. You may lose marks if you do not show your working or if you do not use appropriate units. At the end of the examination, fasten all your work securely together. The number of marks is given in brackets [ ] at the end of each question or part question.
Question paper, page 2
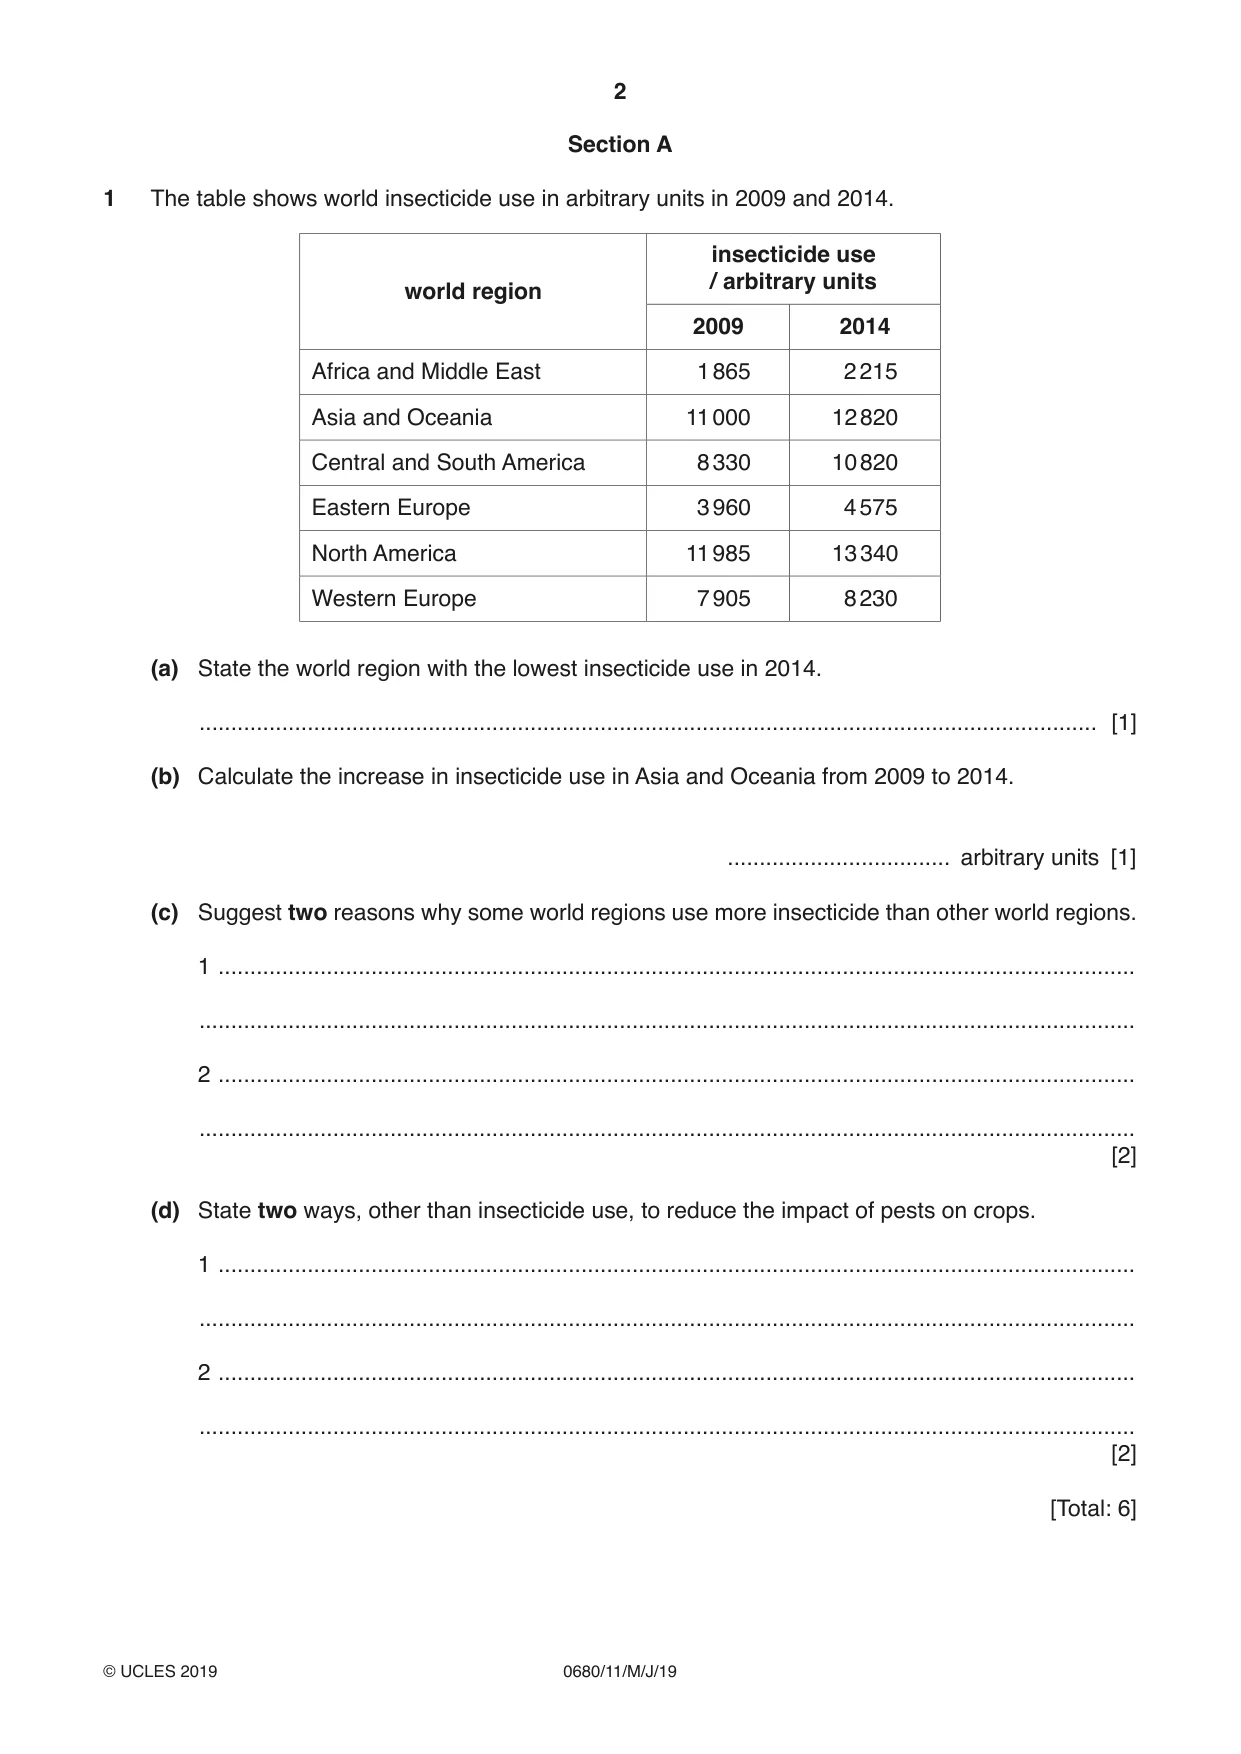
2 0680/11/M/J/19 © UCLES 2019 Section A 1 The table shows world insecticide use in arbitrary units in 2009 and 2014. world region insecticide use / arbitrary units 2009 2014 Africa and Middle East 1 865 2 215 Asia and Oceania 11 000 12 820 Central and South America 8 330 10 820 Eastern Europe 3 960 4 575 North America 11 985 13 340 Western Europe 7 905 8 230 (a) State the world region with the lowest insecticide use in 2014. … [1] (b) Calculate the increase in insecticide use in Asia and Oceania from 2009 to 2014. … arbitrary units [1] (c) Suggest two reasons why some world regions use more insecticide than other world regions. 1 … … 2 … … [2] (d) State two ways, other than insecticide use, to reduce the impact of pests on crops. 1 … … 2 … … [2] [Total: 6]
Question paper, page 3
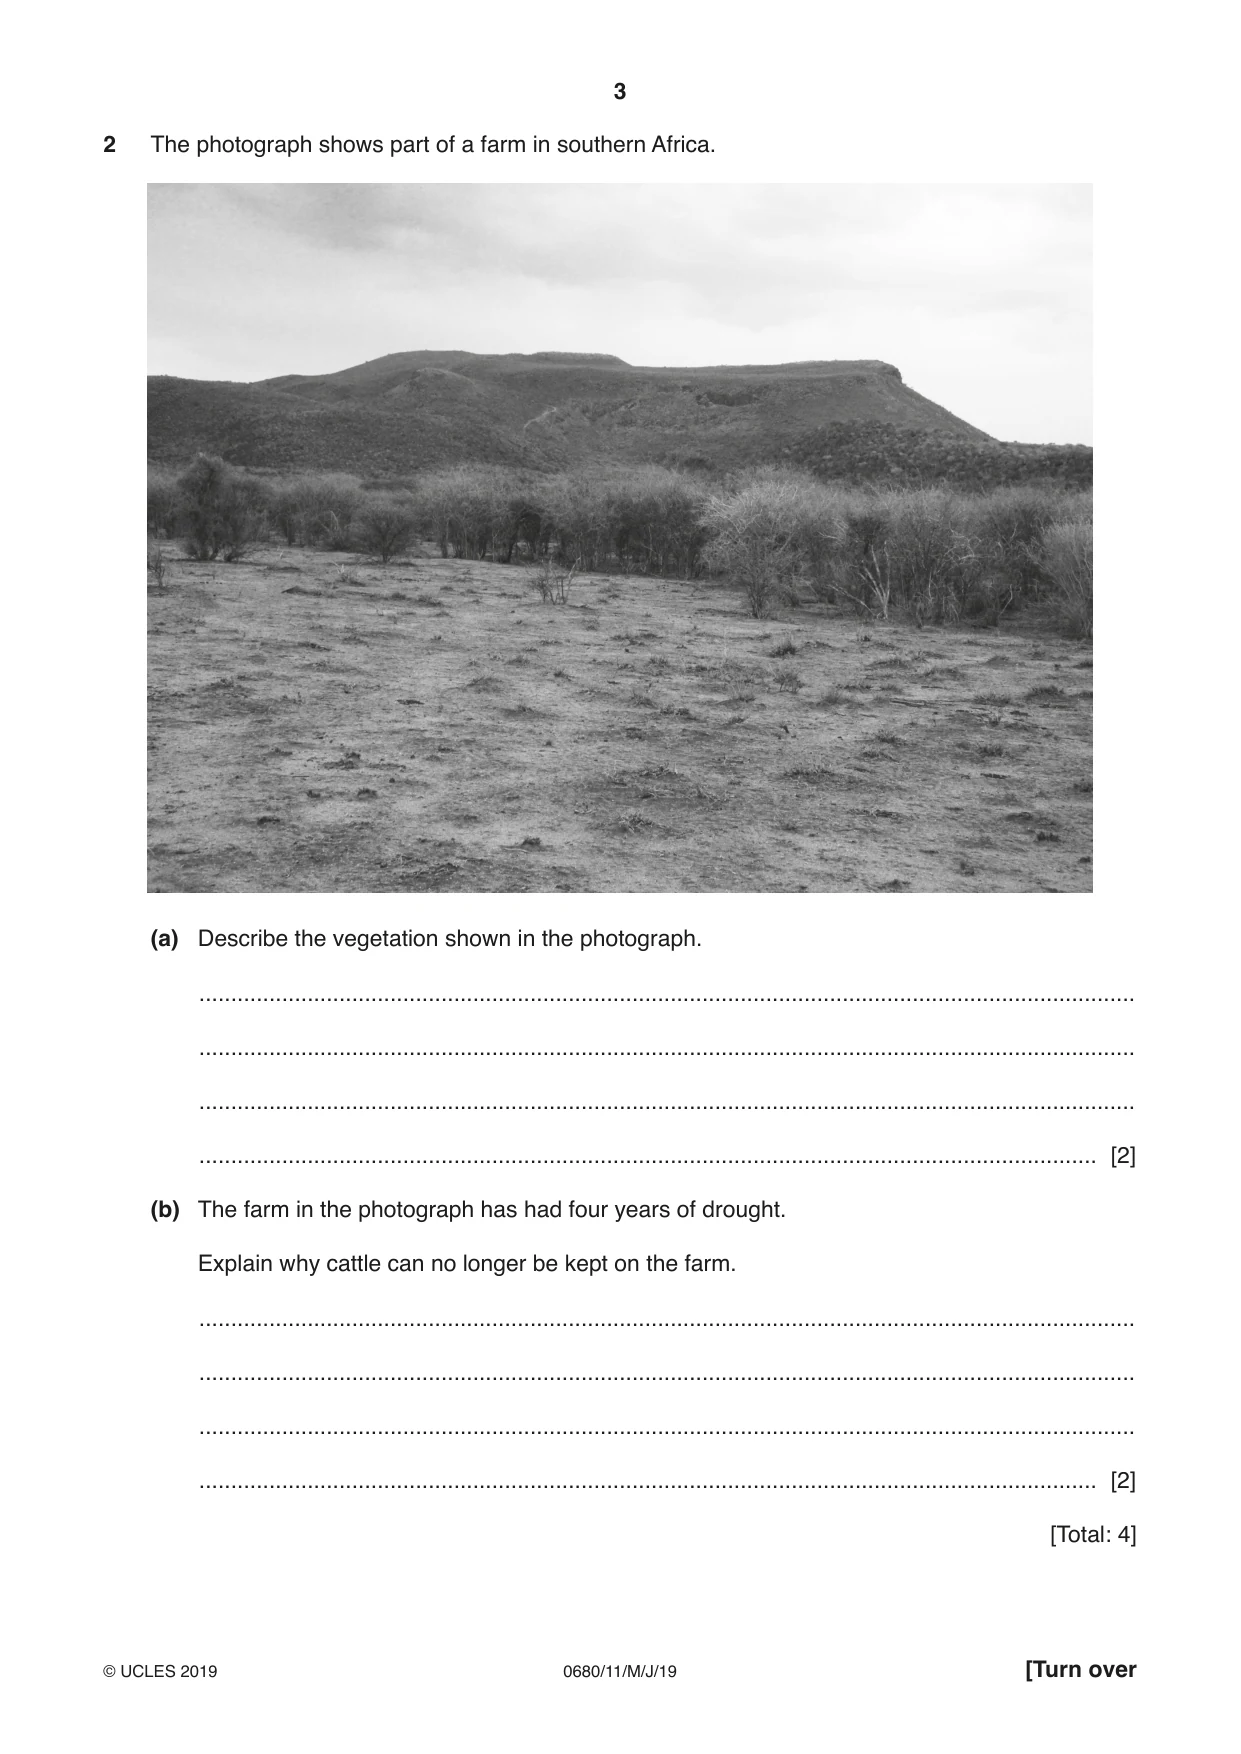
3 0680/11/M/J/19 © UCLES 2019 [Turn over 2 The photograph shows part of a farm in southern Africa. (a) Describe the vegetation shown in the photograph. … … … … [2] (b) The farm in the photograph has had four years of drought. Explain why cattle can no longer be kept on the farm. … … … … [2] [Total: 4]
Question paper, page 4
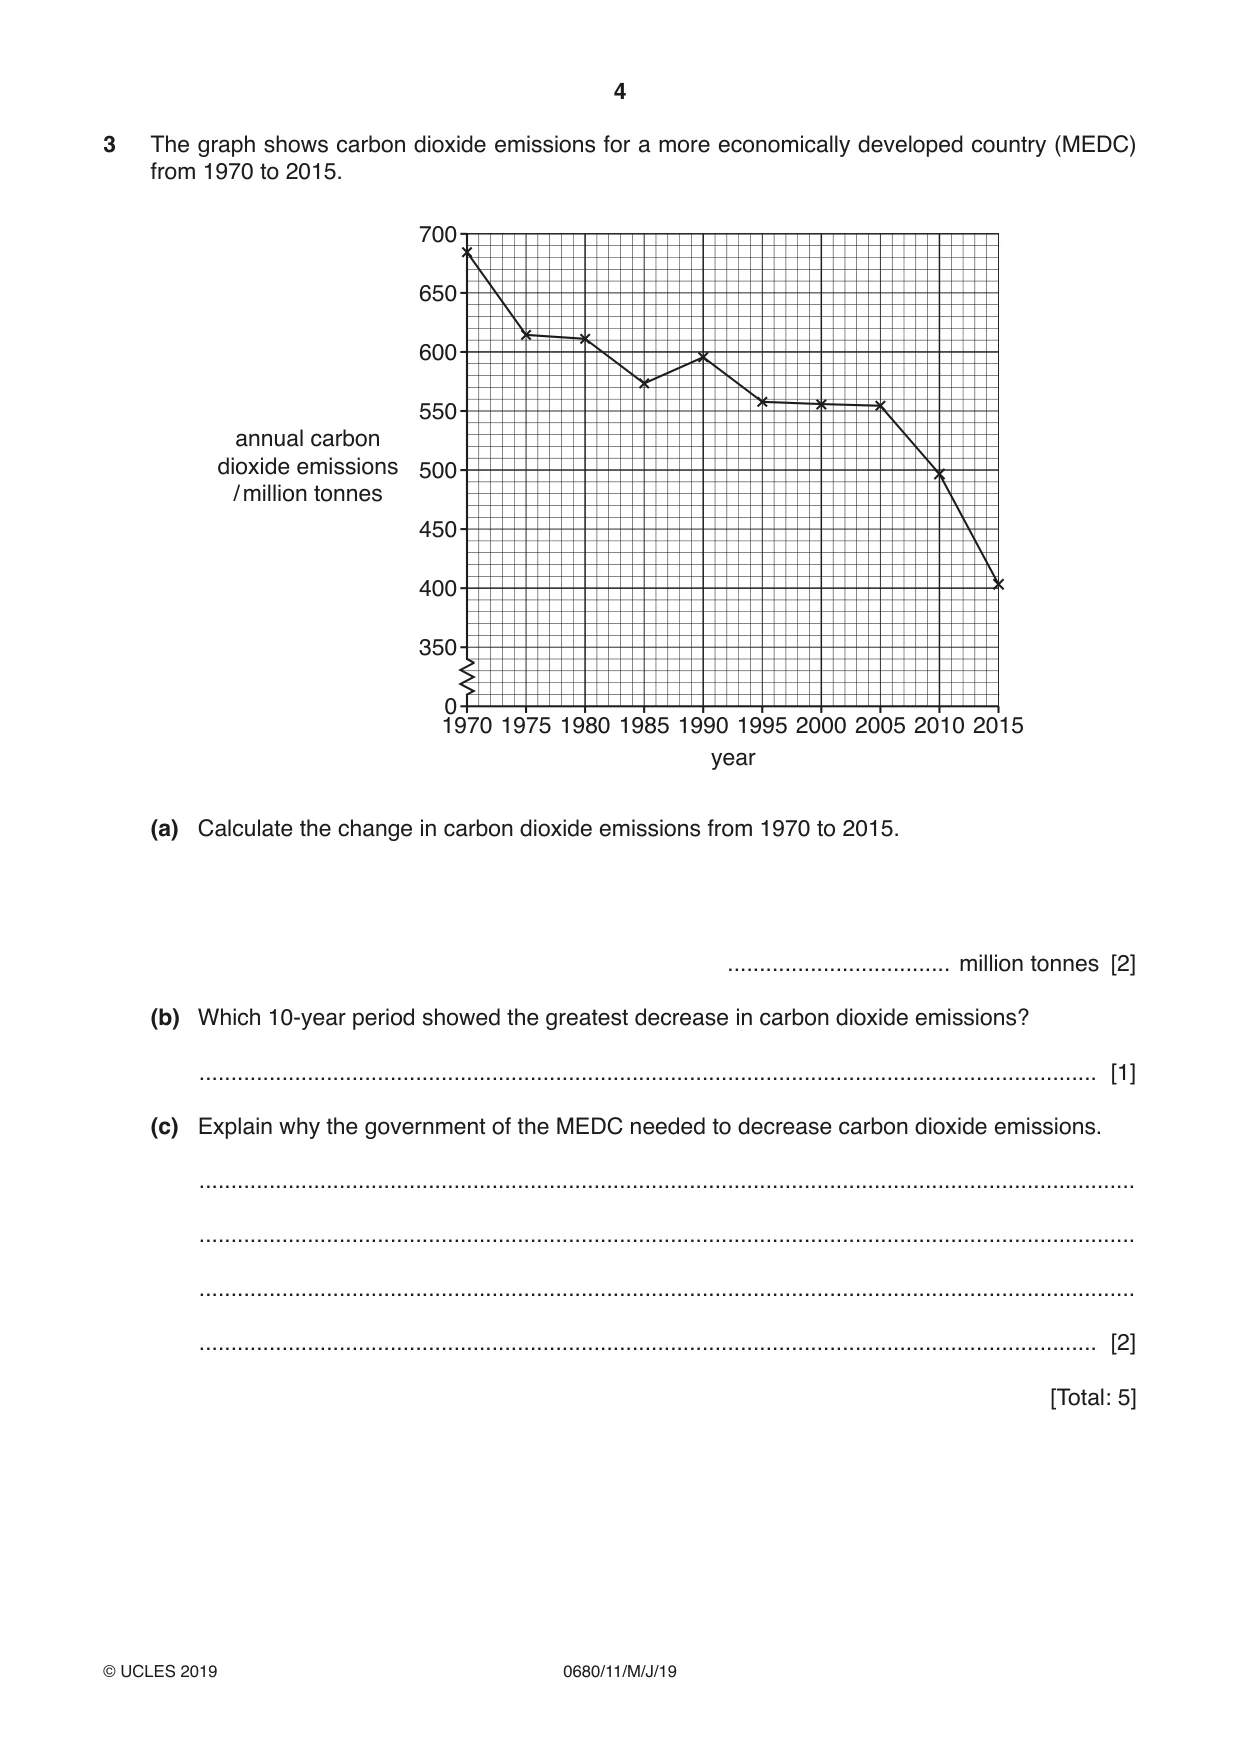
4 0680/11/M/J/19 © UCLES 2019 3 The graph shows carbon dioxide emissions for a more economically developed country (MEDC) from 1970 to 2015. 1970 1975 1980 1985 1990 1995 2000 2005 2010 2015 0 350 400 450 500 550 600 650 700 annual carbon dioxide emissions / million tonnes year (a) Calculate the change in carbon dioxide emissions from 1970 to 2015. … million tonnes [2] (b) Which 10-year period showed the greatest decrease in carbon dioxide emissions? … [1] (c) Explain why the government of the MEDC needed to decrease carbon dioxide emissions. … … … … [2] [Total: 5]
Question paper, page 5
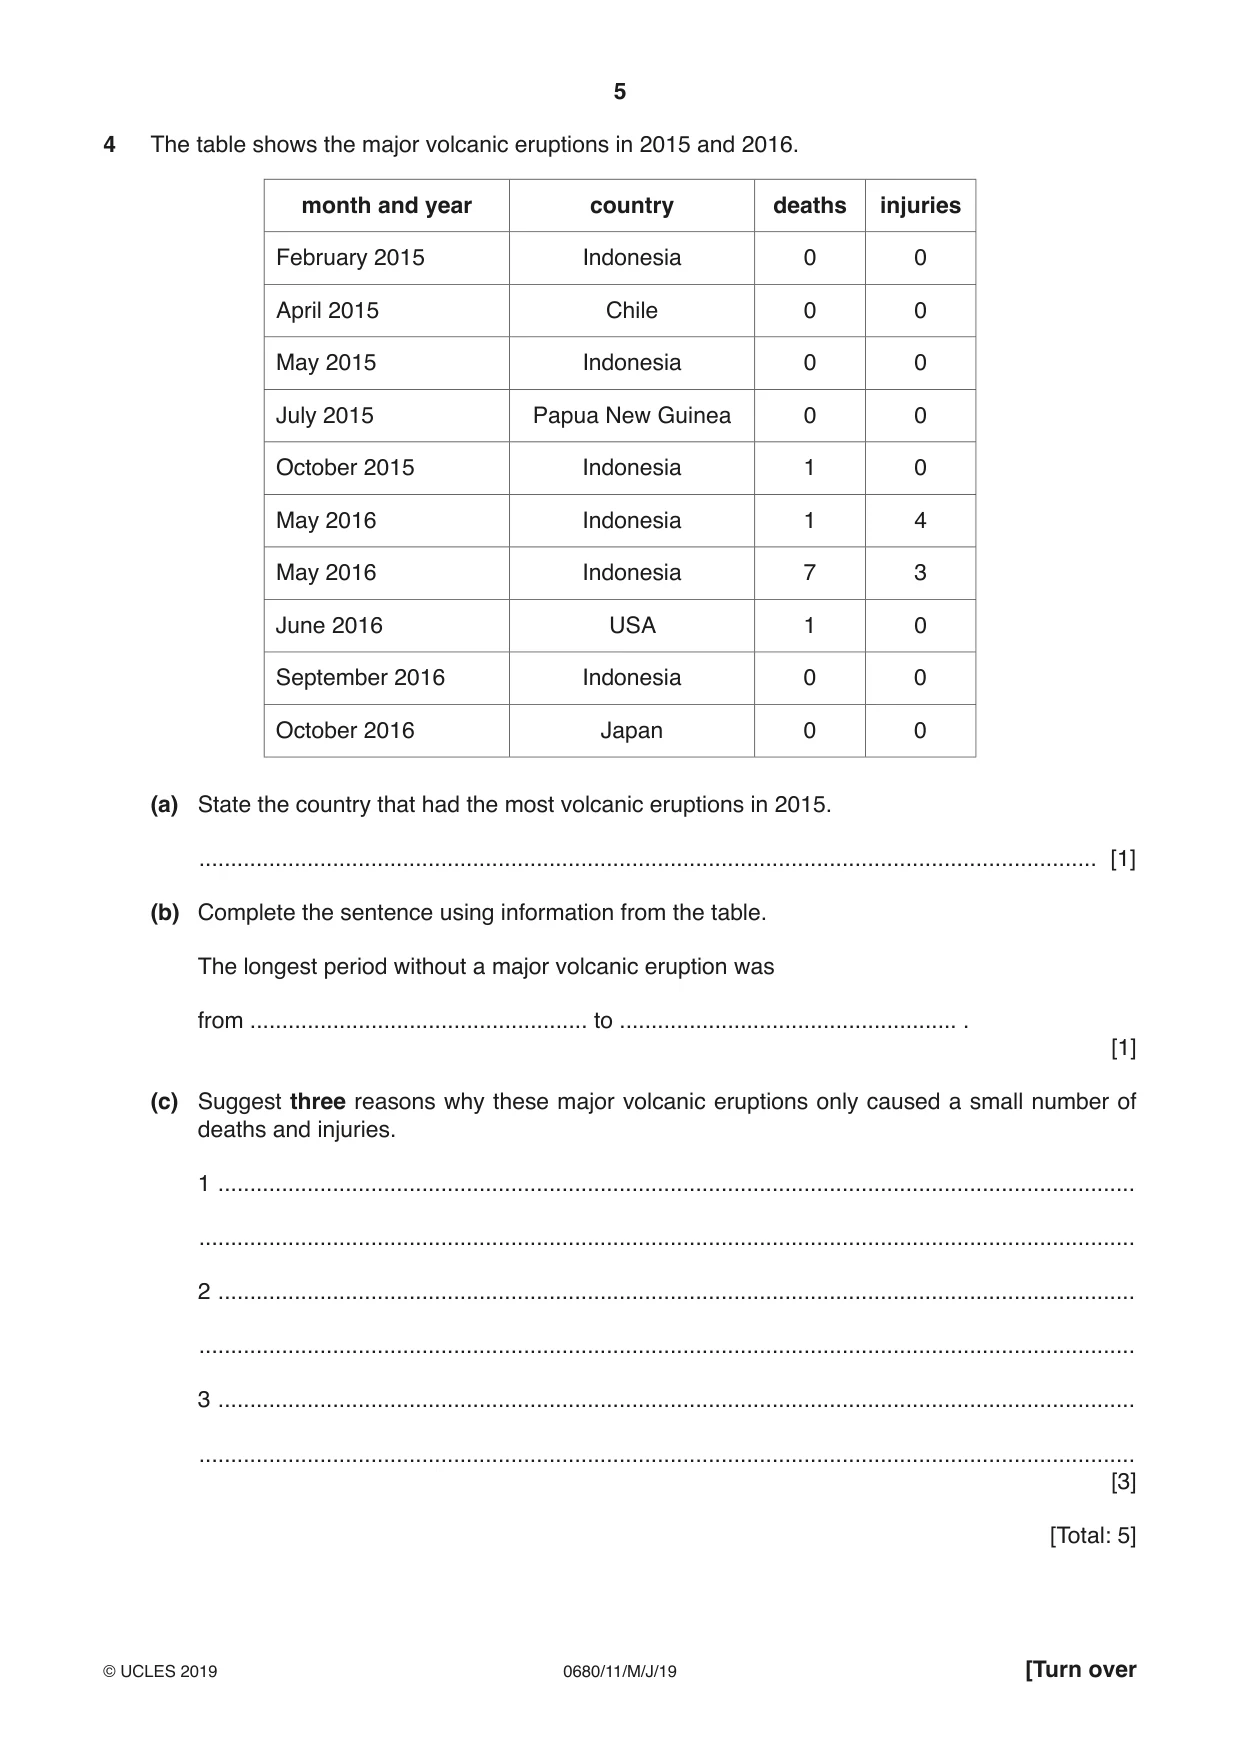
5 0680/11/M/J/19 © UCLES 2019 [Turn over 4 The table shows the major volcanic eruptions in 2015 and 2016. month and year country deaths injuries February 2015 Indonesia 0 0 April 2015 Chile 0 0 May 2015 Indonesia 0 0 July 2015 Papua New Guinea 0 0 October 2015 Indonesia 1 0 May 2016 Indonesia 1 4 May 2016 Indonesia 7 3 June 2016 USA 1 0 September 2016 Indonesia 0 0 October 2016 Japan 0 0 (a) State the country that had the most volcanic eruptions in 2015. … [1] (b) Complete the sentence using information from the table. The longest period without a major volcanic eruption was from … to … . [1] (c) Suggest three reasons why these major volcanic eruptions only caused a small number of deaths and injuries. 1 … … 2 … … 3 … … [3] [Total: 5]
Question paper, page 6
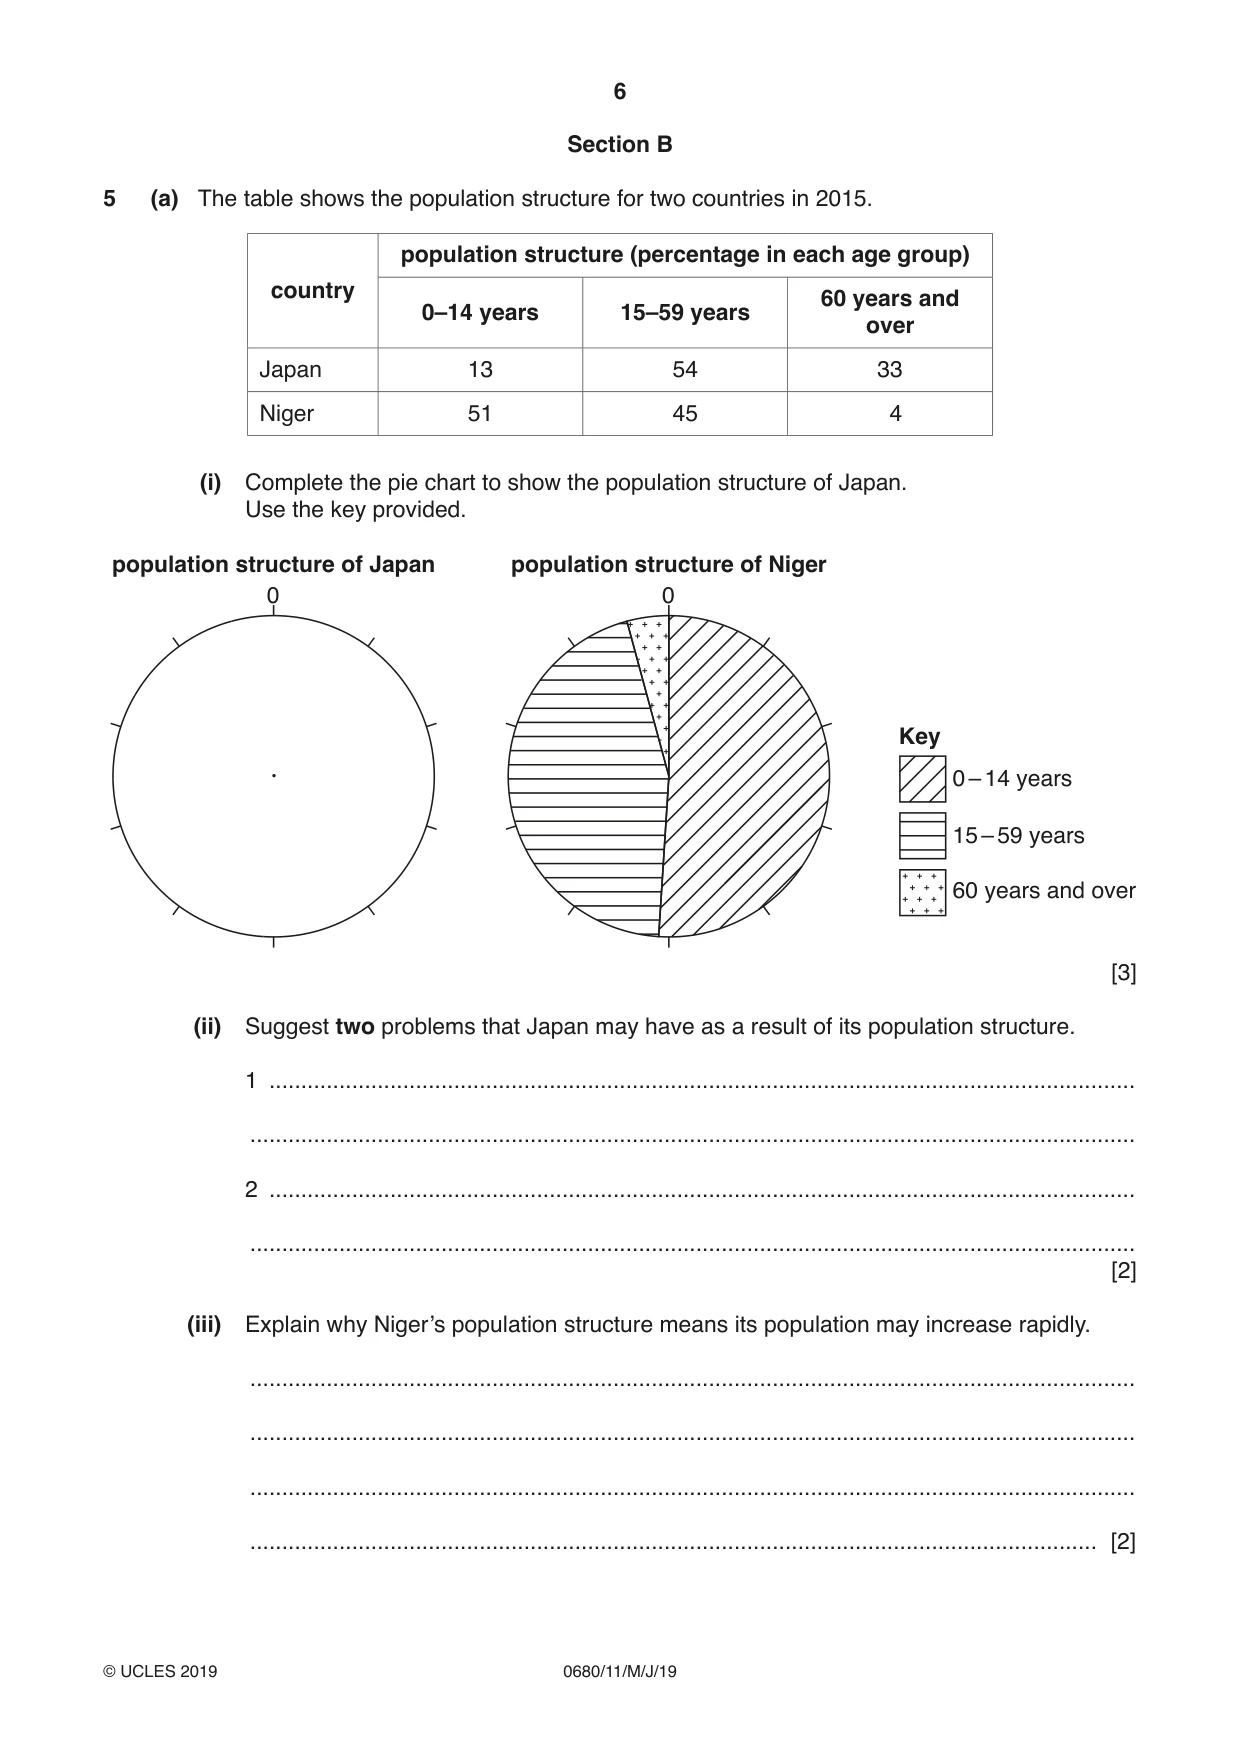
6 0680/11/M/J/19 © UCLES 2019 Section B 5 (a) The table shows the population structure for two countries in 2015. country population structure (percentage in each age group) 0–14 years 15–59 years 60 years and over Japan 13 54 33 Niger 51 45 4 (i) Complete the pie chart to show the population structure of Japan. Use the key provided. Key 0 – 14 years 15 – 59 years 60 years and over population structure of Niger population structure of Japan 0 0 [3] (ii) Suggest two problems that Japan may have as a result of its population structure. 1 … … 2 … … [2] (iii) Explain why Niger’s population structure means its population may increase rapidly. … … … … [2]
Question paper, page 7
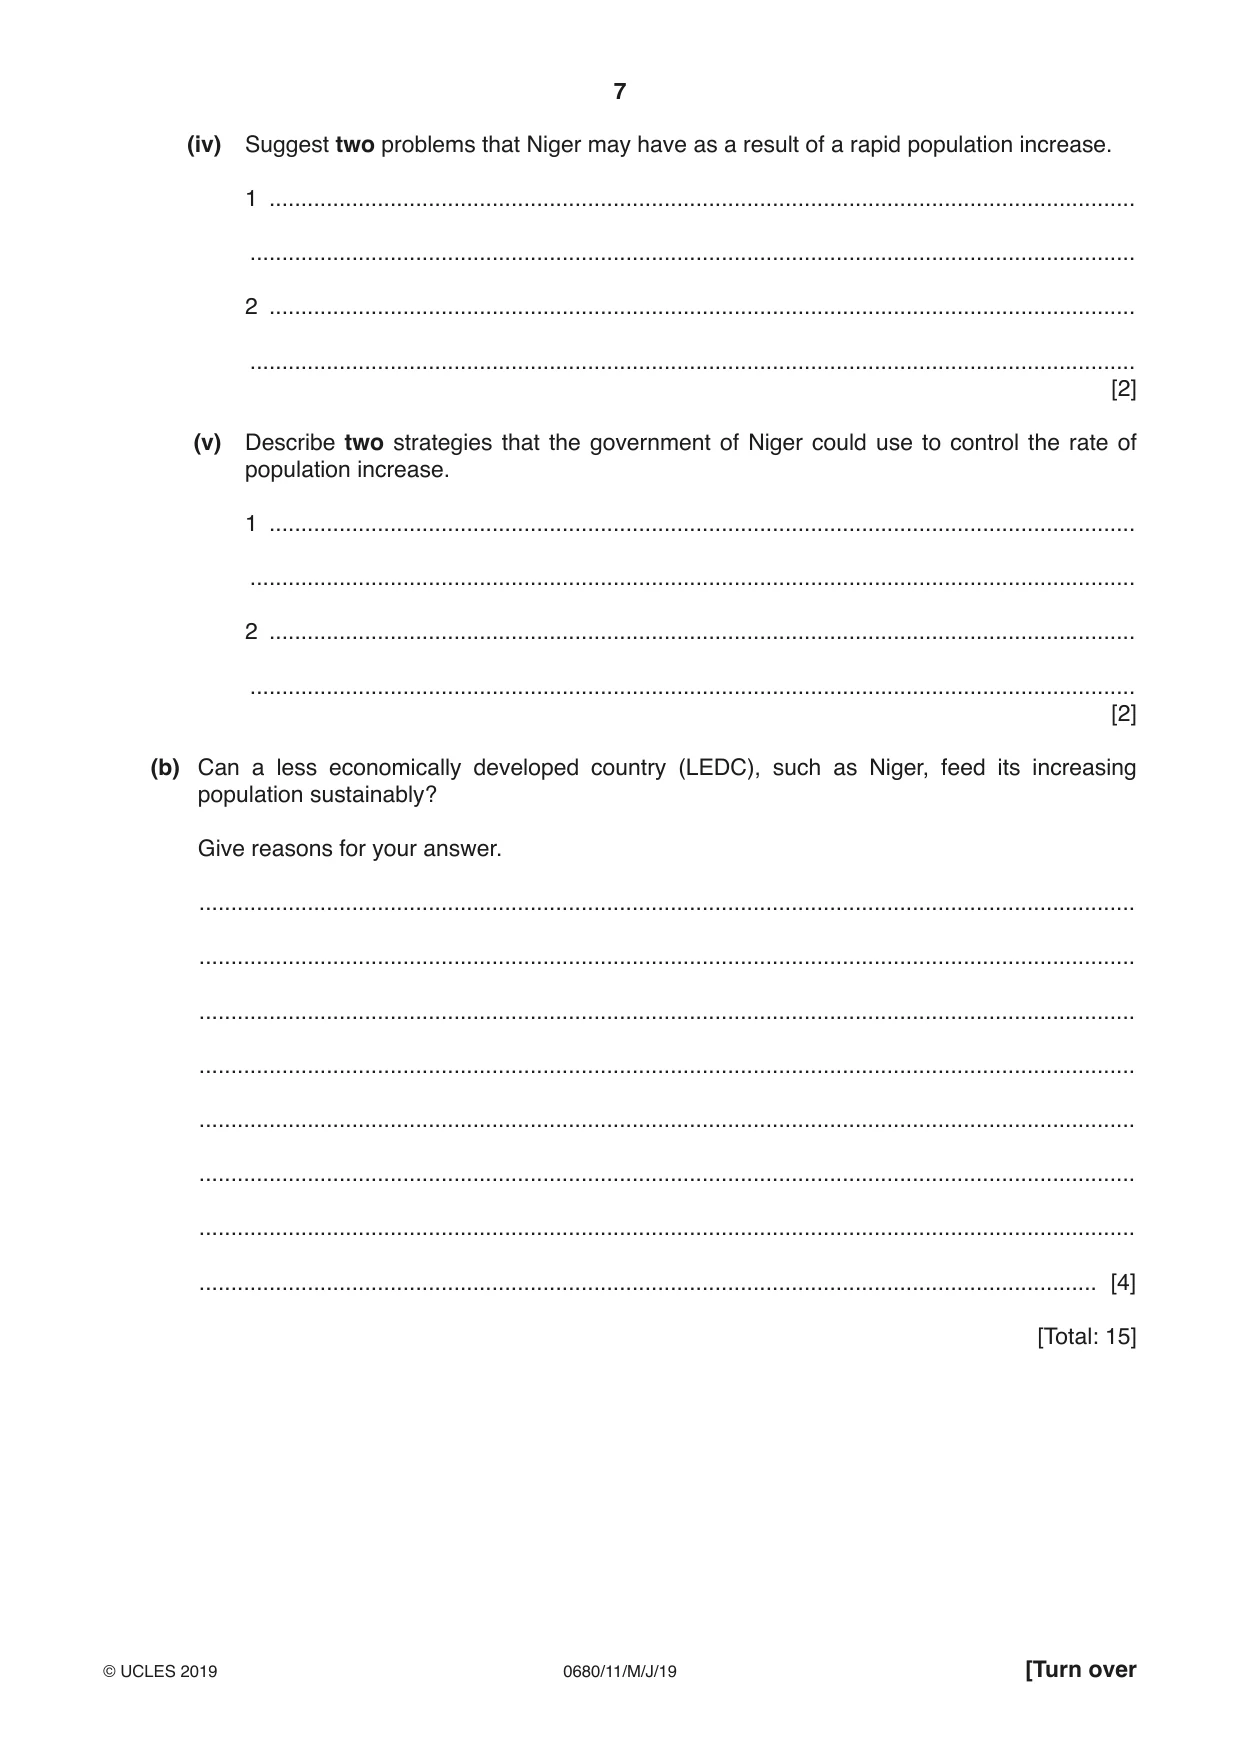
7 0680/11/M/J/19 © UCLES 2019 [Turn over (iv) Suggest two problems that Niger may have as a result of a rapid population increase. 1 … … 2 … … [2] (v) Describe two strategies that the government of Niger could use to control the rate of population increase. 1 … … 2 … … [2] (b) Can a less economically developed country (LEDC), such as Niger, feed its increasing population sustainably? Give reasons for your answer. … … … … … … … … [4] [Total: 15]
Question paper, page 8
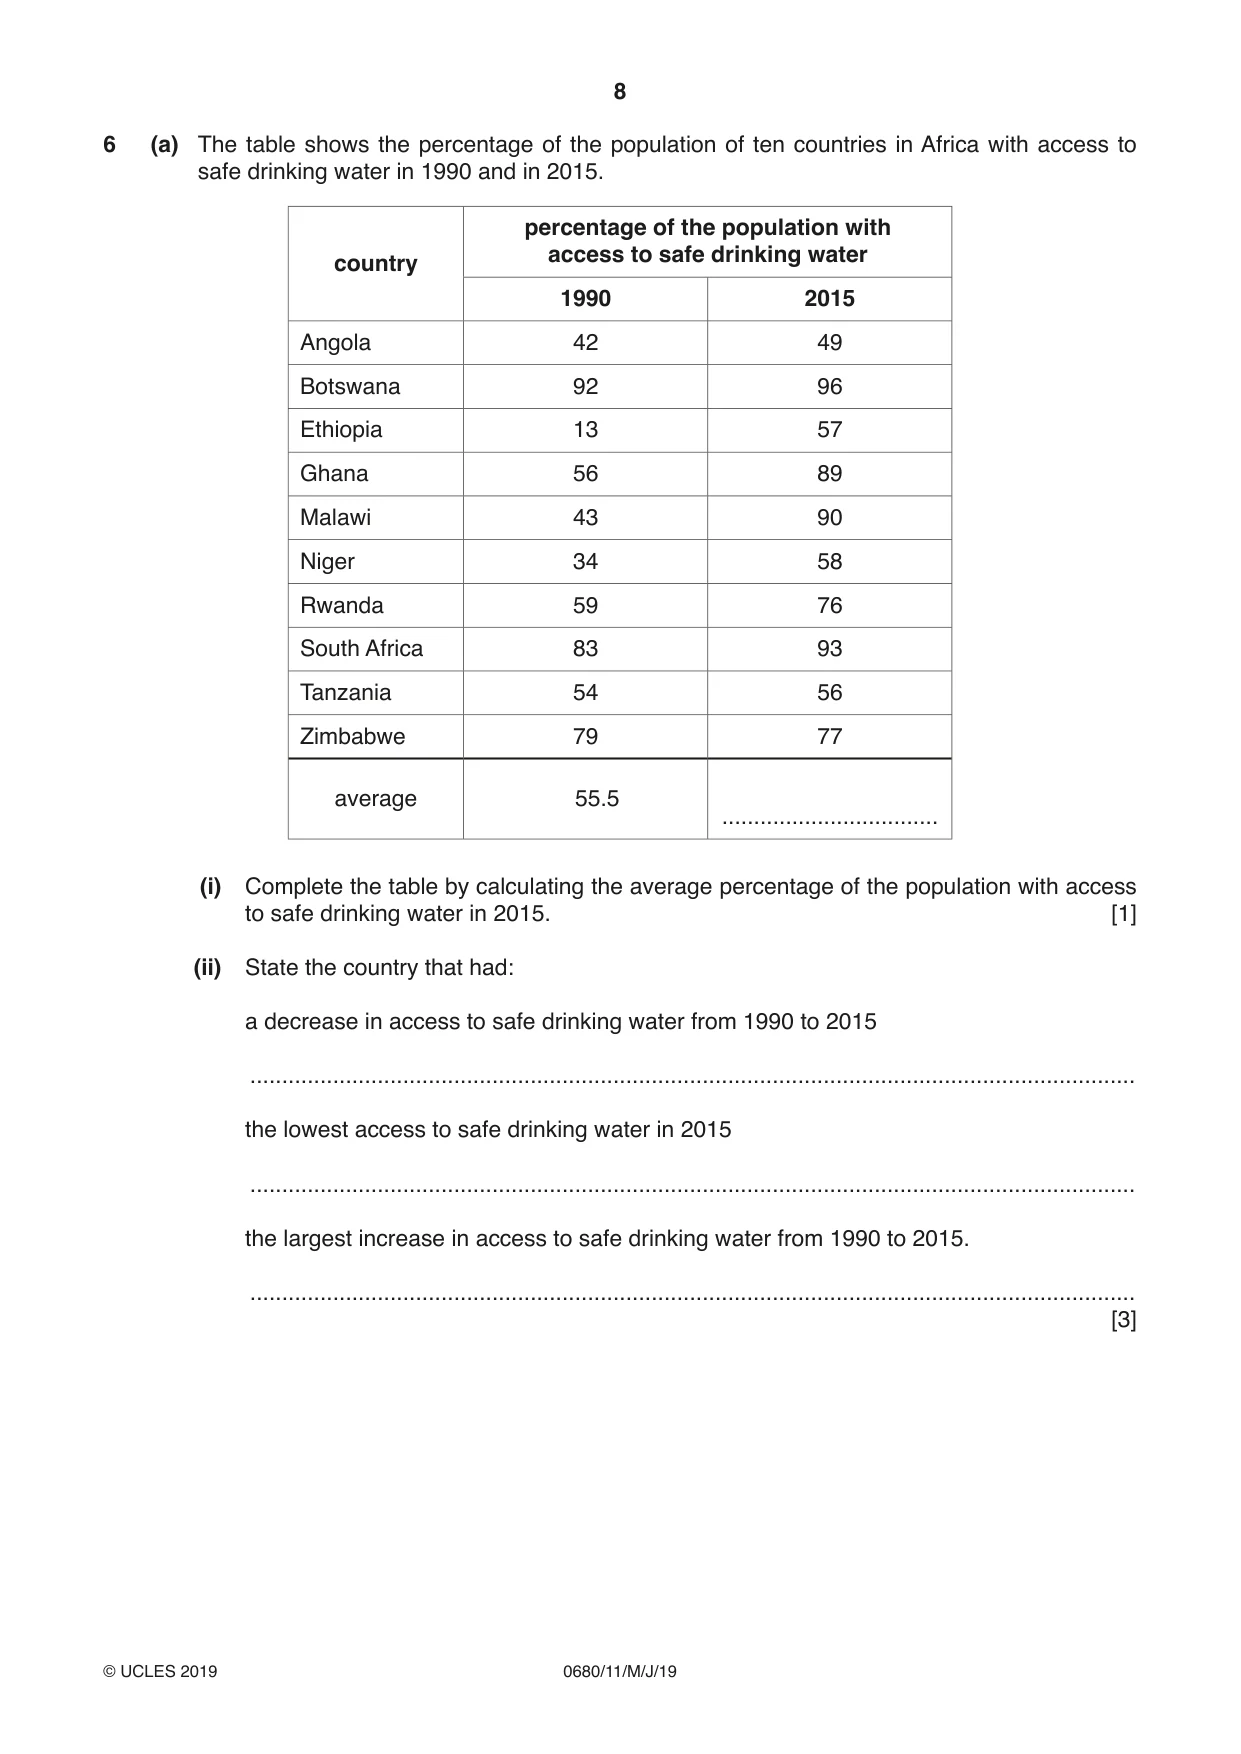
8 0680/11/M/J/19 © UCLES 2019 6 (a) The table shows the percentage of the population of ten countries in Africa with access to safe drinking water in 1990 and in 2015. country percentage of the population with access to safe drinking water 1990 2015 Angola 42 49 Botswana 92 96 Ethiopia 13 57 Ghana 56 89 Malawi 43 90 Niger 34 58 Rwanda 59 76 South Africa 83 93 Tanzania 54 56 Zimbabwe 79 77 average 55.5 … (i) Complete the table by calculating the average percentage of the population with access to safe drinking water in 2015. [1] (ii) State the country that had: a decrease in access to safe drinking water from 1990 to 2015 … the lowest access to safe drinking water in 2015 … the largest increase in access to safe drinking water from 1990 to 2015. … [3]
Question paper, page 9
9 0680/11/M/J/19 © UCLES 2019 [Turn over (iii) Explain why access to safe drinking water is important for people. … … … … … … [3]
Question paper, page 10
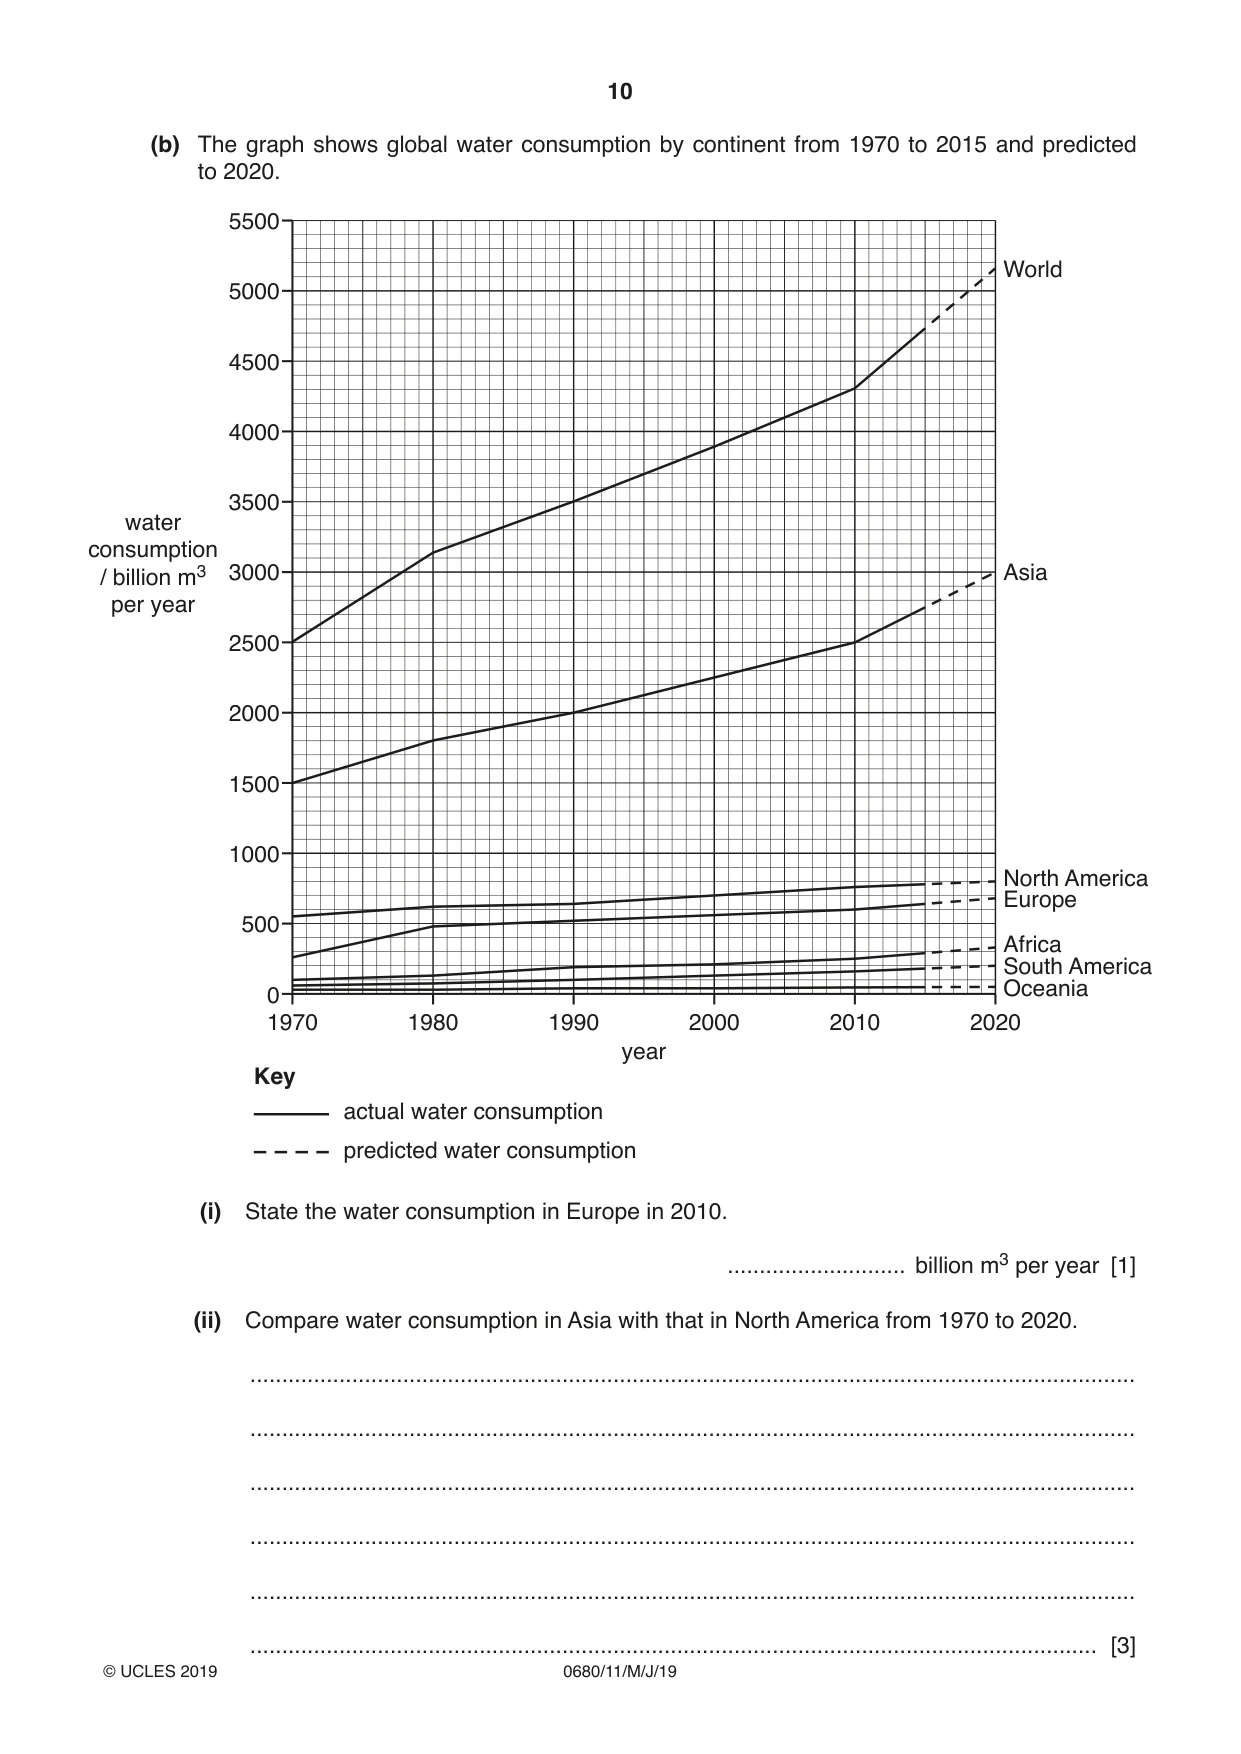
10 0680/11/M/J/19 © UCLES 2019 (b) The graph shows global water consumption by continent from 1970 to 2015 and predicted to 2020. 1970 0 500 1000 1500 2000 2500 3000 3500 4000 4500 5000 5500 1980 1990 2000 2010 2020 water consumption / billion m3 per year year Oceania South America Africa Europe North America Asia World Key actual water consumption predicted water consumption (i) State the water consumption in Europe in 2010. … billion m3 per year [1] (ii) Compare water consumption in Asia with that in North America from 1970 to 2020. … … … … … … [3]
Question paper, page 11
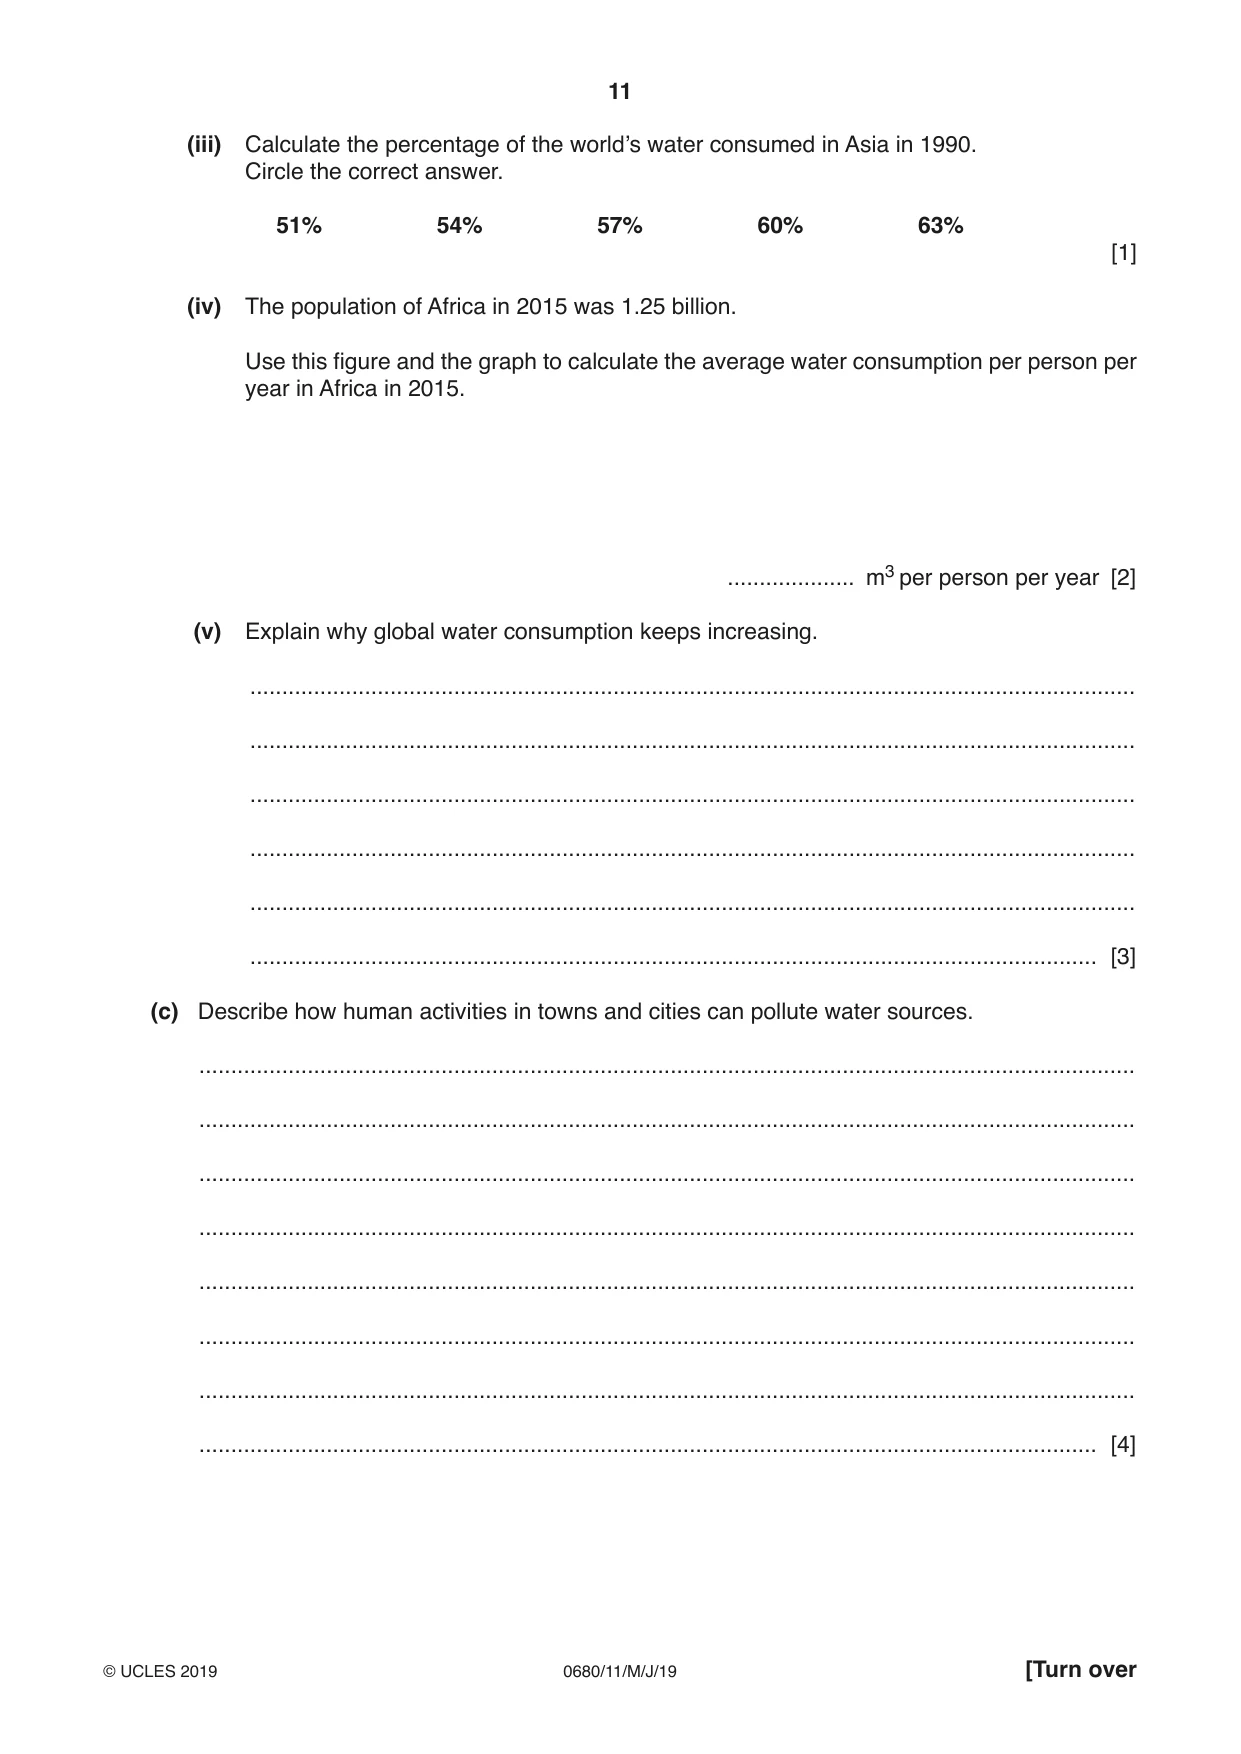
11 0680/11/M/J/19 © UCLES 2019 [Turn over (iii) Calculate the percentage of the world’s water consumed in Asia in 1990. Circle the correct answer. 51% 54% 57% 60% 63% [1] (iv) The population of Africa in 2015 was 1.25 billion. Use this figure and the graph to calculate the average water consumption per person per year in Africa in 2015. … m3 per person per year [2] (v) Explain why global water consumption keeps increasing. … … … … … … [3] (c) Describe how human activities in towns and cities can pollute water sources. … … … … … … … … [4]
Question paper, page 12
12 0680/11/M/J/19 © UCLES 2019 (d) ‘Water pollution is a more serious problem than the enhanced greenhouse effect.’ How far do you agree with this statement? Give reasons for your answer. … … … … … … … … … … … … … … … [6] [Total: 27]
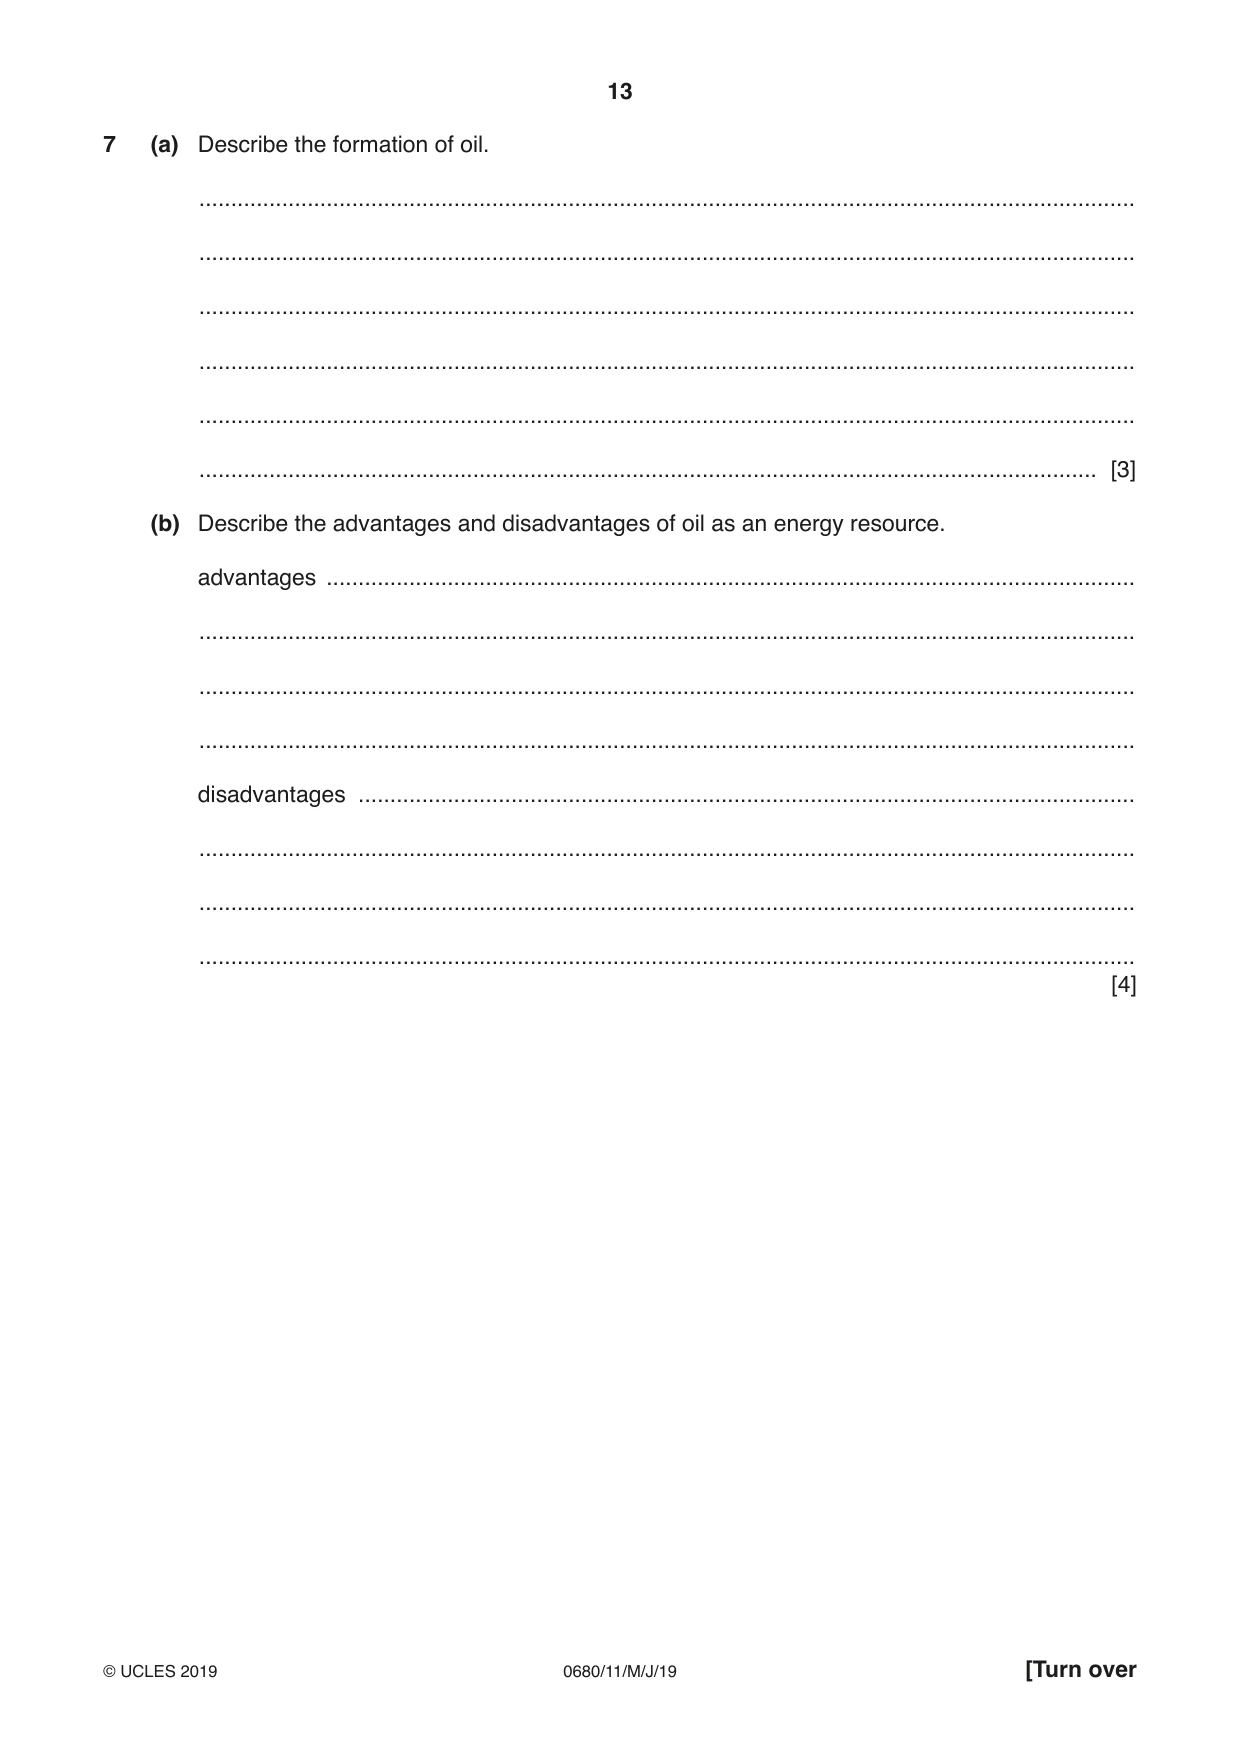
Question paper, page 13
13 0680/11/M/J/19 © UCLES 2019 [Turn over 7 (a) Describe the formation of oil. … … … … … … [3] (b) Describe the advantages and disadvantages of oil as an energy resource. advantages … … … … disadvantages … … … … [4]
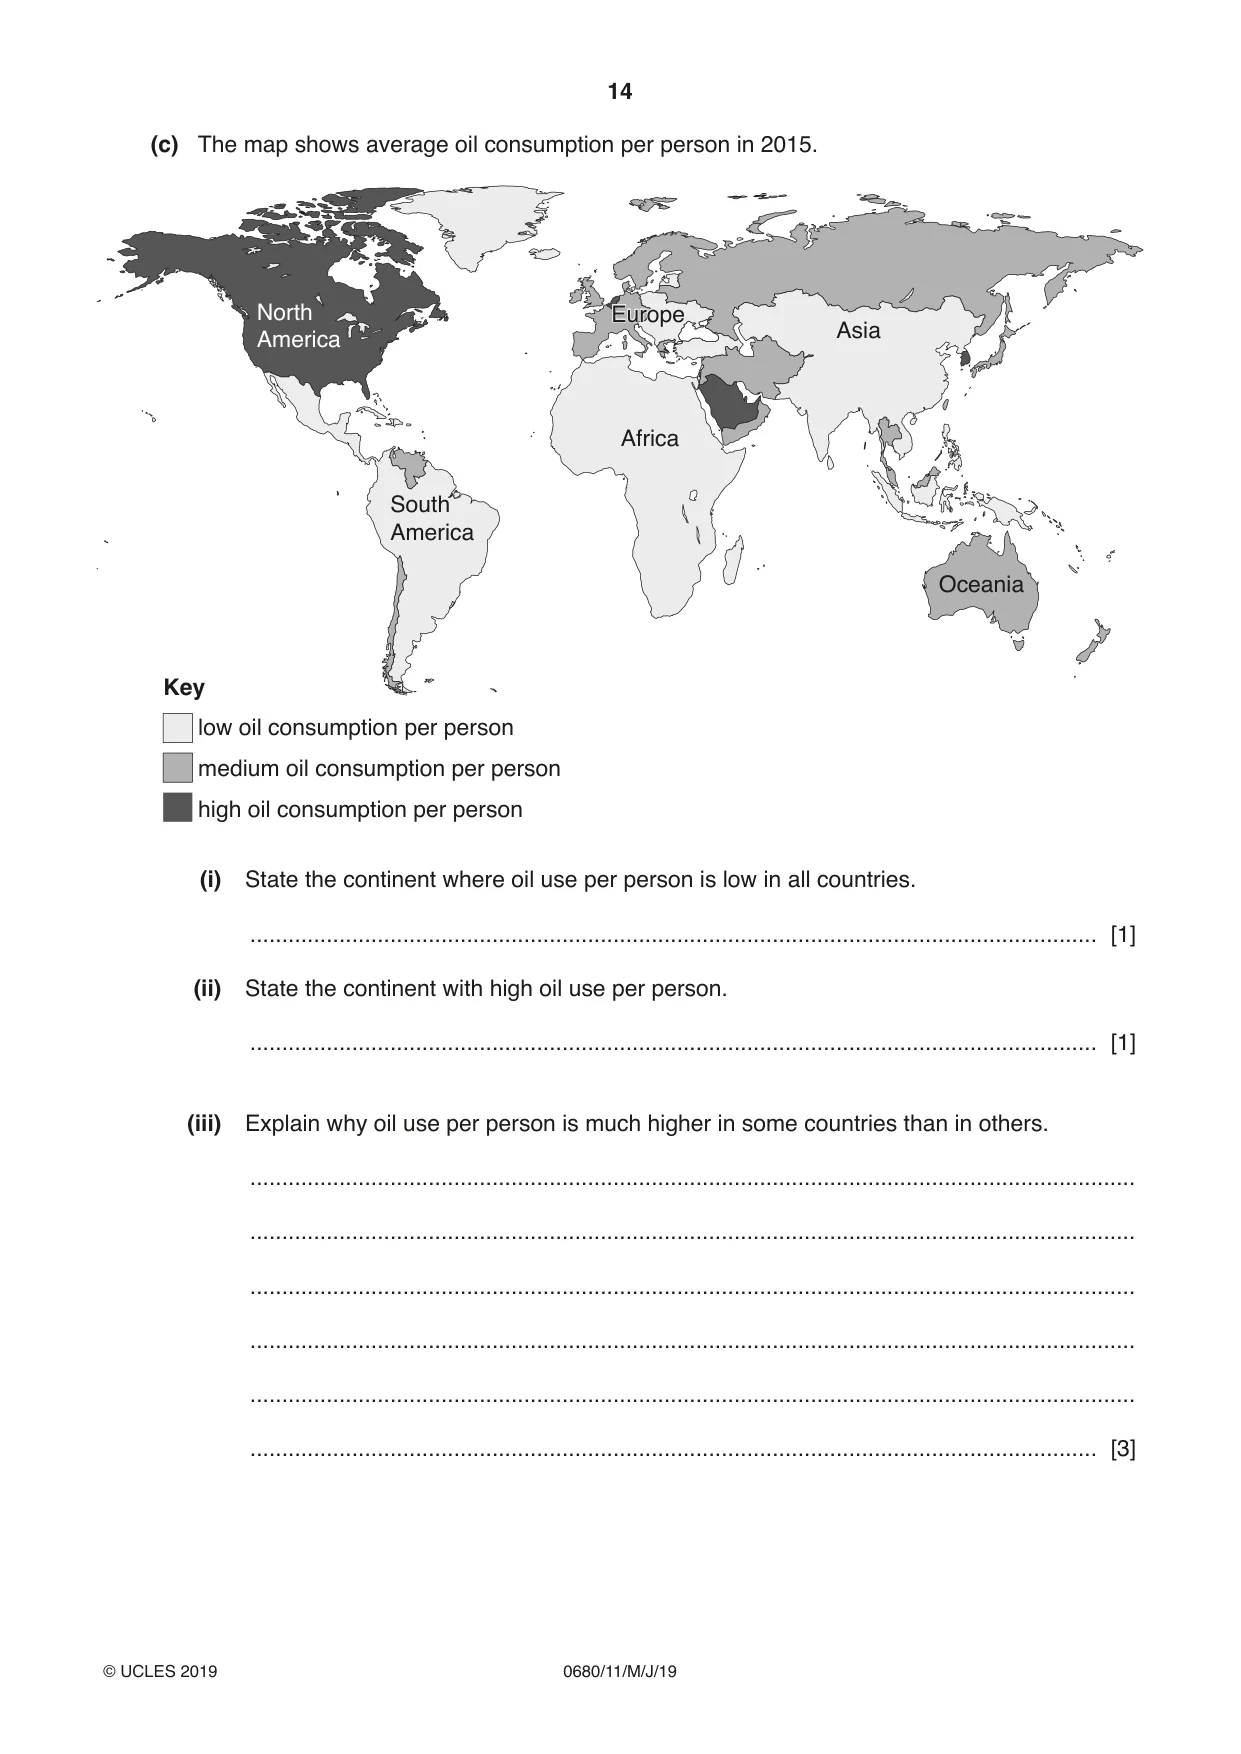
Question paper, page 14
14 0680/11/M/J/19 © UCLES 2019 (c) The map shows average oil consumption per person in 2015. Key low oil consumption per person medium oil consumption per person high oil consumption per person North America South America Africa Asia Oceania Europe Europe (i) State the continent where oil use per person is low in all countries. … [1] (ii) State the continent with high oil use per person. … [1] (iii) Explain why oil use per person is much higher in some countries than in others. … … … … … … [3]
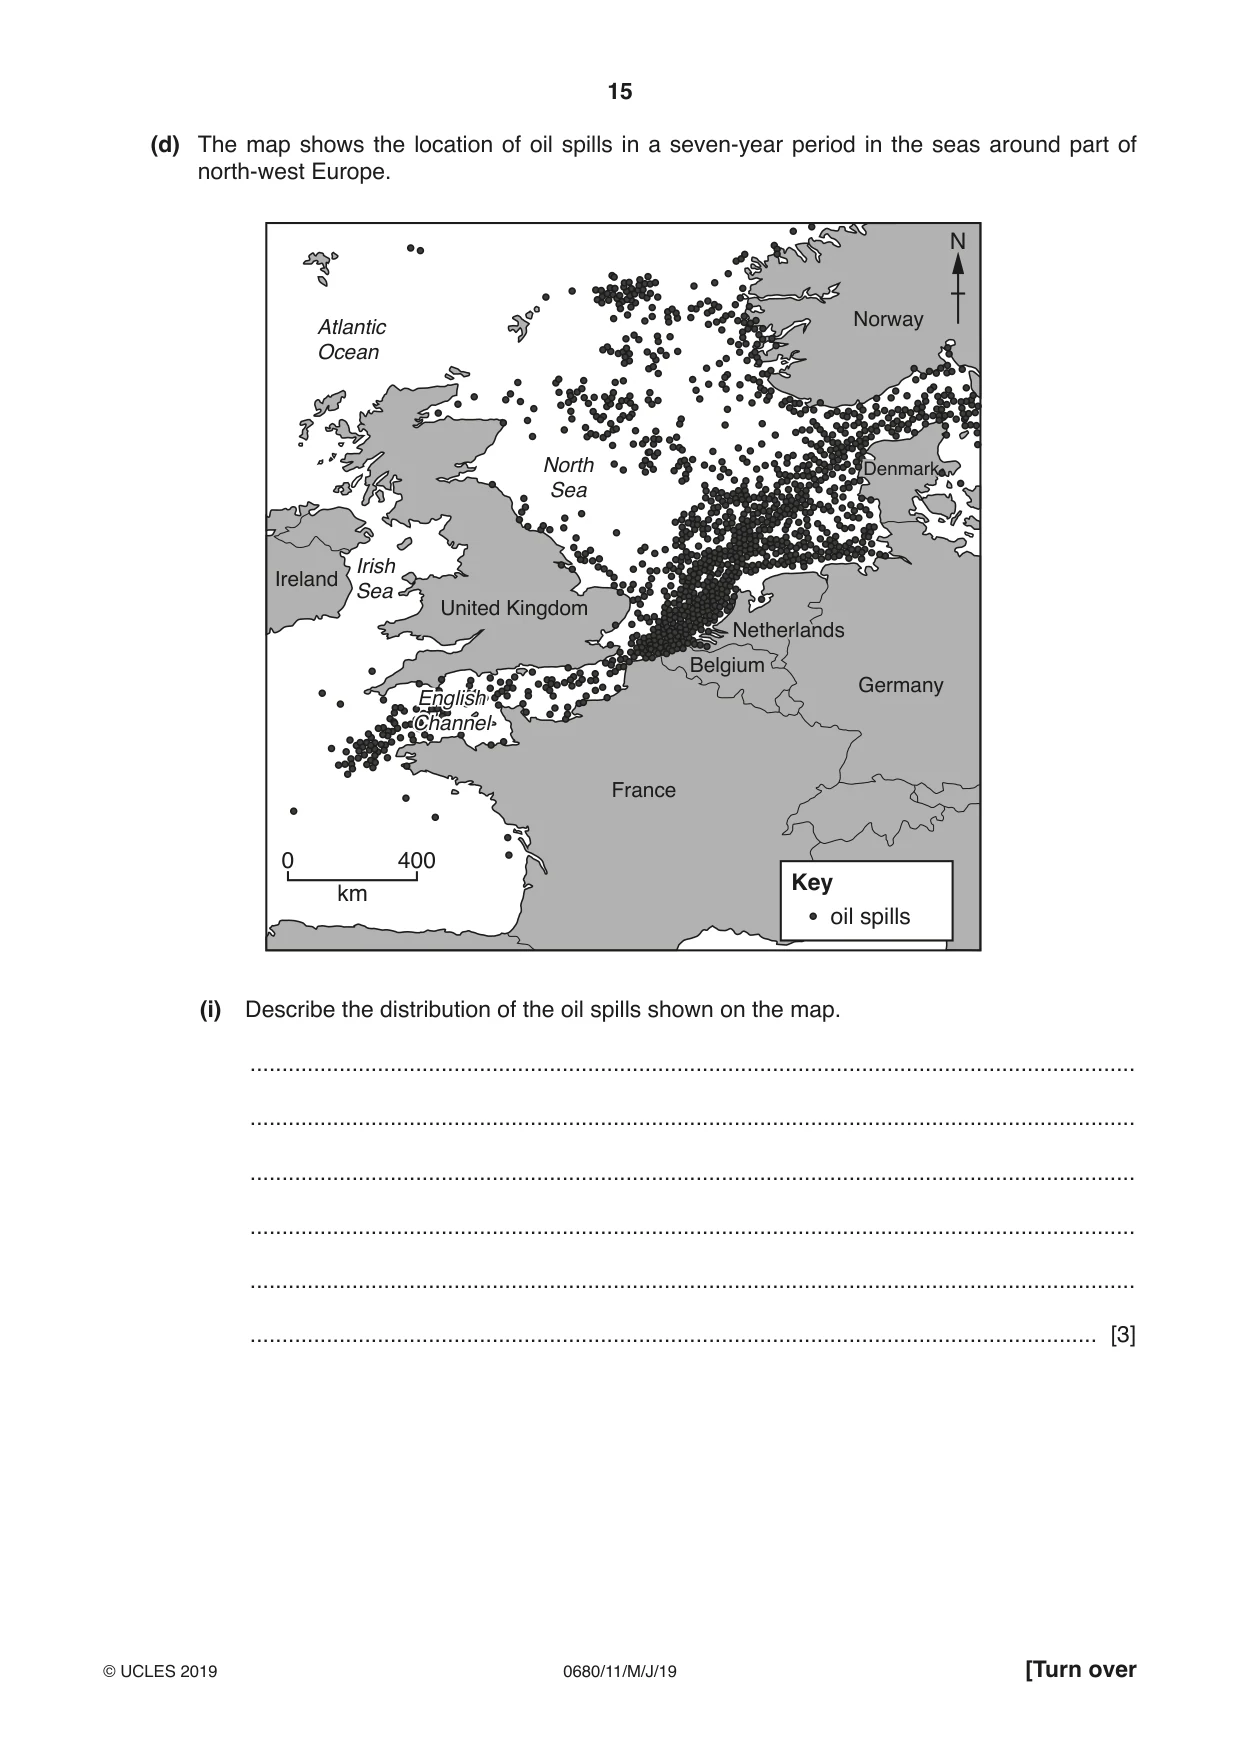
Question paper, page 15
15 0680/11/M/J/19 © UCLES 2019 [Turn over (d) The map shows the location of oil spills in a seven-year period in the seas around part of north-west Europe. Atlantic Ocean Ireland United Kingdom France Belgium Netherlands Netherlands Irish Sea North Sea English Channel English Channel Germany Denmark Denmark Norway 0 km 400 Key oil spills N (i) Describe the distribution of the oil spills shown on the map. … … … … … … [3]
Question paper, page 16
16 0680/11/M/J/19 © UCLES 2019 Permission to reproduce items where third-party owned material protected by copyright is included has been sought and cleared where possible. Every reasonable effort has been made by the publisher (UCLES) to trace copyright holders, but if any items requiring clearance have unwittingly been included, the publisher will be pleased to make amends at the earliest possible opportunity. To avoid the issue of disclosure of answer-related information to candidates, all copyright acknowledgements are reproduced online in the Cambridge Assessment International Education Copyright Acknowledgements Booklet. This is produced for each series of examinations and is freely available to download at www.cambridgeinternational.org after the live examination series. Cambridge Assessment International Education is part of the Cambridge Assessment Group. Cambridge Assessment is the brand name of the University of Cambridge Local Examinations Syndicate (UCLES), which itself is a department of the University of Cambridge. (ii) Discuss strategies for minimising the impact of oil spills at sea. … … … … … … [3] [Total: 18]
Mark scheme, page 1
This document consists of 13 printed pages. © UCLES 2019 [Turn over Cambridge Assessment International Education Cambridge International General Certificate of Secondary Education ENVIRONMENTAL MANAGEMENT 0680/11 Paper 1 Theory May/June 2019 MARK SCHEME Maximum Mark: 80 Published This mark scheme is published as an aid to teachers and candidates, to indicate the requirements of the examination. It shows the basis on which Examiners were instructed to award marks. It does not indicate the details of the discussions that took place at an Examiners’ meeting before marking began, which would have considered the acceptability of alternative answers. Mark schemes should be read in conjunction with the question paper and the Principal Examiner Report for Teachers. Cambridge International will not enter into discussions about these mark schemes. Cambridge International is publishing the mark schemes for the May/June 2019 series for most Cambridge IGCSE™, Cambridge International A and AS Level and Cambridge Pre-U components, and some Cambridge O Level components.
Mark scheme, page 2
0680/11 Cambridge IGCSE – Mark Scheme PUBLISHED May/June 2019 © UCLES 2019 Page 2 of 13 Generic Marking Principles These general marking principles must be applied by all examiners when marking candidate answers. They should be applied alongside the specific content of the mark scheme or generic level descriptors for a question. Each question paper and mark scheme will also comply with these marking principles. GENERIC MARKING PRINCIPLE 1: Marks must be awarded in line with: • the specific content of the mark scheme or the generic level descriptors for the question • the specific skills defined in the mark scheme or in the generic level descriptors for the question • the standard of response required by a candidate as exemplified by the standardisation scripts. GENERIC MARKING PRINCIPLE 2: Marks awarded are always whole marks (not half marks, or other fractions). GENERIC MARKING PRINCIPLE 3: Marks must be awarded positively: • marks are awarded for correct/valid answers, as defined in the mark scheme. However, credit is given for valid answers which go beyond the scope of the syllabus and mark scheme, referring to your Team Leader as appropriate • marks are awarded when candidates clearly demonstrate what they know and can do • marks are not deducted for errors • marks are not deducted for omissions • answers should only be judged on the quality of spelling, punctuation and grammar when these features are specifically assessed by the question as indicated by the mark scheme. The meaning, however, should be unambiguous. GENERIC MARKING PRINCIPLE 4: Rules must be applied consistently e.g. in situations where candidates have not followed instructions or in the application of generic level descriptors.
Mark scheme, page 3
0680/11 Cambridge IGCSE – Mark Scheme PUBLISHED May/June 2019 © UCLES 2019 Page 3 of 13 GENERIC MARKING PRINCIPLE 5: Marks should be awarded using the full range of marks defined in the mark scheme for the question (however; the use of the full mark range may be limited according to the quality of the candidate responses seen). GENERIC MARKING PRINCIPLE 6: Marks awarded are based solely on the requirements as defined in the mark scheme. Marks should not be awarded with grade thresholds or grade descriptors in mind.
Mark scheme, page 4
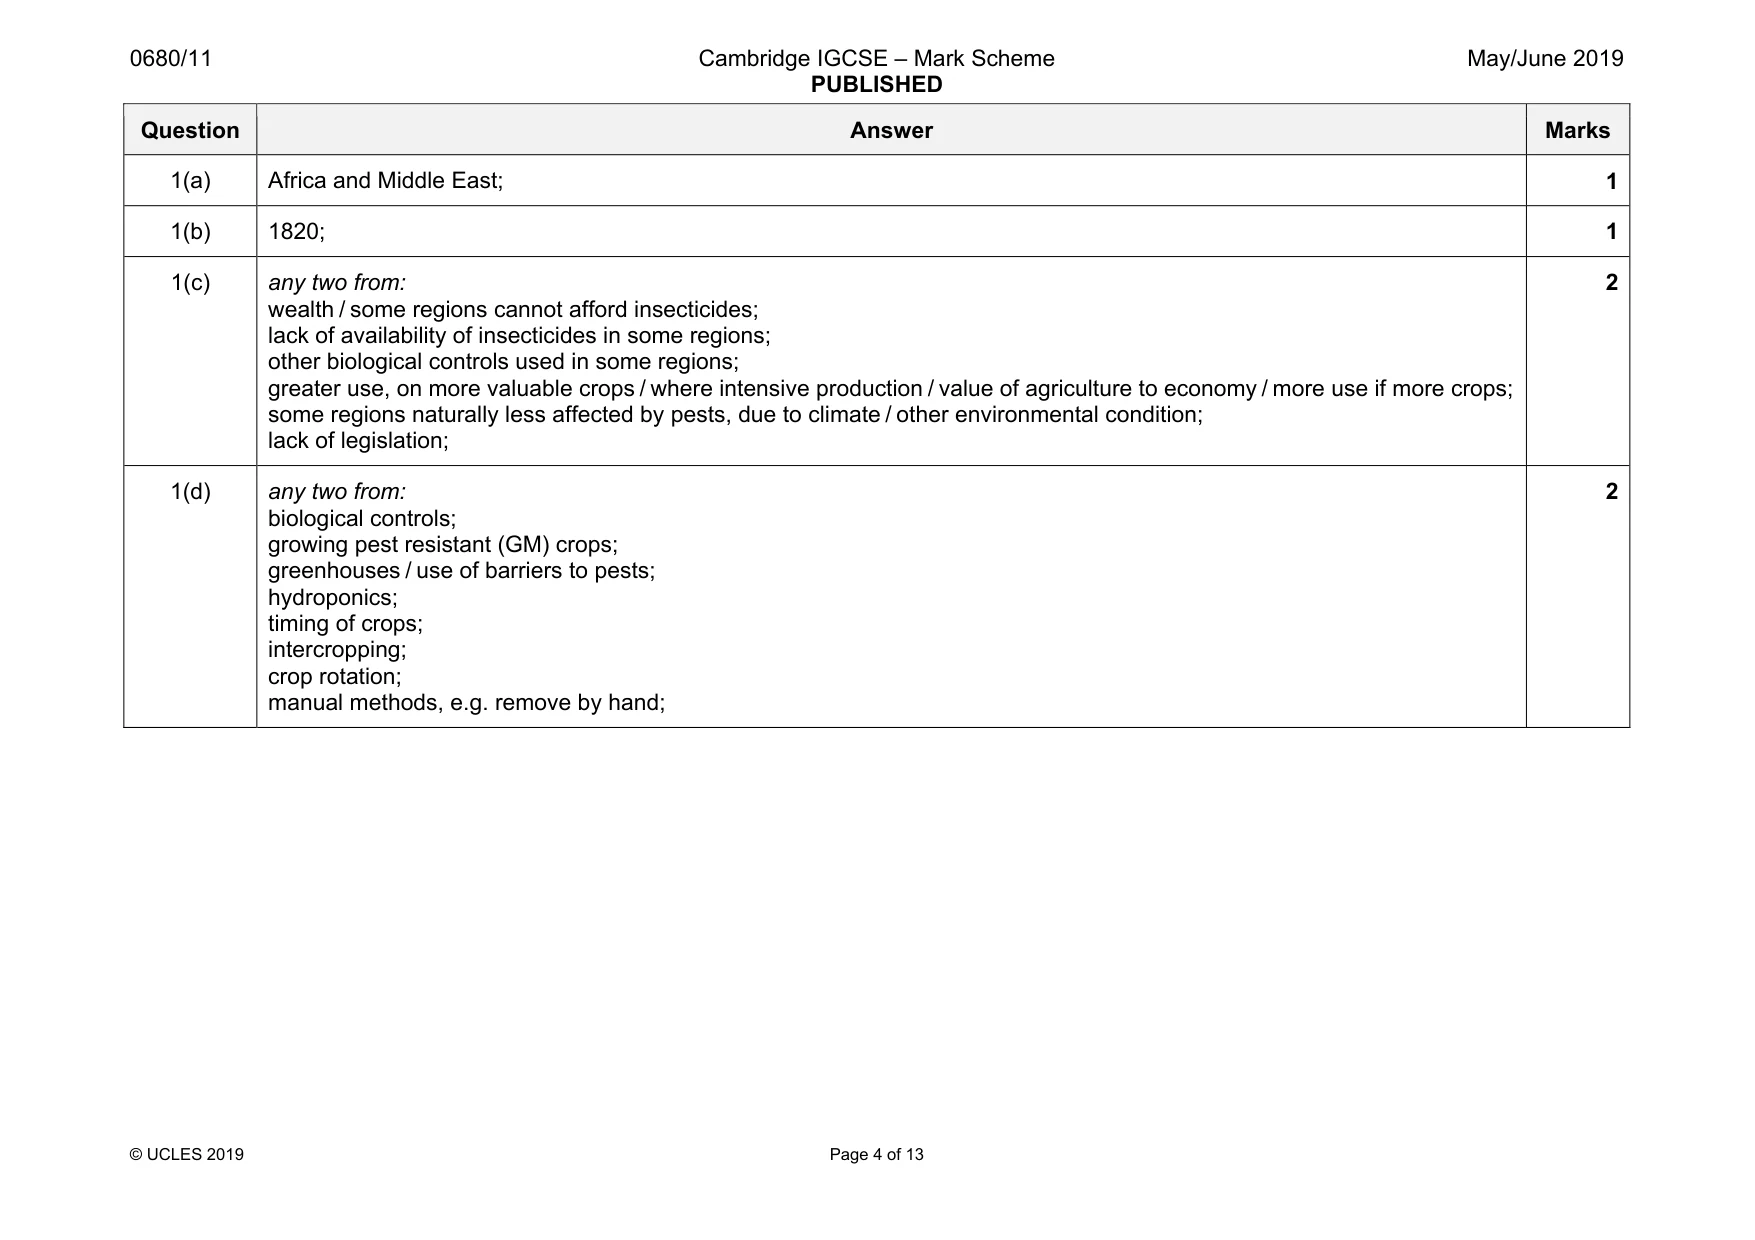
0680/11 Cambridge IGCSE – Mark Scheme PUBLISHED May/June 2019 © UCLES 2019 Page 4 of 13 Question Answer Marks 1(a) Africa and Middle East; 1 1(b) 1820; 1 1(c) any two from: wealth / some regions cannot afford insecticides; lack of availability of insecticides in some regions; other biological controls used in some regions; greater use, on more valuable crops / where intensive production / value of agriculture to economy / more use if more crops; some regions naturally less affected by pests, due to climate / other environmental condition; lack of legislation; 2 1(d) any two from: biological controls; growing pest resistant (GM) crops; greenhouses / use of barriers to pests; hydroponics; timing of crops; intercropping; crop rotation; manual methods, e.g. remove by hand; 2
Mark scheme, page 5
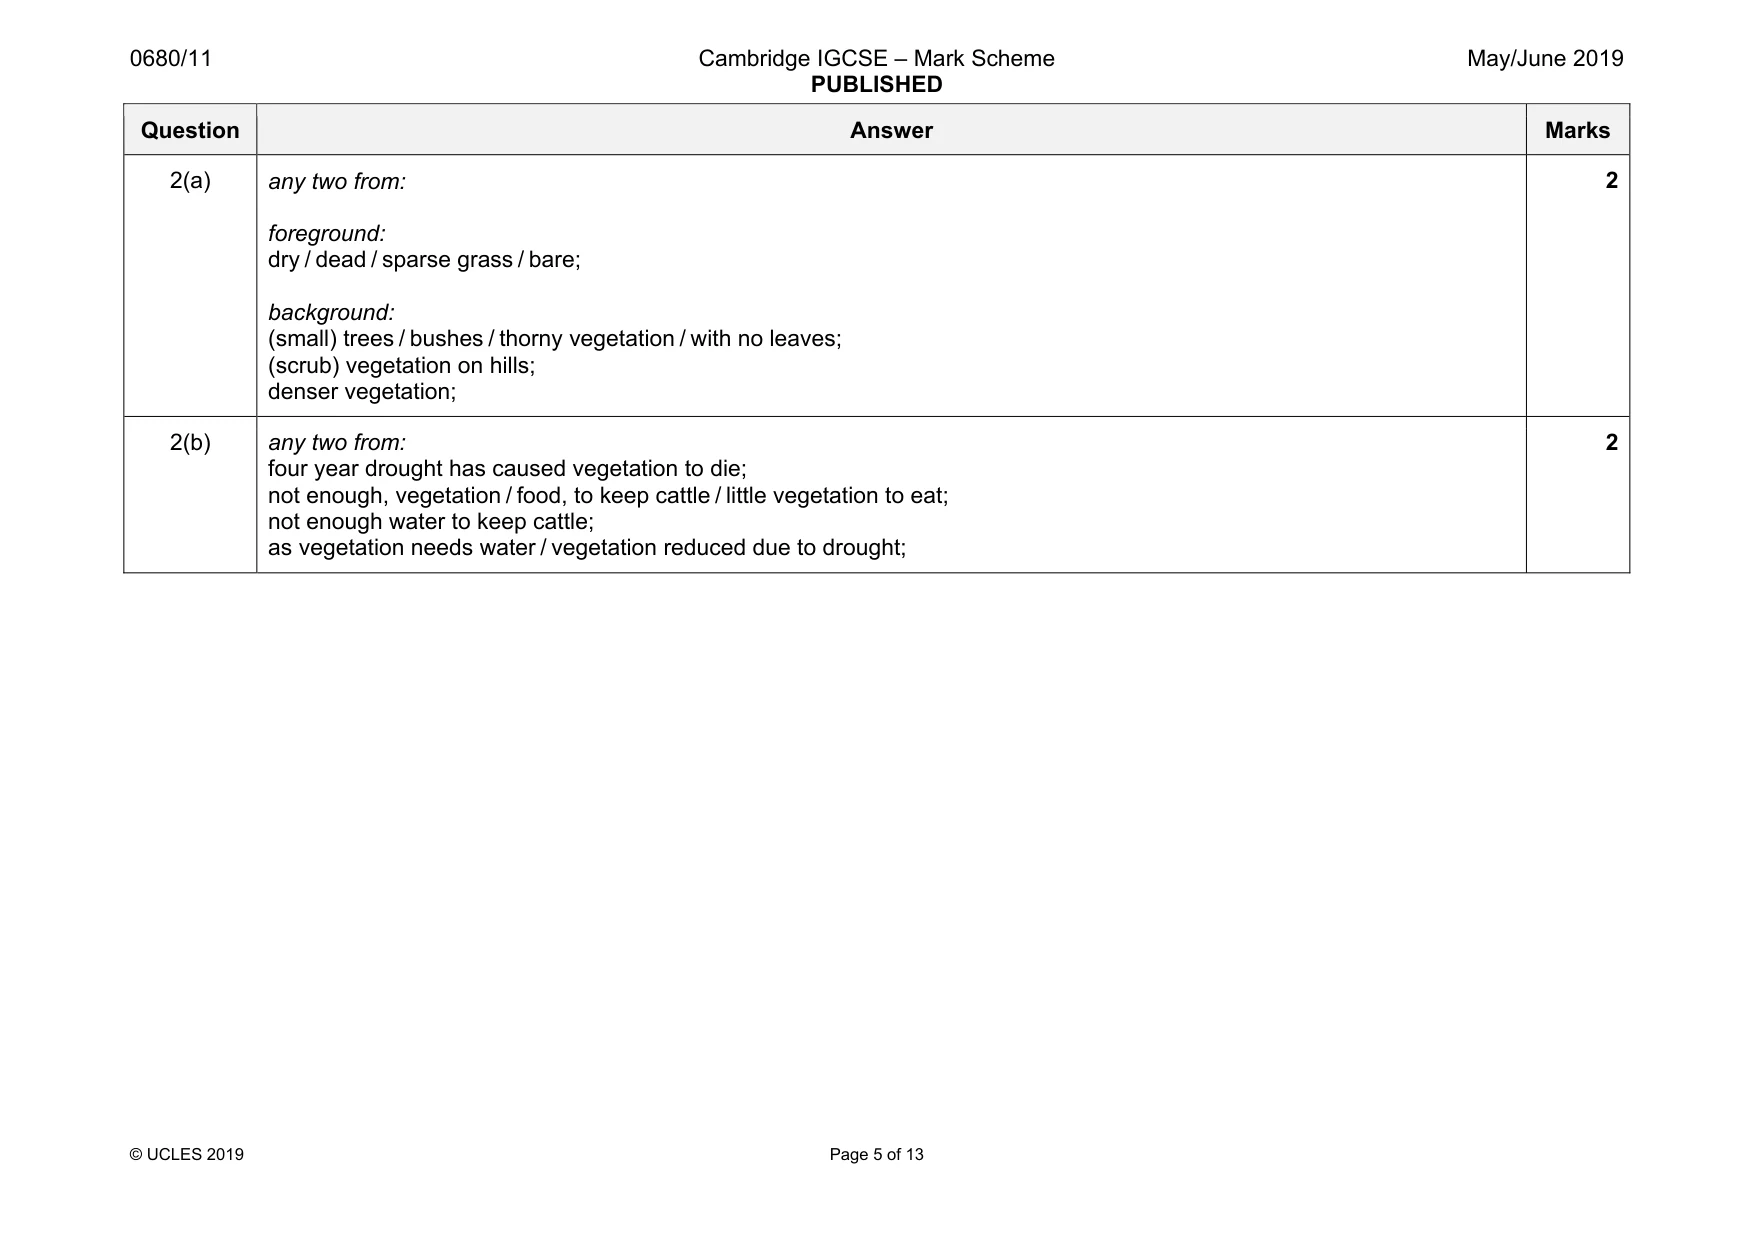
0680/11 Cambridge IGCSE – Mark Scheme PUBLISHED May/June 2019 © UCLES 2019 Page 5 of 13 Question Answer Marks 2(a) any two from: foreground: dry / dead / sparse grass / bare; background: (small) trees / bushes / thorny vegetation / with no leaves; (scrub) vegetation on hills; denser vegetation; 2 2(b) any two from: four year drought has caused vegetation to die; not enough, vegetation / food, to keep cattle / little vegetation to eat; not enough water to keep cattle; as vegetation needs water / vegetation reduced due to drought; 2
Mark scheme, page 6
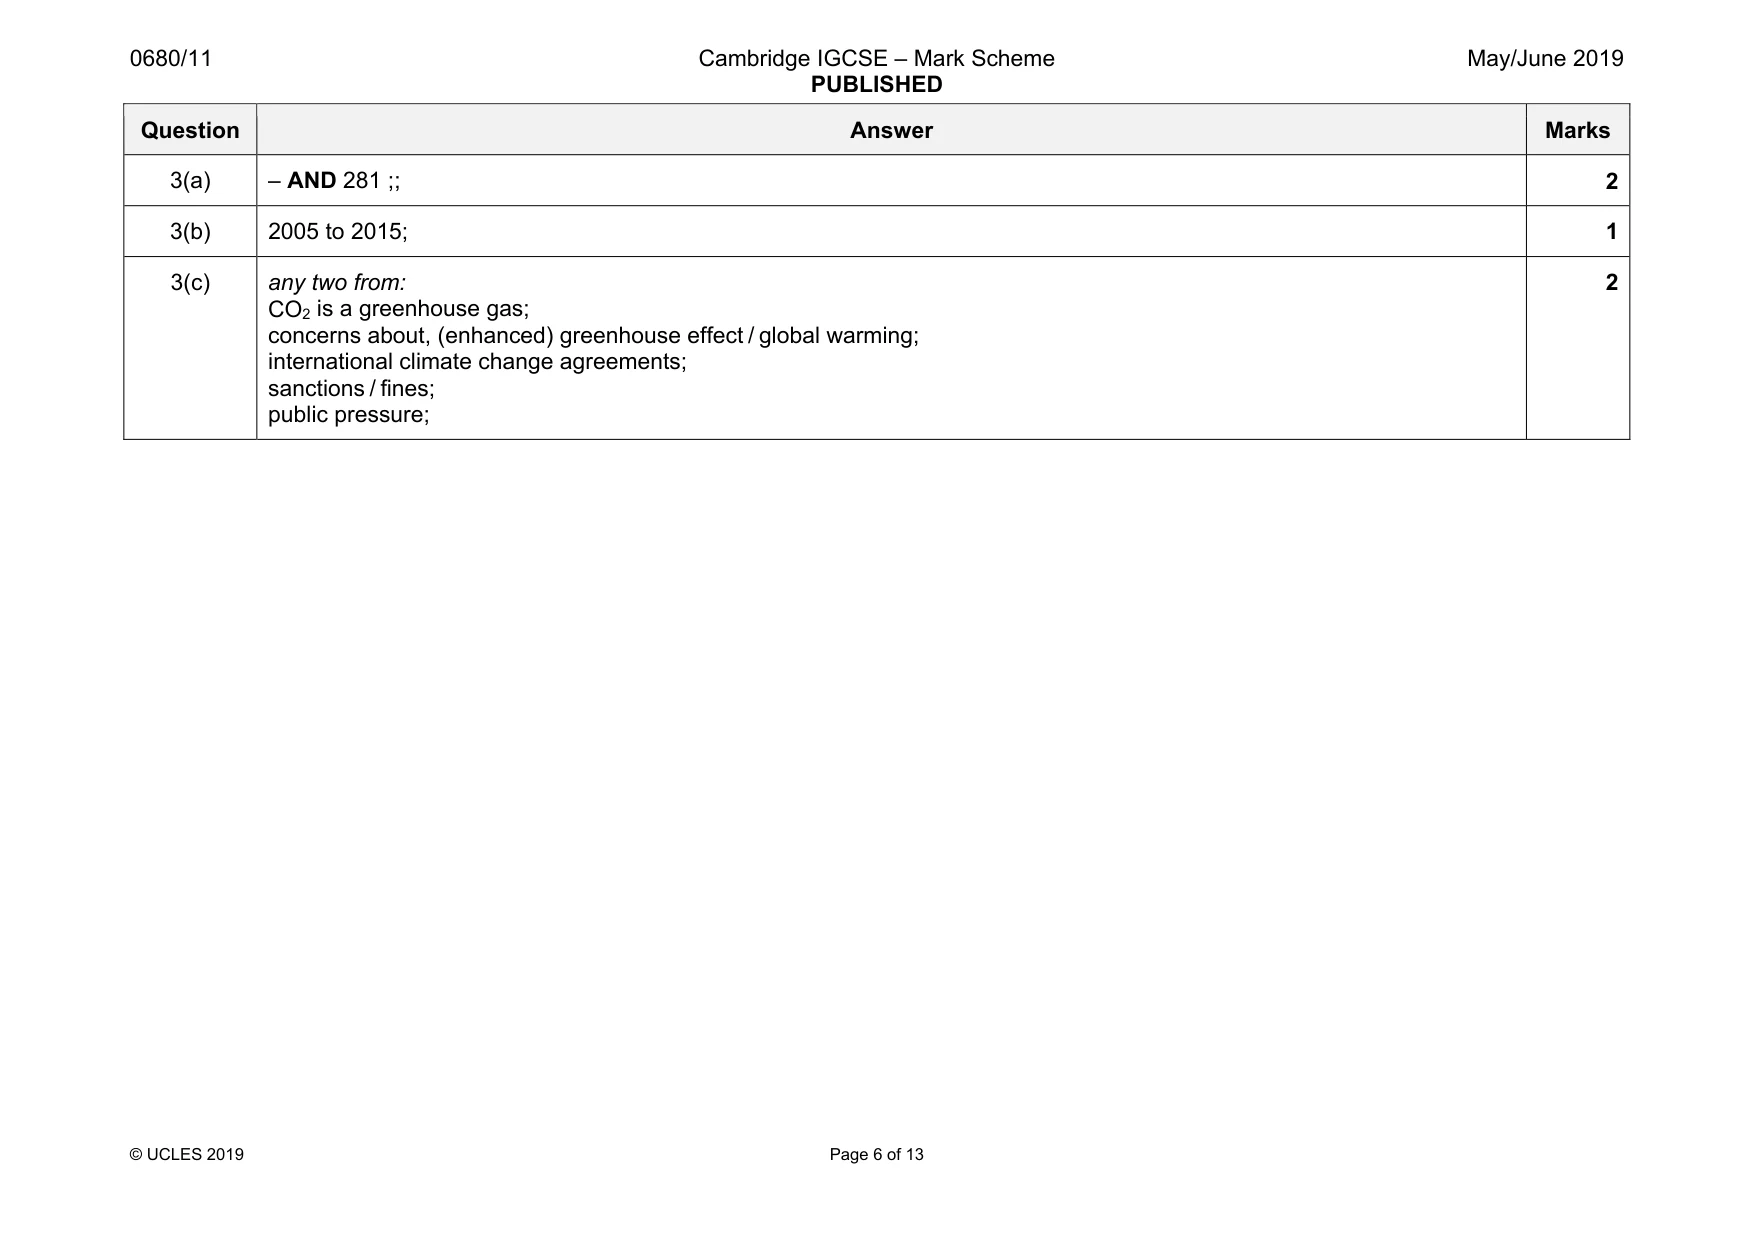
0680/11 Cambridge IGCSE – Mark Scheme PUBLISHED May/June 2019 © UCLES 2019 Page 6 of 13 Question Answer Marks 3(a) – AND 281 ;; 2 3(b) 2005 to 2015; 1 3(c) any two from: CO2 is a greenhouse gas; concerns about, (enhanced) greenhouse effect / global warming; international climate change agreements; sanctions / fines; public pressure; 2
Mark scheme, page 7
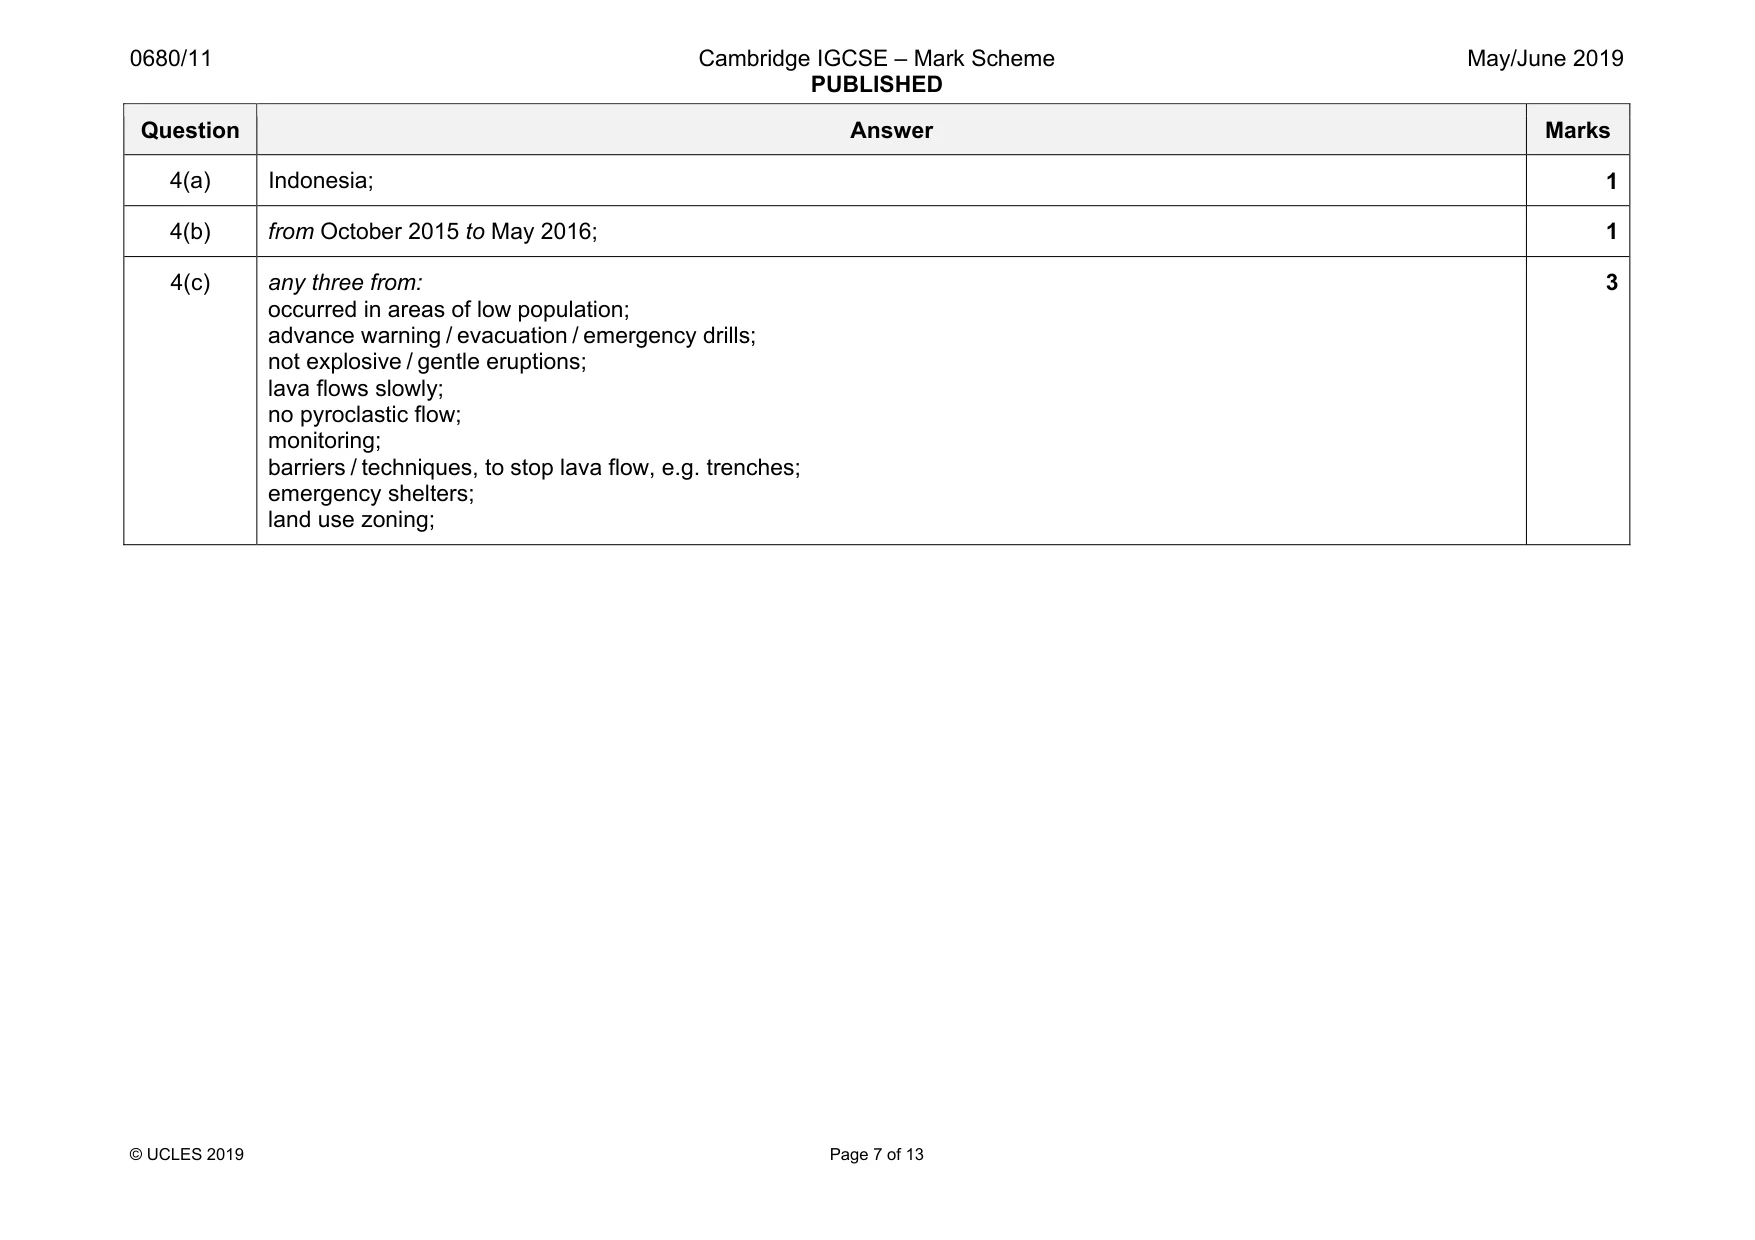
0680/11 Cambridge IGCSE – Mark Scheme PUBLISHED May/June 2019 © UCLES 2019 Page 7 of 13 Question Answer Marks 4(a) Indonesia; 1 4(b) from October 2015 to May 2016; 1 4(c) any three from: occurred in areas of low population; advance warning / evacuation / emergency drills; not explosive / gentle eruptions; lava flows slowly; no pyroclastic flow; monitoring; barriers / techniques, to stop lava flow, e.g. trenches; emergency shelters; land use zoning; 3
Mark scheme, page 8
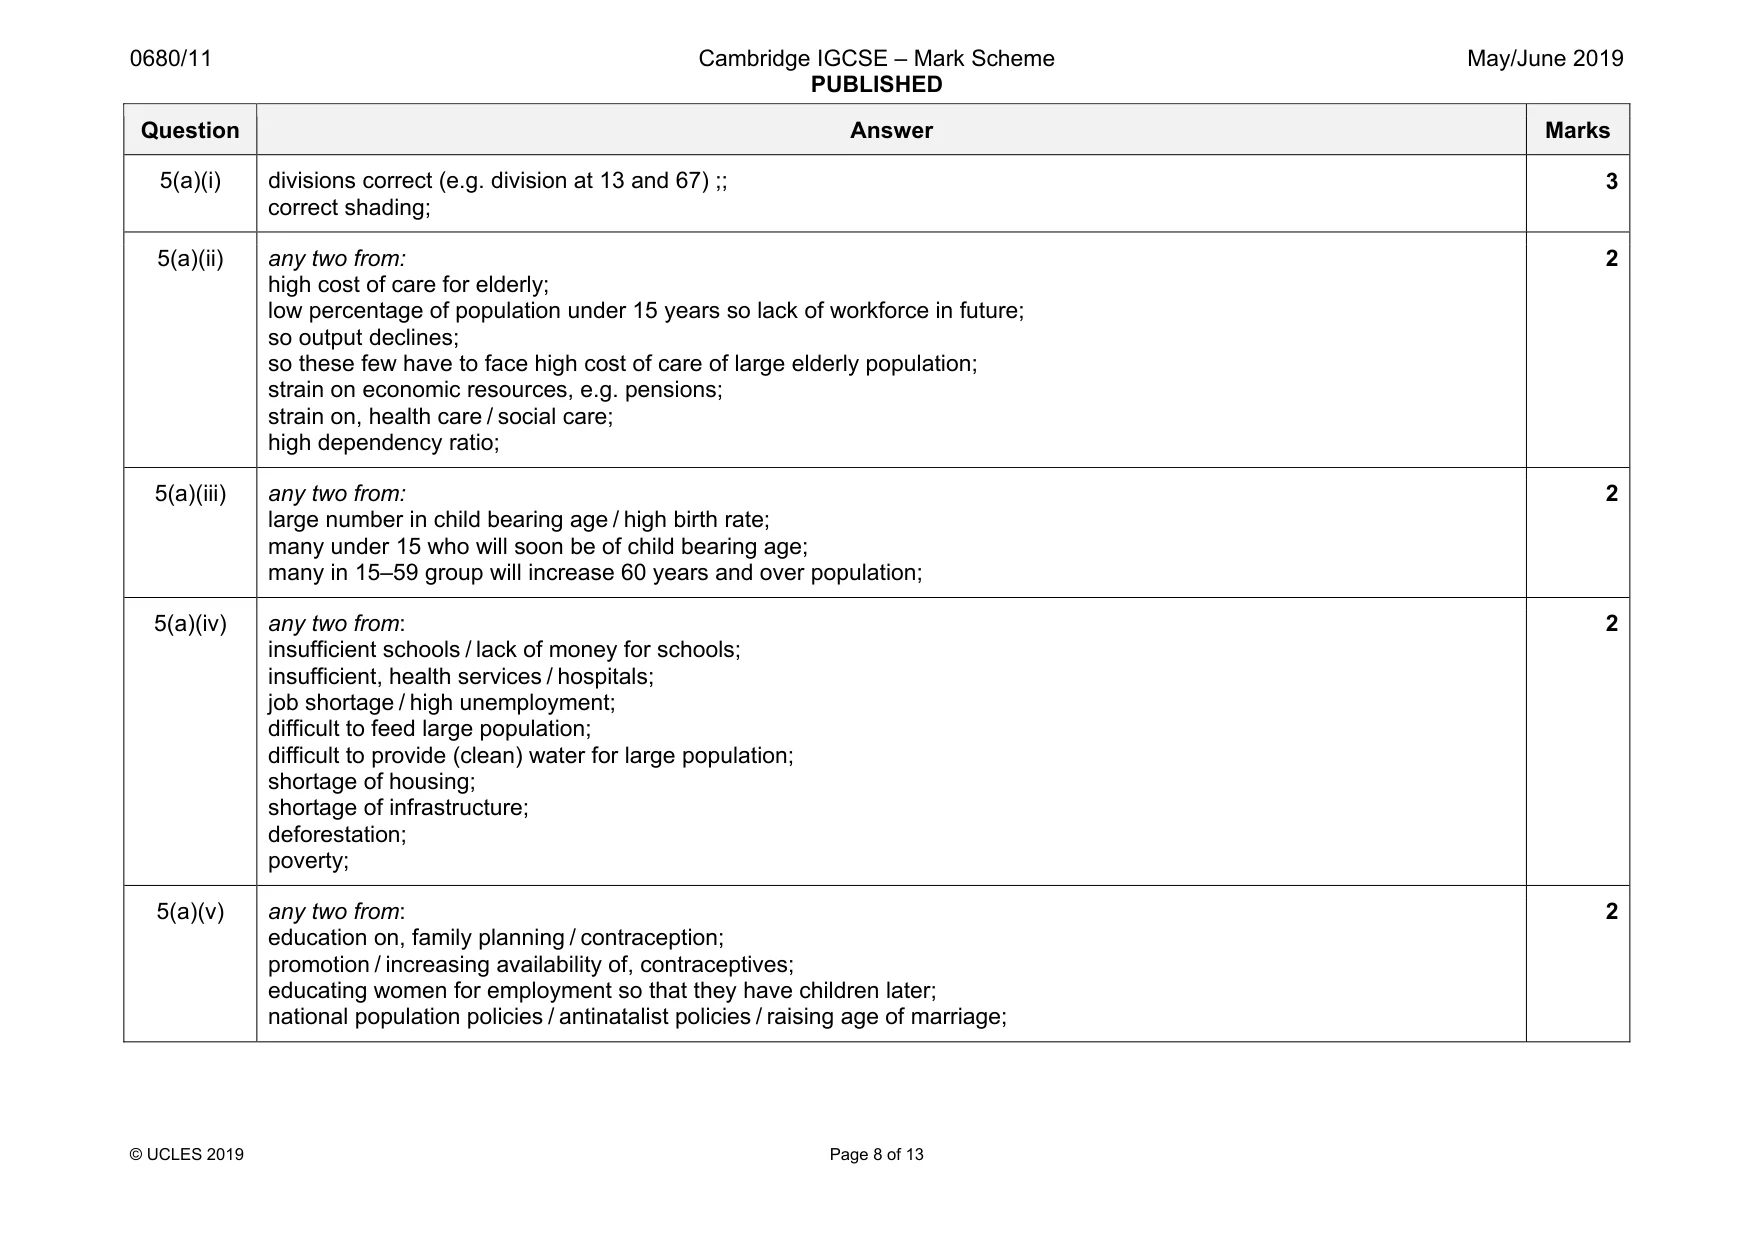
0680/11 Cambridge IGCSE – Mark Scheme PUBLISHED May/June 2019 © UCLES 2019 Page 8 of 13 Question Answer Marks 5(a)(i) divisions correct (e.g. division at 13 and 67) ;; correct shading; 3 5(a)(ii) any two from: high cost of care for elderly; low percentage of population under 15 years so lack of workforce in future; so output declines; so these few have to face high cost of care of large elderly population; strain on economic resources, e.g. pensions; strain on, health care / social care; high dependency ratio; 2 5(a)(iii) any two from: large number in child bearing age / high birth rate; many under 15 who will soon be of child bearing age; many in 15–59 group will increase 60 years and over population; 2 5(a)(iv) any two from: insufficient schools / lack of money for schools; insufficient, health services / hospitals; job shortage / high unemployment; difficult to feed large population; difficult to provide (clean) water for large population; shortage of housing; shortage of infrastructure; deforestation; poverty; 2 5(a)(v) any two from: education on, family planning / contraception; promotion / increasing availability of, contraceptives; educating women for employment so that they have children later; national population policies / antinatalist policies / raising age of marriage; 2
Mark scheme, page 9
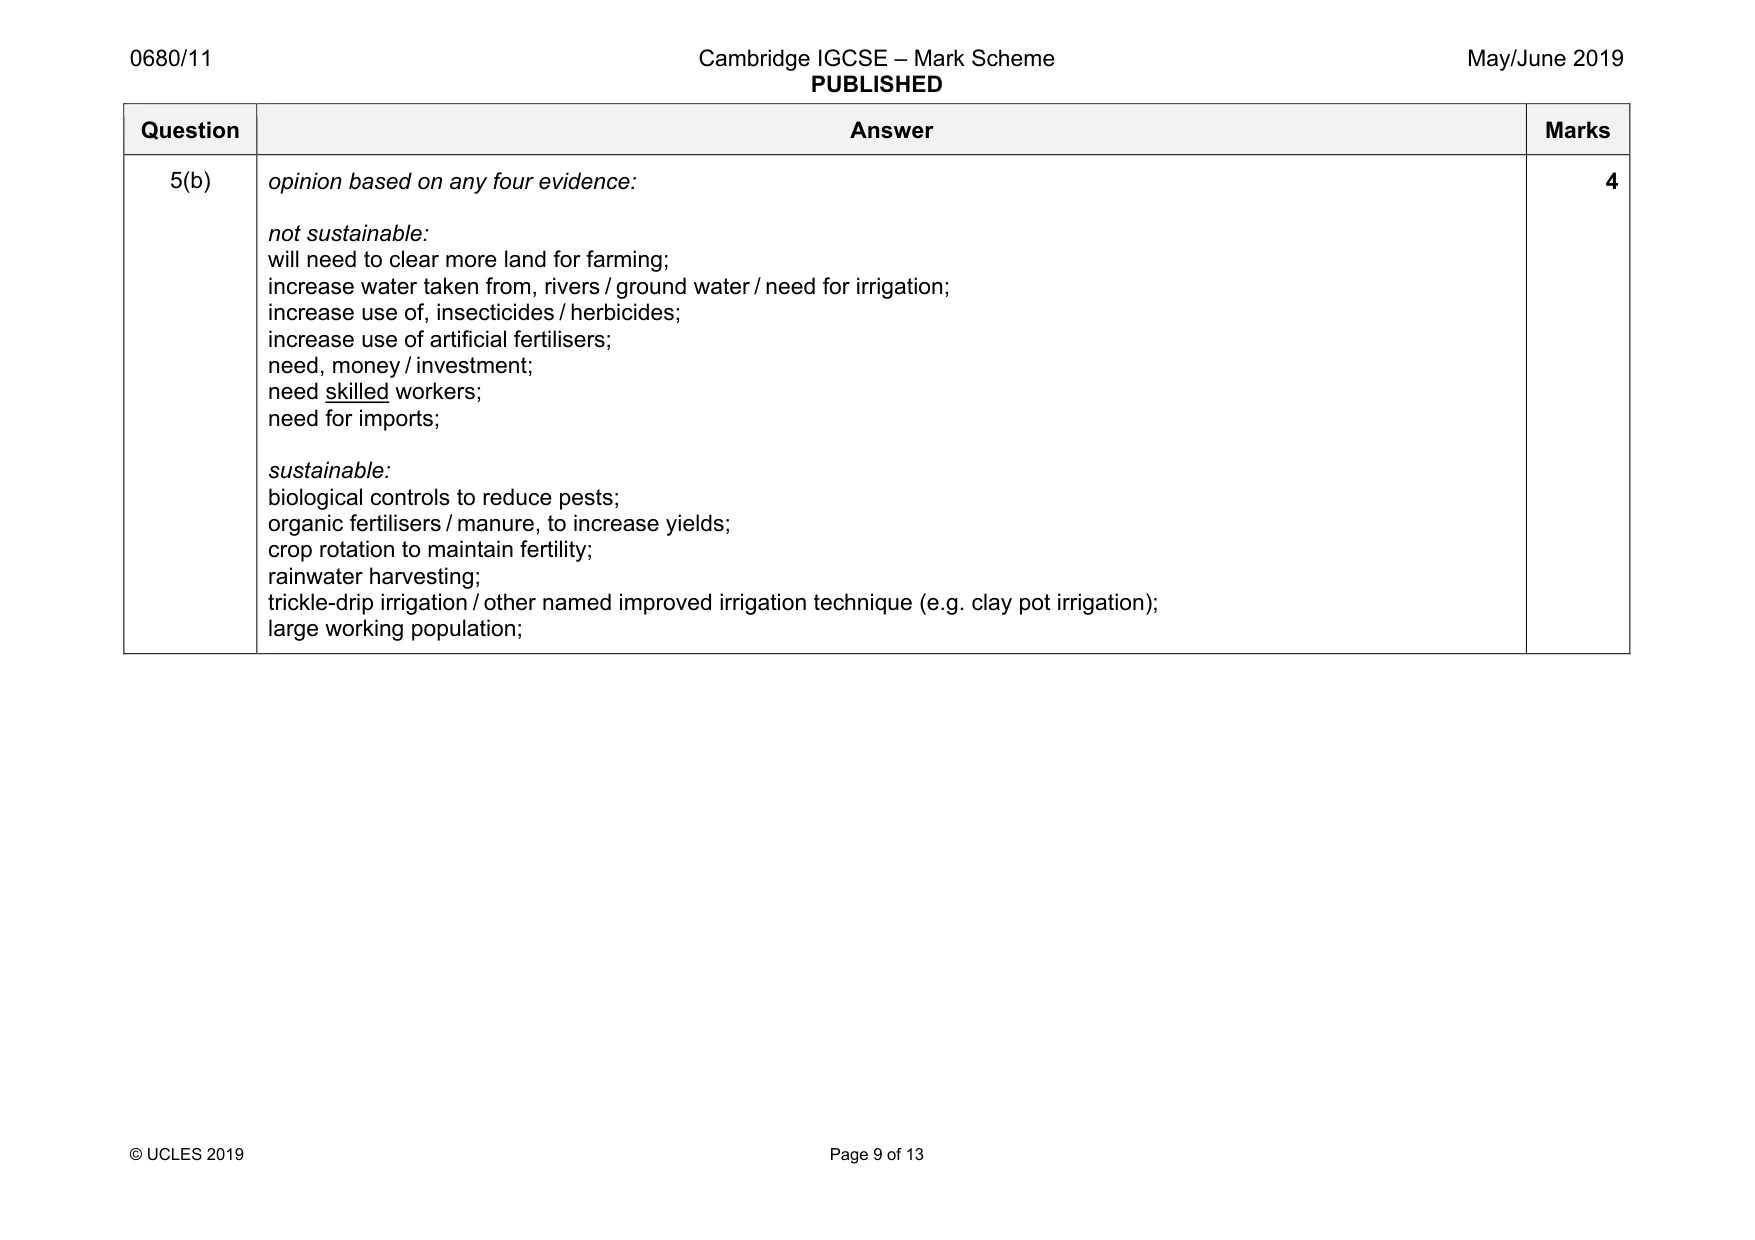
0680/11 Cambridge IGCSE – Mark Scheme PUBLISHED May/June 2019 © UCLES 2019 Page 9 of 13 Question Answer Marks 5(b) opinion based on any four evidence: not sustainable: will need to clear more land for farming; increase water taken from, rivers / ground water / need for irrigation; increase use of, insecticides / herbicides; increase use of artificial fertilisers; need, money / investment; need skilled workers; need for imports; sustainable: biological controls to reduce pests; organic fertilisers / manure, to increase yields; crop rotation to maintain fertility; rainwater harvesting; trickle-drip irrigation / other named improved irrigation technique (e.g. clay pot irrigation); large working population; 4
Mark scheme, page 10
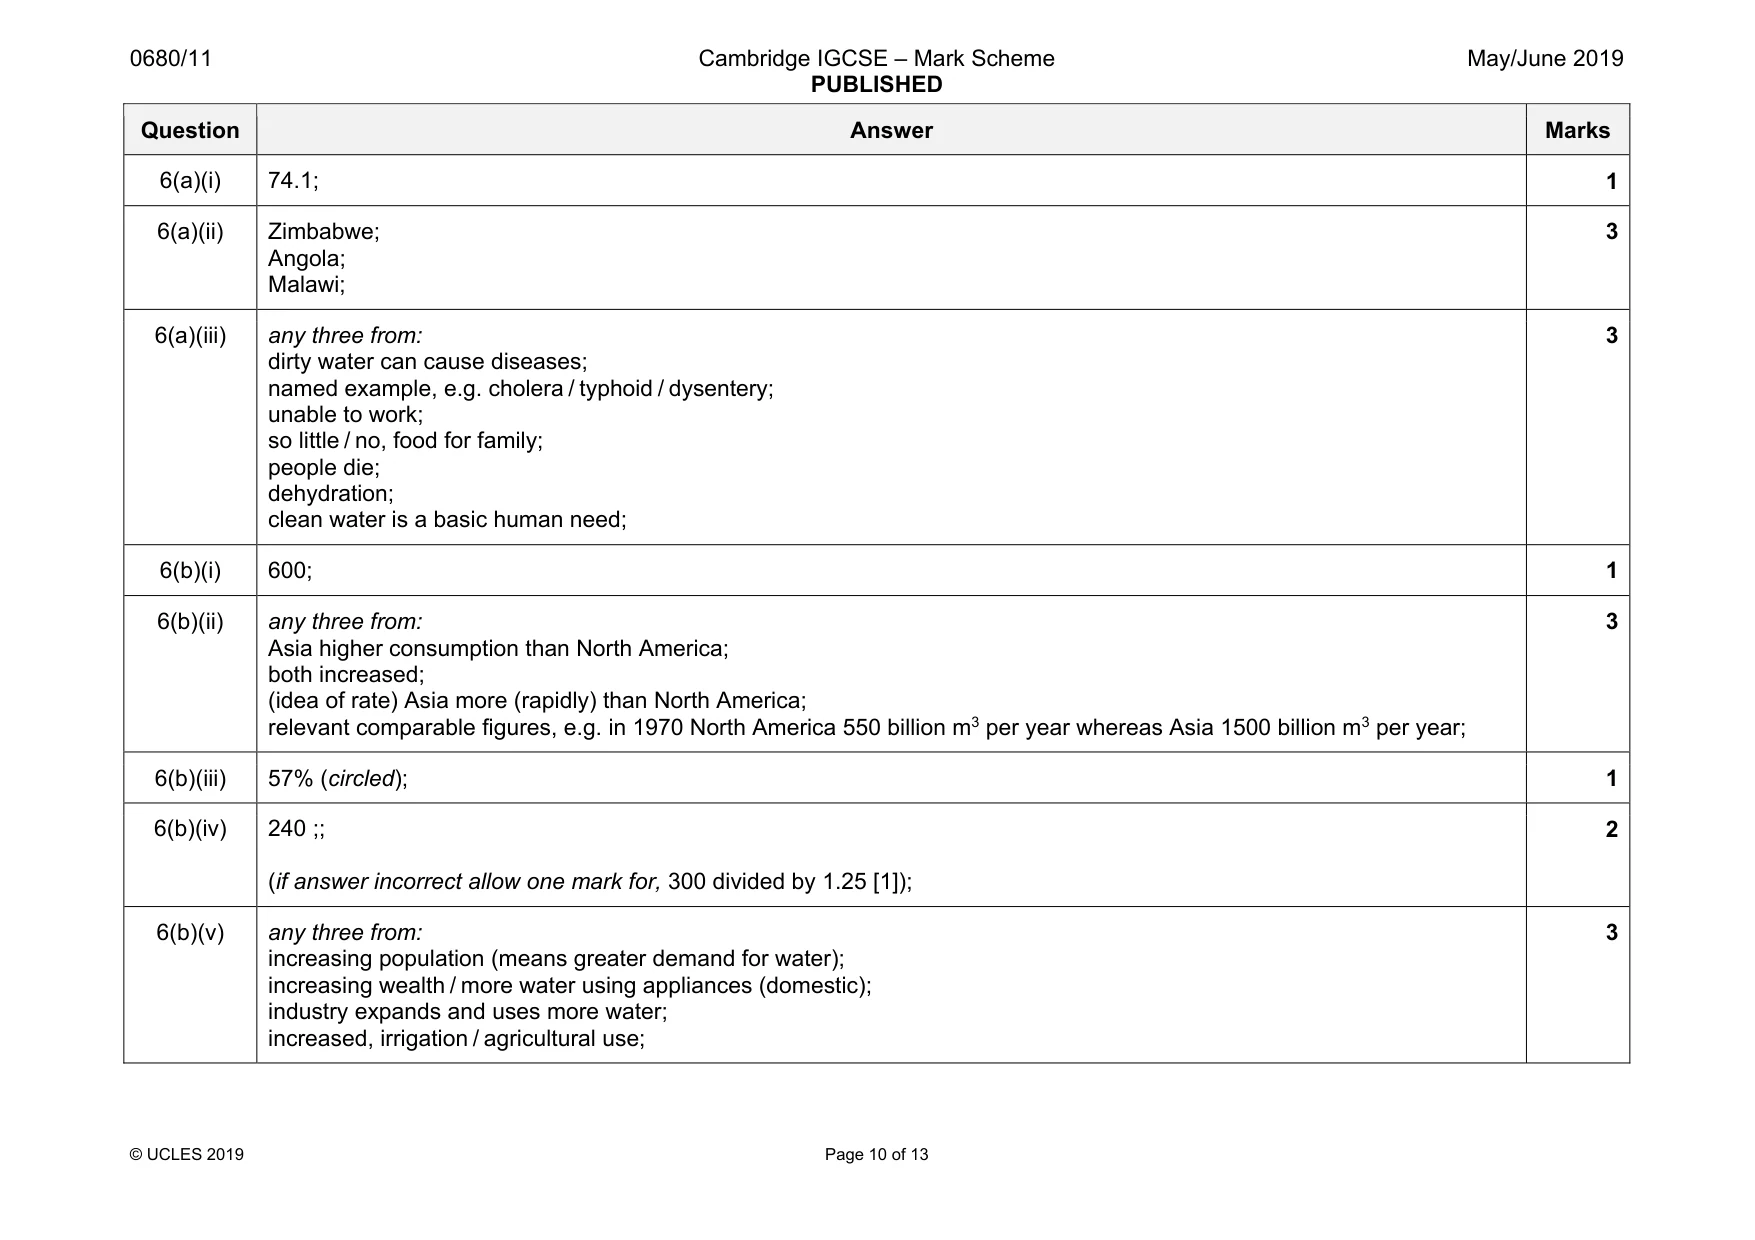
0680/11 Cambridge IGCSE – Mark Scheme PUBLISHED May/June 2019 © UCLES 2019 Page 10 of 13 Question Answer Marks 6(a)(i) 74.1; 1 6(a)(ii) Zimbabwe; Angola; Malawi; 3 6(a)(iii) any three from: dirty water can cause diseases; named example, e.g. cholera / typhoid / dysentery; unable to work; so little / no, food for family; people die; dehydration; clean water is a basic human need; 3 6(b)(i) 600; 1 6(b)(ii) any three from: Asia higher consumption than North America; both increased; (idea of rate) Asia more (rapidly) than North America; relevant comparable figures, e.g. in 1970 North America 550 billion m3 per year whereas Asia 1500 billion m3 per year; 3 6(b)(iii) 57% (circled); 1 6(b)(iv) 240 ;; (if answer incorrect allow one mark for, 300 divided by 1.25 [1]); 2 6(b)(v) any three from: increasing population (means greater demand for water); increasing wealth / more water using appliances (domestic); industry expands and uses more water; increased, irrigation / agricultural use; 3
Mark scheme, page 11
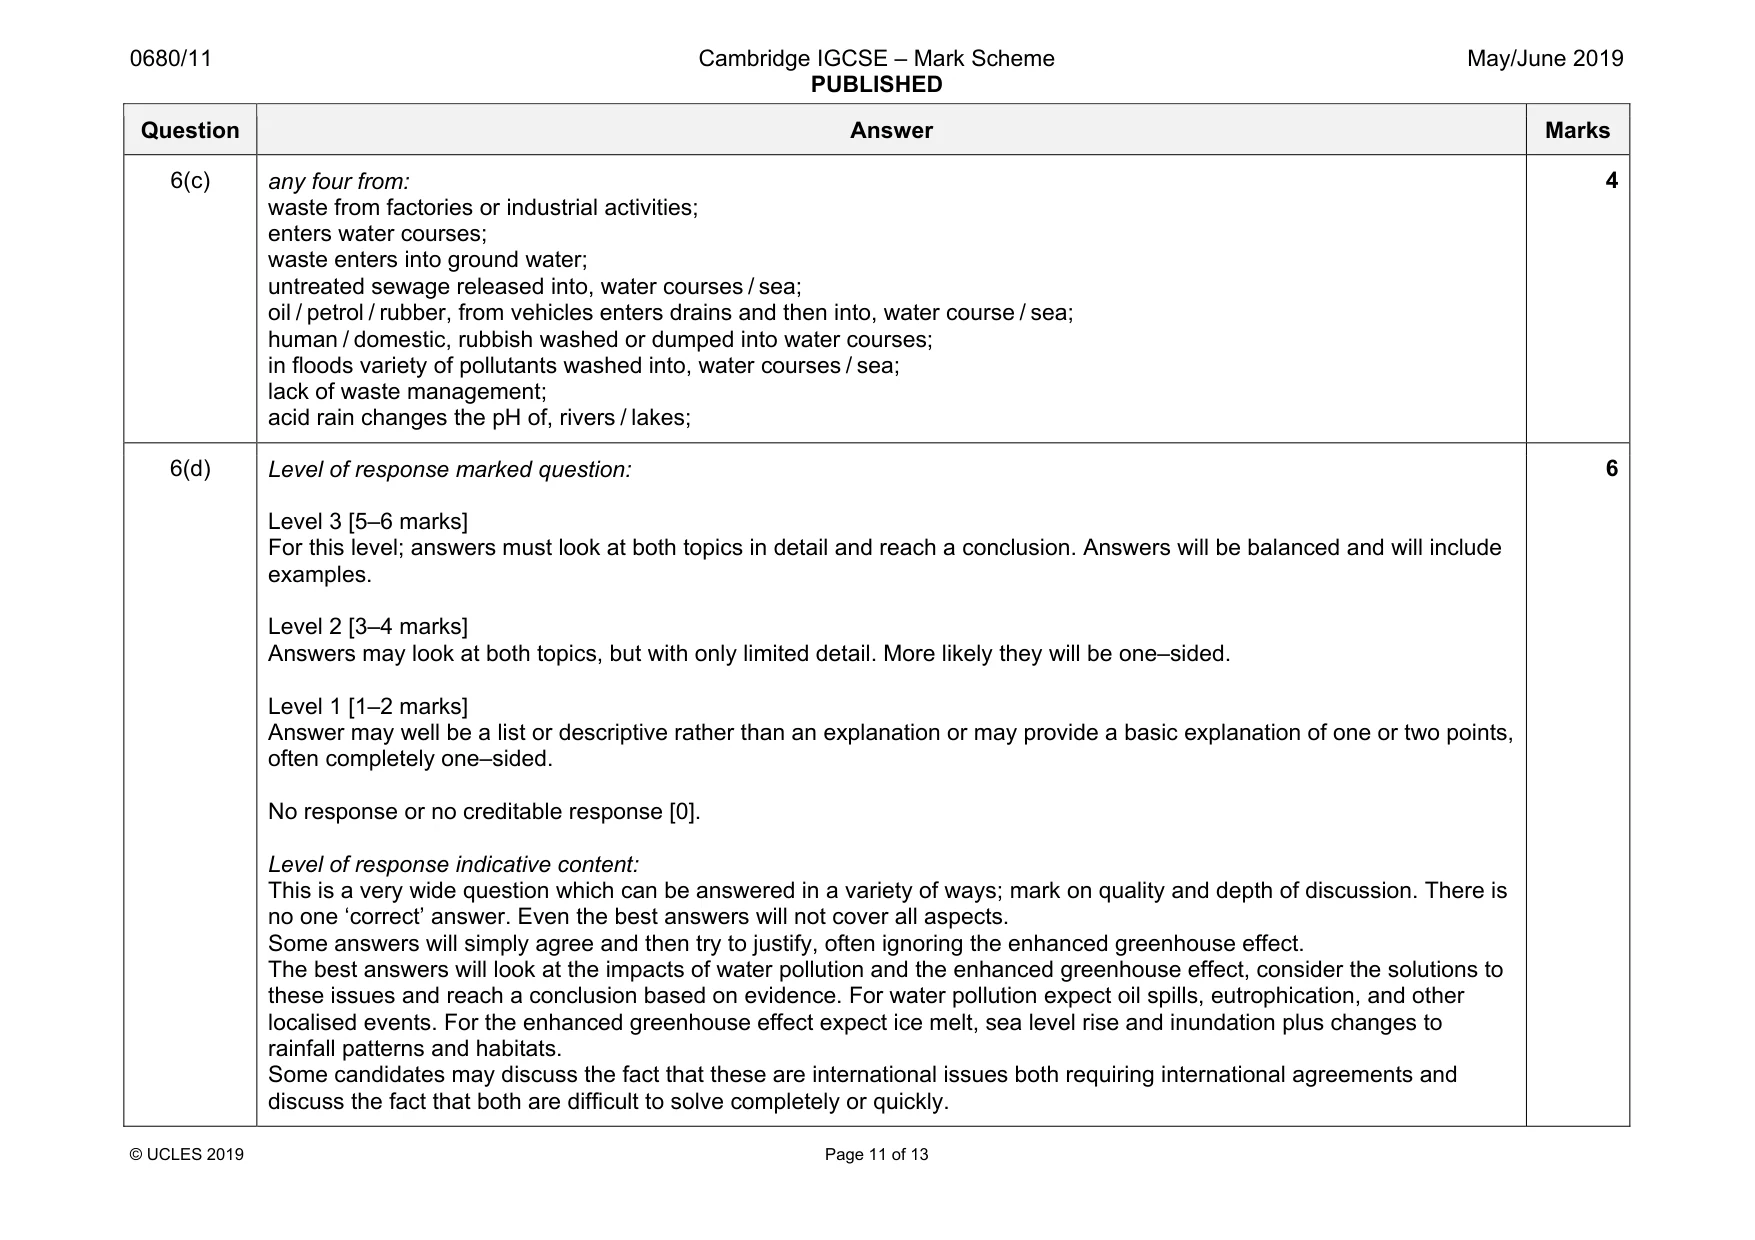
0680/11 Cambridge IGCSE – Mark Scheme PUBLISHED May/June 2019 © UCLES 2019 Page 11 of 13 Question Answer Marks 6(c) any four from: waste from factories or industrial activities; enters water courses; waste enters into ground water; untreated sewage released into, water courses / sea; oil / petrol / rubber, from vehicles enters drains and then into, water course / sea; human / domestic, rubbish washed or dumped into water courses; in floods variety of pollutants washed into, water courses / sea; lack of waste management; acid rain changes the pH of, rivers / lakes; 4 6(d) Level of response marked question: Level 3 [5–6 marks] For this level; answers must look at both topics in detail and reach a conclusion. Answers will be balanced and will include examples. Level 2 [3–4 marks] Answers may look at both topics, but with only limited detail. More likely they will be one–sided. Level 1 [1–2 marks] Answer may well be a list or descriptive rather than an explanation or may provide a basic explanation of one or two points, often completely one–sided. No response or no creditable response [0]. Level of response indicative content: This is a very wide question which can be answered in a variety of ways; mark on quality and depth of discussion. There is no one ‘correct’ answer. Even the best answers will not cover all aspects. Some answers will simply agree and then try to justify, often ignoring the enhanced greenhouse effect. The best answers will look at the impacts of water pollution and the enhanced greenhouse effect, consider the solutions to these issues and reach a conclusion based on evidence. For water pollution expect oil spills, eutrophication, and other localised events. For the enhanced greenhouse effect expect ice melt, sea level rise and inundation plus changes to rainfall patterns and habitats. Some candidates may discuss the fact that these are international issues both requiring international agreements and discuss the fact that both are difficult to solve completely or quickly. 6
Mark scheme, page 12
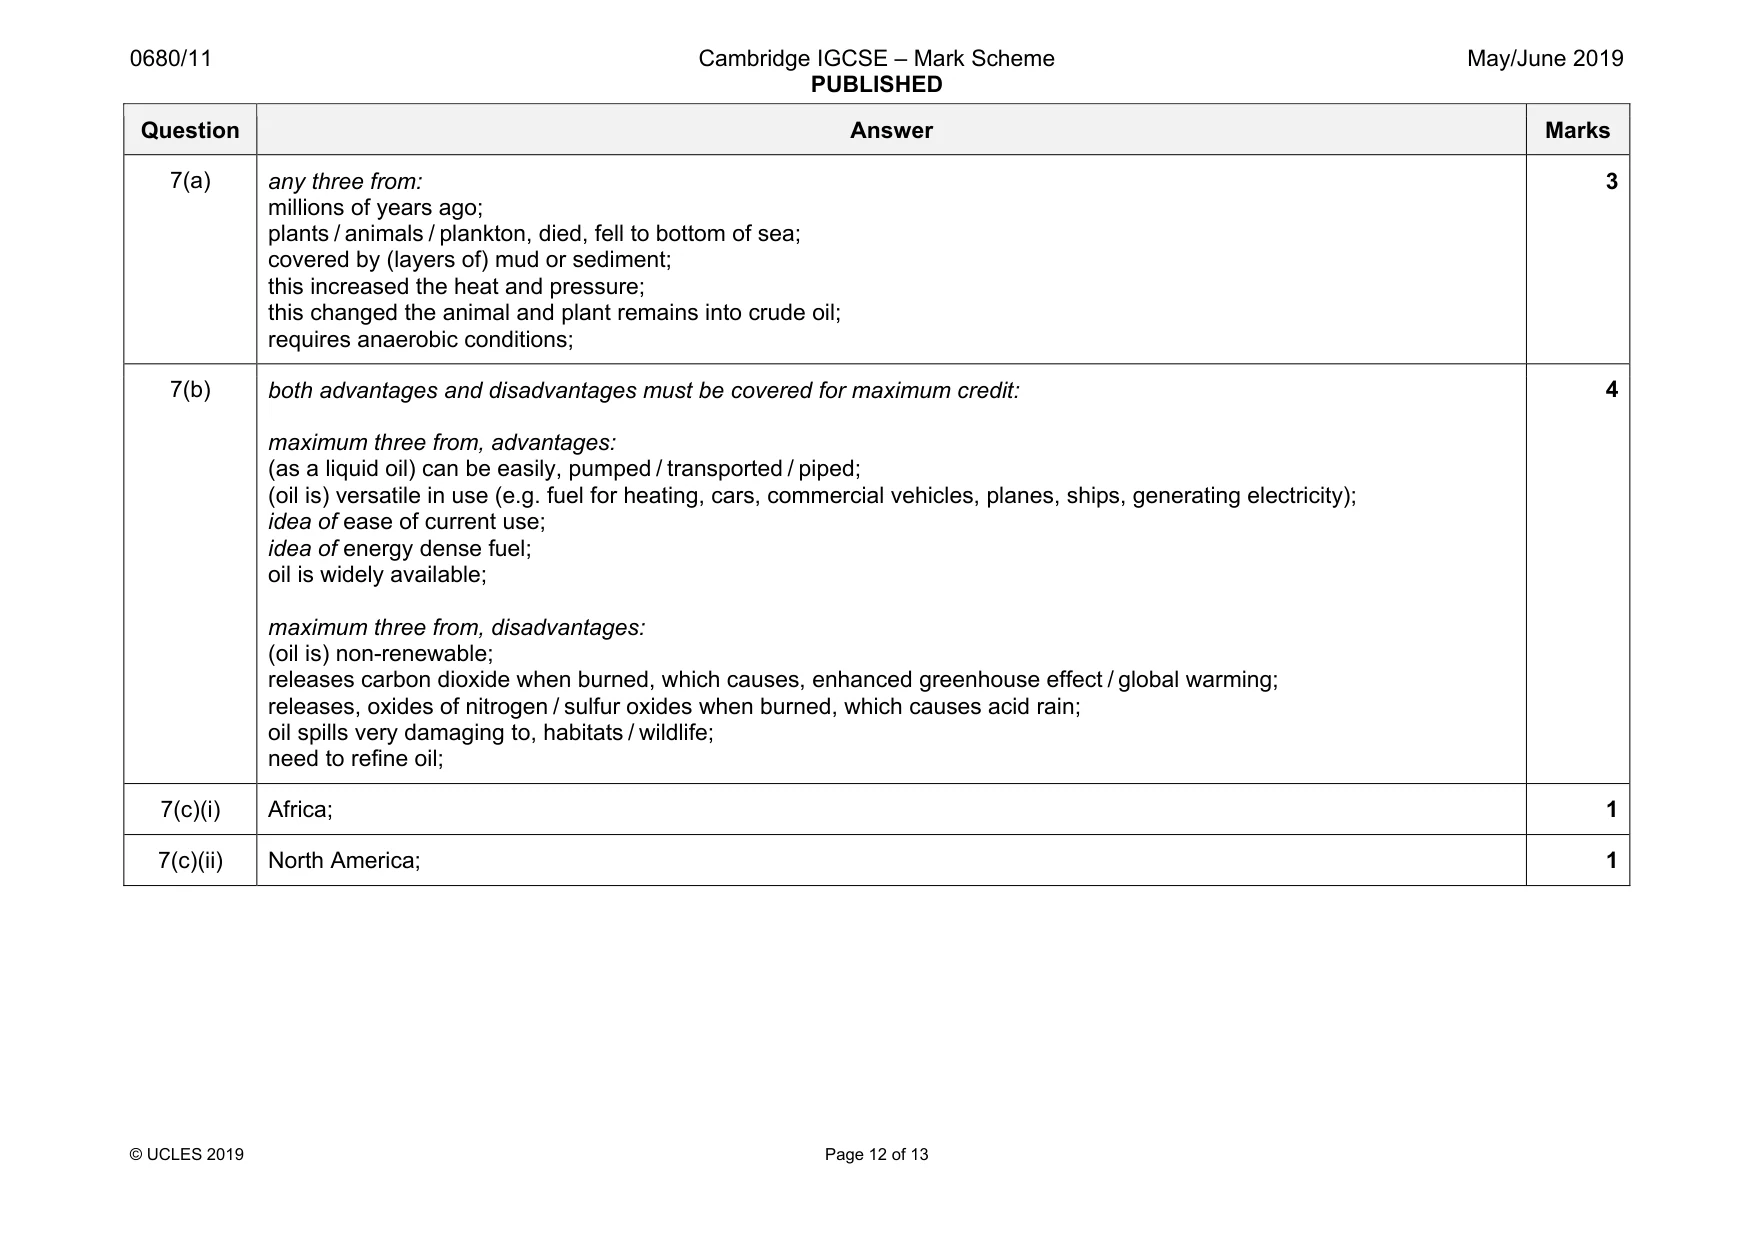
0680/11 Cambridge IGCSE – Mark Scheme PUBLISHED May/June 2019 © UCLES 2019 Page 12 of 13 Question Answer Marks 7(a) any three from: millions of years ago; plants / animals / plankton, died, fell to bottom of sea; covered by (layers of) mud or sediment; this increased the heat and pressure; this changed the animal and plant remains into crude oil; requires anaerobic conditions; 3 7(b) both advantages and disadvantages must be covered for maximum credit: maximum three from, advantages: (as a liquid oil) can be easily, pumped / transported / piped; (oil is) versatile in use (e.g. fuel for heating, cars, commercial vehicles, planes, ships, generating electricity); idea of ease of current use; idea of energy dense fuel; oil is widely available; maximum three from, disadvantages: (oil is) non-renewable; releases carbon dioxide when burned, which causes, enhanced greenhouse effect / global warming; releases, oxides of nitrogen / sulfur oxides when burned, which causes acid rain; oil spills very damaging to, habitats / wildlife; need to refine oil; 4 7(c)(i) Africa; 1 7(c)(ii) North America; 1
Mark scheme, page 13
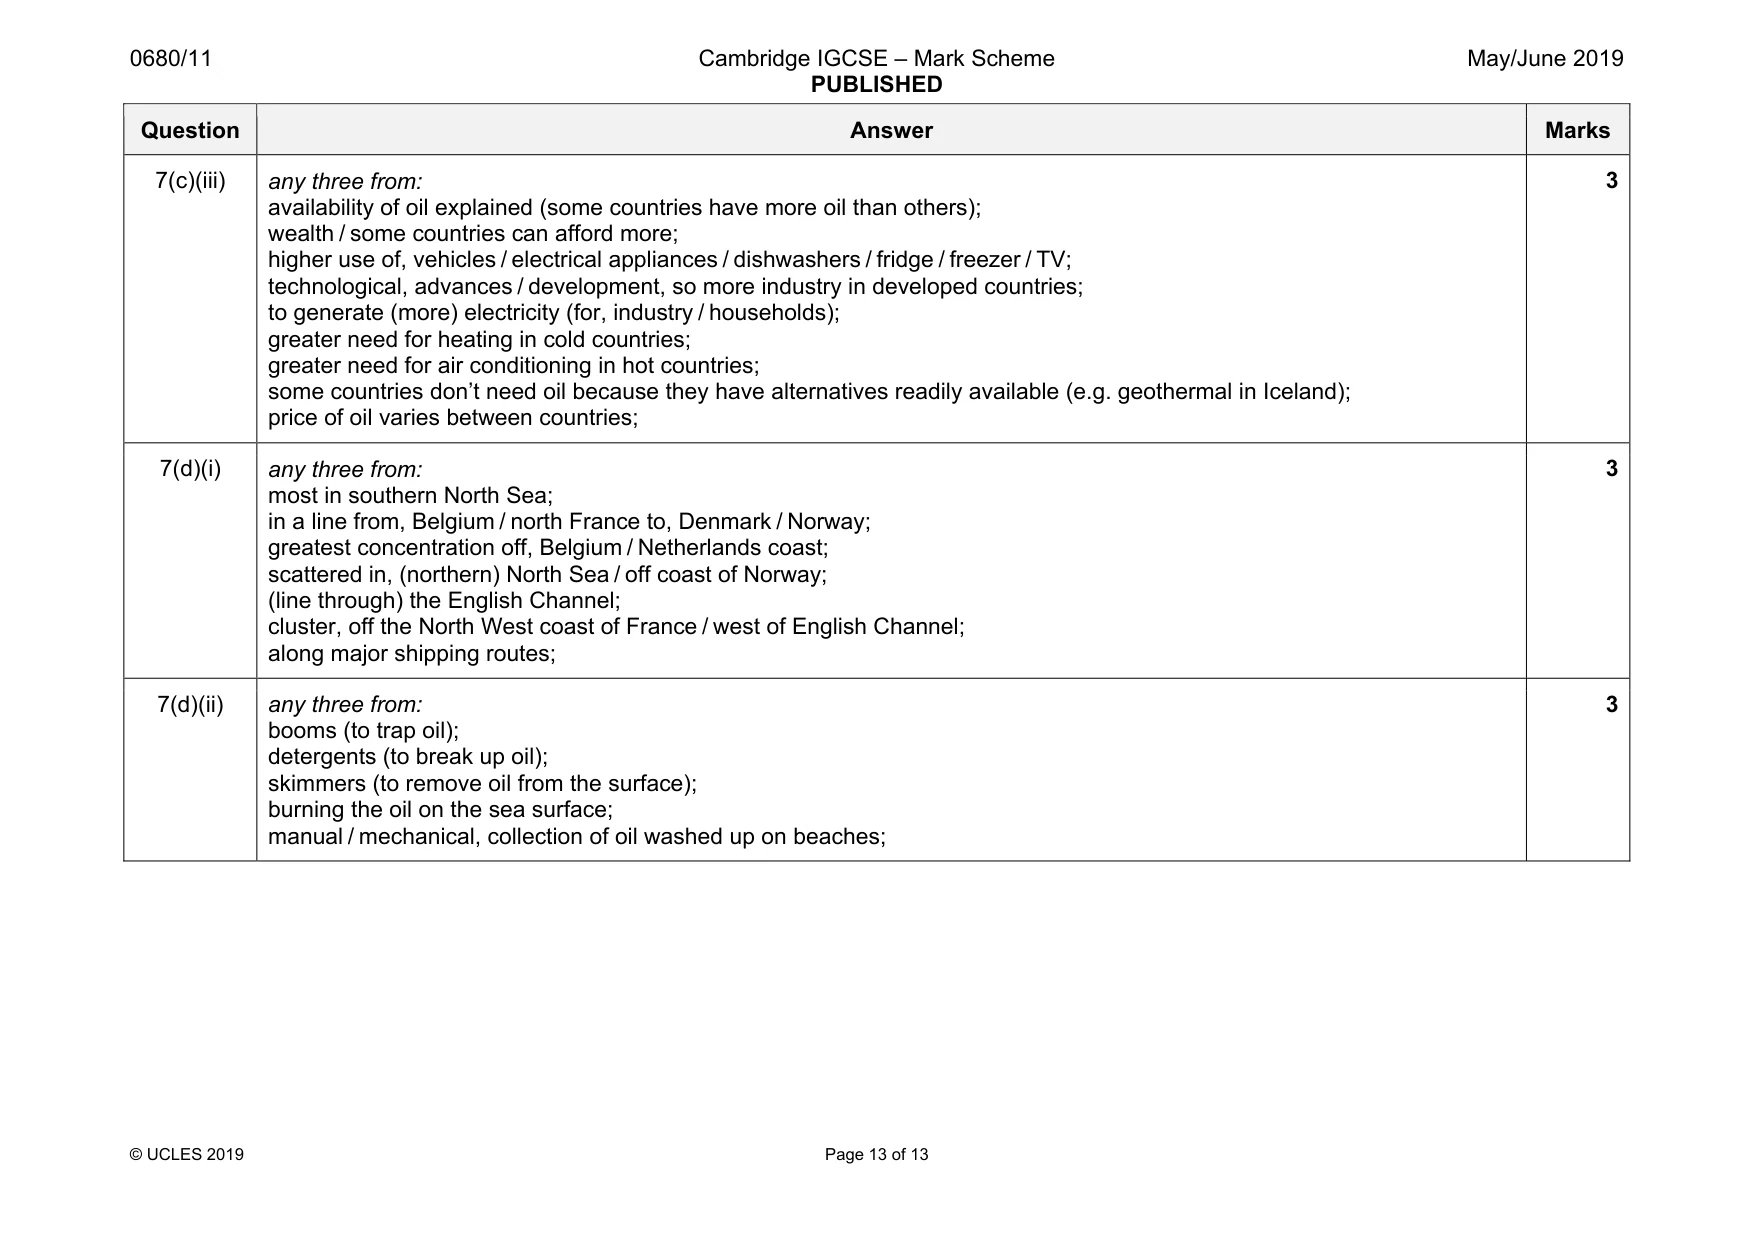
0680/11 Cambridge IGCSE – Mark Scheme PUBLISHED May/June 2019 © UCLES 2019 Page 13 of 13 Question Answer Marks 7(c)(iii) any three from: availability of oil explained (some countries have more oil than others); wealth / some countries can afford more; higher use of, vehicles / electrical appliances / dishwashers / fridge / freezer / TV; technological, advances / development, so more industry in developed countries; to generate (more) electricity (for, industry / households); greater need for heating in cold countries; greater need for air conditioning in hot countries; some countries don’t need oil because they have alternatives readily available (e.g. geothermal in Iceland); price of oil varies between countries; 3 7(d)(i) any three from: most in southern North Sea; in a line from, Belgium / north France to, Denmark / Norway; greatest concentration off, Belgium / Netherlands coast; scattered in, (northern) North Sea / off coast of Norway; (line through) the English Channel; cluster, off the North West coast of France / west of English Channel; along major shipping routes; 3 7(d)(ii) any three from: booms (to trap oil); detergents (to break up oil); skimmers (to remove oil from the surface); burning the oil on the sea surface; manual / mechanical, collection of oil washed up on beaches; 3
What you needed in this session
Cambridge’s own grade thresholds for 2019 May/June, Paper 1 · Variant 1. A higher threshold means an easier paper — the bar moves with how the cohort did.