Cambridge IGCSE Environmental Management 0680 — 2019 May/June Paper 1 · Variant 3
0680/13/M/J/19 · 80 marks · ≈90 min
The question paper and its mark scheme, free to read here and free to download. This is Cambridge’s own paper, exactly as it was sat.
Question paper20 pages






Mark scheme13 pages
Answers below. Sit the paper first if you are practising.
Paper as text
Question paper, page 1
This document consists of 16 printed pages and 4 blank pages. DC (KN/TP) 168044/2 © UCLES 2019 [Turn over * 0 5 4 5 9 3 8 0 4 6 * ENVIRONMENTAL MANAGEMENT 0680/13 Paper 1 Theory May/June 2019 1 hour 45 minutes Candidates answer on the Question Paper. No Additional Materials are required. READ THESE INSTRUCTIONS FIRST Write your centre number, candidate number and name in the spaces at the top of this page. Write in dark blue or black pen. You may use an HB pencil for any diagrams or graphs. Do not use staples, paper clips, glue or correction fluid. DO NOT WRITE IN ANY BARCODES. Answer all questions. Electronic calculators may be used. You may lose marks if you do not show your working or if you do not use appropriate units. At the end of the examination, fasten all your work securely together. The number of marks is given in brackets [ ] at the end of each question or part question. Cambridge Assessment International Education Cambridge International General Certificate of Secondary Education
Question paper, page 2
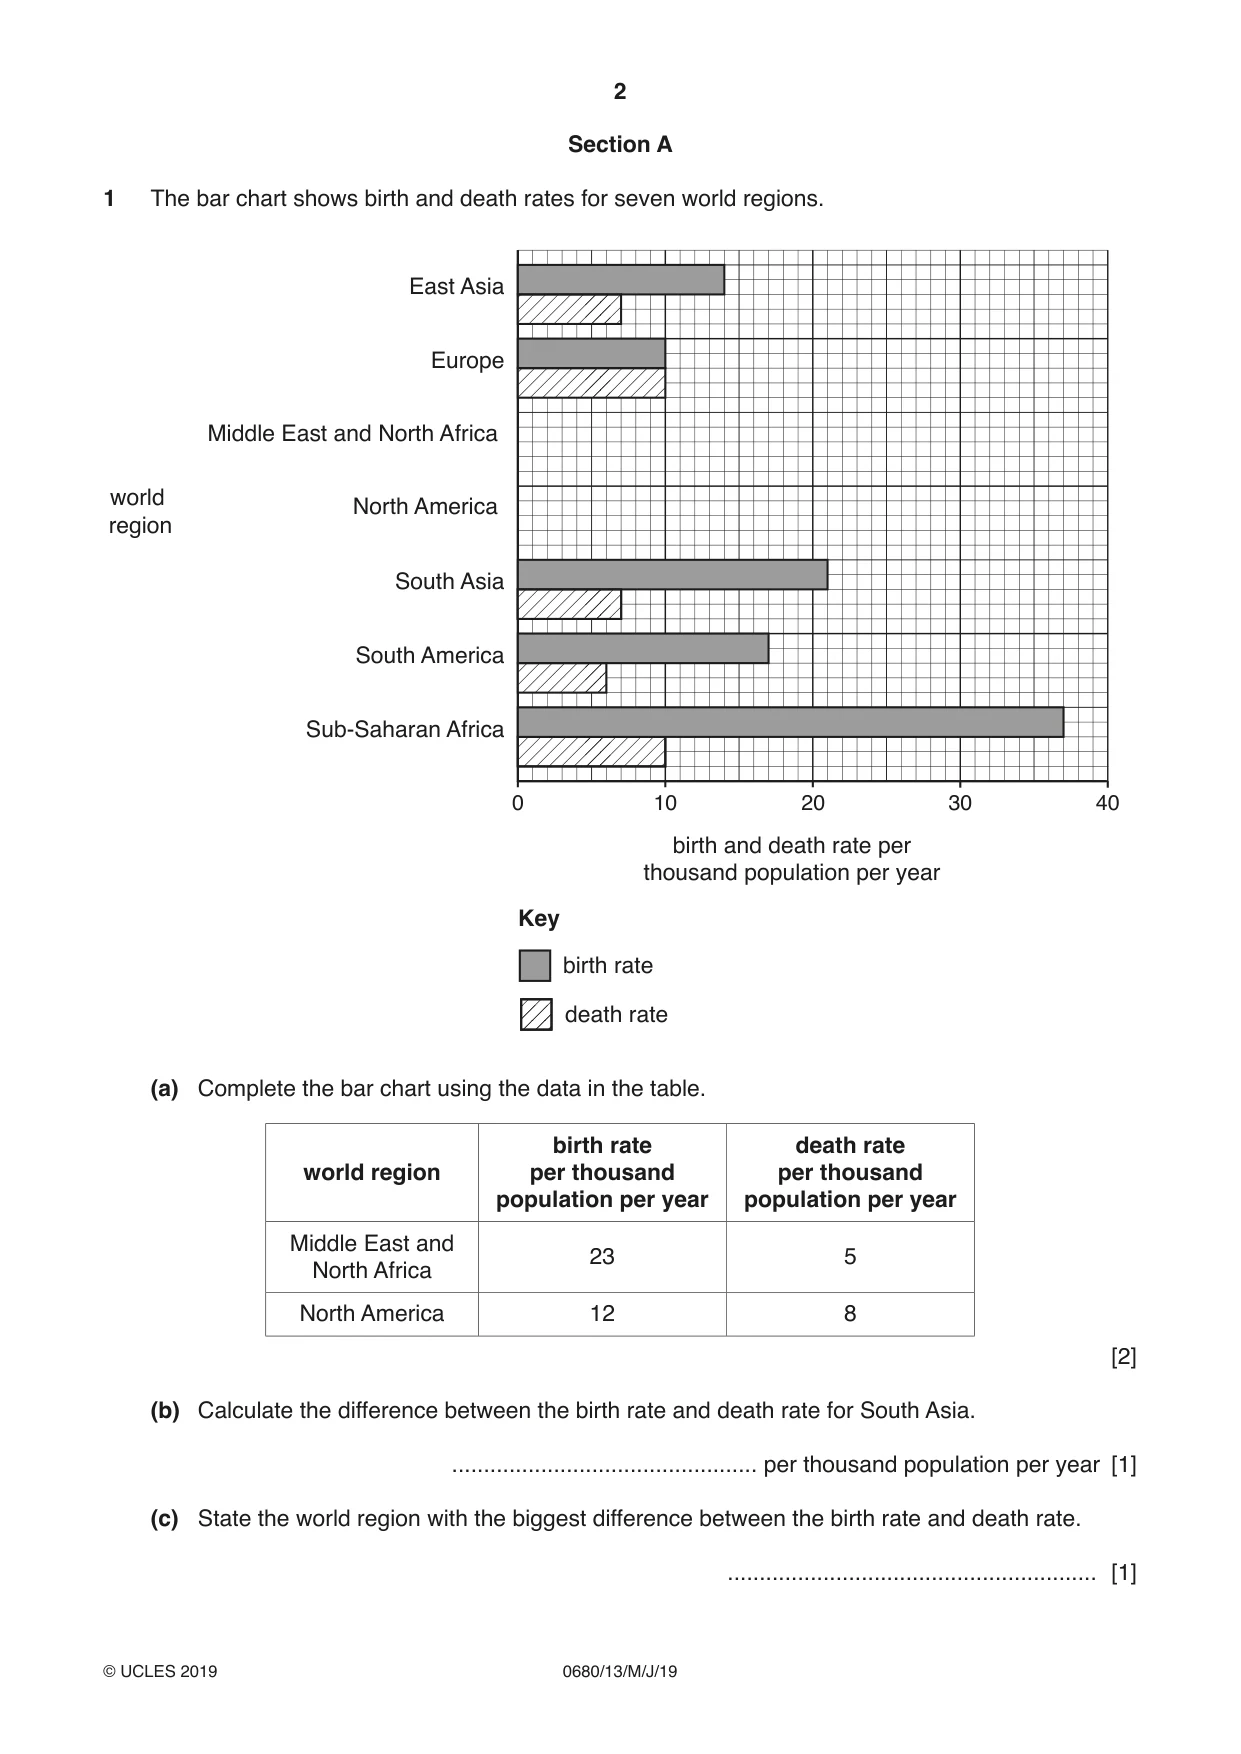
2 0680/13/M/J/19 © UCLES 2019 Section A 1 The bar chart shows birth and death rates for seven world regions. birth rate death rate Key birth and death rate per thousand population per year 10 East Asia Europe Middle East and North Africa North America world region South Asia South America Sub-Saharan Africa 0 20 30 40 (a) Complete the bar chart using the data in the table. world region birth rate per thousand population per year death rate per thousand population per year Middle East and North Africa 23 5 North America 12 8 [2] (b) Calculate the difference between the birth rate and death rate for South Asia. … per thousand population per year [1] (c) State the world region with the biggest difference between the birth rate and death rate. … [1]
Question paper, page 3
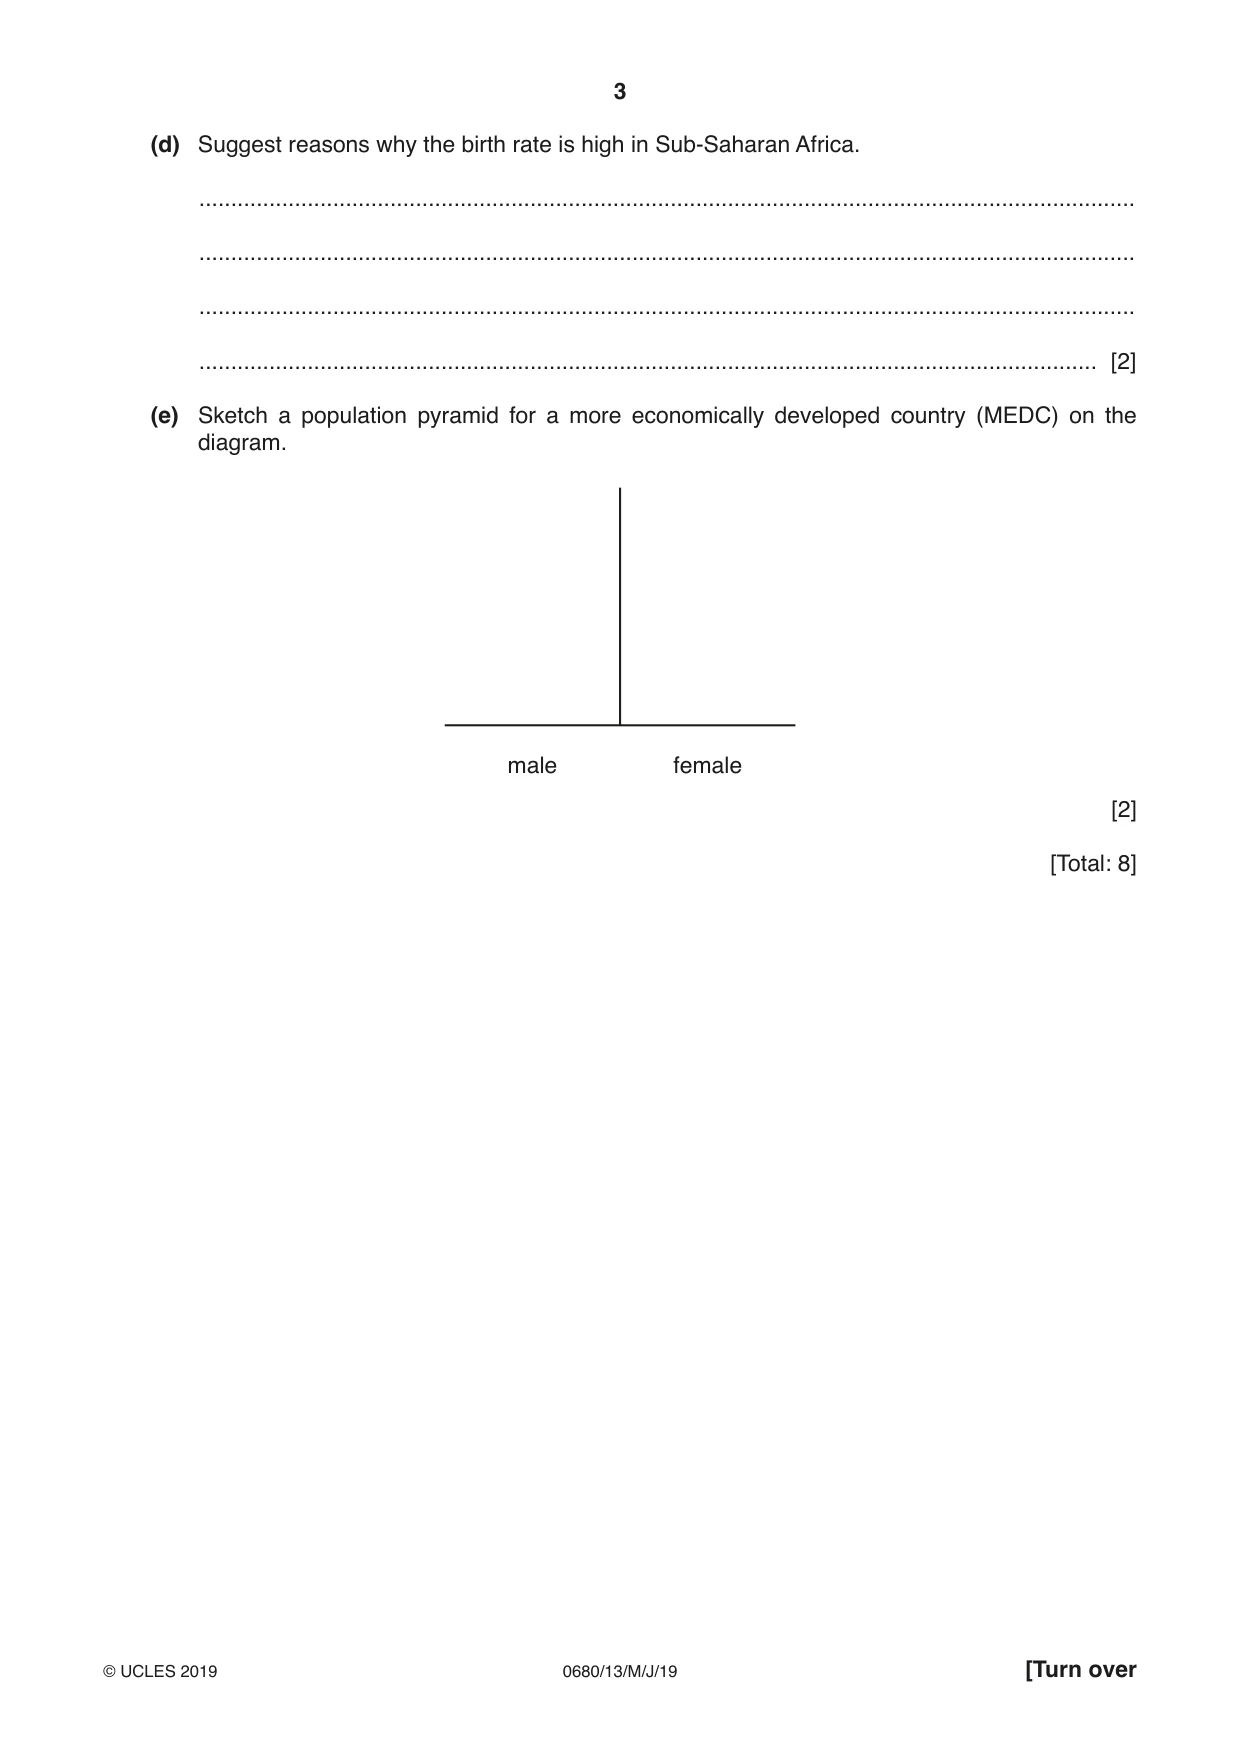
3 0680/13/M/J/19 © UCLES 2019 [Turn over (d) Suggest reasons why the birth rate is high in Sub-Saharan Africa. … … … … [2] (e) Sketch a population pyramid for a more economically developed country (MEDC) on the diagram. male female [2] [Total: 8]
Question paper, page 4
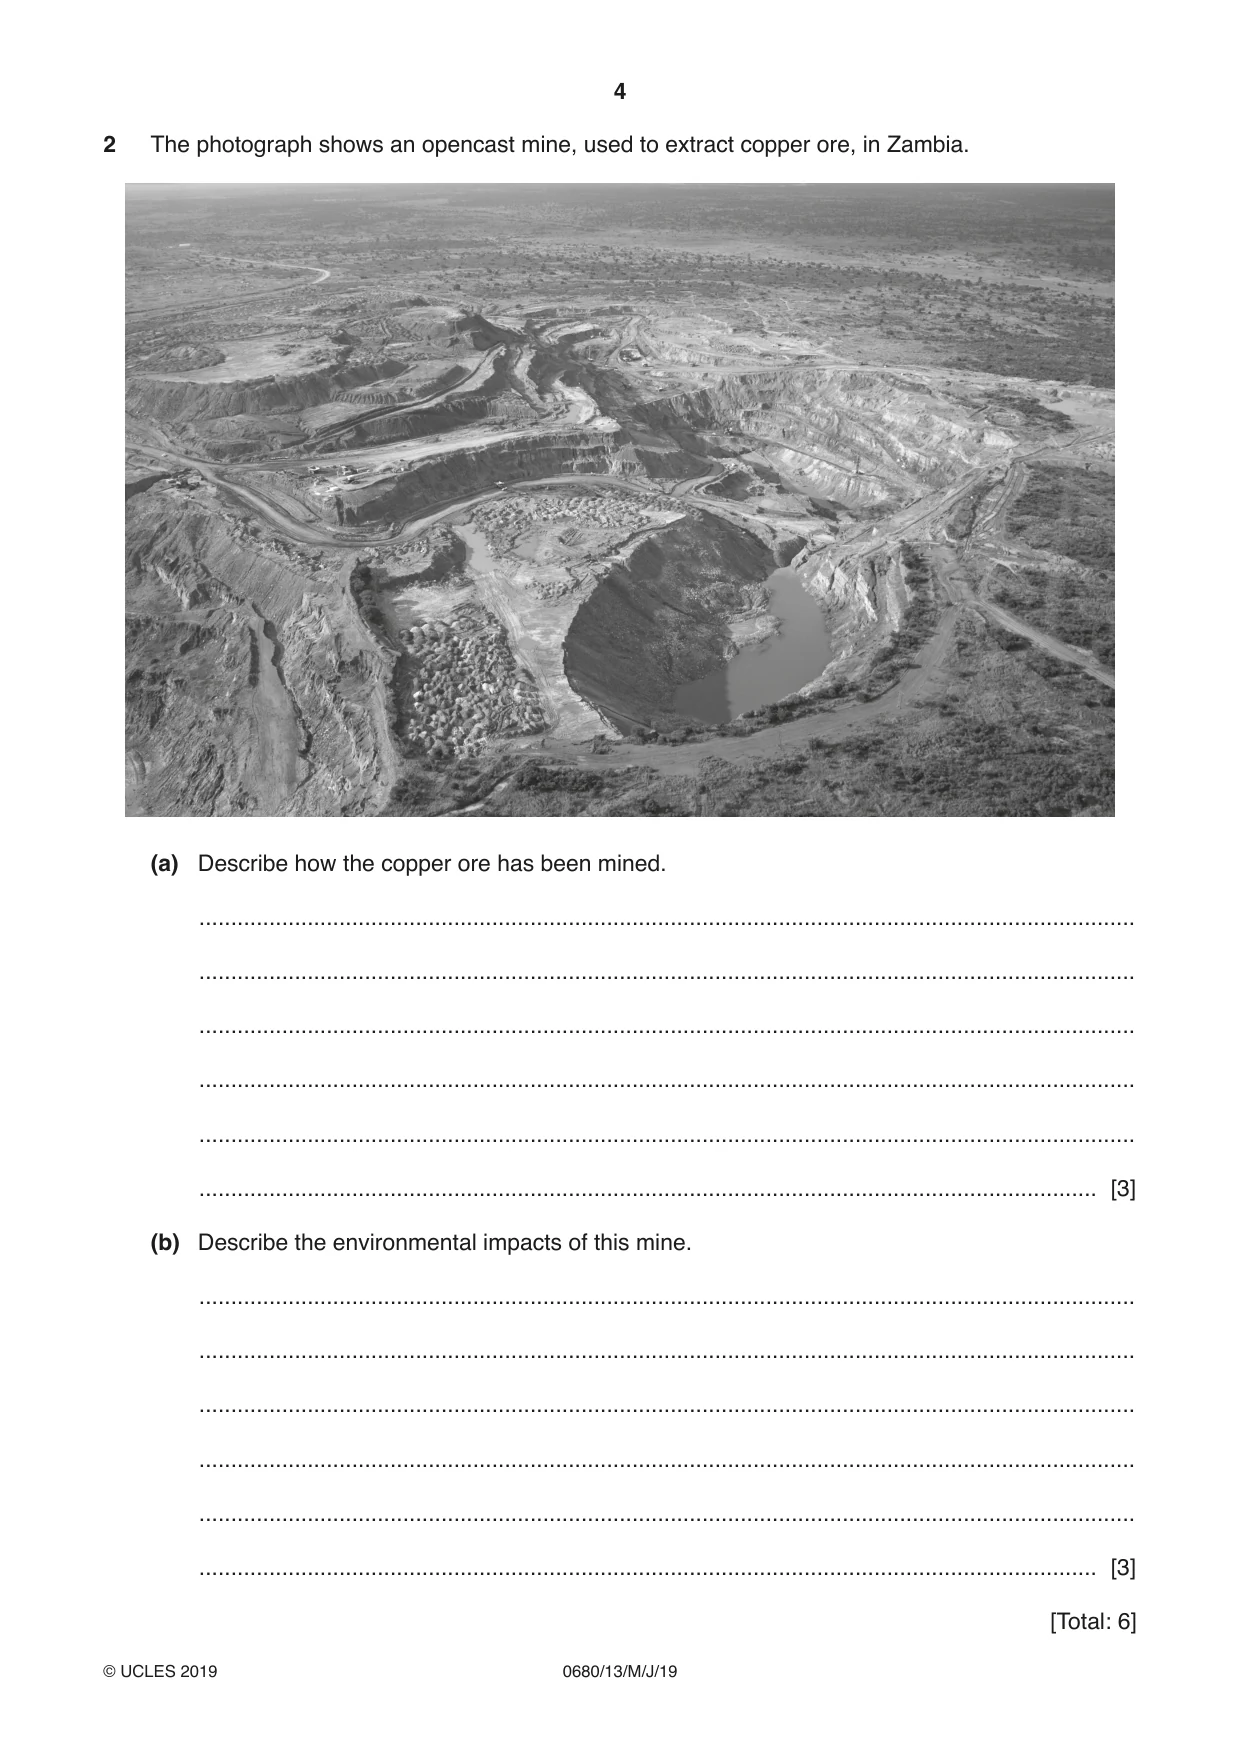
4 0680/13/M/J/19 © UCLES 2019 2 The photograph shows an opencast mine, used to extract copper ore, in Zambia. (a) Describe how the copper ore has been mined. … … … … … … [3] (b) Describe the environmental impacts of this mine. … … … … … … [3] [Total: 6]
Question paper, page 5
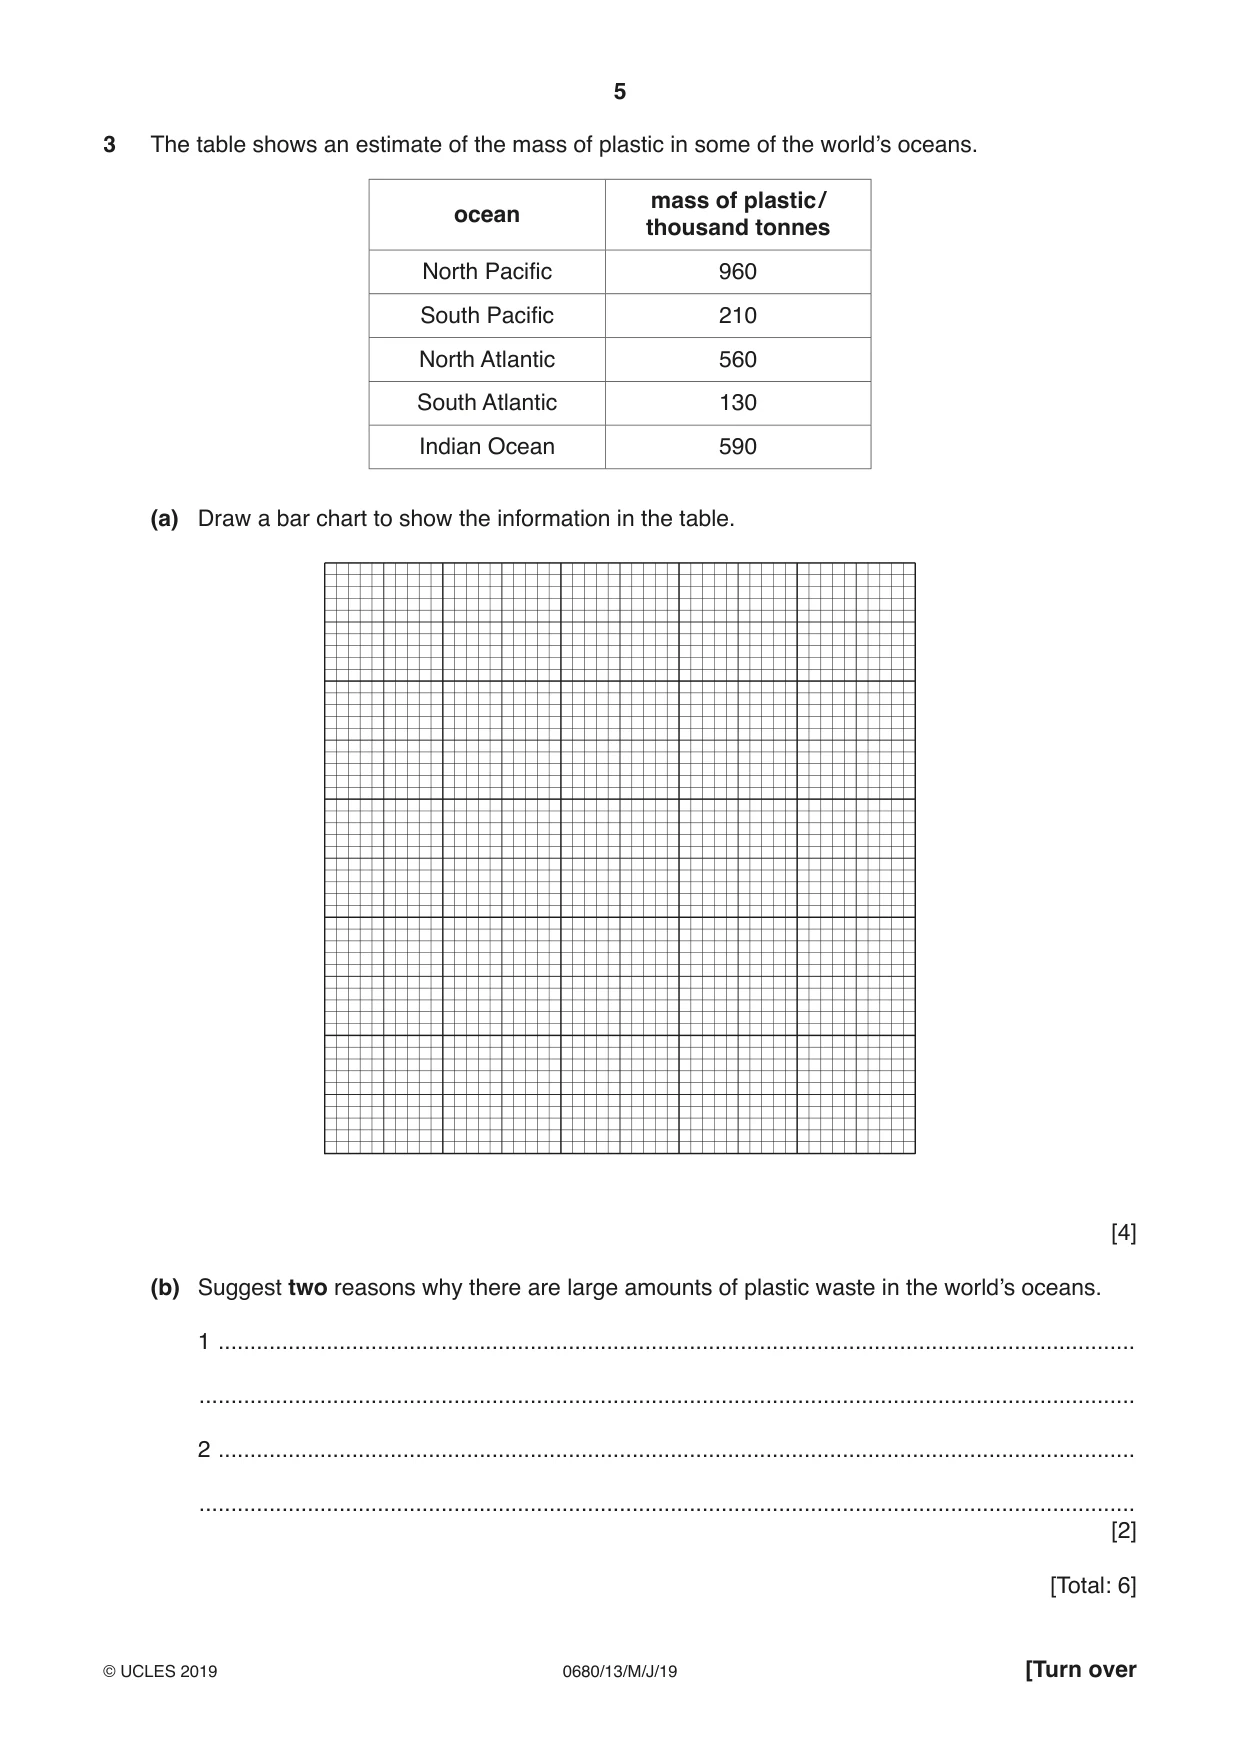
5 0680/13/M/J/19 © UCLES 2019 [Turn over 3 The table shows an estimate of the mass of plastic in some of the world’s oceans. ocean mass of plastic / thousand tonnes North Pacific 960 South Pacific 210 North Atlantic 560 South Atlantic 130 Indian Ocean 590 (a) Draw a bar chart to show the information in the table. [4] (b) Suggest two reasons why there are large amounts of plastic waste in the world’s oceans. 1 … … 2 … … [2] [Total: 6]
Question paper, page 6
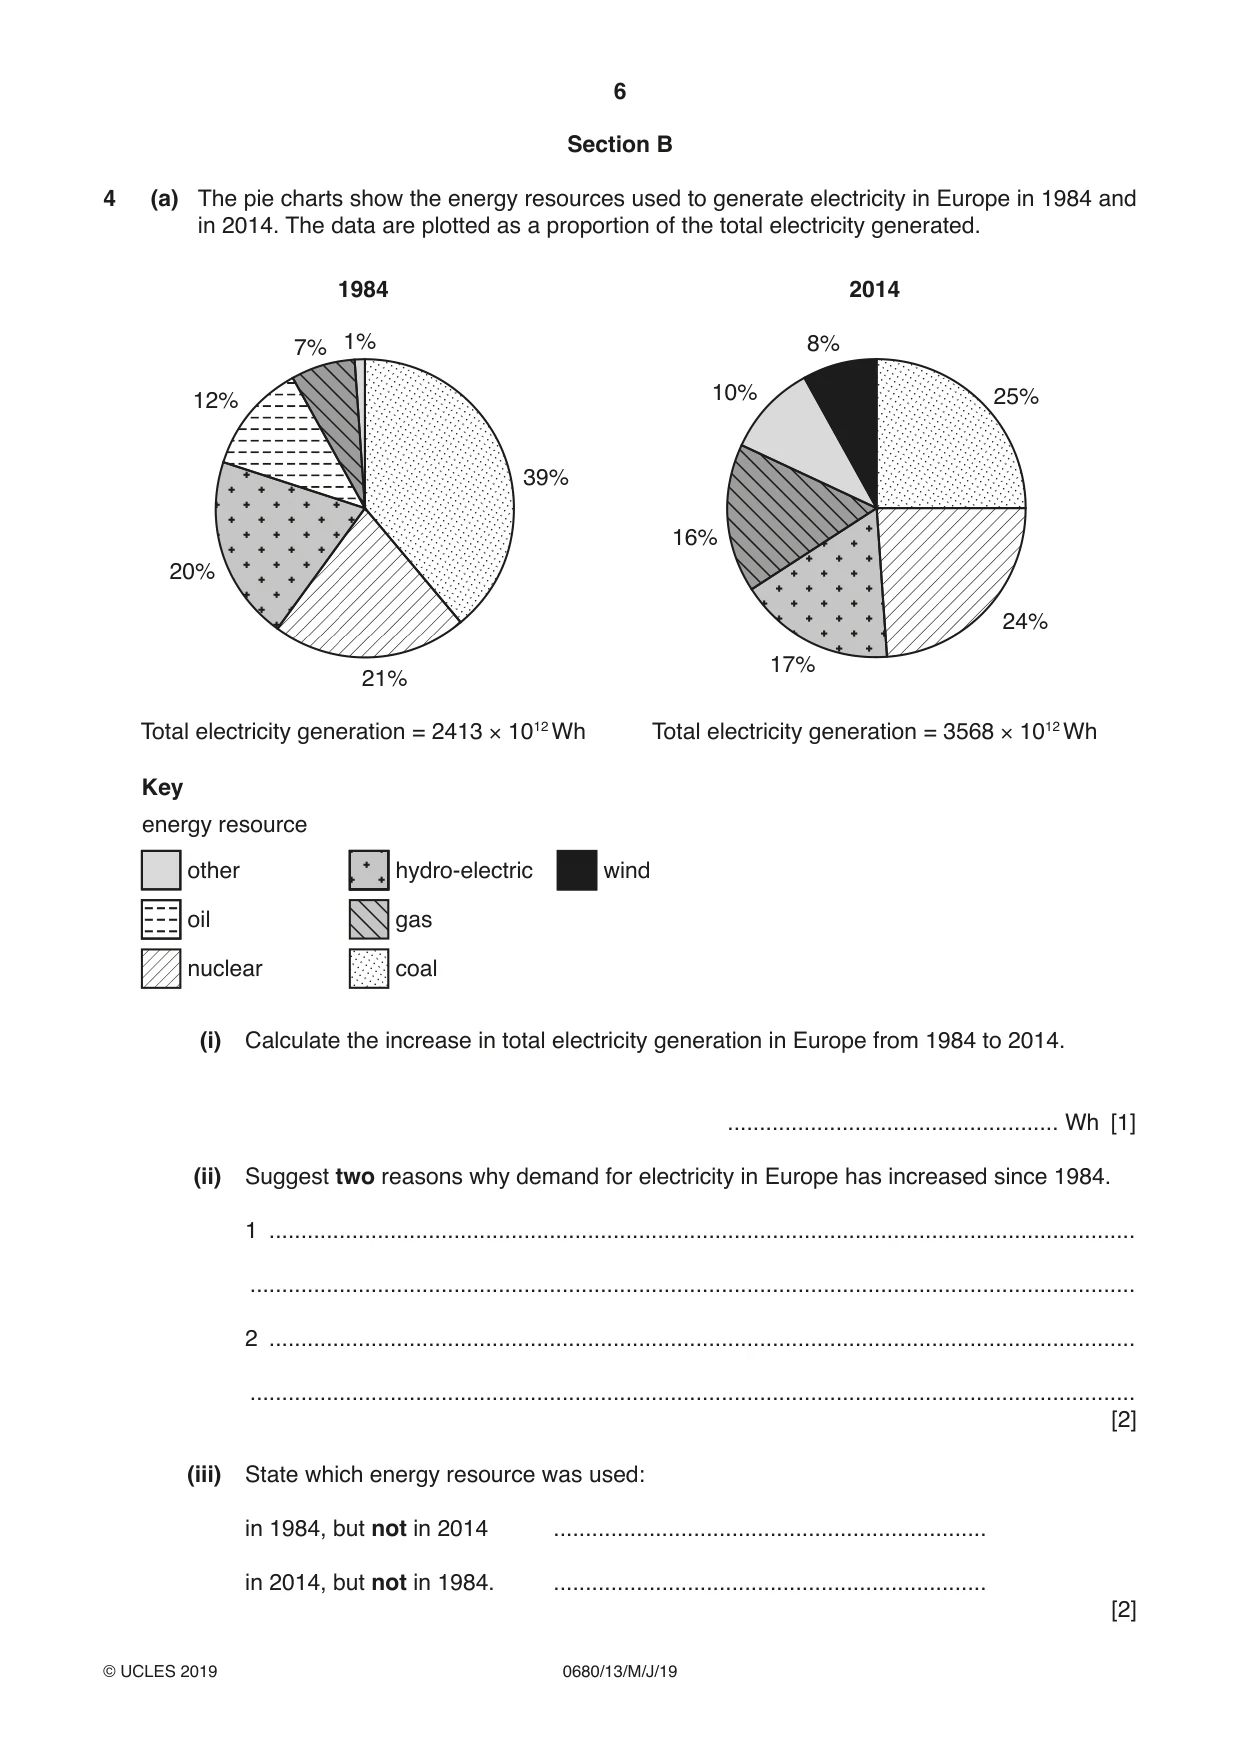
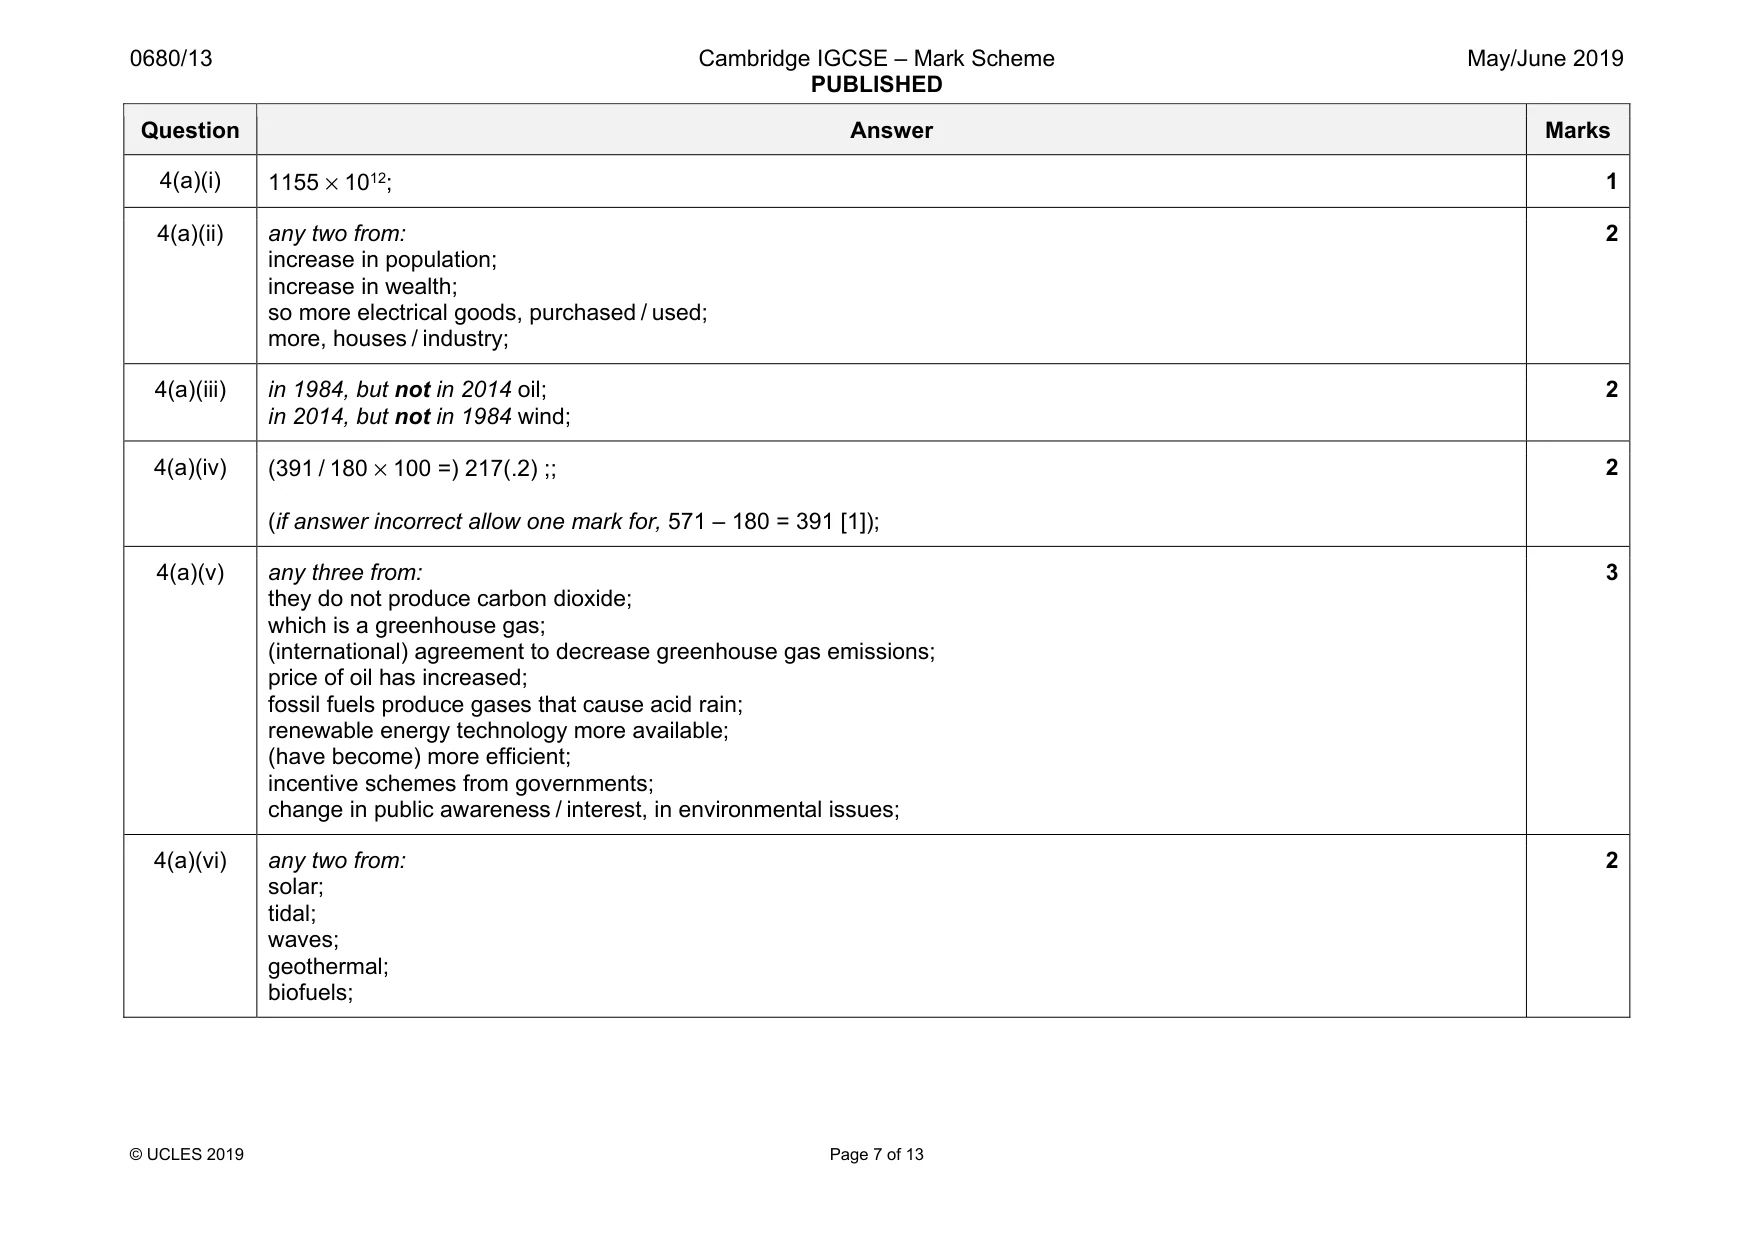
6 0680/13/M/J/19 © UCLES 2019 Section B 4 (a) The pie charts show the energy resources used to generate electricity in Europe in 1984 and in 2014. The data are plotted as a proportion of the total electricity generated. 1984 Total electricity generation = 2413 × 1012 Wh Total electricity generation = 3568 × 1012 Wh 1% 8% 12% 25% 24% 17% 16% 10% 21% 20% 7% 2014 energy resource Key other oil nuclear hydro-electric wind gas coal 39% (i) Calculate the increase in total electricity generation in Europe from 1984 to 2014. … Wh [1] (ii) Suggest two reasons why demand for electricity in Europe has increased since 1984. 1 … … 2 … … [2] (iii) State which energy resource was used: in 1984, but not in 2014 … in 2014, but not in 1984. … [2]
Question paper, page 7
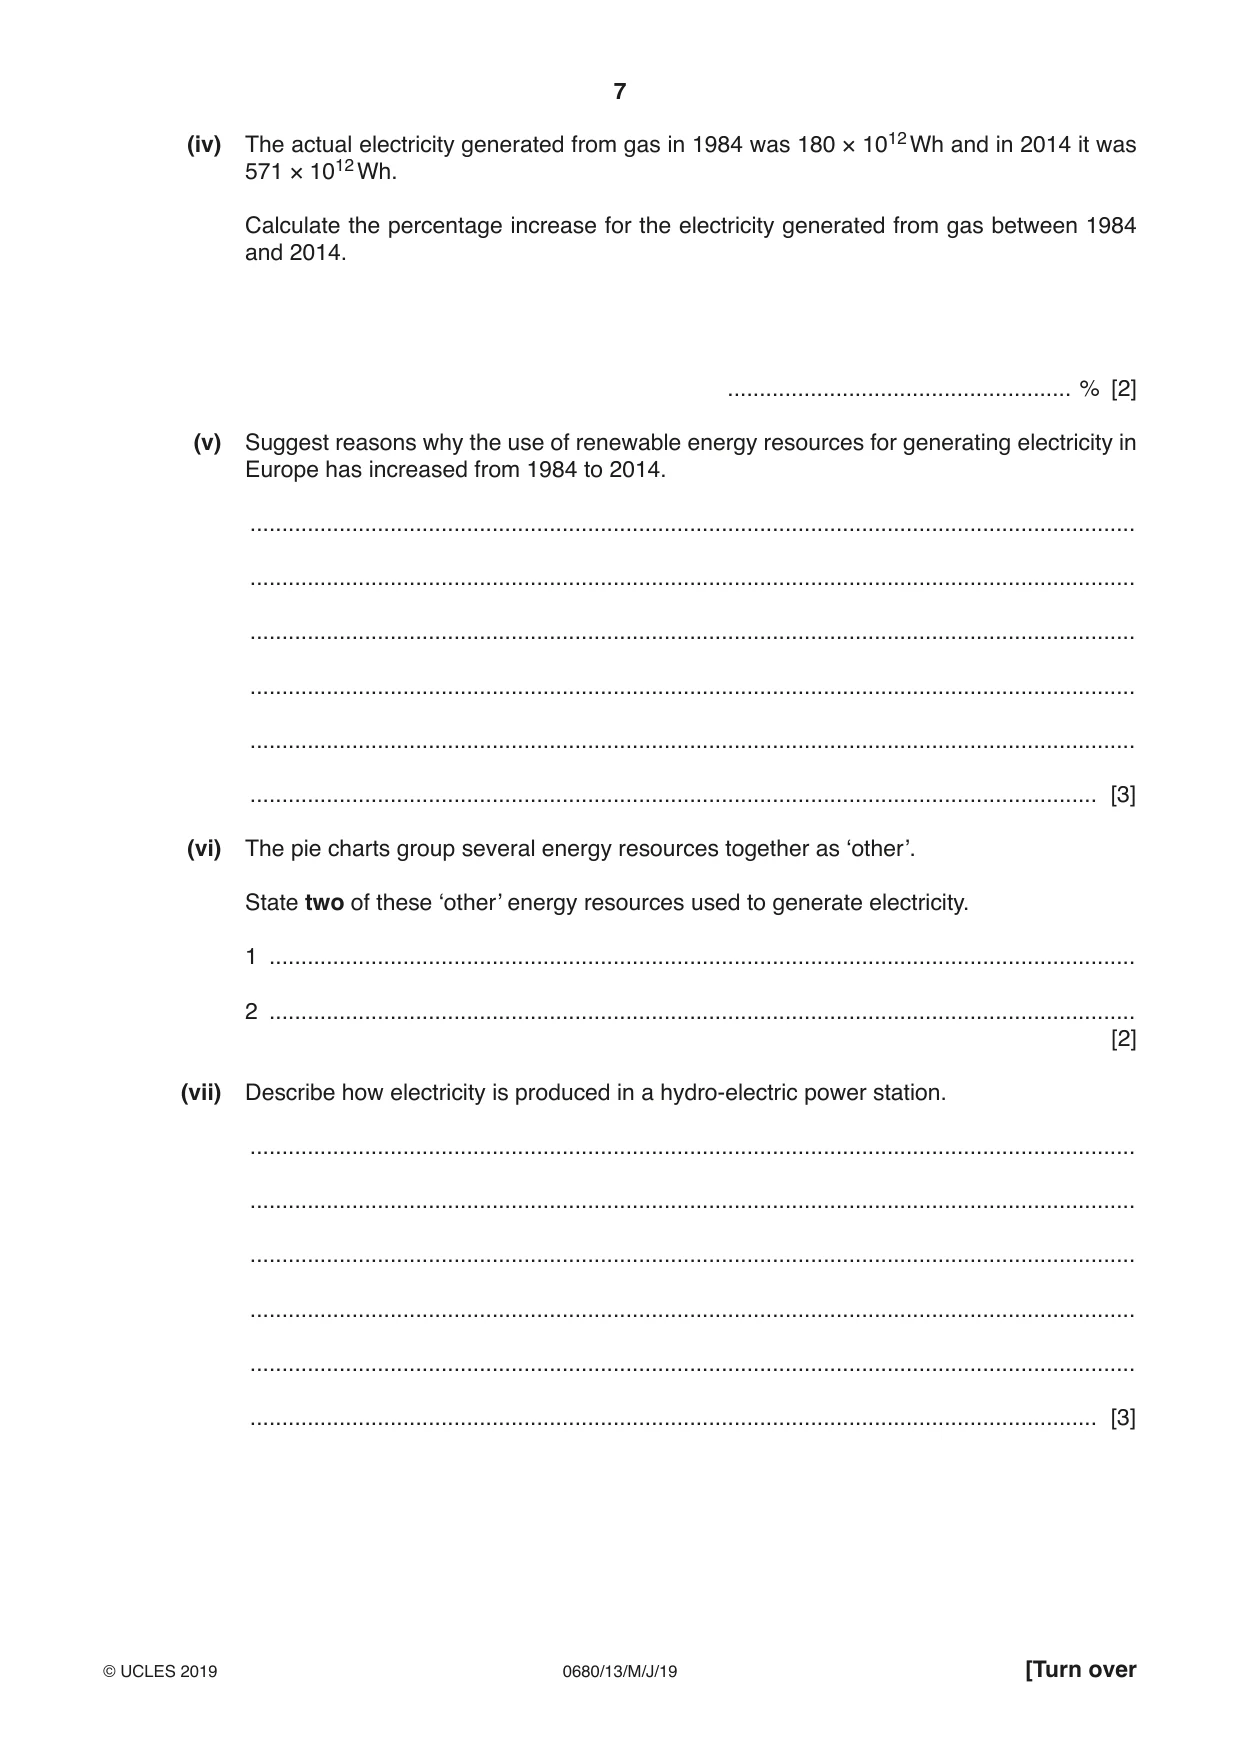
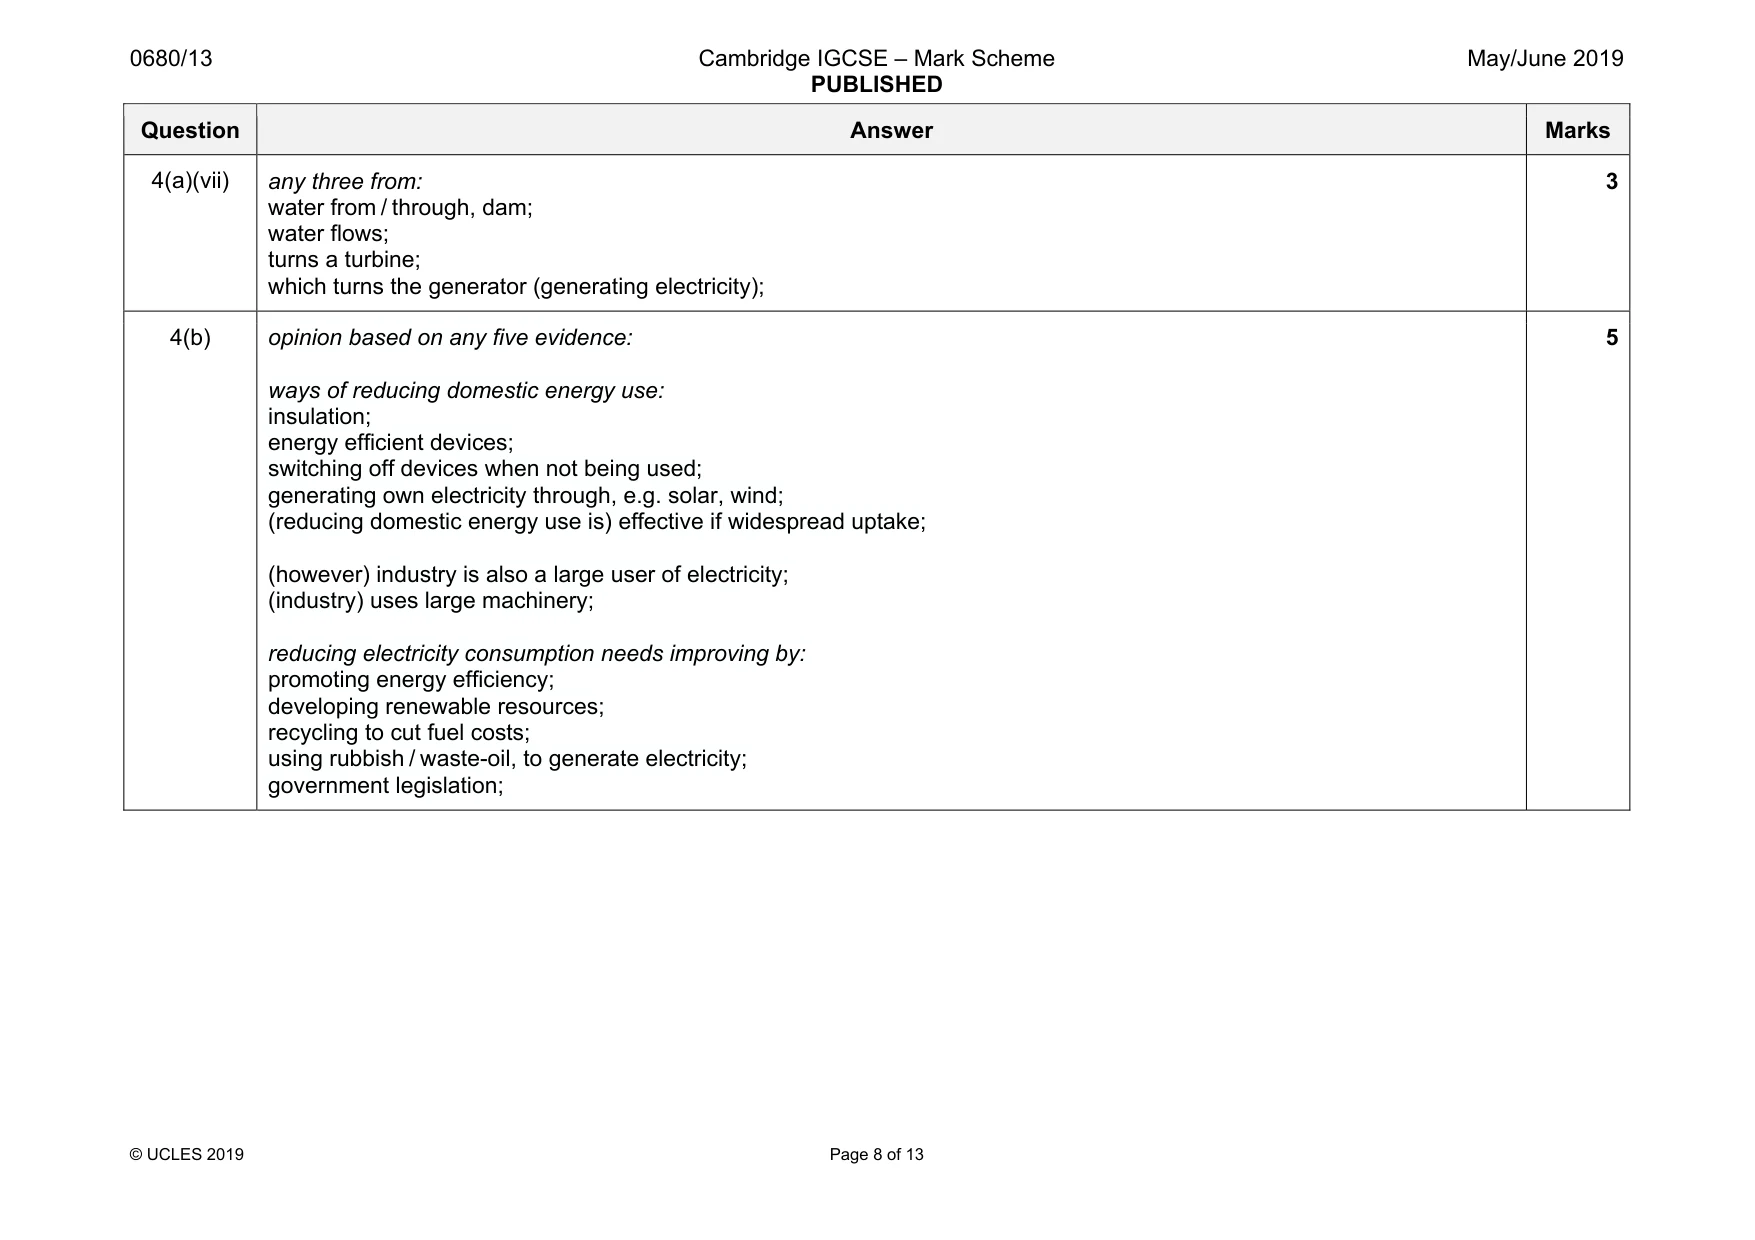
7 0680/13/M/J/19 © UCLES 2019 [Turn over (iv) The actual electricity generated from gas in 1984 was 180 × 1012 Wh and in 2014 it was 571 × 1012 Wh. Calculate the percentage increase for the electricity generated from gas between 1984 and 2014. … % [2] (v) Suggest reasons why the use of renewable energy resources for generating electricity in Europe has increased from 1984 to 2014. … … … … … … [3] (vi) The pie charts group several energy resources together as ‘other’. State two of these ‘other’ energy resources used to generate electricity. 1 … 2 … [2] (vii) Describe how electricity is produced in a hydro-electric power station. … … … … … … [3]
Question paper, page 8
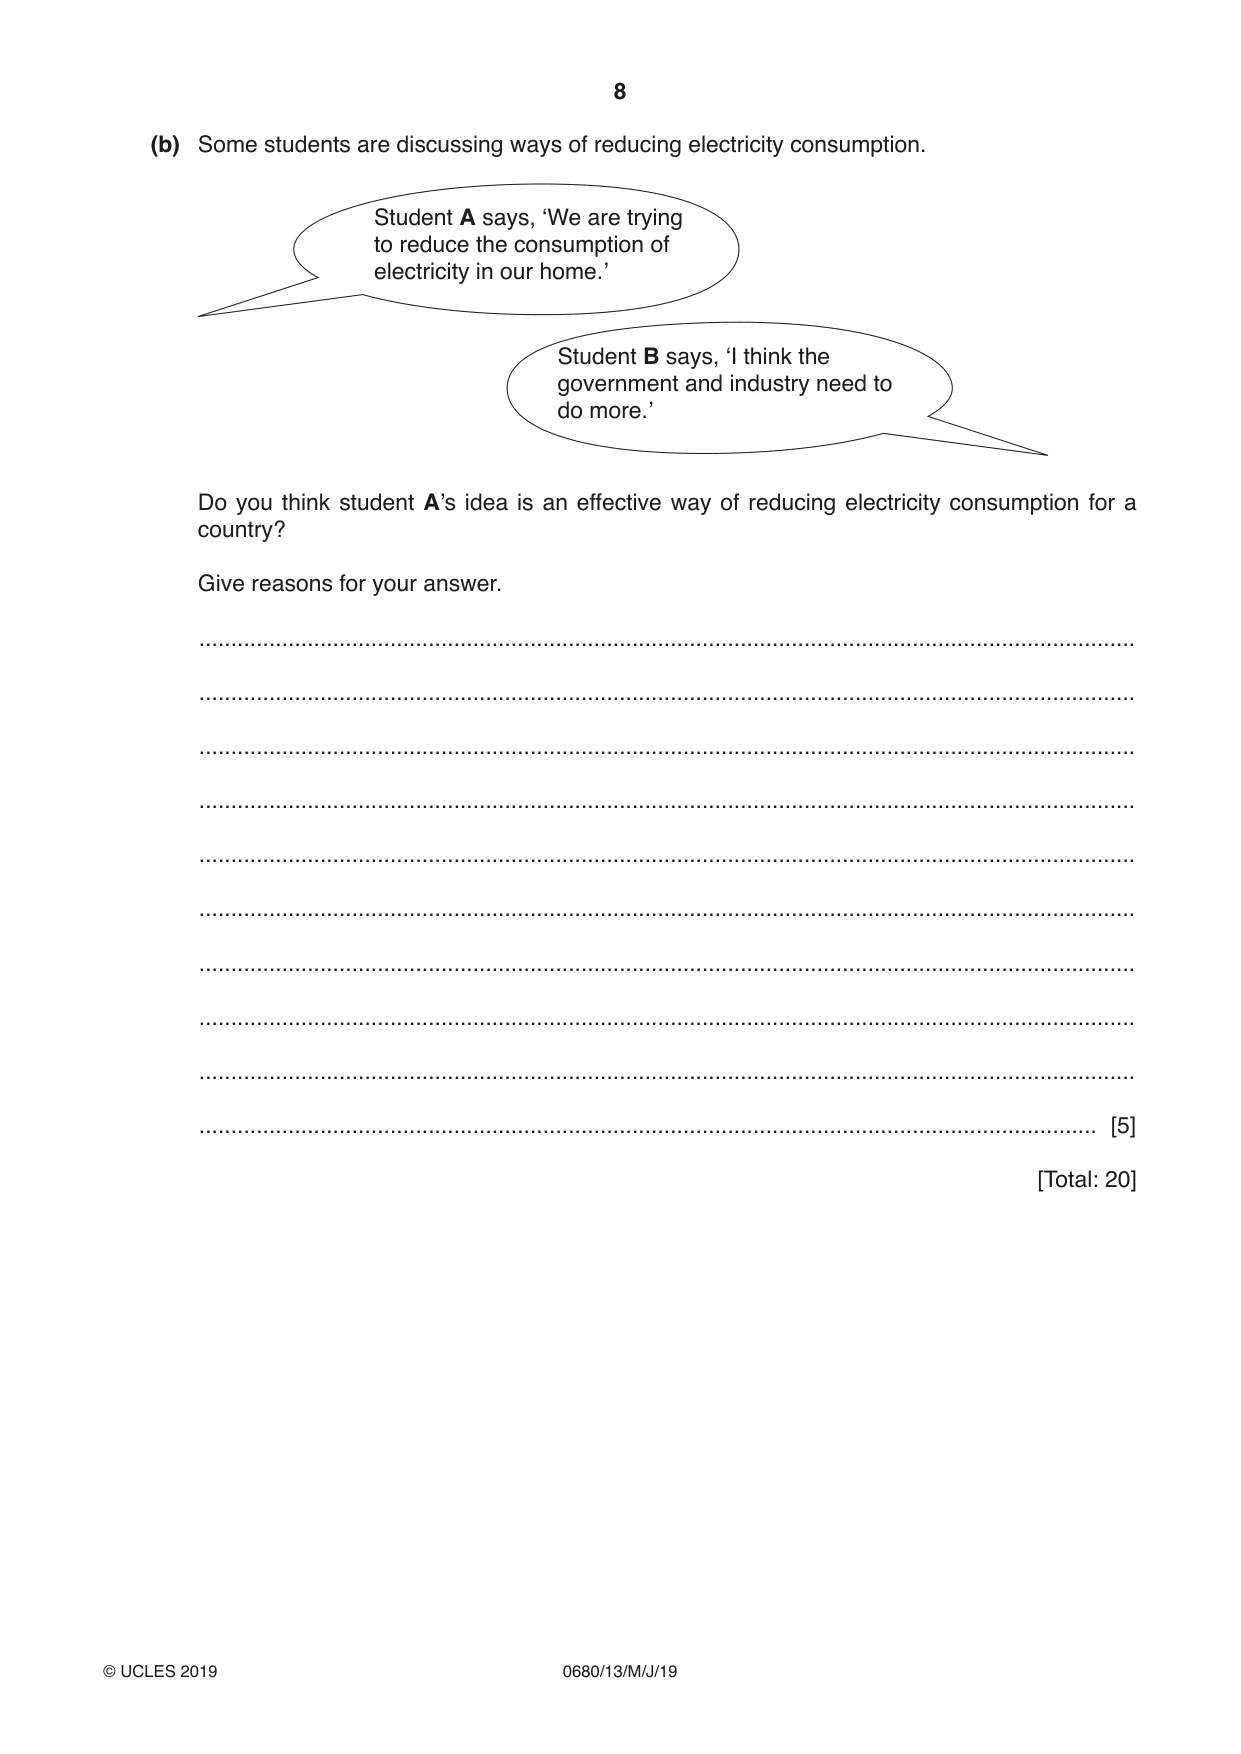
8 0680/13/M/J/19 © UCLES 2019 (b) Some students are discussing ways of reducing electricity consumption. Student A says, ‘We are trying to reduce the consumption of electricity in our home.’ Student B says, ‘I think the government and industry need to do more.’ Do you think student A’s idea is an effective way of reducing electricity consumption for a country? Give reasons for your answer. … … … … … … … … … … [5] [Total: 20]
Question paper, page 9
9 0680/13/M/J/19 © UCLES 2019 [Turn over BLANK PAGE
Question paper, page 10
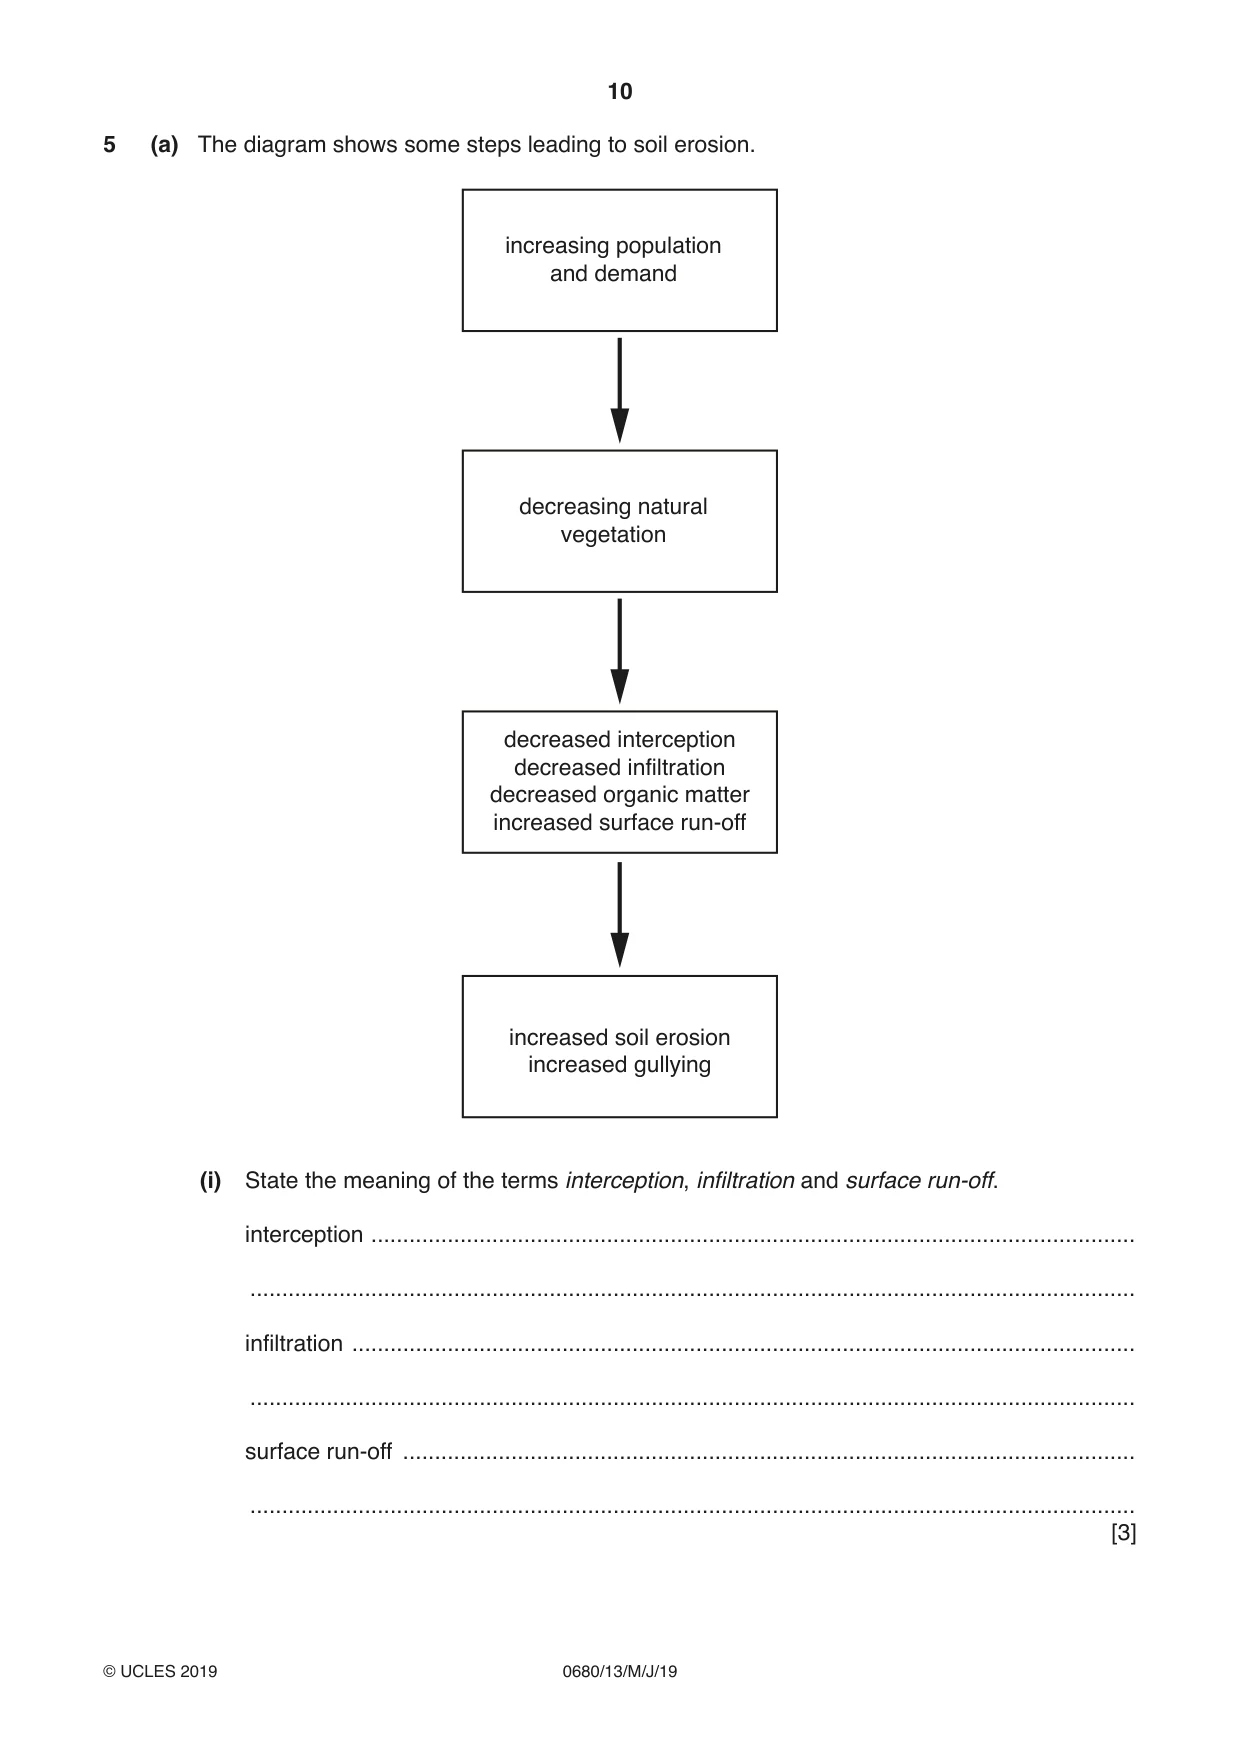
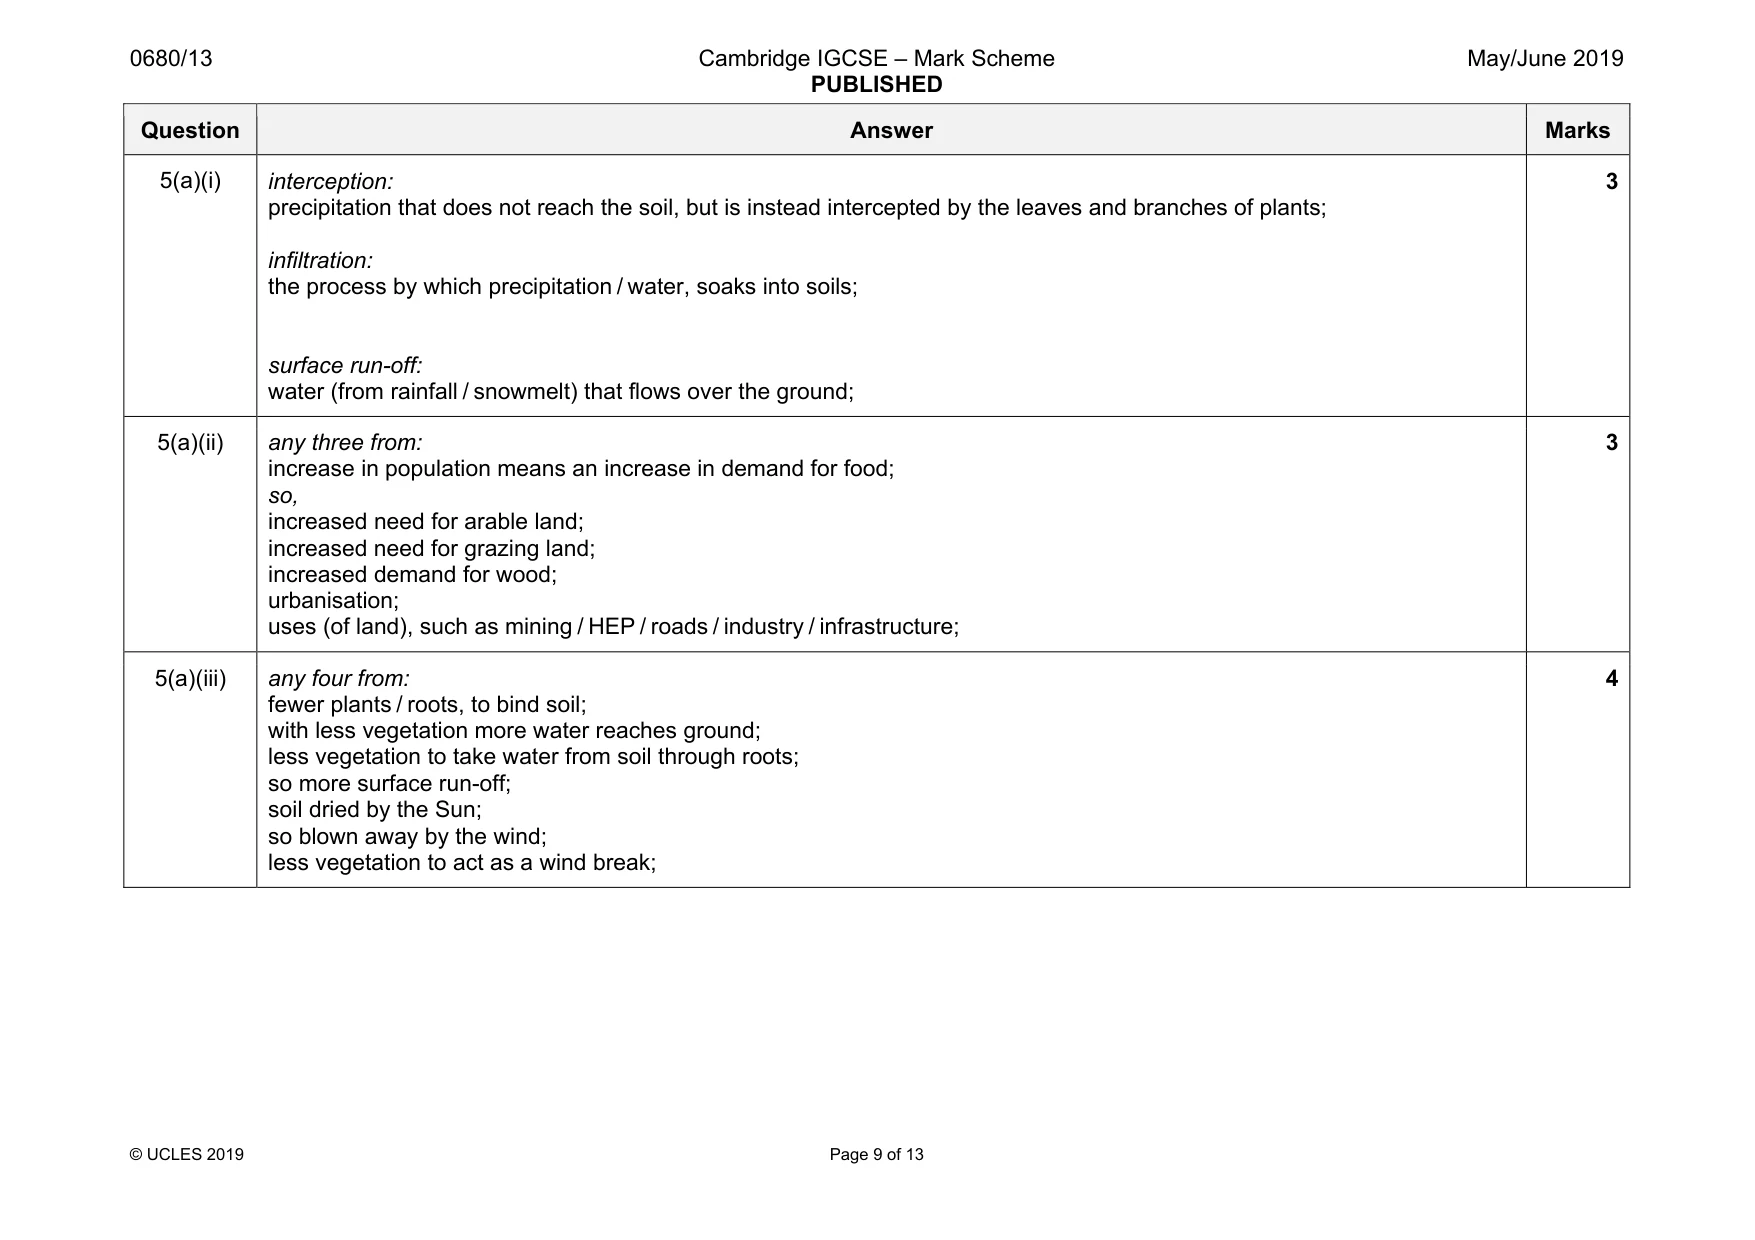
10 0680/13/M/J/19 © UCLES 2019 5 (a) The diagram shows some steps leading to soil erosion. increasing population and demand decreasing natural vegetation decreased interception decreased infiltration decreased organic matter increased surface run-off increased soil erosion increased gullying (i) State the meaning of the terms interception, infiltration and surface run-off. interception … … infiltration … … surface run-off … … [3]
Question paper, page 11
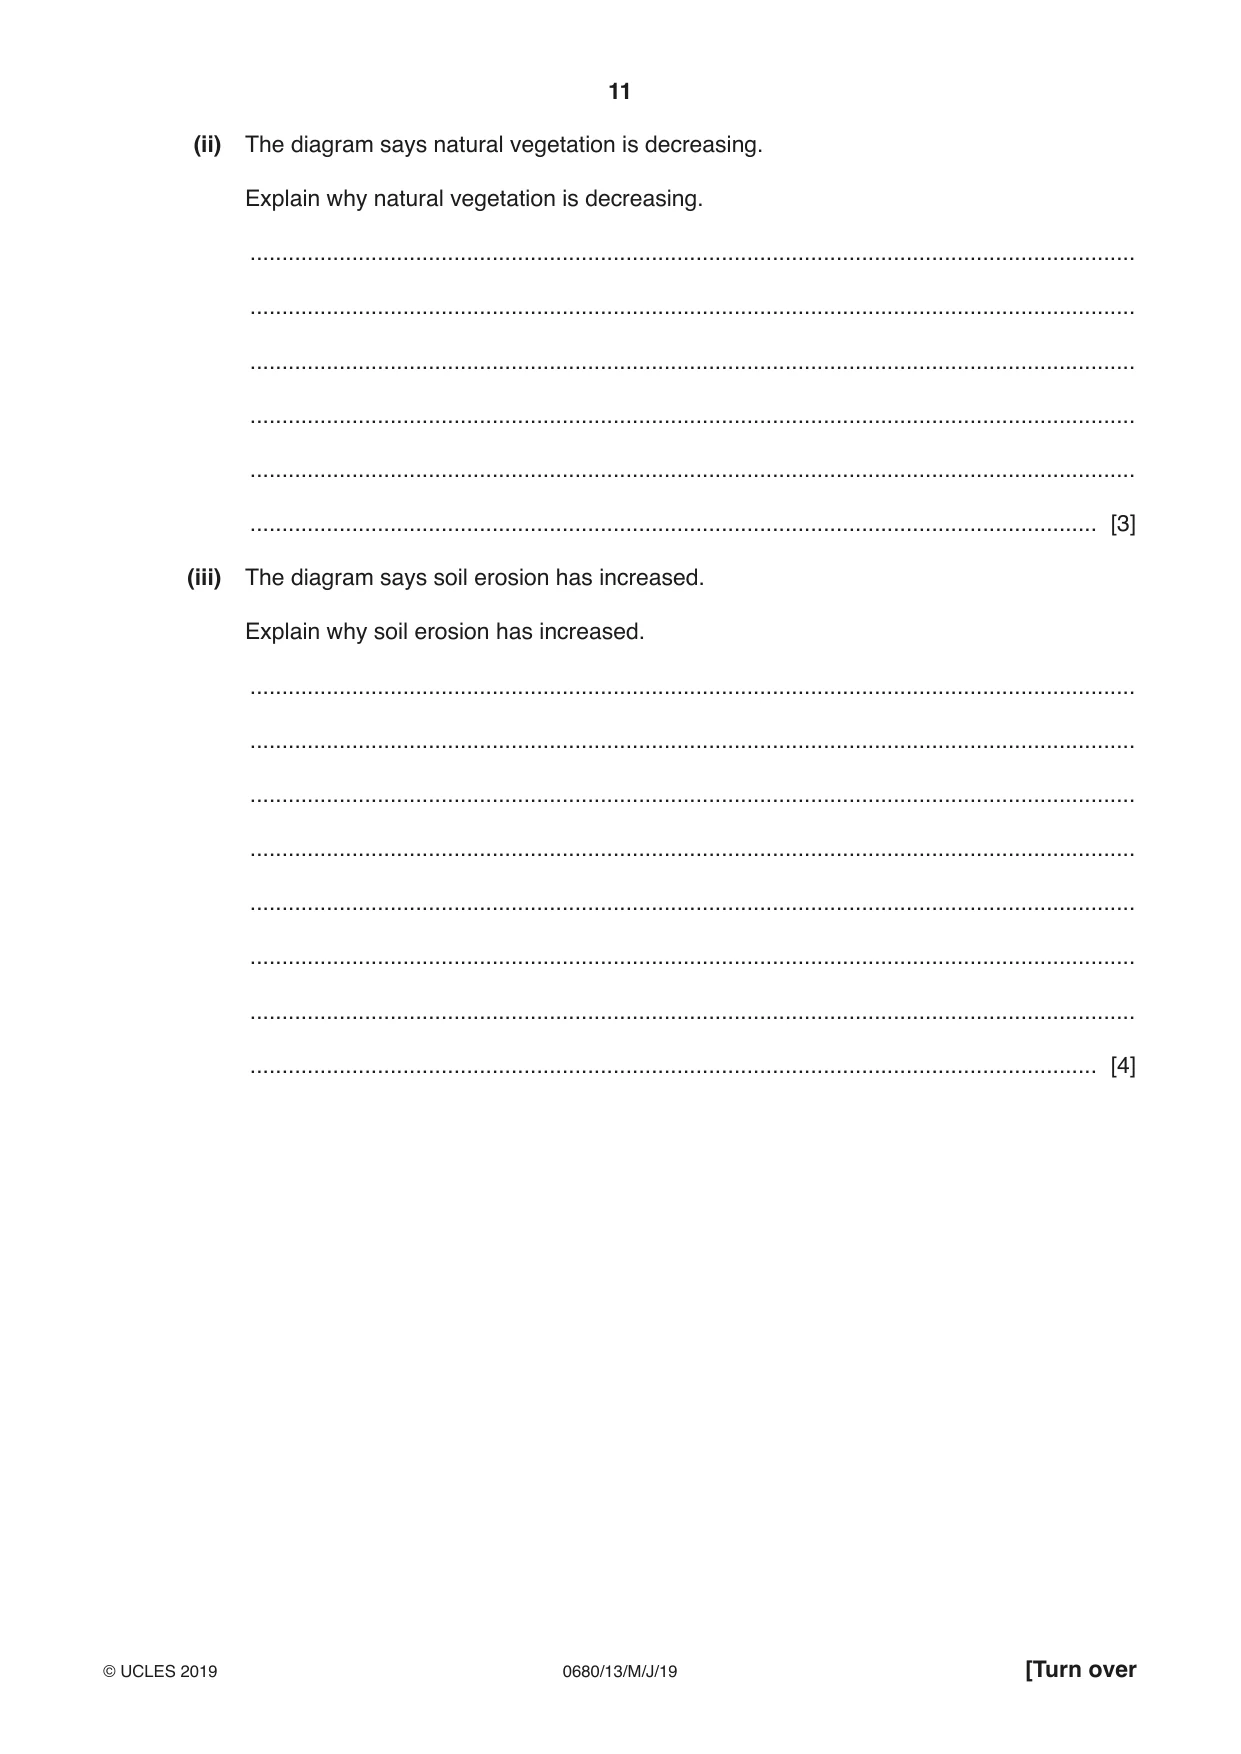
11 0680/13/M/J/19 © UCLES 2019 [Turn over (ii) The diagram says natural vegetation is decreasing. Explain why natural vegetation is decreasing. … … … … … … [3] (iii) The diagram says soil erosion has increased. Explain why soil erosion has increased. … … … … … … … … [4]
Question paper, page 12
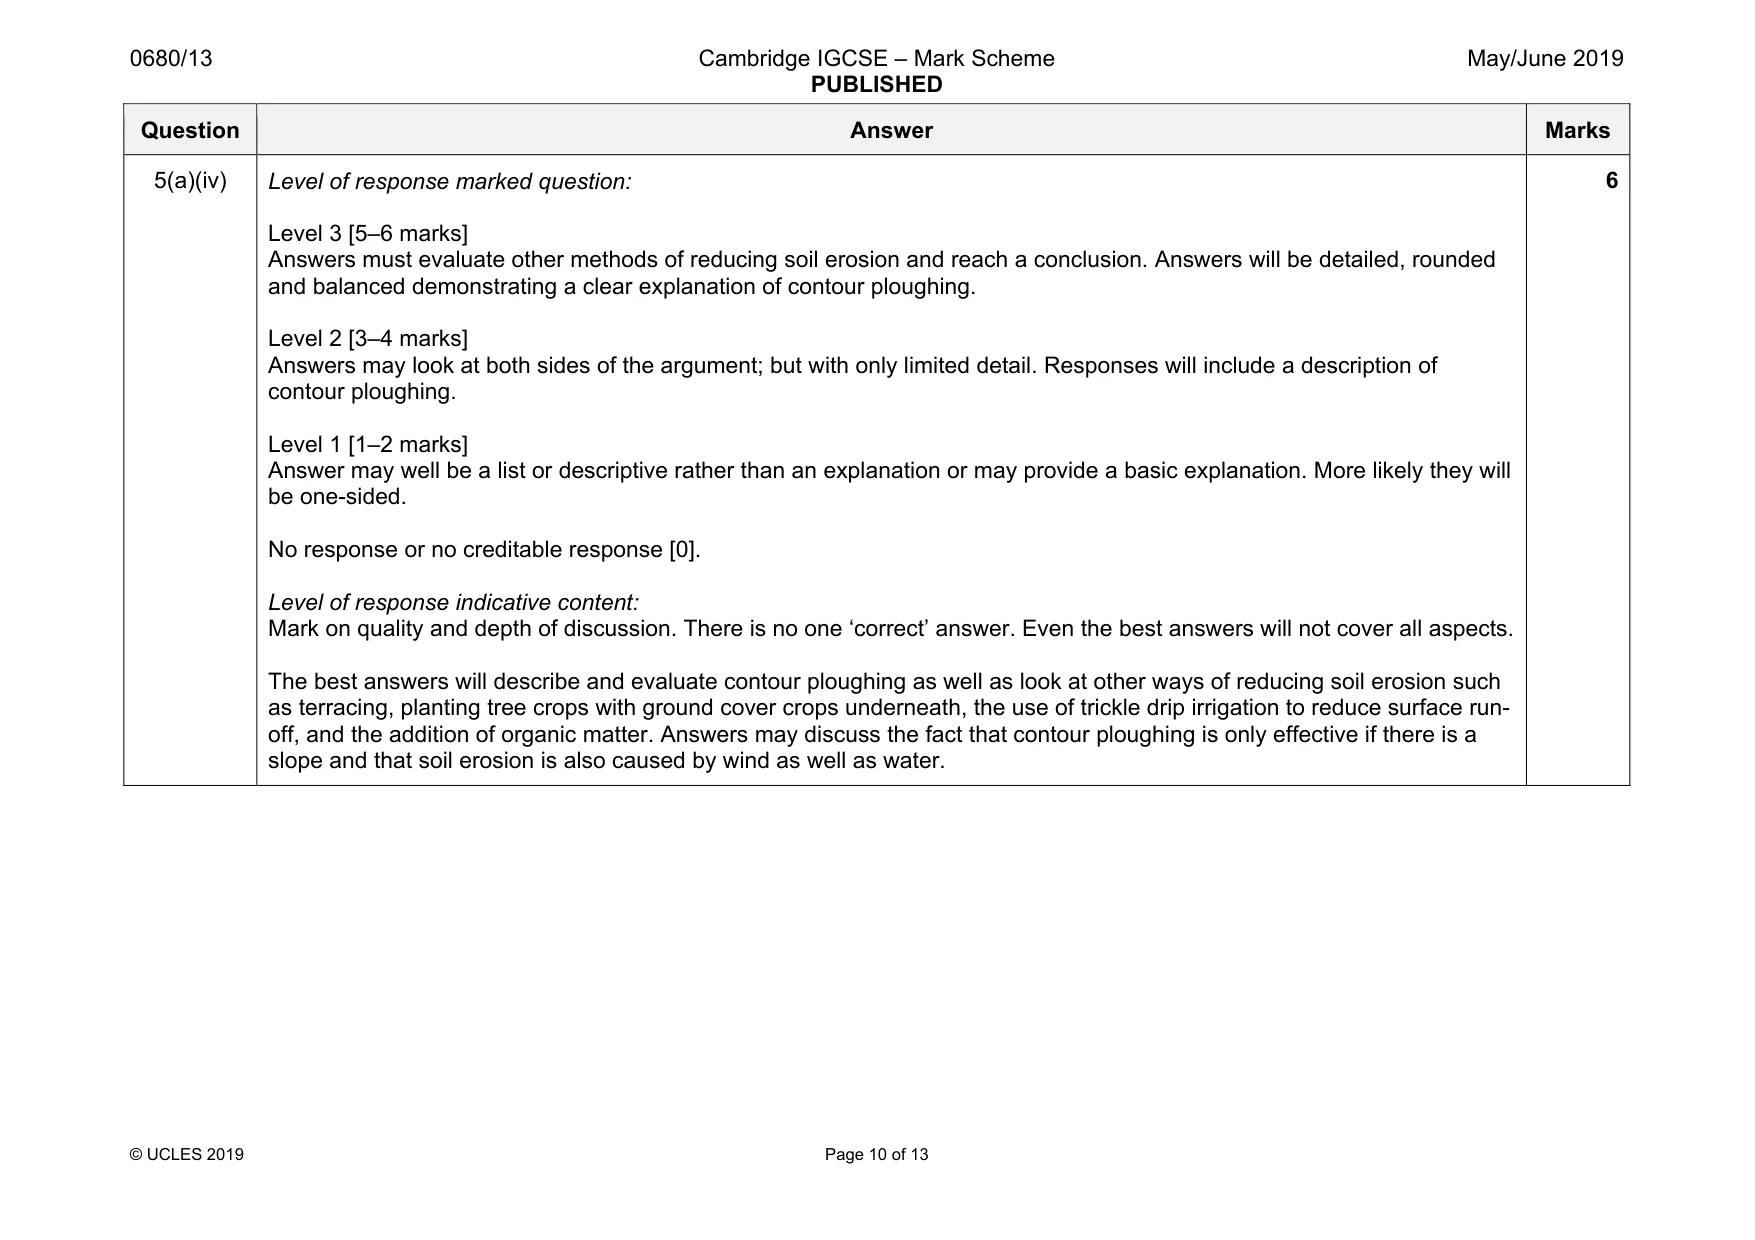
12 0680/13/M/J/19 © UCLES 2019 (iv) ‘Contour ploughing is the best way to reduce soil erosion.’ How far do you agree with this statement? Give reasons for your answer. … … … … … … … … … … … … … … … [6]
Question paper, page 13
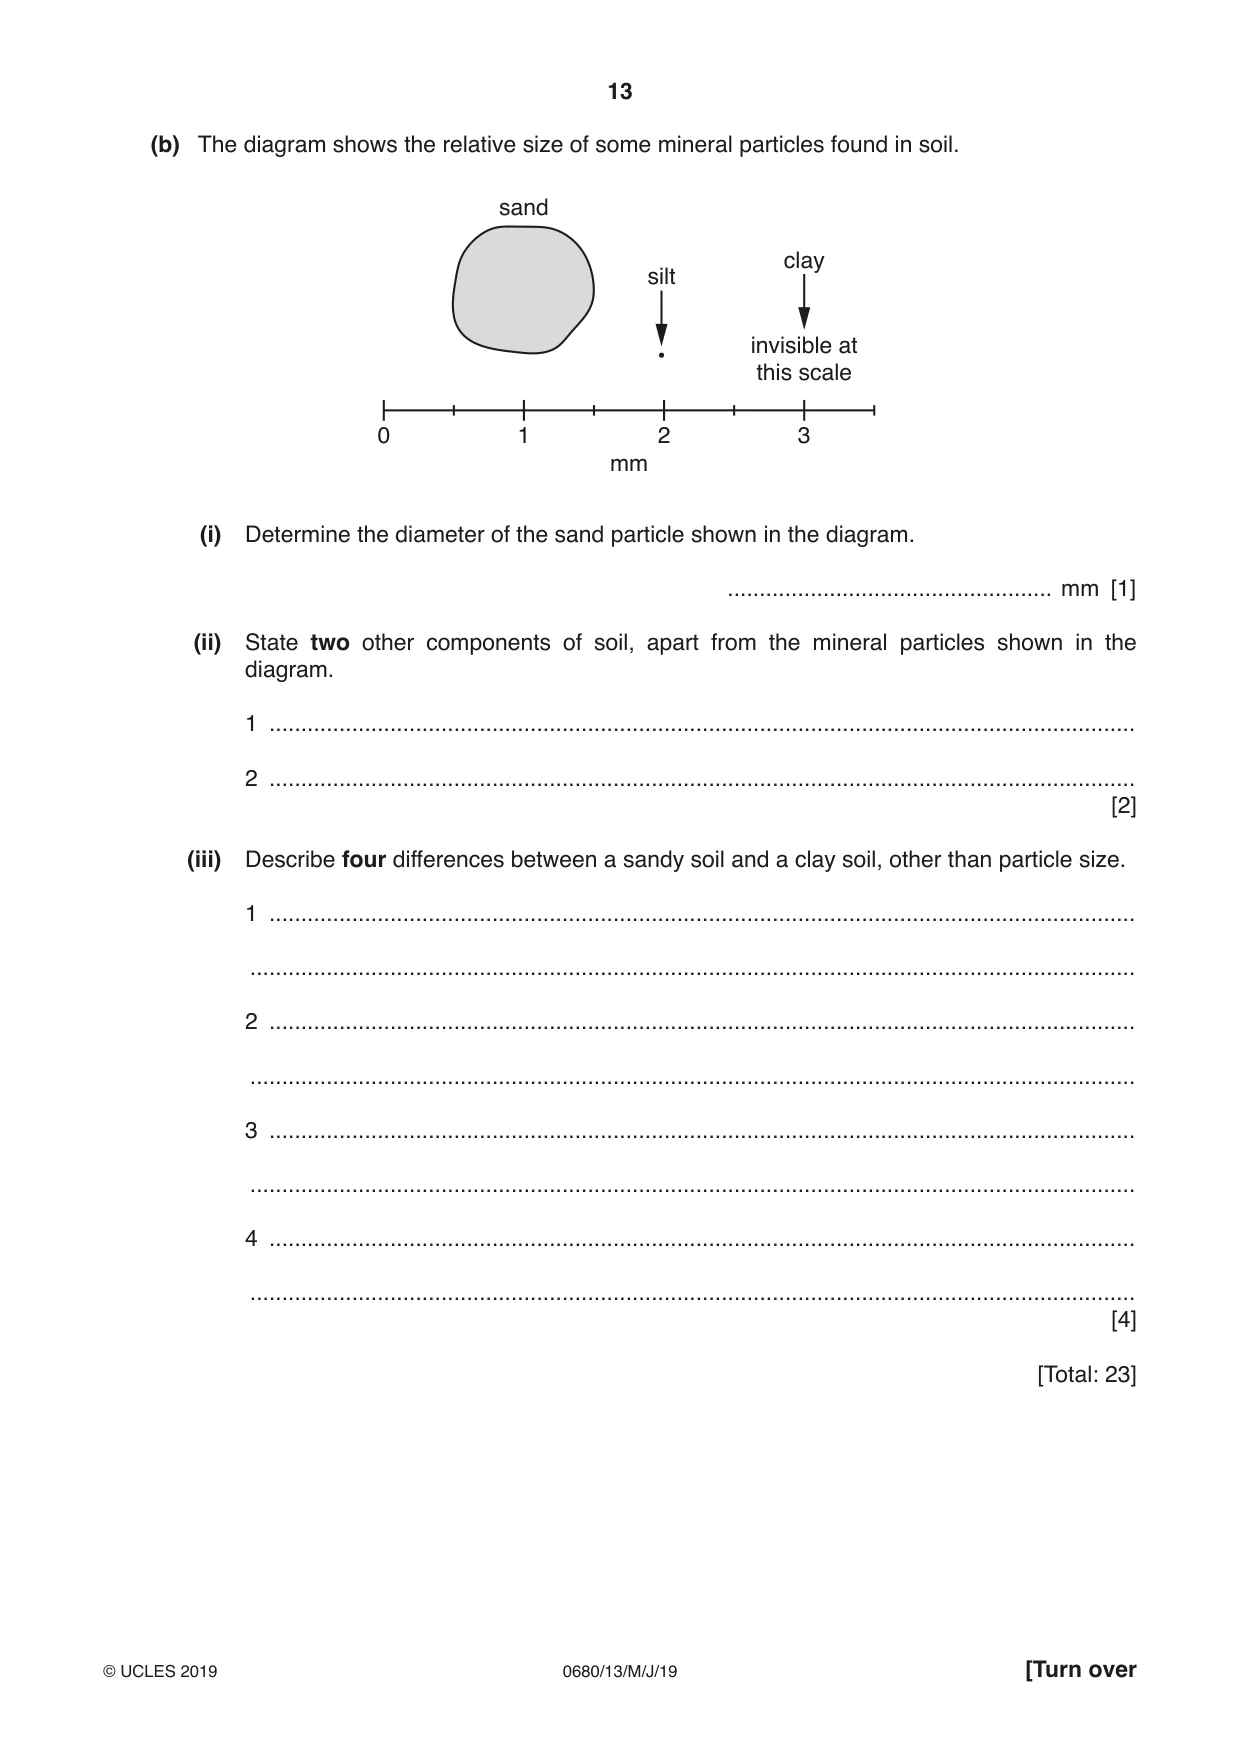
13 0680/13/M/J/19 © UCLES 2019 [Turn over (b) The diagram shows the relative size of some mineral particles found in soil. 3 2 1 mm 0 silt sand clay invisible at this scale (i) Determine the diameter of the sand particle shown in the diagram. … mm [1] (ii) State two other components of soil, apart from the mineral particles shown in the diagram. 1 … 2 … [2] (iii) Describe four differences between a sandy soil and a clay soil, other than particle size. 1 … … 2 … … 3 … … 4 … … [4] [Total: 23]
Question paper, page 14
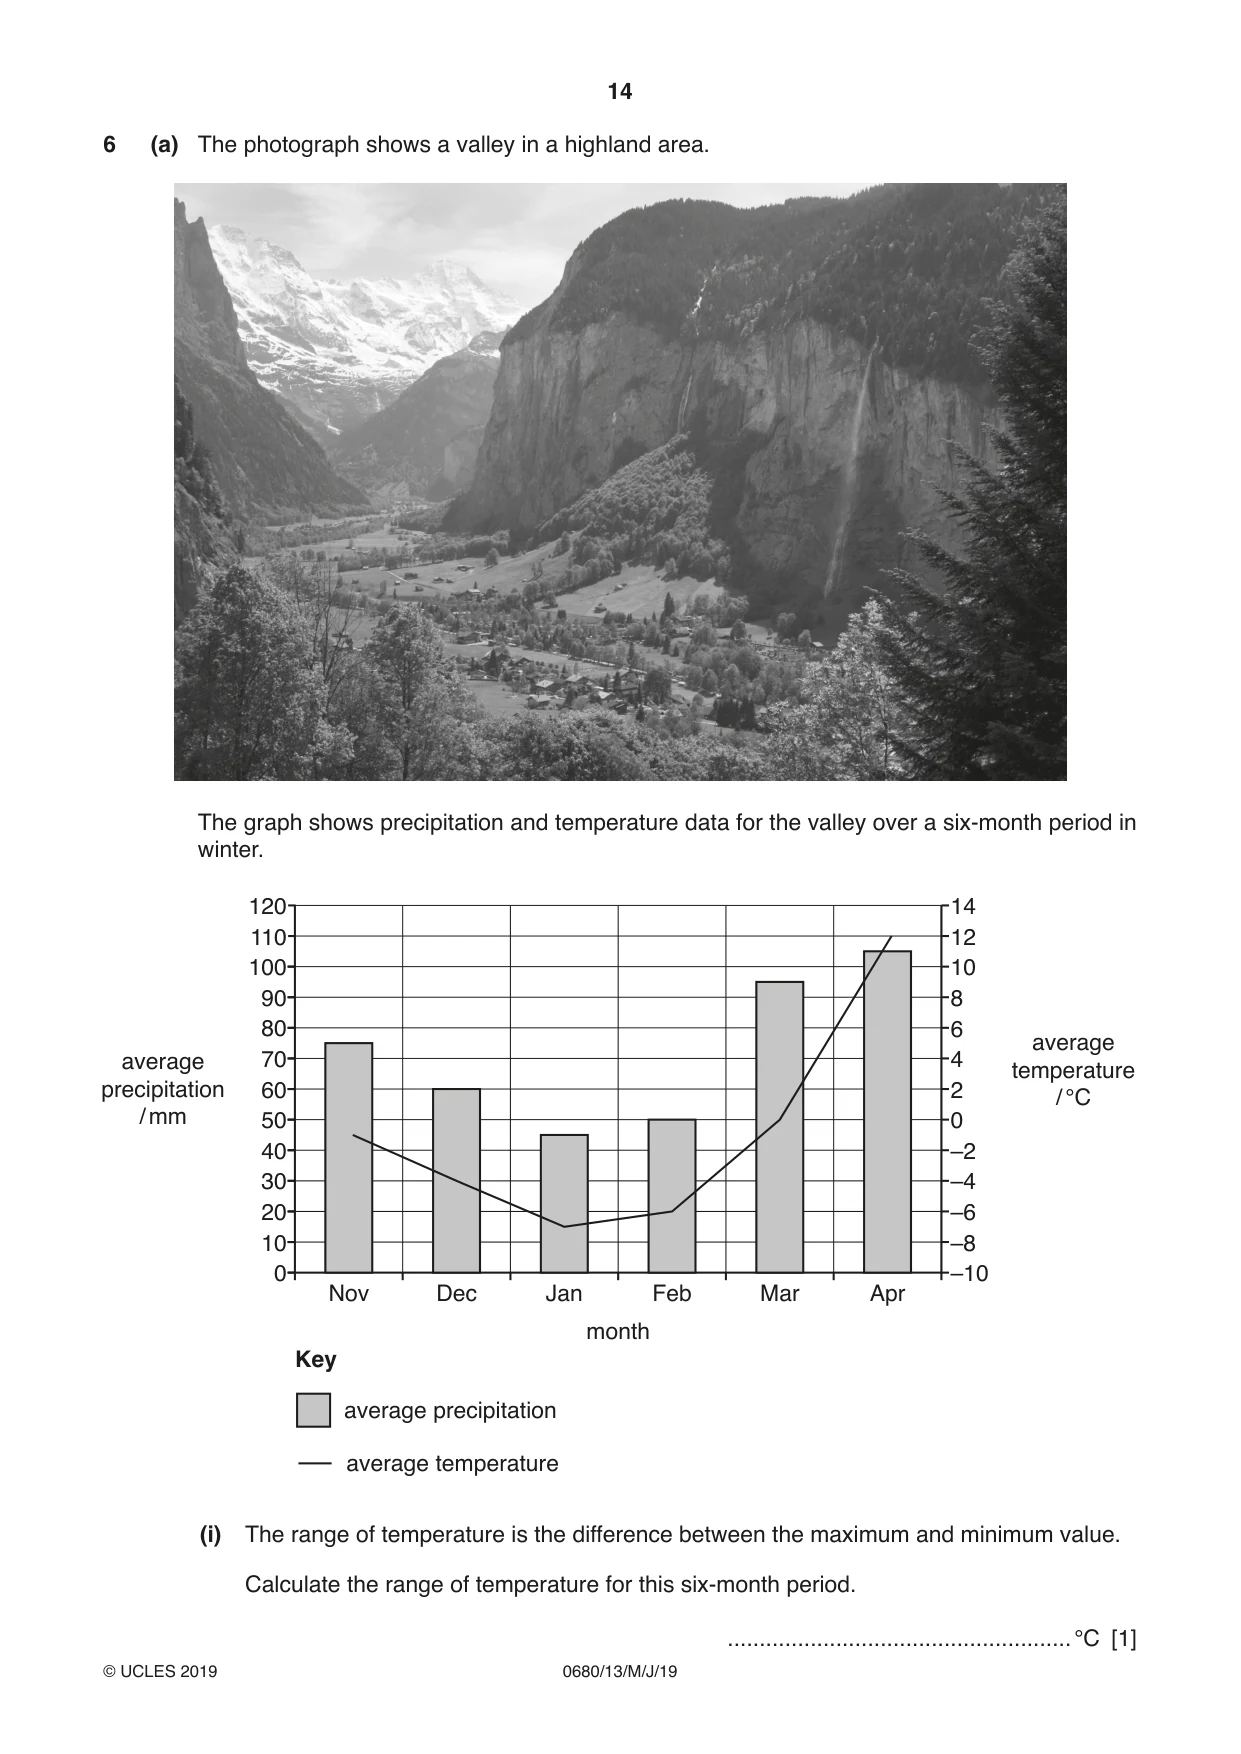
14 0680/13/M/J/19 © UCLES 2019 6 (a) The photograph shows a valley in a highland area. The graph shows precipitation and temperature data for the valley over a six-month period in winter. 100 90 110 120 80 70 60 50 average precipitation / mm average temperature / °C 40 30 20 10 0 Nov Dec Jan month Feb Mar Apr –10 –8 –6 –4 –2 0 2 4 6 8 10 12 14 average precipitation average temperature Key (i) The range of temperature is the difference between the maximum and minimum value. Calculate the range of temperature for this six-month period. … °C [1]
Question paper, page 15
15 0680/13/M/J/19 © UCLES 2019 [Turn over (ii) Using the photograph and the graph, explain why the valley was flooded in April. … … … … … … … … [4] (iii) Suggest three impacts of the flooding on the people living in the valley. 1 … … 2 … … 3 … … [3]
Question paper, page 16
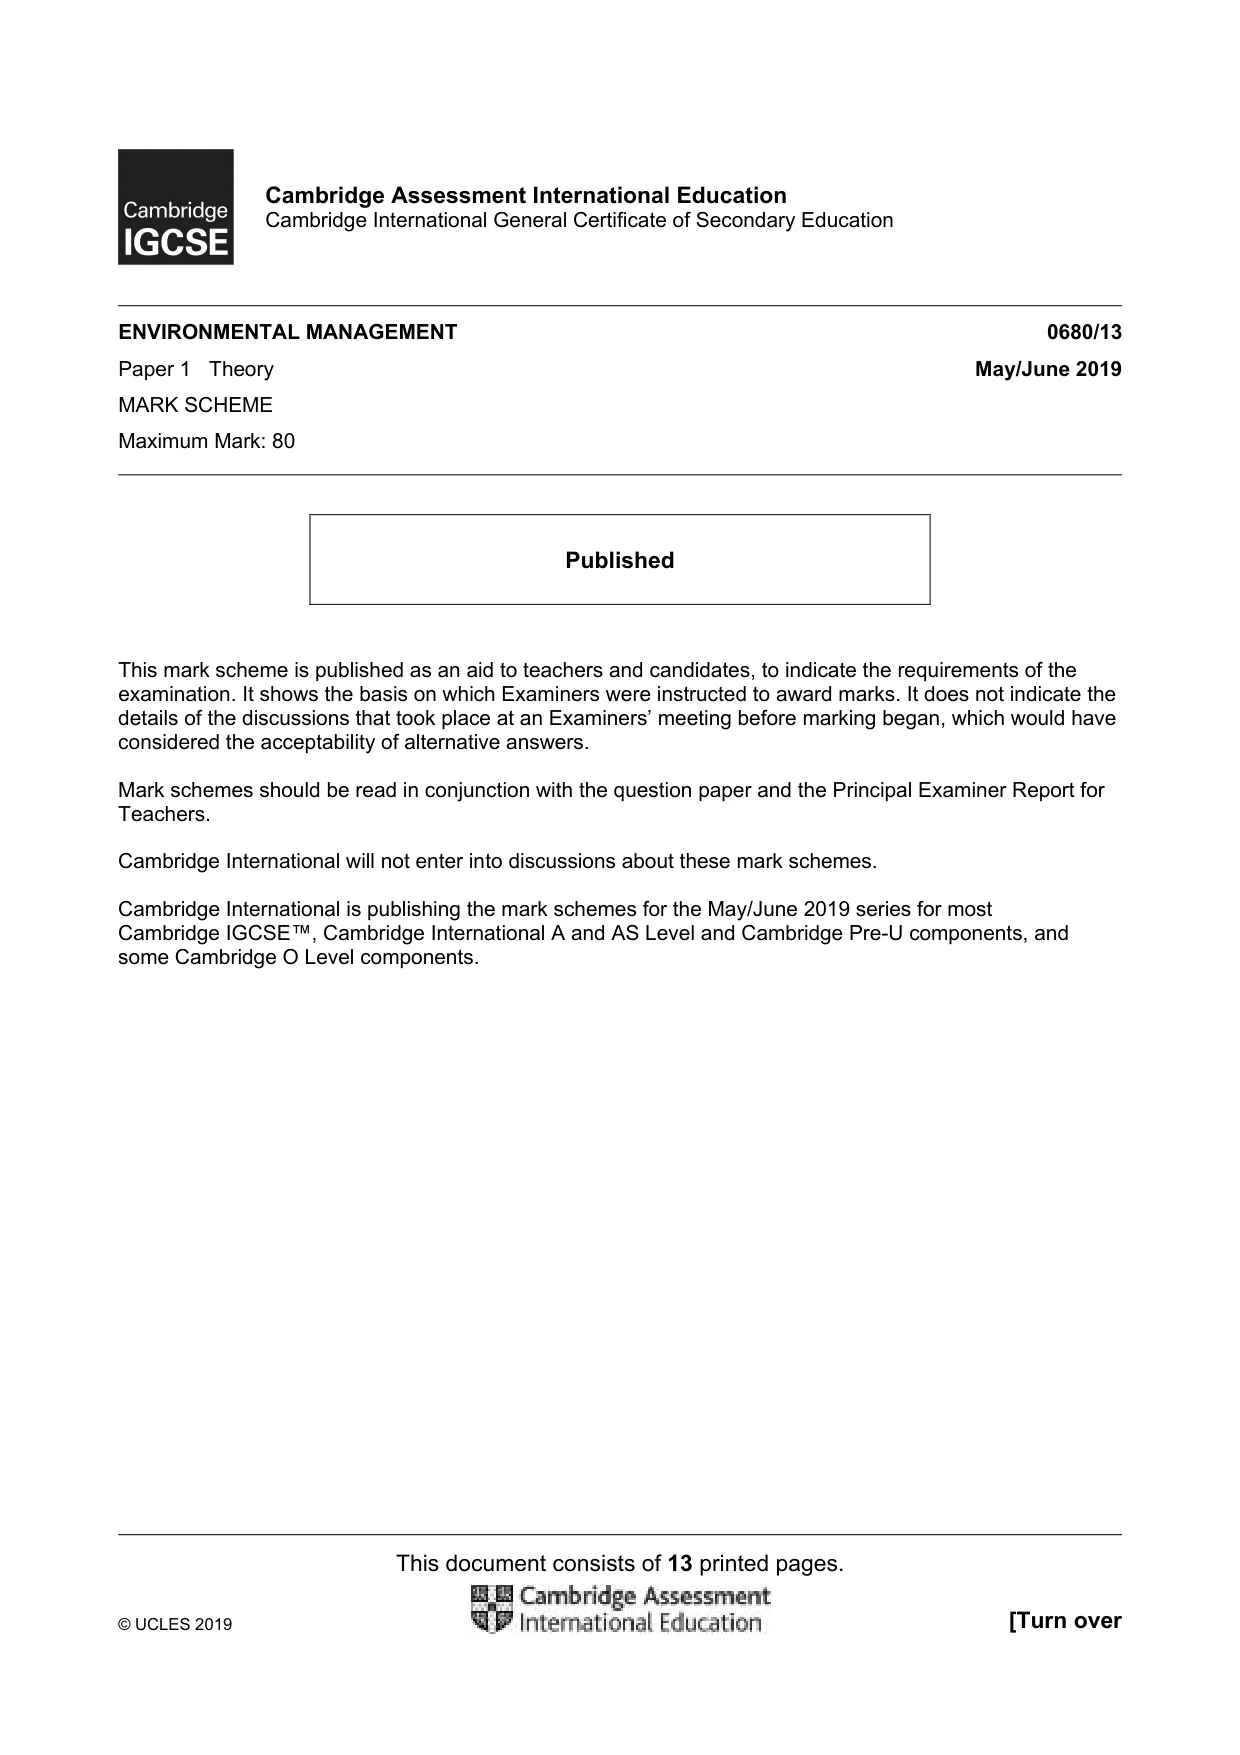
16 0680/13/M/J/19 © UCLES 2019 (b) The graph shows a storm hydrograph. 10 0 0 200 400 600 20 30 day 2 day 1 day 3 day 4 river flow rainfall rainfall / mm per hour river flow / m3 per second (i) State the river flow before the rainfall began. … m3 per second [1] (ii) Describe the river flow during day 2. … … … … [2] (iii) Explain why the highest river flow occurs several hours after the highest rainfall. … … … … … … [3]
Question paper, page 17
17 0680/13/M/J/19 © UCLES 2019 (iv) Describe three flood management techniques that could be used to reduce the flood risk. 1 … … 2 … … 3 … … [3] [Total: 17]
Question paper, page 18
18 0680/13/M/J/19 © UCLES 2019 BLANK PAGE
Question paper, page 19
19 0680/13/M/J/19 © UCLES 2019 BLANK PAGE
Question paper, page 20
20 0680/13/M/J/19 © UCLES 2019 Permission to reproduce items where third-party owned material protected by copyright is included has been sought and cleared where possible. Every reasonable effort has been made by the publisher (UCLES) to trace copyright holders, but if any items requiring clearance have unwittingly been included, the publisher will be pleased to make amends at the earliest possible opportunity. To avoid the issue of disclosure of answer-related information to candidates, all copyright acknowledgements are reproduced online in the Cambridge Assessment International Education Copyright Acknowledgements Booklet. This is produced for each series of examinations and is freely available to download at www.cambridgeinternational.org after the live examination series. Cambridge Assessment International Education is part of the Cambridge Assessment Group. Cambridge Assessment is the brand name of the University of Cambridge Local Examinations Syndicate (UCLES), which itself is a department of the University of Cambridge. BLANK PAGE
Mark scheme, page 1
This document consists of 13 printed pages. © UCLES 2019 [Turn over Cambridge Assessment International Education Cambridge International General Certificate of Secondary Education ENVIRONMENTAL MANAGEMENT 0680/13 Paper 1 Theory May/June 2019 MARK SCHEME Maximum Mark: 80 Published This mark scheme is published as an aid to teachers and candidates, to indicate the requirements of the examination. It shows the basis on which Examiners were instructed to award marks. It does not indicate the details of the discussions that took place at an Examiners’ meeting before marking began, which would have considered the acceptability of alternative answers. Mark schemes should be read in conjunction with the question paper and the Principal Examiner Report for Teachers. Cambridge International will not enter into discussions about these mark schemes. Cambridge International is publishing the mark schemes for the May/June 2019 series for most Cambridge IGCSE™, Cambridge International A and AS Level and Cambridge Pre-U components, and some Cambridge O Level components.
Mark scheme, page 2
0680/13 Cambridge IGCSE – Mark Scheme PUBLISHED May/June 2019 © UCLES 2019 Page 2 of 13 Generic Marking Principles These general marking principles must be applied by all examiners when marking candidate answers. They should be applied alongside the specific content of the mark scheme or generic level descriptors for a question. Each question paper and mark scheme will also comply with these marking principles. GENERIC MARKING PRINCIPLE 1: Marks must be awarded in line with: • the specific content of the mark scheme or the generic level descriptors for the question • the specific skills defined in the mark scheme or in the generic level descriptors for the question • the standard of response required by a candidate as exemplified by the standardisation scripts. GENERIC MARKING PRINCIPLE 2: Marks awarded are always whole marks (not half marks, or other fractions). GENERIC MARKING PRINCIPLE 3: Marks must be awarded positively: • marks are awarded for correct/valid answers, as defined in the mark scheme. However, credit is given for valid answers which go beyond the scope of the syllabus and mark scheme, referring to your Team Leader as appropriate • marks are awarded when candidates clearly demonstrate what they know and can do • marks are not deducted for errors • marks are not deducted for omissions • answers should only be judged on the quality of spelling, punctuation and grammar when these features are specifically assessed by the question as indicated by the mark scheme. The meaning, however, should be unambiguous. GENERIC MARKING PRINCIPLE 4: Rules must be applied consistently e.g. in situations where candidates have not followed instructions or in the application of generic level descriptors.
Mark scheme, page 3
0680/13 Cambridge IGCSE – Mark Scheme PUBLISHED May/June 2019 © UCLES 2019 Page 3 of 13 GENERIC MARKING PRINCIPLE 5: Marks should be awarded using the full range of marks defined in the mark scheme for the question (however; the use of the full mark range may be limited according to the quality of the candidate responses seen). GENERIC MARKING PRINCIPLE 6: Marks awarded are based solely on the requirements as defined in the mark scheme. Marks should not be awarded with grade thresholds or grade descriptors in mind.
Mark scheme, page 4
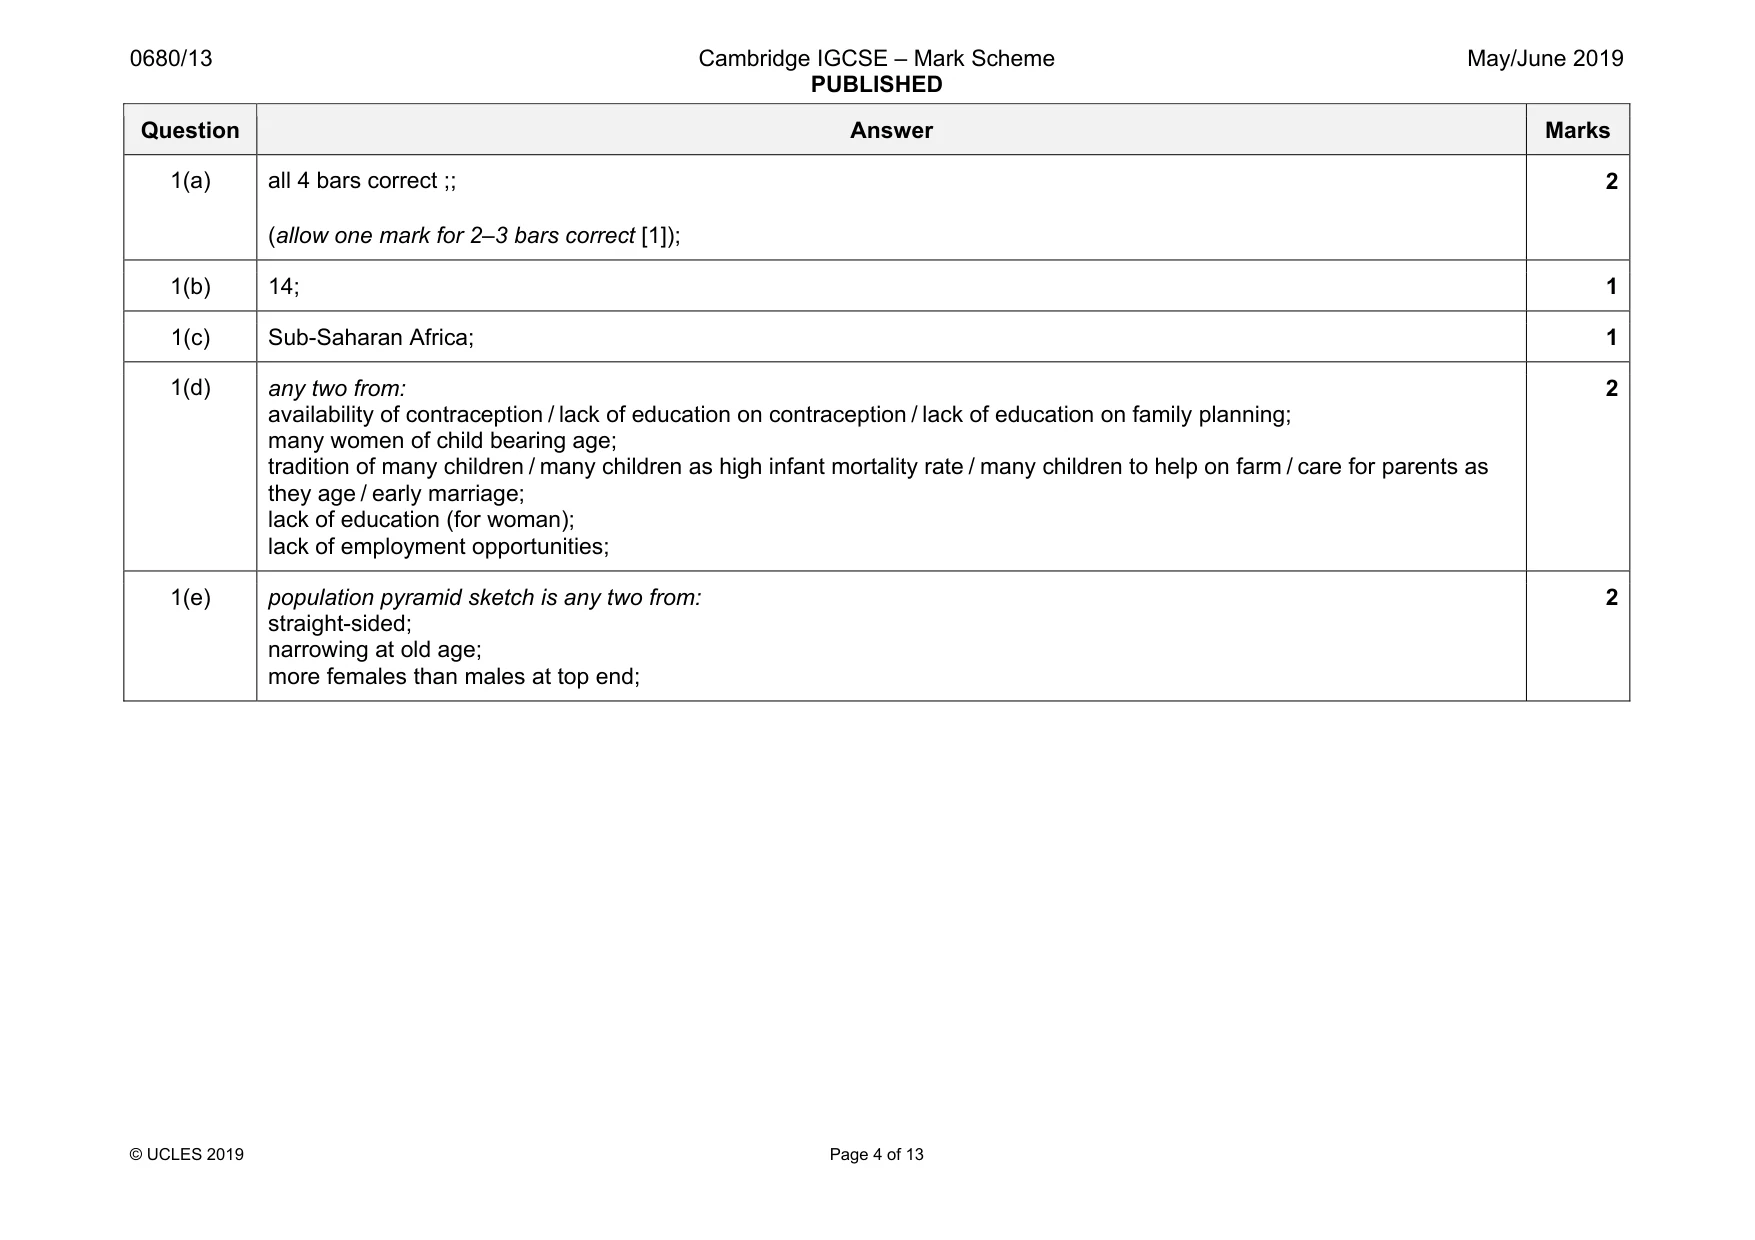
0680/13 Cambridge IGCSE – Mark Scheme PUBLISHED May/June 2019 © UCLES 2019 Page 4 of 13 Question Answer Marks 1(a) all 4 bars correct ;; (allow one mark for 2–3 bars correct [1]); 2 1(b) 14; 1 1(c) Sub-Saharan Africa; 1 1(d) any two from: availability of contraception / lack of education on contraception / lack of education on family planning; many women of child bearing age; tradition of many children / many children as high infant mortality rate / many children to help on farm / care for parents as they age / early marriage; lack of education (for woman); lack of employment opportunities; 2 1(e) population pyramid sketch is any two from: straight-sided; narrowing at old age; more females than males at top end; 2
Mark scheme, page 5
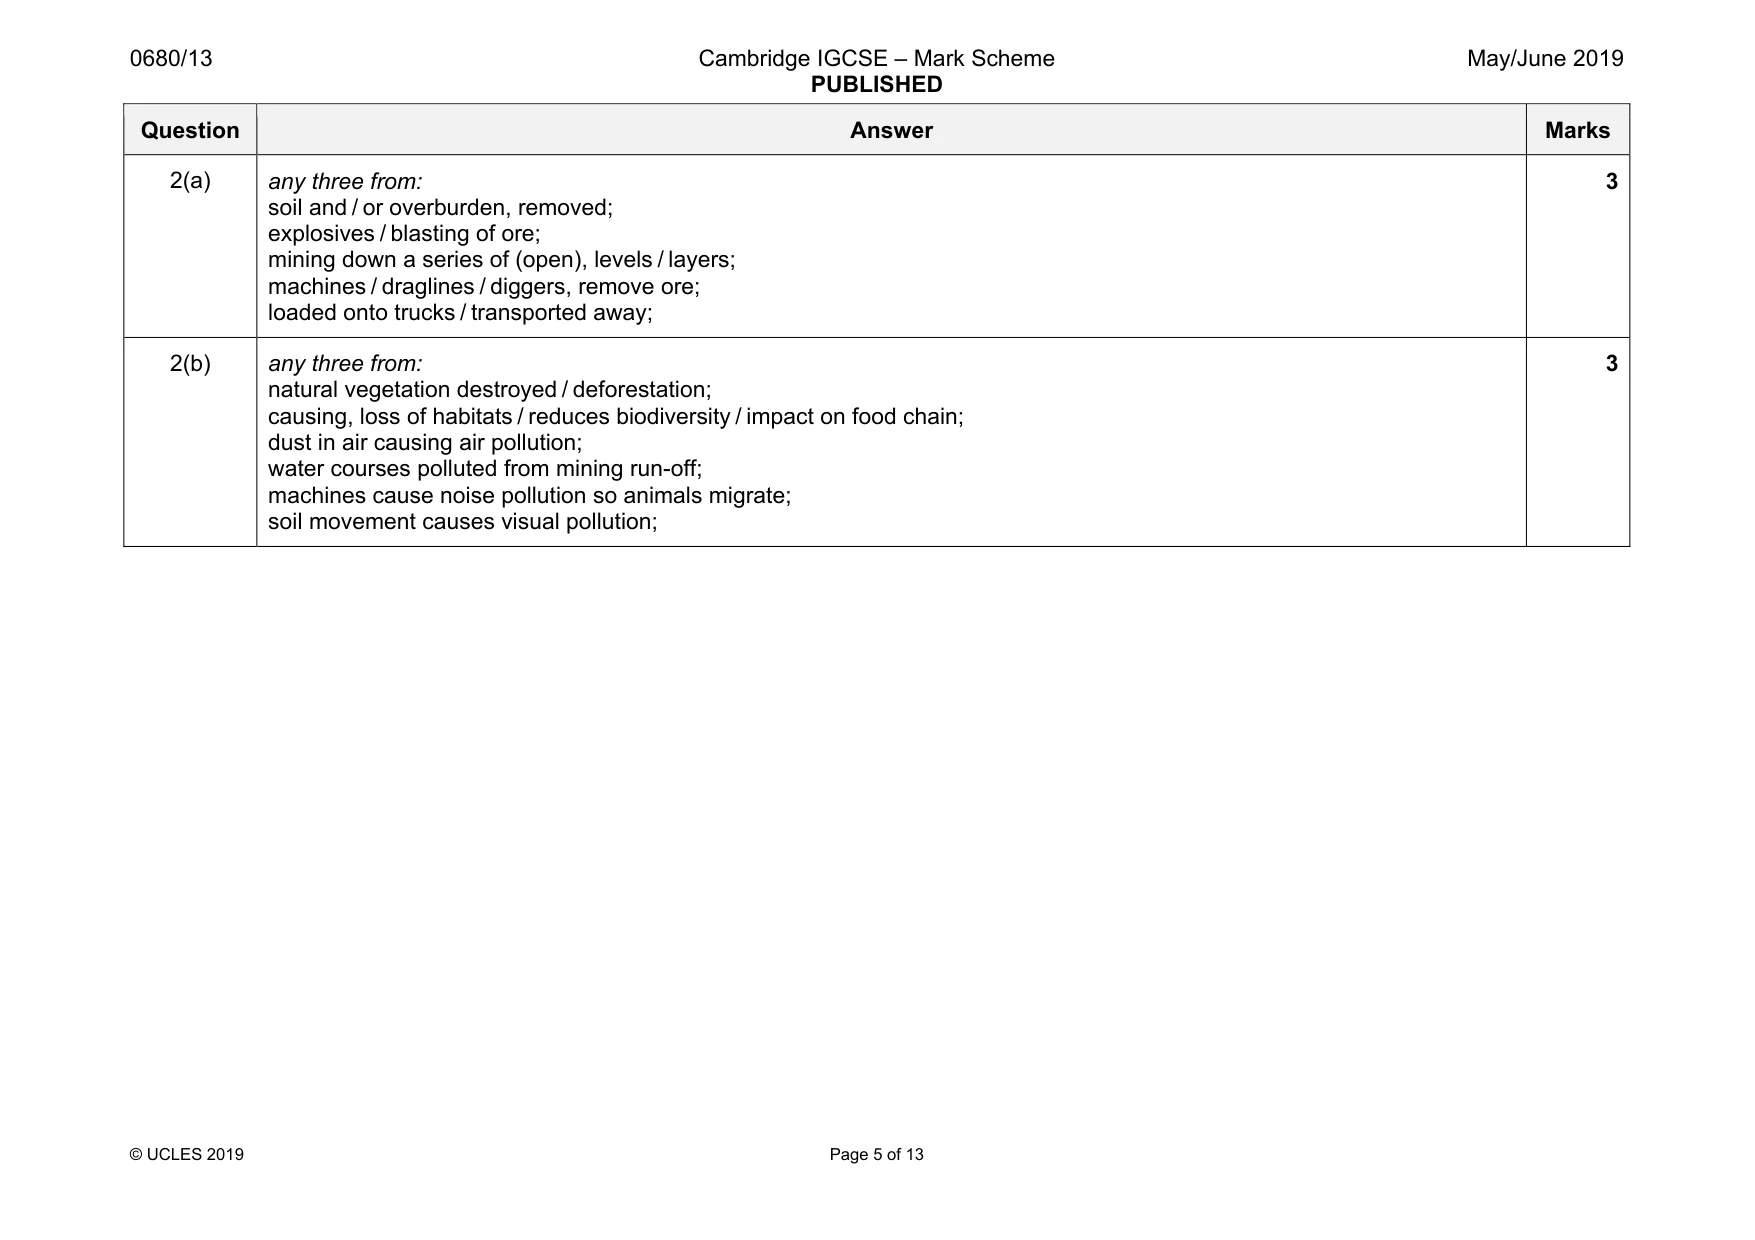
0680/13 Cambridge IGCSE – Mark Scheme PUBLISHED May/June 2019 © UCLES 2019 Page 5 of 13 Question Answer Marks 2(a) any three from: soil and / or overburden, removed; explosives / blasting of ore; mining down a series of (open), levels / layers; machines / draglines / diggers, remove ore; loaded onto trucks / transported away; 3 2(b) any three from: natural vegetation destroyed / deforestation; causing, loss of habitats / reduces biodiversity / impact on food chain; dust in air causing air pollution; water courses polluted from mining run-off; machines cause noise pollution so animals migrate; soil movement causes visual pollution; 3
Mark scheme, page 6
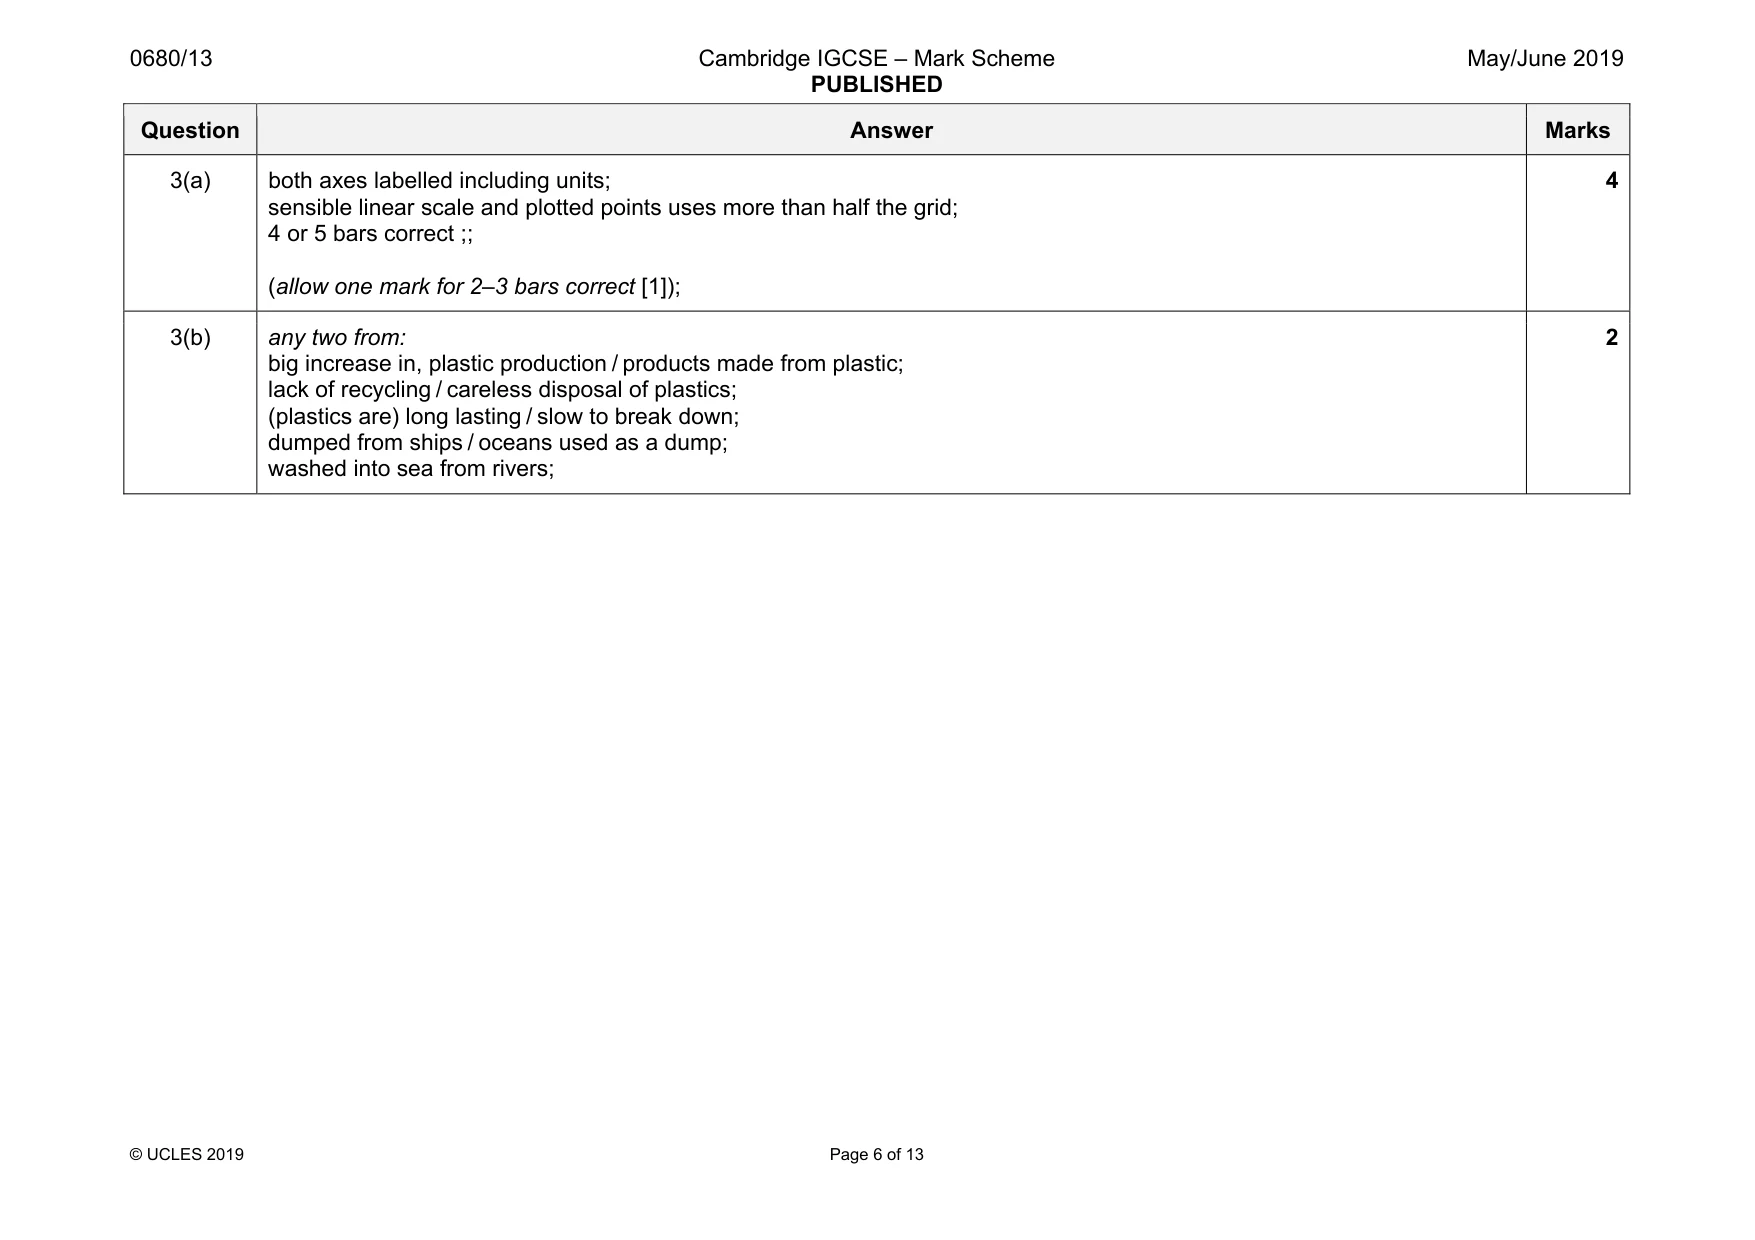
0680/13 Cambridge IGCSE – Mark Scheme PUBLISHED May/June 2019 © UCLES 2019 Page 6 of 13 Question Answer Marks 3(a) both axes labelled including units; sensible linear scale and plotted points uses more than half the grid; 4 or 5 bars correct ;; (allow one mark for 2–3 bars correct [1]); 4 3(b) any two from: big increase in, plastic production / products made from plastic; lack of recycling / careless disposal of plastics; (plastics are) long lasting / slow to break down; dumped from ships / oceans used as a dump; washed into sea from rivers; 2
Mark scheme, page 7
0680/13 Cambridge IGCSE – Mark Scheme PUBLISHED May/June 2019 © UCLES 2019 Page 7 of 13 Question Answer Marks 4(a)(i) 1155 × 1012; 1 4(a)(ii) any two from: increase in population; increase in wealth; so more electrical goods, purchased / used; more, houses / industry; 2 4(a)(iii) in 1984, but not in 2014 oil; in 2014, but not in 1984 wind; 2 4(a)(iv) (391 / 180 × 100 =) 217(.2) ;; (if answer incorrect allow one mark for, 571 – 180 = 391 [1]); 2 4(a)(v) any three from: they do not produce carbon dioxide; which is a greenhouse gas; (international) agreement to decrease greenhouse gas emissions; price of oil has increased; fossil fuels produce gases that cause acid rain; renewable energy technology more available; (have become) more efficient; incentive schemes from governments; change in public awareness / interest, in environmental issues; 3 4(a)(vi) any two from: solar; tidal; waves; geothermal; biofuels; 2
Mark scheme, page 8
0680/13 Cambridge IGCSE – Mark Scheme PUBLISHED May/June 2019 © UCLES 2019 Page 8 of 13 Question Answer Marks 4(a)(vii) any three from: water from / through, dam; water flows; turns a turbine; which turns the generator (generating electricity); 3 4(b) opinion based on any five evidence: ways of reducing domestic energy use: insulation; energy efficient devices; switching off devices when not being used; generating own electricity through, e.g. solar, wind; (reducing domestic energy use is) effective if widespread uptake; (however) industry is also a large user of electricity; (industry) uses large machinery; reducing electricity consumption needs improving by: promoting energy efficiency; developing renewable resources; recycling to cut fuel costs; using rubbish / waste-oil, to generate electricity; government legislation; 5
Mark scheme, page 9
0680/13 Cambridge IGCSE – Mark Scheme PUBLISHED May/June 2019 © UCLES 2019 Page 9 of 13 Question Answer Marks 5(a)(i) interception: precipitation that does not reach the soil, but is instead intercepted by the leaves and branches of plants; infiltration: the process by which precipitation / water, soaks into soils; surface run-off: water (from rainfall / snowmelt) that flows over the ground; 3 5(a)(ii) any three from: increase in population means an increase in demand for food; so, increased need for arable land; increased need for grazing land; increased demand for wood; urbanisation; uses (of land), such as mining / HEP / roads / industry / infrastructure; 3 5(a)(iii) any four from: fewer plants / roots, to bind soil; with less vegetation more water reaches ground; less vegetation to take water from soil through roots; so more surface run-off; soil dried by the Sun; so blown away by the wind; less vegetation to act as a wind break; 4
Mark scheme, page 10
0680/13 Cambridge IGCSE – Mark Scheme PUBLISHED May/June 2019 © UCLES 2019 Page 10 of 13 Question Answer Marks 5(a)(iv) Level of response marked question: Level 3 [5–6 marks] Answers must evaluate other methods of reducing soil erosion and reach a conclusion. Answers will be detailed, rounded and balanced demonstrating a clear explanation of contour ploughing. Level 2 [3–4 marks] Answers may look at both sides of the argument; but with only limited detail. Responses will include a description of contour ploughing. Level 1 [1–2 marks] Answer may well be a list or descriptive rather than an explanation or may provide a basic explanation. More likely they will be one-sided. No response or no creditable response [0]. Level of response indicative content: Mark on quality and depth of discussion. There is no one ‘correct’ answer. Even the best answers will not cover all aspects. The best answers will describe and evaluate contour ploughing as well as look at other ways of reducing soil erosion such as terracing, planting tree crops with ground cover crops underneath, the use of trickle drip irrigation to reduce surface run- off, and the addition of organic matter. Answers may discuss the fact that contour ploughing is only effective if there is a slope and that soil erosion is also caused by wind as well as water. 6
Mark scheme, page 11
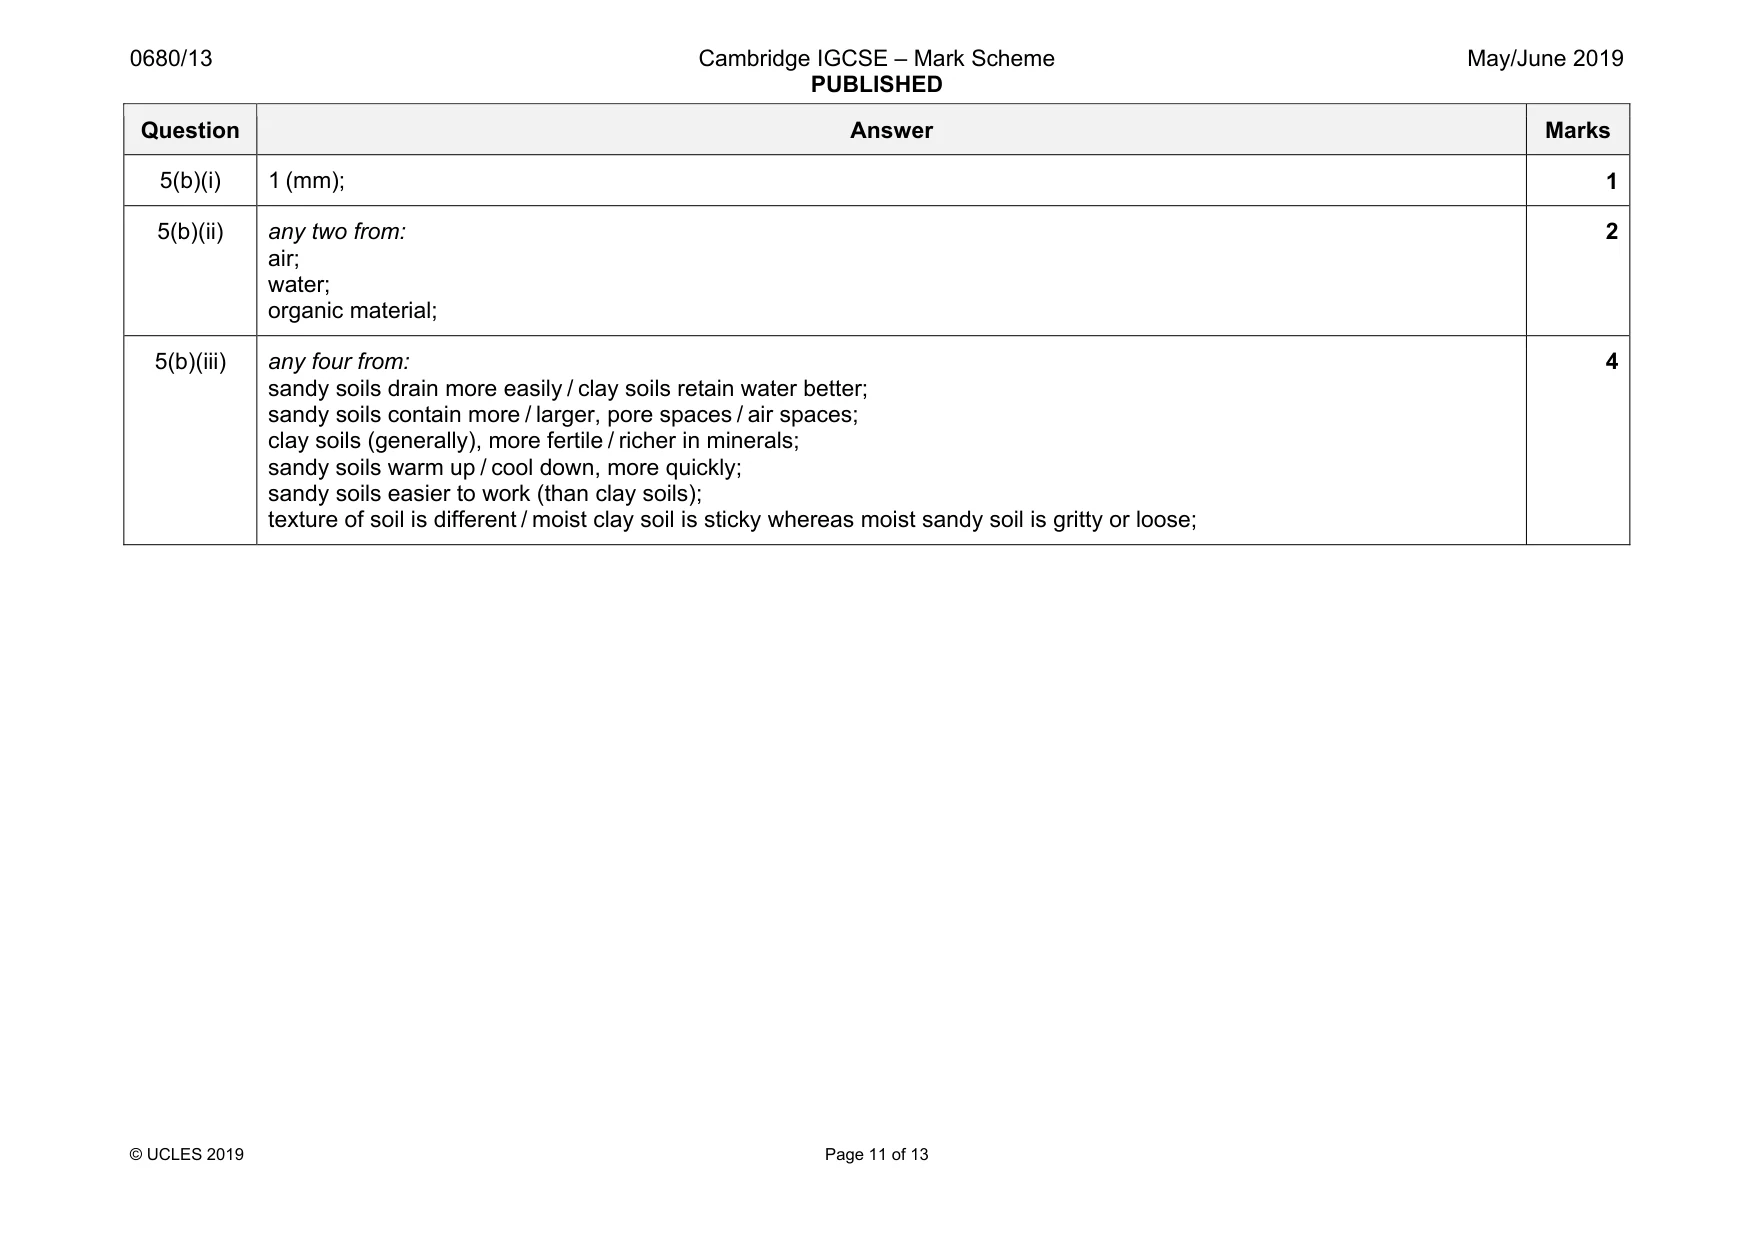
0680/13 Cambridge IGCSE – Mark Scheme PUBLISHED May/June 2019 © UCLES 2019 Page 11 of 13 Question Answer Marks 5(b)(i) 1 (mm); 1 5(b)(ii) any two from: air; water; organic material; 2 5(b)(iii) any four from: sandy soils drain more easily / clay soils retain water better; sandy soils contain more / larger, pore spaces / air spaces; clay soils (generally), more fertile / richer in minerals; sandy soils warm up / cool down, more quickly; sandy soils easier to work (than clay soils); texture of soil is different / moist clay soil is sticky whereas moist sandy soil is gritty or loose; 4
Mark scheme, page 12
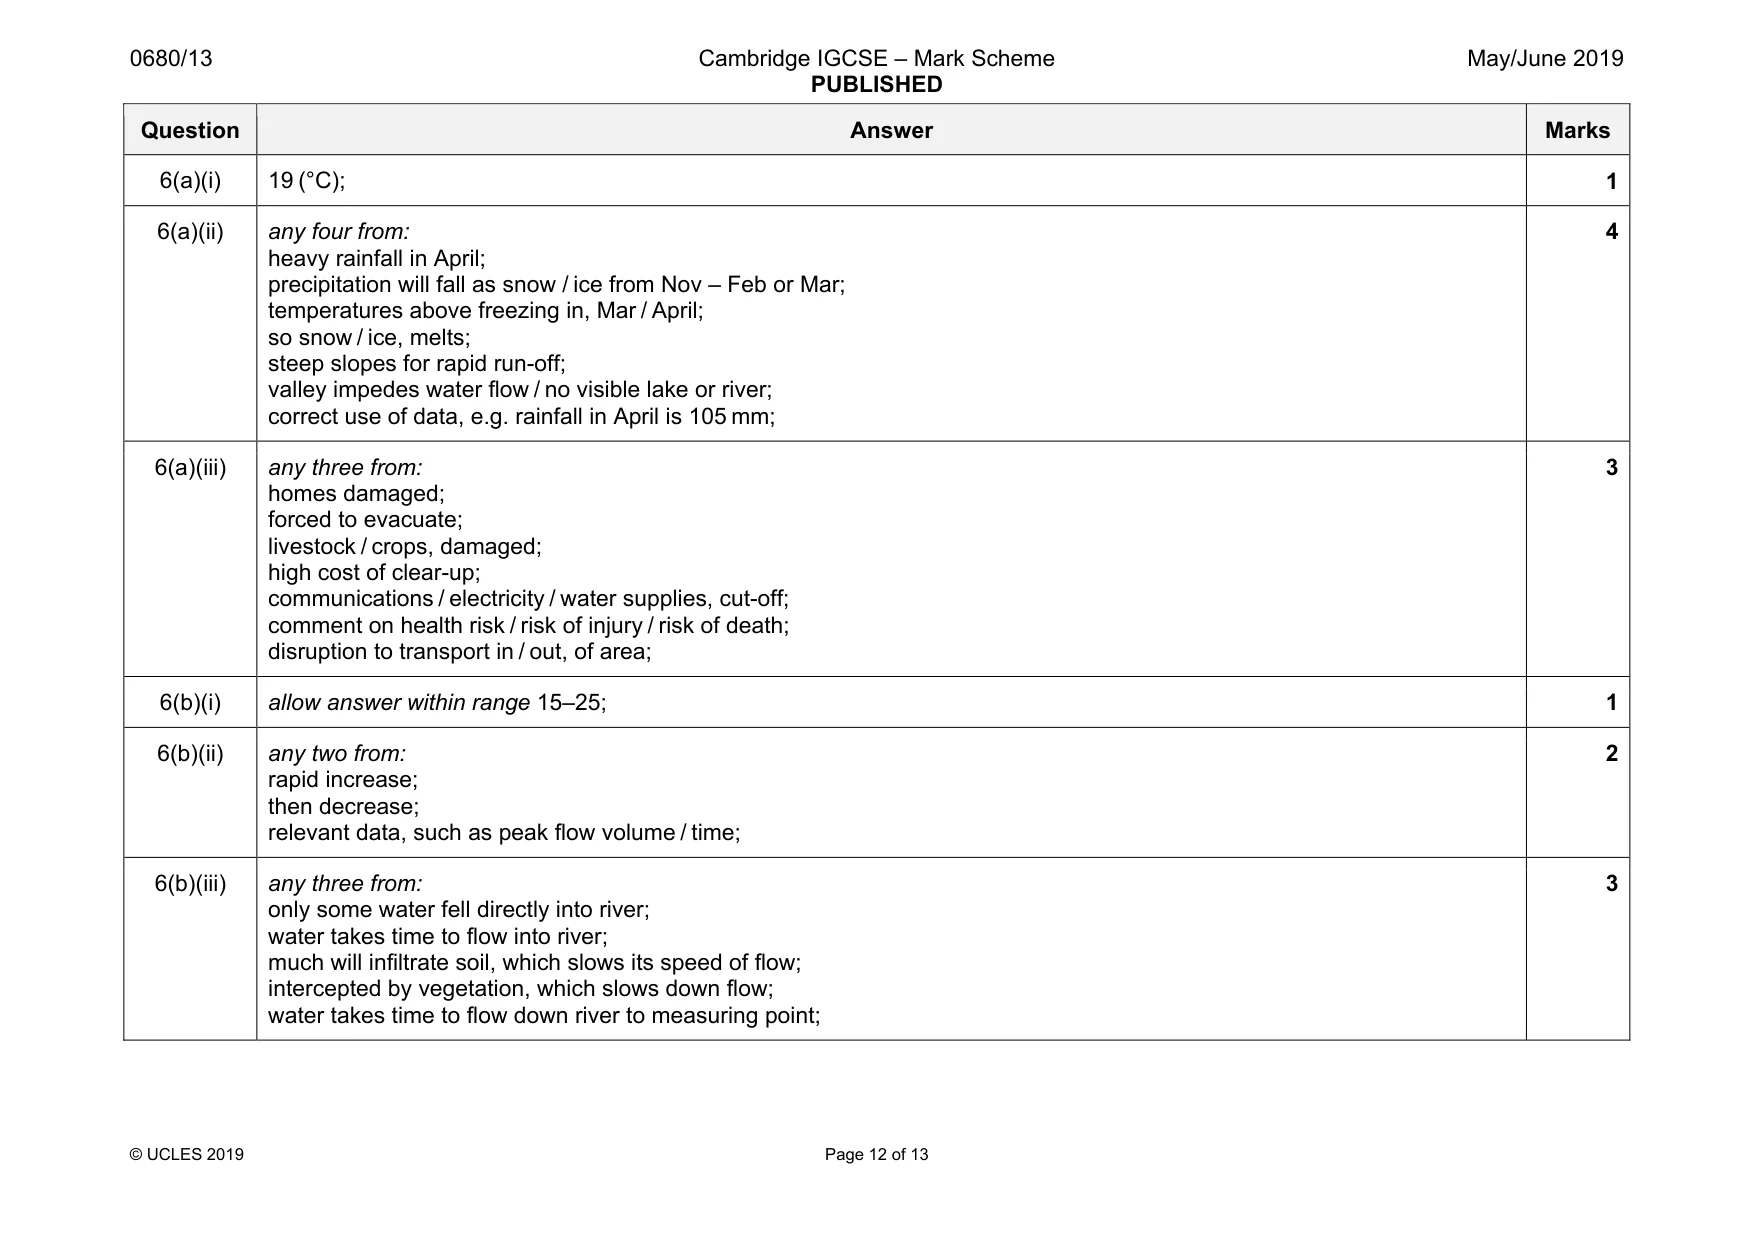
0680/13 Cambridge IGCSE – Mark Scheme PUBLISHED May/June 2019 © UCLES 2019 Page 12 of 13 Question Answer Marks 6(a)(i) 19 (°C); 1 6(a)(ii) any four from: heavy rainfall in April; precipitation will fall as snow / ice from Nov – Feb or Mar; temperatures above freezing in, Mar / April; so snow / ice, melts; steep slopes for rapid run-off; valley impedes water flow / no visible lake or river; correct use of data, e.g. rainfall in April is 105 mm; 4 6(a)(iii) any three from: homes damaged; forced to evacuate; livestock / crops, damaged; high cost of clear-up; communications / electricity / water supplies, cut-off; comment on health risk / risk of injury / risk of death; disruption to transport in / out, of area; 3 6(b)(i) allow answer within range 15–25; 1 6(b)(ii) any two from: rapid increase; then decrease; relevant data, such as peak flow volume / time; 2 6(b)(iii) any three from: only some water fell directly into river; water takes time to flow into river; much will infiltrate soil, which slows its speed of flow; intercepted by vegetation, which slows down flow; water takes time to flow down river to measuring point; 3
Mark scheme, page 13
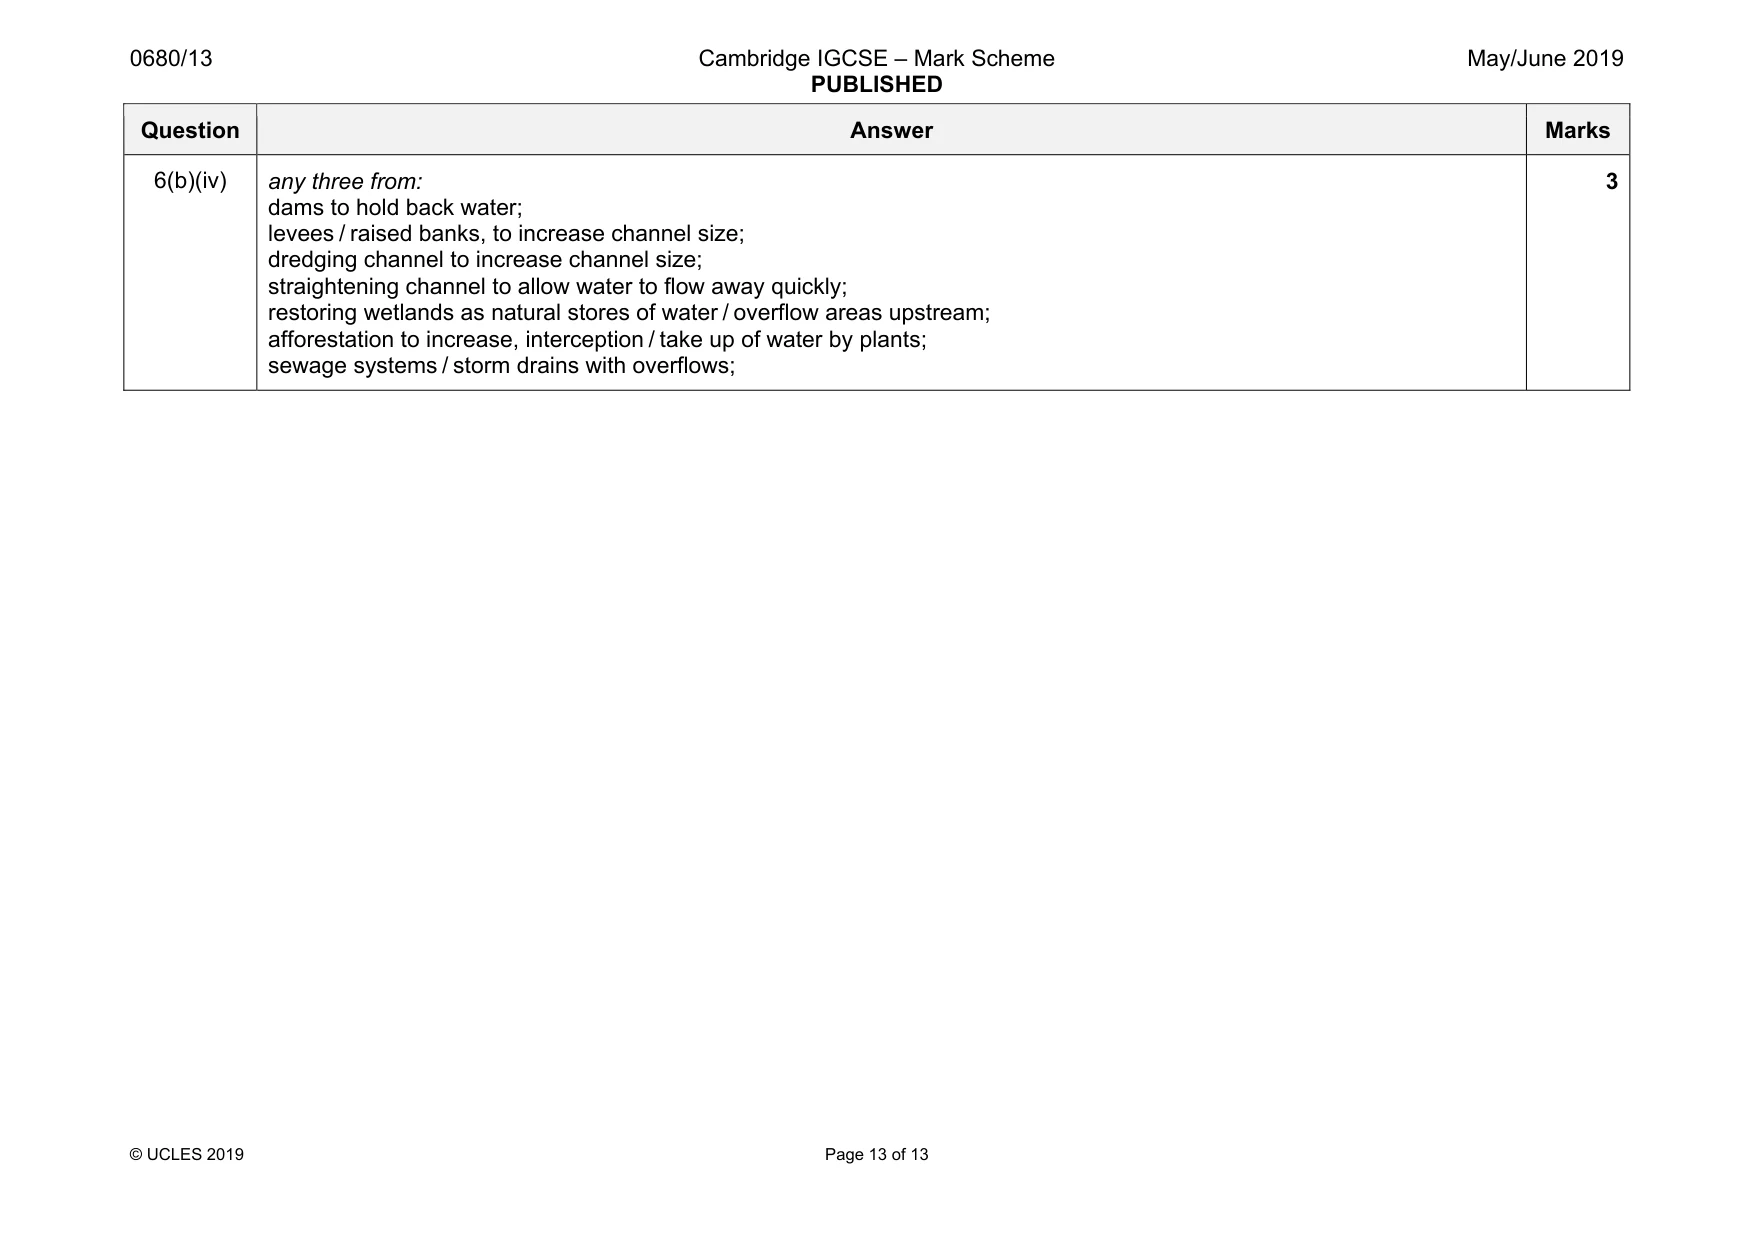
0680/13 Cambridge IGCSE – Mark Scheme PUBLISHED May/June 2019 © UCLES 2019 Page 13 of 13 Question Answer Marks 6(b)(iv) any three from: dams to hold back water; levees / raised banks, to increase channel size; dredging channel to increase channel size; straightening channel to allow water to flow away quickly; restoring wetlands as natural stores of water / overflow areas upstream; afforestation to increase, interception / take up of water by plants; sewage systems / storm drains with overflows; 3
What you needed in this session
Cambridge’s own grade thresholds for 2019 May/June, Paper 1 · Variant 3. A higher threshold means an easier paper — the bar moves with how the cohort did.