Cambridge IGCSE Environmental Management 0680 — 2015 Oct/Nov Paper 2 · Variant 3
0680/23/O/N/15 · 80 marks · ≈90 min
The question paper and its mark scheme, free to read here and free to download. This is Cambridge’s own paper, exactly as it was sat.
Question paper16 pages
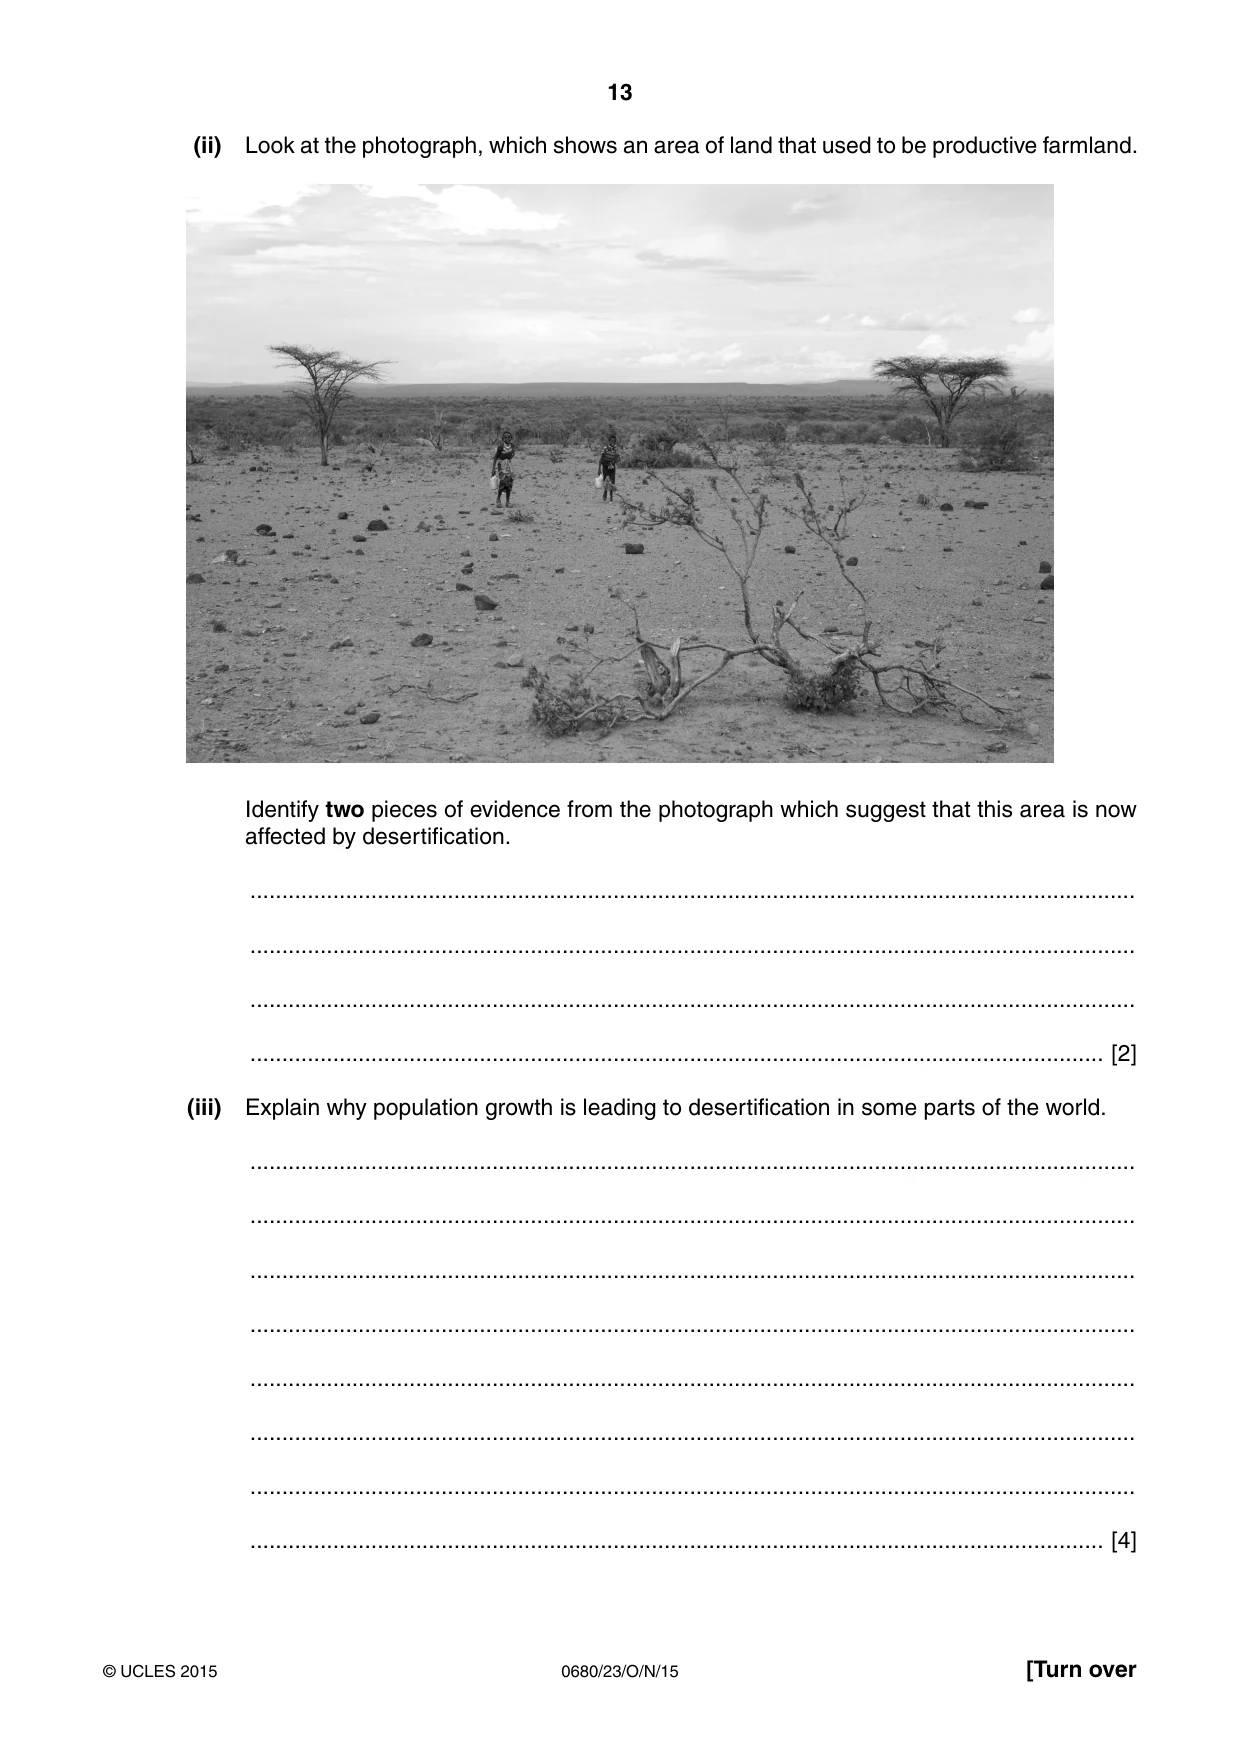
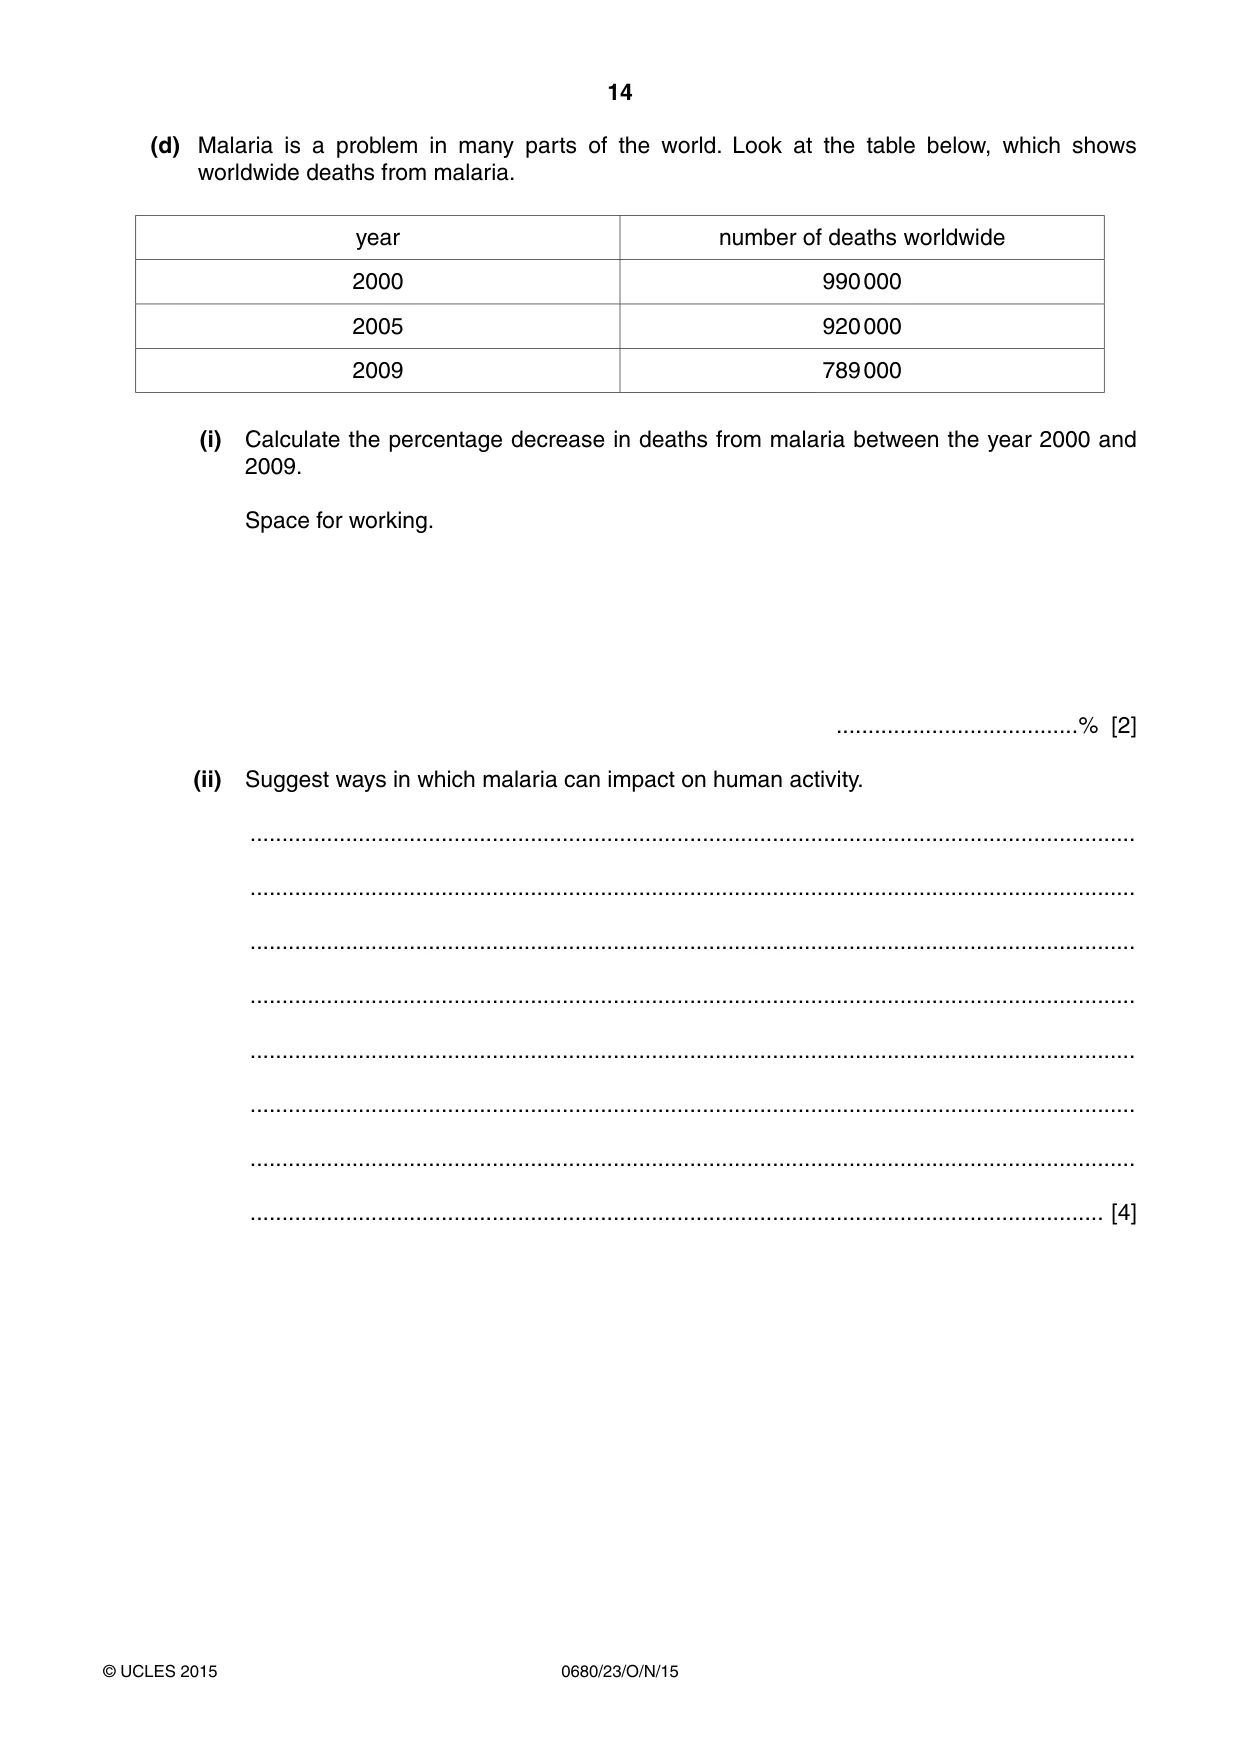

Mark scheme7 pages
Answers below. Sit the paper first if you are practising.
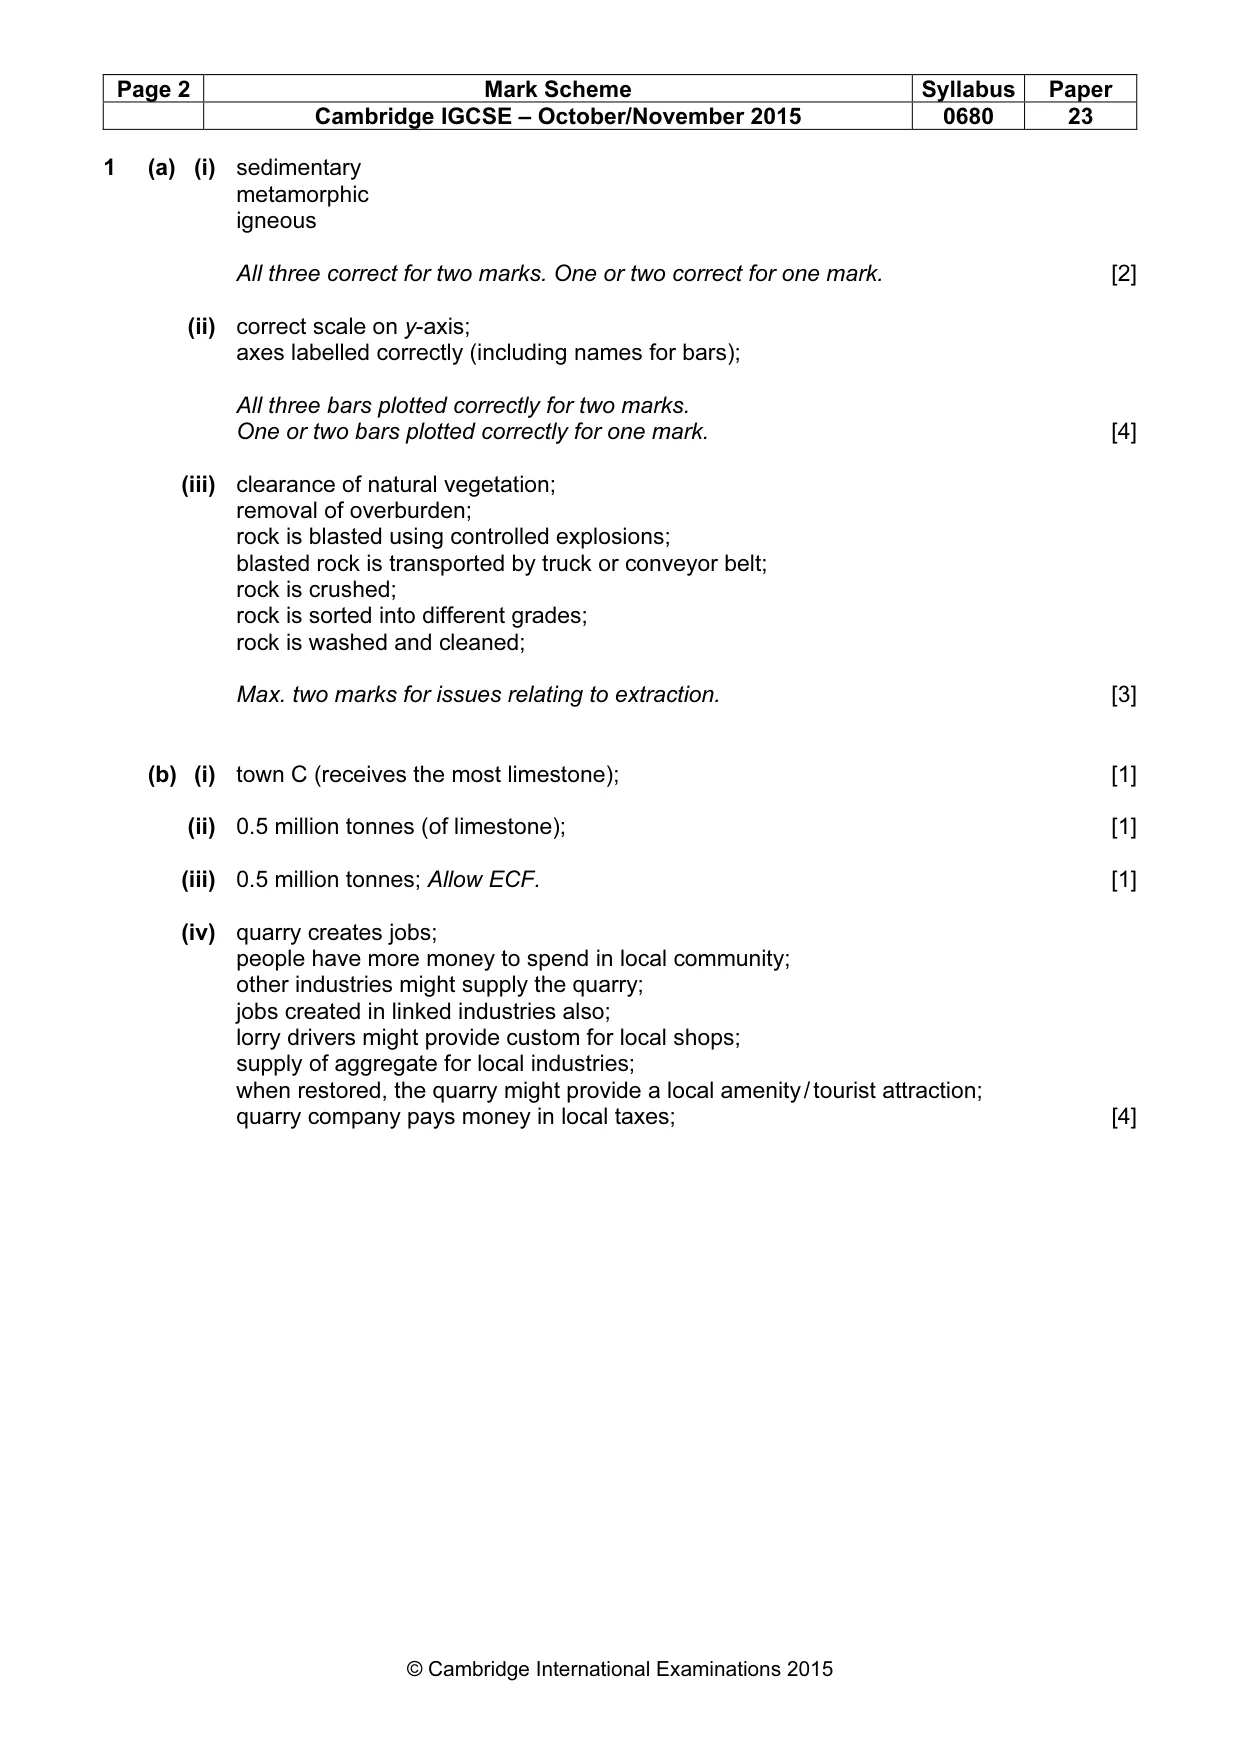
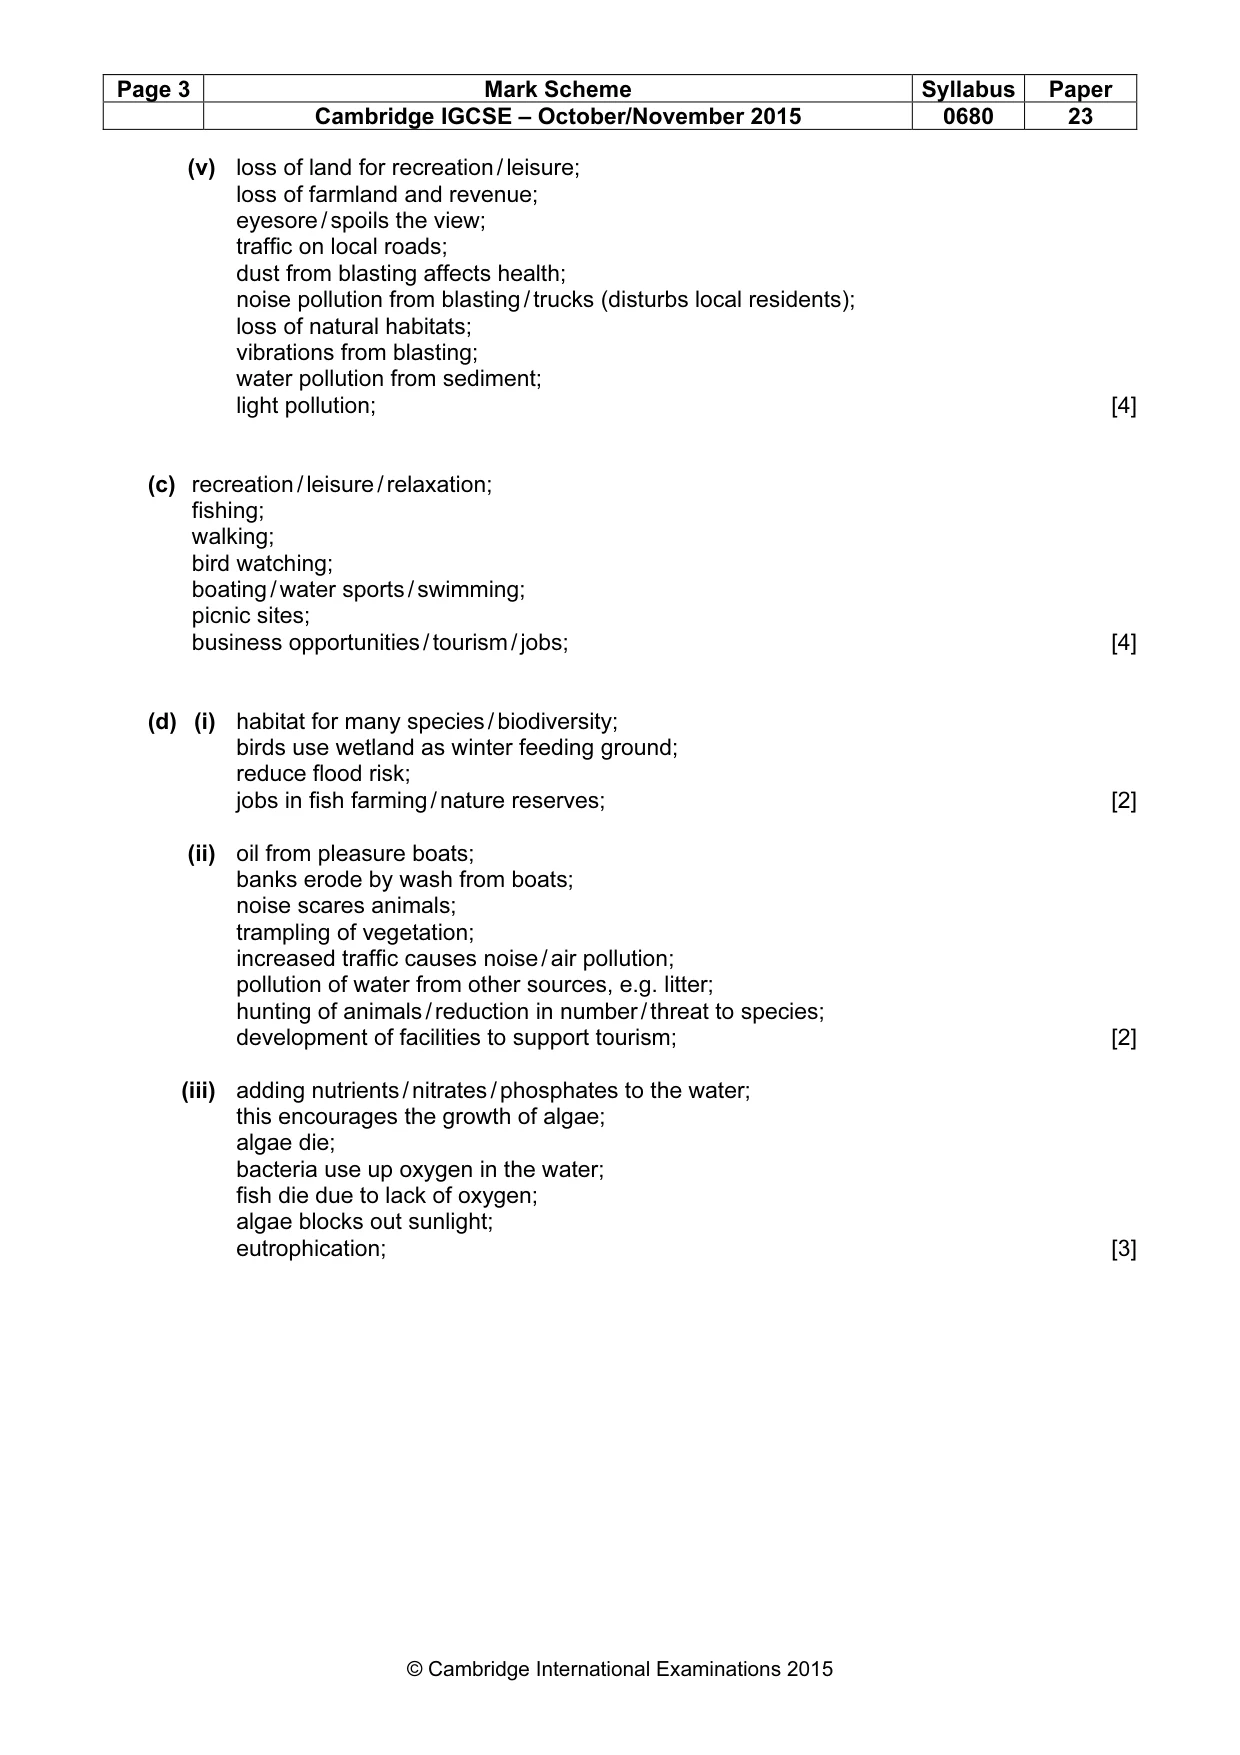
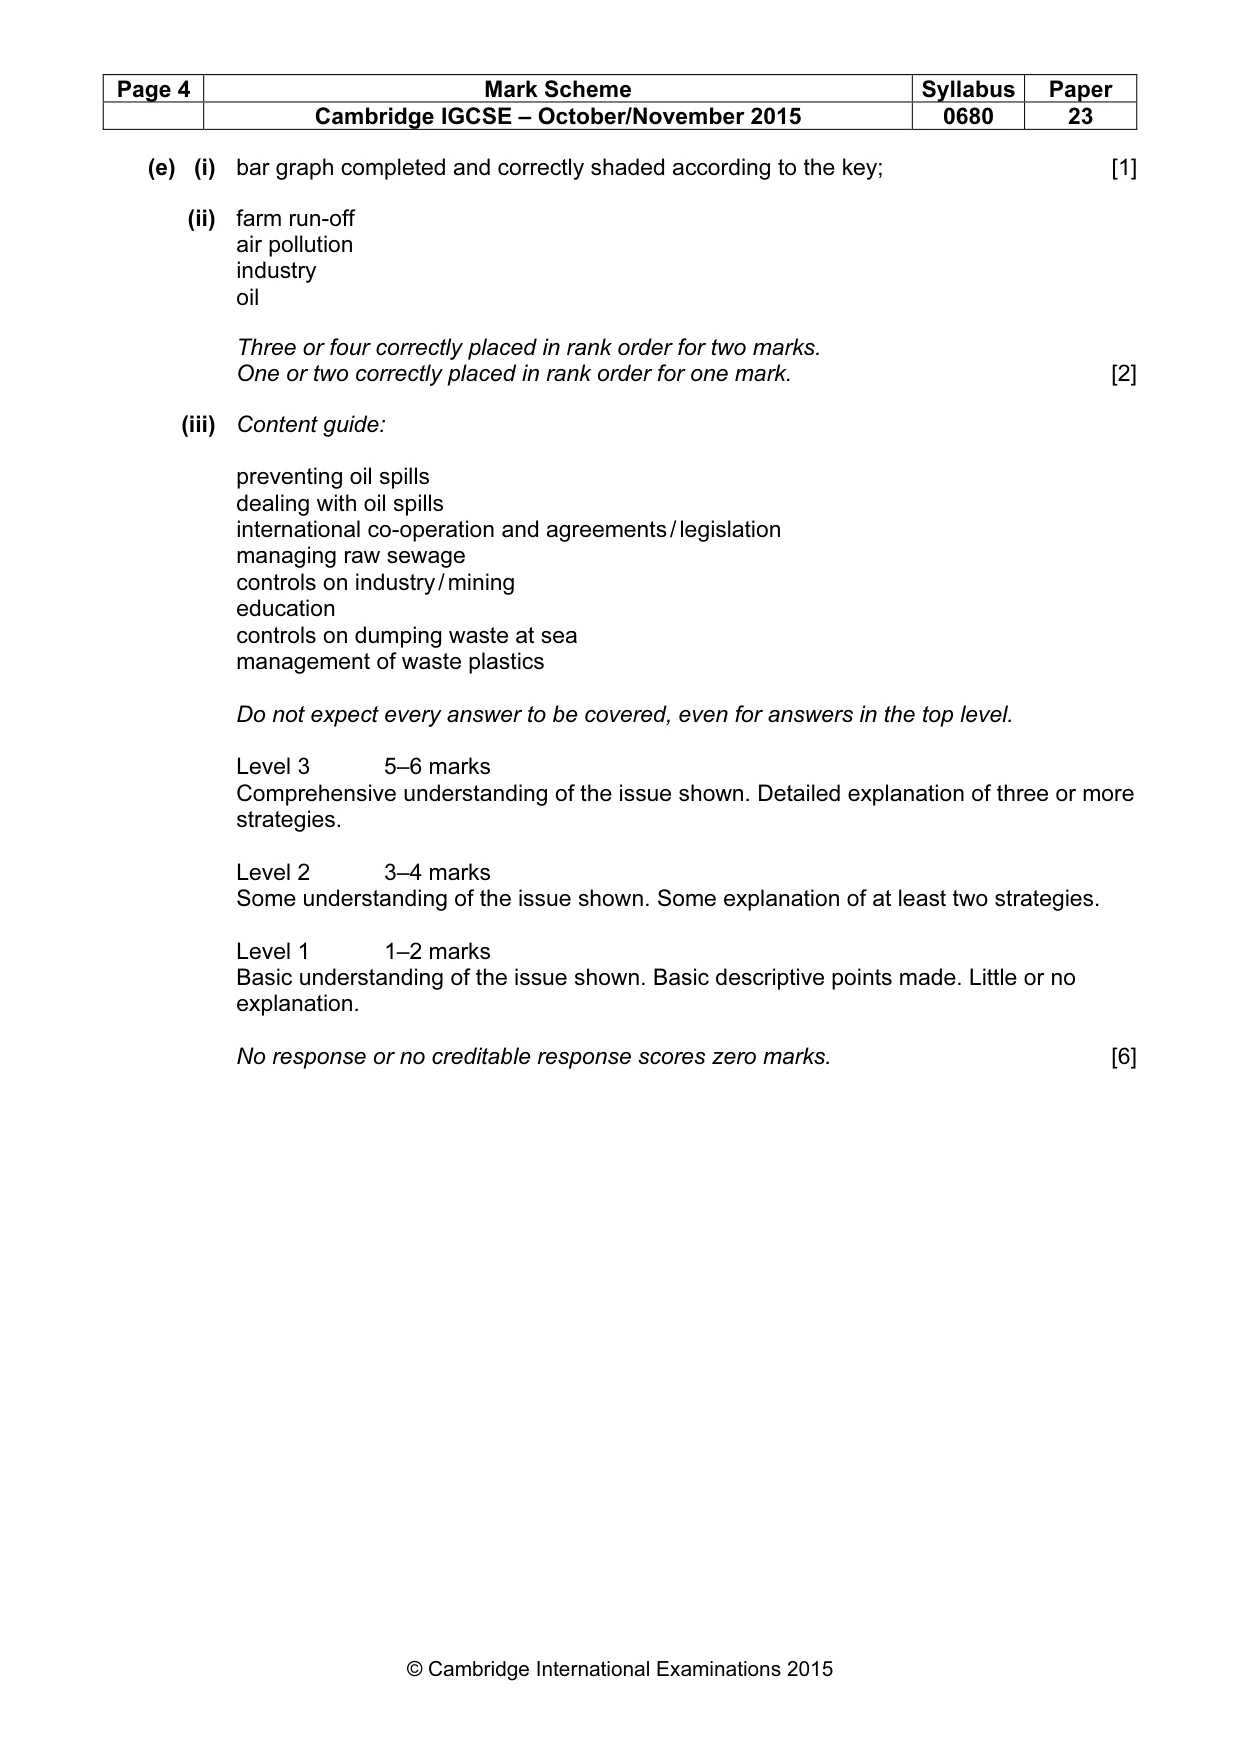
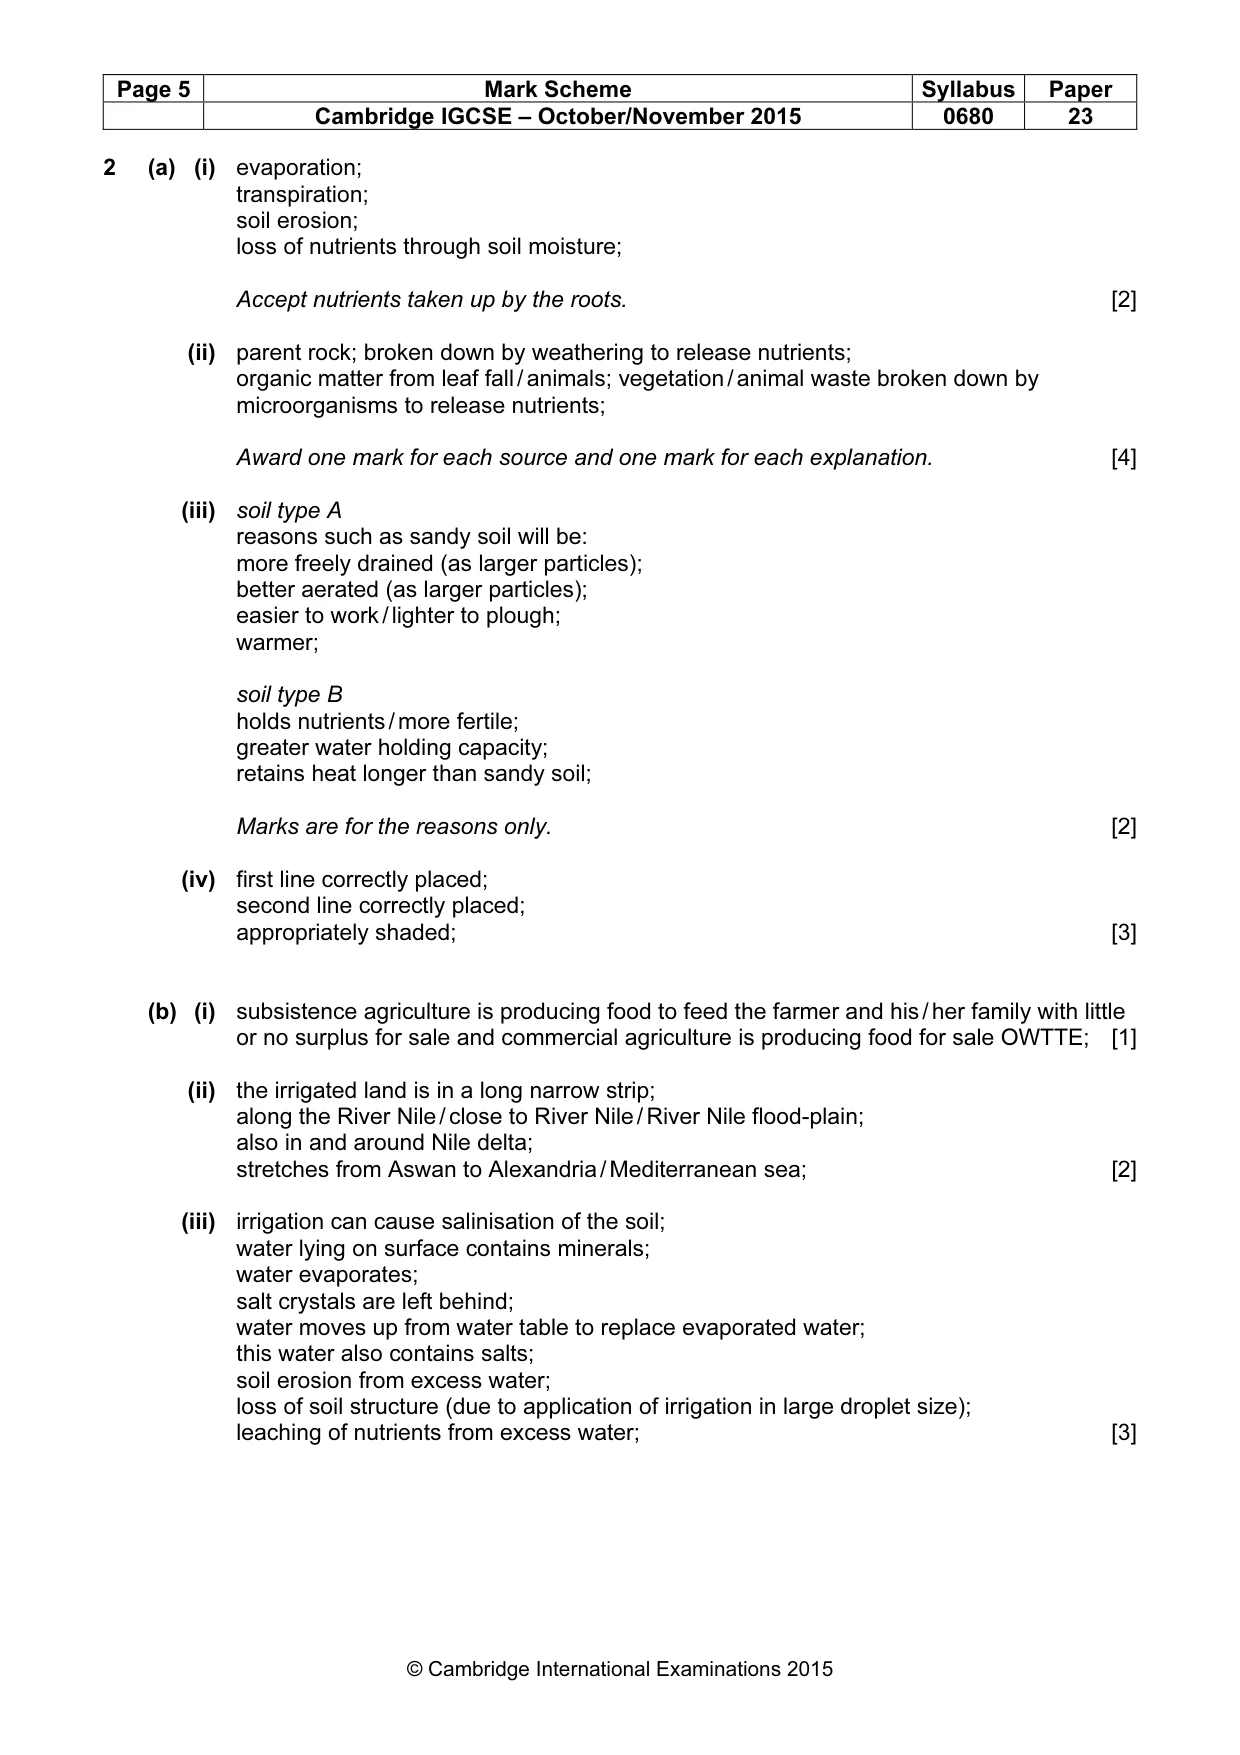
Paper as text
Question paper, page 1
This document consists of 15 printed pages and 1 blank page. DC (NF/CGW) 97064/4 © UCLES 2015 [Turn over Cambridge International Examinations Cambridge International General Certificate of Secondary Education * 8 1 5 2 0 7 3 4 6 5 * ENVIRONMENTAL MANAGEMENT 0680/23 Paper 2 October/November 2015 1 hour 45 minutes Candidates answer on the Question Paper. No Additional Materials are required. READ THESE INSTRUCTIONS FIRST Write your Centre number, candidate number and name on all the work you hand in. Write in dark blue or black pen. You may use an HB pencil for any diagrams or graphs. Do not use staples, paper clips, glue or correction fluid. DO NOT WRITE IN ANY BARCODES. Answer both questions. Electronic calculators may be used. You may lose marks if you do not show your working or if you do not use appropriate units. At the end of the examination, fasten all your work securely together. The number of marks is given in brackets [ ] at the end of each question or part question.
Question paper, page 2
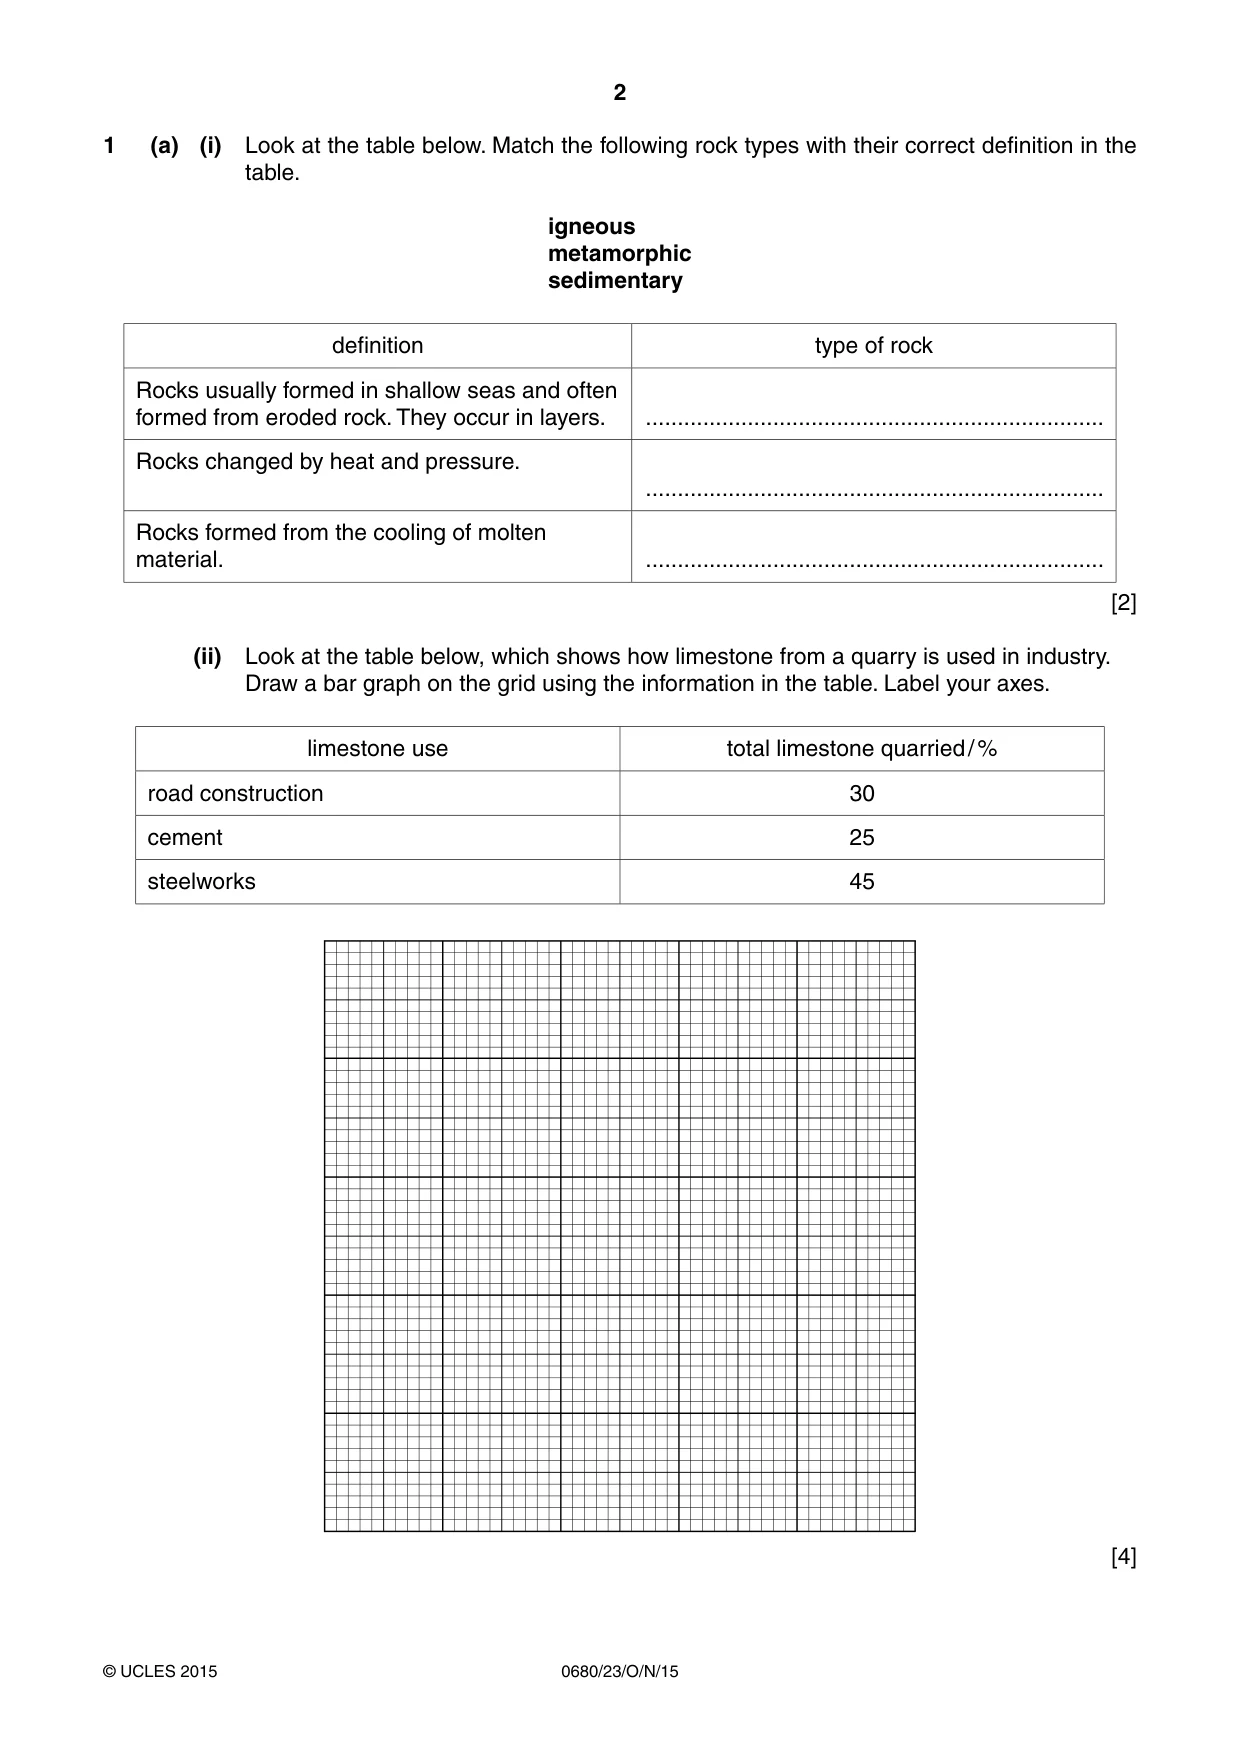
2 0680/23/O/N/15 © UCLES 2015 1 (a) (i) Look at the table below. Match the following rock types with their correct definition in the table. igneous metamorphic sedimentary definition type of rock Rocks usually formed in shallow seas and often formed from eroded rock. They occur in layers. … Rocks changed by heat and pressure. … Rocks formed from the cooling of molten material. … [2] (ii) Look at the table below, which shows how limestone from a quarry is used in industry. Draw a bar graph on the grid using the information in the table. Label your axes. limestone use total limestone quarried / % road construction 30 cement 25 steelworks 45 [4]
Question paper, page 3
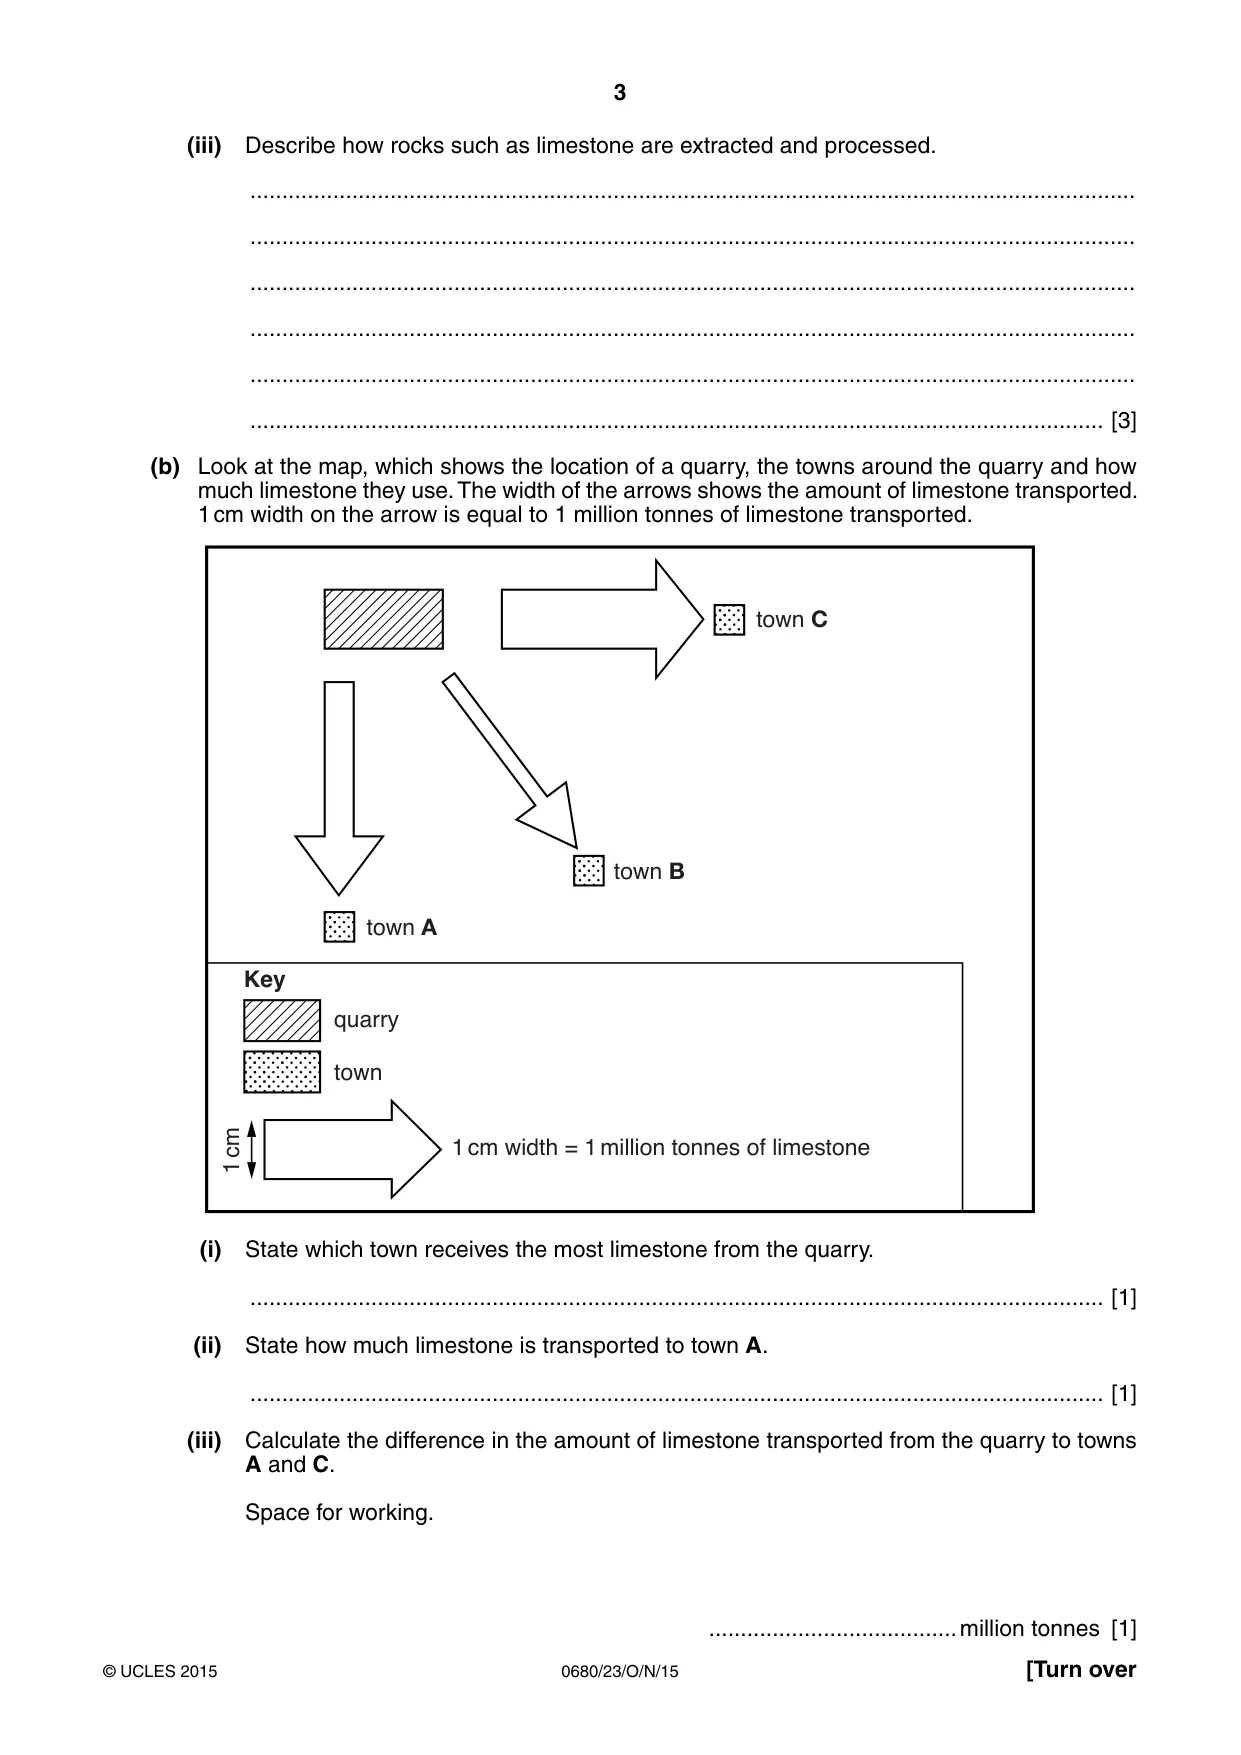
3 0680/23/O/N/15 © UCLES 2015 [Turn over (iii) Describe how rocks such as limestone are extracted and processed. … … … … … … [3] (b) Look at the map, which shows the location of a quarry, the towns around the quarry and how much limestone they use. The width of the arrows shows the amount of limestone transported. 1 cm width on the arrow is equal to 1 million tonnes of limestone transported. Key quarry town 1 cm width = 1 million tonnes of limestone 1 cm town C town B town A (i) State which town receives the most limestone from the quarry. … [1] (ii) State how much limestone is transported to town A. … [1] (iii) Calculate the difference in the amount of limestone transported from the quarry to towns A and C. Space for working. … million tonnes [1]
Question paper, page 4
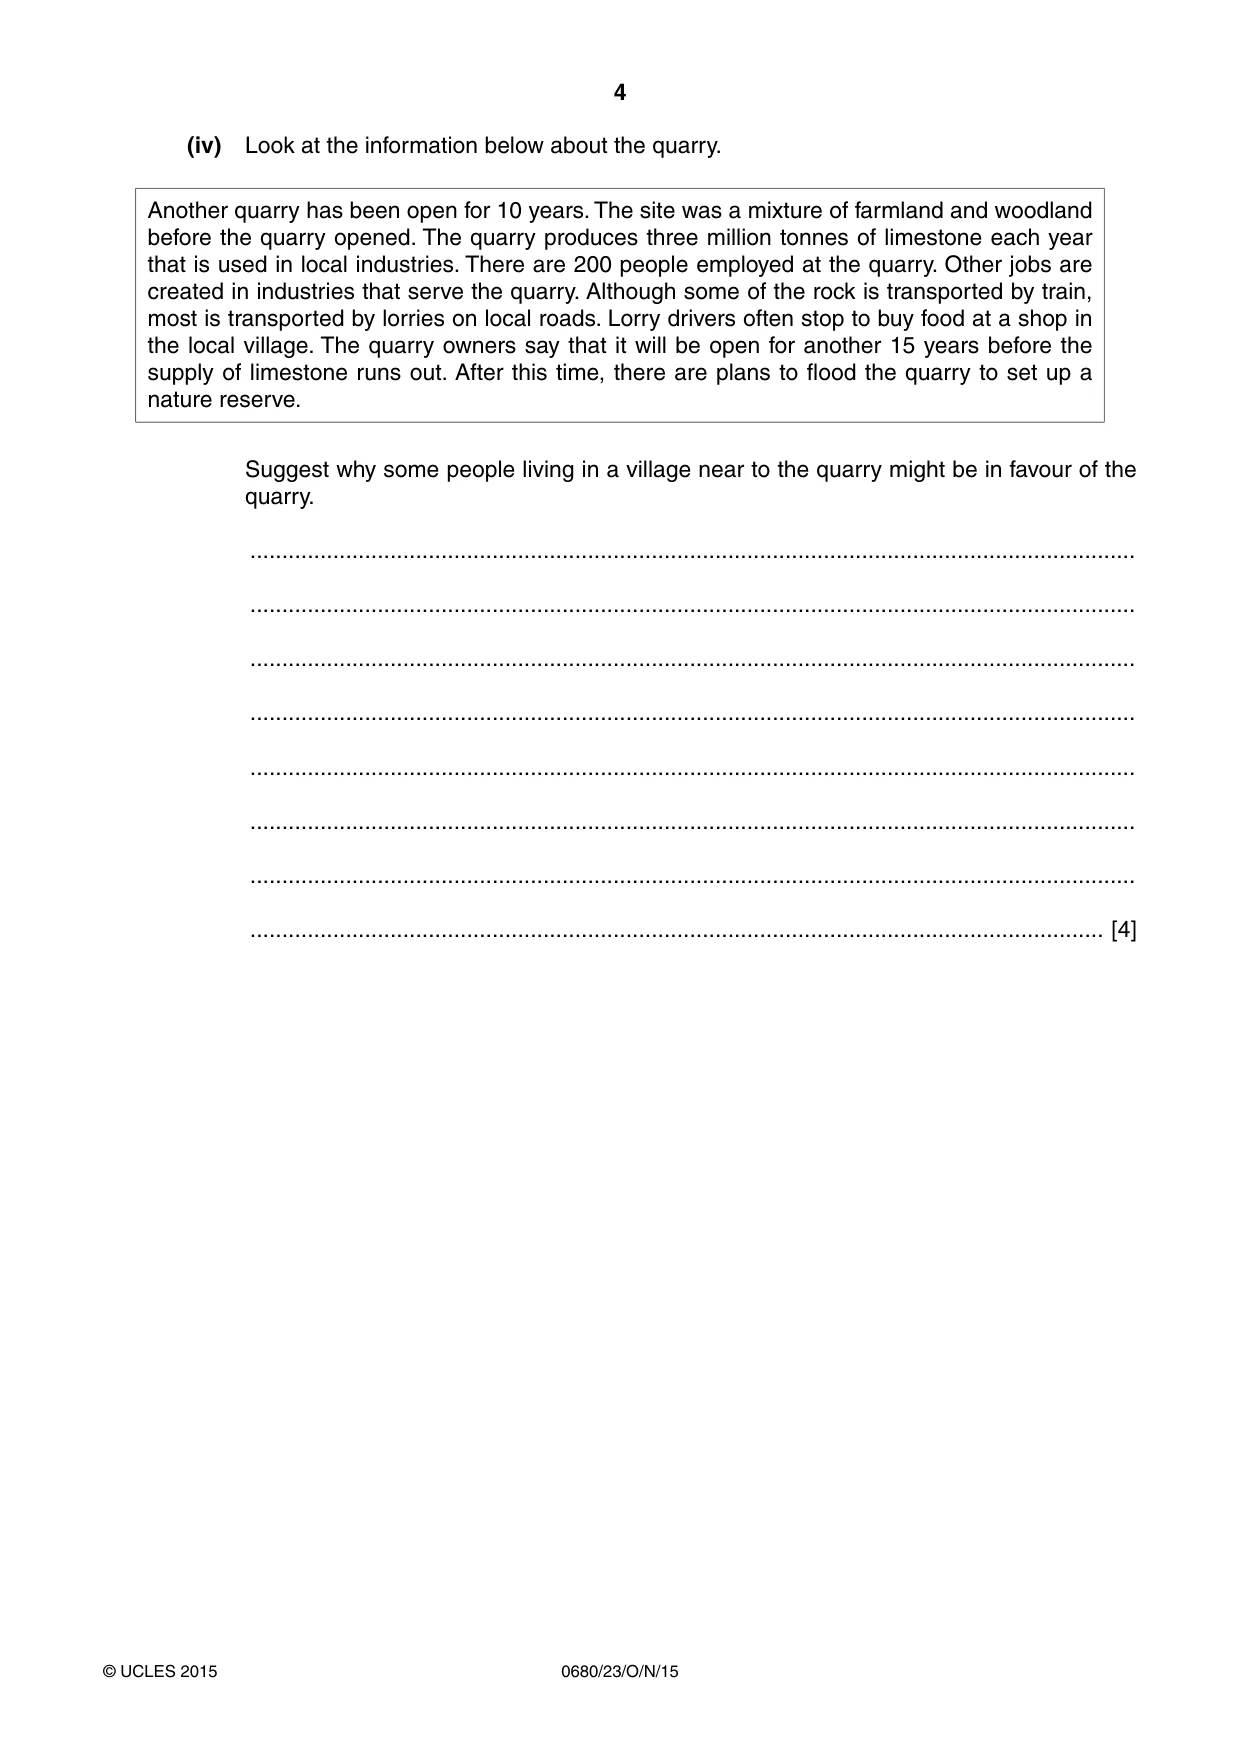
4 0680/23/O/N/15 © UCLES 2015 (iv) Look at the information below about the quarry. Another quarry has been open for 10 years. The site was a mixture of farmland and woodland before the quarry opened. The quarry produces three million tonnes of limestone each year that is used in local industries. There are 200 people employed at the quarry. Other jobs are created in industries that serve the quarry. Although some of the rock is transported by train, most is transported by lorries on local roads. Lorry drivers often stop to buy food at a shop in the local village. The quarry owners say that it will be open for another 15 years before the supply of limestone runs out. After this time, there are plans to flood the quarry to set up a nature reserve. Suggest why some people living in a village near to the quarry might be in favour of the quarry. … … … … … … … … [4]
Question paper, page 5
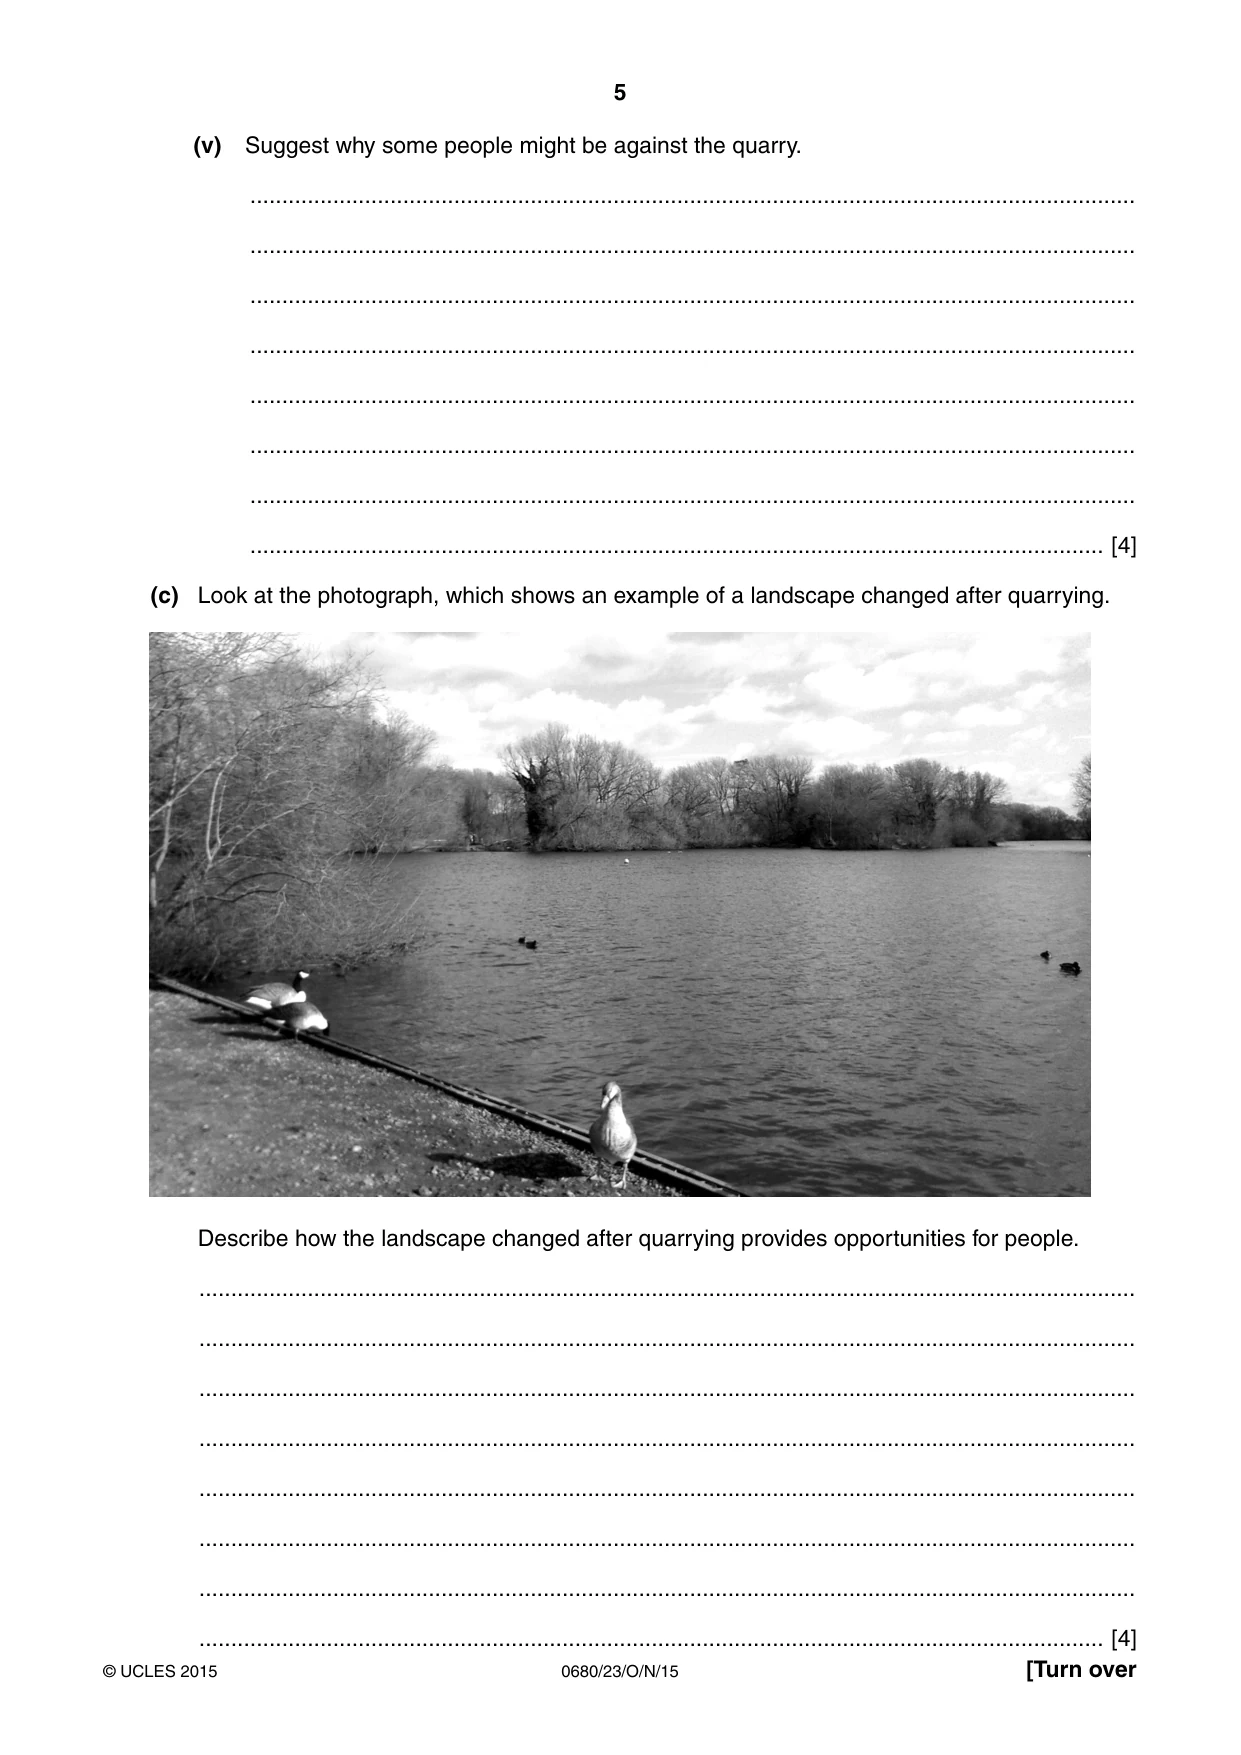
5 0680/23/O/N/15 © UCLES 2015 [Turn over (v) Suggest why some people might be against the quarry. … … … … … … … … [4] (c) Look at the photograph, which shows an example of a landscape changed after quarrying. Describe how the landscape changed after quarrying provides opportunities for people. … … … … … … … … [4]
Question paper, page 6
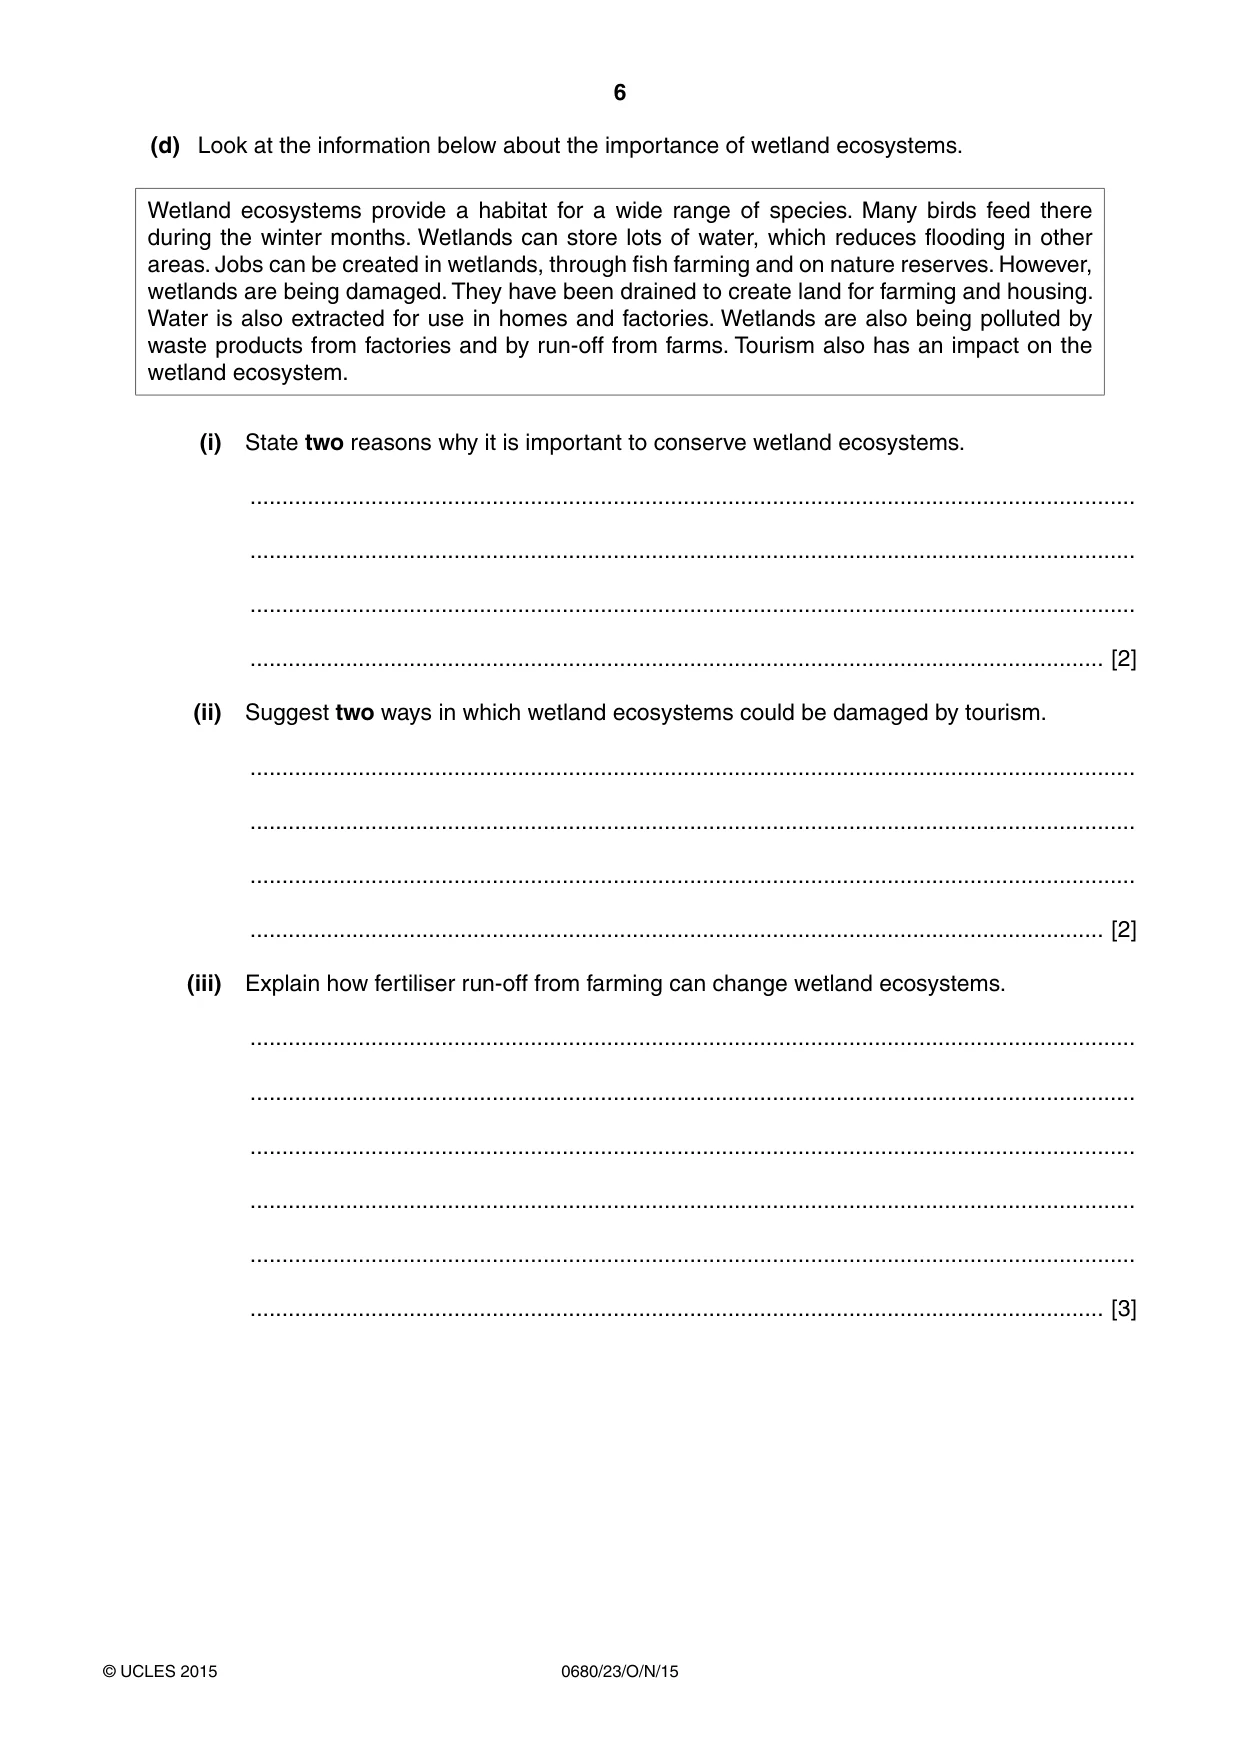
6 0680/23/O/N/15 © UCLES 2015 (d) Look at the information below about the importance of wetland ecosystems. Wetland ecosystems provide a habitat for a wide range of species. Many birds feed there during the winter months. Wetlands can store lots of water, which reduces flooding in other areas. Jobs can be created in wetlands, through fish farming and on nature reserves. However, wetlands are being damaged. They have been drained to create land for farming and housing. Water is also extracted for use in homes and factories. Wetlands are also being polluted by waste products from factories and by run-off from farms. Tourism also has an impact on the wetland ecosystem. (i) State two reasons why it is important to conserve wetland ecosystems. … … … … [2] (ii) Suggest two ways in which wetland ecosystems could be damaged by tourism. … … … … [2] (iii) Explain how fertiliser run-off from farming can change wetland ecosystems. … … … … … … [3]
Question paper, page 7
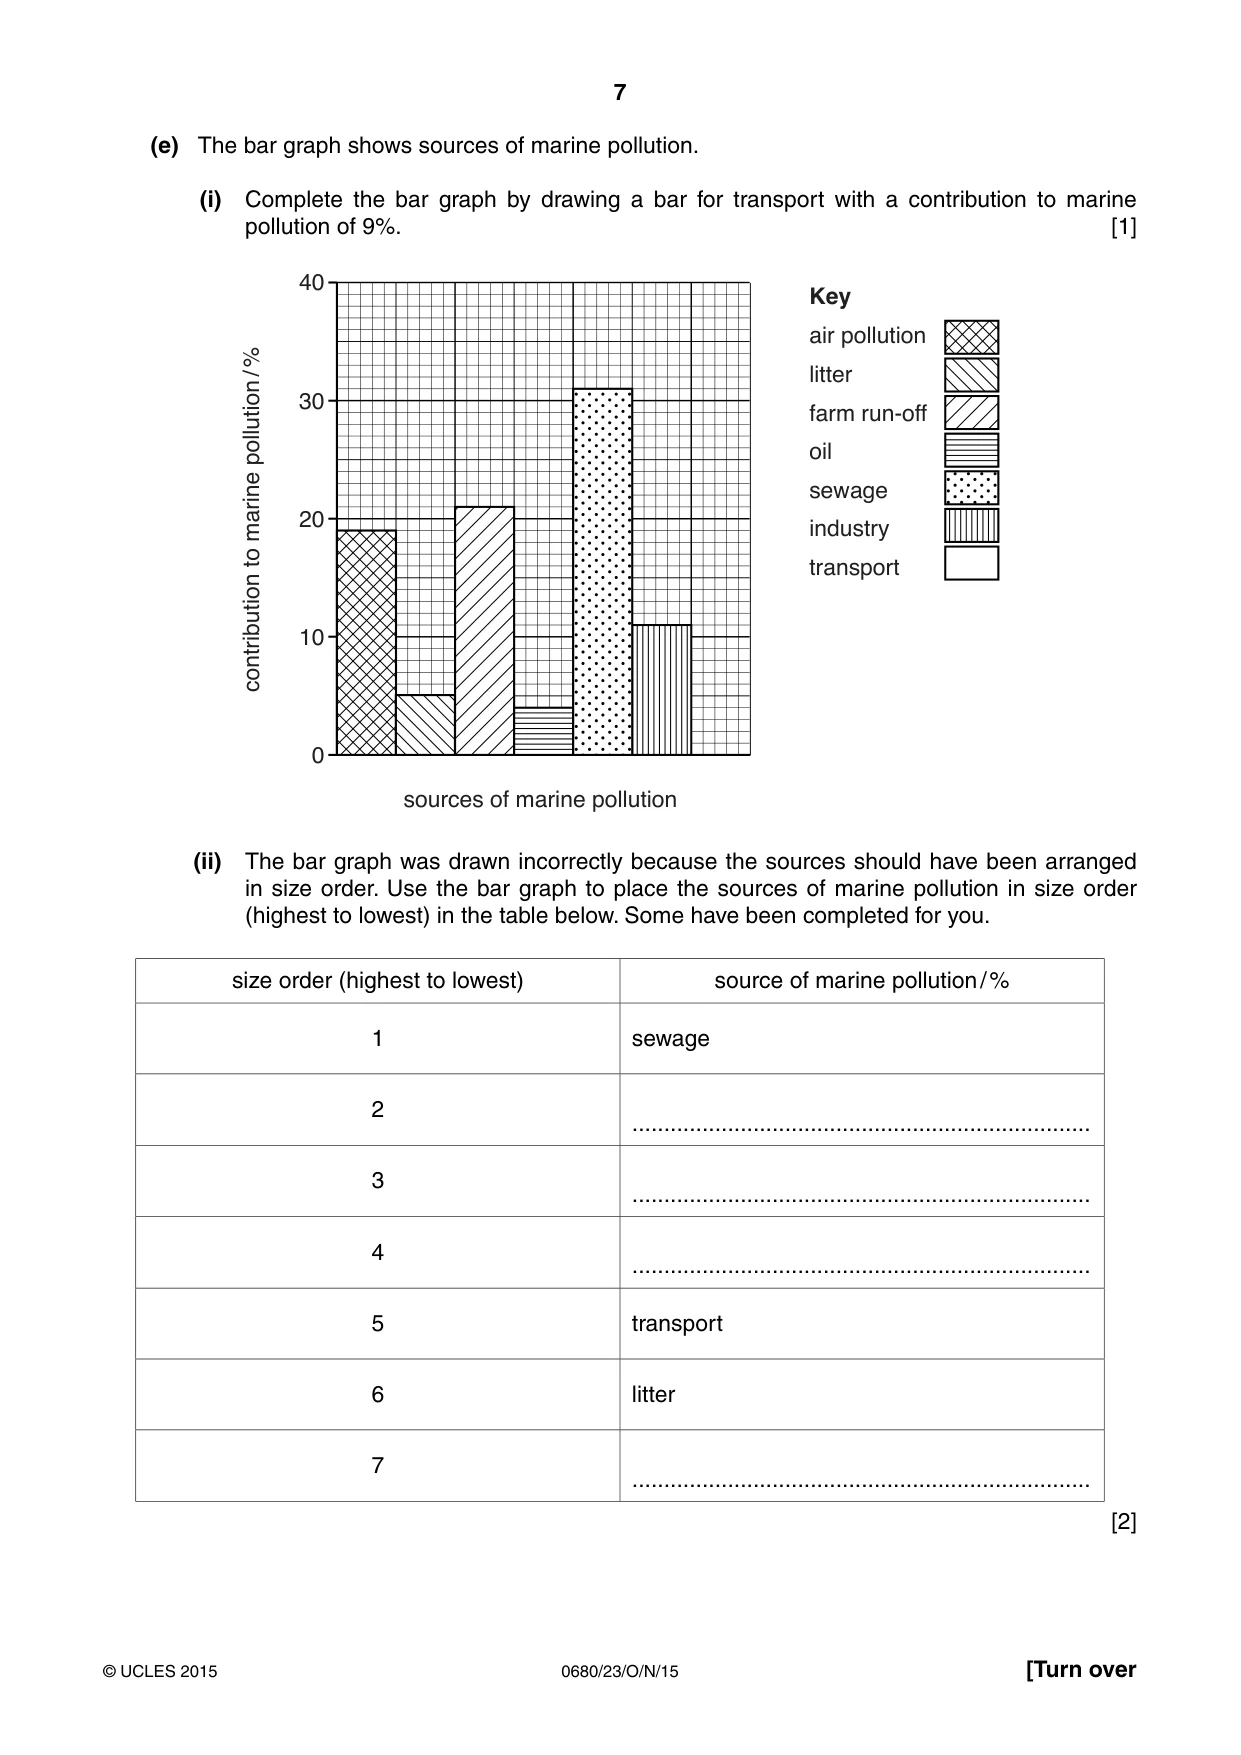
7 0680/23/O/N/15 © UCLES 2015 [Turn over (e) The bar graph shows sources of marine pollution. (i) Complete the bar graph by drawing a bar for transport with a contribution to marine pollution of 9%. [1] 0 10 20 contribution to marine pollution / % sources of marine pollution 30 40 Key air pollution litter farm run-off oil sewage industry transport (ii) The bar graph was drawn incorrectly because the sources should have been arranged in size order. Use the bar graph to place the sources of marine pollution in size order (highest to lowest) in the table below. Some have been completed for you. size order (highest to lowest) source of marine pollution / % 1 sewage 2 … 3 … 4 … 5 transport 6 litter 7 … [2]
Question paper, page 8
8 0680/23/O/N/15 © UCLES 2015 (iii) Suggest ways in which the problem of marine pollution could be managed to ensure our oceans are a sustainable resource. … … … … … … … … … … … … [6]
Question paper, page 9
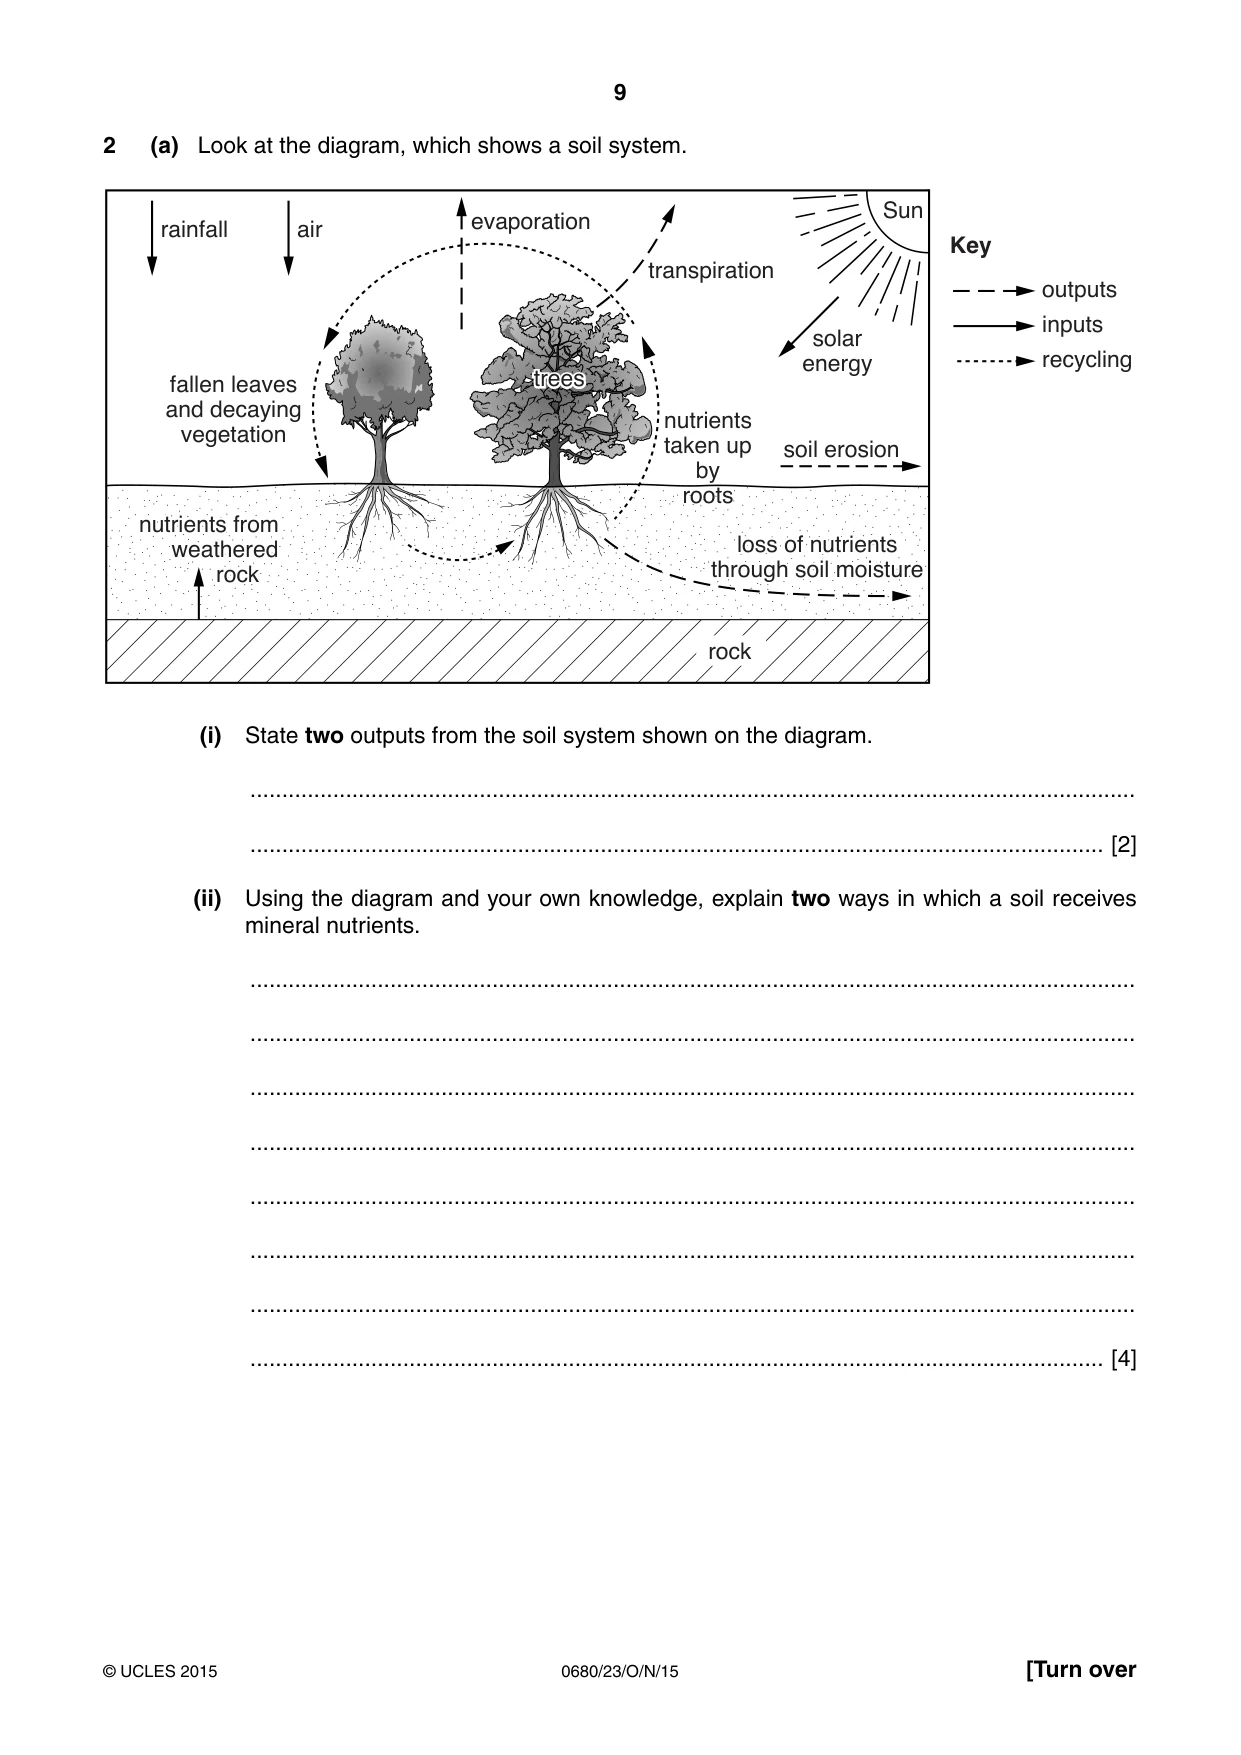
9 0680/23/O/N/15 © UCLES 2015 [Turn over 2 (a) Look at the diagram, which shows a soil system. rock nutrients from weathered rock nutrients from weathered rock nutrients taken up by roots fallen leaves and decaying vegetation rainfall air evaporation transpiration solar energy outputs Key inputs recycling soil erosion loss of nutrients through soil moisture trees trees loss of nutrients through soil moisture Sun (i) State two outputs from the soil system shown on the diagram. … … [2] (ii) Using the diagram and your own knowledge, explain two ways in which a soil receives mineral nutrients. … … … … … … … … [4]
Question paper, page 10
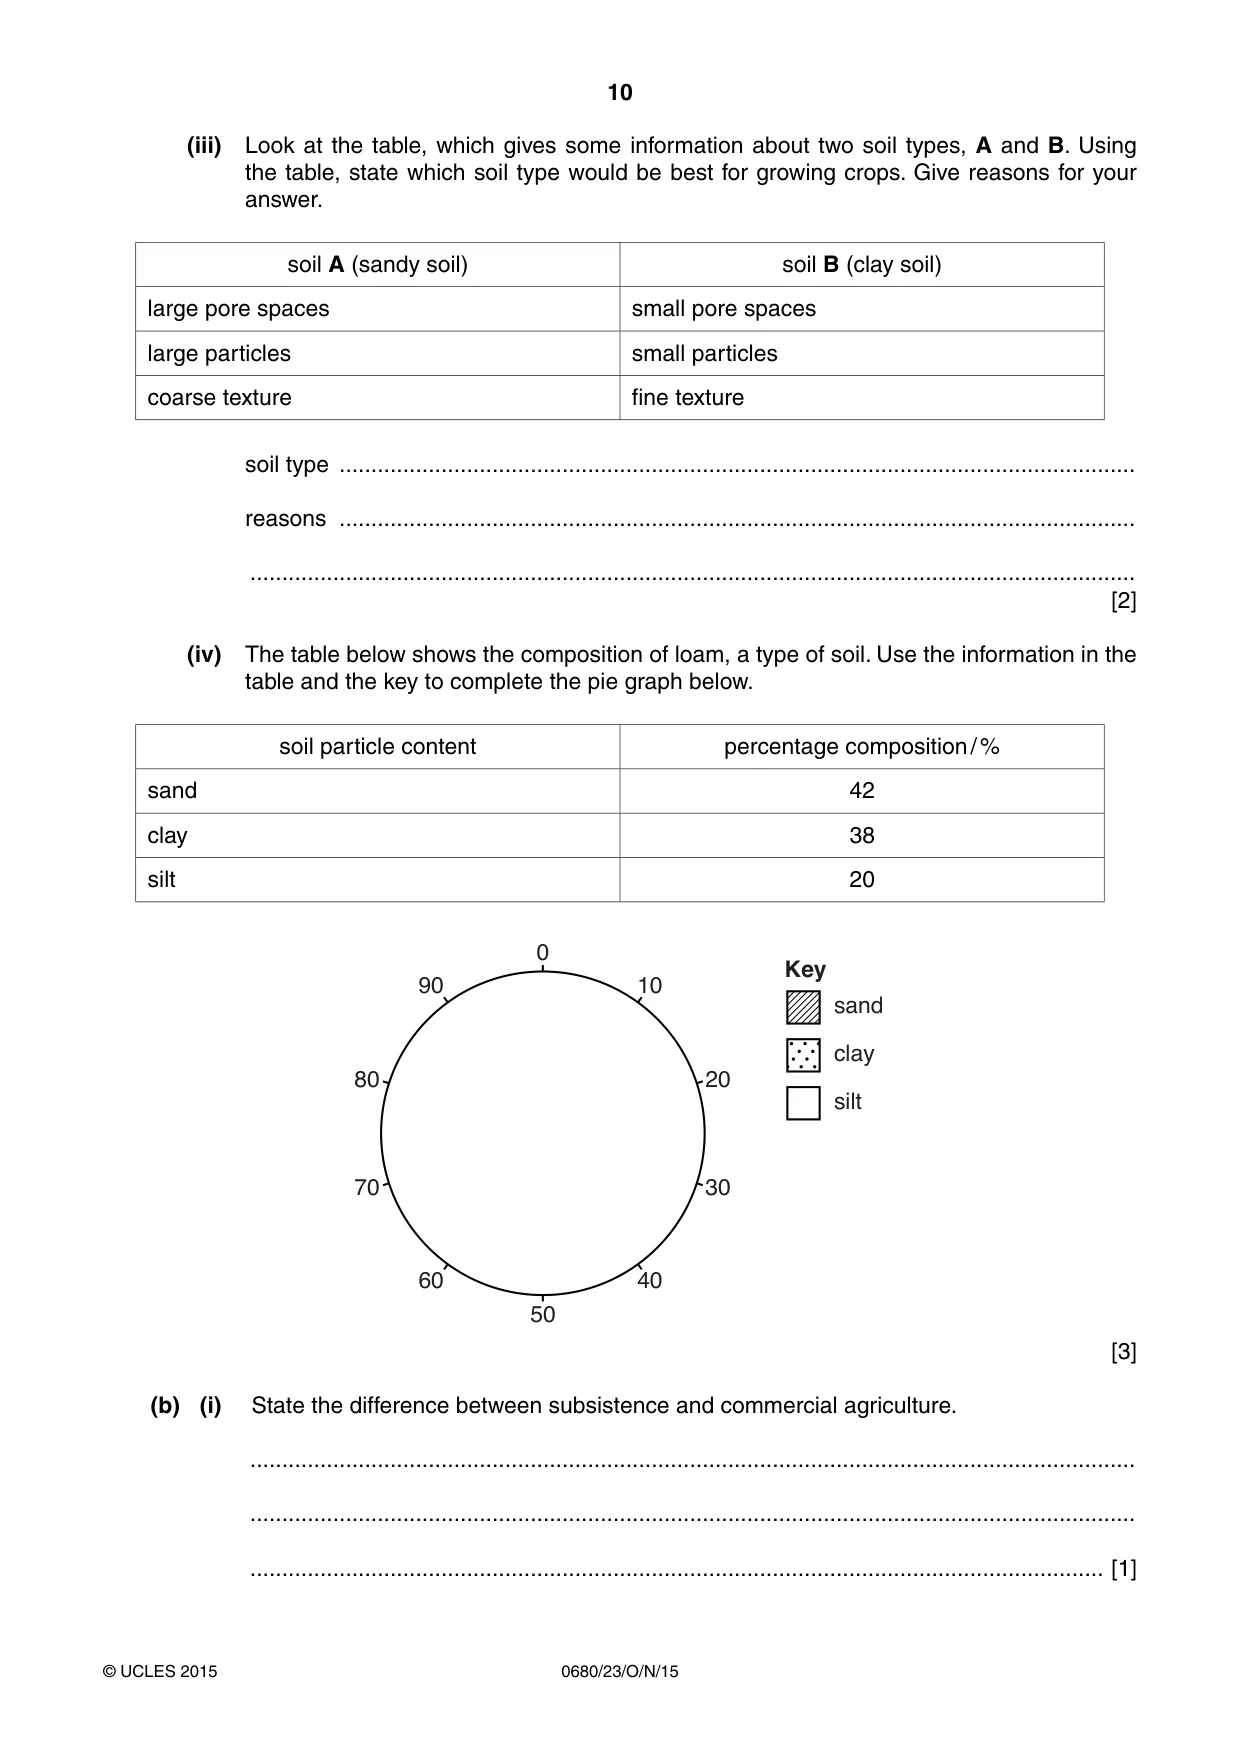
10 0680/23/O/N/15 © UCLES 2015 (iii) Look at the table, which gives some information about two soil types, A and B. Using the table, state which soil type would be best for growing crops. Give reasons for your answer. soil A (sandy soil) soil B (clay soil) large pore spaces small pore spaces large particles small particles coarse texture fine texture soil type … reasons … … [2] (iv) The table below shows the composition of loam, a type of soil. Use the information in the table and the key to complete the pie graph below. soil particle content percentage composition / % sand 42 clay 38 silt 20 10 40 90 0 50 60 20 Key sand clay silt 30 80 70 [3] (b) (i) State the difference between subsistence and commercial agriculture. … … … [1]
Question paper, page 11
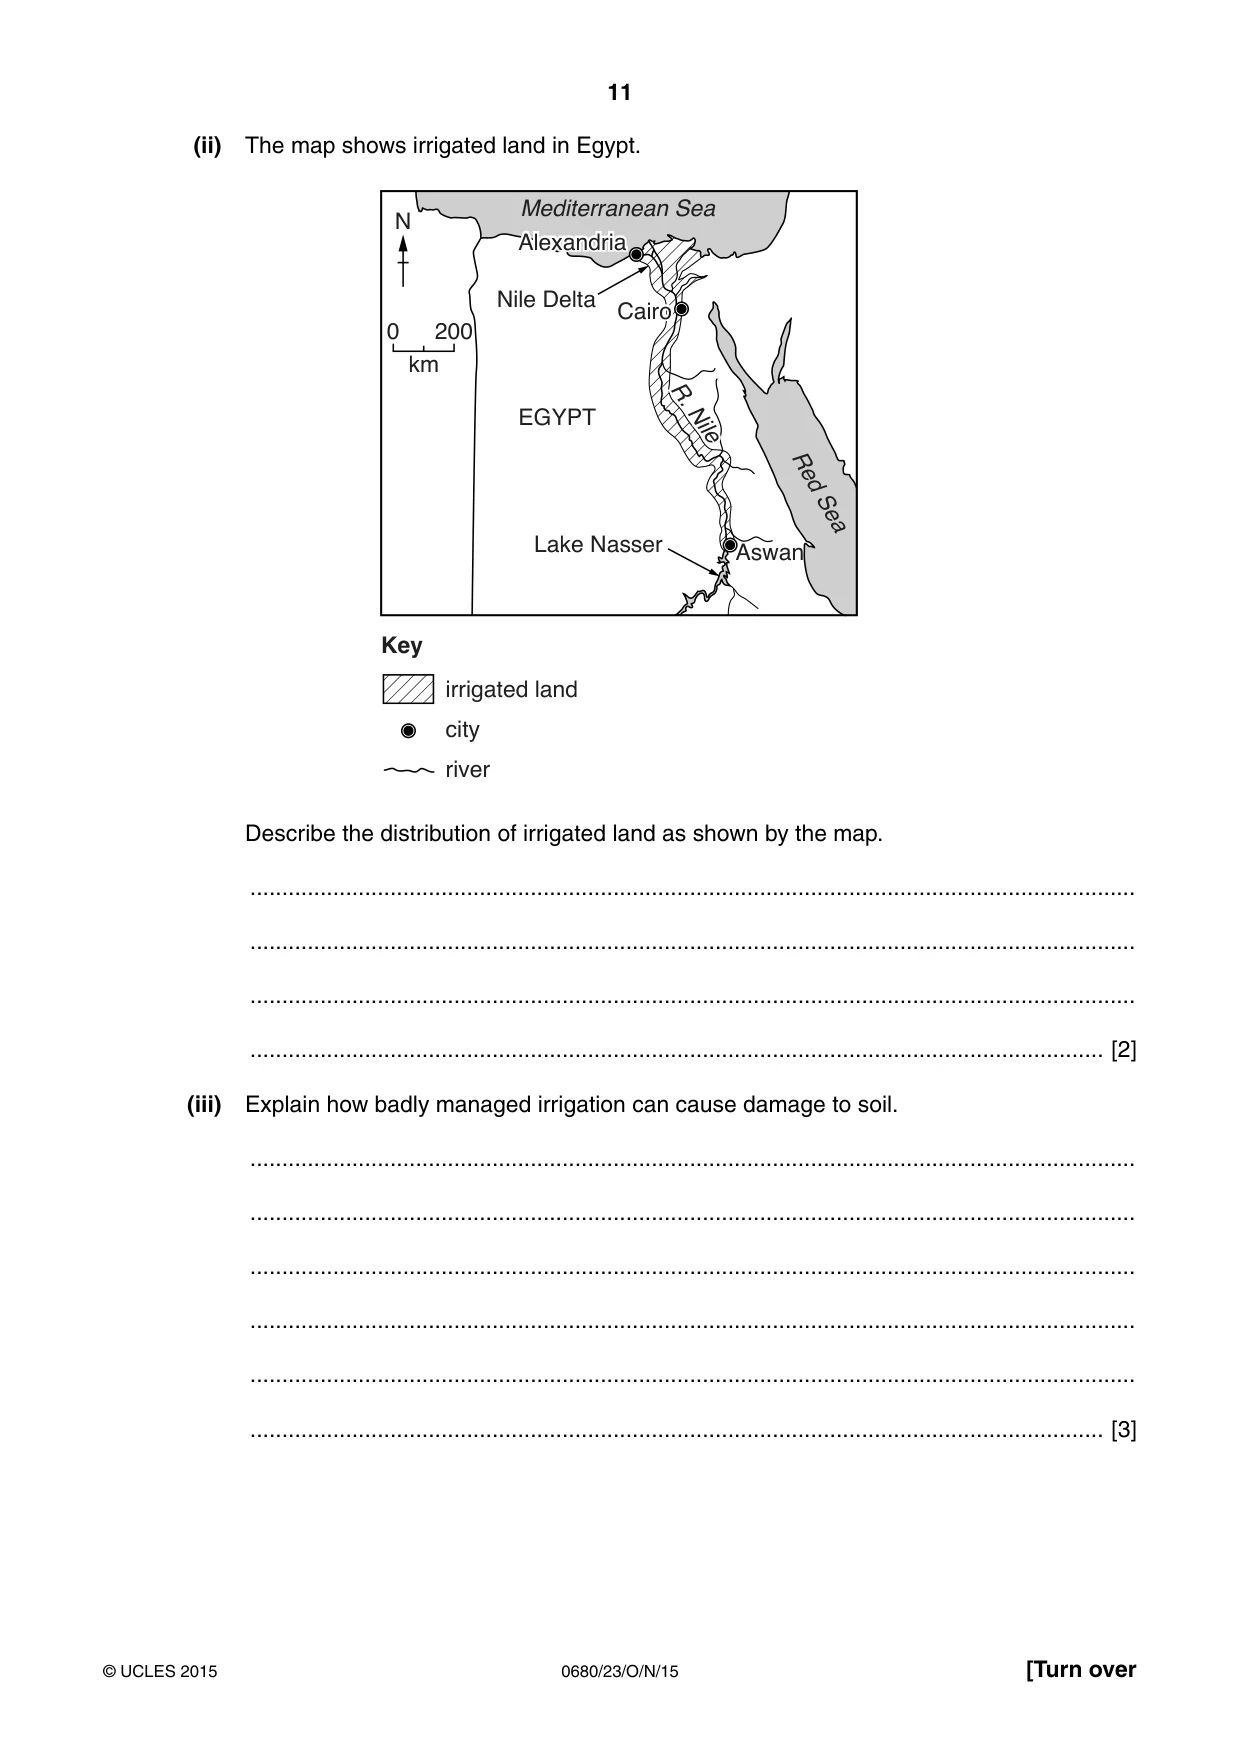
11 0680/23/O/N/15 © UCLES 2015 [Turn over (ii) The map shows irrigated land in Egypt. 0 200 N Mediterranean Sea Alexandria Red Sea km Alexandria Aswan Nile Delta Lake Nasser irrigated land city river Cairo EGYPT Key Cairo R. Nile R. Nile Describe the distribution of irrigated land as shown by the map. … … … … [2] (iii) Explain how badly managed irrigation can cause damage to soil. … … … … … … [3]
Question paper, page 12
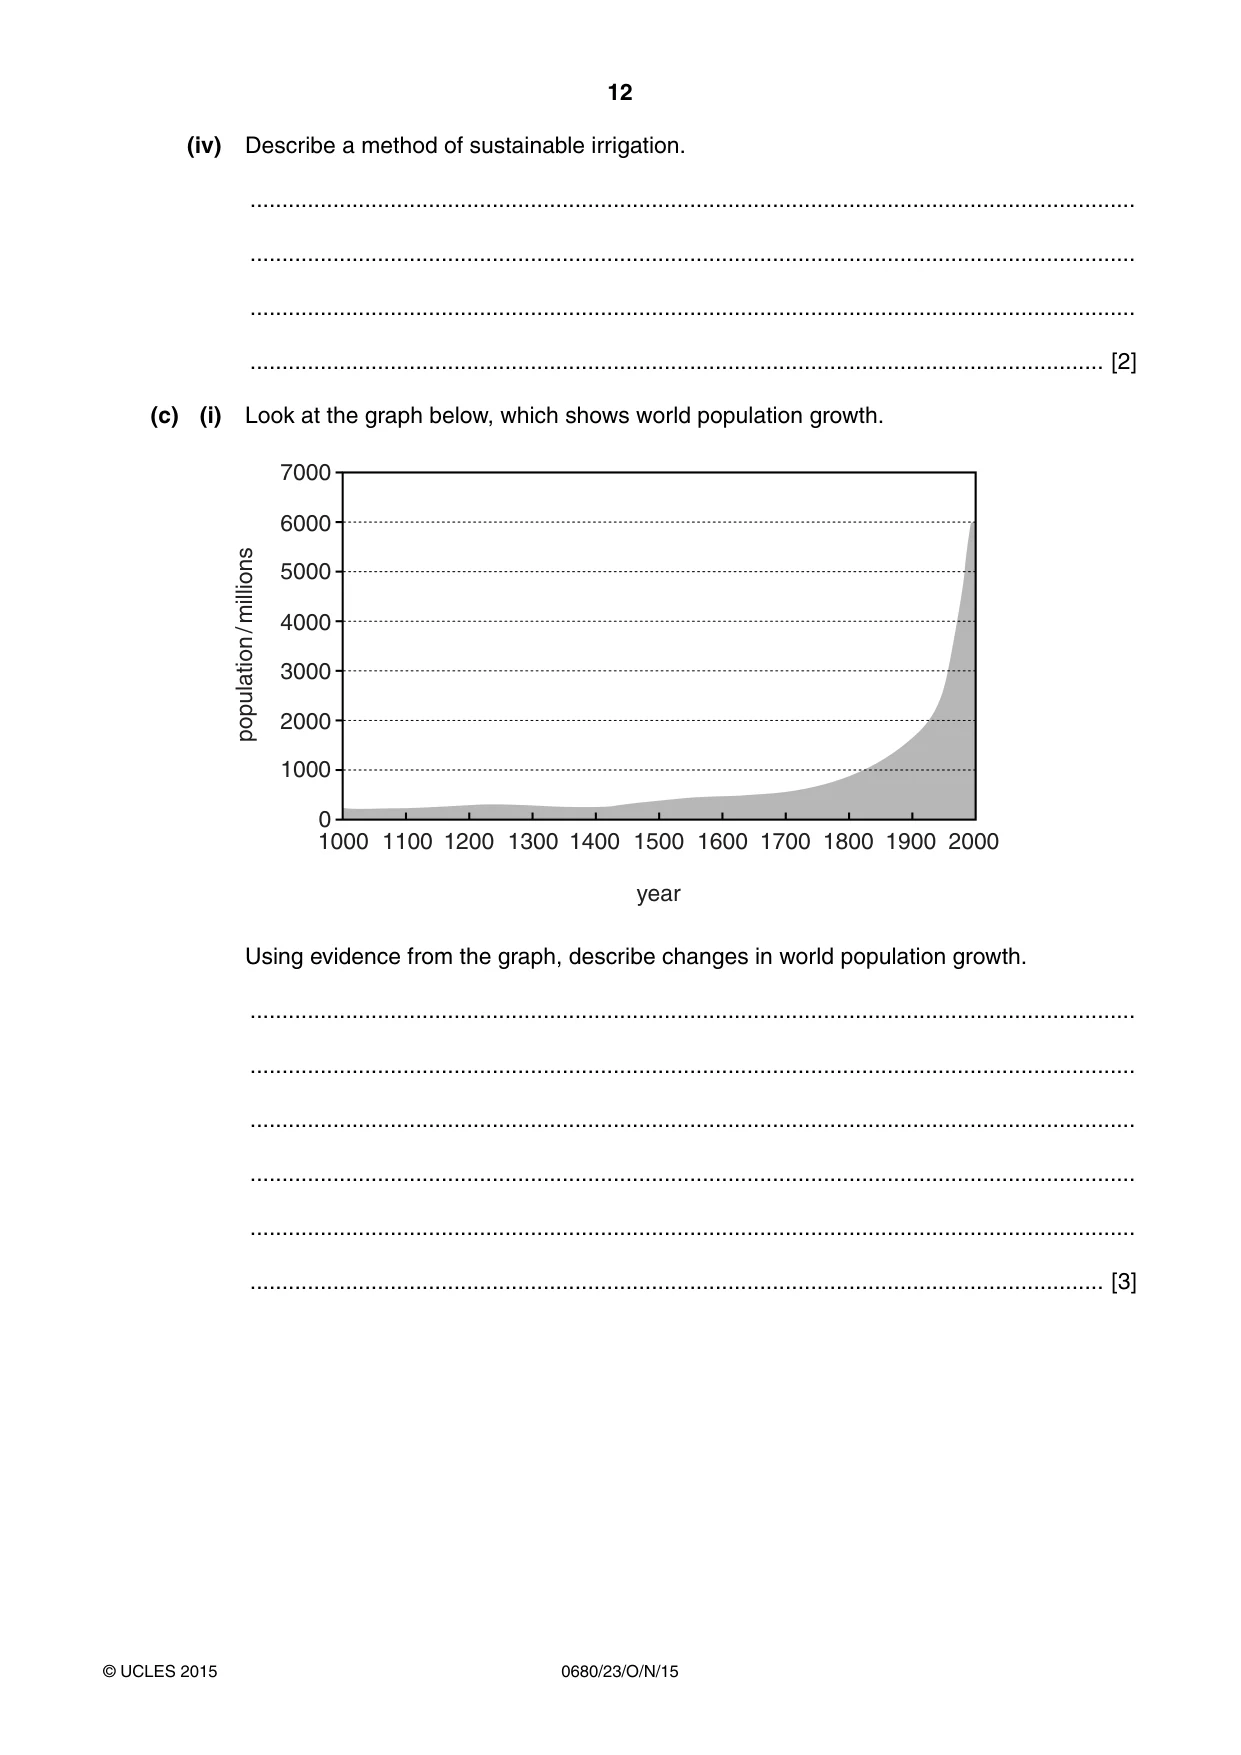
12 0680/23/O/N/15 © UCLES 2015 (iv) Describe a method of sustainable irrigation. … … … … [2] (c) (i) Look at the graph below, which shows world population growth. 7000 6000 5000 4000 3000 2000 0 1000 1200 1400 1600 1800 2000 1100 1300 1500 year population / millions 1700 1900 1000 Using evidence from the graph, describe changes in world population growth. … … … … … … [3]
Question paper, page 13
13 0680/23/O/N/15 © UCLES 2015 [Turn over (ii) Look at the photograph, which shows an area of land that used to be productive farmland. Identify two pieces of evidence from the photograph which suggest that this area is now affected by desertification. … … … … [2] (iii) Explain why population growth is leading to desertification in some parts of the world. … … … … … … … … [4]
Question paper, page 14
14 0680/23/O/N/15 © UCLES 2015 (d) Malaria is a problem in many parts of the world. Look at the table below, which shows worldwide deaths from malaria. year number of deaths worldwide 2000 990 000 2005 920 000 2009 789 000 (i) Calculate the percentage decrease in deaths from malaria between the year 2000 and 2009. Space for working. …% [2] (ii) Suggest ways in which malaria can impact on human activity. … … … … … … … … [4]
Question paper, page 15
15 0680/23/O/N/15 © UCLES 2015 (iii) Suggest strategies that could be used to control and eradicate water-related diseases. You should refer to named examples of diseases and strategies in your answer. … … … … … … … … … … … … [6]
Question paper, page 16
16 0680/23/O/N/15 © UCLES 2015 Permission to reproduce items where third-party owned material protected by copyright is included has been sought and cleared where possible. Every reasonable effort has been made by the publisher (UCLES) to trace copyright holders, but if any items requiring clearance have unwittingly been included, the publisher will be pleased to make amends at the earliest possible opportunity. To avoid the issue of disclosure of answer-related information to candidates, all copyright acknowledgements are reproduced online in the Cambridge International Examinations Copyright Acknowledgements Booklet. This is produced for each series of examinations and is freely available to download at www.cie.org.uk after the live examination series. Cambridge International Examinations is part of the Cambridge Assessment Group. Cambridge Assessment is the brand name of University of Cambridge Local Examinations Syndicate (UCLES), which is itself a department of the University of Cambridge. BLANK PAGE
Mark scheme, page 1
® IGCSE is the registered trademark of Cambridge International Examinations. CAMBRIDGE INTERNATIONAL EXAMINATIONS Cambridge International General Certificate of Secondary Education MARK SCHEME for the October/November 2015 series 0680 ENVIRONMENTAL MANAGEMENT 0680/23 Paper 2, maximum raw mark 80 This mark scheme is published as an aid to teachers and candidates, to indicate the requirements of the examination. It shows the basis on which Examiners were instructed to award marks. It does not indicate the details of the discussions that took place at an Examiners’ meeting before marking began, which would have considered the acceptability of alternative answers. Mark schemes should be read in conjunction with the question paper and the Principal Examiner Report for Teachers. Cambridge will not enter into discussions about these mark schemes. Cambridge is publishing the mark schemes for the October/November 2015 series for most Cambridge IGCSE®, Cambridge International A and AS Level components and some Cambridge O Level components.
Mark scheme, page 2
Page 2 Mark Scheme Syllabus Paper Cambridge IGCSE – October/November 2015 0680 23 © Cambridge International Examinations 2015 1 (a) (i) sedimentary metamorphic igneous All three correct for two marks. One or two correct for one mark. [2] (ii) correct scale on y-axis; axes labelled correctly (including names for bars); All three bars plotted correctly for two marks. One or two bars plotted correctly for one mark. [4] (iii) clearance of natural vegetation; removal of overburden; rock is blasted using controlled explosions; blasted rock is transported by truck or conveyor belt; rock is crushed; rock is sorted into different grades; rock is washed and cleaned; Max. two marks for issues relating to extraction. [3] (b) (i) town C (receives the most limestone); [1] (ii) 0.5 million tonnes (of limestone); [1] (iii) 0.5 million tonnes; Allow ECF. [1] (iv) quarry creates jobs; people have more money to spend in local community; other industries might supply the quarry; jobs created in linked industries also; lorry drivers might provide custom for local shops; supply of aggregate for local industries; when restored, the quarry might provide a local amenity / tourist attraction; quarry company pays money in local taxes; [4]
Mark scheme, page 3
Page 3 Mark Scheme Syllabus Paper Cambridge IGCSE – October/November 2015 0680 23 © Cambridge International Examinations 2015 (v) loss of land for recreation / leisure; loss of farmland and revenue; eyesore / spoils the view; traffic on local roads; dust from blasting affects health; noise pollution from blasting / trucks (disturbs local residents); loss of natural habitats; vibrations from blasting; water pollution from sediment; light pollution; [4] (c) recreation / leisure / relaxation; fishing; walking; bird watching; boating / water sports / swimming; picnic sites; business opportunities / tourism / jobs; [4] (d) (i) habitat for many species / biodiversity; birds use wetland as winter feeding ground; reduce flood risk; jobs in fish farming / nature reserves; [2] (ii) oil from pleasure boats; banks erode by wash from boats; noise scares animals; trampling of vegetation; increased traffic causes noise / air pollution; pollution of water from other sources, e.g. litter; hunting of animals / reduction in number / threat to species; development of facilities to support tourism; [2] (iii) adding nutrients / nitrates / phosphates to the water; this encourages the growth of algae; algae die; bacteria use up oxygen in the water; fish die due to lack of oxygen; algae blocks out sunlight; eutrophication; [3]
Mark scheme, page 4
Page 4 Mark Scheme Syllabus Paper Cambridge IGCSE – October/November 2015 0680 23 © Cambridge International Examinations 2015 (e) (i) bar graph completed and correctly shaded according to the key; [1] (ii) farm run-off air pollution industry oil Three or four correctly placed in rank order for two marks. One or two correctly placed in rank order for one mark. [2] (iii) Content guide: preventing oil spills dealing with oil spills international co-operation and agreements / legislation managing raw sewage controls on industry / mining education controls on dumping waste at sea management of waste plastics Do not expect every answer to be covered, even for answers in the top level. Level 3 5–6 marks Comprehensive understanding of the issue shown. Detailed explanation of three or more strategies. Level 2 3–4 marks Some understanding of the issue shown. Some explanation of at least two strategies. Level 1 1–2 marks Basic understanding of the issue shown. Basic descriptive points made. Little or no explanation. No response or no creditable response scores zero marks. [6]
Mark scheme, page 5
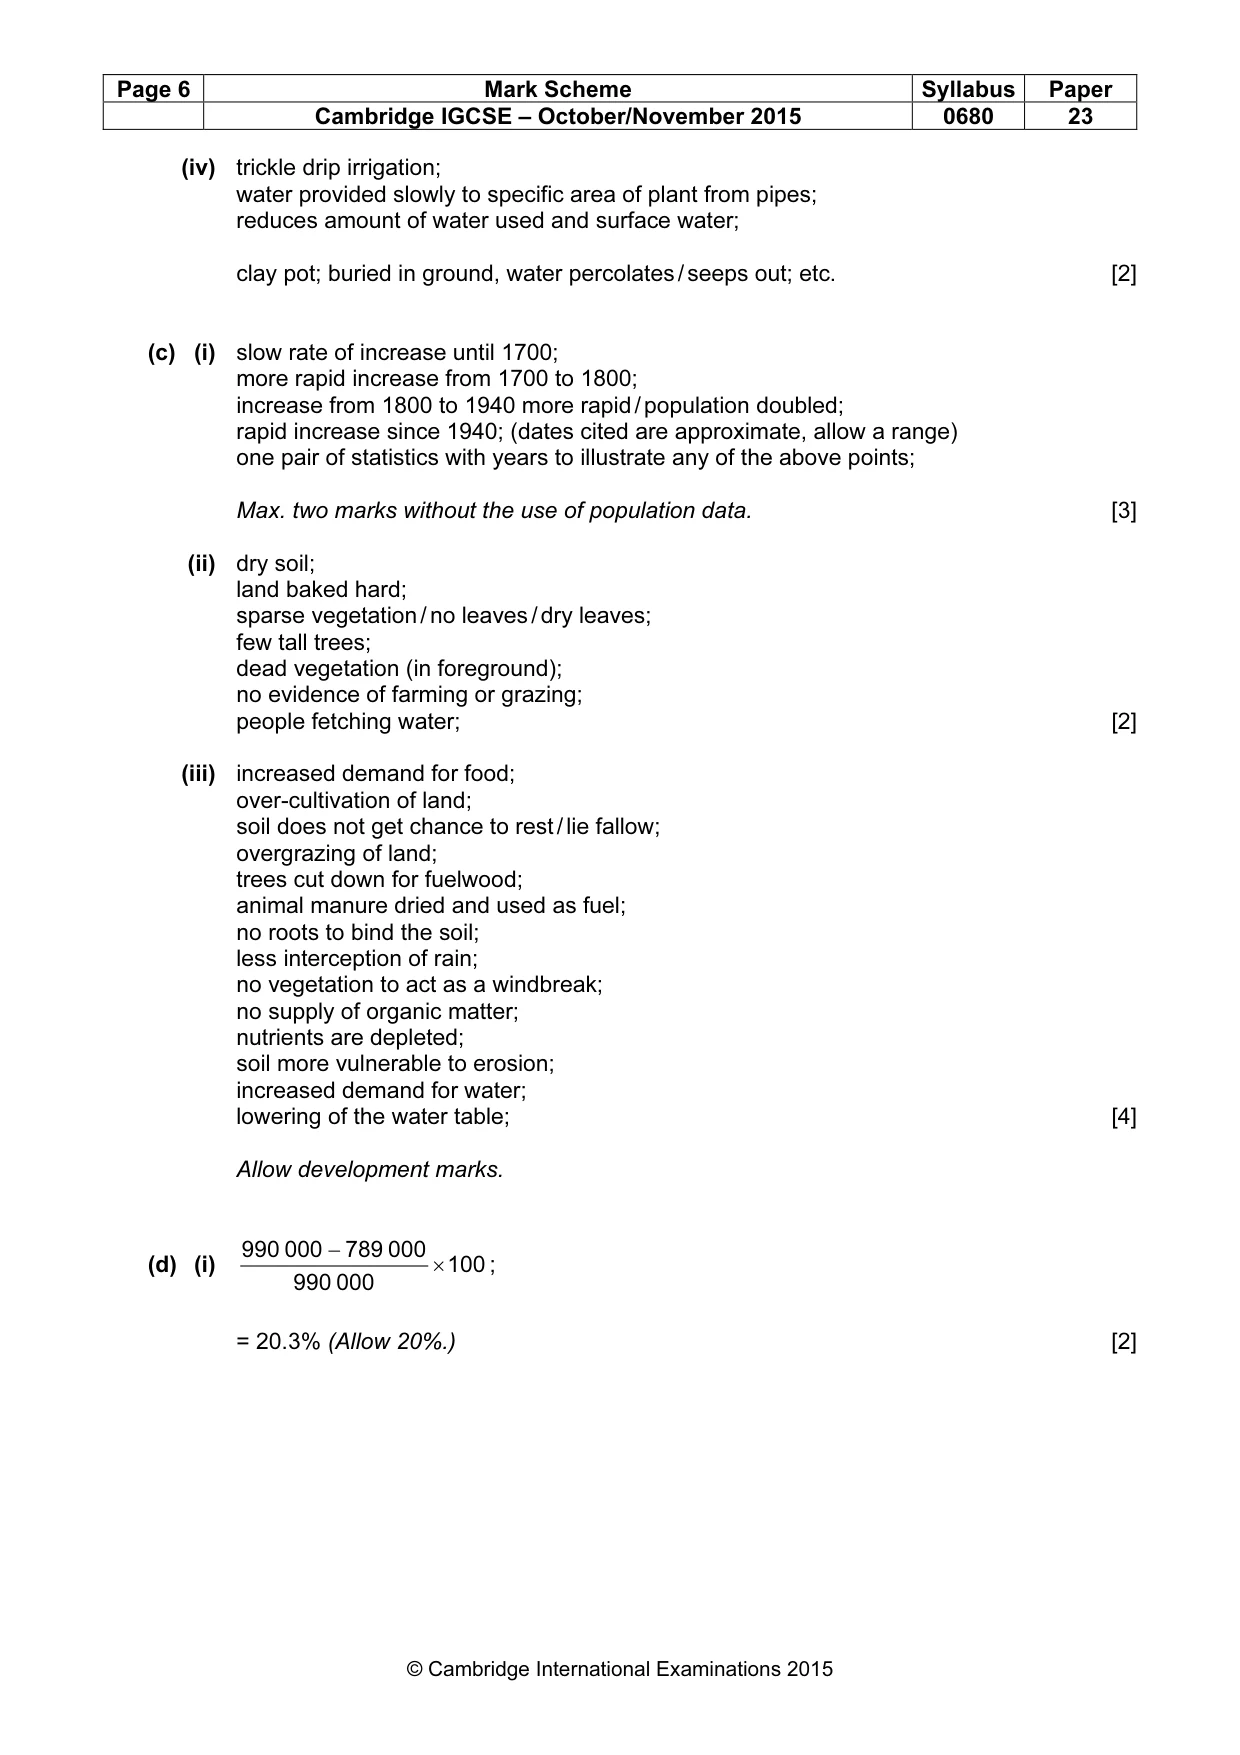
Page 5 Mark Scheme Syllabus Paper Cambridge IGCSE – October/November 2015 0680 23 © Cambridge International Examinations 2015 2 (a) (i) evaporation; transpiration; soil erosion; loss of nutrients through soil moisture; Accept nutrients taken up by the roots. [2] (ii) parent rock; broken down by weathering to release nutrients; organic matter from leaf fall / animals; vegetation / animal waste broken down by microorganisms to release nutrients; Award one mark for each source and one mark for each explanation. [4] (iii) soil type A reasons such as sandy soil will be: more freely drained (as larger particles); better aerated (as larger particles); easier to work / lighter to plough; warmer; soil type B holds nutrients / more fertile; greater water holding capacity; retains heat longer than sandy soil; Marks are for the reasons only. [2] (iv) first line correctly placed; second line correctly placed; appropriately shaded; [3] (b) (i) subsistence agriculture is producing food to feed the farmer and his / her family with little or no surplus for sale and commercial agriculture is producing food for sale OWTTE; [1] (ii) the irrigated land is in a long narrow strip; along the River Nile / close to River Nile / River Nile flood-plain; also in and around Nile delta; stretches from Aswan to Alexandria / Mediterranean sea; [2] (iii) irrigation can cause salinisation of the soil; water lying on surface contains minerals; water evaporates; salt crystals are left behind; water moves up from water table to replace evaporated water; this water also contains salts; soil erosion from excess water; loss of soil structure (due to application of irrigation in large droplet size); leaching of nutrients from excess water; [3]
Mark scheme, page 6
Page 6 Mark Scheme Syllabus Paper Cambridge IGCSE – October/November 2015 0680 23 © Cambridge International Examinations 2015 (iv) trickle drip irrigation; water provided slowly to specific area of plant from pipes; reduces amount of water used and surface water; clay pot; buried in ground, water percolates / seeps out; etc. [2] (c) (i) slow rate of increase until 1700; more rapid increase from 1700 to 1800; increase from 1800 to 1940 more rapid / population doubled; rapid increase since 1940; (dates cited are approximate, allow a range) one pair of statistics with years to illustrate any of the above points; Max. two marks without the use of population data. [3] (ii) dry soil; land baked hard; sparse vegetation / no leaves / dry leaves; few tall trees; dead vegetation (in foreground); no evidence of farming or grazing; people fetching water; [2] (iii) increased demand for food; over-cultivation of land; soil does not get chance to rest / lie fallow; overgrazing of land; trees cut down for fuelwood; animal manure dried and used as fuel; no roots to bind the soil; less interception of rain; no vegetation to act as a windbreak; no supply of organic matter; nutrients are depleted; soil more vulnerable to erosion; increased demand for water; lowering of the water table; [4] Allow development marks. (d) (i) 100 000 990 000 789 000 990 × − ; = 20.3% (Allow 20%.) [2]
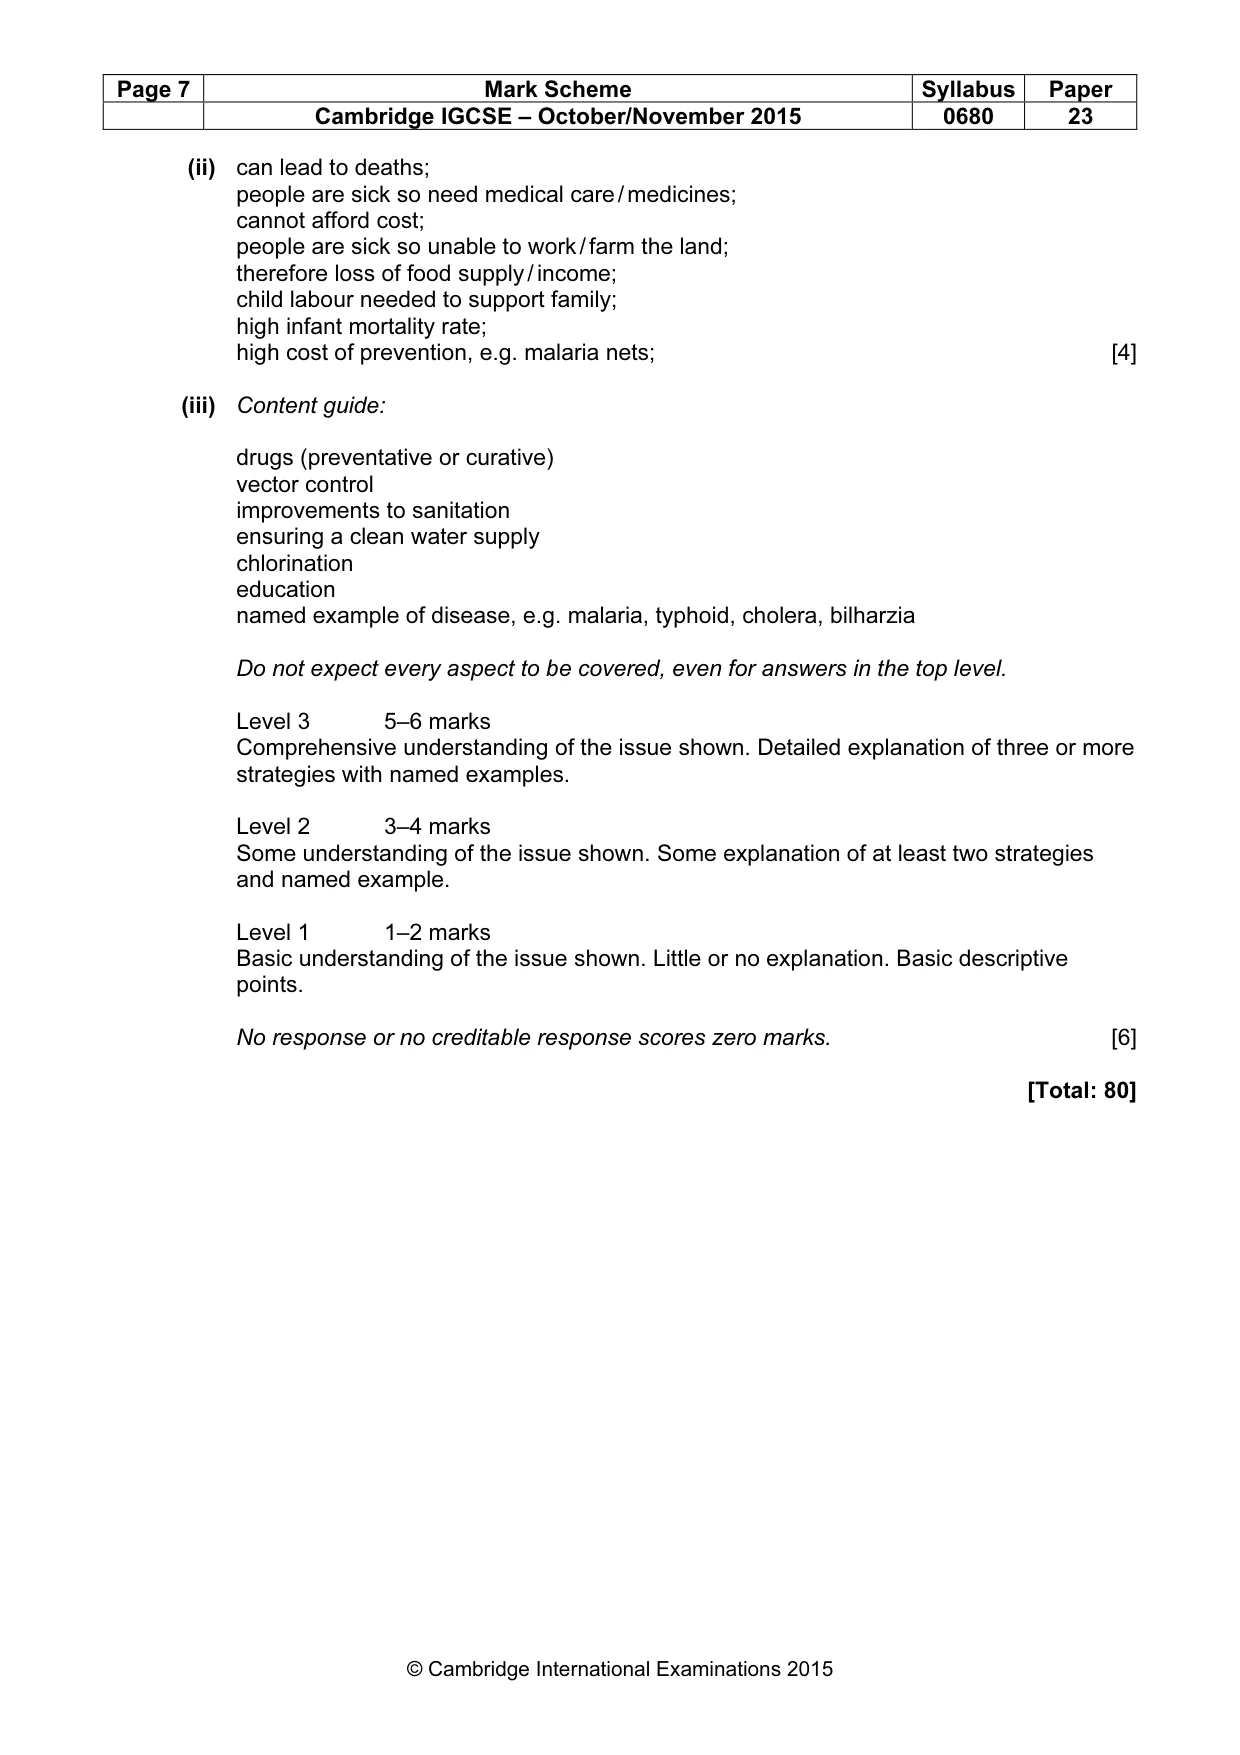
Mark scheme, page 7
Page 7 Mark Scheme Syllabus Paper Cambridge IGCSE – October/November 2015 0680 23 © Cambridge International Examinations 2015 (ii) can lead to deaths; people are sick so need medical care / medicines; cannot afford cost; people are sick so unable to work / farm the land; therefore loss of food supply / income; child labour needed to support family; high infant mortality rate; high cost of prevention, e.g. malaria nets; [4] (iii) Content guide: drugs (preventative or curative) vector control improvements to sanitation ensuring a clean water supply chlorination education named example of disease, e.g. malaria, typhoid, cholera, bilharzia Do not expect every aspect to be covered, even for answers in the top level. Level 3 5–6 marks Comprehensive understanding of the issue shown. Detailed explanation of three or more strategies with named examples. Level 2 3–4 marks Some understanding of the issue shown. Some explanation of at least two strategies and named example. Level 1 1–2 marks Basic understanding of the issue shown. Little or no explanation. Basic descriptive points. No response or no creditable response scores zero marks. [6] [Total: 80]
What you needed in this session
Cambridge’s own grade thresholds for 2015 Oct/Nov, Paper 2 · Variant 3. A higher threshold means an easier paper — the bar moves with how the cohort did.