Cambridge IGCSE Environmental Management 0680 — 2015 May/June Paper 1 · Variant 1
0680/11/M/J/15 · 60 marks · ≈68 min
The question paper and its mark scheme, free to read here and free to download. This is Cambridge’s own paper, exactly as it was sat.
Question paper16 pages


Mark scheme5 pages
Answers below. Sit the paper first if you are practising.
Paper as text
Question paper, page 1
This document consists of 15 printed pages and 1 blank page. DC (NF/SW) 92107/5 © UCLES 2015 [Turn over Cambridge International Examinations Cambridge International General Certificate of Secondary Education * 6 0 6 5 3 7 5 5 6 5 * ENVIRONMENTAL MANAGEMENT 0680/11 Paper 1 May/June 2015 1 hour 30 minutes Candidates answer on the Question Paper. No Additional Materials are required. READ THESE INSTRUCTIONS FIRST Write your Centre number, candidate number and name on all the work you hand in. Write in dark blue or black pen. You may use an HB pencil for any diagrams or graphs. Do not use staples, paper clips, glue or correction fluid. DO NOT WRITE IN ANY BARCODES. Answer all questions. Electronic calculators may be used. You may lose marks if you do not show your working or if you do not use appropriate units. At the end of the examination, fasten all your work securely together. The number of marks is given in brackets [ ] at the end of each question or part question.
Question paper, page 2
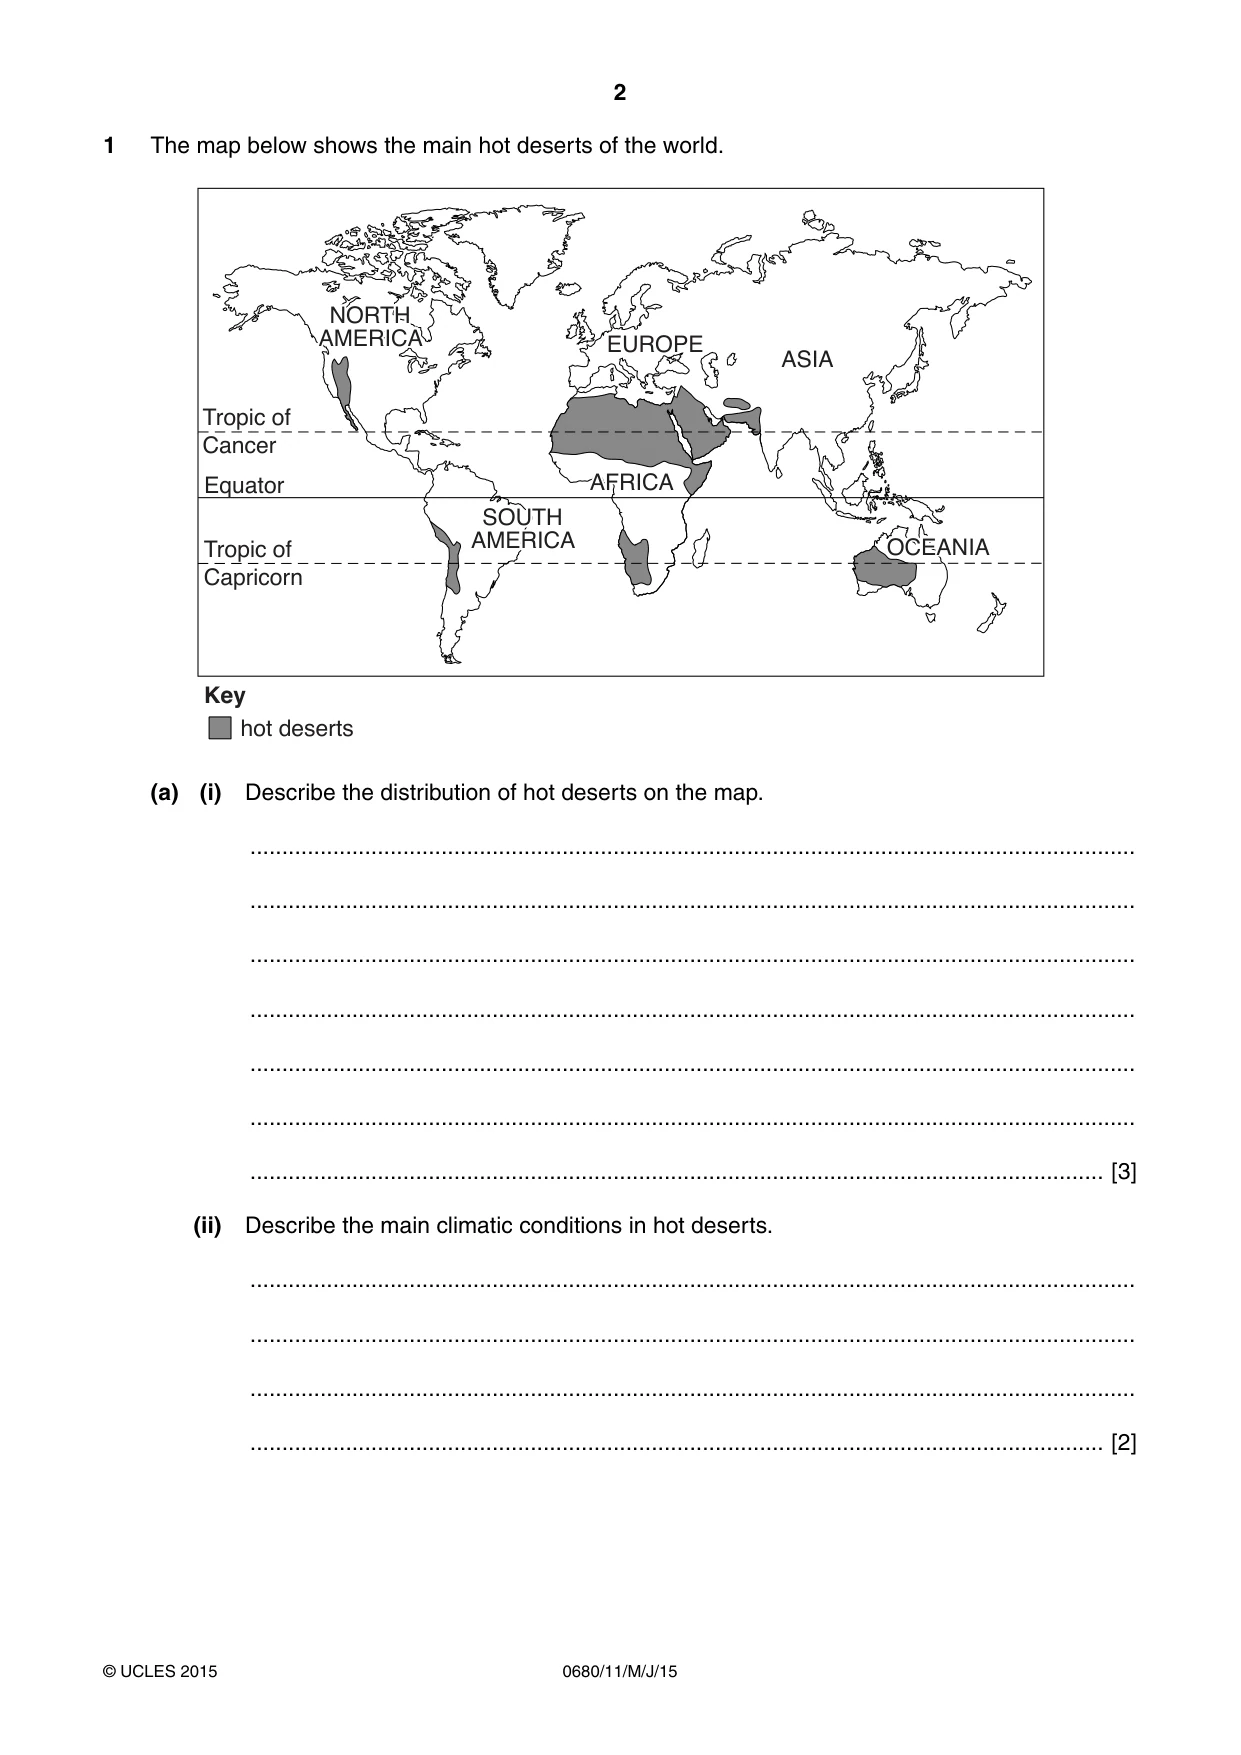
2 0680/11/M/J/15 © UCLES 2015 1 The map below shows the main hot deserts of the world. hot deserts Key Equator Tropic of Capricorn Tropic of Cancer NORTH AMERICA SOUTH AMERICA AFRICA EUROPE OCEANIA ASIA (a) (i) Describe the distribution of hot deserts on the map. … … … … … … … [3] (ii) Describe the main climatic conditions in hot deserts. … … … … [2]
Question paper, page 3
3 0680/11/M/J/15 © UCLES 2015 [Turn over (b) (i) Many parts of the world are becoming desert in a process called desertification. Explain the causes of desertification. … … … … [2] (ii) Desertification and soil erosion are often linked. State one strategy to prevent soil erosion and explain how it works. strategy … … … … explanation … … … … [3]
Question paper, page 4
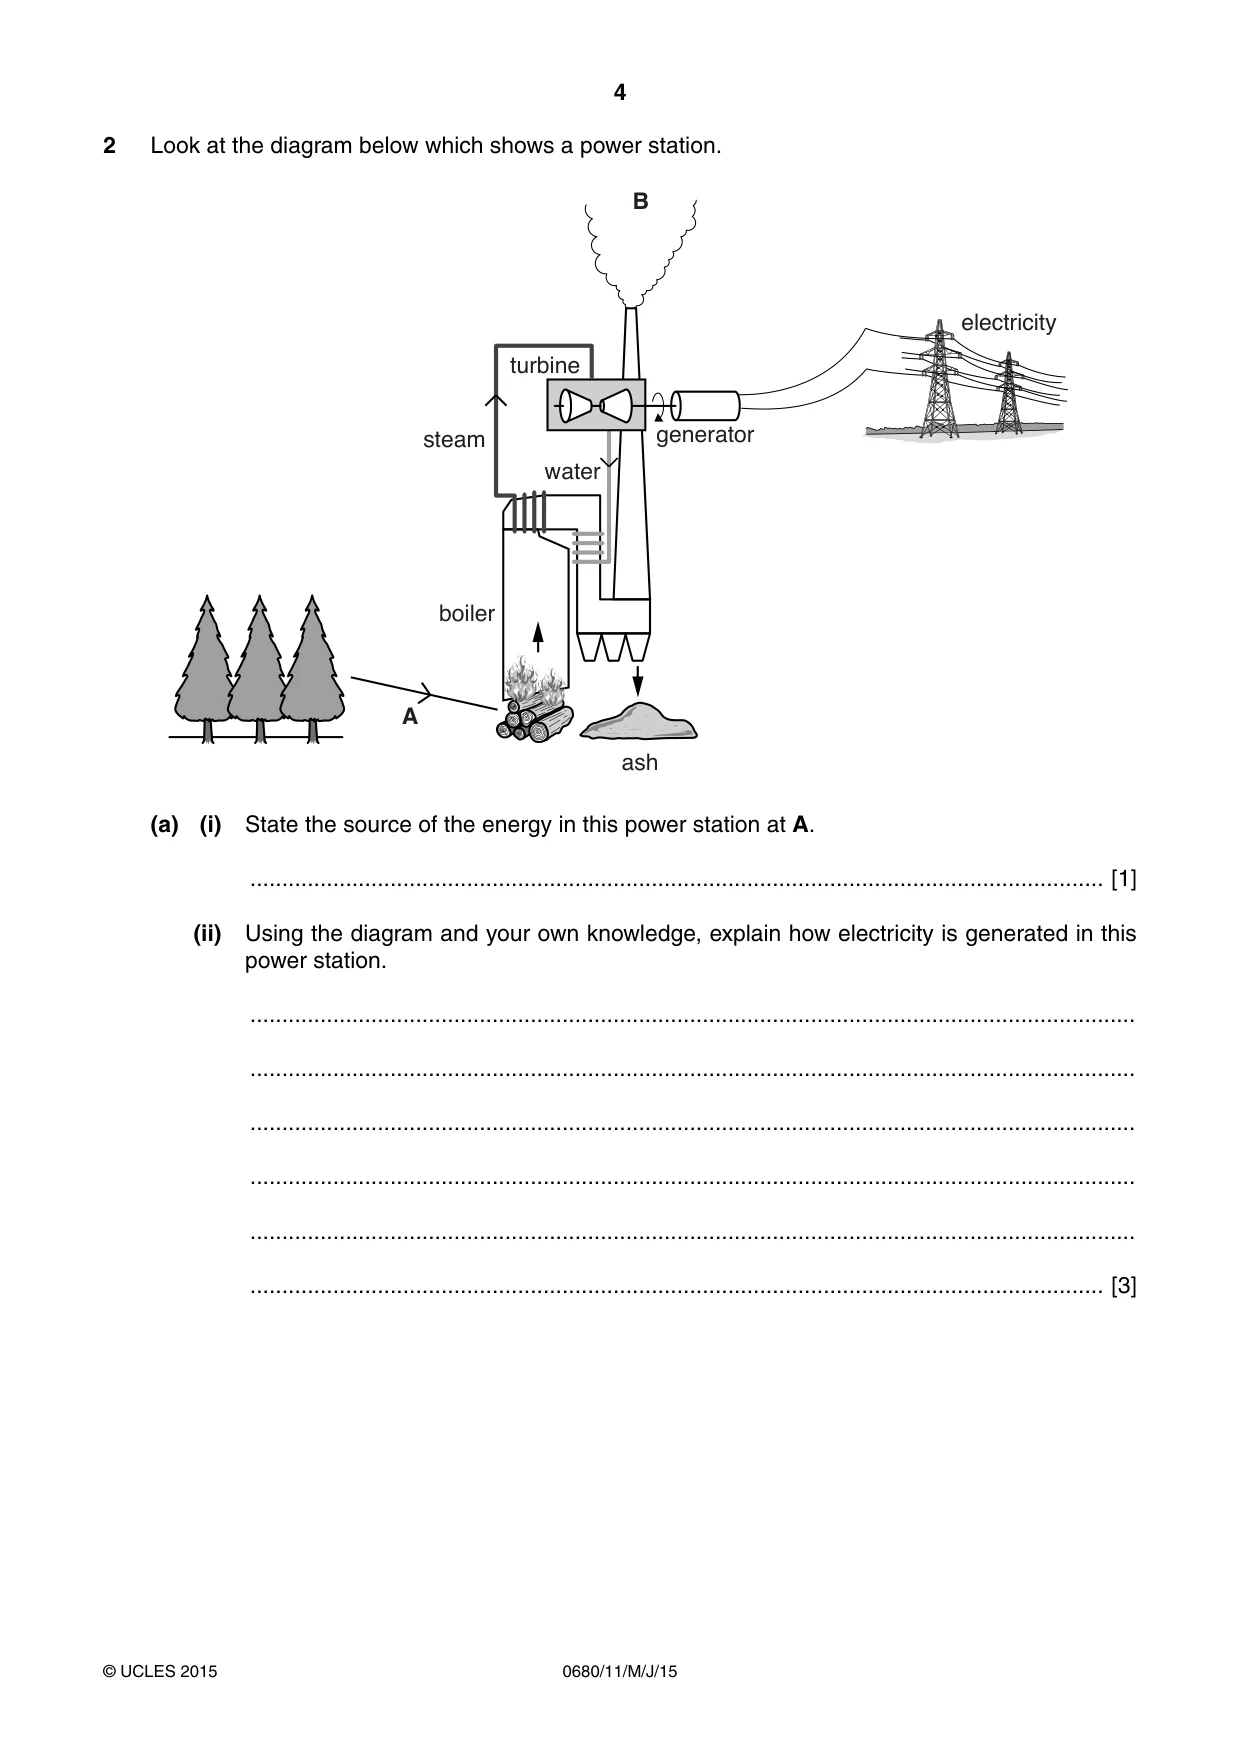
4 0680/11/M/J/15 © UCLES 2015 2 Look at the diagram below which shows a power station. boiler steam turbine water generator electricity ash A B (a) (i) State the source of the energy in this power station at A. … [1] (ii) Using the diagram and your own knowledge, explain how electricity is generated in this power station. … … … … … … [3]
Question paper, page 5
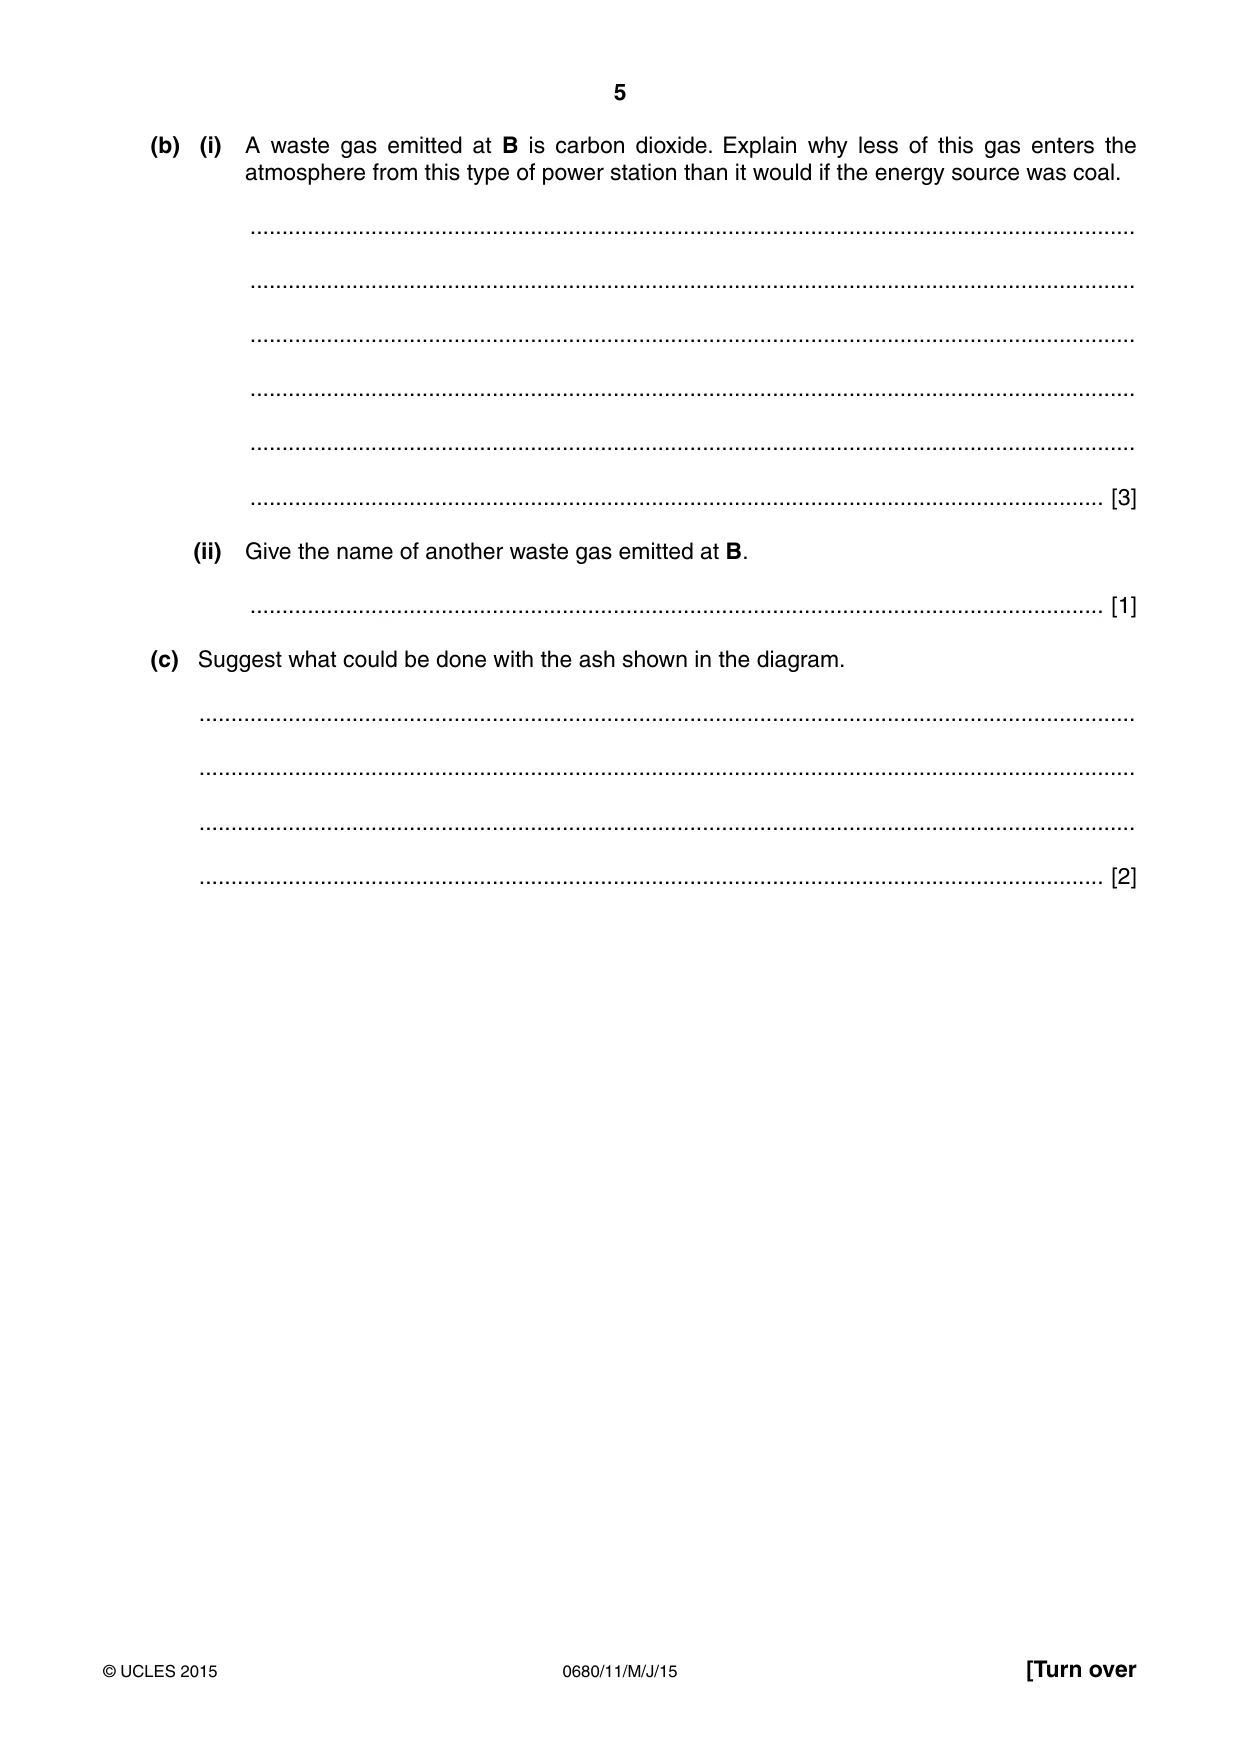
5 0680/11/M/J/15 © UCLES 2015 [Turn over (b) (i) A waste gas emitted at B is carbon dioxide. Explain why less of this gas enters the atmosphere from this type of power station than it would if the energy source was coal. … … … … … … [3] (ii) Give the name of another waste gas emitted at B. … [1] (c) Suggest what could be done with the ash shown in the diagram. … … … … [2]
Question paper, page 6
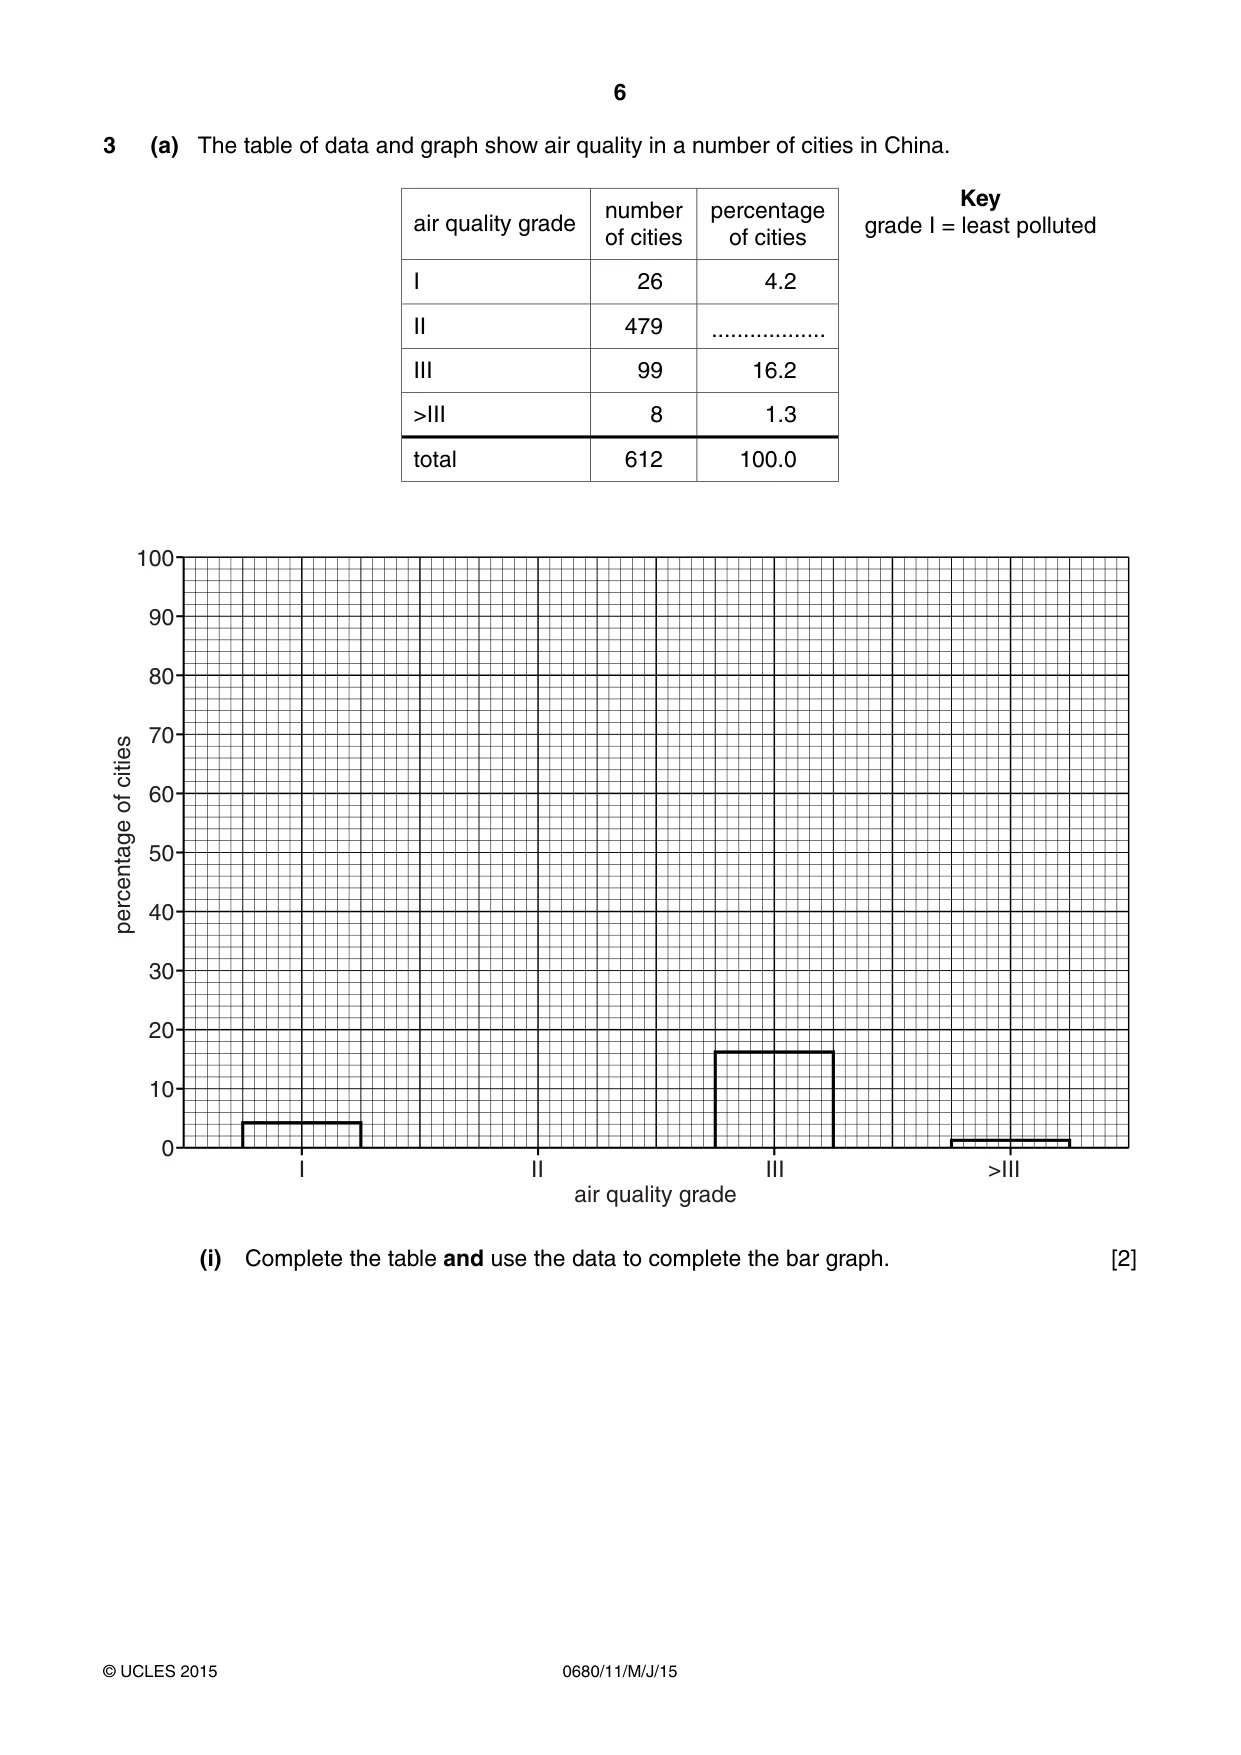
6 0680/11/M/J/15 © UCLES 2015 3 (a) The table of data and graph show air quality in a number of cities in China. air quality grade number of cities percentage of cities Key grade I = least polluted I 26 4.2 II 479 … III 99 16.2 >III 8 1.3 total 612 100.0 0 I II III air quality grade >III 10 20 30 40 50 60 percentage of cities 70 80 90 100 (i) Complete the table and use the data to complete the bar graph. [2]
Question paper, page 7
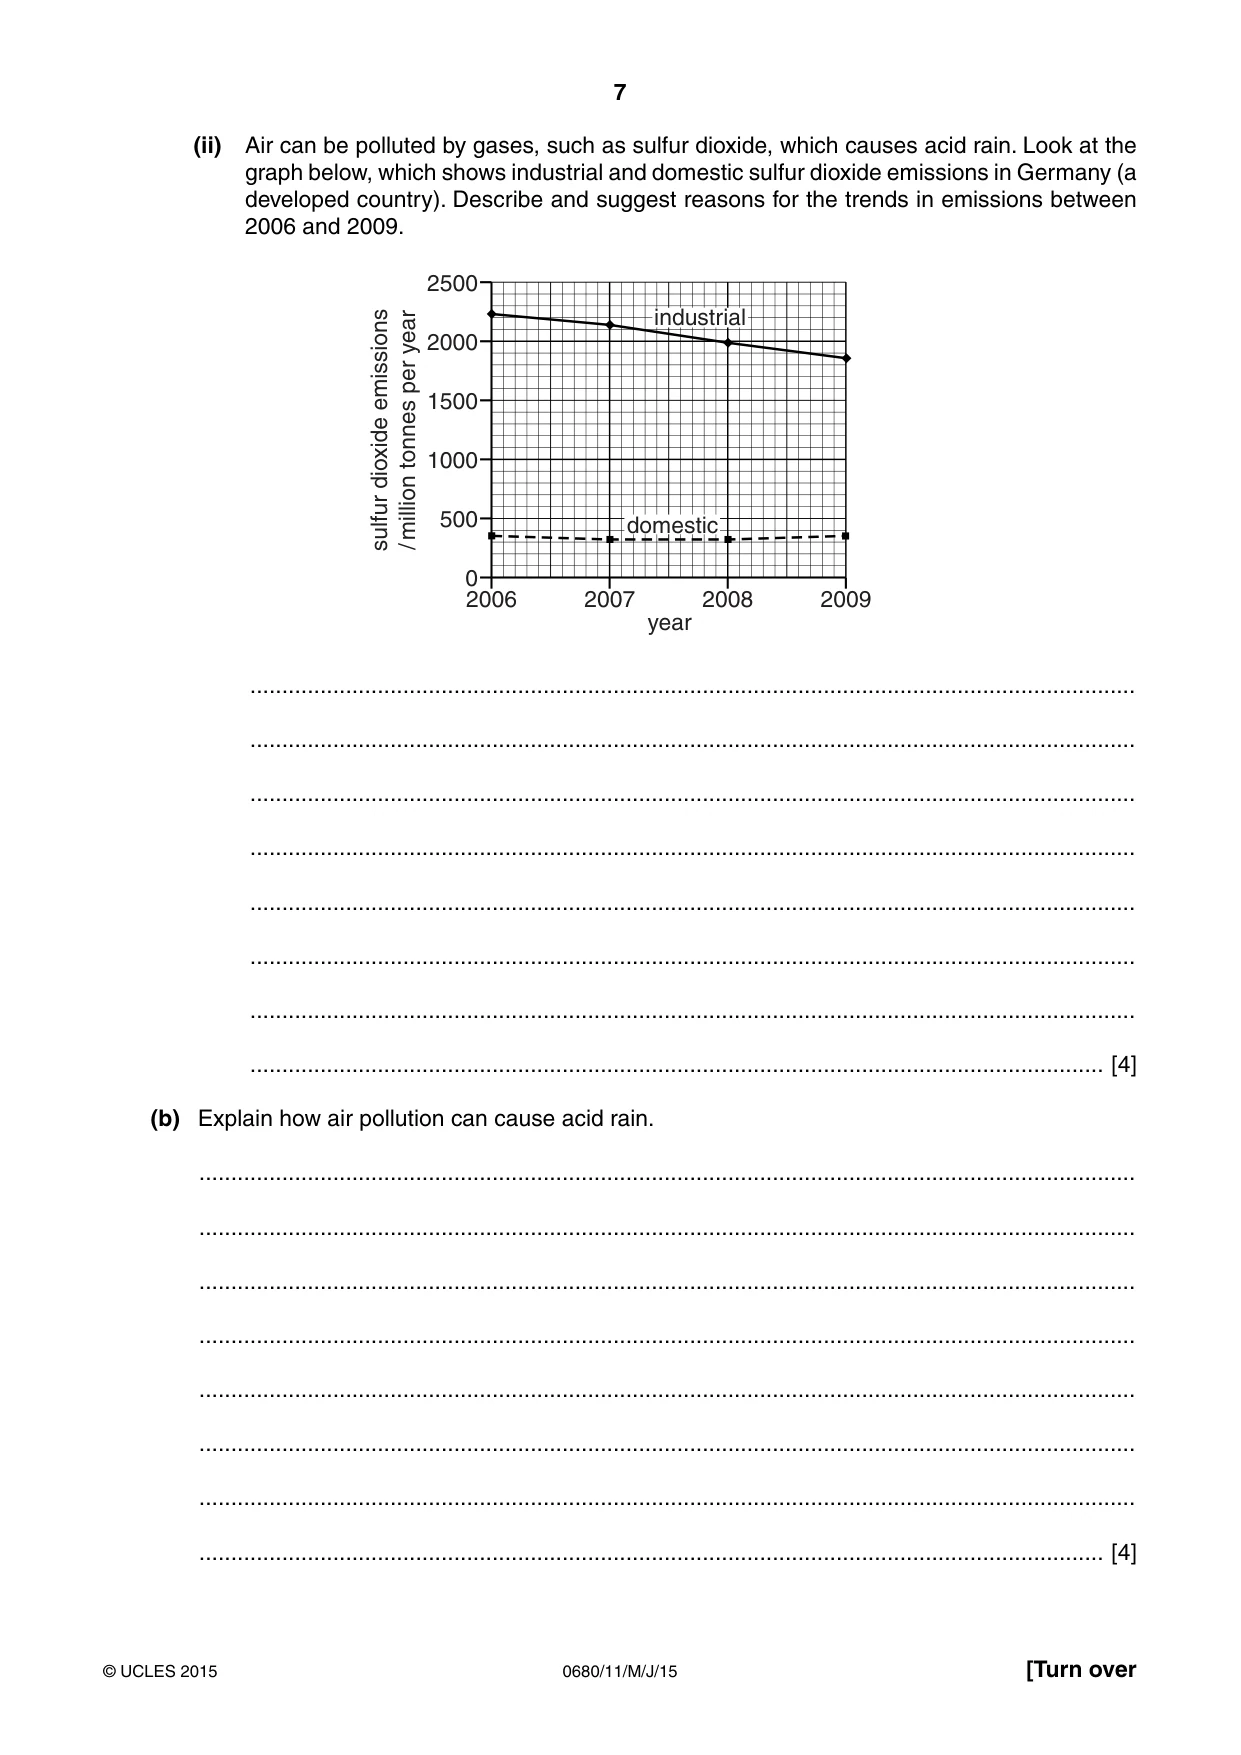
7 0680/11/M/J/15 © UCLES 2015 [Turn over (ii) Air can be polluted by gases, such as sulfur dioxide, which causes aci d rain. Look at the graph below, which shows industrial and domestic sulfur dioxide emissions in Germany (a developed country). Describe and suggest reasons for the trends in emissions between 2006 and 2009. 0 2006 2007 2008 year 2009 500 1000 1500 2000 2500 sulfur dioxide emissions / million tonnes per year industrial domestic … … … … … … … … [4] (b) Explain how air pollution can cause acid rain. … … … … … … … … [4]
Question paper, page 8
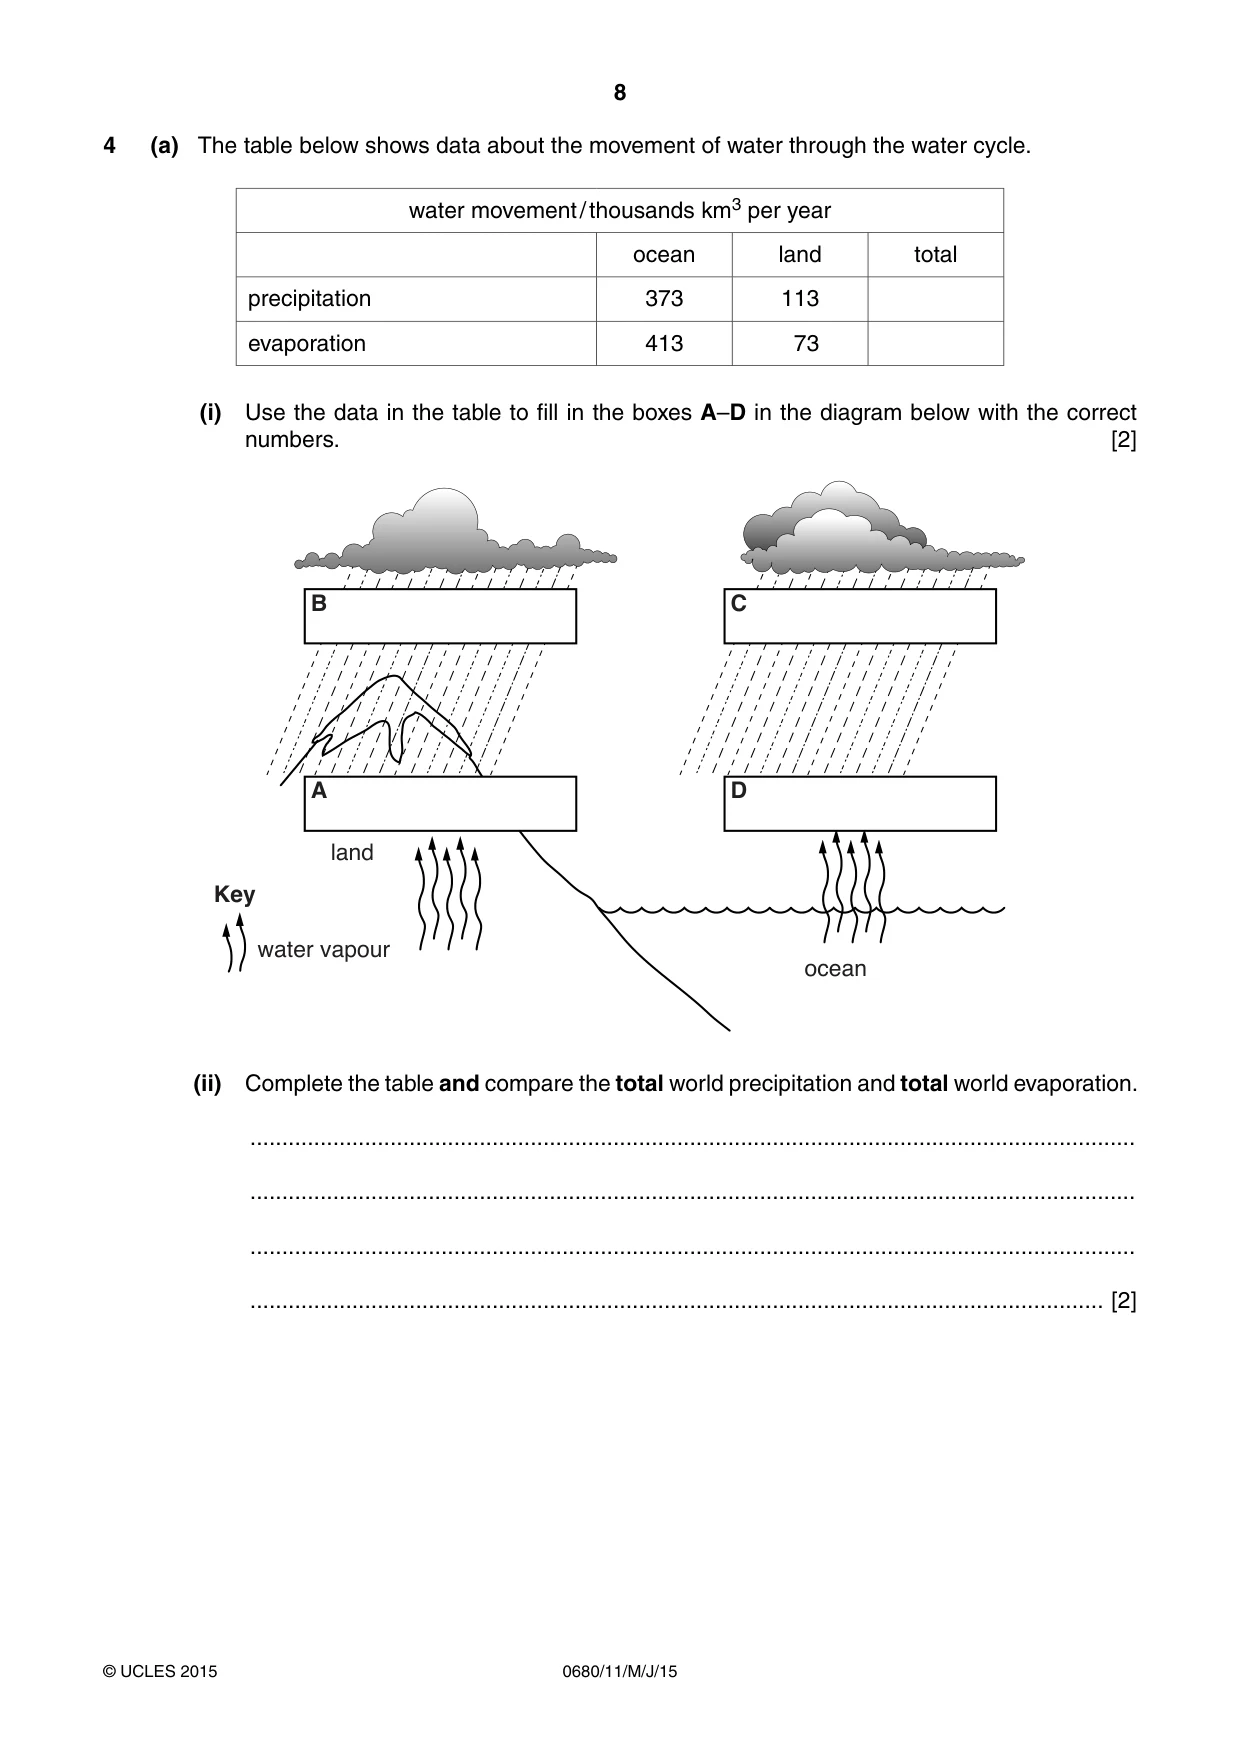
8 0680/11/M/J/15 © UCLES 2015 4 (a) The table below shows data about the movement of water through the water cycle. water movement / thousands km3 per year ocean land total precipitation 373 113 evaporation 413 73 (i) Use the data in the table to fill in the boxes A–D in the diagram below with the correct numbers. [2] B C A D land water vapour Key ocean (ii) Complete the table and compare the total world precipitation and total world evaporation. … … … … [2]
Question paper, page 9
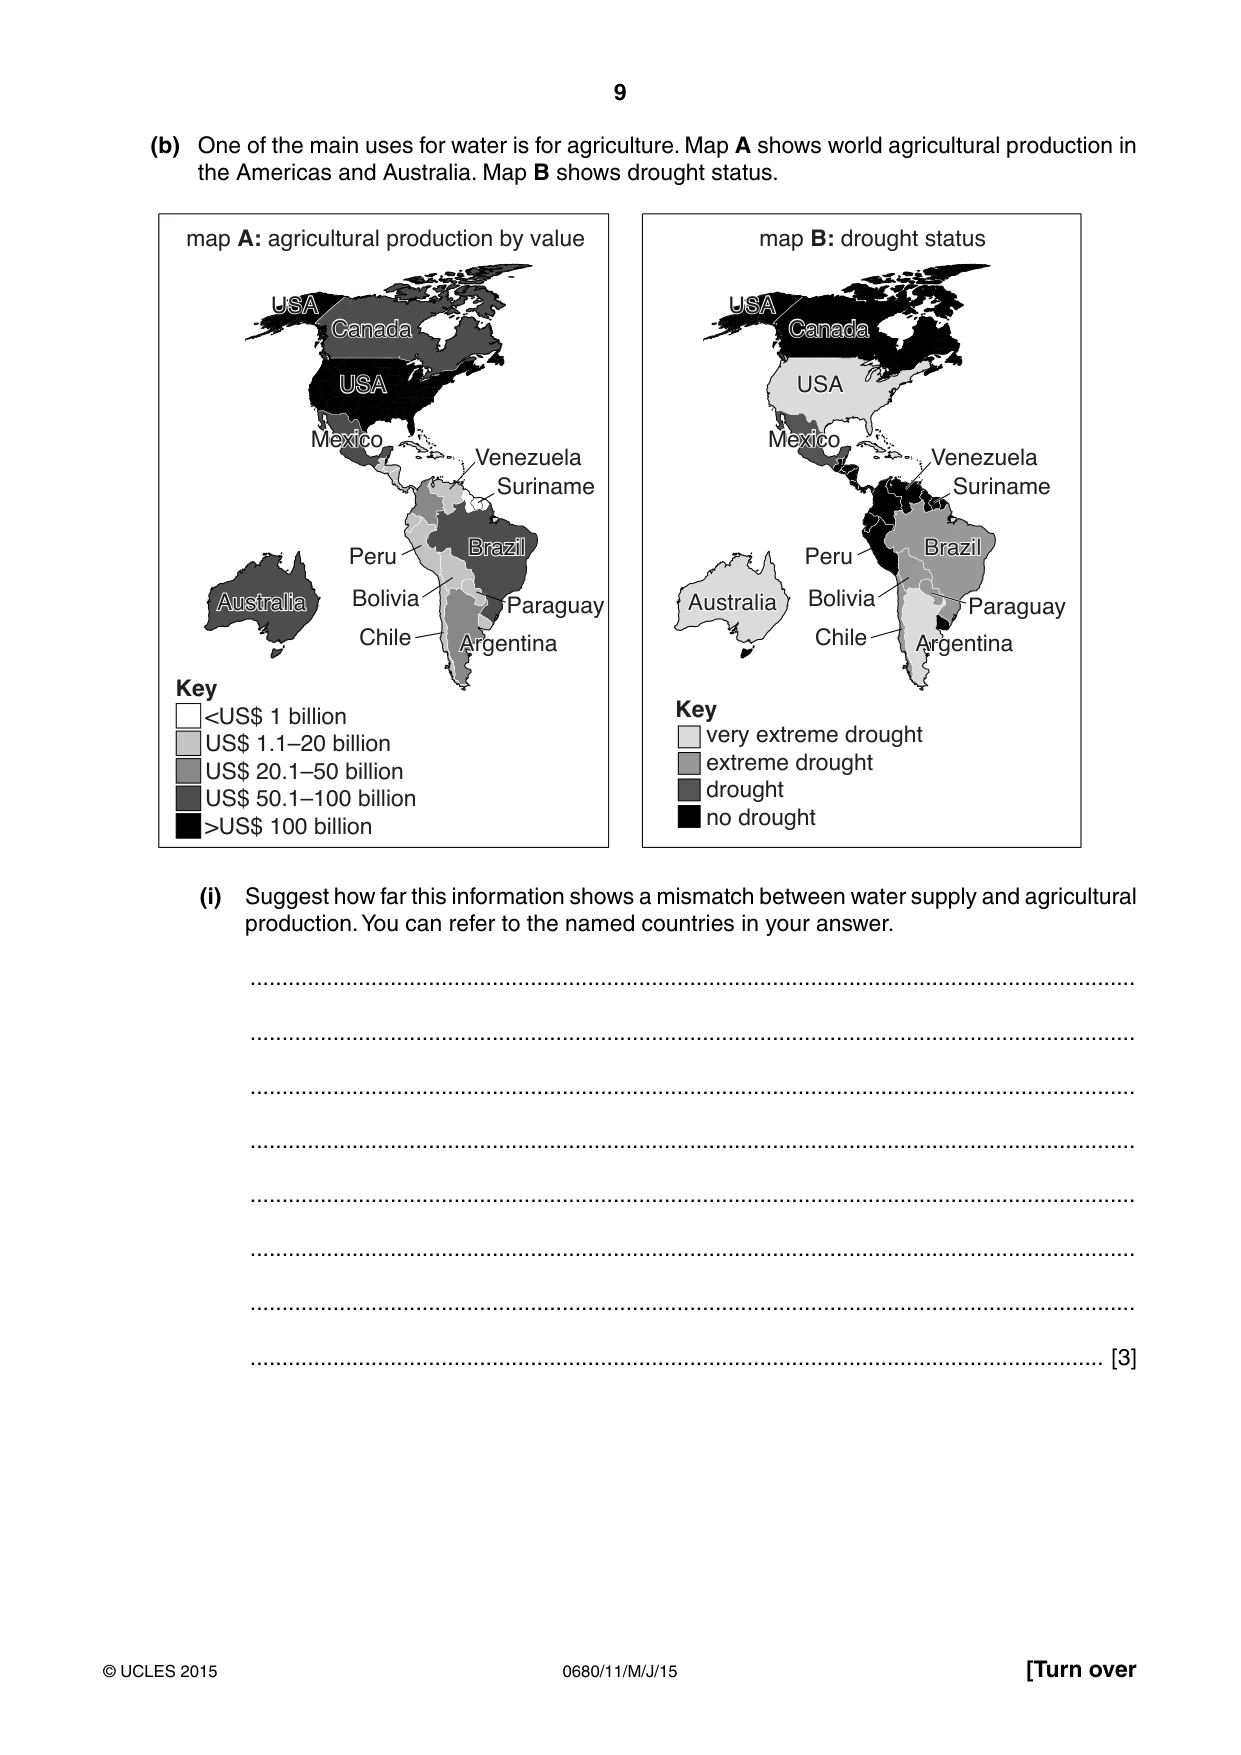
9 0680/11/M/J/15 © UCLES 2015 [Turn over (b) One of the main uses for water is for agriculture. Map A shows world agricultural production in the Americas and Australia. Map B shows drought status. very extreme drought extreme drought drought no drought <US$ 1 billion US$ 1.1–20 billion US$ 20.1–50 billion US$ 50.1–100 billion >US$ 100 billion Key map A: agricultural production by value map B: drought status Key Canada USA Peru Brazil Venezuela Paraguay Suriname Mexico Australia Australia Argentina Chile Bolivia USA Canada USA Mexico USA Peru Brazil Venezuela Paraguay Suriname Argentina Chile Bolivia (i) Suggest how far this information shows a mismatch between water supply and agricultural production. You can refer to the named countries in your answer. … … … … … … … … [3]
Question paper, page 10
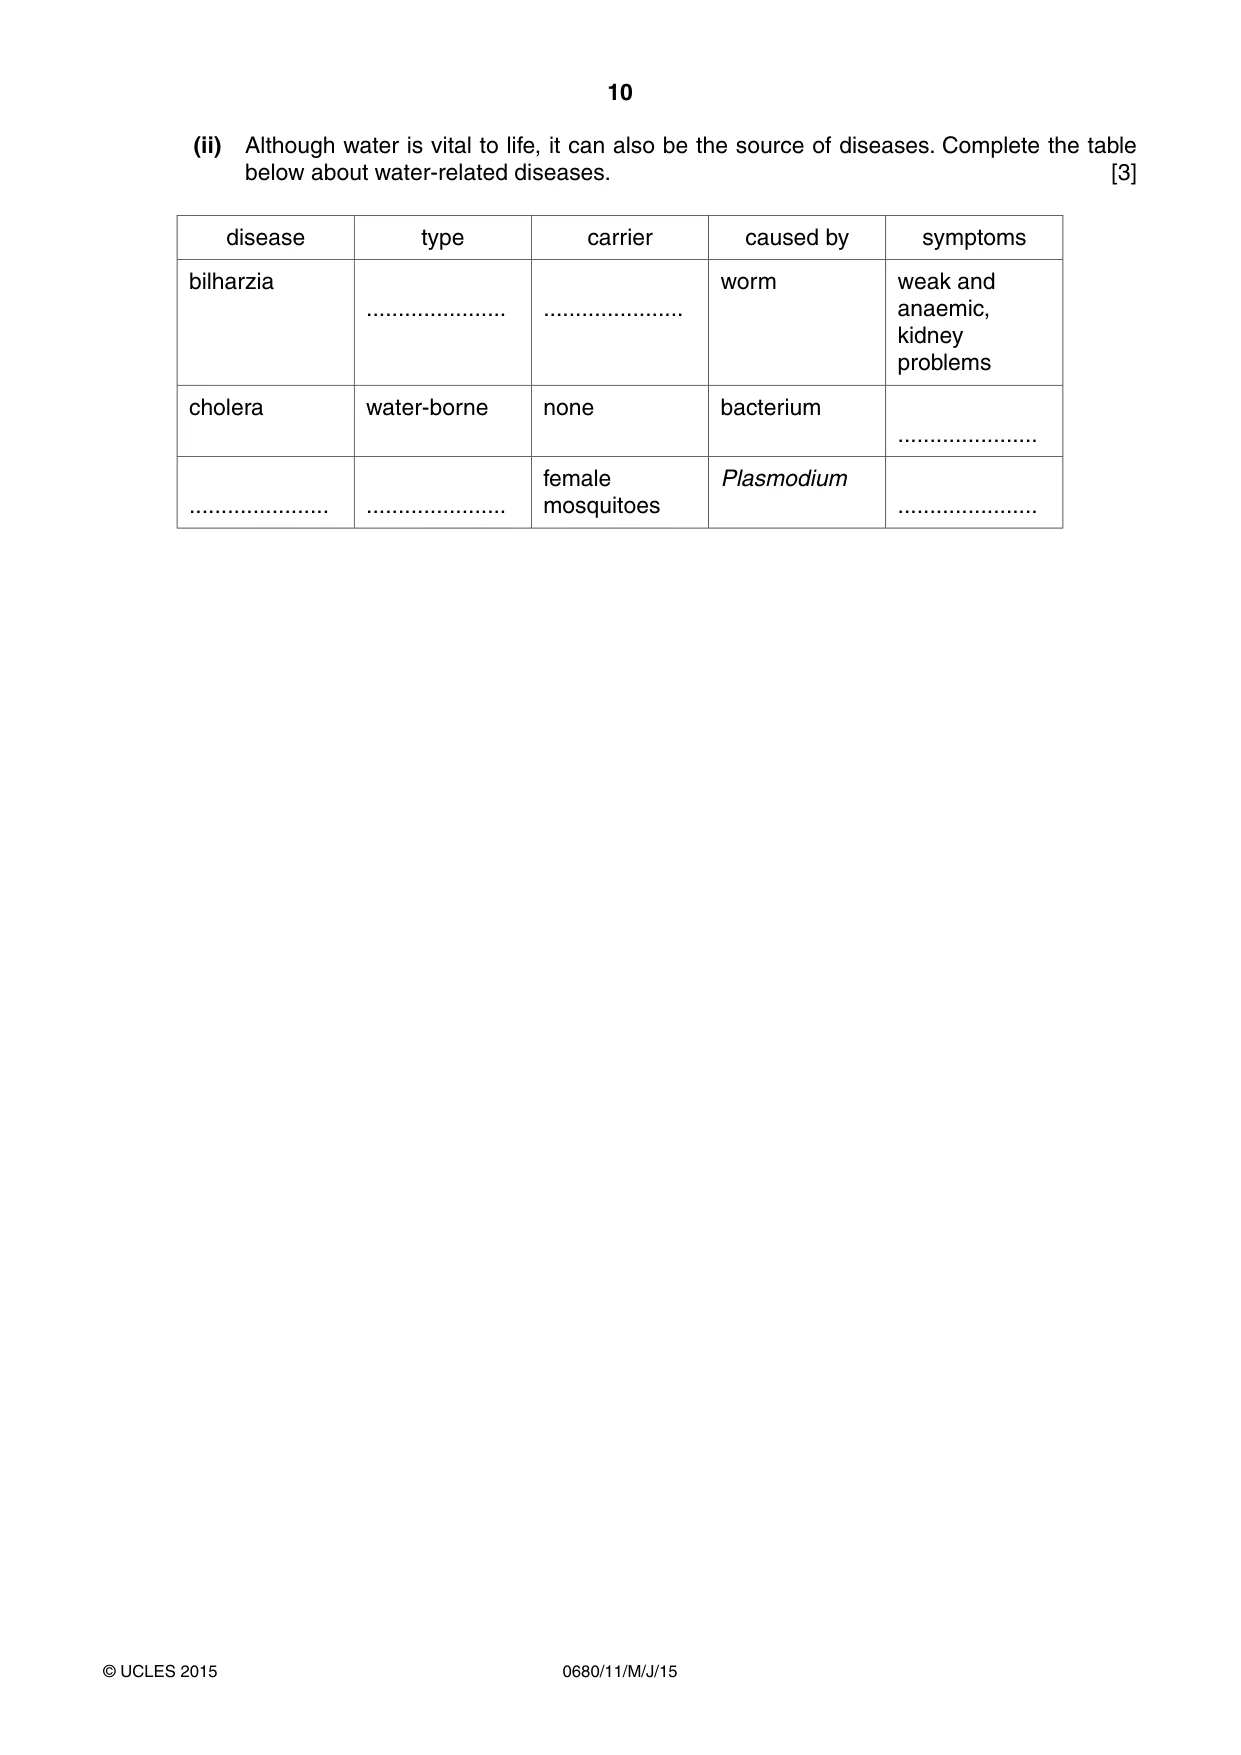
10 0680/11/M/J/15 © UCLES 2015 (ii) Although water is vital to life, it can also be the source of diseases. Complete the table below about water-related diseases. [3] disease type carrier caused by symptoms bilharzia … … worm weak and anaemic, kidney problems cholera water-borne none bacterium … … … female mosquitoes Plasmodium …
Question paper, page 11
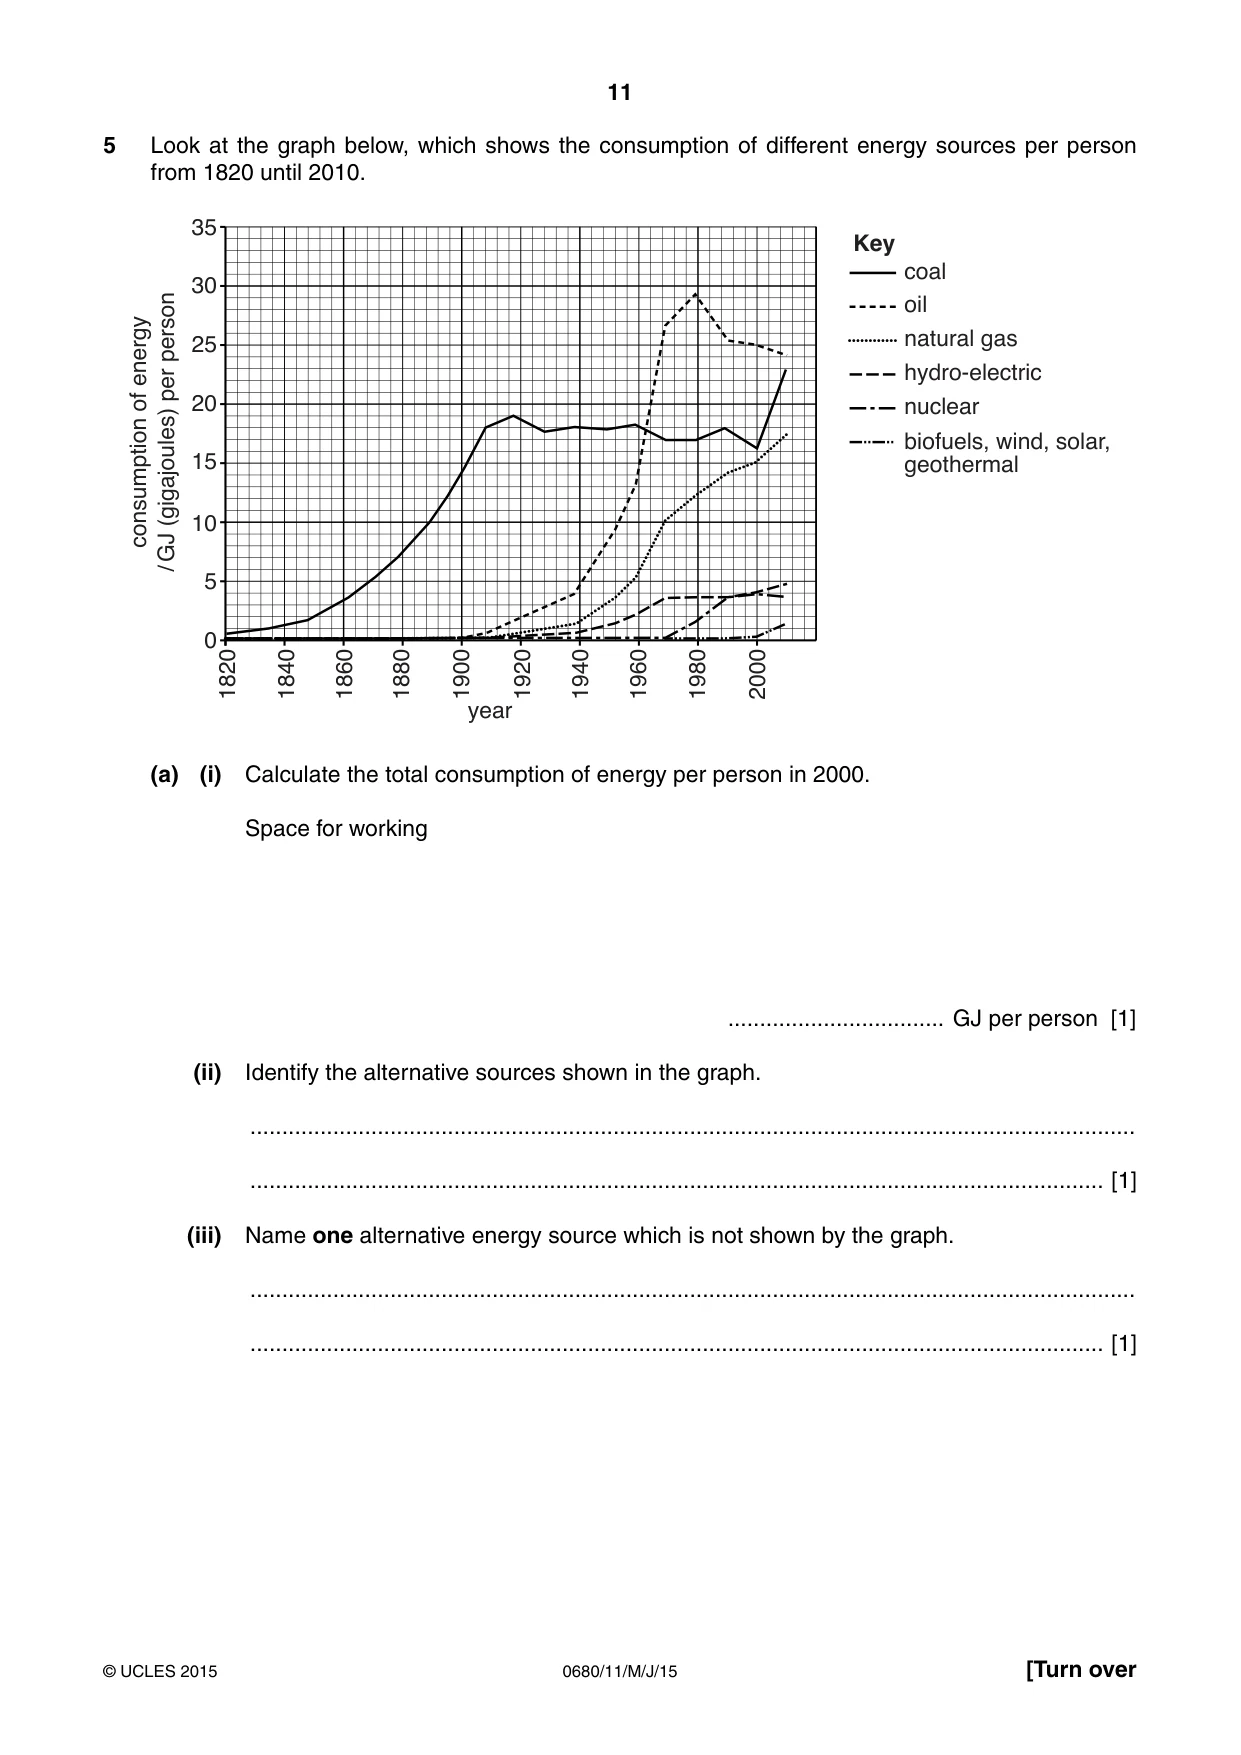
11 0680/11/M/J/15 © UCLES 2015 [Turn over 5 Look at the graph below, which shows the consumption of different energy sources per person from 1820 until 2010. 1980 2000 1960 1940 1920 1900 1880 1860 1840 1820 year 0 5 10 15 20 consumption of energy / GJ (gigajoules) per person 25 30 35 coal oil natural gas hydro-electric nuclear biofuels, wind, solar, geothermal Key (a) (i) Calculate the total consumption of energy per person in 2000. Space for working … GJ per person [1] (ii) Identify the alternative sources shown in the graph. … … [1] (iii) Name one alternative energy source which is not shown by the graph. … … [1]
Question paper, page 12
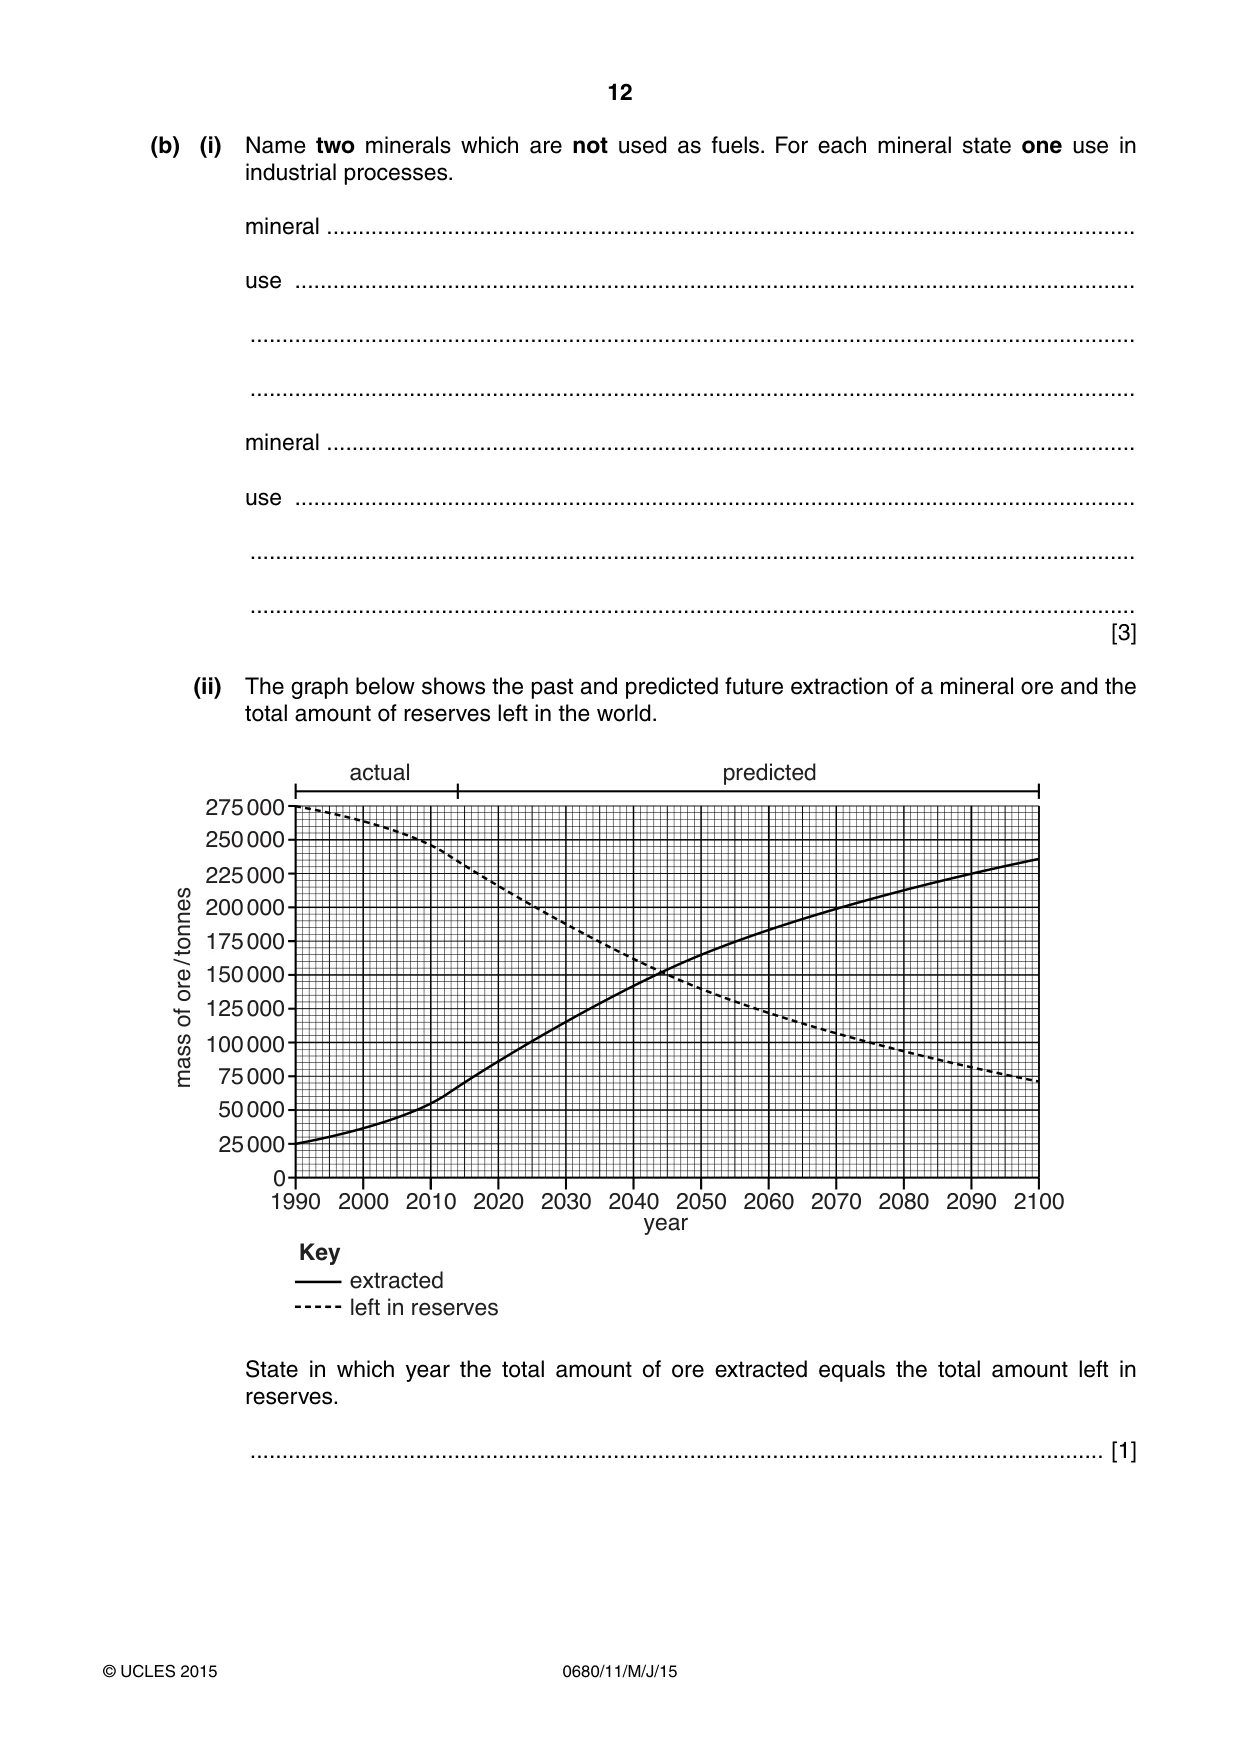
12 0680/11/M/J/15 © UCLES 2015 (b) (i) Name two minerals which are not used as fuels. For each mineral state one use in industrial processes. mineral … use … … … mineral … use … … … [3] (ii) The graph below shows the past and predicted future extraction of a mineral ore and the total amount of reserves left in the world. 1990 2000 year 0 25 000 50 000 75 000 100 000 mass of ore / tonnes 125 000 150 000 175 000 extracted left in reserves Key 2010 2020 2030 2040 2050 2060 2070 2080 2090 2100 200 000 225 000 250 000 275 000 actual predicted State in which year the total amount of ore extracted equals the total amount left in reserves. … [1]
Question paper, page 13
13 0680/11/M/J/15 © UCLES 2015 [Turn over (iii) Suggest ways in which the ore reserves could be made to last longer. … … … … … … [3]
Question paper, page 14
14 0680/11/M/J/15 © UCLES 2015 6 (a) Look at the photographs (A, B, C) of part of three wooden benches with vegetation growing on them in 2008. A B C (i) Complete the table below to match each photograph to the year in which each of the benches were new. year when bench was new letter of photograph 2001 … 2002 … 2003 … [2] (ii) The change in vegetation shown on the benches is called vegetational succession. Explain why vegetation changes over time in an area. Your answer should refer to soil changes and competition. … … … … … … … … [4]
Question paper, page 15
15 0680/11/M/J/15 © UCLES 2015 (b) Competition between weeds and crops is a problem for farmers because it reduces crop yield. Suggest how a farmer might reduce this problem. … … … … … … … … [4]
Question paper, page 16
16 0680/11/M/J/15 © UCLES 2015 BLANK PAGE Permission to reproduce items where third-party owned material protected by copyright is included has been sought and cleared where possible. Every reasonable effort has been made by the publisher (UCLES) to trace copyright holders, but if any items requiring clearance have unwittingly been included, the publisher will be pleased to make amends at the earliest possible opportunity. To avoid the issue of disclosure of answer-related information to candidates, all copyright acknowledgements are reproduced online in the Cambridge International Examinations Copyright Acknowledgements Booklet. This is produced for each series of examinations and is freely available to download at www.cie.org.uk after the live examination series. Cambridge International Examinations is part of the Cambridge Assessment Group. Cambridge Assessment is the brand name of University of Cambridge Local Examinations Syndicate (UCLES), which is itself a department of the University of Cambridge.
Mark scheme, page 1
® IGCSE is the registered trademark of Cambridge International Examinations. CAMBRIDGE INTERNATIONAL EXAMINATIONS Cambridge International General Certificate of Secondary Education MARK SCHEME for the May/June 2015 series 0680 ENVIRONMENTAL MANAGEMENT 0680/11 Paper 1, maximum raw mark 60 This mark scheme is published as an aid to teachers and candidates, to indicate the requirements of the examination. It shows the basis on which Examiners were instructed to award marks. It does not indicate the details of the discussions that took place at an Examiners’ meeting before marking began, which would have considered the acceptability of alternative answers. Mark schemes should be read in conjunction with the question paper and the Principal Examiner Report for Teachers. Cambridge will not enter into discussions about these mark schemes. Cambridge is publishing the mark schemes for the May/June 2015 series for most Cambridge IGCSE®, Cambridge International A and AS Level components and some Cambridge O Level components.
Mark scheme, page 2
Page 2 Mark Scheme Syllabus Paper Cambridge IGCSE – May/June 2015 0680 11 © Cambridge International Examinations 2015 1 (a) (i) mostly astride / in tropics / between tropics / (the US / SW USA / Californian) desert; ref. to further point about tropics, e.g. (largest desert / 1 or 2) on Tropic of Cancer / (most deserts / 3) on Tropic of Capricorn; (mostly) on west of (continent / coasts) / eq.; correct ref. to size of desert in Africa / Arabia / Australia; none in high latitudes / eq.; [3] (ii) dry / low rainfall; high temperatures (not just hot / very hot) (in day); cold at night; strong winds; [2] (b) (i) over(grazing / cultivation); deforestation / eq.; soil erosion / soil degradation / loss of nutrients; climate change; (leading to) temperature rise / reduced rainfall; [2] (ii) tree planting (accept afforestation); (roots) bind soil / increase intercepted rainfall / shelter from wind erosion; stops being blown away / washed away; terracing / build barrier across slope; soil is on flatter land; stops soil being blown away / washed away; contour ploughing / ploughing around the slope; reduces run-off; stops soil being washed away; wind breaks; plant trees; stops soil being blown away / washed away; [3] 2 (a) (i) fuelwood / wood / biomass / plants / timber; [1] (ii) burning / combusting / eq. wood / eq.; turns water to steam; this turns / moves turbine; [3] (b) (i) ref. plants absorb carbon dioxide from atmosphere; in photosynthesis / eq.; net CO2 emission to atmosphere is zero / reduced; ref. carbon neutral; ORA for coal for any of the above; One mark for idea of coal having higher proportion of carbon / ORA; [3] (ii) carbon monoxide / water vapour / sulfur dioxide / (accept SO2) / nitrogen oxides / NOx; [1]
Mark scheme, page 3
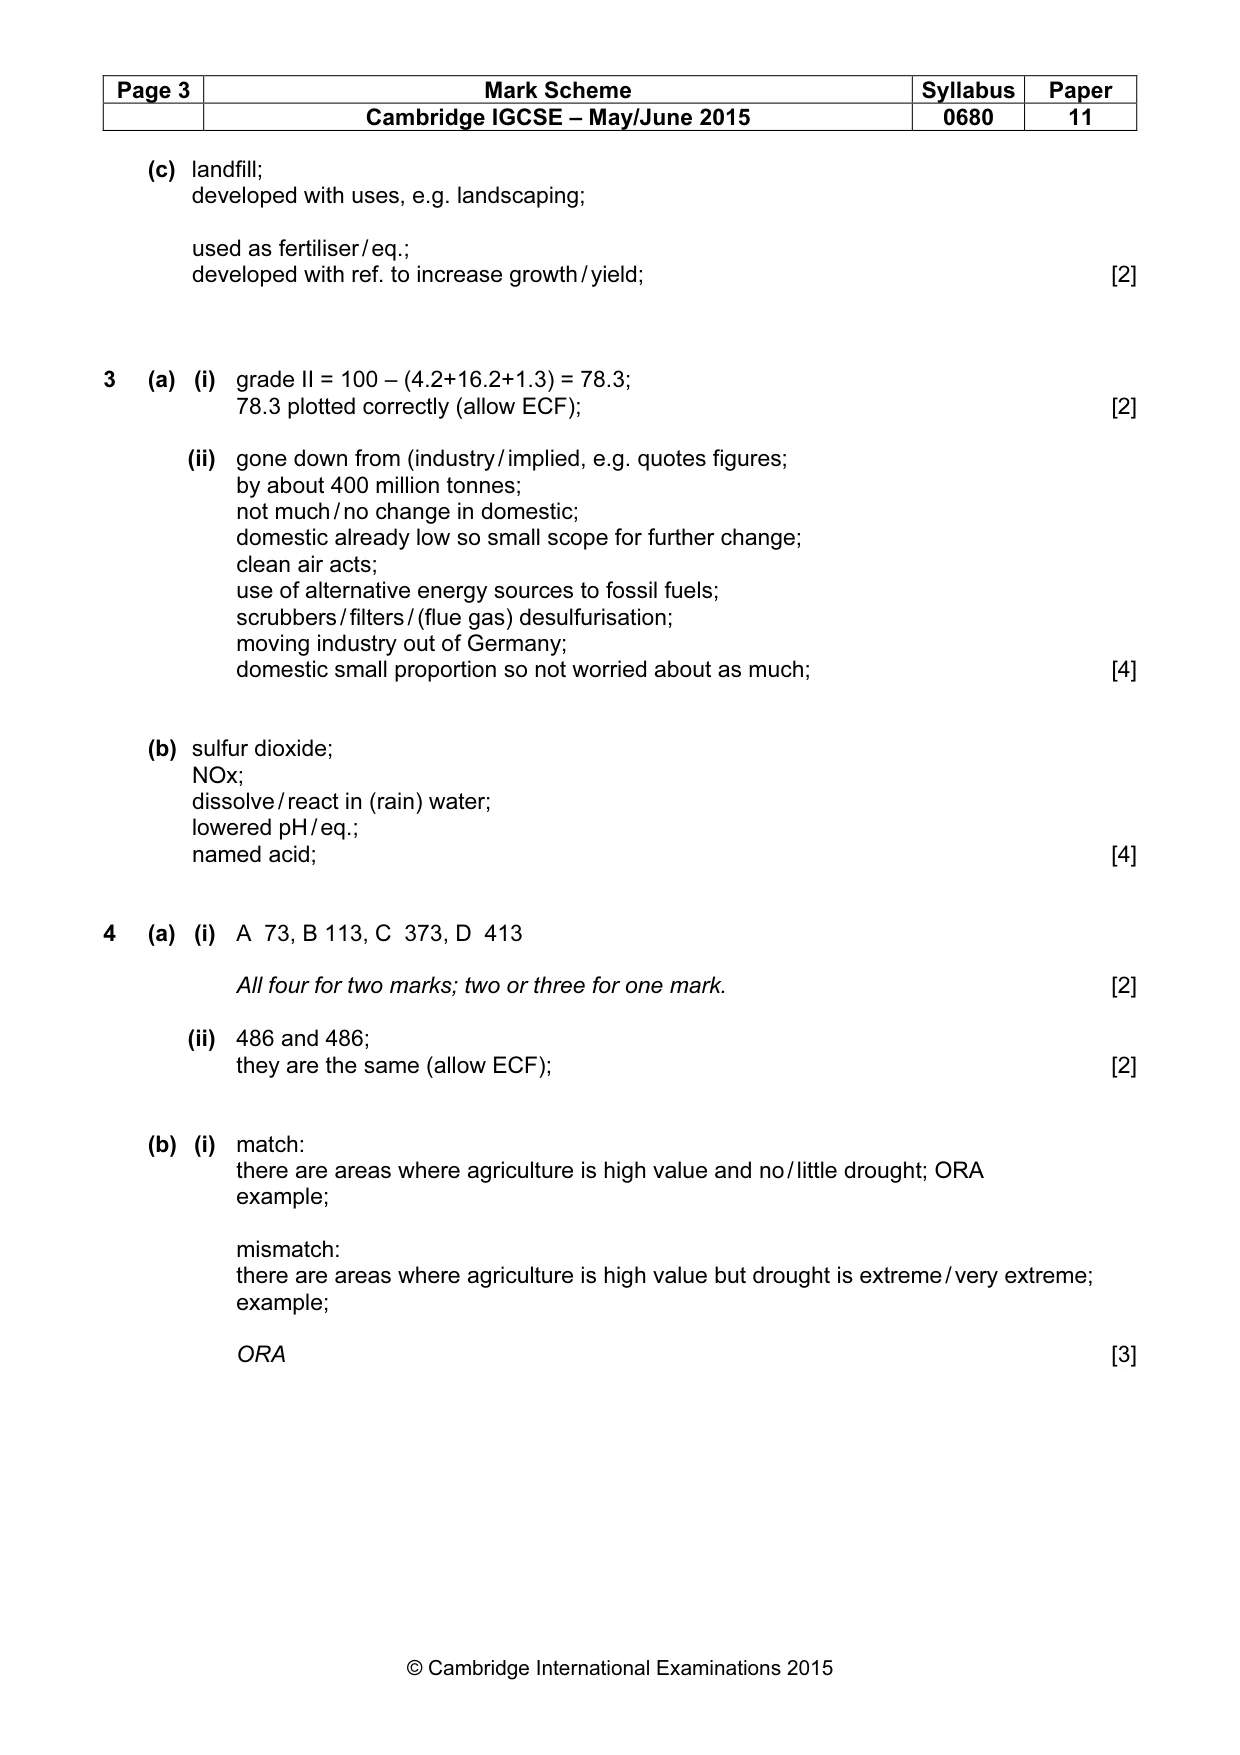
Page 3 Mark Scheme Syllabus Paper Cambridge IGCSE – May/June 2015 0680 11 © Cambridge International Examinations 2015 (c) landfill; developed with uses, e.g. landscaping; used as fertiliser / eq.; developed with ref. to increase growth / yield; [2] 3 (a) (i) grade II = 100 – (4.2+16.2+1.3) = 78.3; 78.3 plotted correctly (allow ECF); [2] (ii) gone down from (industry / implied, e.g. quotes figures; by about 400 million tonnes; not much / no change in domestic; domestic already low so small scope for further change; clean air acts; use of alternative energy sources to fossil fuels; scrubbers / filters / (flue gas) desulfurisation; moving industry out of Germany; domestic small proportion so not worried about as much; [4] (b) sulfur dioxide; NOx; dissolve / react in (rain) water; lowered pH / eq.; named acid; [4] 4 (a) (i) A 73, B 113, C 373, D 413 All four for two marks; two or three for one mark. [2] (ii) 486 and 486; they are the same (allow ECF); [2] (b) (i) match: there are areas where agriculture is high value and no / little drought; ORA example; mismatch: there are areas where agriculture is high value but drought is extreme / very extreme; example; ORA [3]
Mark scheme, page 4
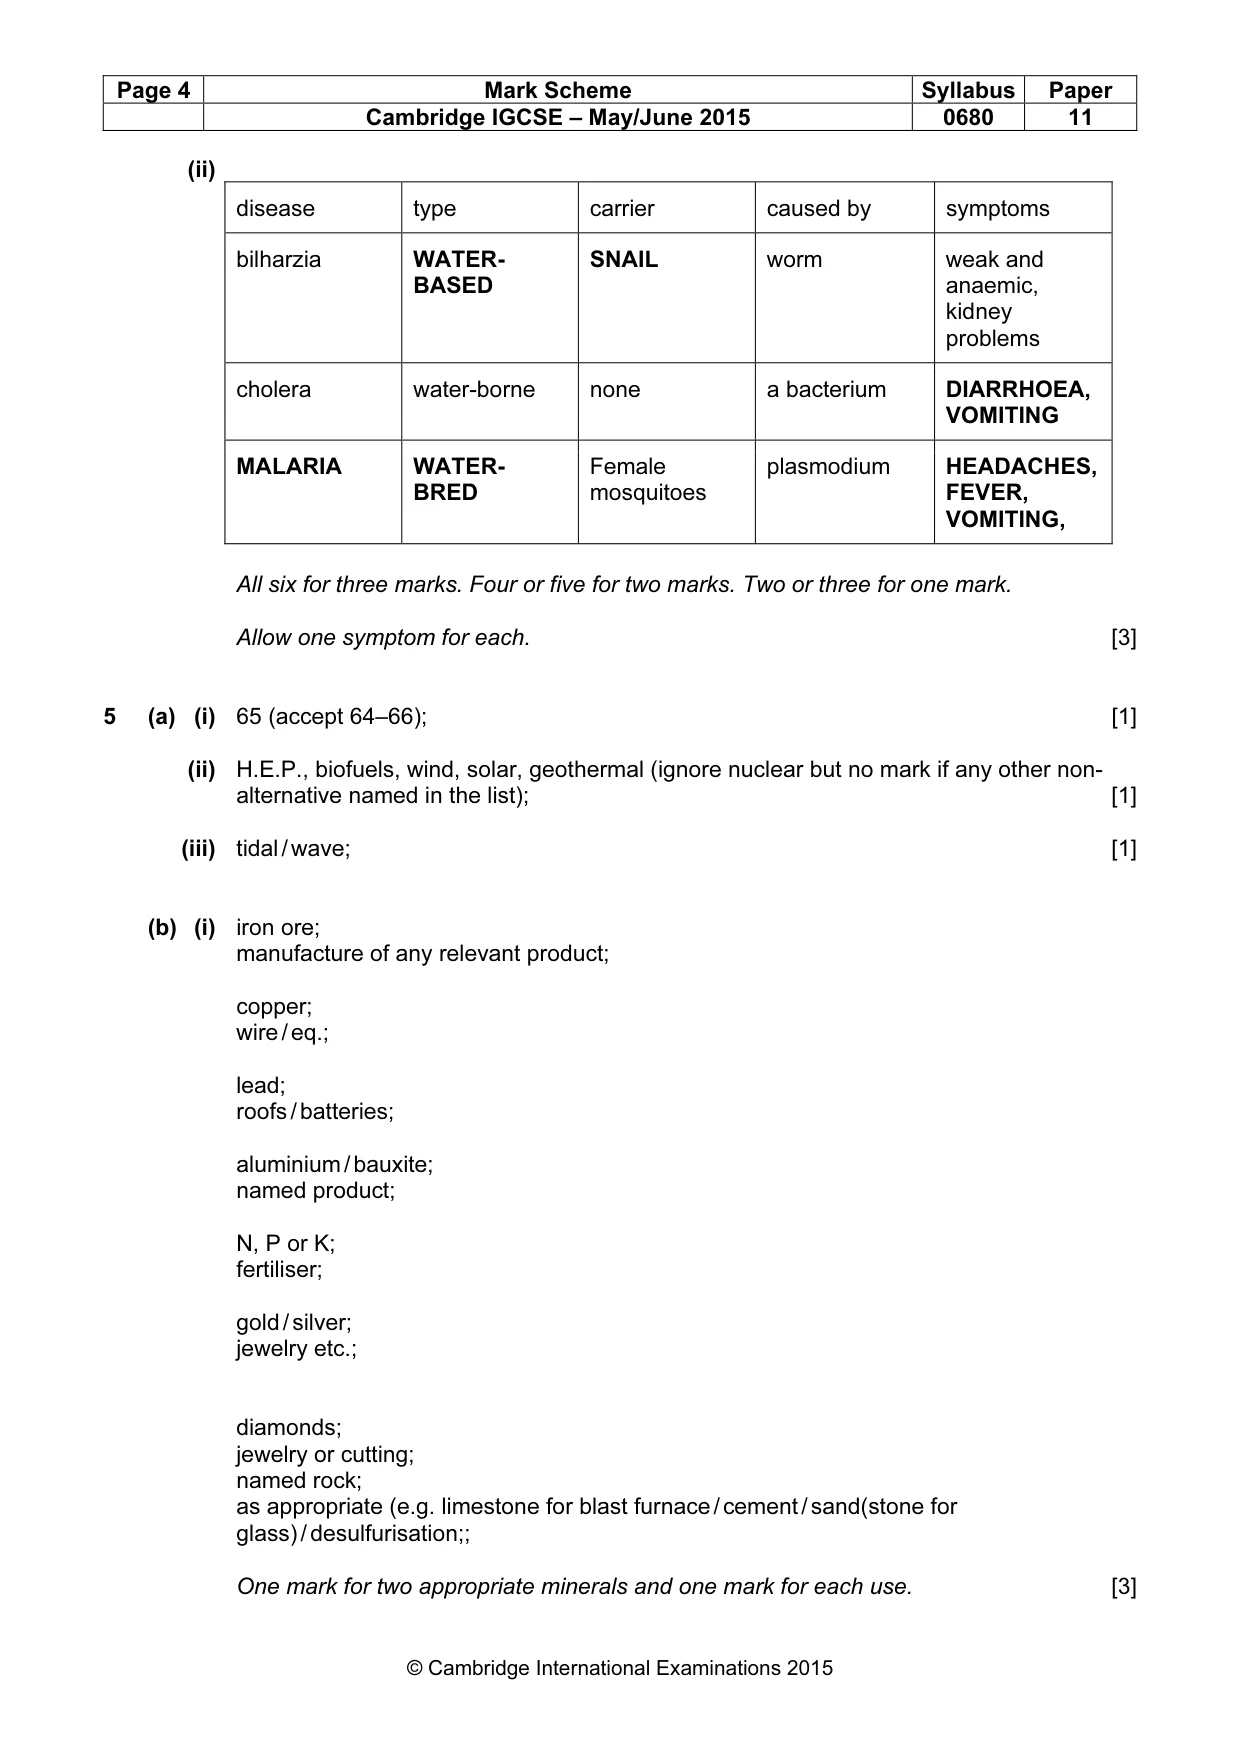
Page 4 Mark Scheme Syllabus Paper Cambridge IGCSE – May/June 2015 0680 11 © Cambridge International Examinations 2015 (ii) disease type carrier caused by symptoms bilharzia WATER- BASED SNAIL worm weak and anaemic, kidney problems cholera water-borne none a bacterium DIARRHOEA, VOMITING MALARIA WATER- BRED Female mosquitoes plasmodium HEADACHES, FEVER, VOMITING, All six for three marks. Four or five for two marks. Two or three for one mark. Allow one symptom for each. [3] 5 (a) (i) 65 (accept 64–66); [1] (ii) H.E.P., biofuels, wind, solar, geothermal (ignore nuclear but no mark if any other non- alternative named in the list); [1] (iii) tidal / wave; [1] (b) (i) iron ore; manufacture of any relevant product; copper; wire / eq.; lead; roofs / batteries; aluminium / bauxite; named product; N, P or K; fertiliser; gold / silver; jewelry etc.; diamonds; jewelry or cutting; named rock; as appropriate (e.g. limestone for blast furnace / cement / sand(stone for glass) / desulfurisation;; One mark for two appropriate minerals and one mark for each use. [3]
Mark scheme, page 5
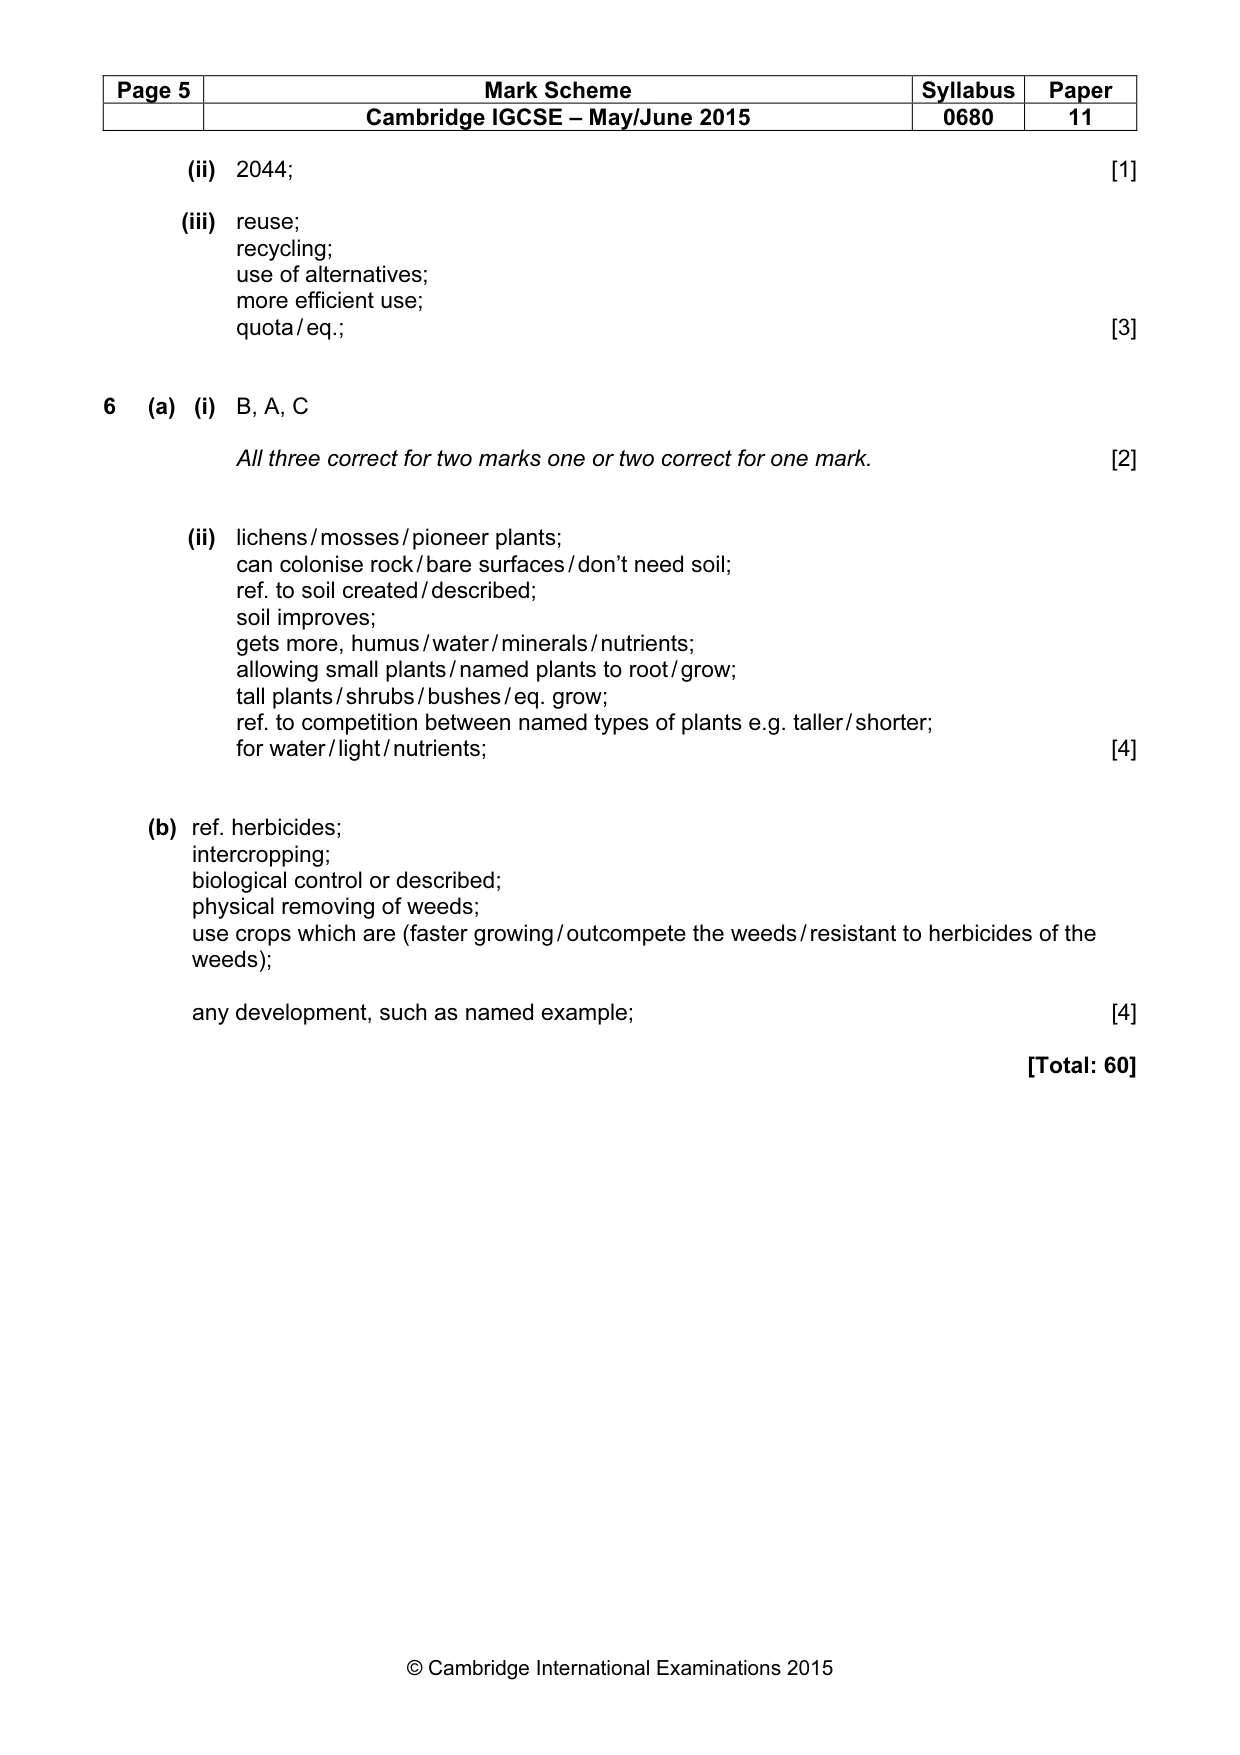
Page 5 Mark Scheme Syllabus Paper Cambridge IGCSE – May/June 2015 0680 11 © Cambridge International Examinations 2015 (ii) 2044; [1] (iii) reuse; recycling; use of alternatives; more efficient use; quota / eq.; [3] 6 (a) (i) B, A, C All three correct for two marks one or two correct for one mark. [2] (ii) lichens / mosses / pioneer plants; can colonise rock / bare surfaces / don’t need soil; ref. to soil created / described; soil improves; gets more, humus / water / minerals / nutrients; allowing small plants / named plants to root / grow; tall plants / shrubs / bushes / eq. grow; ref. to competition between named types of plants e.g. taller / shorter; for water / light / nutrients; [4] (b) ref. herbicides; intercropping; biological control or described; physical removing of weeds; use crops which are (faster growing / outcompete the weeds / resistant to herbicides of the weeds); any development, such as named example; [4] [Total: 60]
What you needed in this session
Cambridge’s own grade thresholds for 2015 May/June, Paper 1 · Variant 1. A higher threshold means an easier paper — the bar moves with how the cohort did.