Cambridge IGCSE Environmental Management 0680 — 2015 Feb/March Paper 4 · Variant 2
0680/42/F/M/15 · 60 marks · ≈68 min
The question paper and its mark scheme, free to read here and free to download. This is Cambridge’s own paper, exactly as it was sat.
Question paper16 pages


Mark scheme3 pages
Answers below. Sit the paper first if you are practising.
Paper as text
Question paper, page 1
This document consists of 14 printed pages and 2 blank pages. DC (ST/CGW) 97463/5 © UCLES 2015 [Turn over Cambridge International Examinations Cambridge International General Certificate of Secondary Education * 6 5 1 2 2 0 9 4 1 7 * ENVIRONMENTAL MANAGEMENT 0680/42 Alternative to Coursework February/March 2015 1 hour 30 minutes Candidates answer on the Question Paper. No Additional Materials are required. READ THESE INSTRUCTIONS FIRST Write your Centre number, candidate number and name on all the work you hand in. Write in dark blue or black pen. You may use an HB pencil for any diagrams or graphs. Do not use staples, paper clips, glue or correction fluid. DO NOT WRITE IN ANY BARCODES. Answer all questions. Electronic calculators may be used. You may lose marks if you do not show your working or if you do not use appropriate units. Study the appropriate source materials before you start to write your answers. Credit will be given for appropriate selection and use of data in your answers and for relevant interpretation of these data. Suggestions for data sources are given in some questions. You may use the source data to draw diagrams and graphs or to do calculations to illustrate your answers. At the end of the examination, fasten all your work securely together. The number of marks is given in brackets [ ] at the end of each question or part question. The syllabus is approved for use in England, Wales and Northern Ireland as a Cambridge International Level 1/Level 2 Certificate.
Question paper, page 2
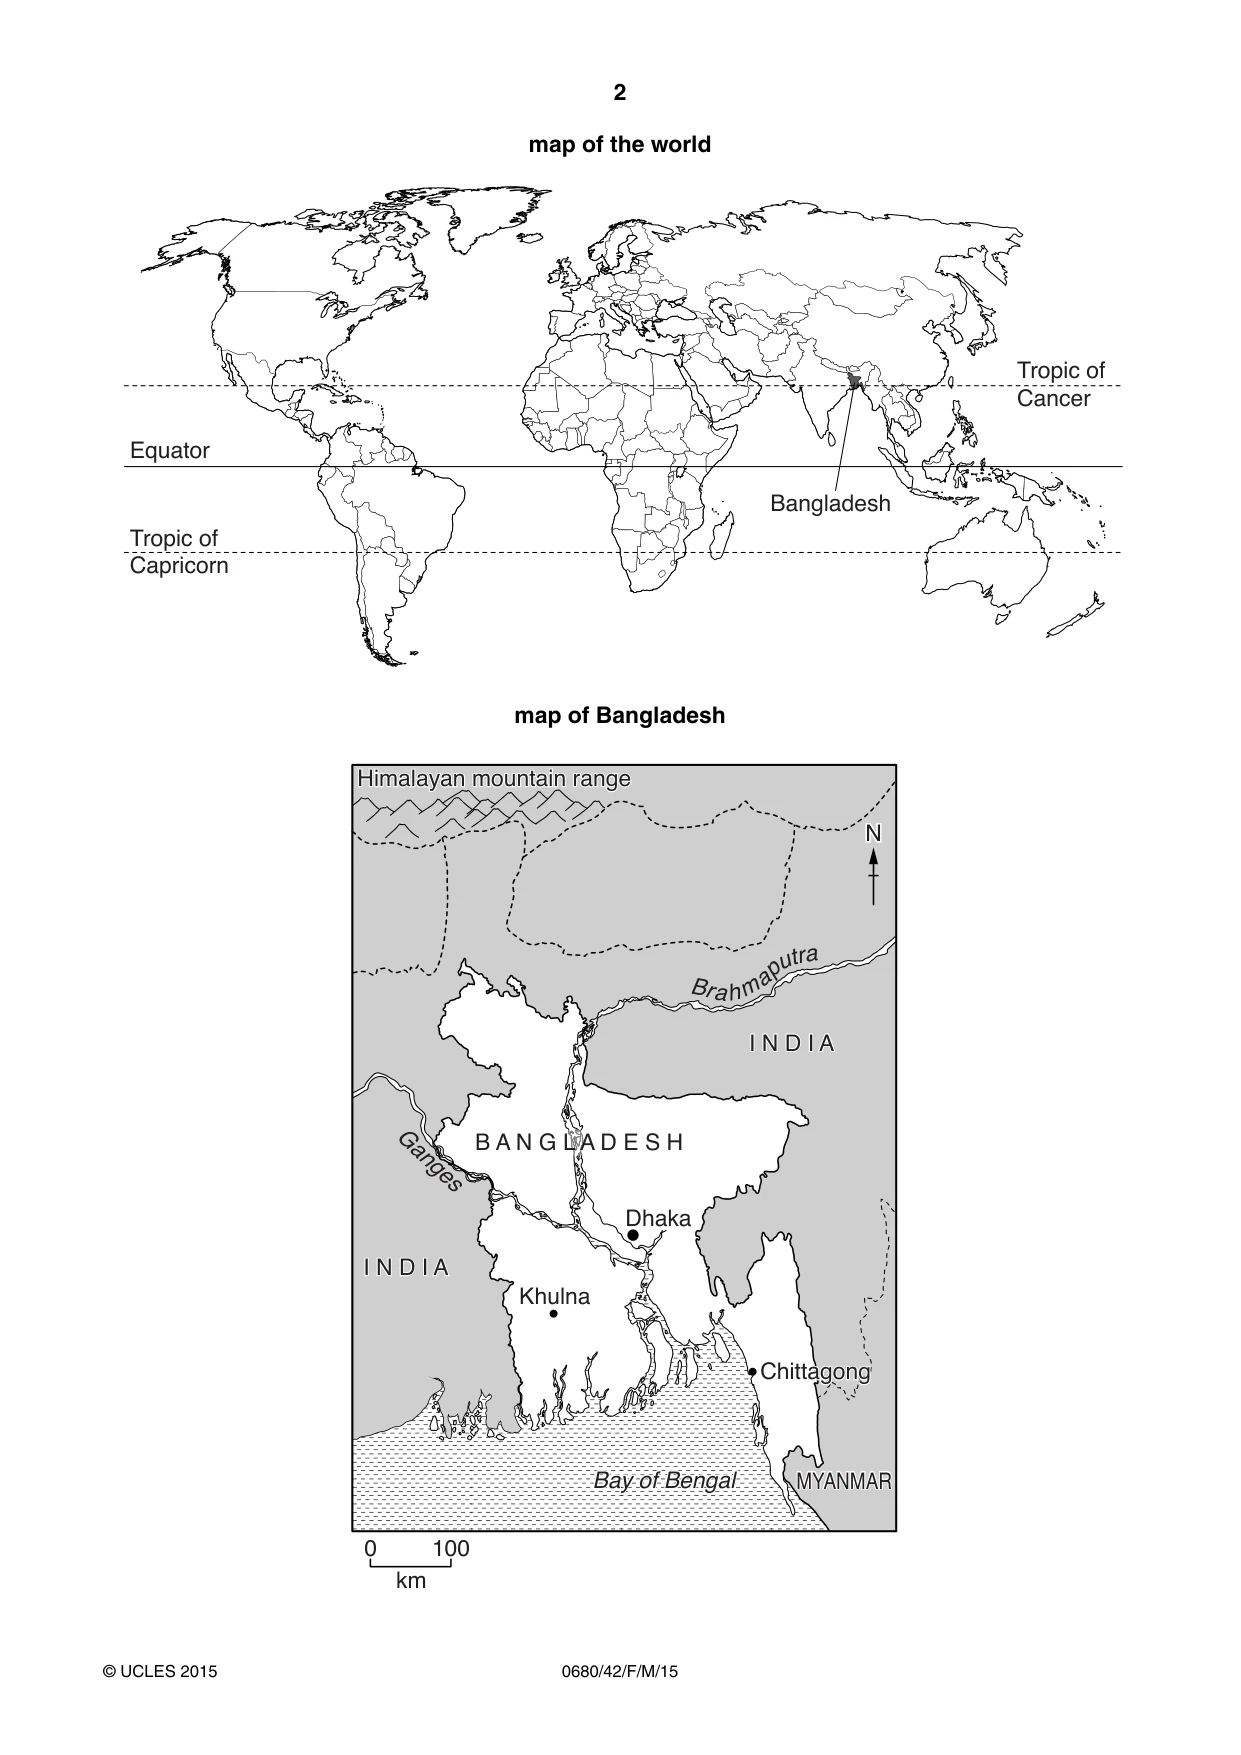
2 0680/42/F/M/15 © UCLES 2015 map of the world Equator Tropic of Capricorn Tropic of Cancer Bangladesh map of Bangladesh Dhaka Khulna Ganges Himalayan mountain range I N D I A I N D I A MYANMAR Bay of Bengal Chittagong B A N G L A D E S H I N D I A I N D I A N Himalayan mountain range MYANMAR Bay of Bengal Chittagong 0 100 N B r a h m a p u t r a km km
Question paper, page 3
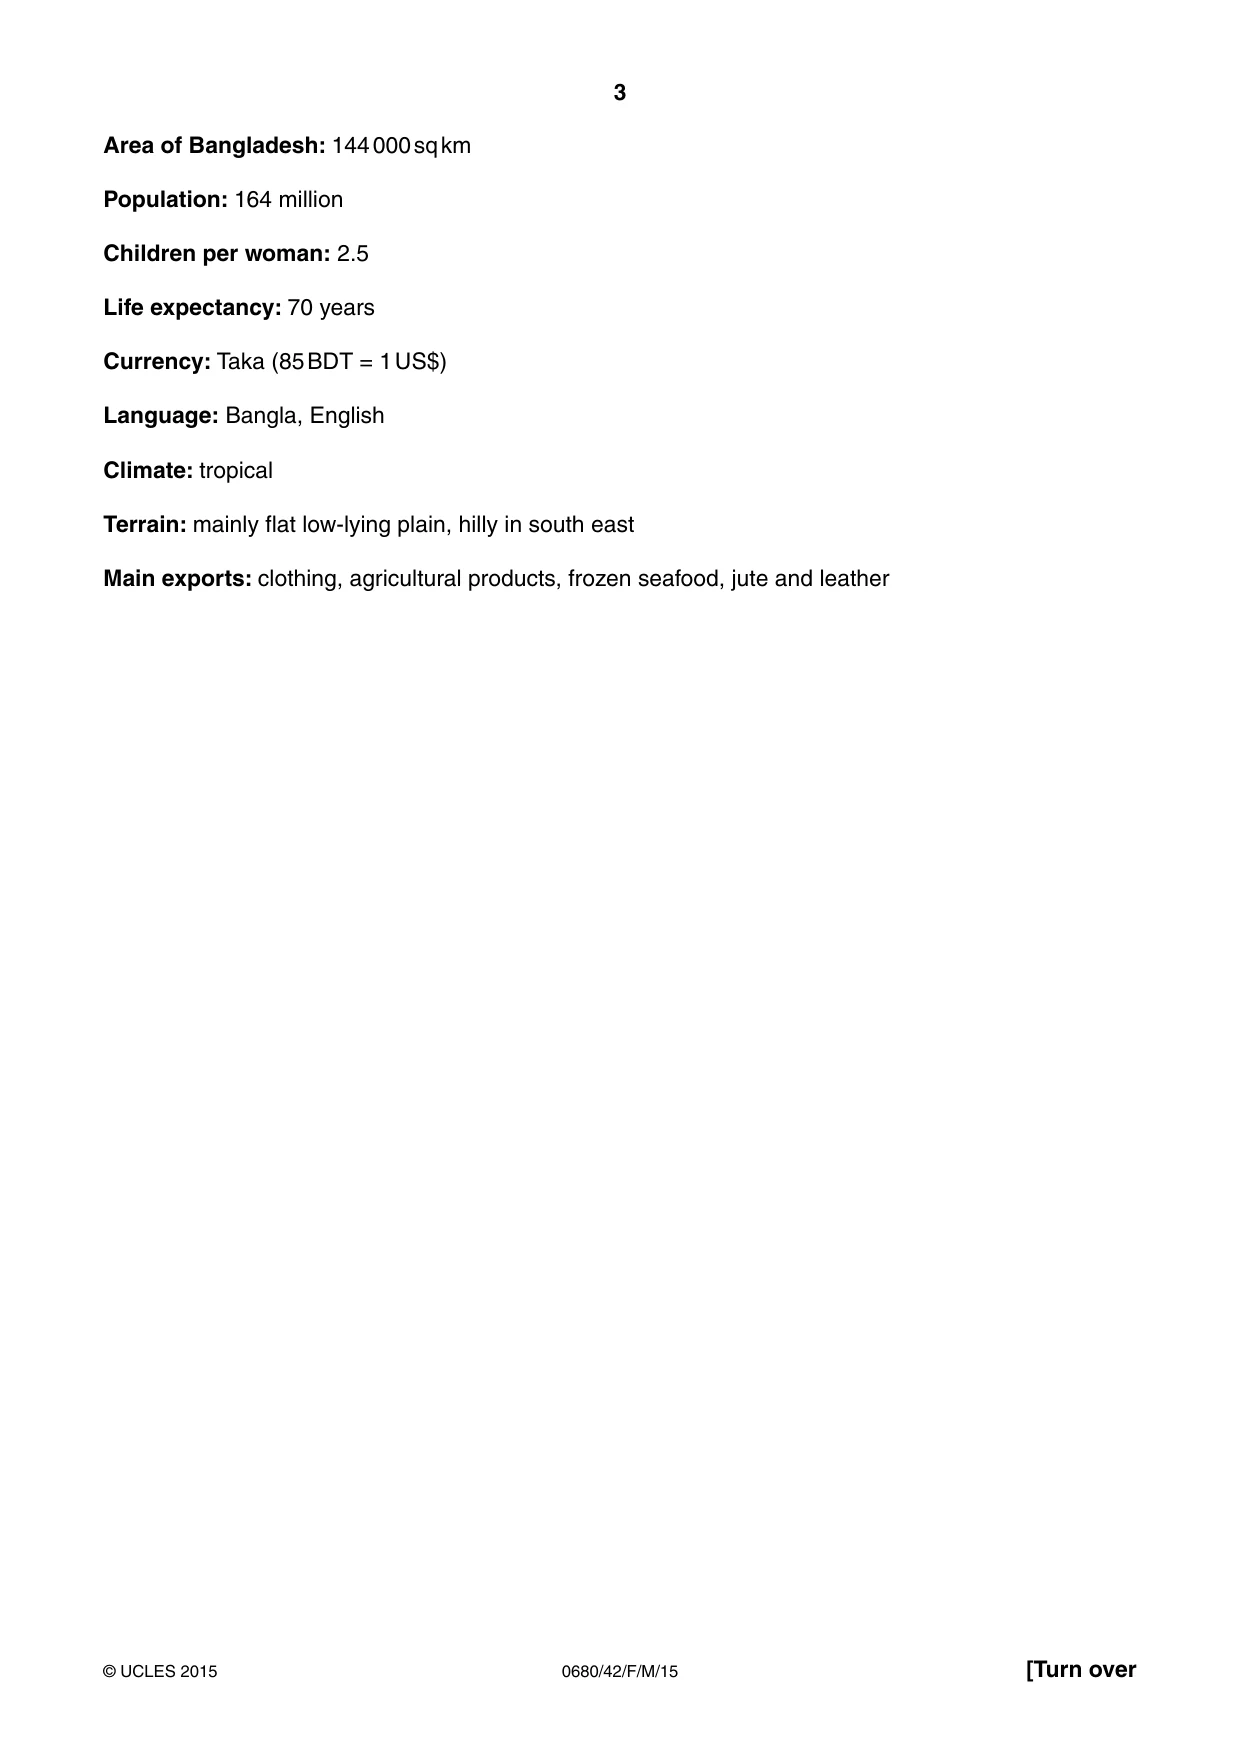
3 0680/42/F/M/15 © UCLES 2015 [Turn over Area of Bangladesh: 144 000 sq km Population: 164 million Children per woman: 2.5 Life expectancy: 70 years Currency: Taka (85 BDT = 1 US$) Language: Bangla, English Climate: tropical Terrain: mainly flat low-lying plain, hilly in south east Main exports: clothing, agricultural products, frozen seafood, jute and leather
Question paper, page 4
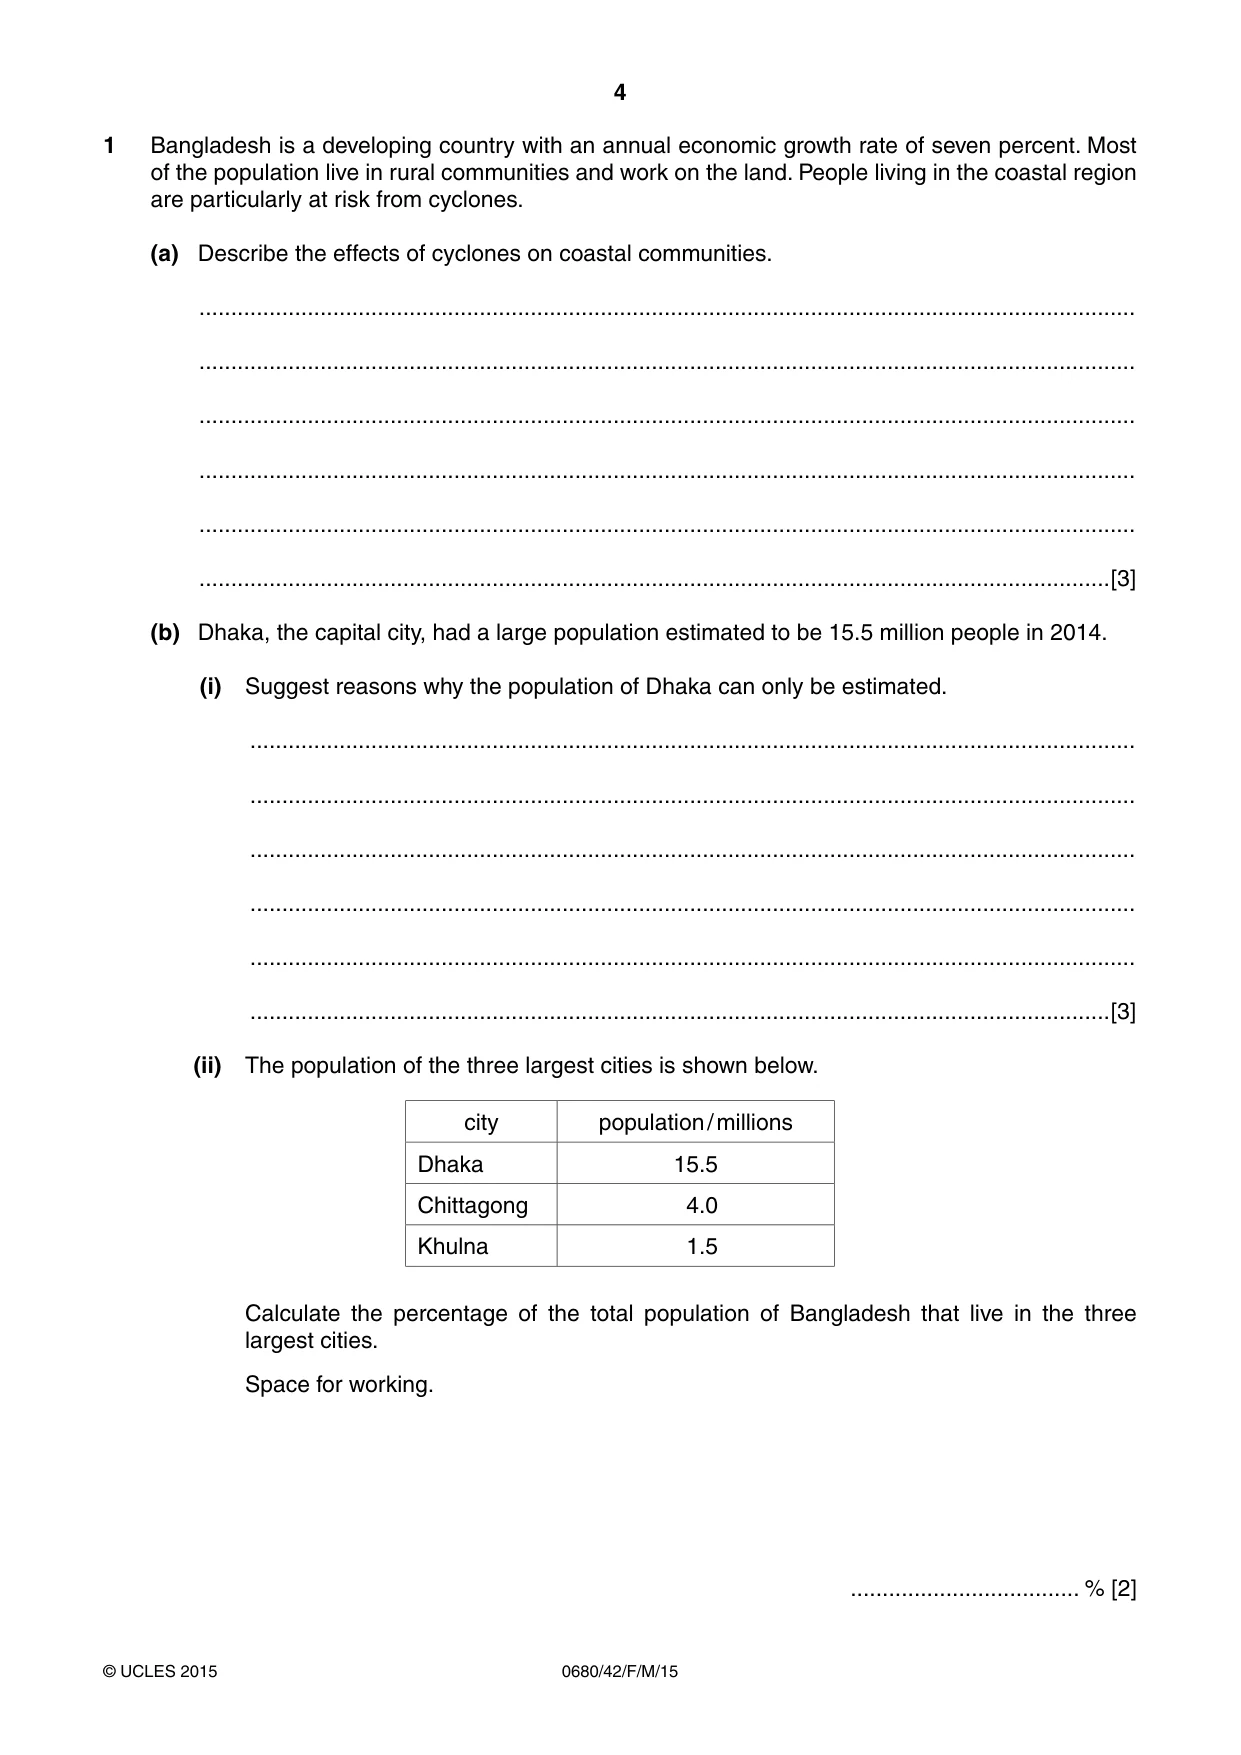
4 0680/42/F/M/15 © UCLES 2015 1 Bangladesh is a developing country with an annual economic growth rate of seven percent. Most of the population live in rural communities and work on the land. People living in the coastal region are particularly at risk from cyclones. (a) Describe the effects of cyclones on coastal communities. … … … … … …[3] (b) Dhaka, the capital city, had a large population estimated to be 15.5 million people in 2014. (i) Suggest reasons why the population of Dhaka can only be estimated. … … … … … …[3] (ii) The population of the three largest cities is shown below. city population / millions Dhaka 15.5 Chittagong 4.0 Khulna 1.5 Calculate the percentage of the total population of Bangladesh that live in the three largest cities. Space for working. … % [2]
Question paper, page 5
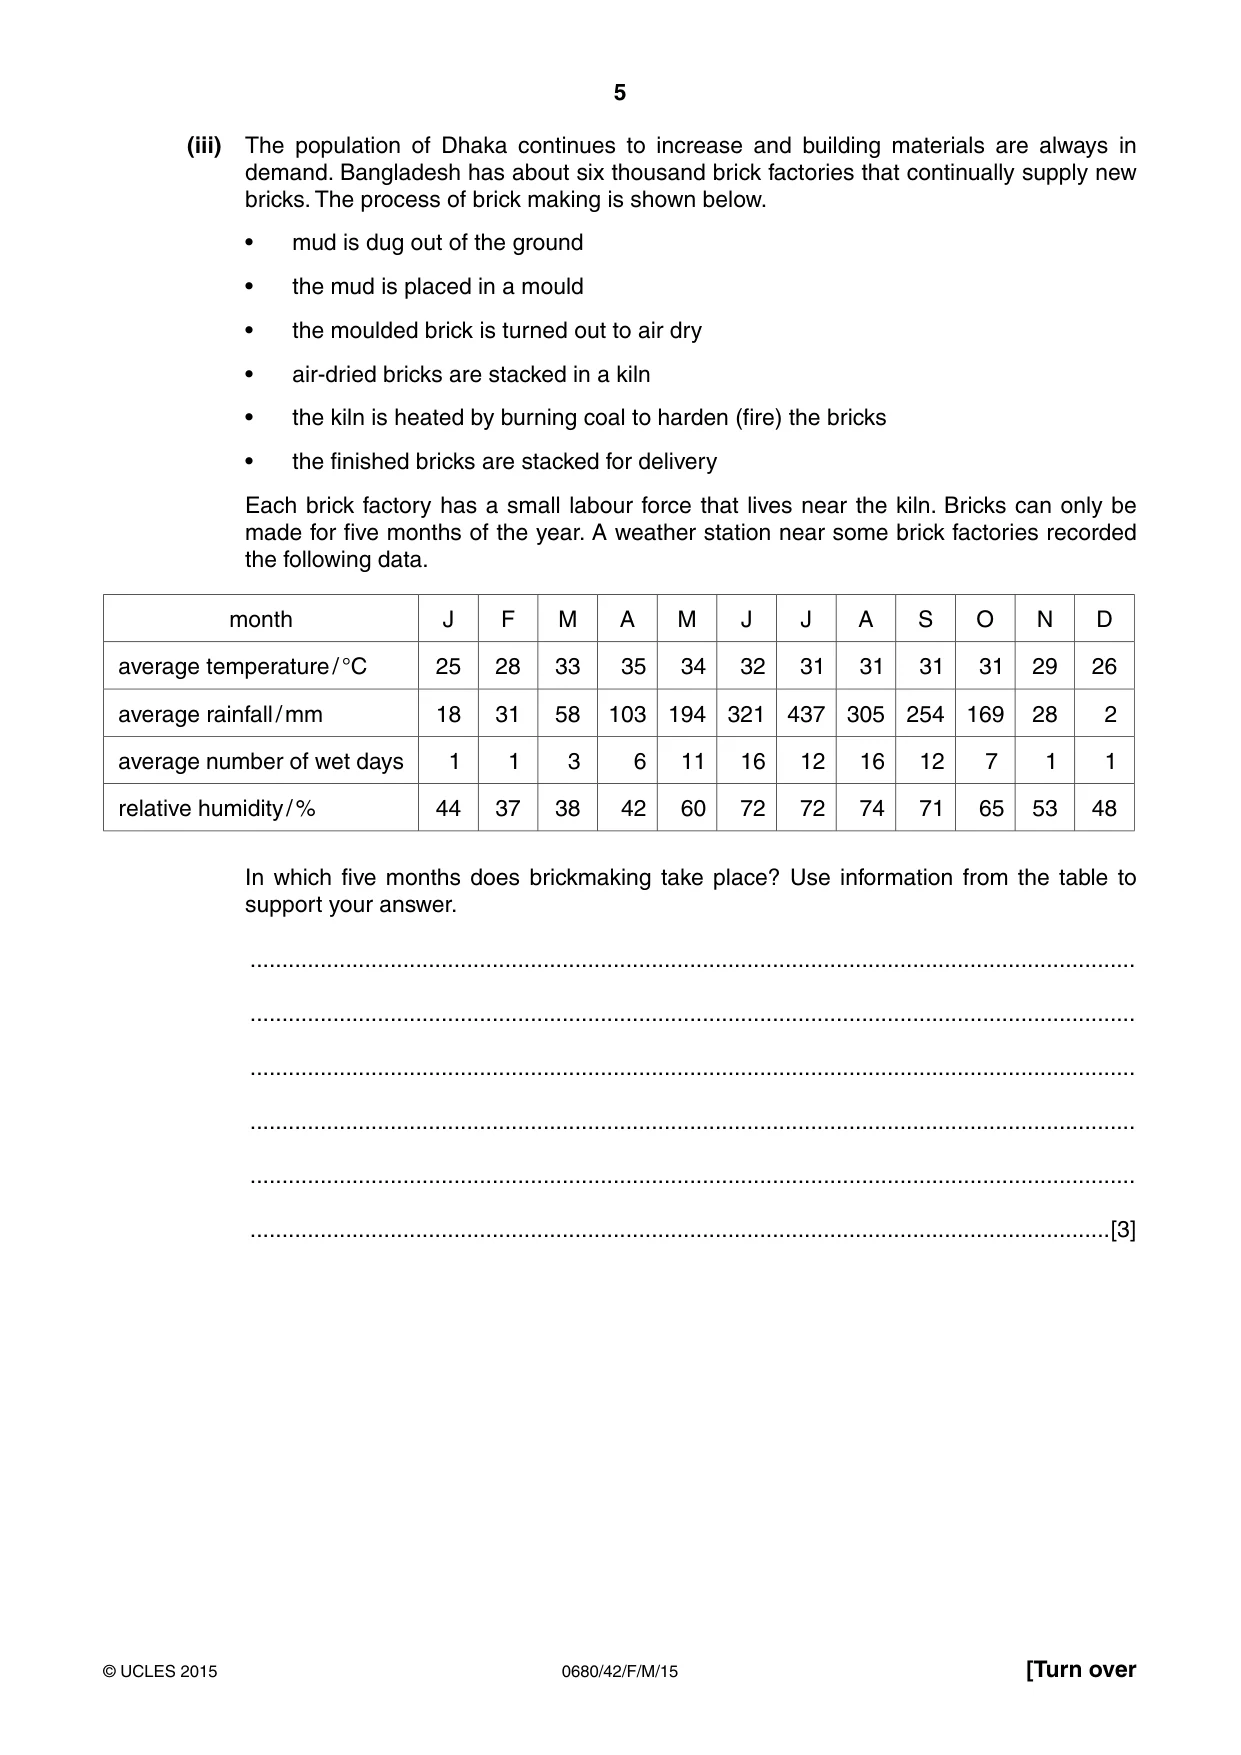
5 0680/42/F/M/15 © UCLES 2015 [Turn over (iii) The population of Dhaka continues to increase and building materials are always in demand. Bangladesh has about six thousand brick factories that continually supply new bricks. The process of brick making is shown below. • mud is dug out of the ground • the mud is placed in a mould • the moulded brick is turned out to air dry • air-dried bricks are stacked in a kiln • the kiln is heated by burning coal to harden (fire) the bricks • the finished bricks are stacked for delivery Each brick factory has a small labour force that lives near the kiln. Bricks can only be made for five months of the year. A weather station near some brick factories recorded the following data. month J F M A M J J A S O N D average temperature / °C 25 28 33 35 34 32 31 31 31 31 29 26 average rainfall / mm 18 31 58 103 194 321 437 305 254 169 28 2 average number of wet days 1 1 3 6 11 16 12 16 12 7 1 1 relative humidity / % 44 37 38 42 60 72 72 74 71 65 53 48 In which five months does brickmaking take place? Use information from the table to support your answer. … … … … … …[3]
Question paper, page 6
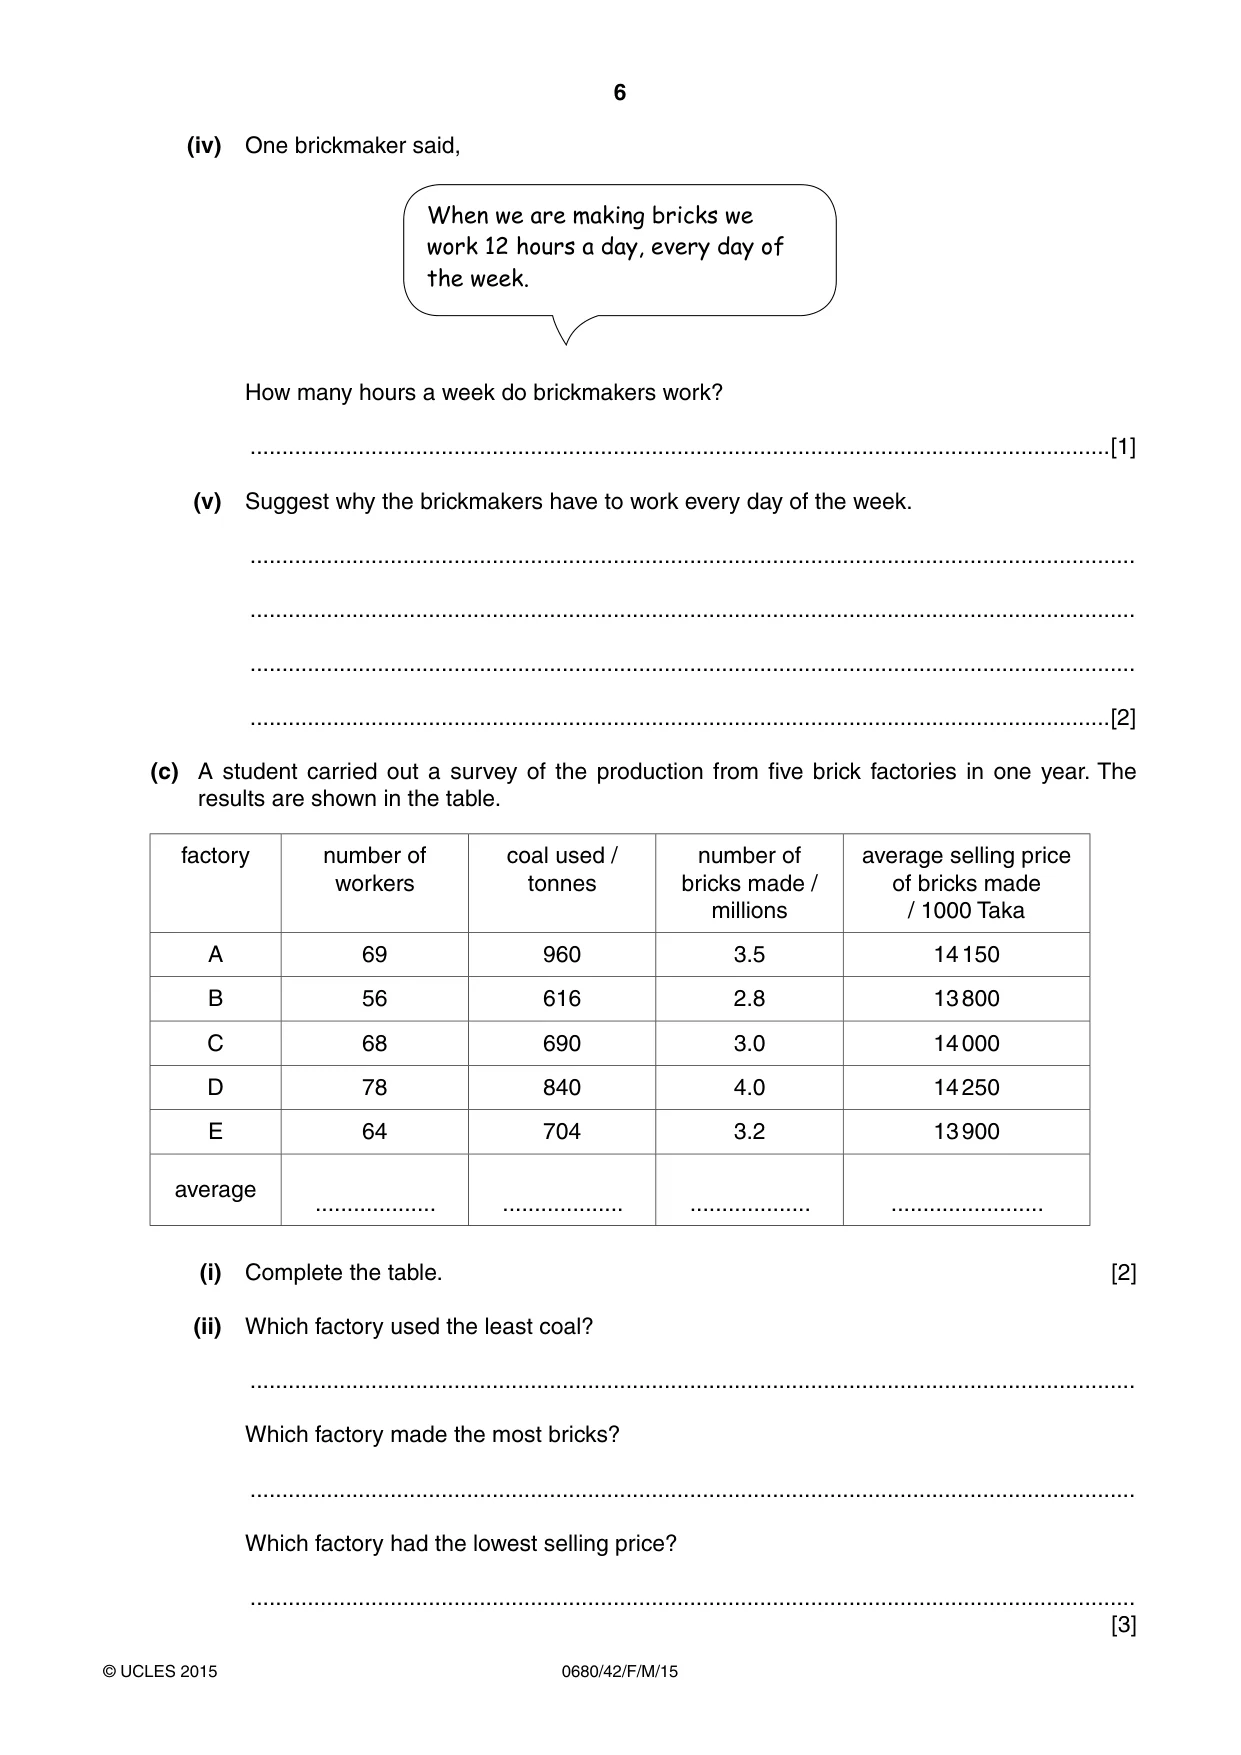
6 0680/42/F/M/15 © UCLES 2015 (iv) One brickmaker said, When we are making bricks we work 12 hours a day, every day of the week. How many hours a week do brickmakers work? …[1] (v) Suggest why the brickmakers have to work every day of the week. … … … …[2] (c) A student carried out a survey of the production from five brick factories in one year. The results are shown in the table. factory number of workers coal used / tonnes number of bricks made / millions average selling price of bricks made / 1000 Taka A 69 960 3.5 14 150 B 56 616 2.8 13 800 C 68 690 3.0 14 000 D 78 840 4.0 14 250 E 64 704 3.2 13 900 average … … … … (i) Complete the table. [2] (ii) Which factory used the least coal? … Which factory made the most bricks? … Which factory had the lowest selling price? … [3]
Question paper, page 7
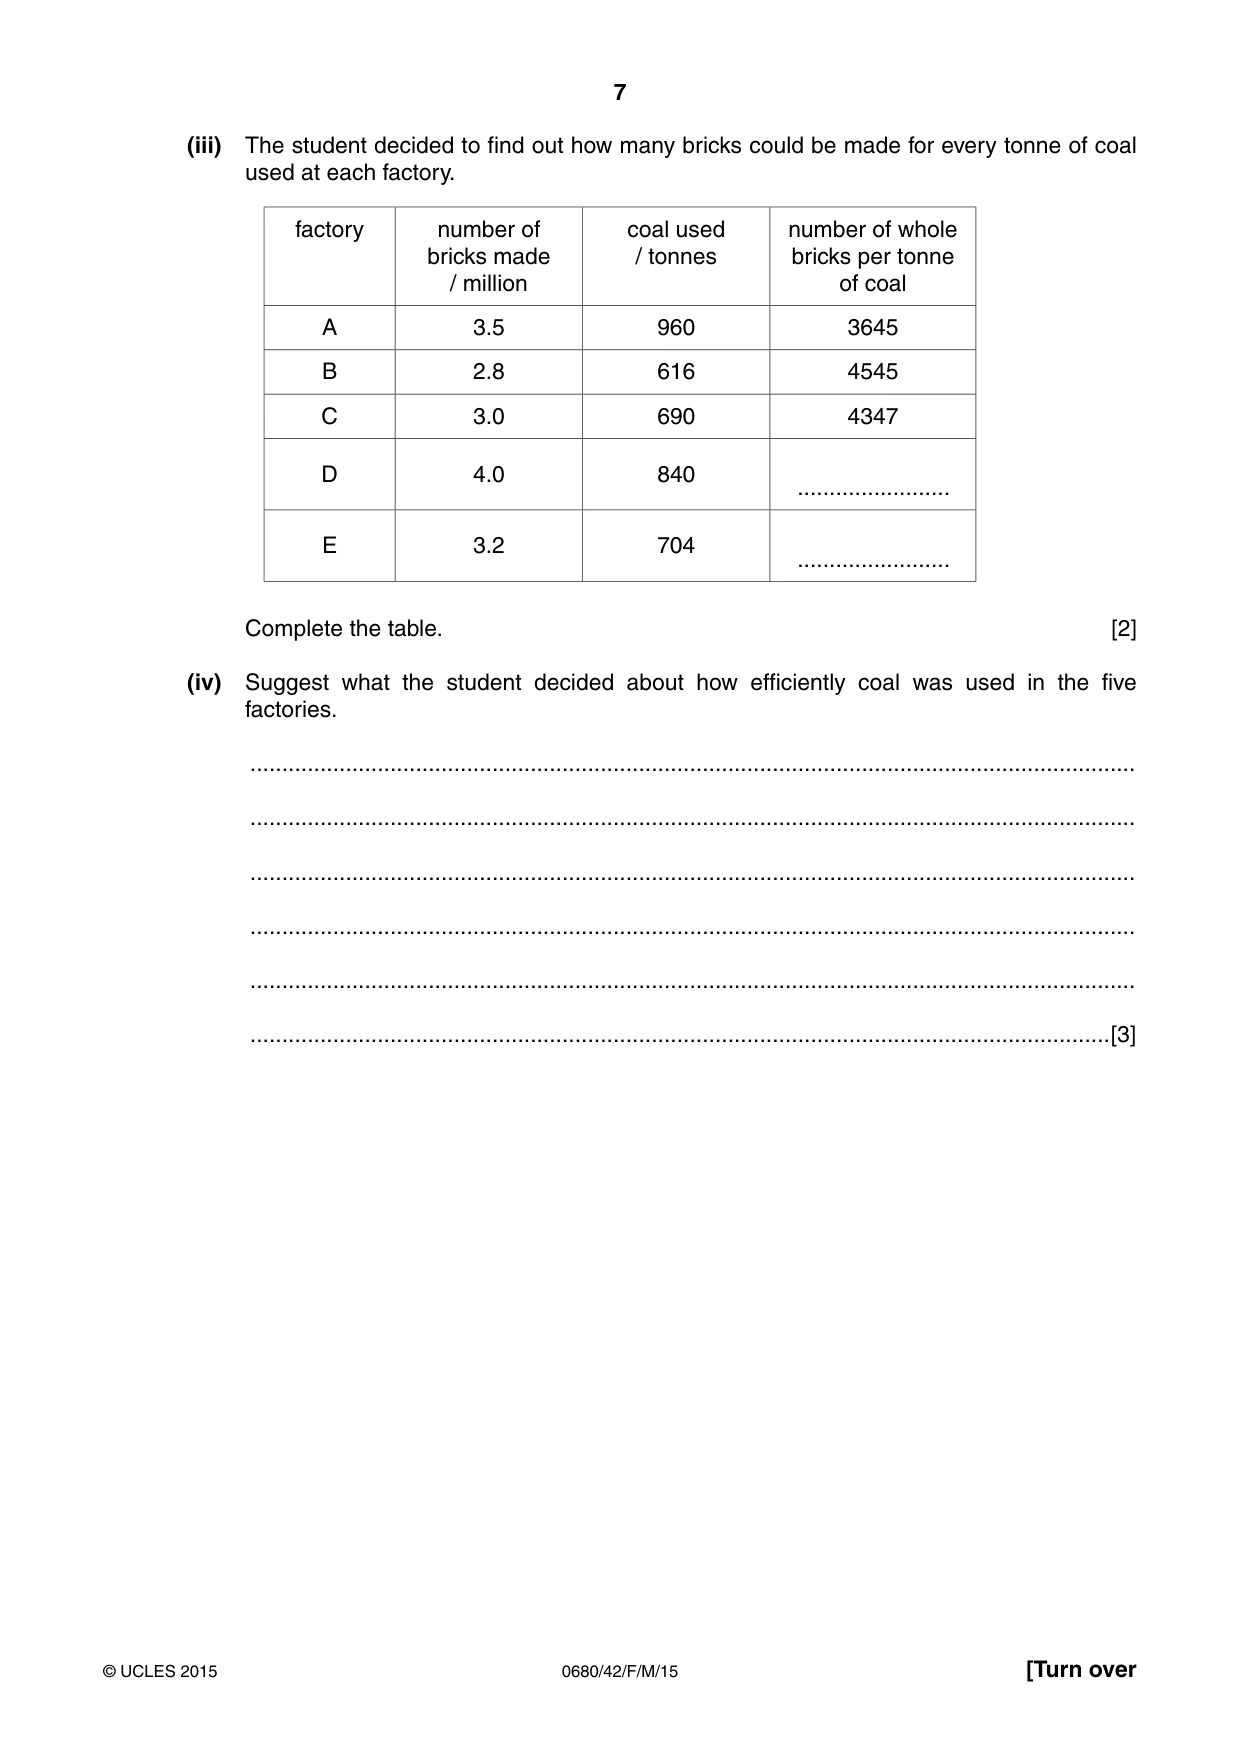
7 0680/42/F/M/15 © UCLES 2015 [Turn over (iii) The student decided to find out how many bricks could be made for every tonne of coal used at each factory. factory number of bricks made / million coal used / tonnes number of whole bricks per tonne of coal A 3.5 960 3645 B 2.8 616 4545 C 3.0 690 4347 D 4.0 840 … E 3.2 704 … Complete the table. [2] (iv) Suggest what the student decided about how efficiently coal was used in the five factories. … … … … … …[3]
Question paper, page 8
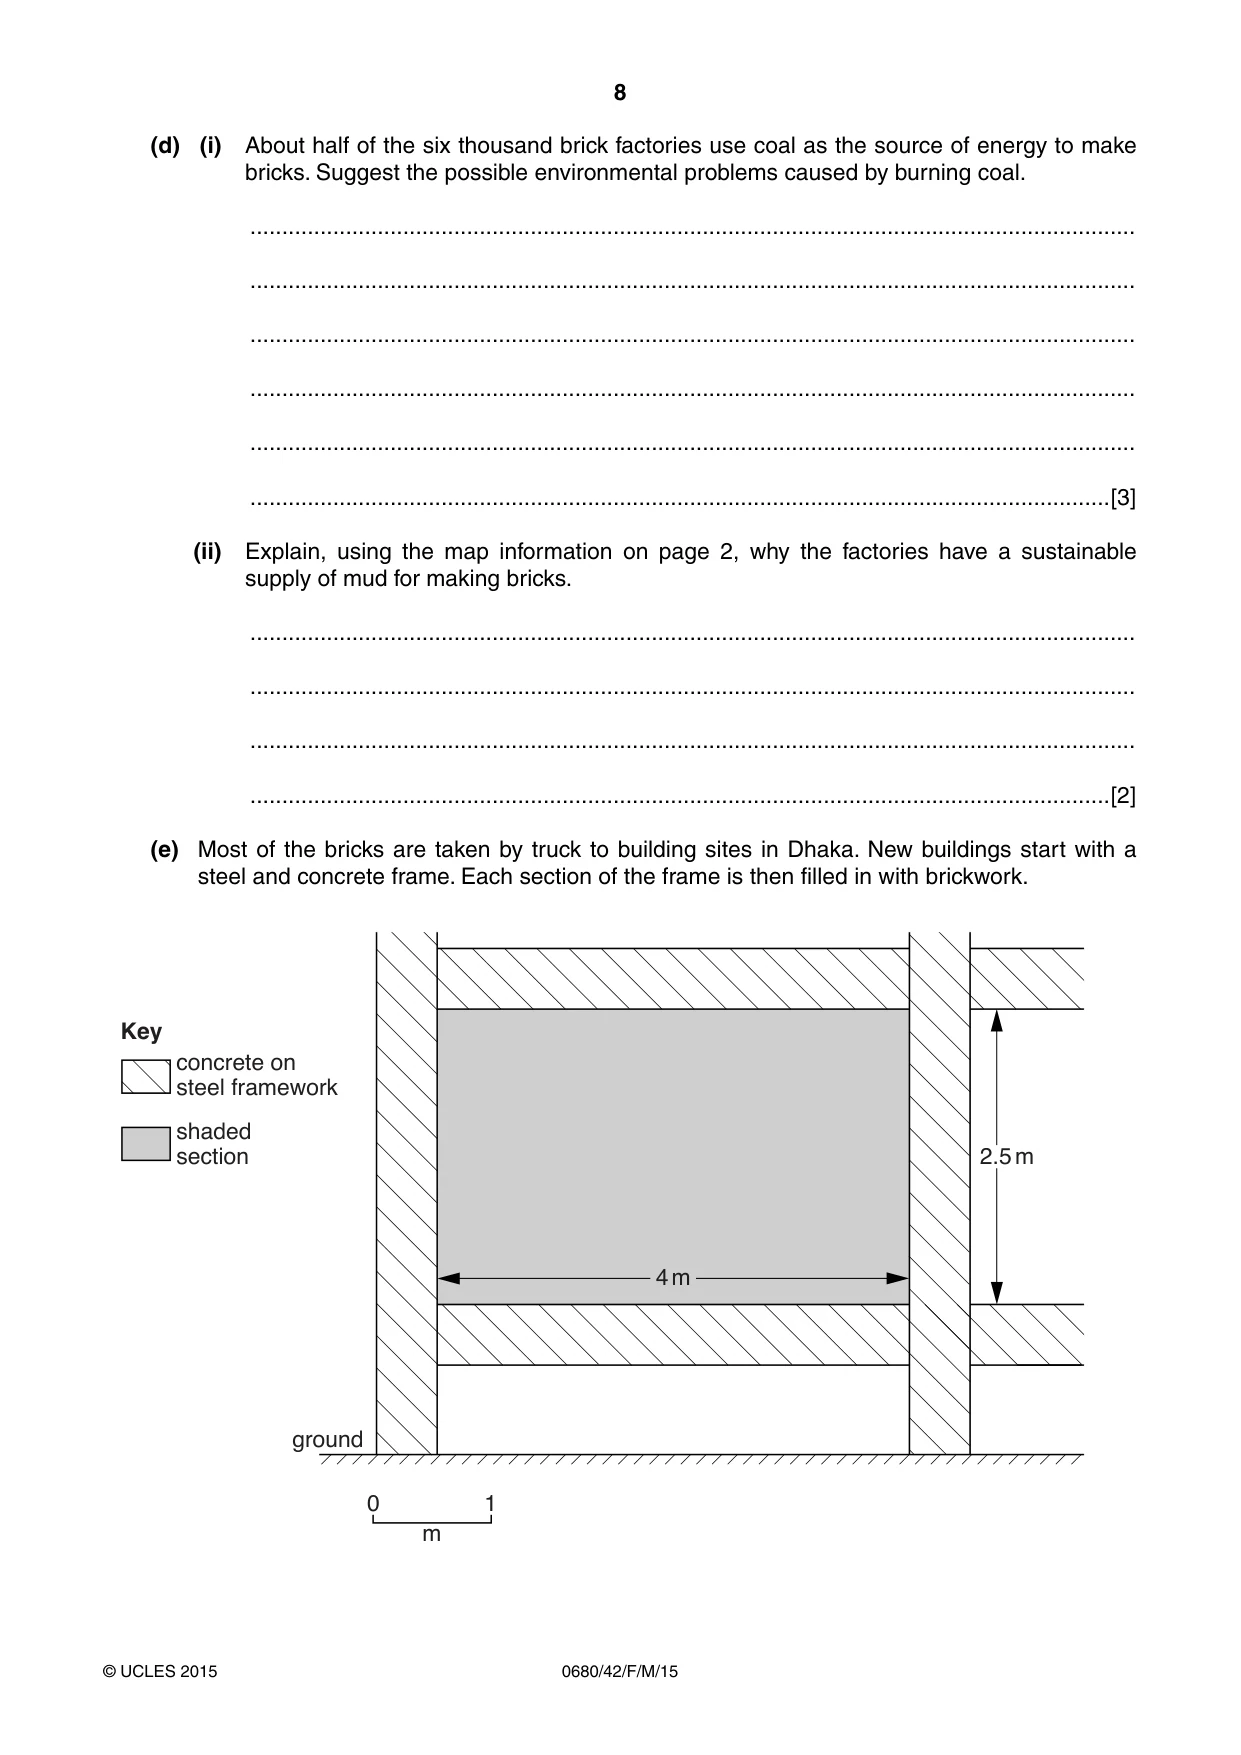
8 0680/42/F/M/15 © UCLES 2015 (d) (i) About half of the six thousand brick factories use coal as the source of energy to make bricks. Suggest the possible environmental problems caused by burning coal. … … … … … …[3] (ii) Explain, using the map information on page 2, why the factories have a sustainable supply of mud for making bricks. … … … …[2] (e) Most of the bricks are taken by truck to building sites in Dhaka. New buildings start with a steel and concrete frame. Each section of the frame is then filled in with brickwork. 4 m 0 1 m 2.5 m ground concrete on steel framework shaded section Key
Question paper, page 9
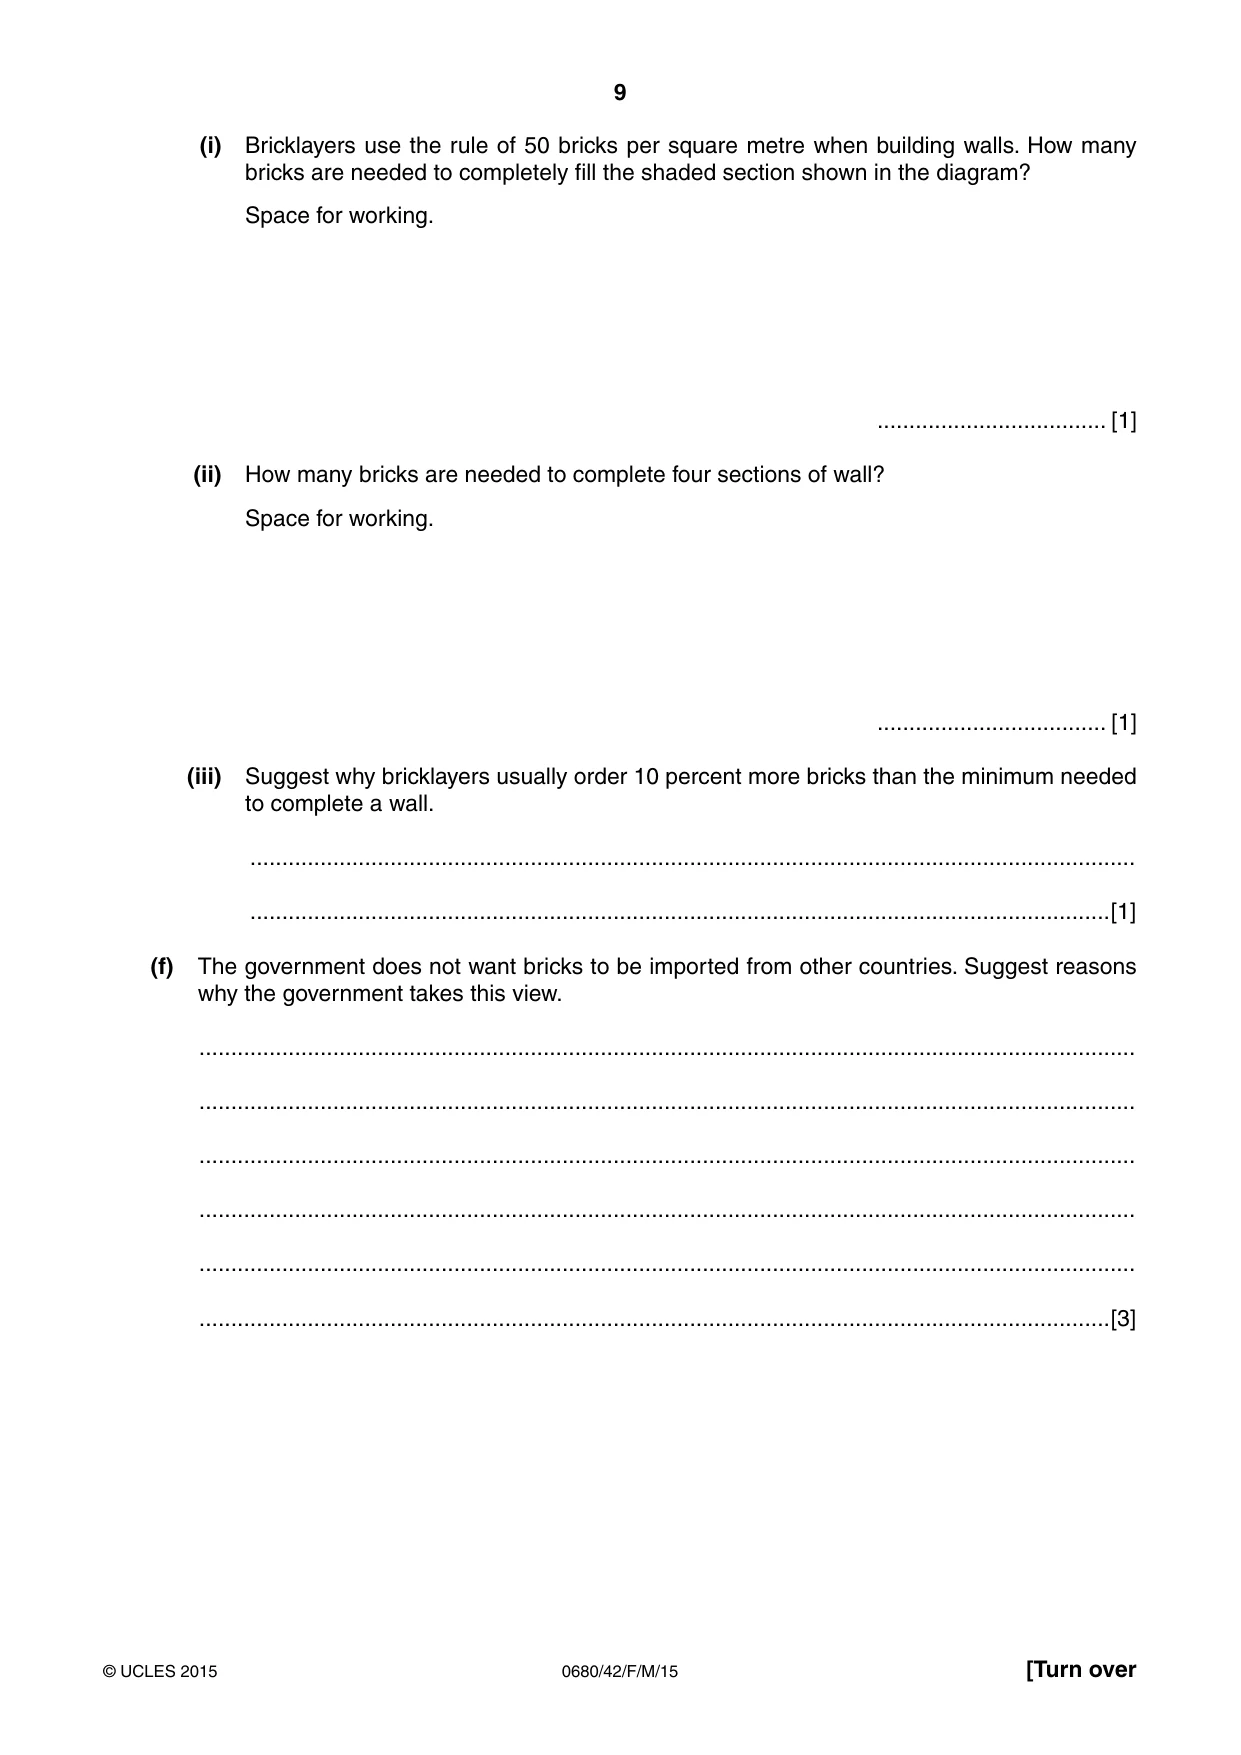
9 0680/42/F/M/15 © UCLES 2015 [Turn over (i) Bricklayers use the rule of 50 bricks per square metre when building walls. How many bricks are needed to completely fill the shaded section shown in the diagram? Space for working. … [1] (ii) How many bricks are needed to complete four sections of wall? Space for working. … [1] (iii) Suggest why bricklayers usually order 10 percent more bricks than the minimum needed to complete a wall. … …[1] (f) The government does not want bricks to be imported from other countries. Suggest reasons why the government takes this view. … … … … … …[3]
Question paper, page 10
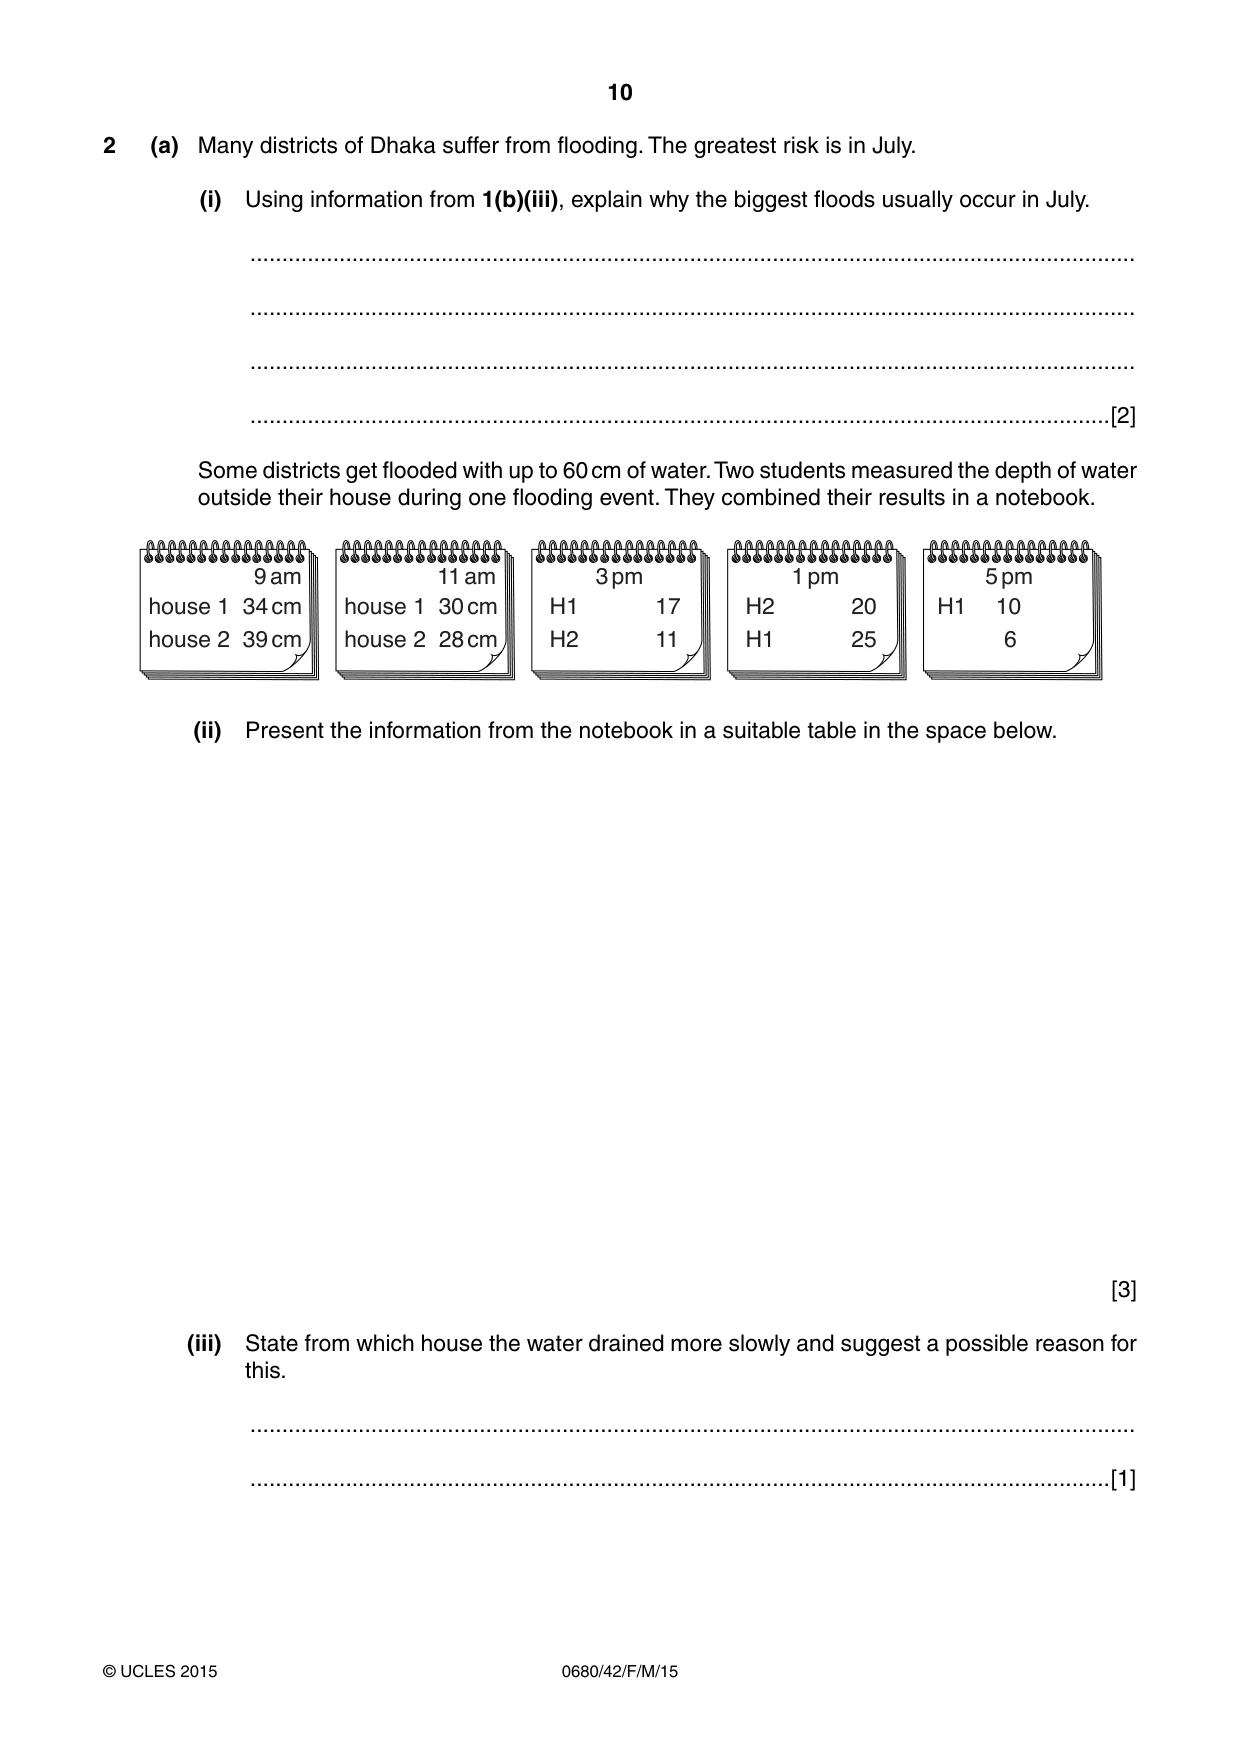
10 0680/42/F/M/15 © UCLES 2015 2 (a) Many districts of Dhaka suffer from flooding. The greatest risk is in July. (i) Using information from 1(b)(iii), explain why the biggest floods usually occur in July. … … … …[2] Some districts get flooded with up to 60 cm of water. Two students measured the depth of water outside their house during one flooding event. They combined their results in a notebook. house 1 34 cm 9 am house 2 39 cm house 1 30 cm 11 am house 2 28 cm 3 pm H2 11 10 5 pm 6 H2 20 1 pm H1 25 H1 17 H1 (ii) Present the information from the notebook in a suitable table in the space below. [3] (iii) State from which house the water drained more slowly and suggest a possible reason for this. … …[1]
Question paper, page 11
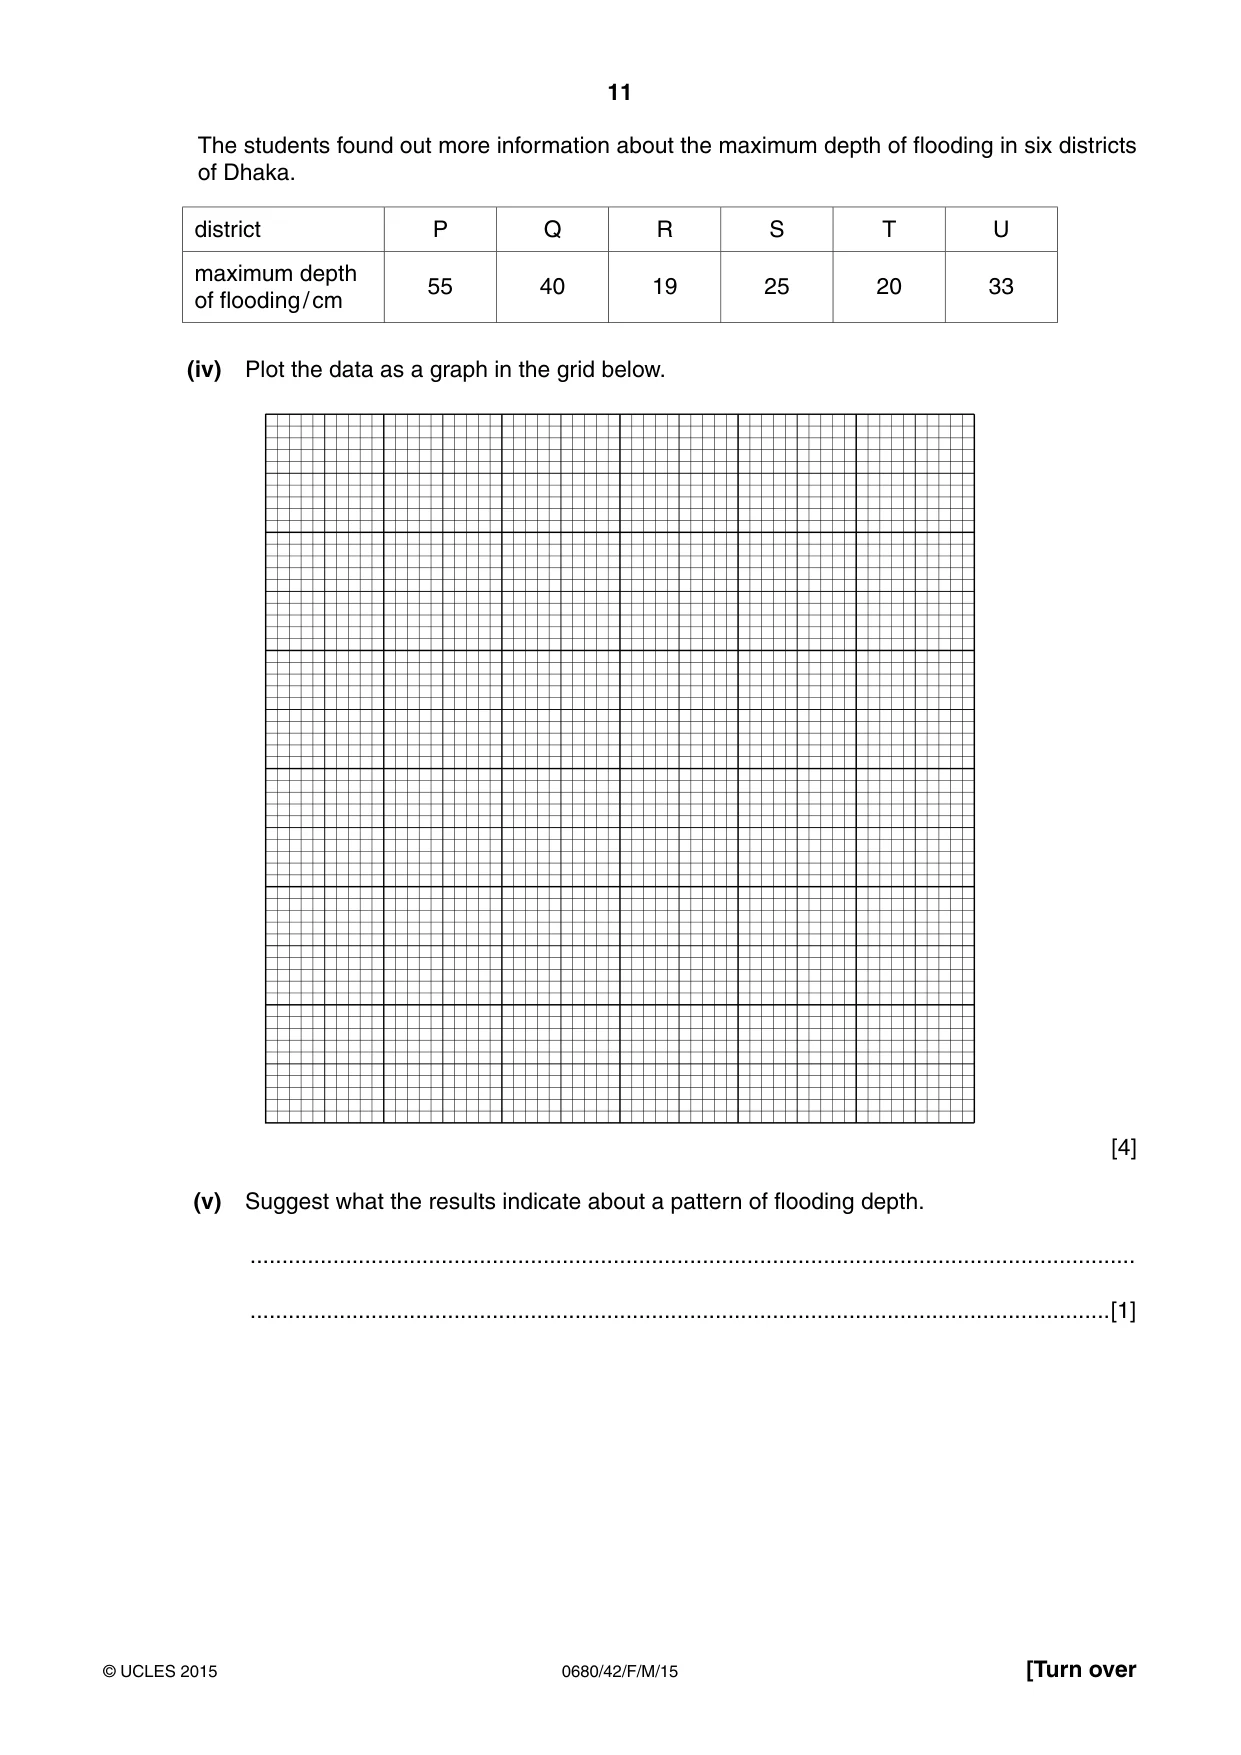
11 0680/42/F/M/15 © UCLES 2015 [Turn over The students found out more information about the maximum depth of flooding in six districts of Dhaka. district P Q R S T U maximum depth of flooding / cm 55 40 19 25 20 33 (iv) Plot the data as a graph in the grid below. [4] (v) Suggest what the results indicate about a pattern of flooding depth. … …[1]
Question paper, page 12
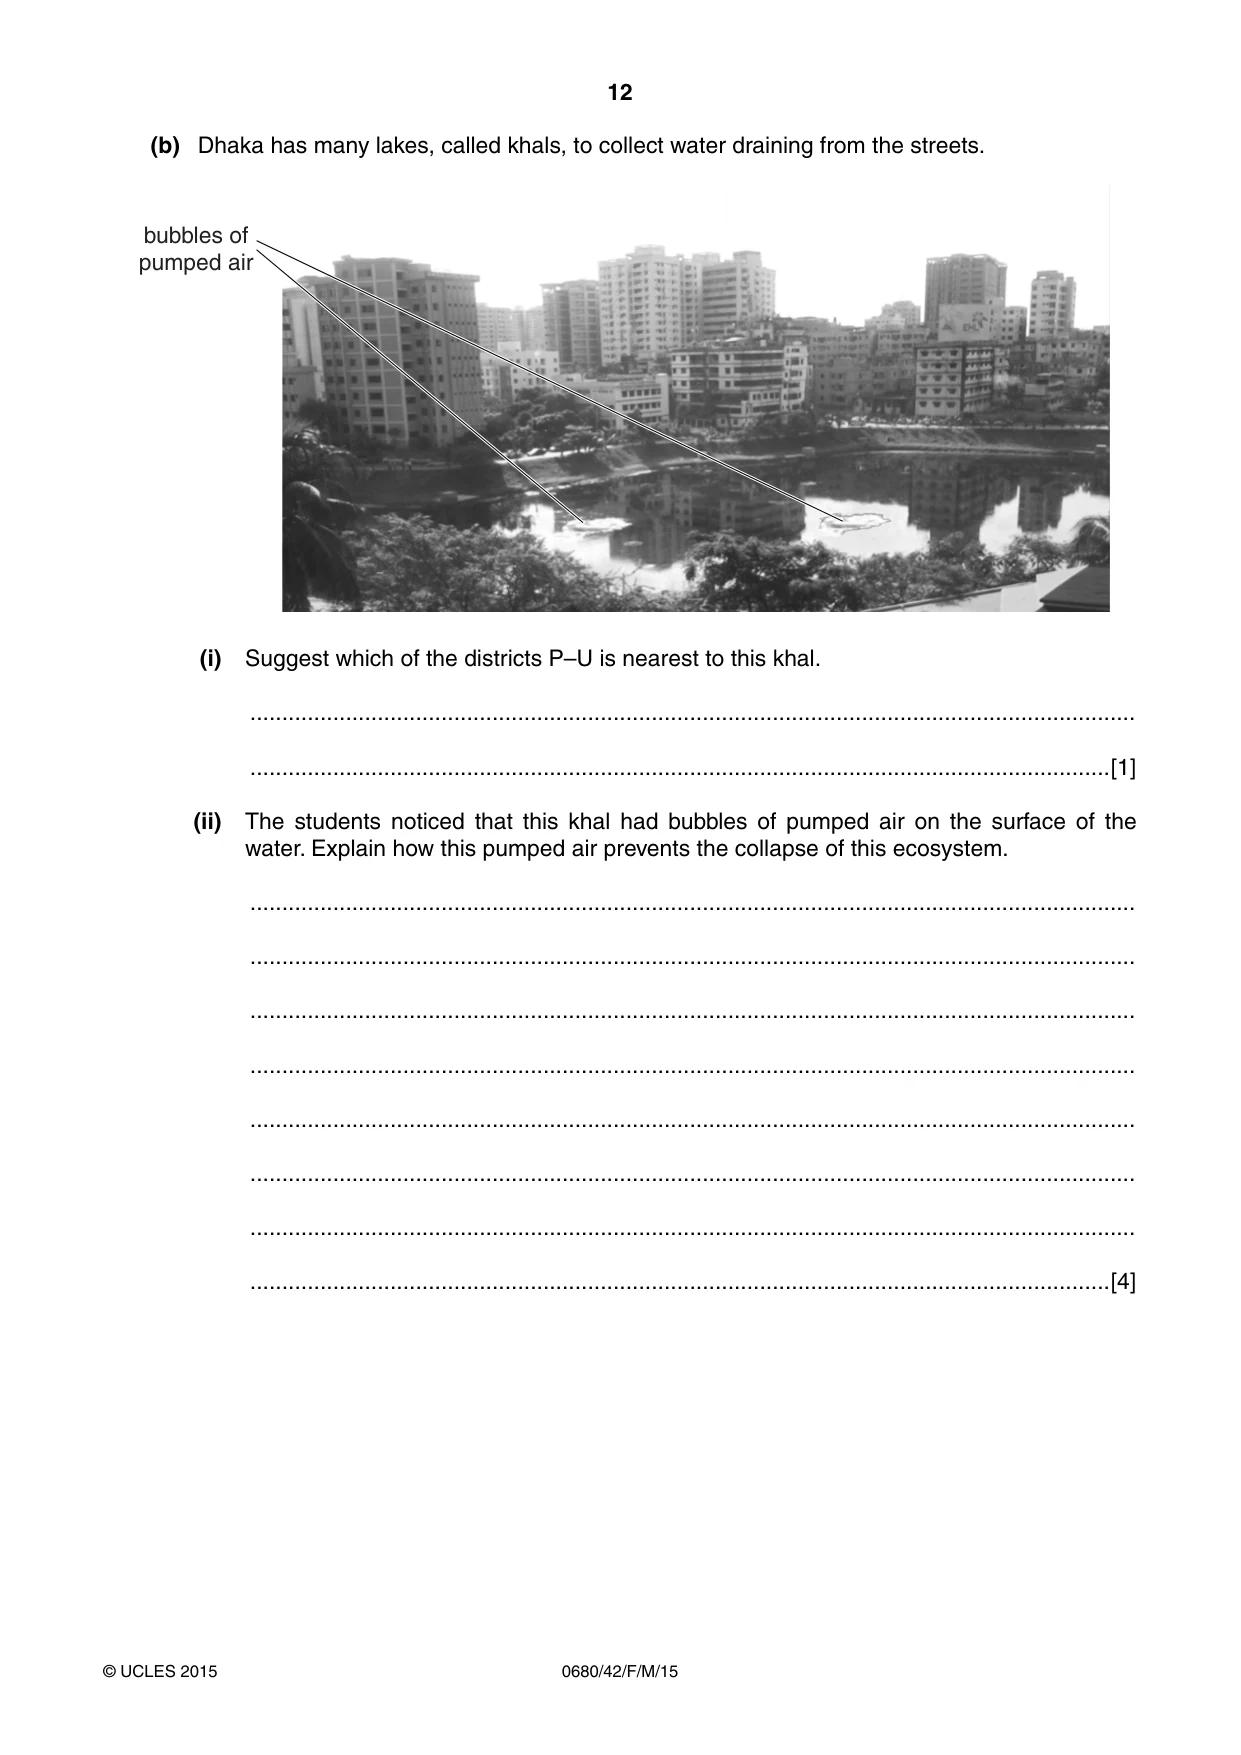
12 0680/42/F/M/15 © UCLES 2015 (b) Dhaka has many lakes, called khals, to collect water draining from the streets. bubbles of pumped air (i) Suggest which of the districts P–U is nearest to this khal. … …[1] (ii) The students noticed that this khal had bubbles of pumped air on the surface of the water. Explain how this pumped air prevents the collapse of this ecosystem. … … … … … … … …[4]
Question paper, page 13
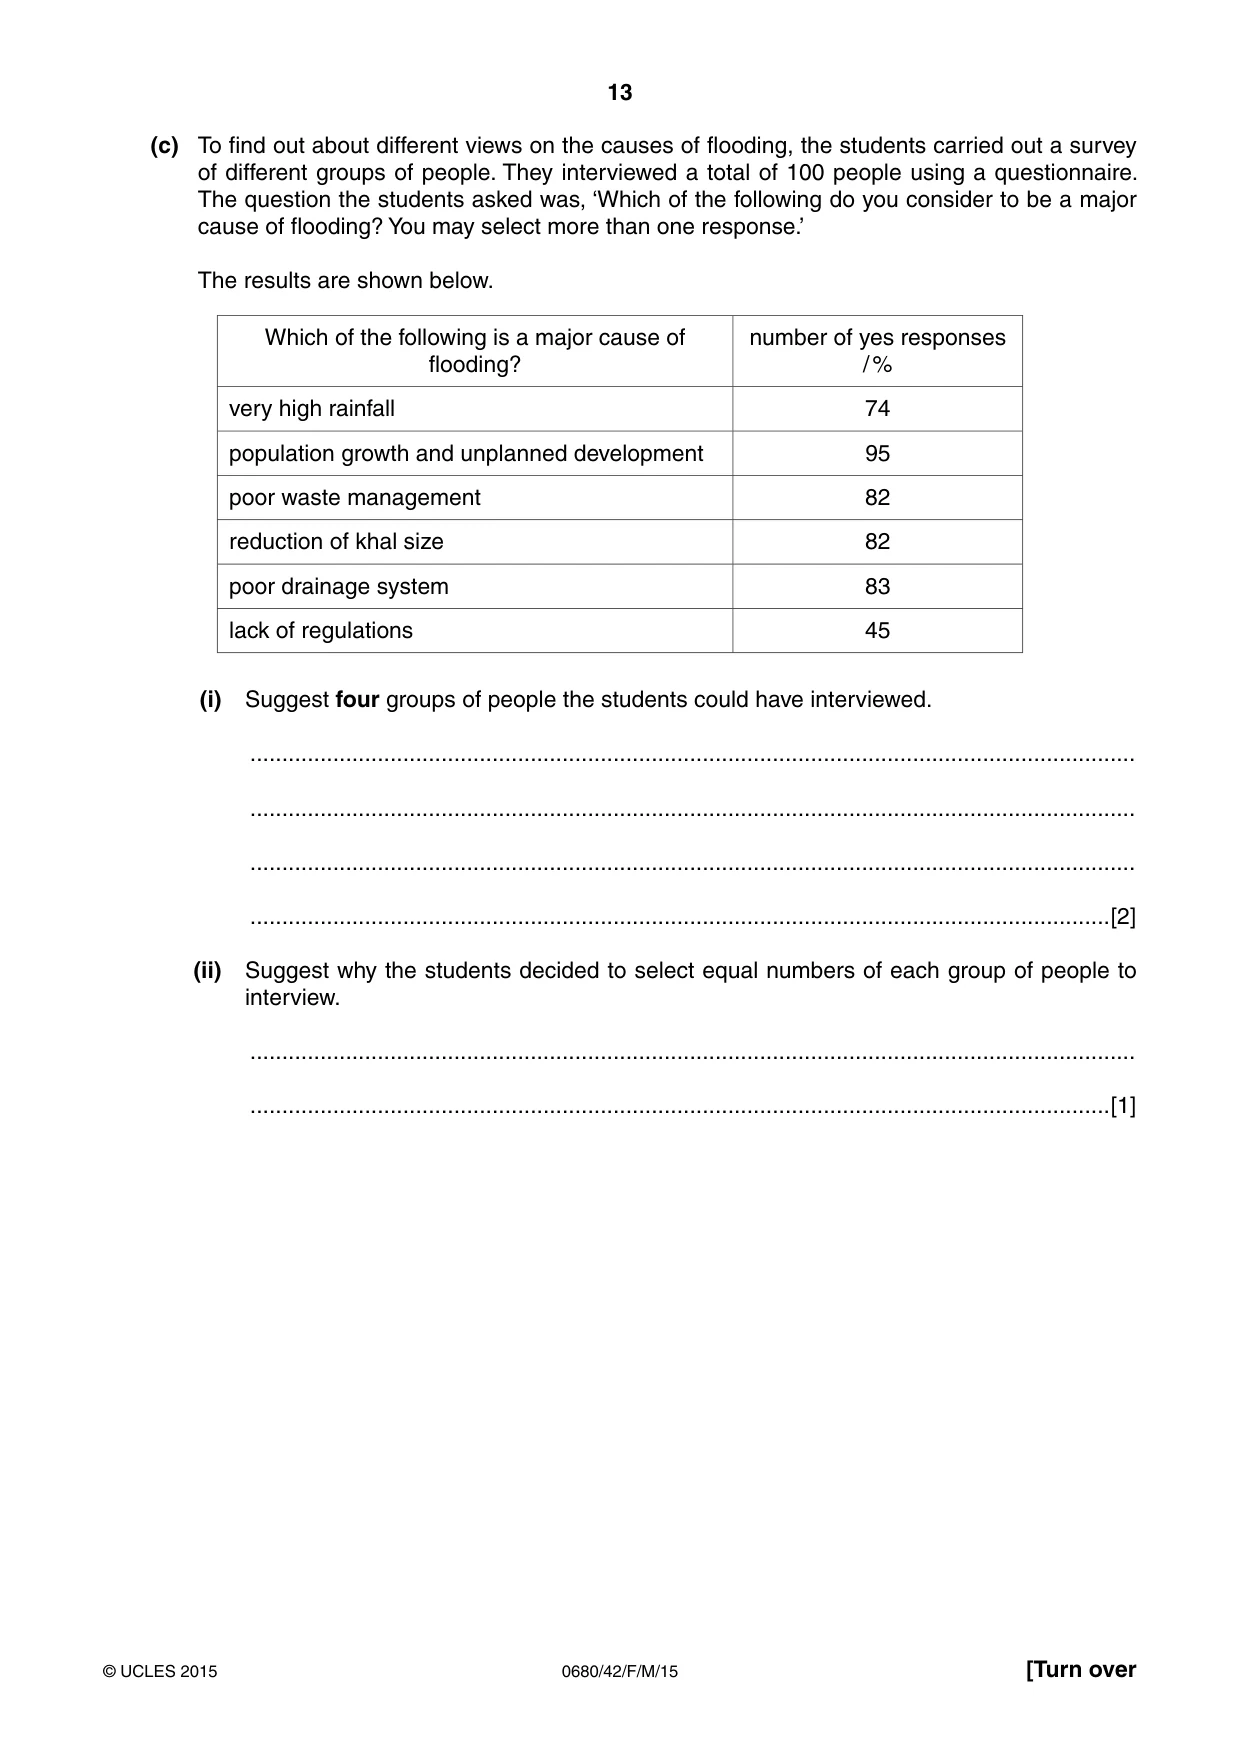
13 0680/42/F/M/15 © UCLES 2015 [Turn over (c) To find out about different views on the causes of flooding, the students carried out a survey of different groups of people. They interviewed a total of 100 people using a questionnaire. The question the students asked was, ‘Which of the following do you consider to be a major cause of flooding? You may select more than one response.’ The results are shown below. Which of the following is a major cause of flooding? number of yes responses / % very high rainfall 74 population growth and unplanned development 95 poor waste management 82 reduction of khal size 82 poor drainage system 83 lack of regulations 45 (i) Suggest four groups of people the students could have interviewed. … … … …[2] (ii) Suggest why the students decided to select equal numbers of each group of people to interview. … …[1]
Question paper, page 14
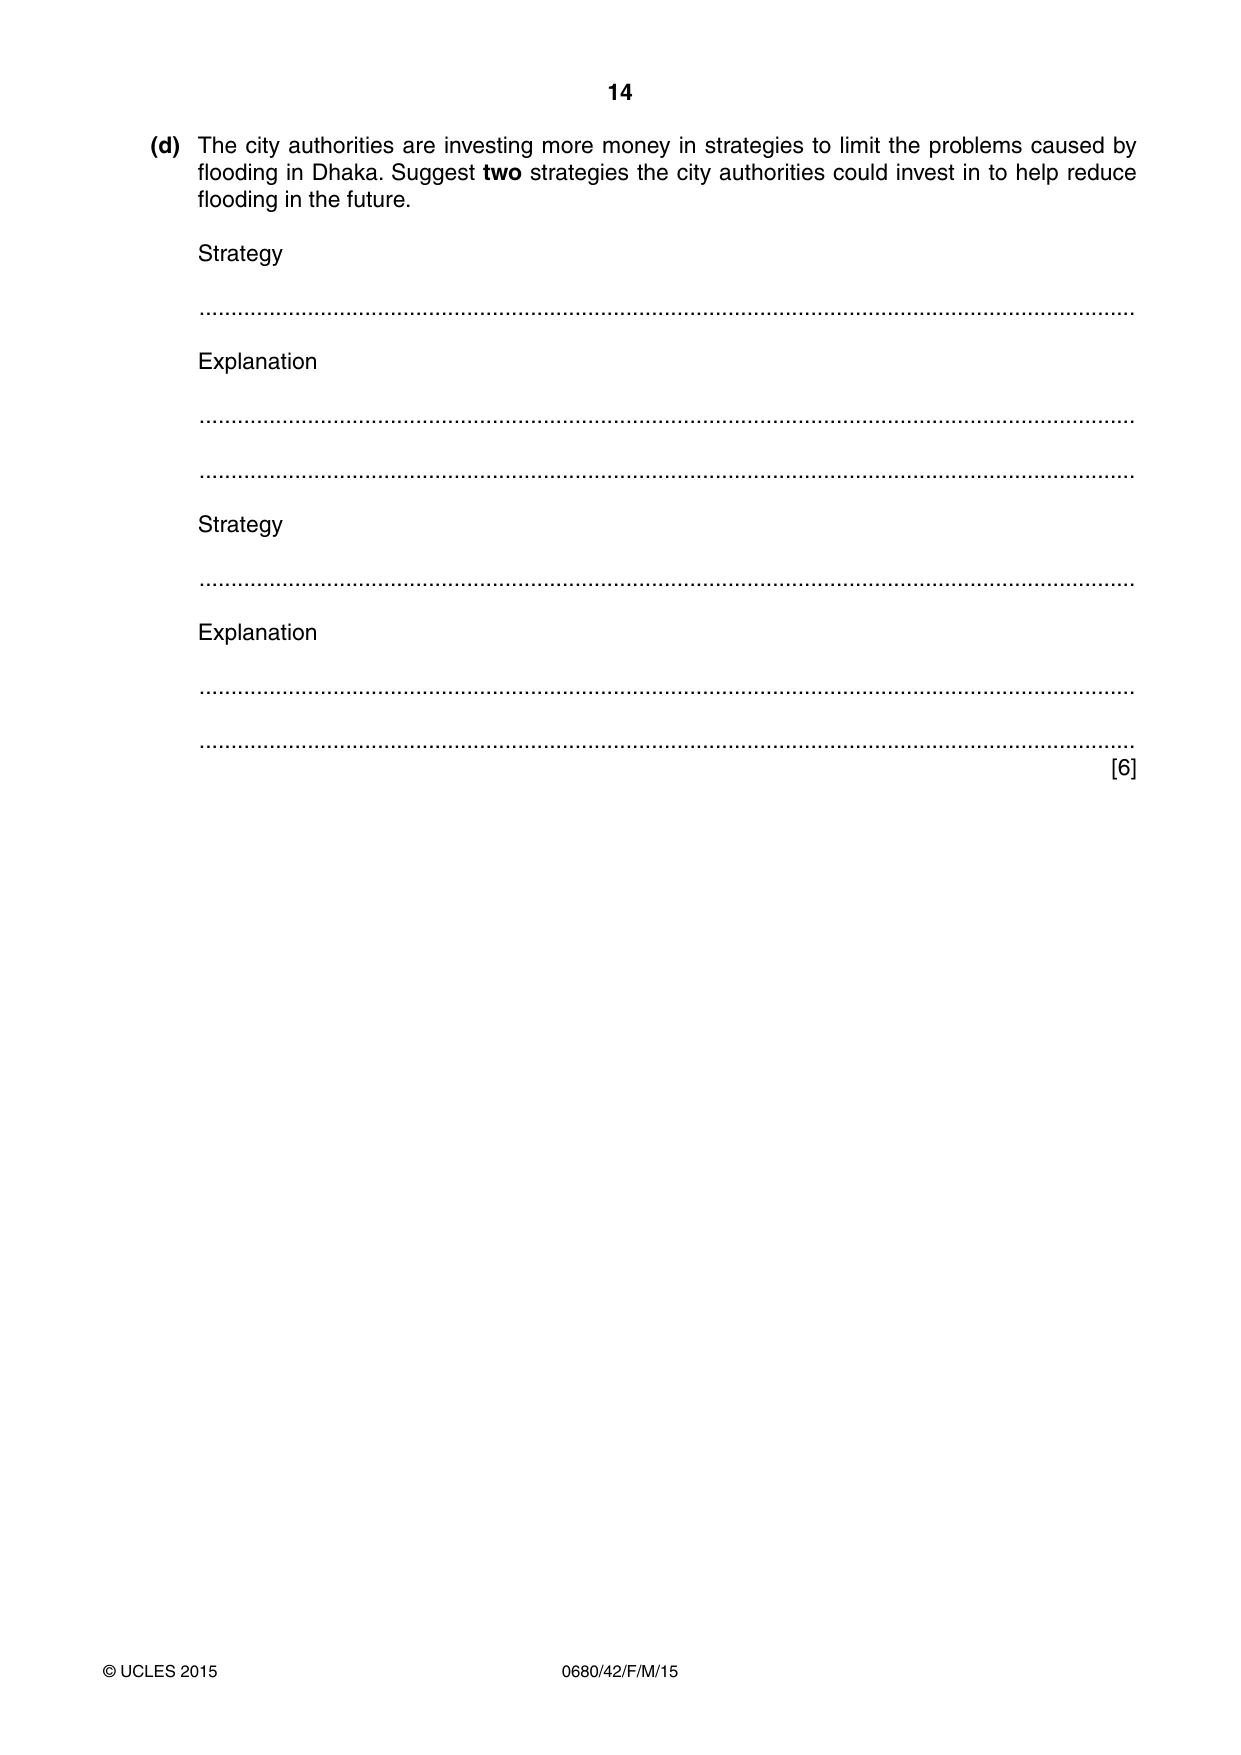
14 0680/42/F/M/15 © UCLES 2015 (d) The city authorities are investing more money in strategies to limit the problems caused by flooding in Dhaka. Suggest two strategies the city authorities could invest in to help reduce flooding in the future. Strategy … Explanation … … Strategy … Explanation … … [6]
Question paper, page 15
15 0680/42/F/M/15 © UCLES 2015 BLANK PAGE
Question paper, page 16
16 0680/42/F/M/15 © UCLES 2015 Permission to reproduce items where third-party owned material protected by copyright is included has been sought and cleared where possible. Every reasonable effort has been made by the publisher (UCLES) to trace copyright holders, but if any items requiring clearance have unwittingly been included, the publisher will be pleased to make amends at the earliest possible opportunity. To avoid the issue of disclosure of answer-related information to candidates, all copyright acknowledgements are reproduced online in the Cambridge International Examinations Copyright Acknowledgements Booklet. This is produced for each series of examinations and is freely available to download at www.cie.org.uk after the live examination series. Cambridge International Examinations is part of the Cambridge Assessment Group. Cambridge Assessment is the brand name of University of Cambridge Local Examinations Syndicate (UCLES), which is itself a department of the University of Cambridge. BLANK PAGE
Mark scheme, page 1
® IGCSE is the registered trademark of Cambridge International Examinations. CAMBRIDGE INTERNATIONAL EXAMINATIONS Cambridge International General Certificate of Secondary Education MARK SCHEME for the March 2015 series 0680 ENVIRONMENTAL MANAGEMENT 0680/42 Paper 4 (Alternative to Coursework), maximum raw mark 60 This mark scheme is published as an aid to teachers and candidates, to indicate the requirements of the examination. It shows the basis on which Examiners were instructed to award marks. It does not indicate the details of the discussions that took place at an Examiners’ meeting before marking began, which would have considered the acceptability of alternative answers. Mark schemes should be read in conjunction with the question paper and the Principal Examiner Report for Teachers. Cambridge will not enter into discussions about these mark schemes. Cambridge is publishing the mark schemes for the March 2015 series for most Cambridge IGCSE® components.
Mark scheme, page 2
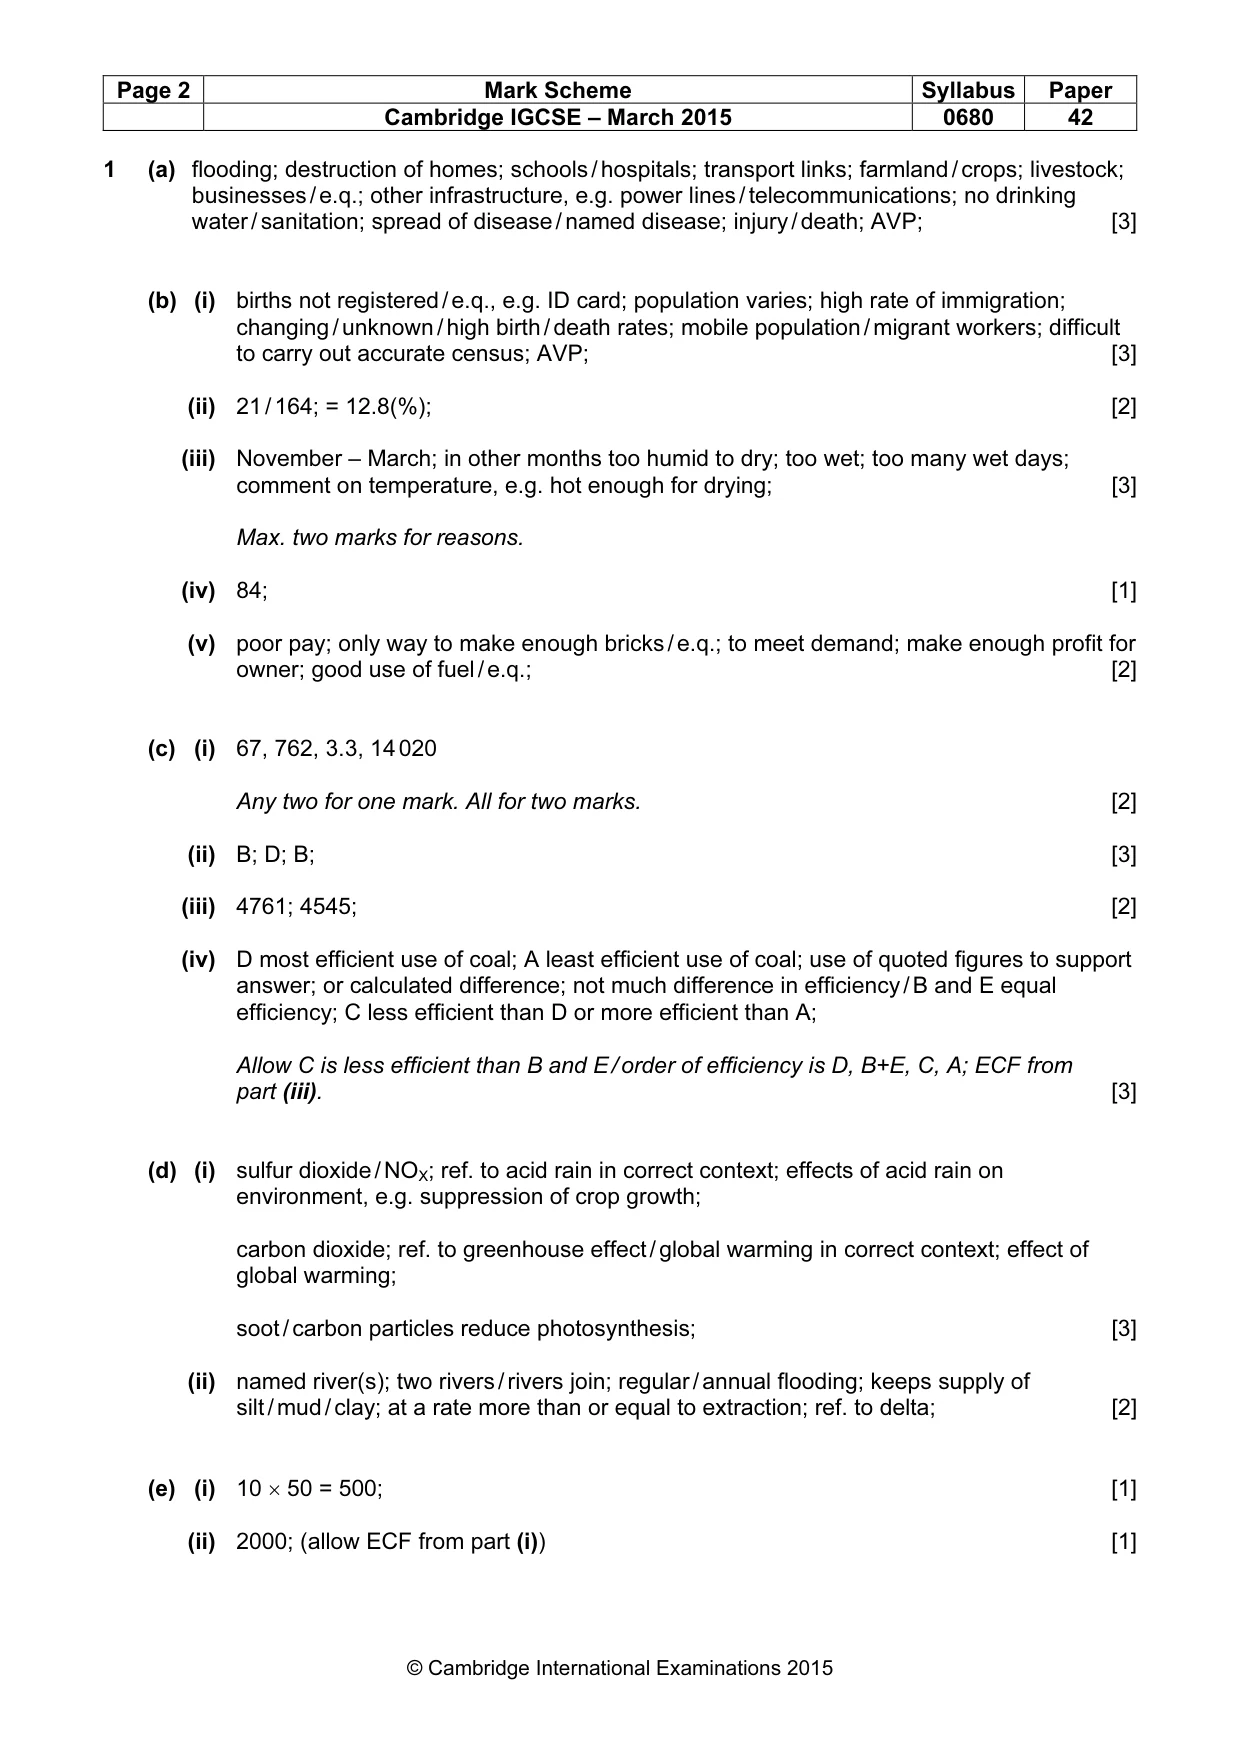
Page 2 Mark Scheme Syllabus Paper Cambridge IGCSE – March 2015 0680 42 © Cambridge International Examinations 2015 1 (a) flooding; destruction of homes; schools / hospitals; transport links; farmland / crops; livestock; businesses / e.q.; other infrastructure, e.g. power lines / telecommunications; no drinking water / sanitation; spread of disease / named disease; injury / death; AVP; [3] (b) (i) births not registered / e.q., e.g. ID card; population varies; high rate of immigration; changing / unknown / high birth / death rates; mobile population / migrant workers; difficult to carry out accurate census; AVP; [3] (ii) 21 / 164; = 12.8(%); [2] (iii) November – March; in other months too humid to dry; too wet; too many wet days; comment on temperature, e.g. hot enough for drying; [3] Max. two marks for reasons. (iv) 84; [1] (v) poor pay; only way to make enough bricks / e.q.; to meet demand; make enough profit for owner; good use of fuel / e.q.; [2] (c) (i) 67, 762, 3.3, 14 020 Any two for one mark. All for two marks. [2] (ii) B; D; B; [3] (iii) 4761; 4545; [2] (iv) D most efficient use of coal; A least efficient use of coal; use of quoted figures to support answer; or calculated difference; not much difference in efficiency / B and E equal efficiency; C less efficient than D or more efficient than A; Allow C is less efficient than B and E / order of efficiency is D, B+E, C, A; ECF from part (iii). [3] (d) (i) sulfur dioxide / NOX; ref. to acid rain in correct context; effects of acid rain on environment, e.g. suppression of crop growth; carbon dioxide; ref. to greenhouse effect / global warming in correct context; effect of global warming; soot / carbon particles reduce photosynthesis; [3] (ii) named river(s); two rivers / rivers join; regular / annual flooding; keeps supply of silt / mud / clay; at a rate more than or equal to extraction; ref. to delta; [2] (e) (i) 10 × 50 = 500; [1] (ii) 2000; (allow ECF from part (i)) [1]
Mark scheme, page 3
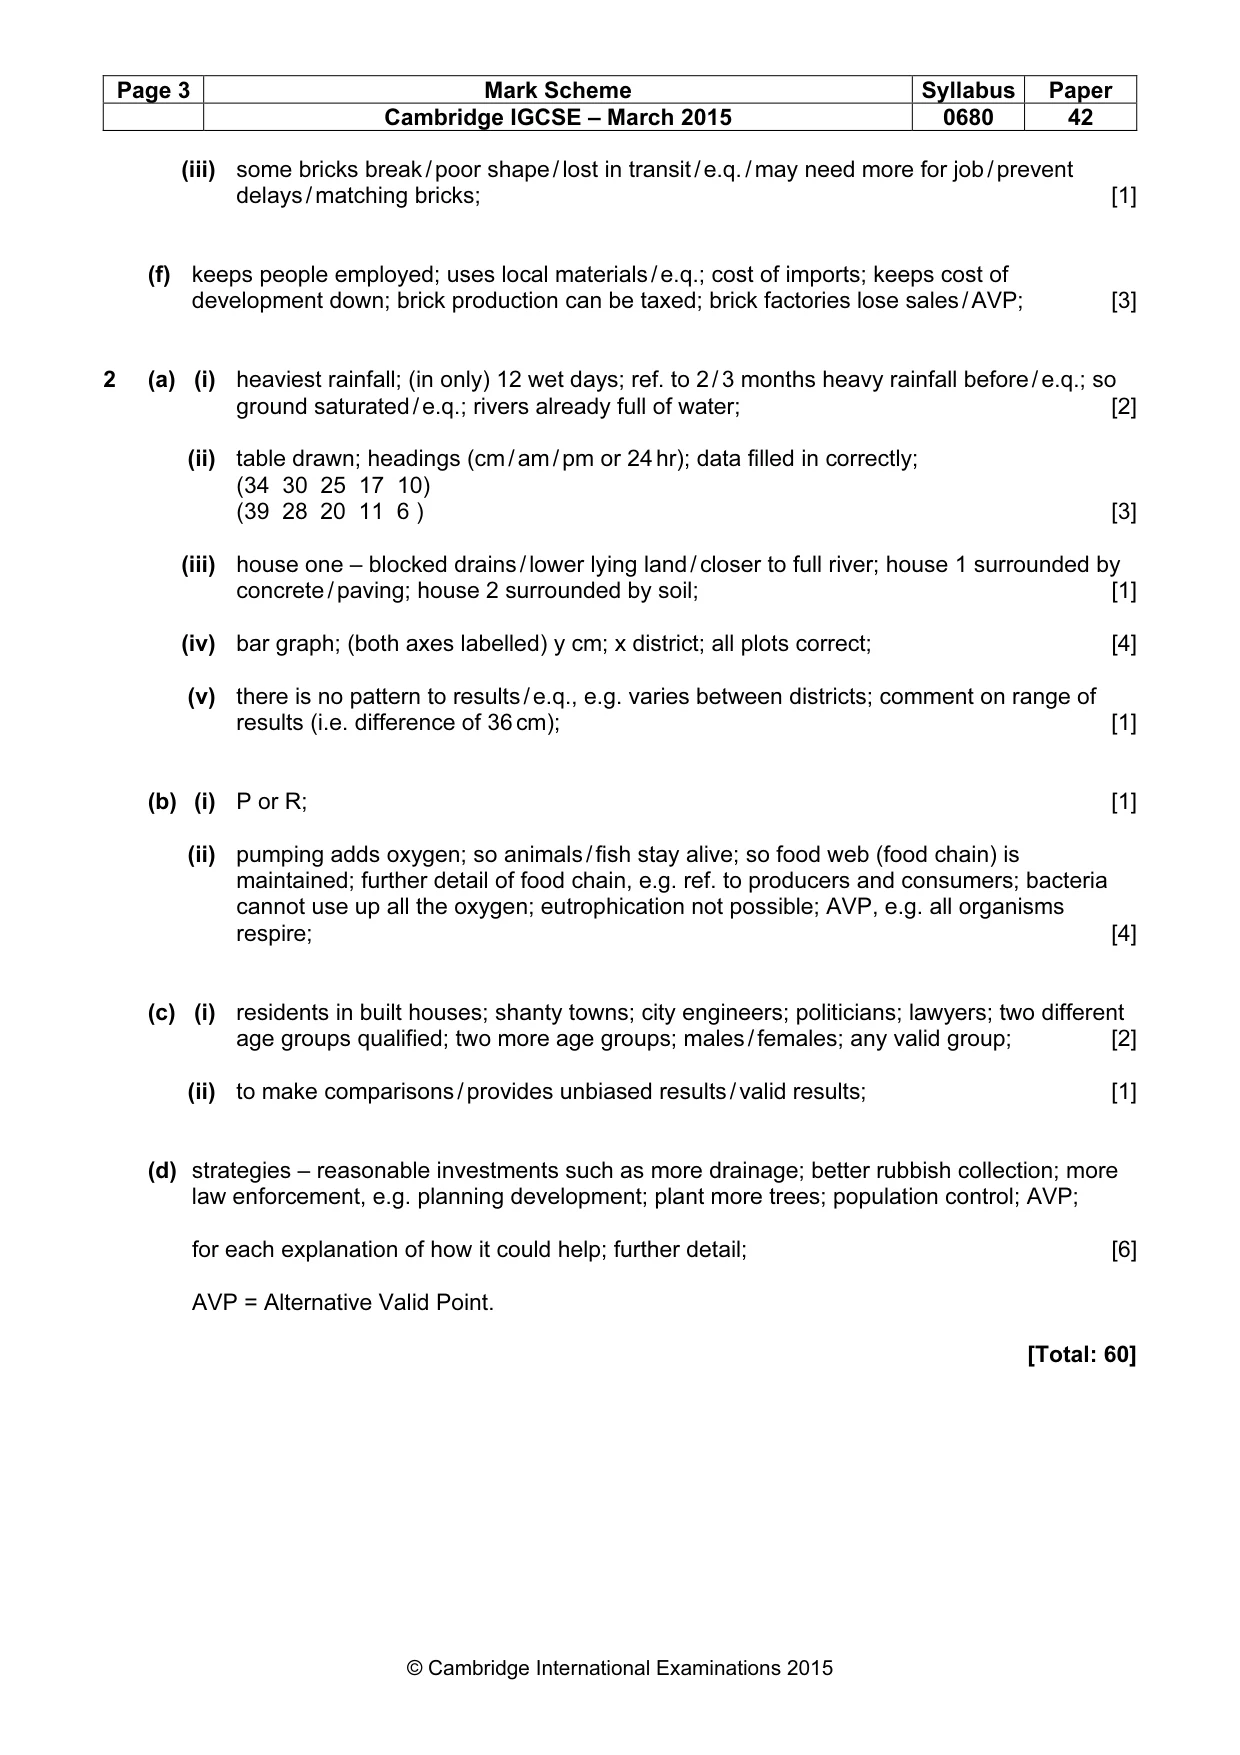
Page 3 Mark Scheme Syllabus Paper Cambridge IGCSE – March 2015 0680 42 © Cambridge International Examinations 2015 (iii) some bricks break / poor shape / lost in transit / e.q. / may need more for job / prevent delays / matching bricks; [1] (f) keeps people employed; uses local materials / e.q.; cost of imports; keeps cost of development down; brick production can be taxed; brick factories lose sales / AVP; [3] 2 (a) (i) heaviest rainfall; (in only) 12 wet days; ref. to 2 / 3 months heavy rainfall before / e.q.; so ground saturated / e.q.; rivers already full of water; [2] (ii) table drawn; headings (cm / am / pm or 24 hr); data filled in correctly; (34 30 25 17 10) (39 28 20 11 6 ) [3] (iii) house one – blocked drains / lower lying land / closer to full river; house 1 surrounded by concrete / paving; house 2 surrounded by soil; [1] (iv) bar graph; (both axes labelled) y cm; x district; all plots correct; [4] (v) there is no pattern to results / e.q., e.g. varies between districts; comment on range of results (i.e. difference of 36 cm); [1] (b) (i) P or R; [1] (ii) pumping adds oxygen; so animals / fish stay alive; so food web (food chain) is maintained; further detail of food chain, e.g. ref. to producers and consumers; bacteria cannot use up all the oxygen; eutrophication not possible; AVP, e.g. all organisms respire; [4] (c) (i) residents in built houses; shanty towns; city engineers; politicians; lawyers; two different age groups qualified; two more age groups; males / females; any valid group; [2] (ii) to make comparisons / provides unbiased results / valid results; [1] (d) strategies – reasonable investments such as more drainage; better rubbish collection; more law enforcement, e.g. planning development; plant more trees; population control; AVP; for each explanation of how it could help; further detail; [6] AVP = Alternative Valid Point. [Total: 60]
What you needed in this session
Cambridge’s own grade thresholds for 2015 Feb/March, Paper 4 · Variant 2. A higher threshold means an easier paper — the bar moves with how the cohort did.