Cambridge IGCSE Environmental Management 0680 — 2014 Oct/Nov Paper 4 · Variant 3
0680/43/O/N/14 · 60 marks · ≈68 min
The question paper and its mark scheme, free to read here and free to download. This is Cambridge’s own paper, exactly as it was sat.
Question paper16 pages


Mark scheme3 pages
Answers below. Sit the paper first if you are practising.
Paper as text
Question paper, page 1
This document consists of 14 printed pages and 2 blank pages. DC (SJF/SW) 91034/3 © UCLES 2014 [Turn over * 2 2 7 0 8 3 0 5 9 6 * ENVIRONMENTAL MANAGEMENT 0680/43 Alternative to Coursework October/November 2014 1 hour 30 minutes Candidates answer on the Question Paper. Additional Materials: Ruler READ THESE INSTRUCTIONS FIRST Write your Centre number, candidate number and name on all the work you hand in. Write in dark blue or black pen. You may use an HB pencil for any diagrams or graphs. Do not use staples, paper clips, glue or correction fluid. DO NOT WRITE IN ANY BARCODES. Answer all questions. Electronic calculators may be used. You may lose marks if you do not show your working or if you do not use appropriate units. Study the appropriate source materials before you start to write your answers. Credit will be given for appropriate selection and use of data in your answers and for relevant interpretation of these data. Suggestions for data sources are given in some questions. You may use the source data to draw diagrams and graphs or to do calculations to illustrate your answers. At the end of the examination, fasten all your work securely together. The number of marks is given in brackets [ ] at the end of each question or part question. Cambridge International Examinations Cambridge International General Certificate of Secondary Education
Question paper, page 2
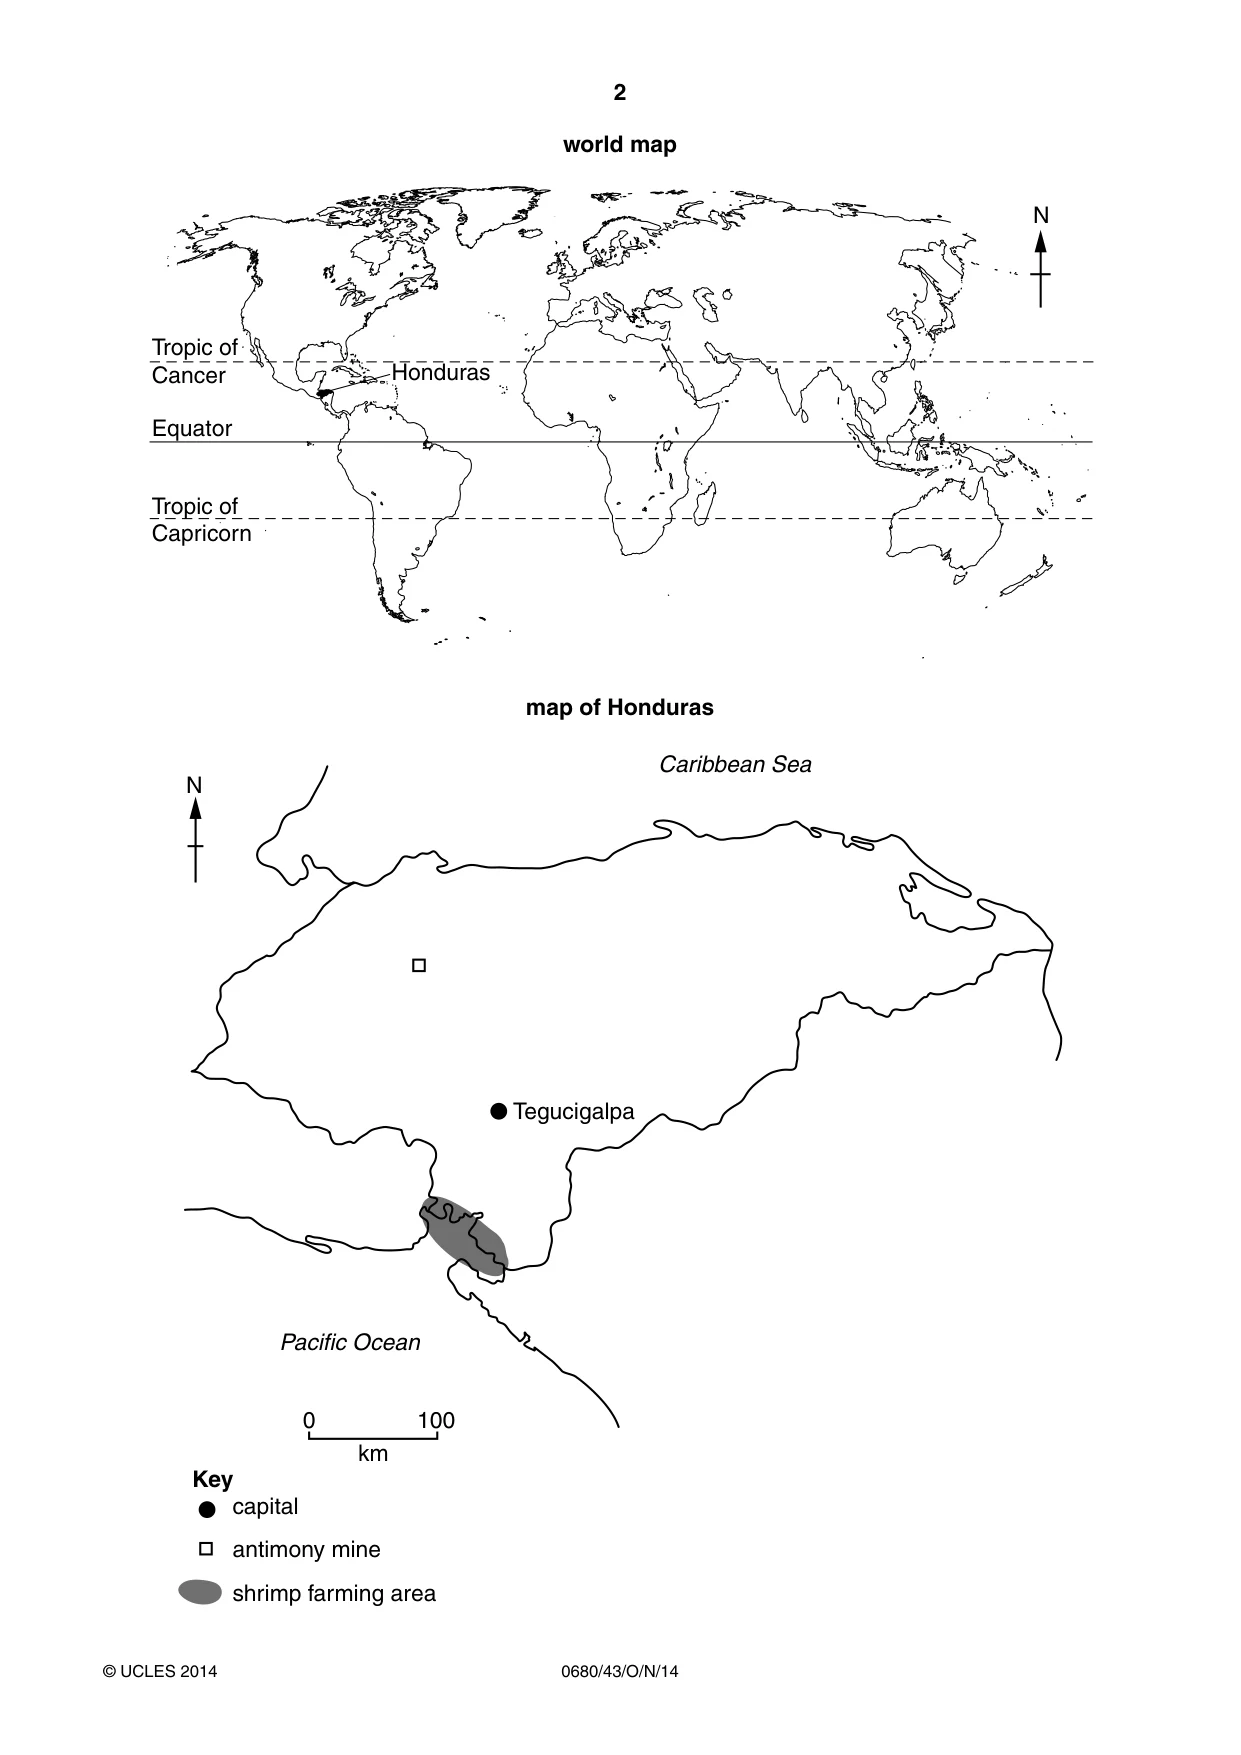
2 0680/43/O/N/14 © UCLES 2014 world map Equator Tropic of Capricorn Honduras Tropic of Cancer N map of Honduras 0 100 km Tegucigalpa Pacific Ocean Caribbean Sea capital antimony mine shrimp farming area Key N
Question paper, page 3
3 0680/43/O/N/14 © UCLES 2014 [Turn over Area of Honduras: 112 090 sq km Population: 8 500 000 Children per woman: 2.9 Life expectancy: 71yrs Currency: lempiras (20 =1 US$) Languages: Spanish, Amerindian languages Climate: subtropical in lowlands, temperate in the mountains Terrain: narrow coastal plains, mountains in the interior Main exports: shrimps, clothing, coffee, car parts, cigars, bananas, antimony, palm oil and timber.
Question paper, page 4
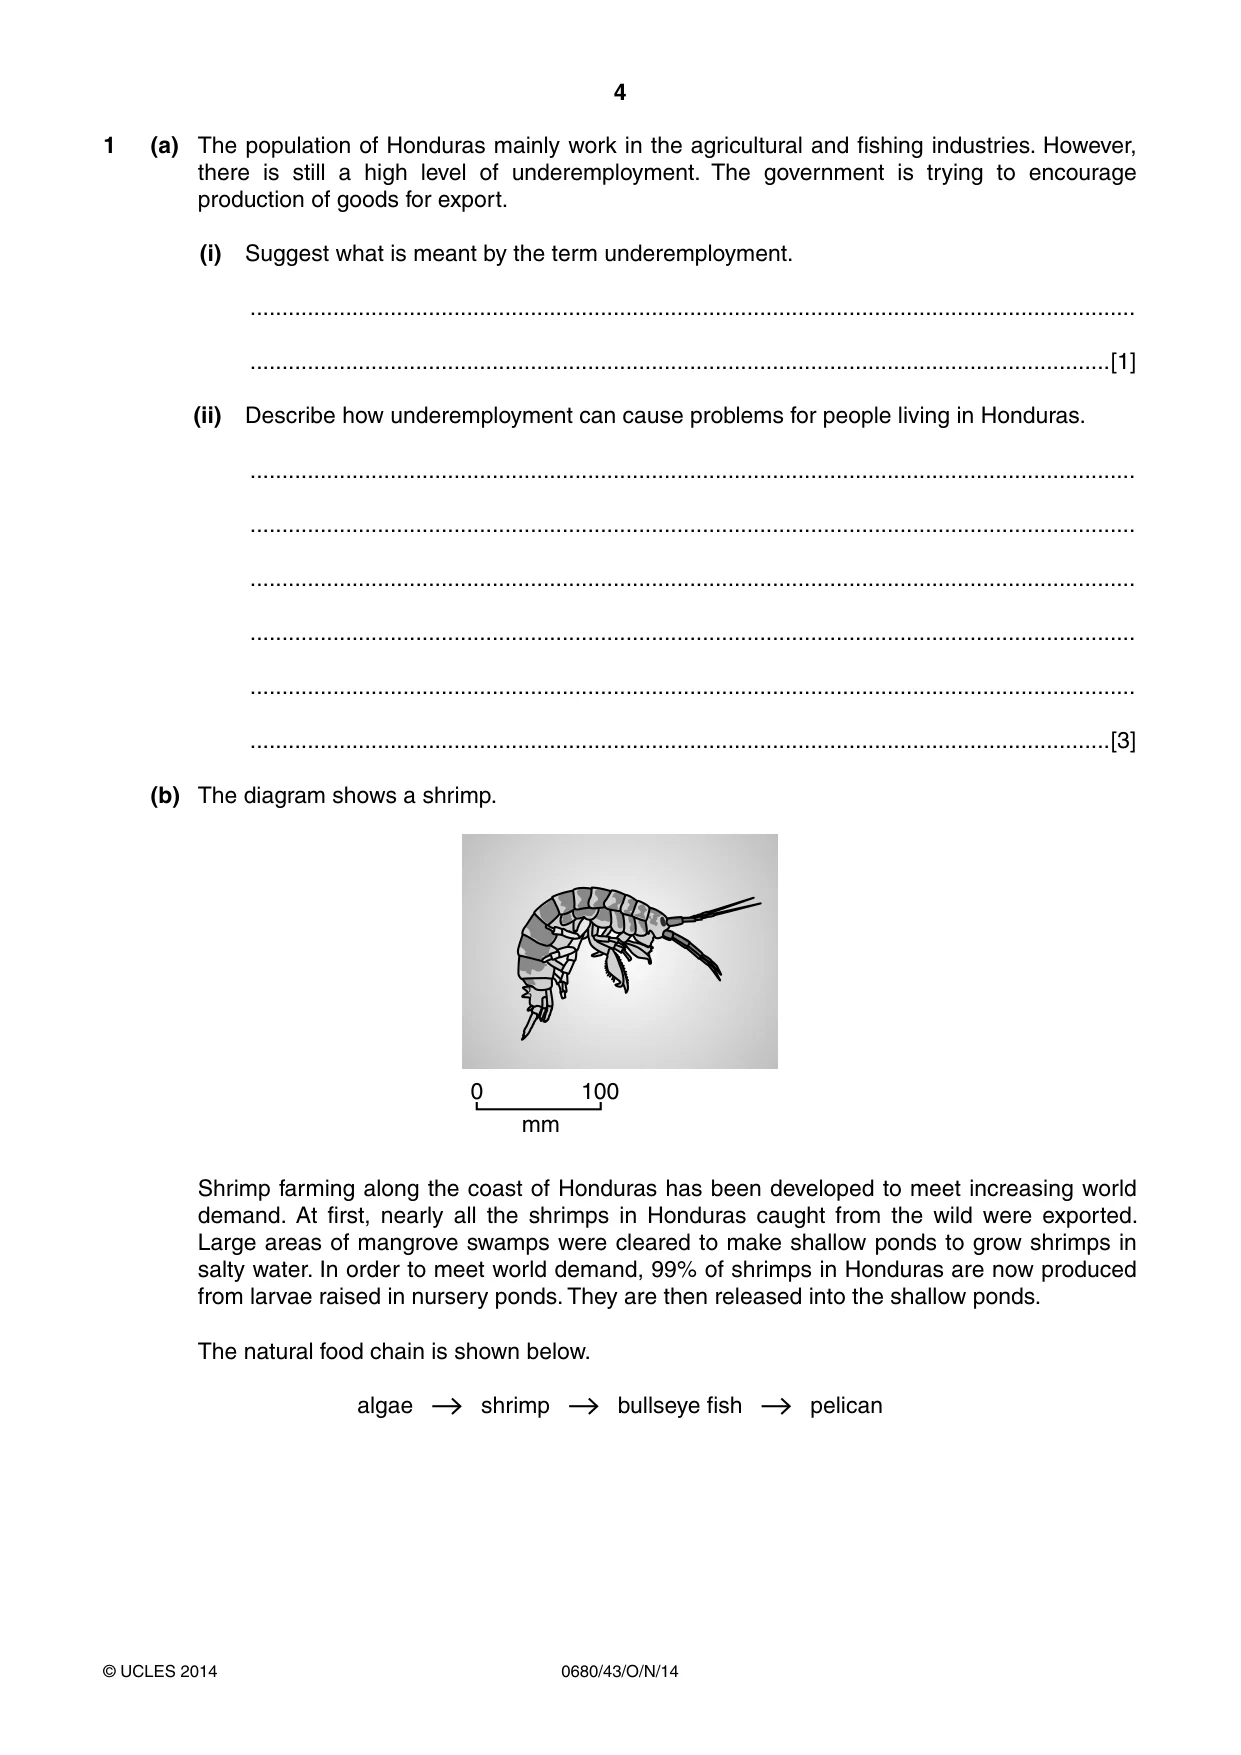
4 0680/43/O/N/14 © UCLES 2014 1 (a) The population of Honduras mainly work in the agricultural and fishing industries. However, there is still a high level of underemployment. The government is trying to encourage production of goods for export. (i) Suggest what is meant by the term underemployment. … …[1] (ii) Describe how underemployment can cause problems for people living in Honduras. … … … … … …[3] (b) The diagram shows a shrimp. 0 100 mm Shrimp farming along the coast of Honduras has been developed to meet increasing world demand. At first, nearly all the shrimps in Honduras caught from the wild were exported. Large areas of mangrove swamps were cleared to make shallow ponds to grow shrimps in salty water. In order to meet world demand, 99% of shrimps in Honduras are now produced from larvae raised in nursery ponds. They are then released into the shallow ponds. The natural food chain is shown below. algae shrimp bullseye fish pelican
Question paper, page 5
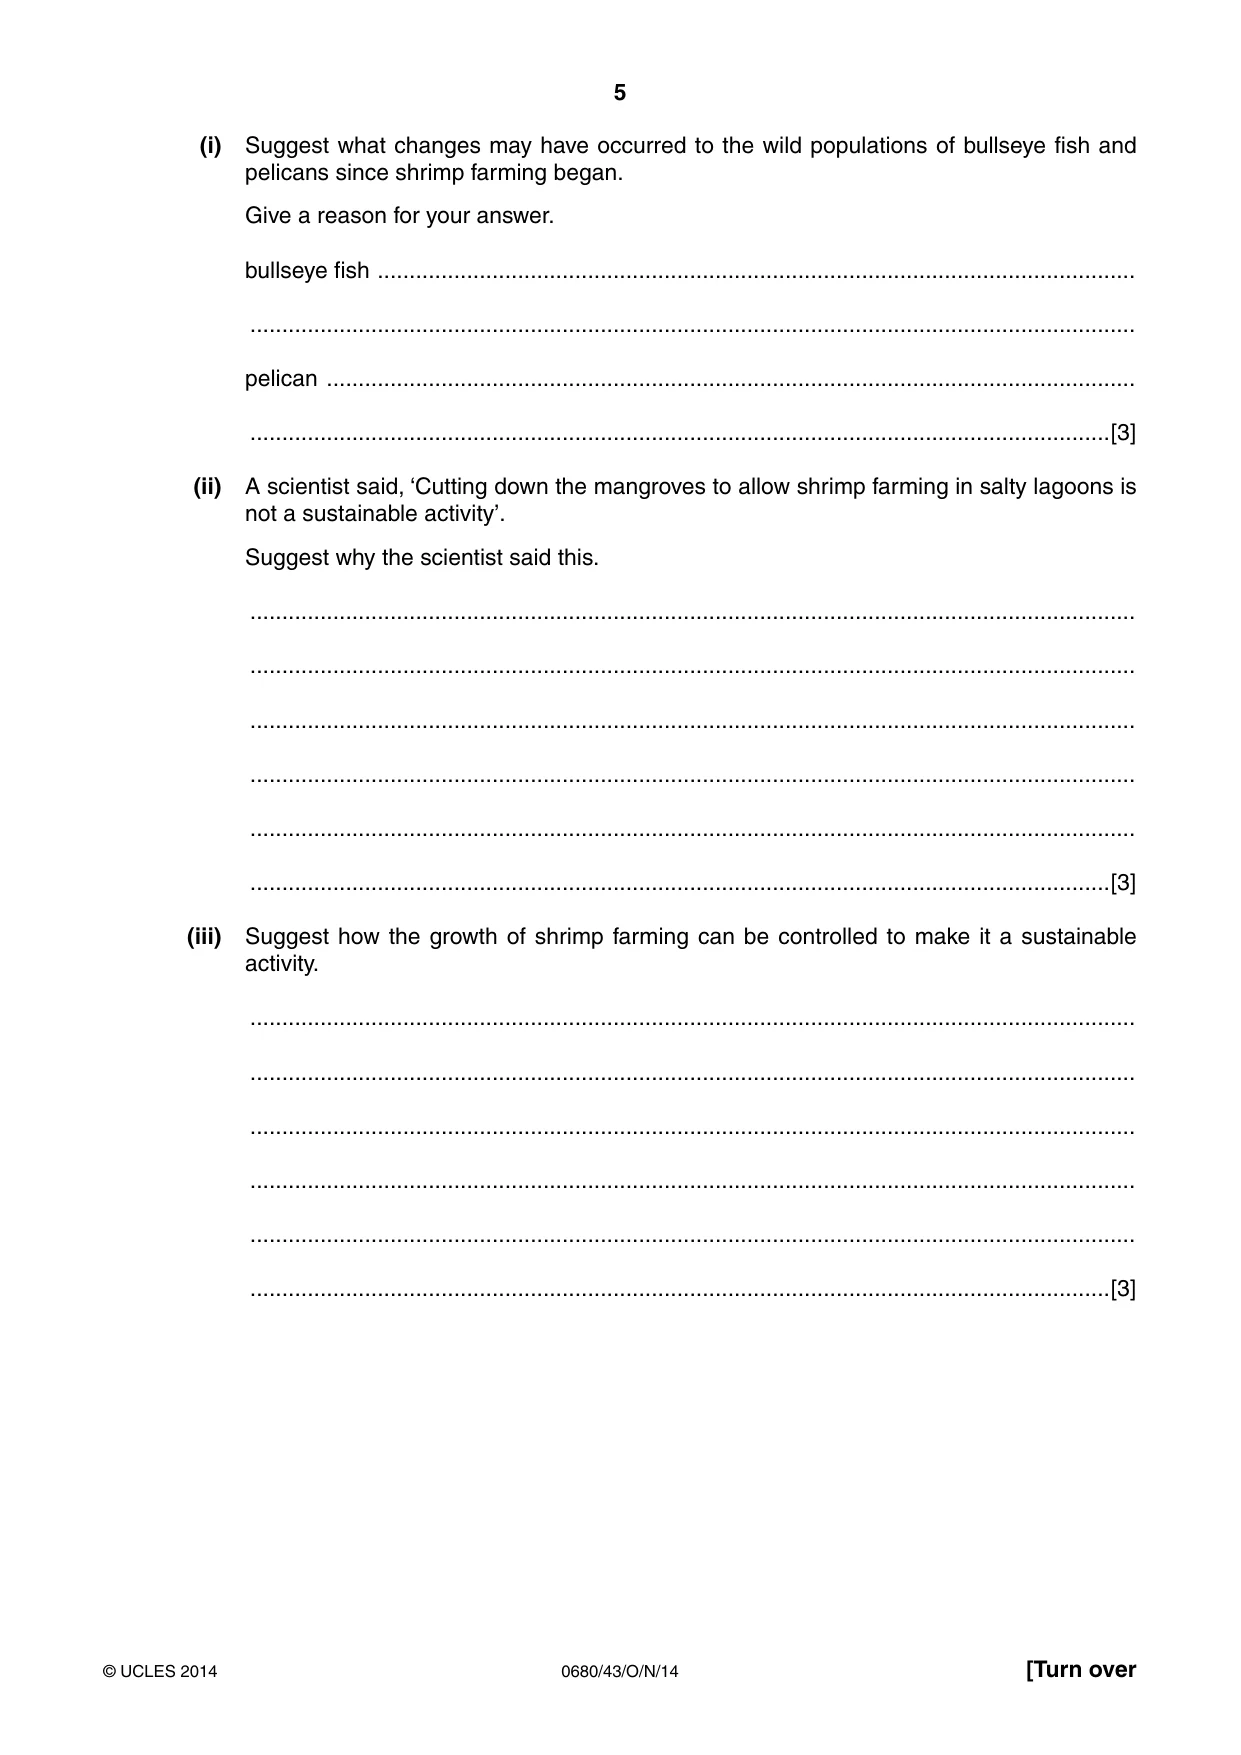
5 0680/43/O/N/14 © UCLES 2014 [Turn over (i) Suggest what changes may have occurred to the wild populations of bullseye fish and pelicans since shrimp farming began. Give a reason for your answer. bullseye fish … … pelican … …[3] (ii) A scientist said, ‘Cutting down the mangroves to allow shrimp farming in salty lagoons is not a sustainable activity’. Suggest why the scientist said this. … … … … … …[3] (iii) Suggest how the growth of shrimp farming can be controlled to make it a sustainable activity. … … … … … …[3]
Question paper, page 6
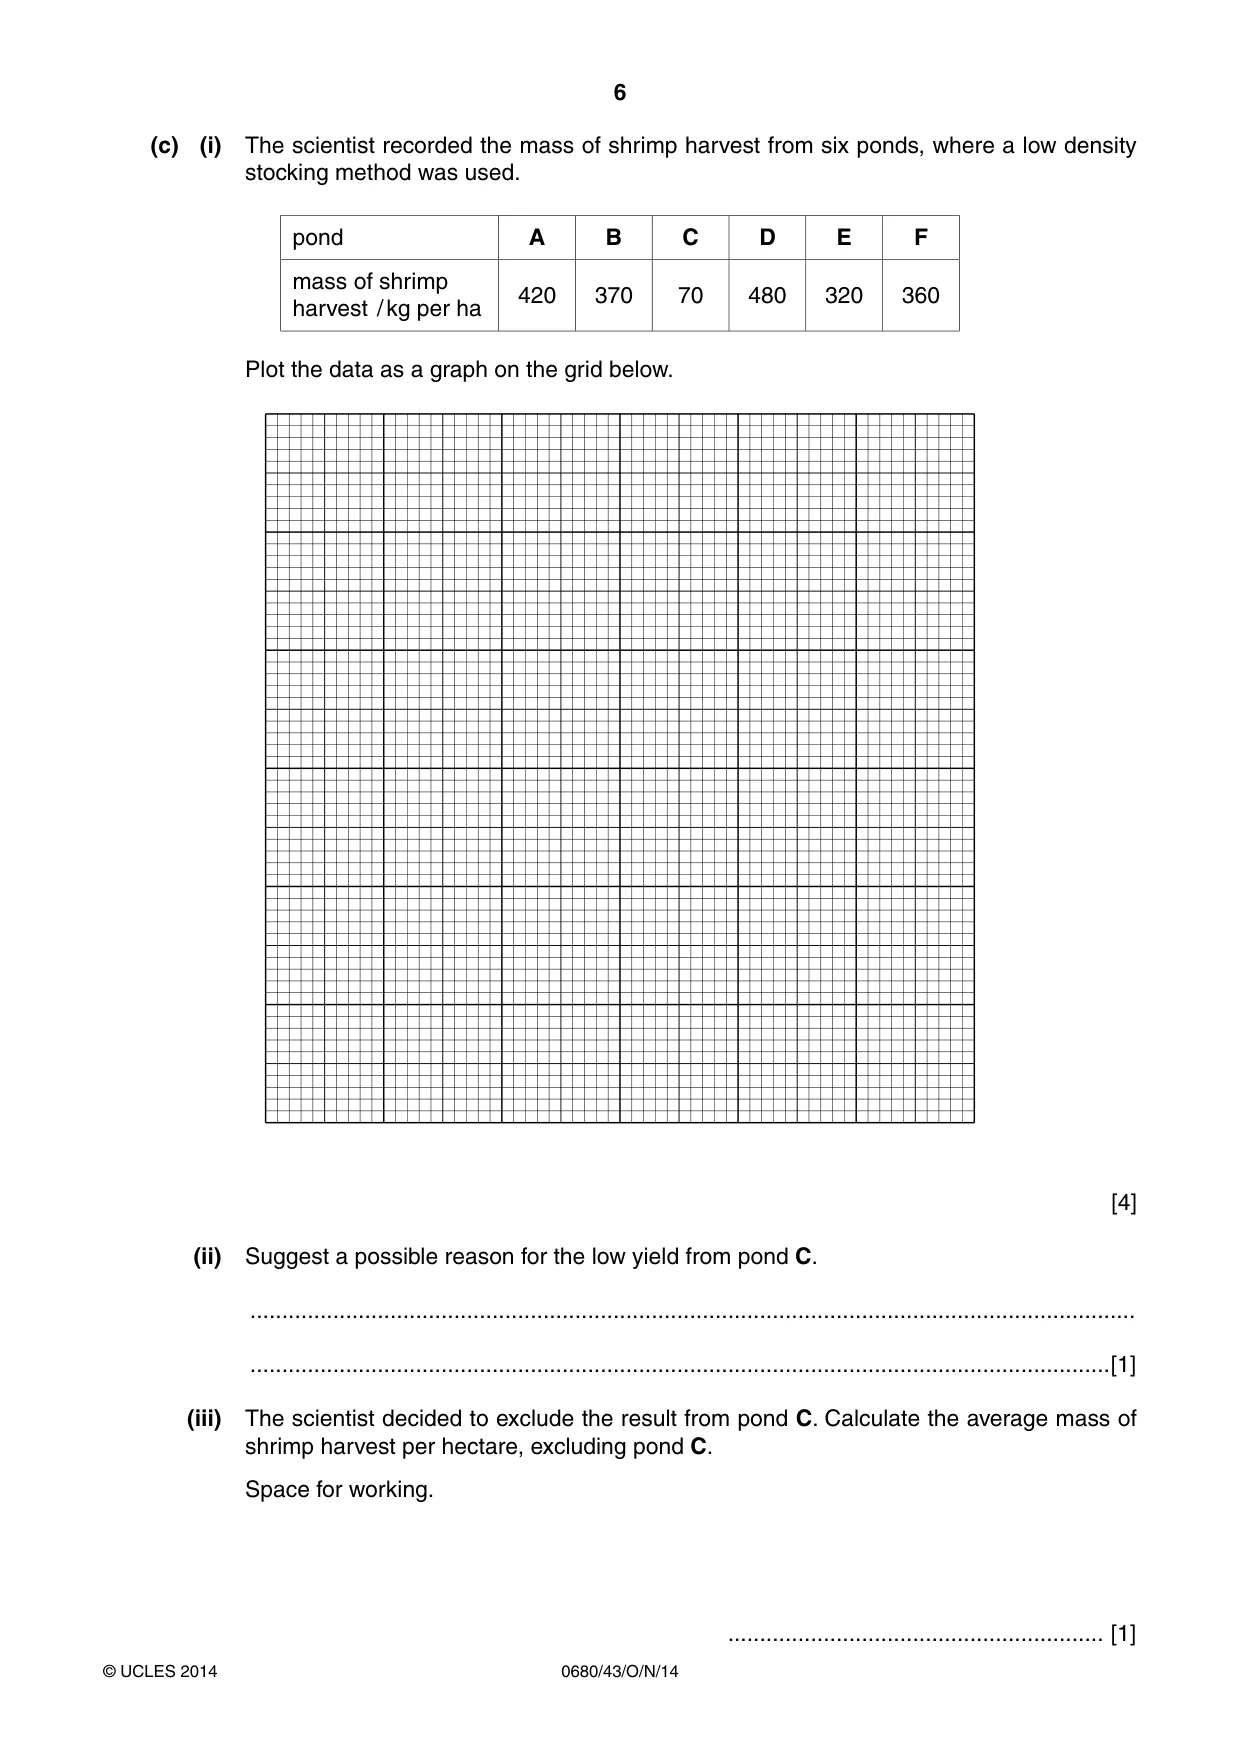
6 0680/43/O/N/14 © UCLES 2014 (c) (i) The scientist recorded the mass of shrimp harvest from six ponds, where a low density stocking method was used. pond A B C D E F mass of shrimp harvest / kg per ha 420 370 70 480 320 360 Plot the data as a graph on the grid below. [4] (ii) Suggest a possible reason for the low yield from pond C. … …[1] (iii) The scientist decided to exclude the result from pond C. Calculate the average mass of shrimp harvest per hectare, excluding pond C. Space for working. … [1]
Question paper, page 7
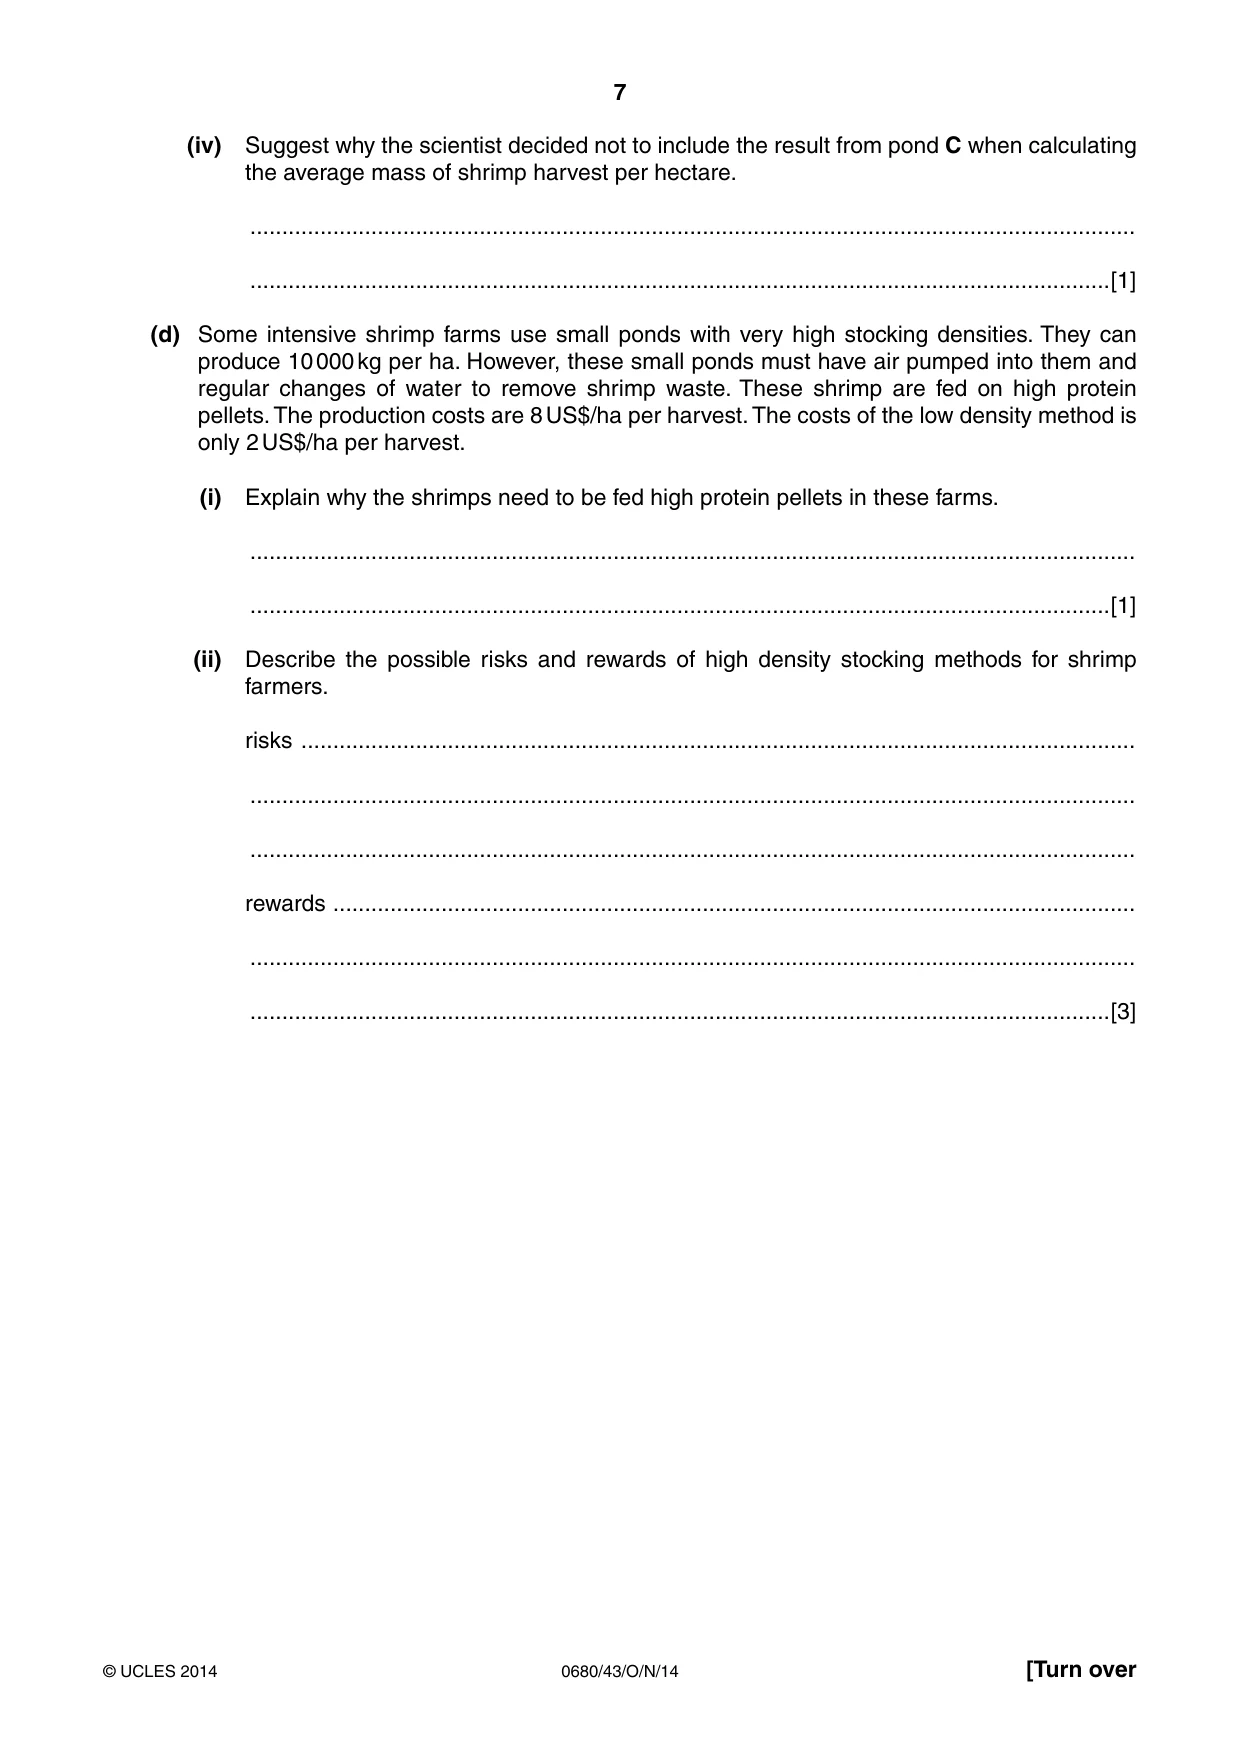
7 0680/43/O/N/14 © UCLES 2014 [Turn over (iv) Suggest why the scientist decided not to include the result from pond C when calculating the average mass of shrimp harvest per hectare. … …[1] (d) Some intensive shrimp farms use small ponds with very high stocking densities. They can produce 10 000 kg per ha. However, these small ponds must have air pumped into them and regular changes of water to remove shrimp waste. These shrimp are fed on high protein pellets. The production costs are 8 US$/ha per harvest. The costs of the low density method is only 2 US$/ha per harvest. (i) Explain why the shrimps need to be fed high protein pellets in these farms. … …[1] (ii) Describe the possible risks and rewards of high density stocking methods for shrimp farmers. risks … … … rewards … … …[3]
Question paper, page 8
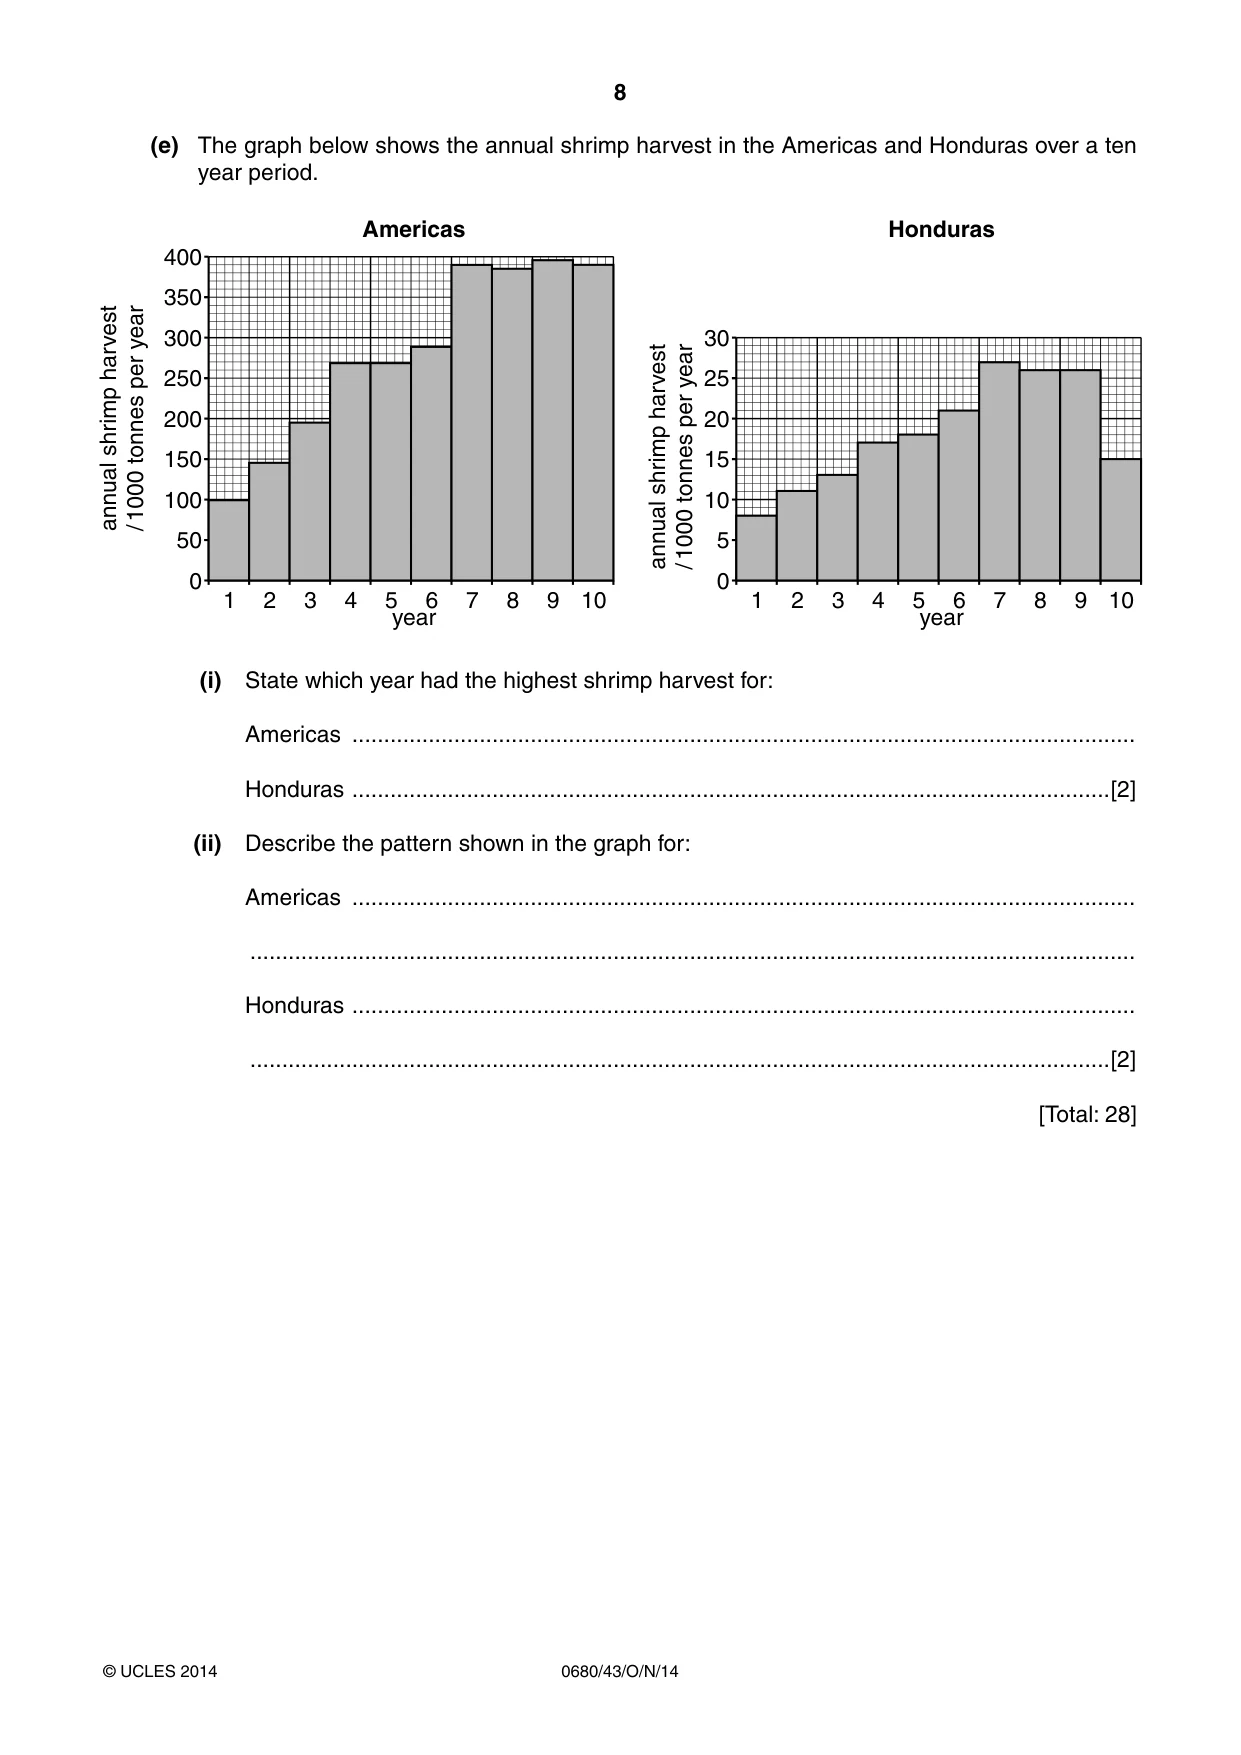
8 0680/43/O/N/14 © UCLES 2014 (e) The graph below shows the annual shrimp harvest in the Americas and Honduras over a ten year period. 1 0 50 100 150 200 250 300 350 400 2 3 4 5 6 year annual shrimp harvest / 1000 tonnes per year 7 8 9 10 1 0 5 10 15 20 25 30 2 3 4 5 6 year Americas Honduras annual shrimp harvest / 1000 tonnes per year 7 8 9 10 (i) State which year had the highest shrimp harvest for: Americas … Honduras …[2] (ii) Describe the pattern shown in the graph for: Americas … … Honduras … …[2] [Total: 28]
Question paper, page 9
9 0680/43/O/N/14 © UCLES 2014 [Turn over 2 (a) Antimony ore has been extracted from one shaft mine in Honduras for many years. The government has recently decided to give licenses for open pit (cast) and shaft mining of antimony and other ores. Some people are worried that new mining activity will cause problems. (i) Describe the main differences between open pit (cast) and shaft mining. … … … … … …[3] (ii) Suggest why people living near the proposed open pit (cast) mines may be adversely affected by these mining developments. … … … … … … … …[4]
Question paper, page 10
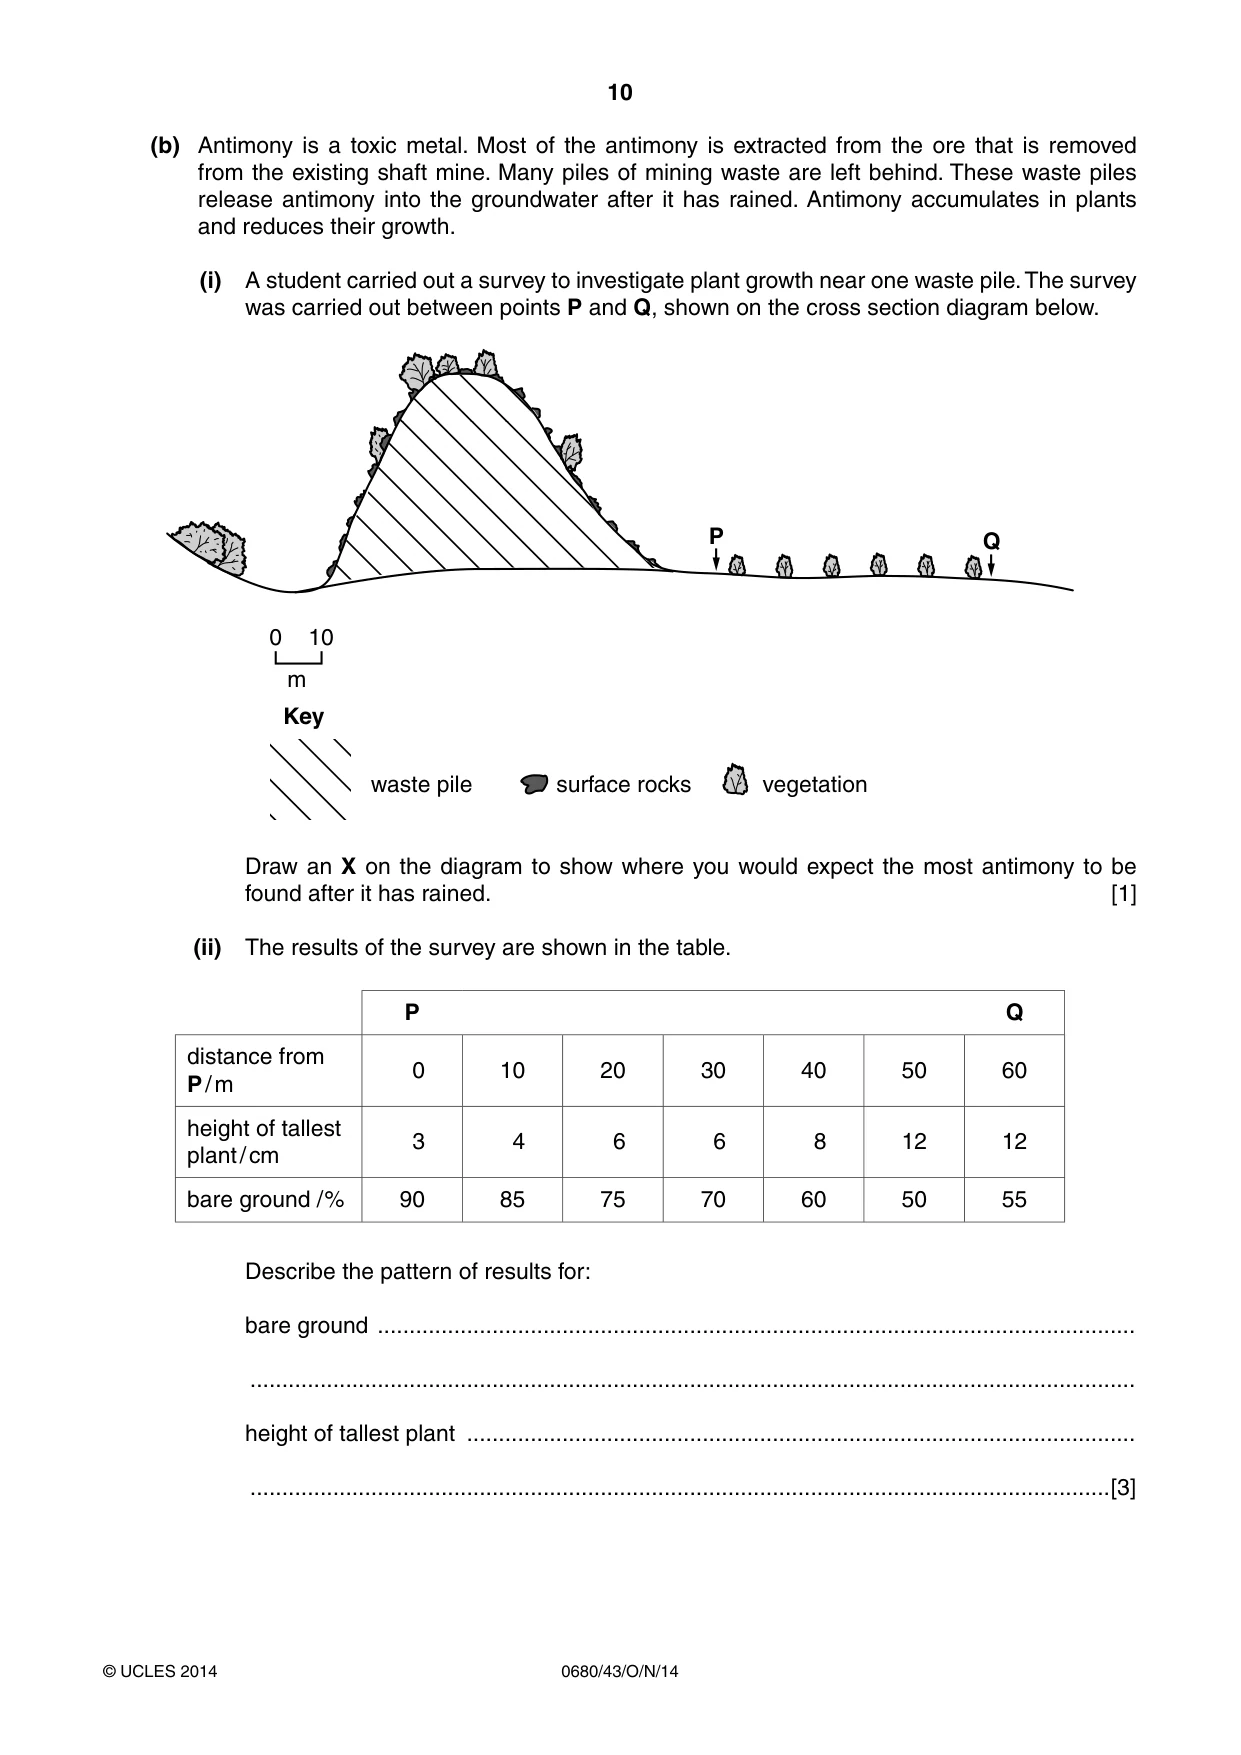
10 0680/43/O/N/14 © UCLES 2014 (b) Antimony is a toxic metal. Most of the antimony is extracted from the ore that is removed from the existing shaft mine. Many piles of mining waste are left behind. These waste piles release antimony into the groundwater after it has rained. Antimony accumulates in plants and reduces their growth. (i) A student carried out a survey to investigate plant growth near one waste pile. The survey was carried out between points P and Q, shown on the cross section diagram below. 0 10 P Key Q m waste pile surface rocks vegetation Draw an X on the diagram to show where you would expect the most antimony to be found after it has rained. [1] (ii) The results of the survey are shown in the table. P Q distance from P / m 0 10 20 30 40 50 60 height of tallest plant / cm 3 4 6 6 8 12 12 bare ground /% 90 85 75 70 60 50 55 Describe the pattern of results for: bare ground … … height of tallest plant … …[3]
Question paper, page 11
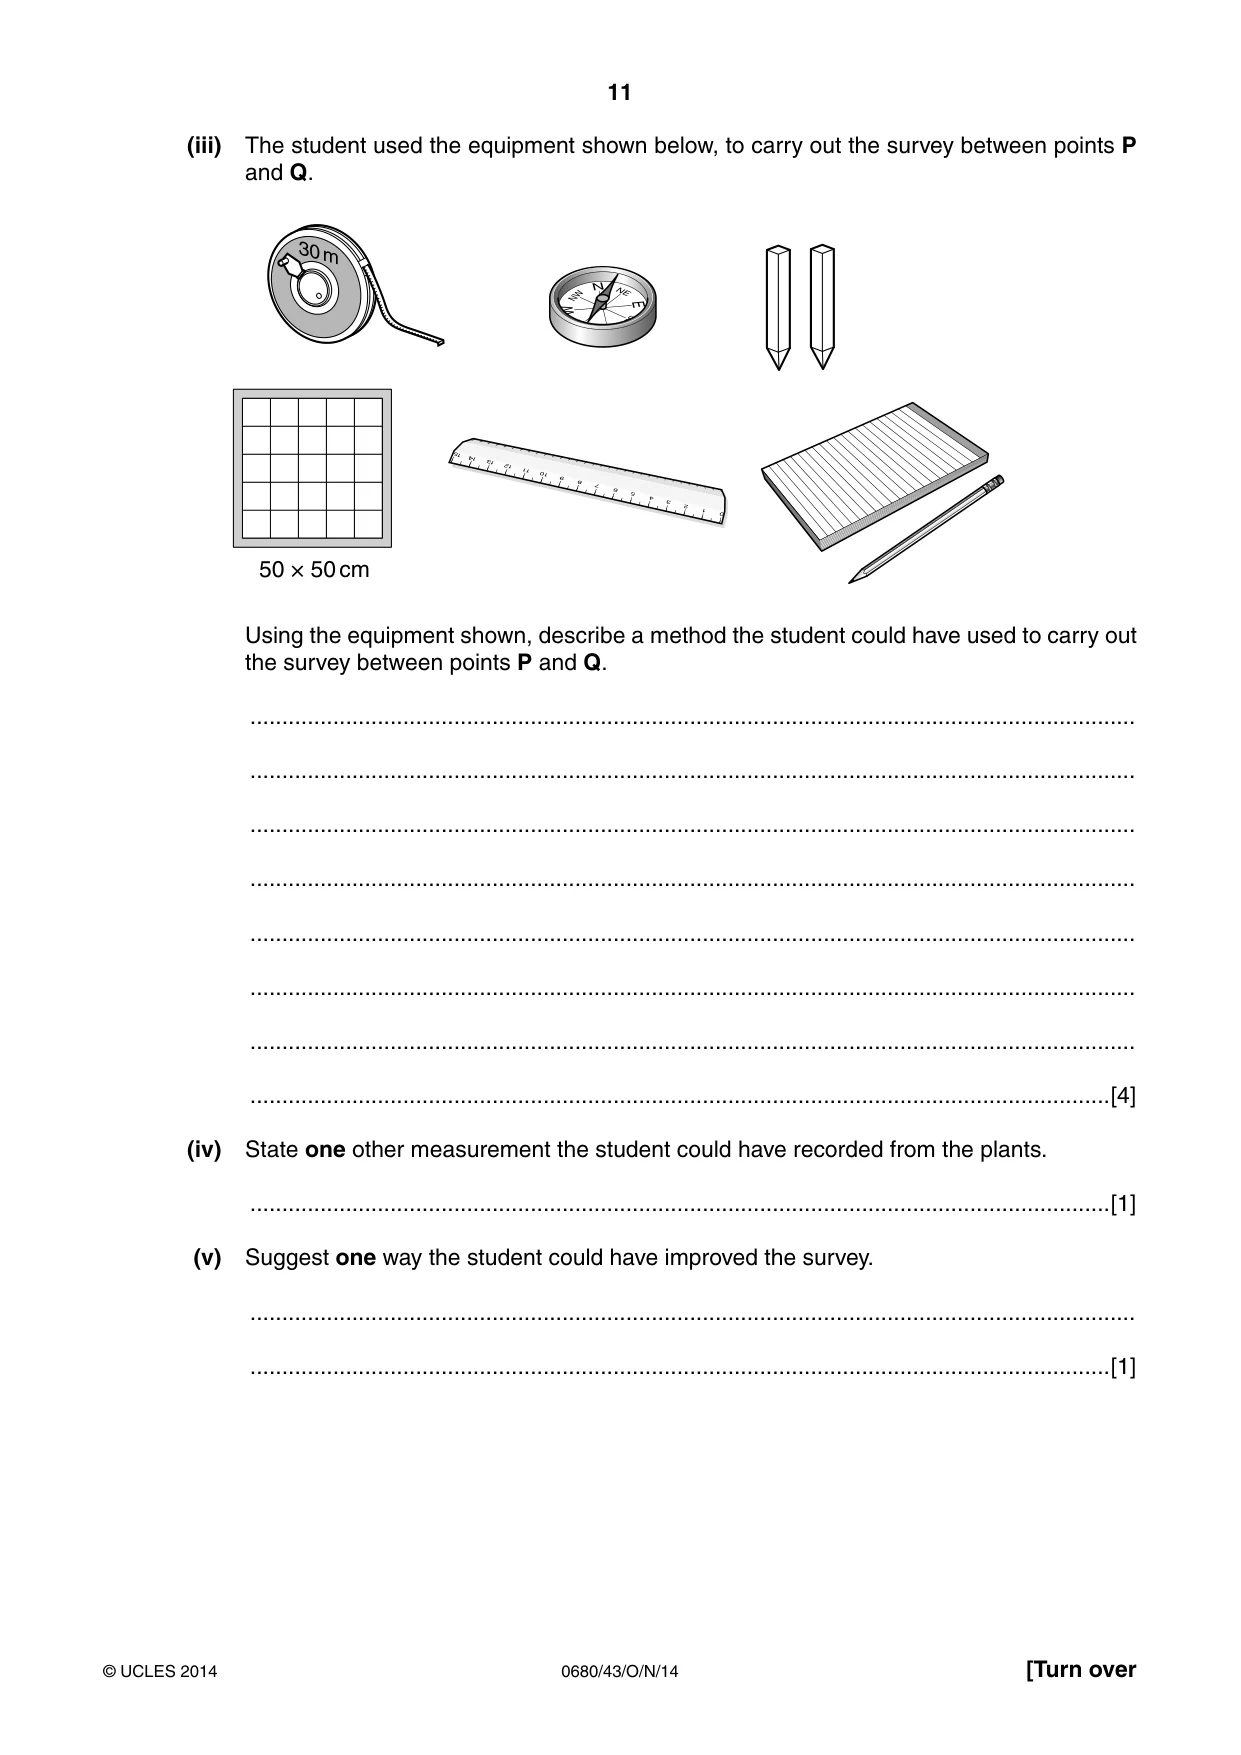
11 0680/43/O/N/14 © UCLES 2014 [Turn over (iii) The student used the equipment shown below, to carry out the survey between points P and Q. N NW W SW S SE E NE 50 × 50 cm Using the equipment shown, describe a method the student could have used to carry out the survey between points P and Q. … … … … … … … …[4] (iv) State one other measurement the student could have recorded from the plants. …[1] (v) Suggest one way the student could have improved the survey. … …[1]
Question paper, page 12
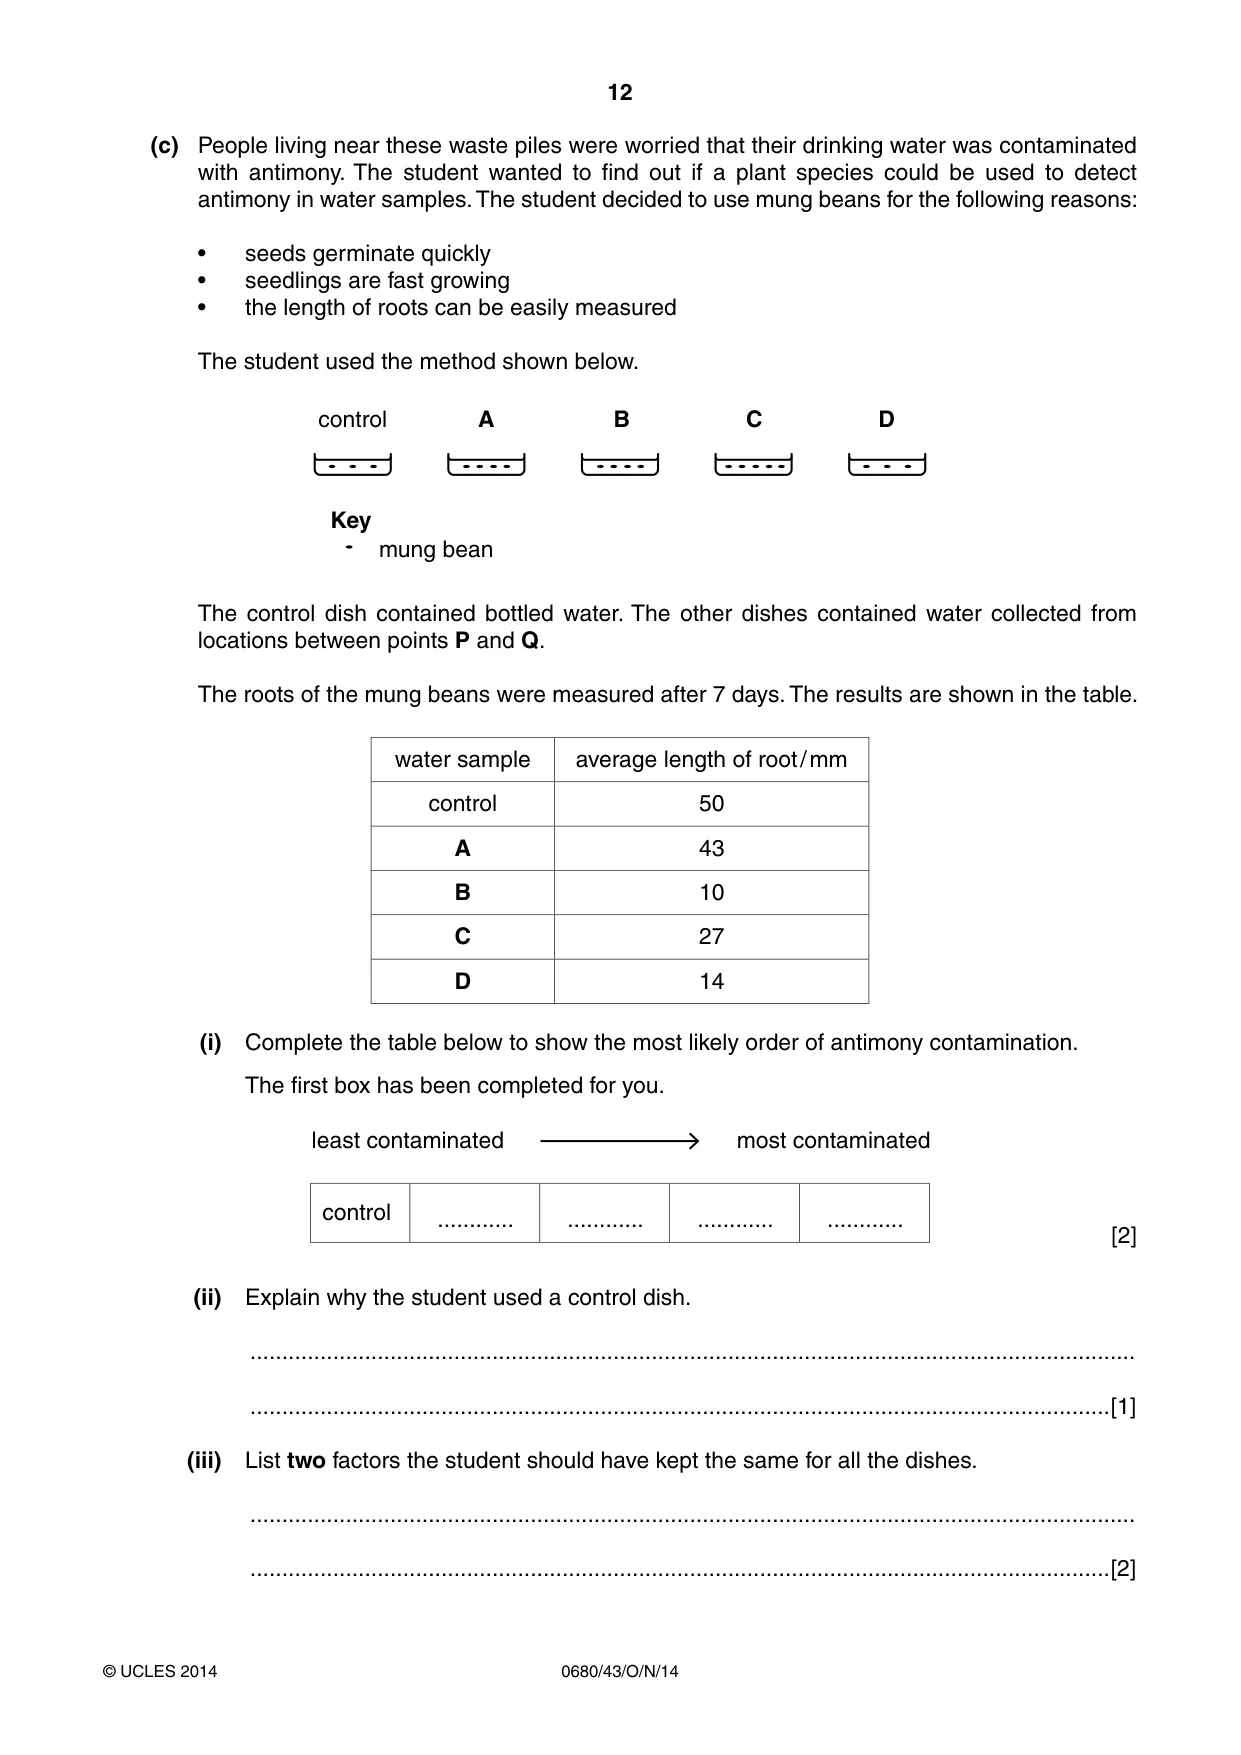
12 0680/43/O/N/14 © UCLES 2014 (c) People living near these waste piles were worried that their drinking water was contaminated with antimony. The student wanted to find out if a plant species could be used to detect antimony in water samples. The student decided to use mung beans for the following reasons: • seeds germinate quickly • seedlings are fast growing • the length of roots can be easily measured The student used the method shown below. A Key mung bean B C control D The control dish contained bottled water. The other dishes contained water collected from locations between points P and Q. The roots of the mung beans were measured after 7 days. The results are shown in the table. water sample average length of root / mm control 50 A 43 B 10 C 27 D 14 (i) Complete the table below to show the most likely order of antimony contamination. The first box has been completed for you. least contaminated most contaminated control … … … … [2] (ii) Explain why the student used a control dish. … …[1] (iii) List two factors the student should have kept the same for all the dishes. … …[2]
Question paper, page 13
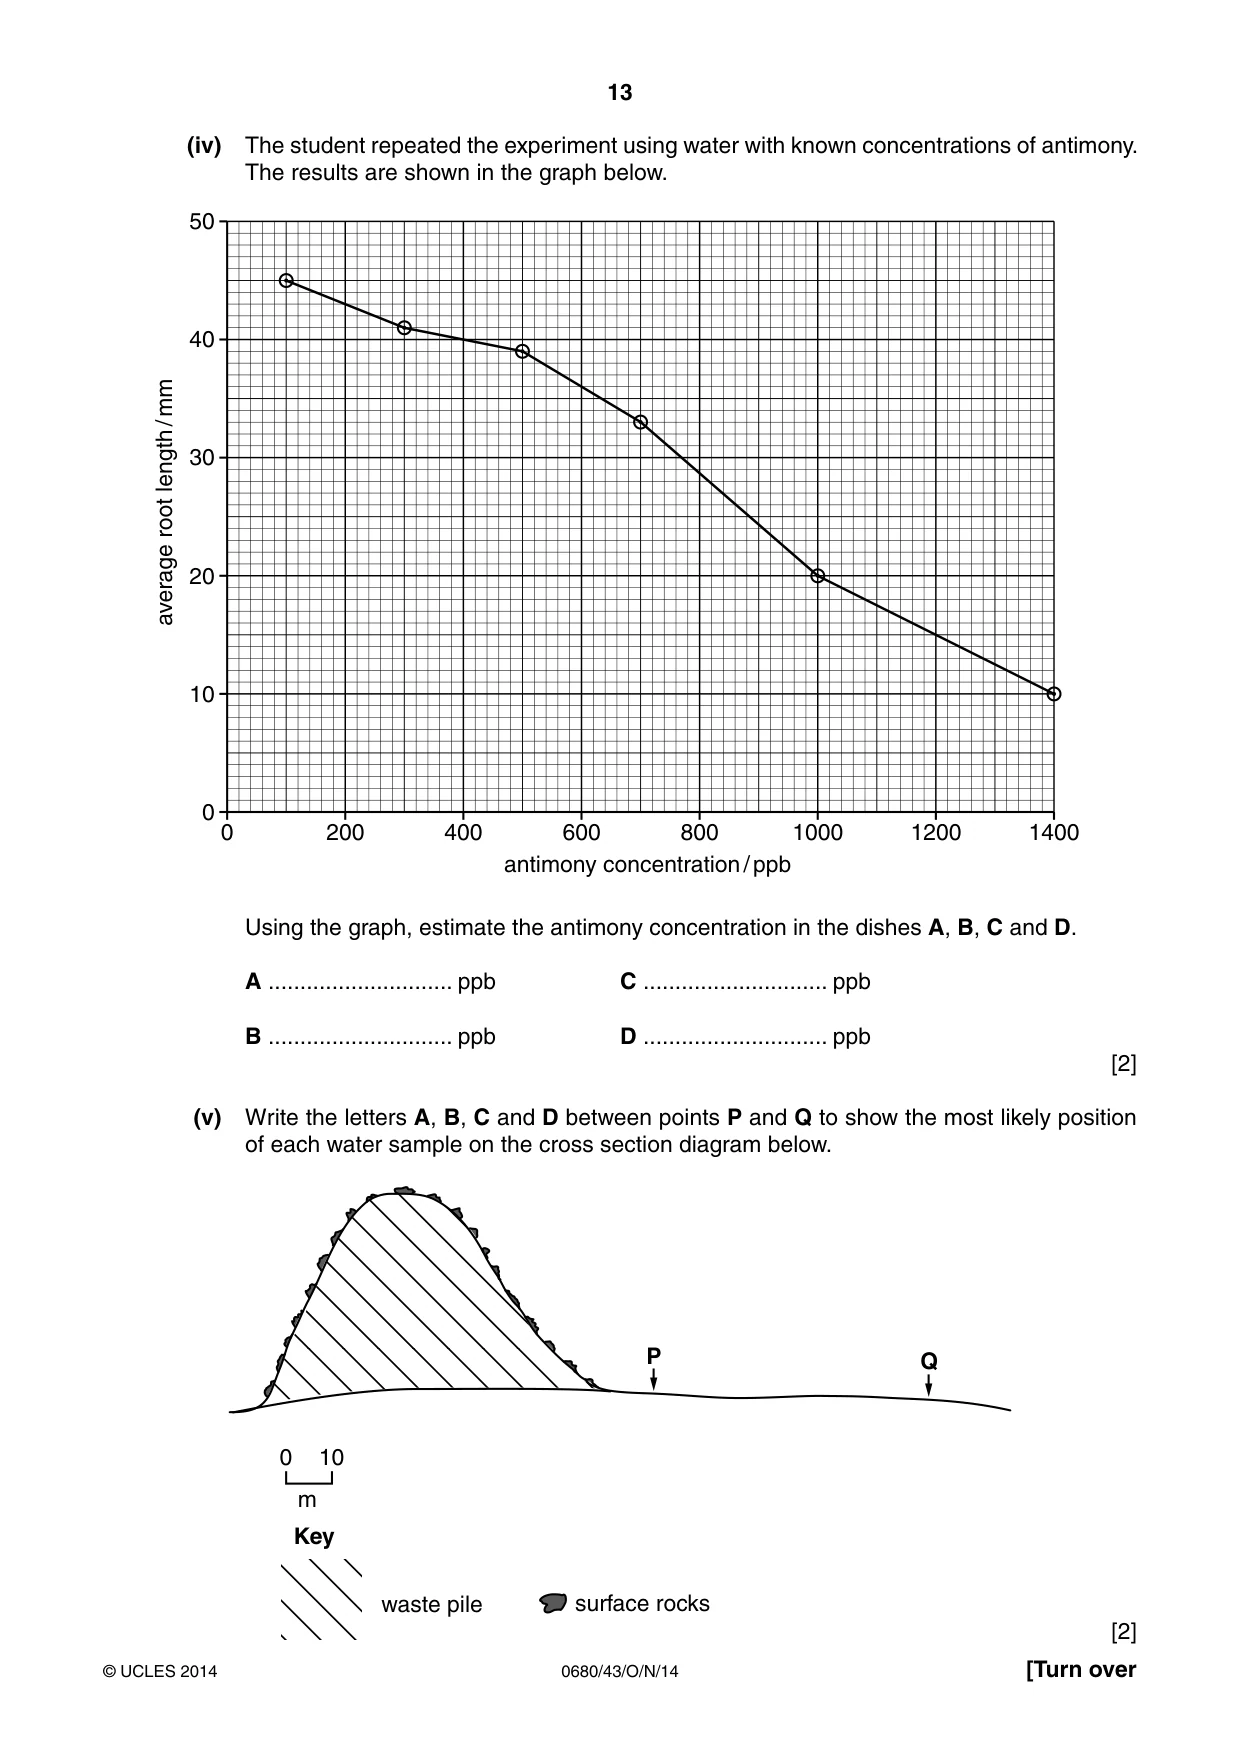
13 0680/43/O/N/14 © UCLES 2014 [Turn over (iv) The student repeated the experiment using water with known concentrations of antimony. The results are shown in the graph below. 0 0 10 20 30 40 50 200 400 600 800 antimony concentration / ppb average root length / mm 1000 1200 1400 Using the graph, estimate the antimony concentration in the dishes A, B, C and D. A … ppb C … ppb B … ppb D … ppb [2] (v) Write the letters A, B, C and D between points P and Q to show the most likely position of each water sample on the cross section diagram below. 0 10 Key m waste pile surface rocks P Q [2]
Question paper, page 14
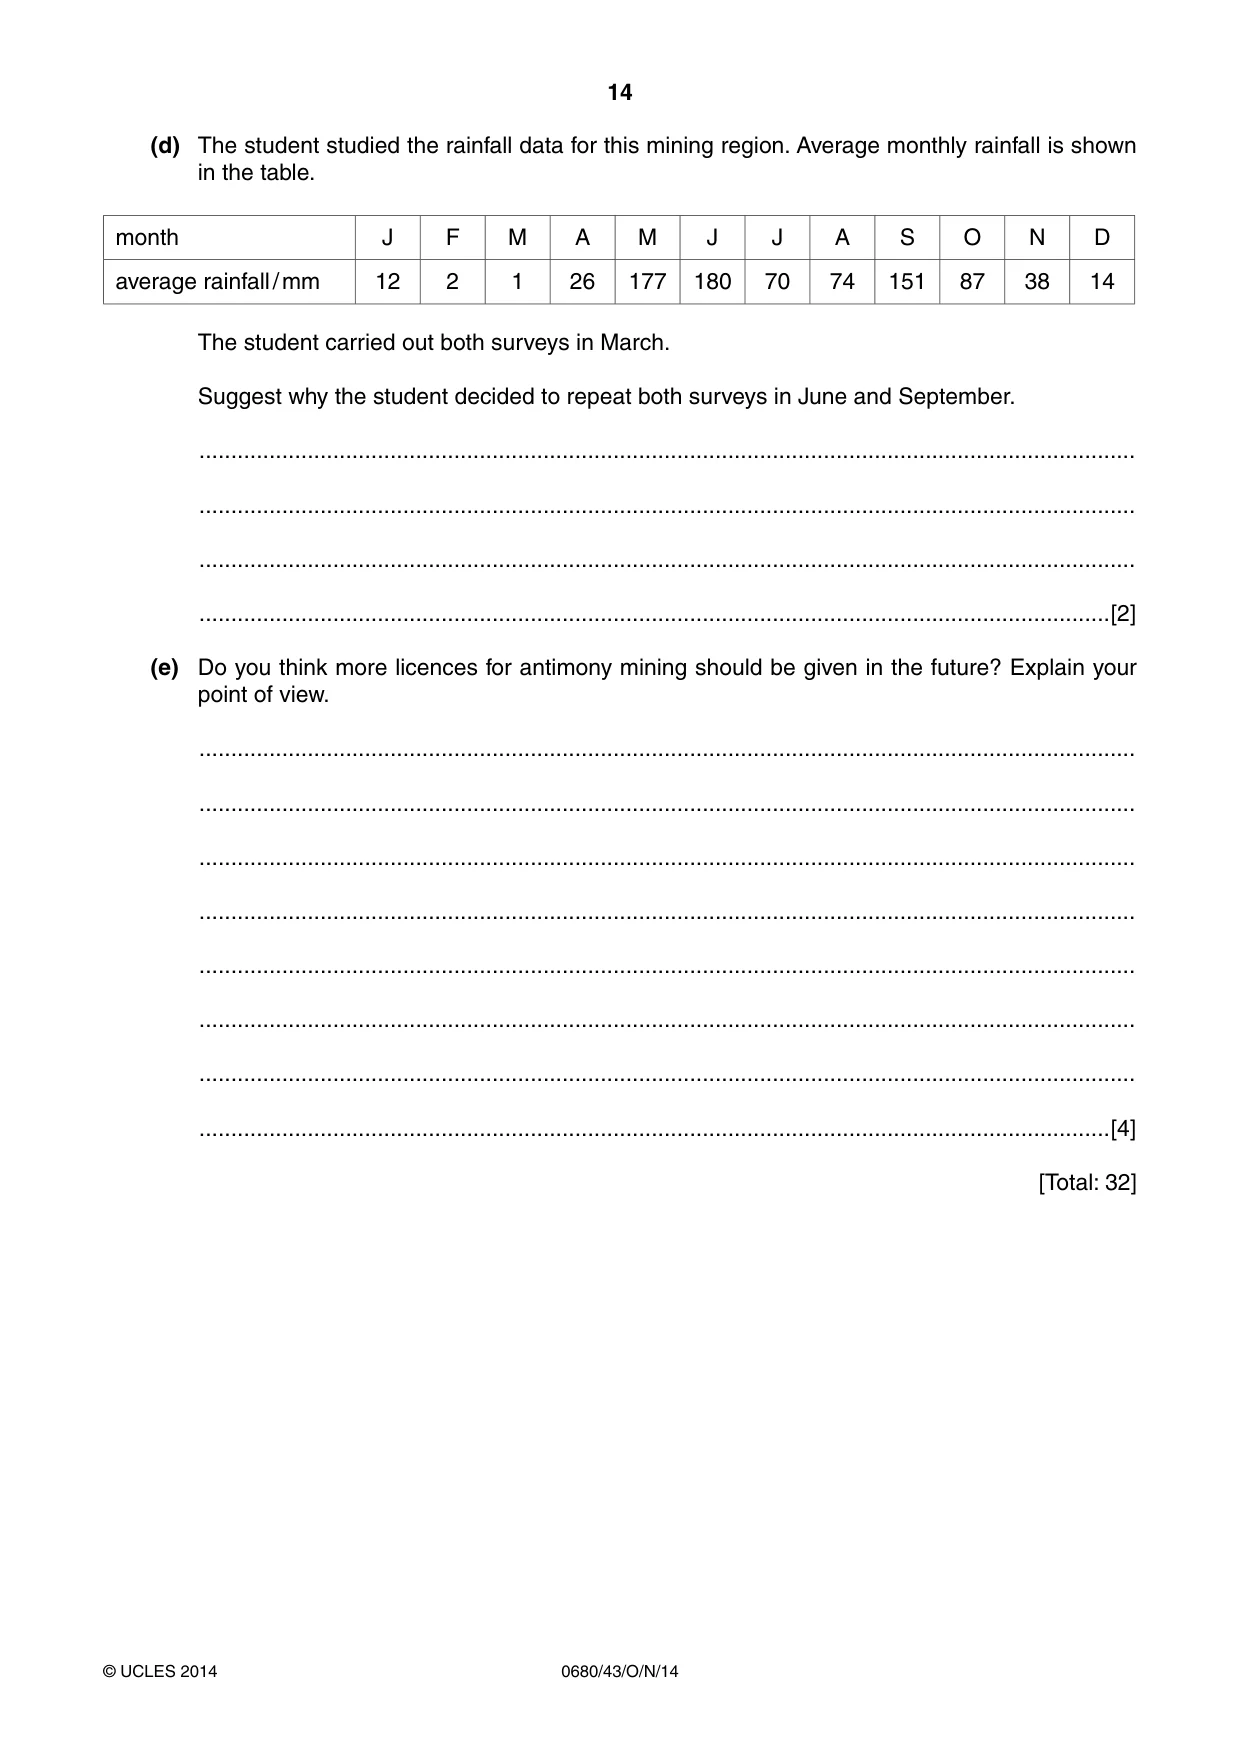
14 0680/43/O/N/14 © UCLES 2014 (d) The student studied the rainfall data for this mining region. Average monthly rainfall is shown in the table. month J F M A M J J A S O N D average rainfall / mm 12 2 1 26 177 180 70 74 151 87 38 14 The student carried out both surveys in March. Suggest why the student decided to repeat both surveys in June and September. … … … …[2] (e) Do you think more licences for antimony mining should be given in the future? Explain your point of view. … … … … … … … …[4] [Total: 32]
Question paper, page 15
15 0680/43/O/N/14 © UCLES 2014 BLANK PAGE
Question paper, page 16
16 0680/43/O/N/14 © UCLES 2014 Permission to reproduce items where third-party owned material protected by copyright is included has been sought and cleared where possible. Every reasonable effort has been made by the publisher (UCLES) to trace copyright holders, but if any items requiring clearance have unwittingly been included, the publisher will be pleased to make amends at the earliest possible opportunity. Cambridge International Examinations is part of the Cambridge Assessment Group. Cambridge Assessment is the brand name of University of Cambridge Local Examinations Syndicate (UCLES), which is itself a department of the University of Cambridge. BLANK PAGE
Mark scheme, page 1
® IGCSE is the registered trademark of Cambridge International Examinations. CAMBRIDGE INTERNATIONAL EXAMINATIONS Cambridge International General Certificate of Secondary Education MARK SCHEME for the October/November 2014 series 0680 ENVIRONMENTAL MANAGEMENT 0680/43 Paper 4 (Alternative to Coursework), maximum raw mark 60 This mark scheme is published as an aid to teachers and candidates, to indicate the requirements of the examination. It shows the basis on which Examiners were instructed to award marks. It does not indicate the details of the discussions that took place at an Examiners’ meeting before marking began, which would have considered the acceptability of alternative answers. Mark schemes should be read in conjunction with the question paper and the Principal Examiner Report for Teachers. Cambridge will not enter into discussions about these mark schemes. Cambridge is publishing the mark schemes for the October/November 2014 series for most Cambridge IGCSE®, Cambridge International A and AS Level components and some Cambridge O Level components.
Mark scheme, page 2
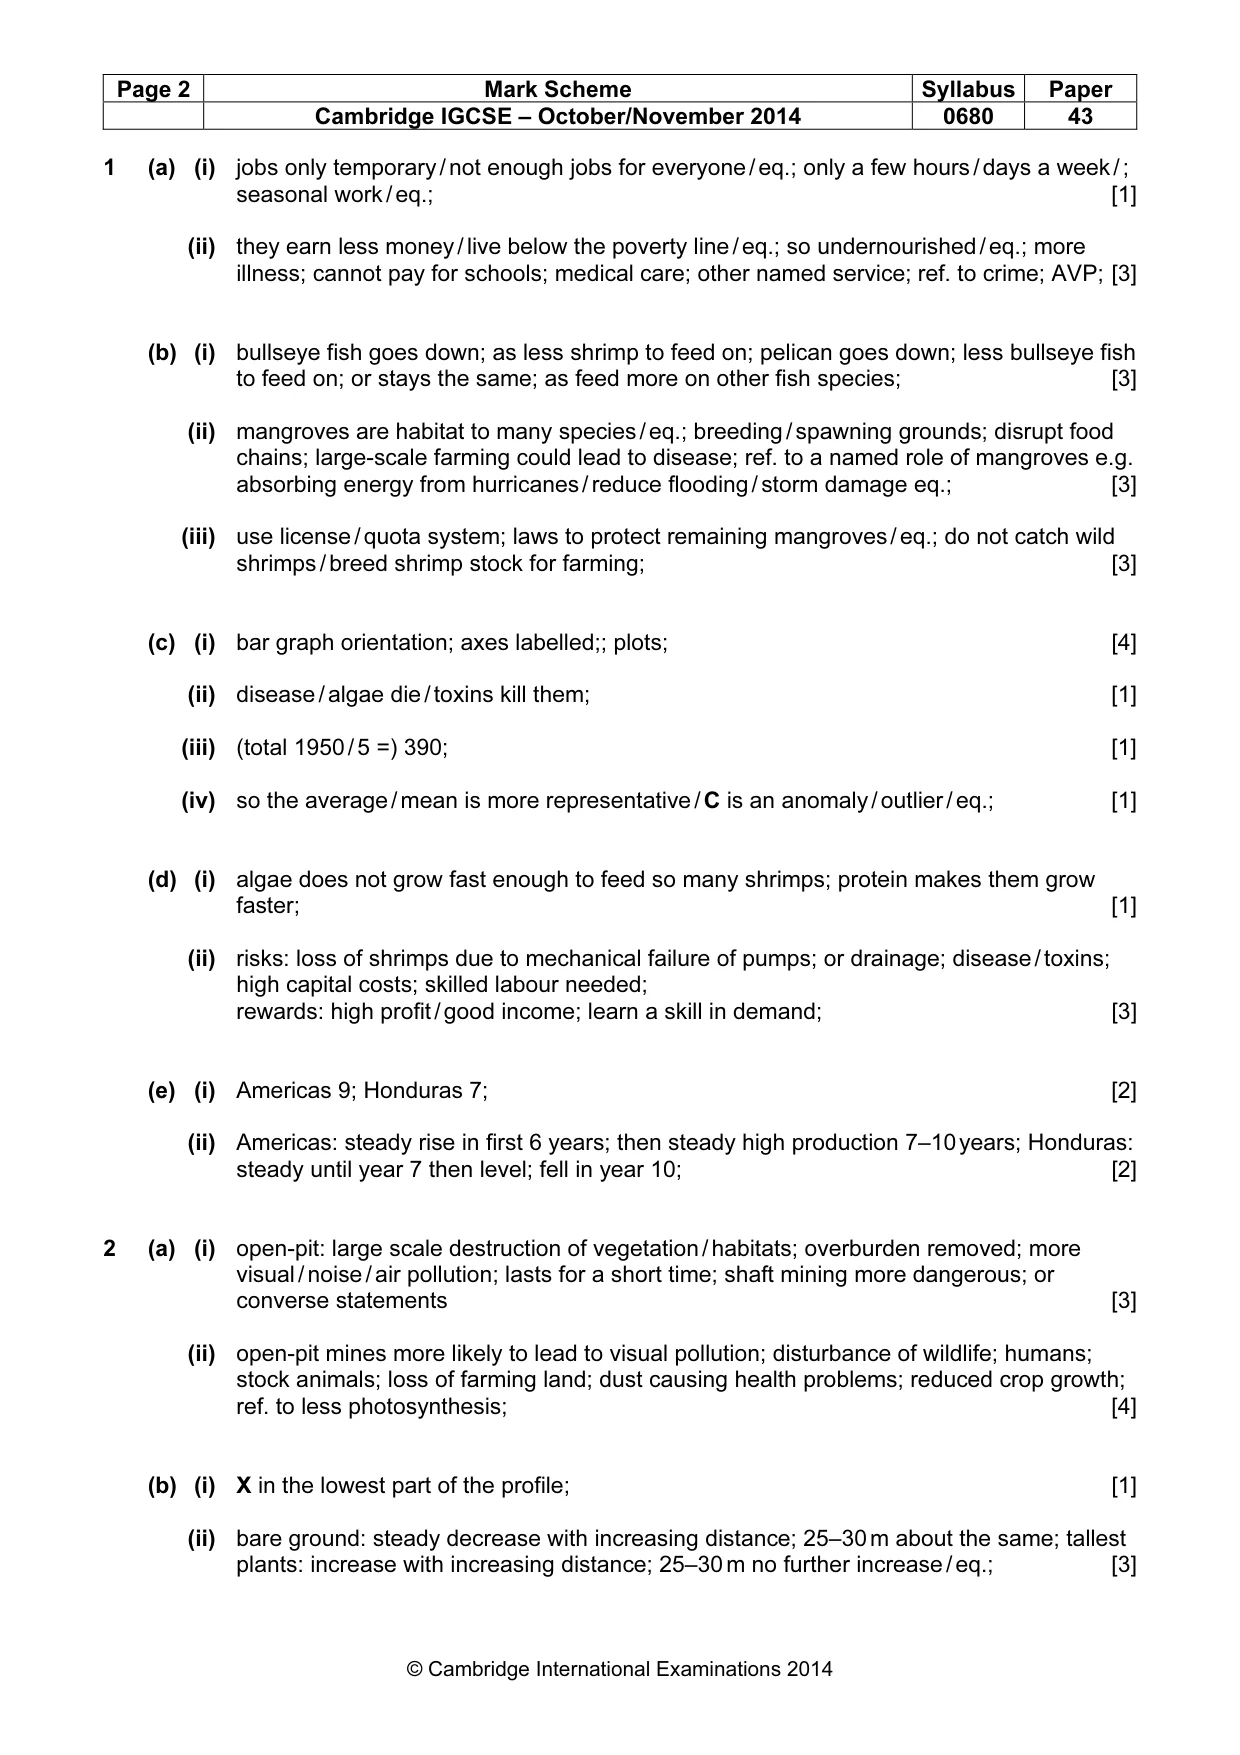
Page 2 Mark Scheme Syllabus Paper Cambridge IGCSE – October/November 2014 0680 43 © Cambridge International Examinations 2014 1 (a) (i) jobs only temporary / not enough jobs for everyone / eq.; only a few hours / days a week / ; seasonal work / eq.; [1] (ii) they earn less money / live below the poverty line / eq.; so undernourished / eq.; more illness; cannot pay for schools; medical care; other named service; ref. to crime; AVP; [3] (b) (i) bullseye fish goes down; as less shrimp to feed on; pelican goes down; less bullseye fish to feed on; or stays the same; as feed more on other fish species; [3] (ii) mangroves are habitat to many species / eq.; breeding / spawning grounds; disrupt food chains; large-scale farming could lead to disease; ref. to a named role of mangroves e.g. absorbing energy from hurricanes / reduce flooding / storm damage eq.; [3] (iii) use license / quota system; laws to protect remaining mangroves / eq.; do not catch wild shrimps / breed shrimp stock for farming; [3] (c) (i) bar graph orientation; axes labelled;; plots; [4] (ii) disease / algae die / toxins kill them; [1] (iii) (total 1950 / 5 =) 390; [1] (iv) so the average / mean is more representative / C is an anomaly / outlier / eq.; [1] (d) (i) algae does not grow fast enough to feed so many shrimps; protein makes them grow faster; [1] (ii) risks: loss of shrimps due to mechanical failure of pumps; or drainage; disease / toxins; high capital costs; skilled labour needed; rewards: high profit / good income; learn a skill in demand; [3] (e) (i) Americas 9; Honduras 7; [2] (ii) Americas: steady rise in first 6 years; then steady high production 7–10 years; Honduras: steady until year 7 then level; fell in year 10; [2] 2 (a) (i) open-pit: large scale destruction of vegetation / habitats; overburden removed; more visual / noise / air pollution; lasts for a short time; shaft mining more dangerous; or converse statements [3] (ii) open-pit mines more likely to lead to visual pollution; disturbance of wildlife; humans; stock animals; loss of farming land; dust causing health problems; reduced crop growth; ref. to less photosynthesis; [4] (b) (i) X in the lowest part of the profile; [1] (ii) bare ground: steady decrease with increasing distance; 25–30 m about the same; tallest plants: increase with increasing distance; 25–30 m no further increase / eq.; [3]
Mark scheme, page 3
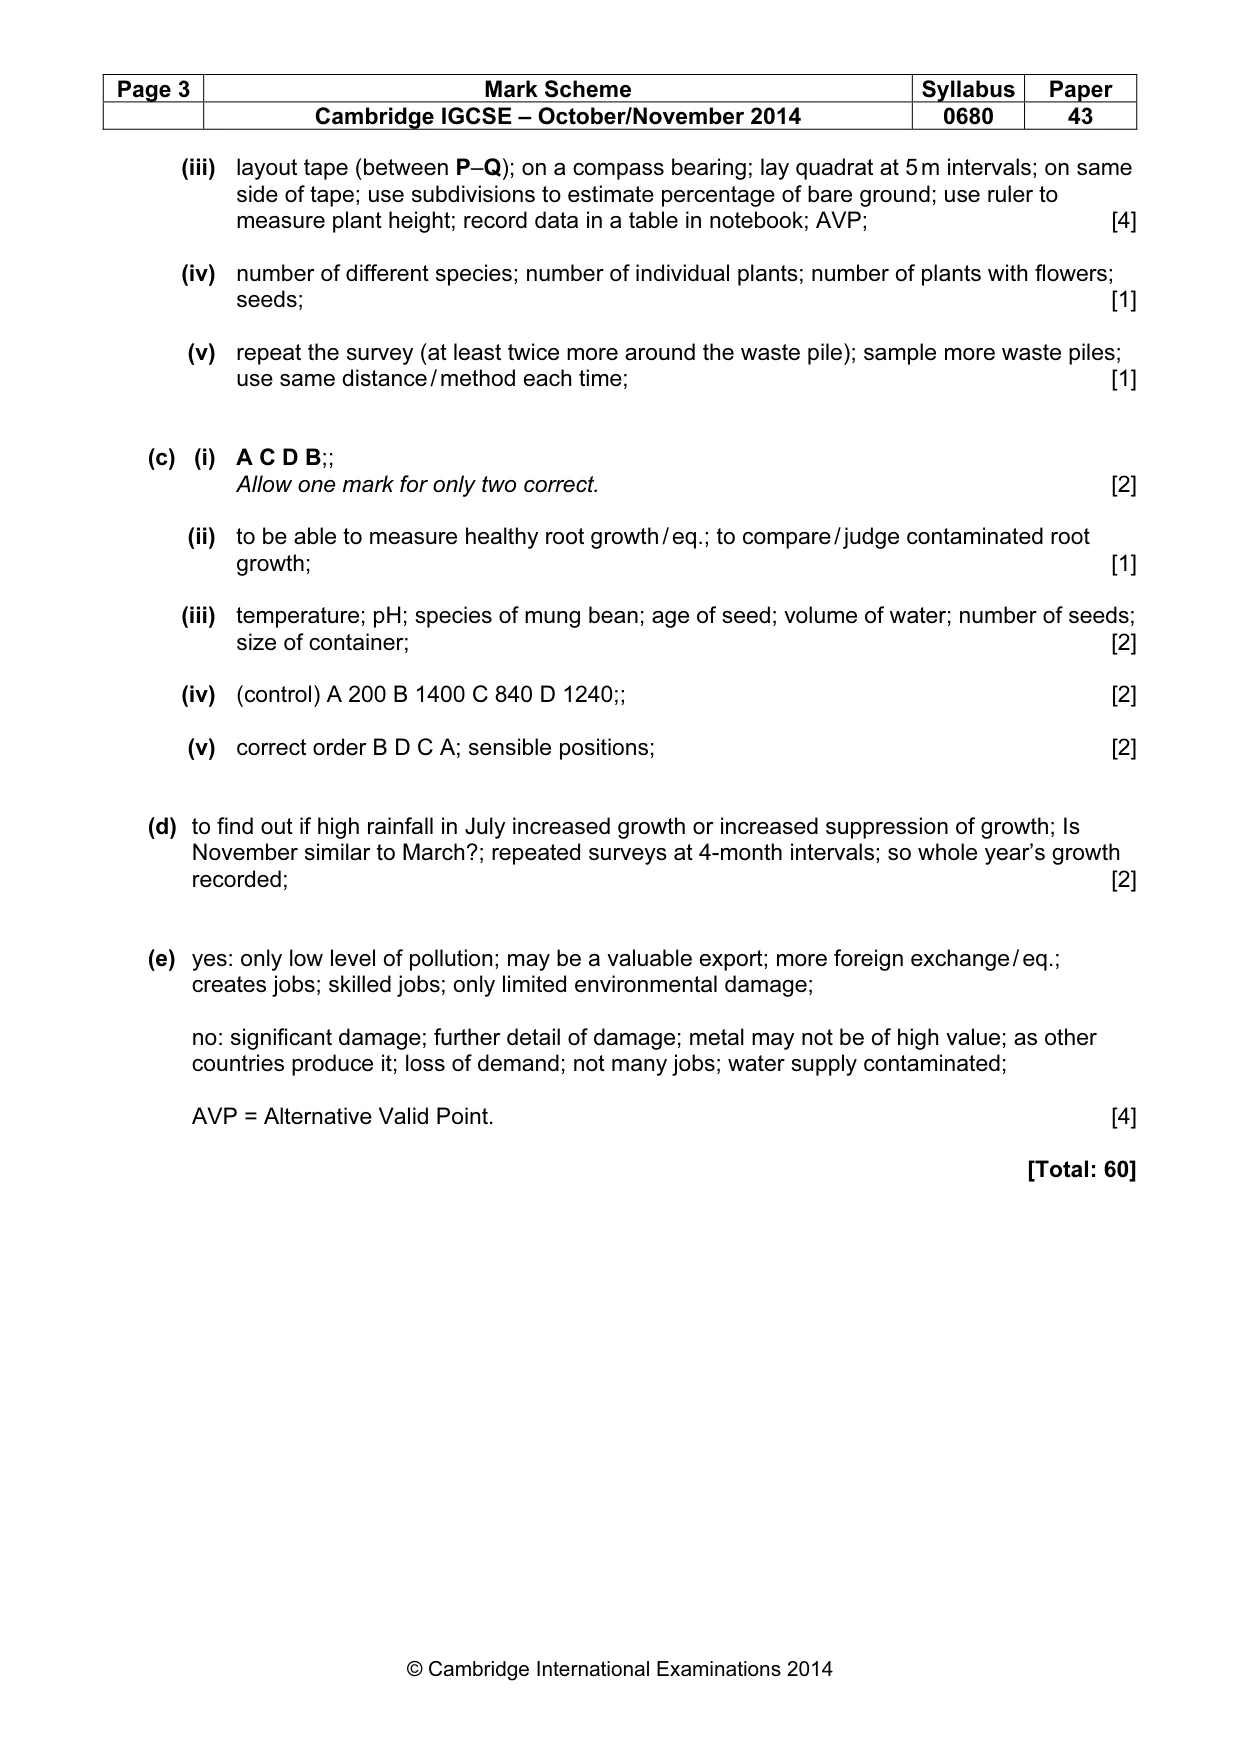
Page 3 Mark Scheme Syllabus Paper Cambridge IGCSE – October/November 2014 0680 43 © Cambridge International Examinations 2014 (iii) layout tape (between P–Q); on a compass bearing; lay quadrat at 5 m intervals; on same side of tape; use subdivisions to estimate percentage of bare ground; use ruler to measure plant height; record data in a table in notebook; AVP; [4] (iv) number of different species; number of individual plants; number of plants with flowers; seeds; [1] (v) repeat the survey (at least twice more around the waste pile); sample more waste piles; use same distance / method each time; [1] (c) (i) A C D B;; Allow one mark for only two correct. [2] (ii) to be able to measure healthy root growth / eq.; to compare / judge contaminated root growth; [1] (iii) temperature; pH; species of mung bean; age of seed; volume of water; number of seeds; size of container; [2] (iv) (control) A 200 B 1400 C 840 D 1240;; [2] (v) correct order B D C A; sensible positions; [2] (d) to find out if high rainfall in July increased growth or increased suppression of growth; Is November similar to March?; repeated surveys at 4-month intervals; so whole year’s growth recorded; [2] (e) yes: only low level of pollution; may be a valuable export; more foreign exchange / eq.; creates jobs; skilled jobs; only limited environmental damage; no: significant damage; further detail of damage; metal may not be of high value; as other countries produce it; loss of demand; not many jobs; water supply contaminated; AVP = Alternative Valid Point. [4] [Total: 60]
What you needed in this session
Cambridge’s own grade thresholds for 2014 Oct/Nov, Paper 4 · Variant 3. A higher threshold means an easier paper — the bar moves with how the cohort did.