Cambridge IGCSE Environmental Management 0680 — 2014 May/June Paper 1 · Variant 2
0680/12/M/J/14 · 60 marks · ≈68 min
The question paper and its mark scheme, free to read here and free to download. This is Cambridge’s own paper, exactly as it was sat.
Question paper16 pages



Mark scheme5 pages
Answers below. Sit the paper first if you are practising.
Paper as text
Question paper, page 1
This document consists of 13 printed pages and 3 blank pages. DC (CW/SW) 80700/3 © UCLES 2014 [Turn over Cambridge International Examinations Cambridge International General Certificate of Secondary Education * 8 1 6 5 7 7 9 0 4 7 * ENVIRONMENTAL MANAGEMENT 0680/12 Paper 1 May/June 2014 1 hour 30 minutes Candidates answer on the Question Paper. Additional Materials: Ruler READ THESE INSTRUCTIONS FIRST Write your Centre number, candidate number and name on all the work you hand in. Write in dark blue or black pen. You may use an HB pencil for any diagrams or graphs. Do not use staples, paper clips, glue or correction fluid. DO NOT WRITE IN ANY BARCODES. Answer all questions. Electronic calculators may be used. You may lose marks if you do not show your working or if you do not use appropriate units. At the end of the examination, fasten all your work securely together. The number of marks is given in brackets [ ] at the end of each question or part question.
Question paper, page 2
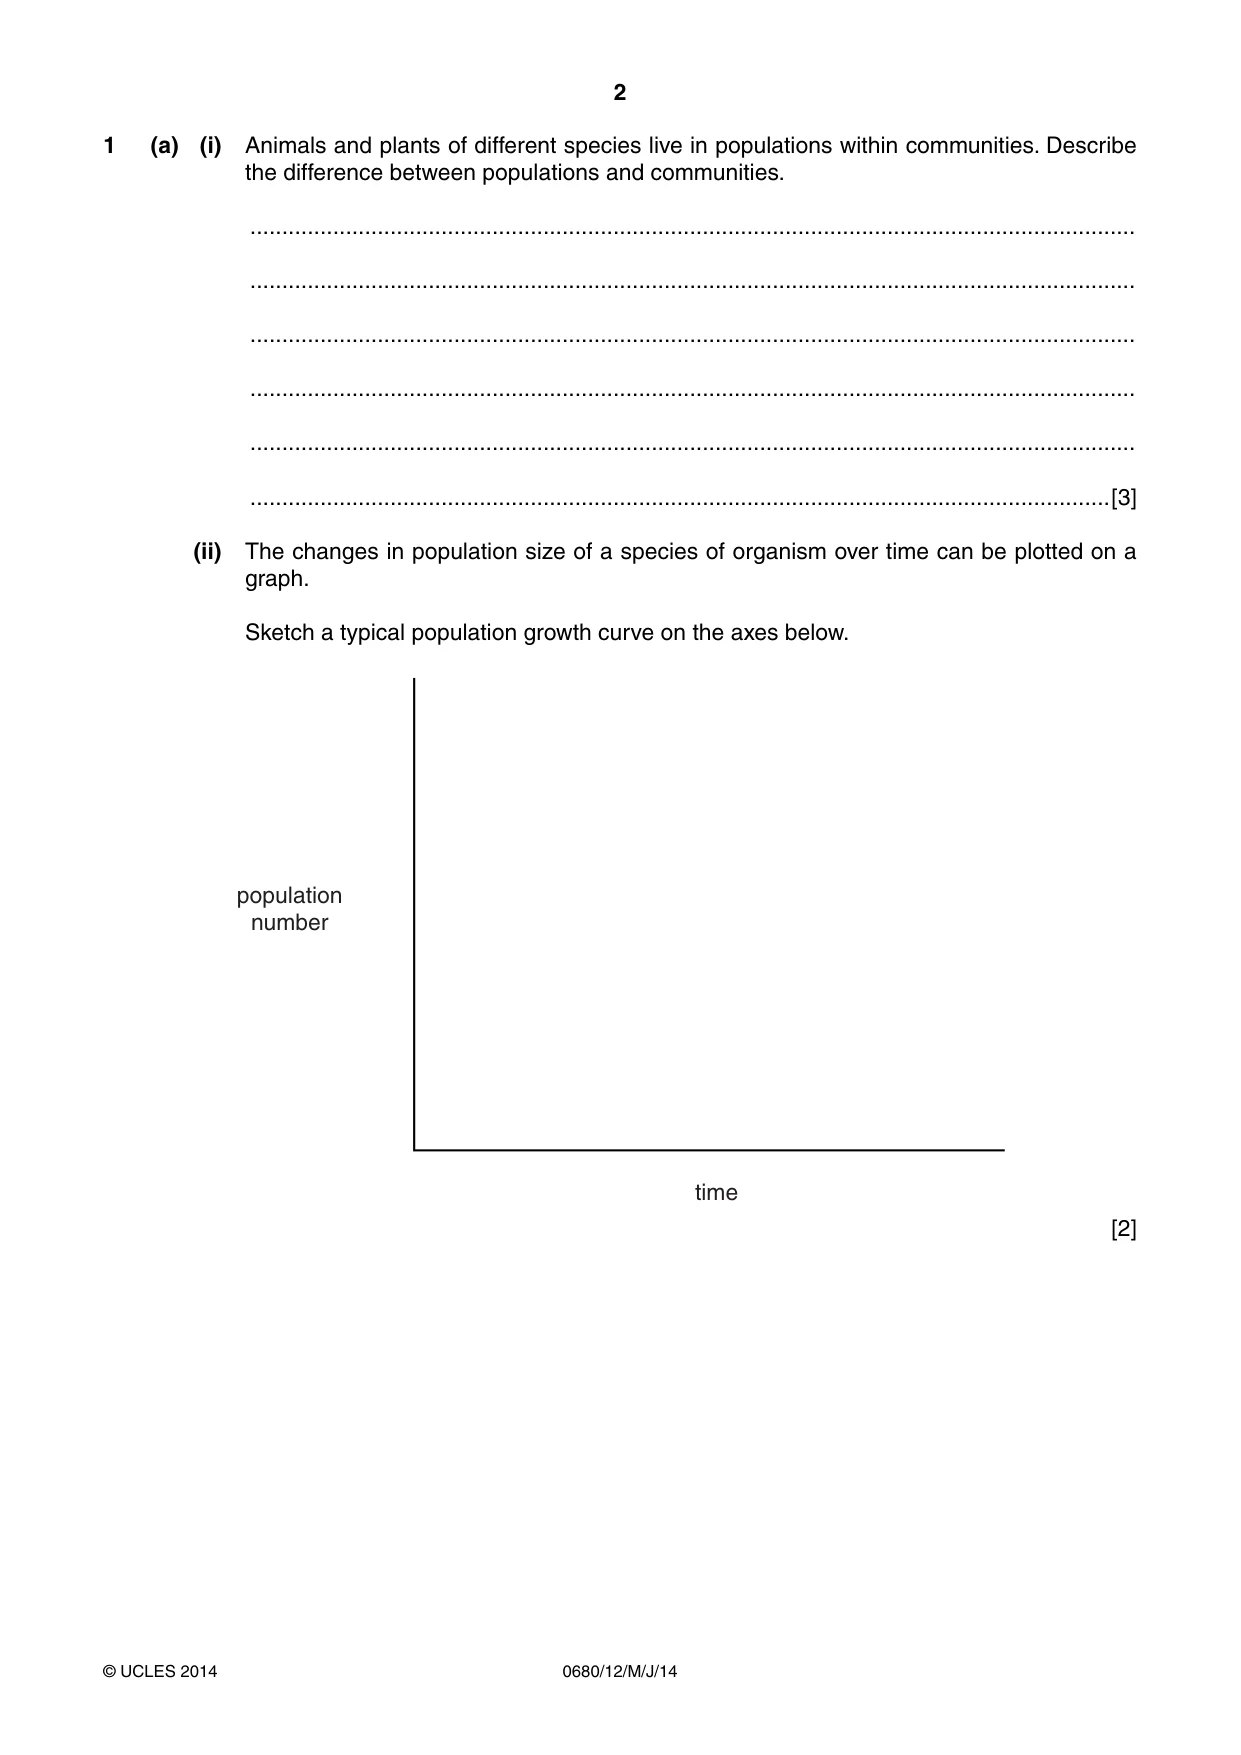
2 0680/12/M/J/14 © UCLES 2014 1 (a) (i) Animals and plants of different species live in populations within communities. Describe the difference between populations and communities. … … … … … …[3] (ii) The changes in population size of a species of organism over time can be plotted on a graph. Sketch a typical population growth curve on the axes below. population number time [2]
Question paper, page 3
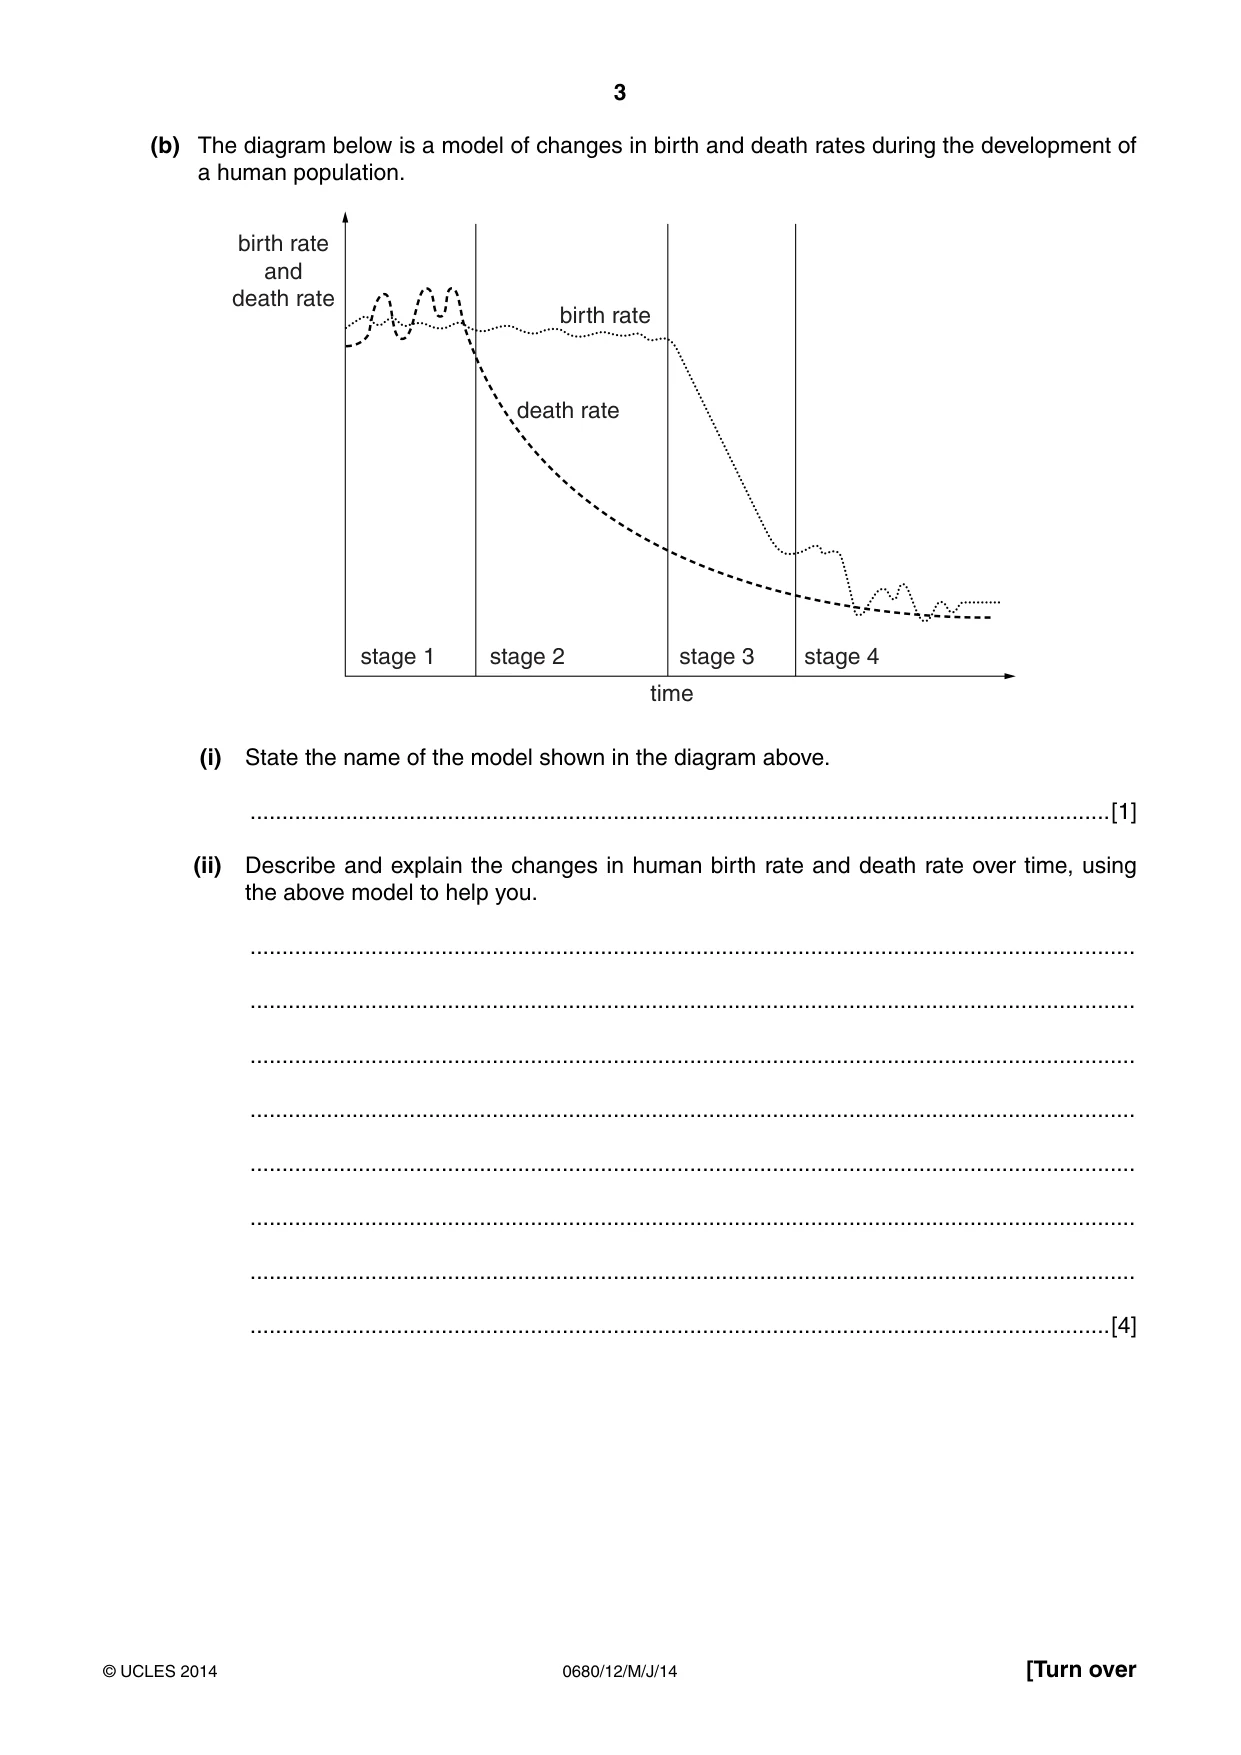
3 0680/12/M/J/14 © UCLES 2014 [Turn over (b) The diagram below is a model of changes in birth and death rates during the development of a human population. birth rate and death rate time stage 1 stage 2 stage 3 stage 4 birth rate death rate (i) State the name of the model shown in the diagram above. …[1] (ii) Describe and explain the changes in human birth rate and death rate over time, using the above model to help you. … … … … … … … …[4]
Question paper, page 4
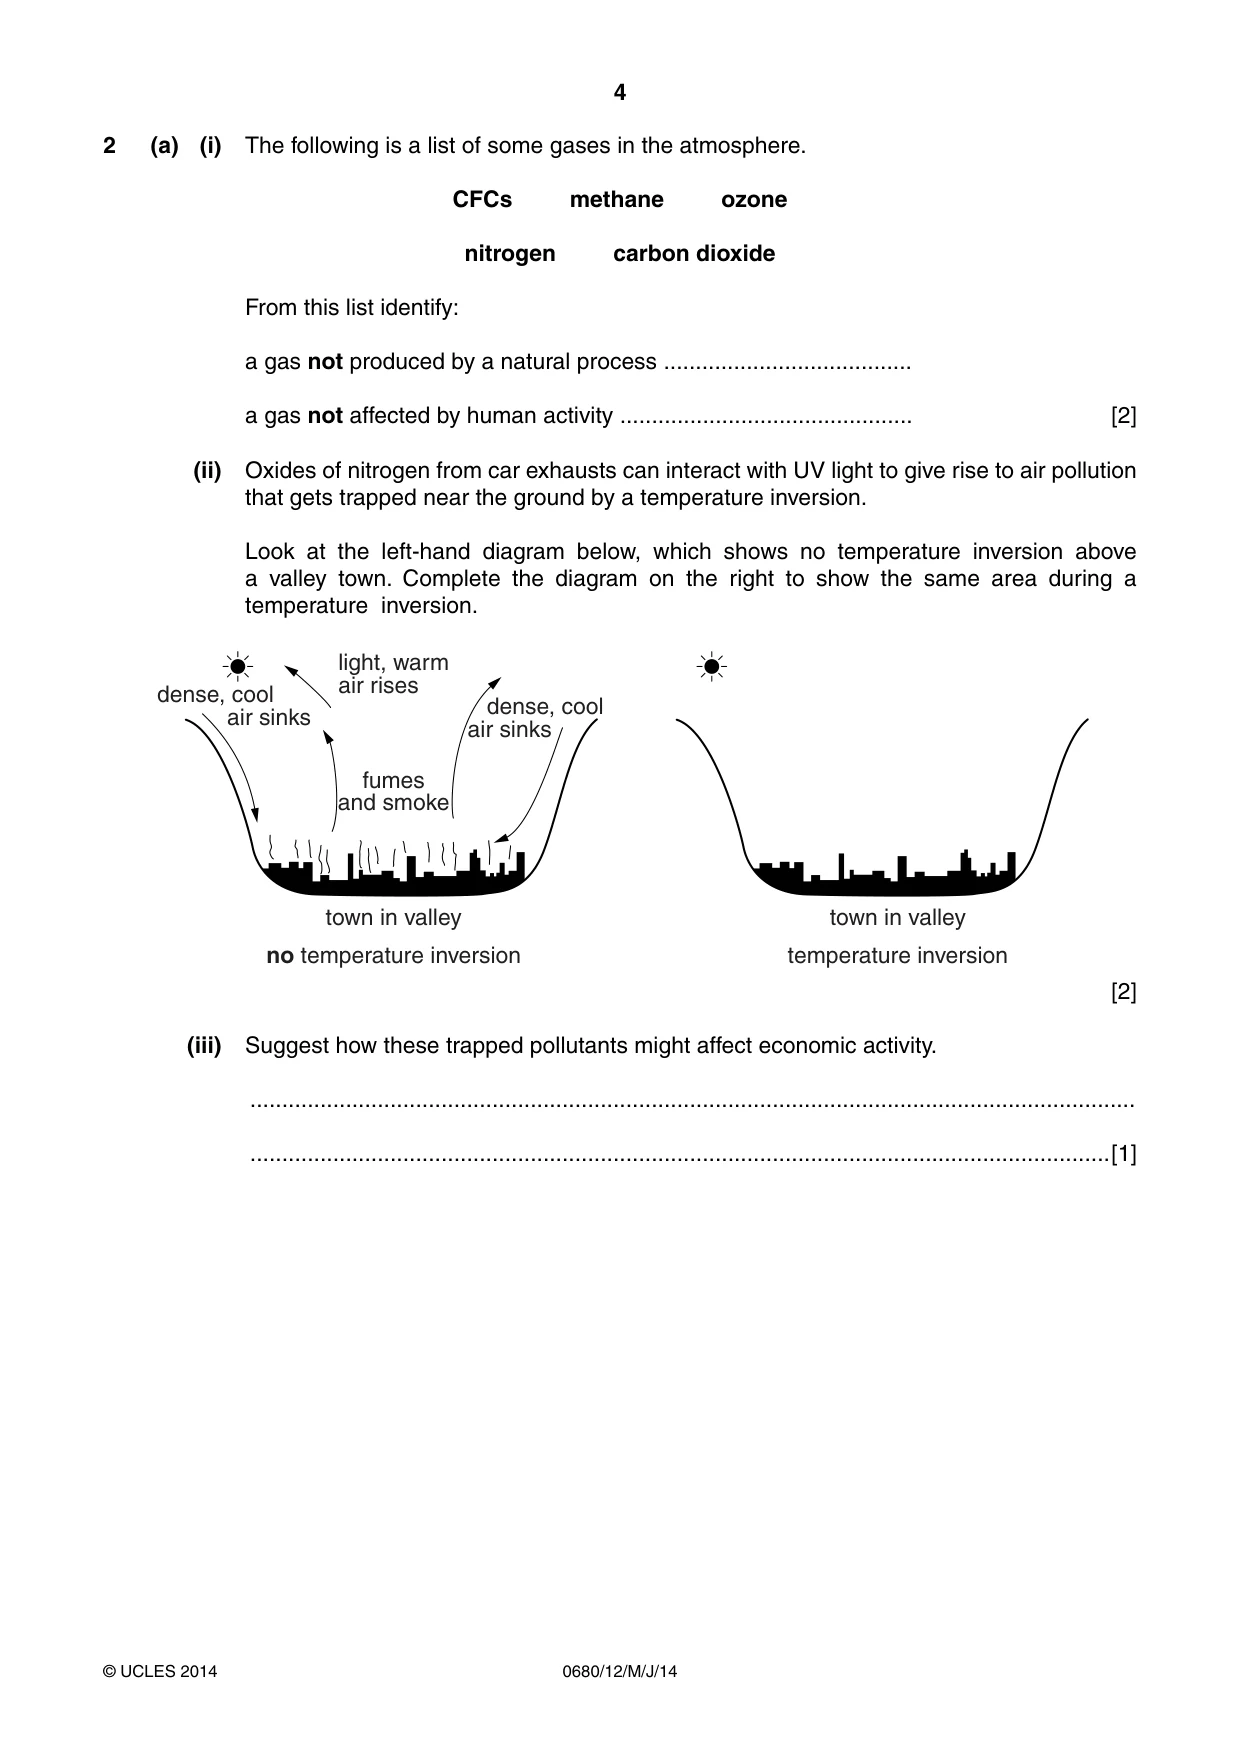
4 0680/12/M/J/14 © UCLES 2014 2 (a) (i) The following is a list of some gases in the atmosphere. CFCs methane ozone nitrogen carbon dioxide From this list identify: a gas not produced by a natural process … a gas not affected by human activity … [2] (ii) Oxides of nitrogen from car exhausts can interact with UV light to give rise to air pollution that gets trapped near the ground by a temperature inversion. Look at the left-hand diagram below, which shows no temperature inversion above a valley town. Complete the diagram on the right to show the same area during a temperature inversion. light, warm air rises dense, cool air sinks dense, cool air sinks fumes and smoke town in valley town in valley no temperature inversion temperature inversion [2] (iii) Suggest how these trapped pollutants might affect economic activity. … …[1]
Question paper, page 5
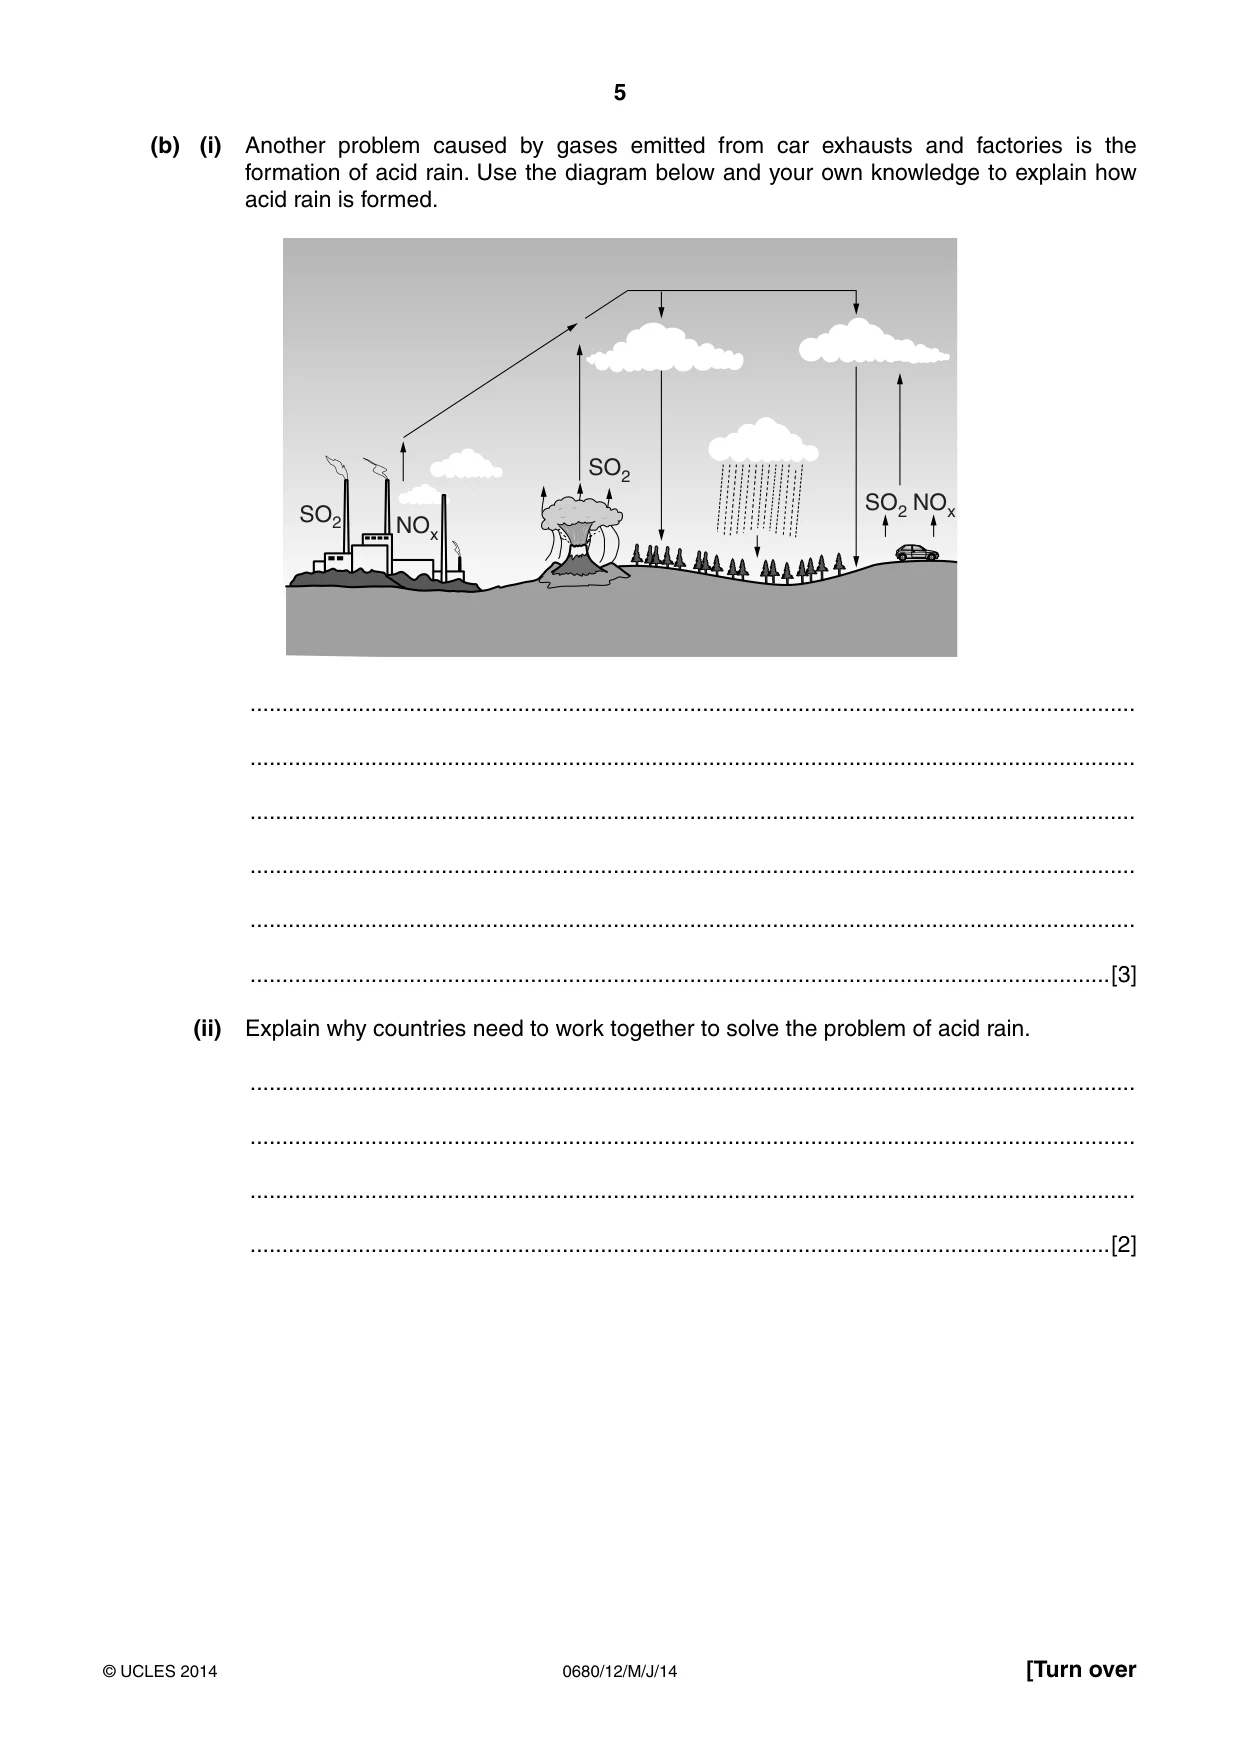
5 0680/12/M/J/14 © UCLES 2014 [Turn over (b) (i) Another problem caused by gases emitted from car exhausts and factories is the formation of acid rain. Use the diagram below and your own knowledge to explain how acid rain is formed. SO2 SO2 SO2 NOx NOx … … … … … …[3] (ii) Explain why countries need to work together to solve the problem of acid rain. … … … …[2]
Question paper, page 6
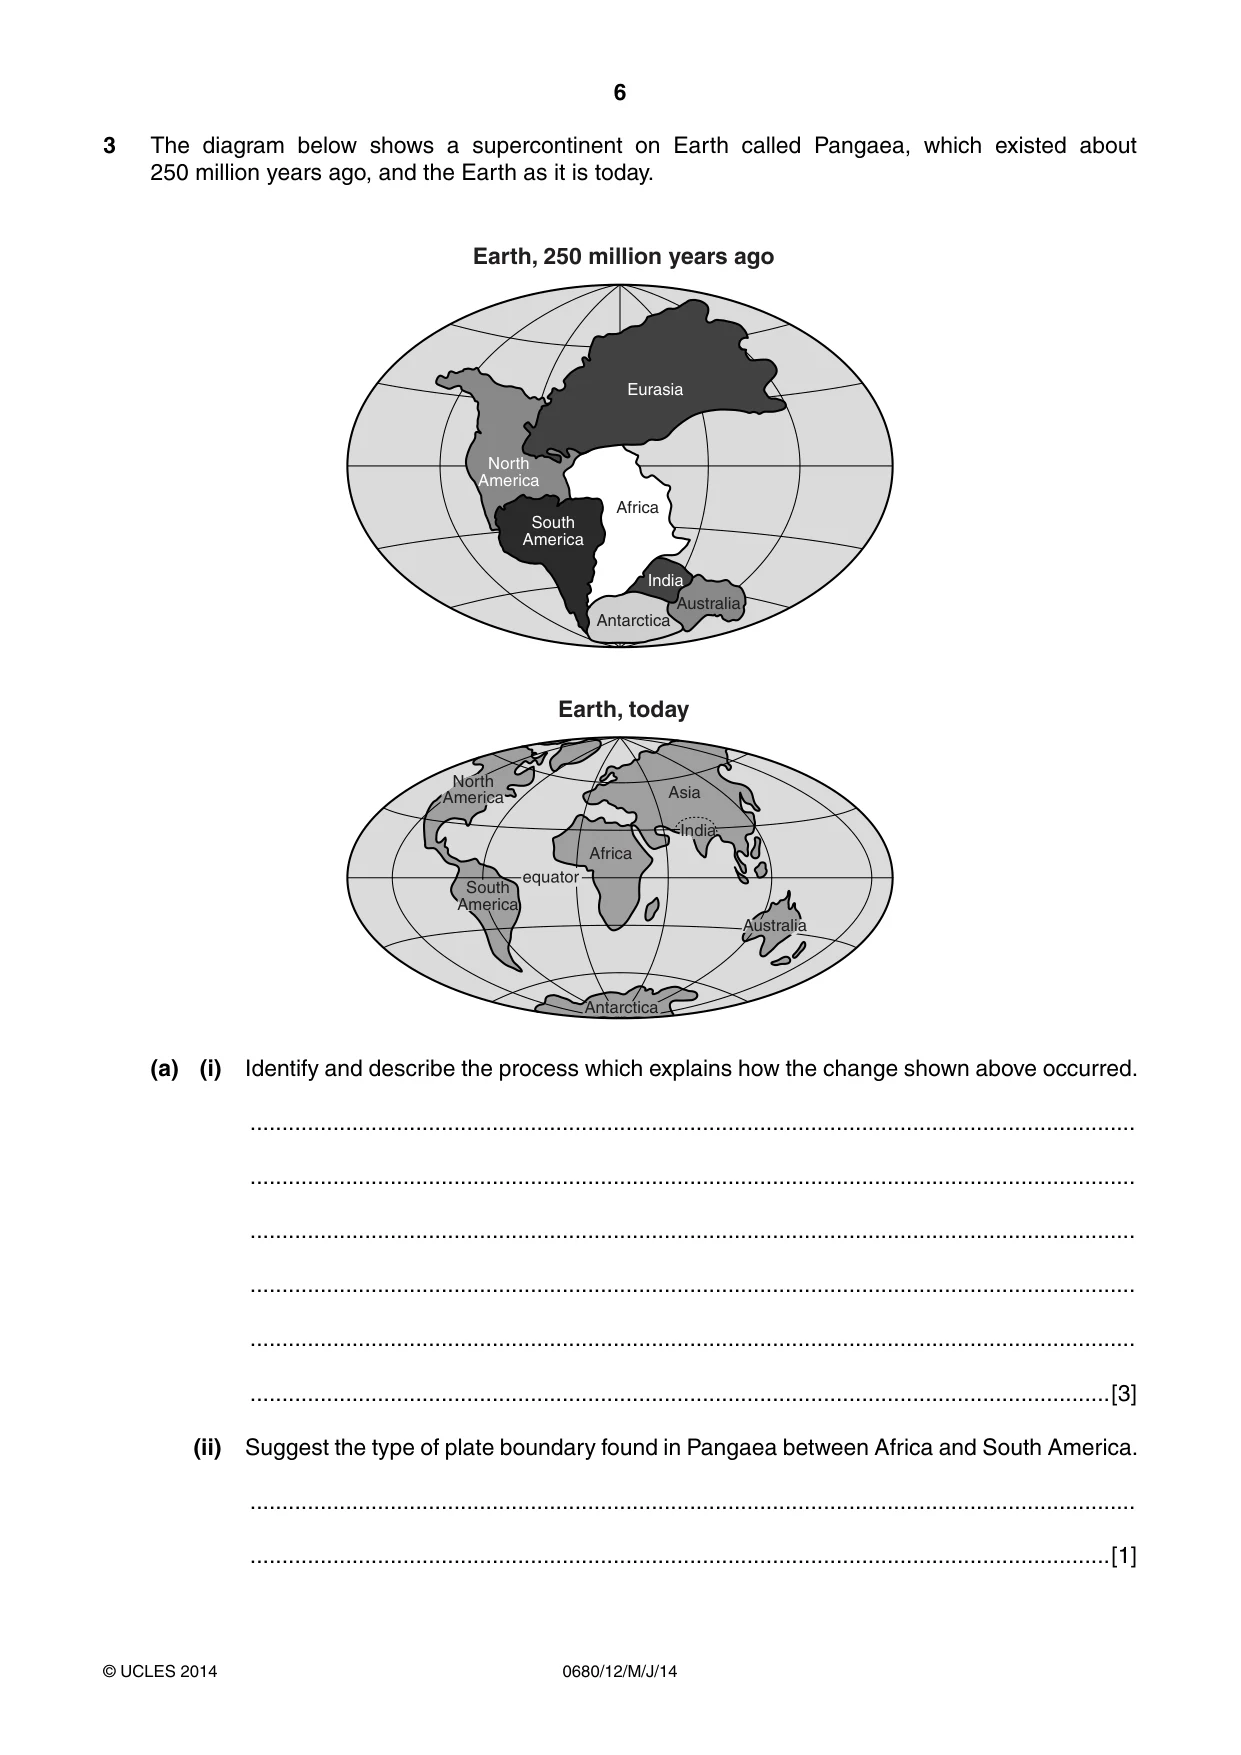
6 0680/12/M/J/14 © UCLES 2014 3 The diagram below shows a supercontinent on Earth called Pangaea, which existed about 250 million years ago, and the Earth as it is today. South America South America North America North America Asia Africa Africa India India Eurasia Australia Australia Antarctica Antarctica equator Earth, today Earth, 250 million years ago (a) (i) Identify and describe the process which explains how the change shown above occurred. … … … … … …[3] (ii) Suggest the type of plate boundary found in Pangaea between Africa and South America. … …[1]
Question paper, page 7
7 0680/12/M/J/14 © UCLES 2014 [Turn over (b) (i) Explain why fewer people are injured or killed in volcanic eruptions than in earthquakes. … … … … … …[3] (ii) Describe ways in which governments might reduce the death toll during an earthquake. … … … … … …[3]
Question paper, page 8
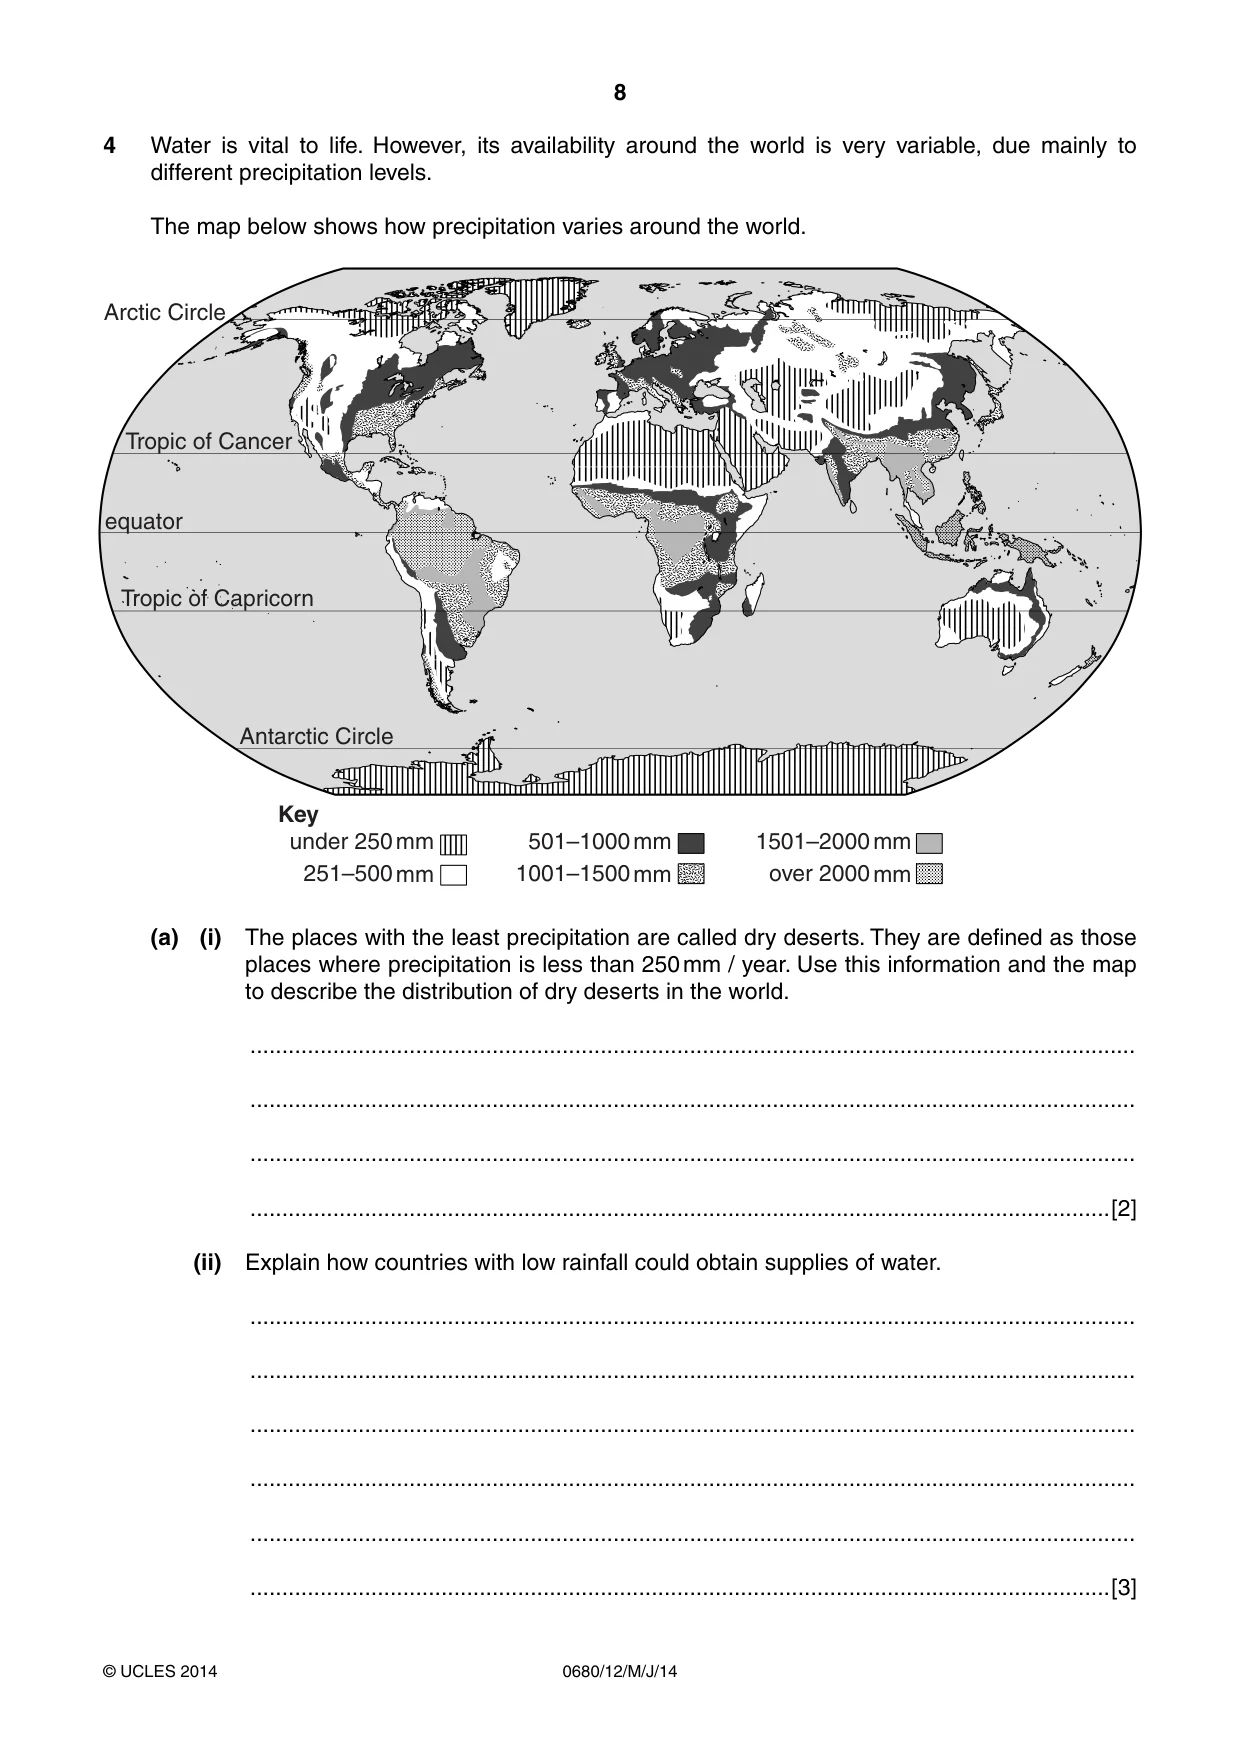
8 0680/12/M/J/14 © UCLES 2014 4 Water is vital to life. However, its availability around the world is very variable, due mainly to different precipitation levels. The map below shows how precipitation varies around the world. under 250 mm Key 251–500 mm 501–1000 mm 1001–1500 mm 1501–2000 mm over 2000 mm Tropic of Cancer Arctic Circle equator Tropic of Capricorn Antarctic Circle (a) (i) The places with the least precipitation are called dry deserts. They are defined as those places where precipitation is less than 250 mm / year. Use this information and the map to describe the distribution of dry deserts in the world. … … … …[2] (ii) Explain how countries with low rainfall could obtain supplies of water. … … … … … …[3]
Question paper, page 9
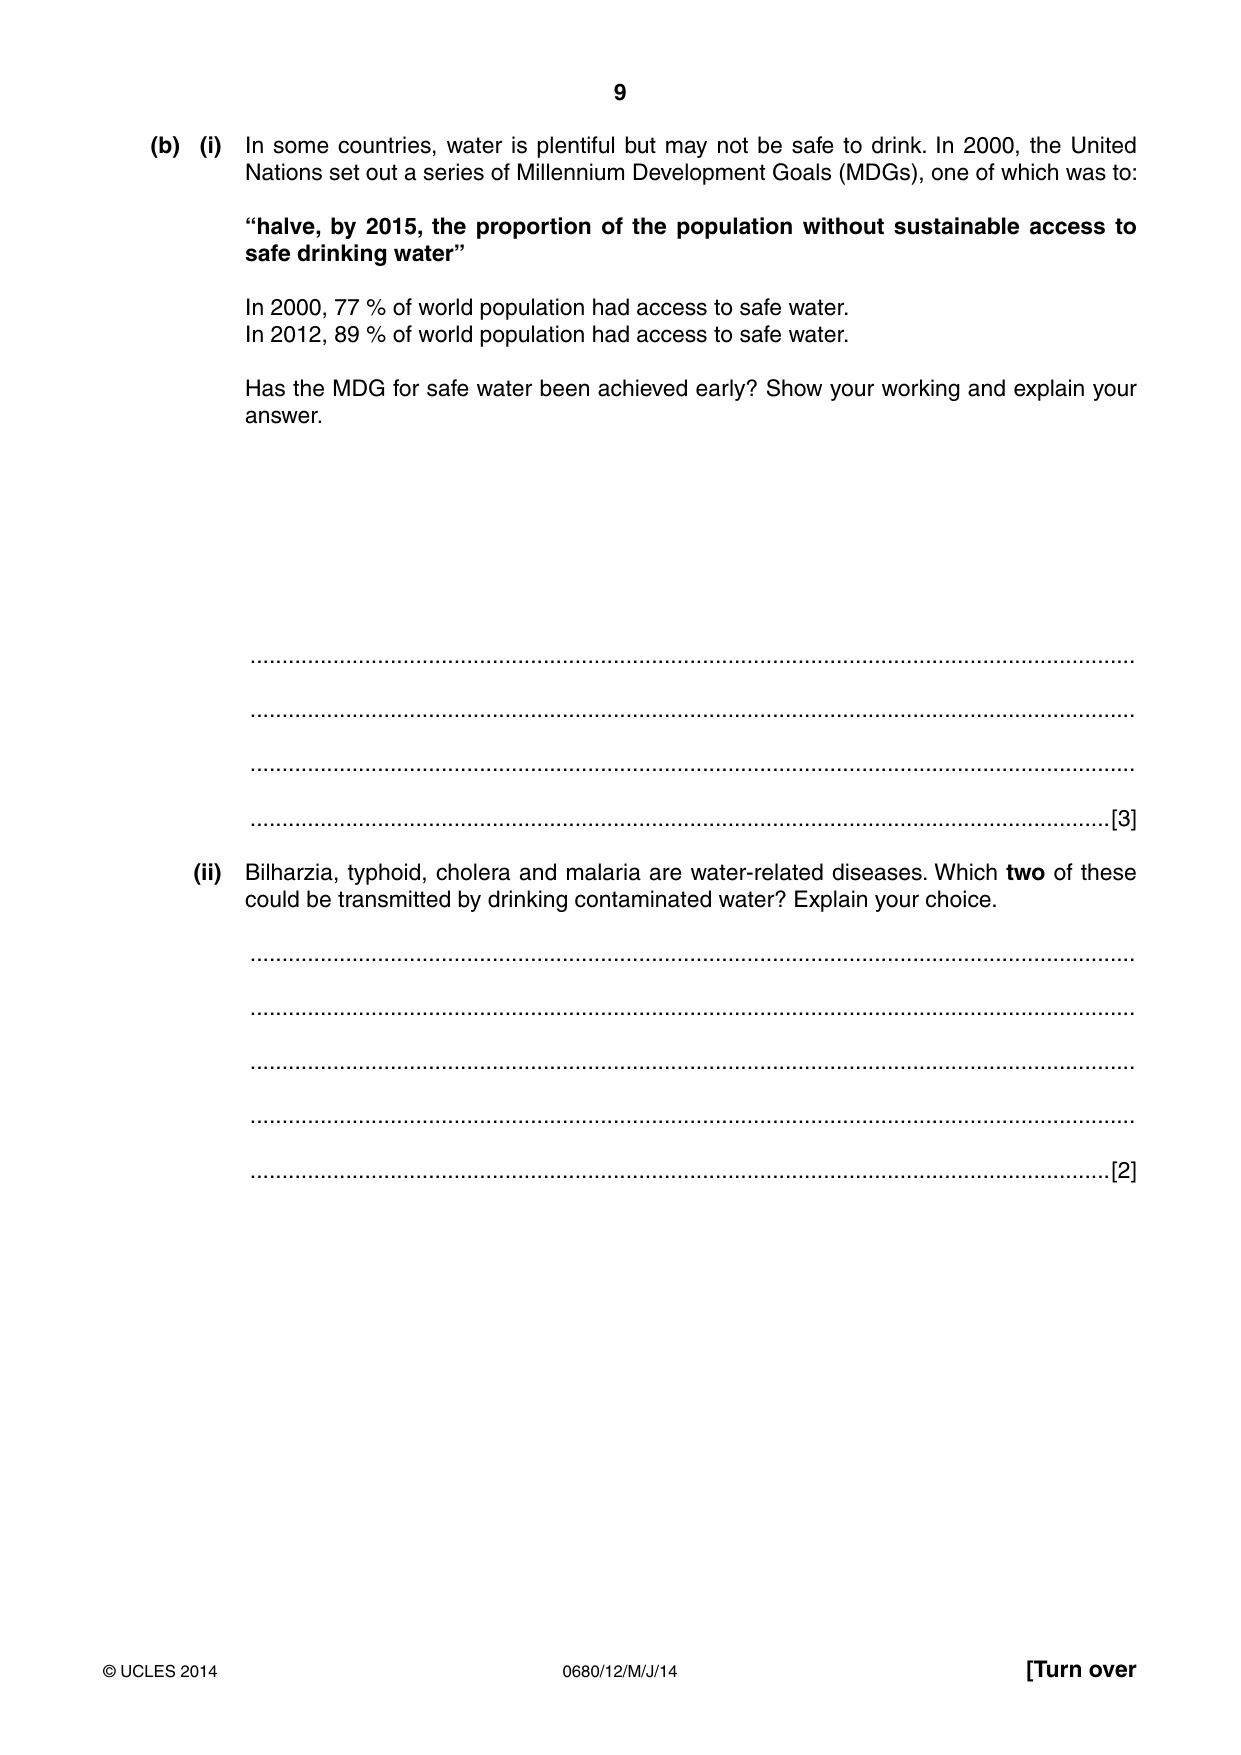
9 0680/12/M/J/14 © UCLES 2014 [Turn over (b) (i) In some countries, water is plentiful but may not be safe to drink. In 2000, the United Nations set out a series of Millennium Development Goals (MDGs), one of which was to: “halve, by 2015, the proportion of the population without sustainable access to safe drinking water” In 2000, 77 % of world population had access to safe water. In 2012, 89 % of world population had access to safe water. Has the MDG for safe water been achieved early? Show your working and explain your answer. … … … …[3] (ii) Bilharzia, typhoid, cholera and malaria are water-related diseases. Which two of these could be transmitted by drinking contaminated water? Explain your choice. … … … … …[2]
Question paper, page 10
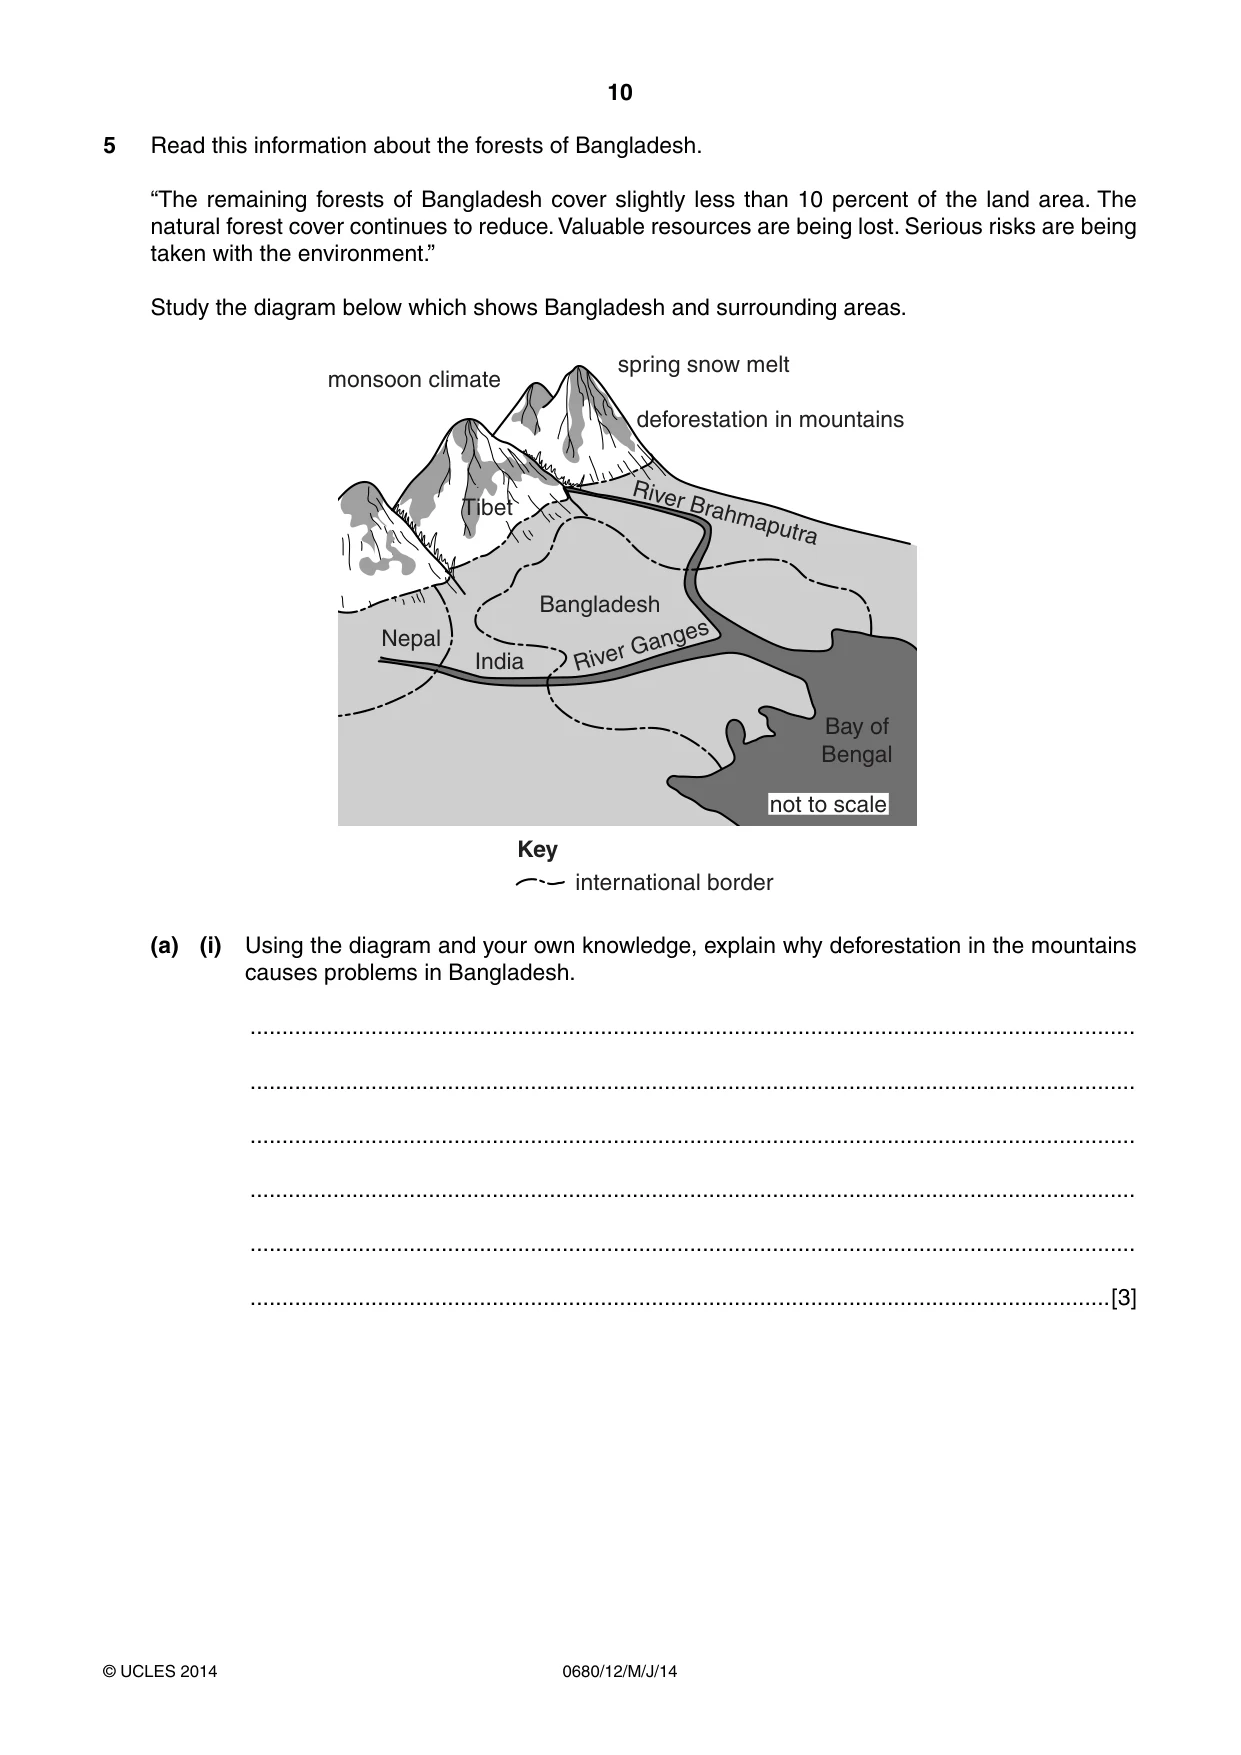
10 0680/12/M/J/14 © UCLES 2014 5 Read this information about the forests of Bangladesh. “The remaining forests of Bangladesh cover slightly less than 10 percent of the land area. The natural forest cover continues to reduce. Valuable resources are being lost. Serious risks are being taken with the environment.” Study the diagram below which shows Bangladesh and surrounding areas. Nepal India Bangladesh Tibet River Ganges River Brahmaputra deforestation in mountains spring snow melt monsoon climate not to scale Bay of Bengal Key international border (a) (i) Using the diagram and your own knowledge, explain why deforestation in the mountains causes problems in Bangladesh. … … … … … …[3]
Question paper, page 11
11 0680/12/M/J/14 © UCLES 2014 [Turn over (ii) Suggest how these problems might be reduced. … … … … … …[3] (b) (i) State one forest resource and identify what it is used for. … … … …[2] (ii) Explain how forests help to maintain the balance of some of the gases in the Earth’s atmosphere. … … … …[2]
Question paper, page 12
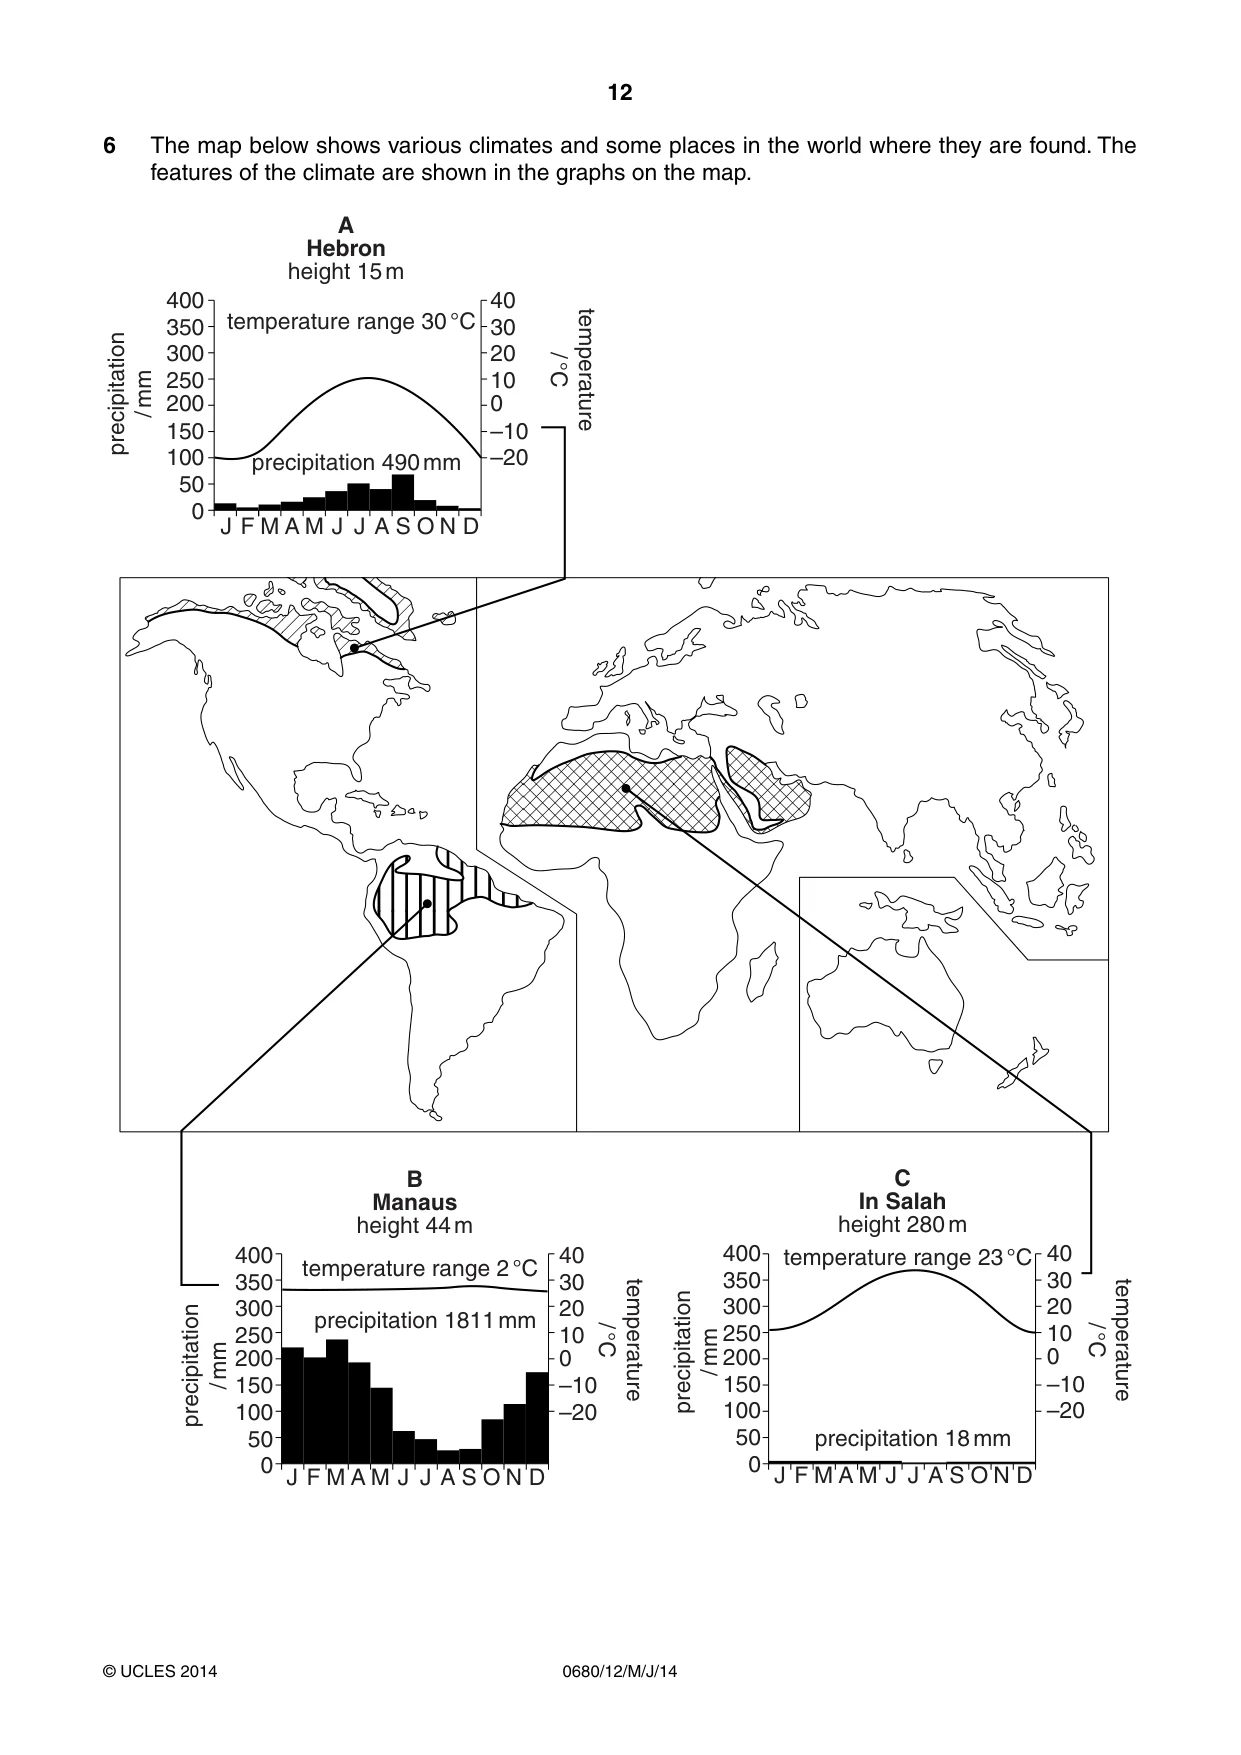
12 0680/12/M/J/14 © UCLES 2014 6 The map below shows various climates and some places in the world where they are found. The features of the climate are shown in the graphs on the map. J 0 50 100 150 200 250 300 350 400 –20 –10 0 10 20 30 40 F M A M temperature range 30 °C precipitation 490 mm precipitation / mm temperature / °C precipitation / mm precipitation / mm temperature / °C temperature / °C A Hebron height 15 m J J A S O N D J 0 50 100 150 200 250 300 350 400 –20 –10 0 10 20 30 40 F M A M temperature range 2 °C precipitation 1811 mm B Manaus height 44 m J J A S O N D J 0 50 100 150 200 250 300 350 400 –20 –10 0 10 20 30 40 F M A M temperature range 23 °C precipitation 18 mm C In Salah height 280 m J J A S O N D
Question paper, page 13
13 0680/12/M/J/14 © UCLES 2014 (a) (i) Match the climate letter, A, B and C, with its type below: equatorial … tundra … hot desert … [2] (ii) Describe and explain two ways in which plants growing in area C are adapted to the climate. … … … … … … … …[4] (b) (i) Suggest why few people live in area A. … … … …[2] (ii) Suggest the possible problems of farming in area C. … … … …[2]
Question paper, page 14
14 0680/12/M/J/14 © UCLES 2014 BLANK PAGE
Question paper, page 15
15 0680/12/M/J/14 © UCLES 2014 BLANK PAGE
Question paper, page 16
16 0680/12/M/J/14 © UCLES 2014 BLANK PAGE Permission to reproduce items where third-party owned material protected by copyright is included has been sought and cleared where possible. Every reasonable effort has been made by the publisher (UCLES) to trace copyright holders, but if any items requiring clearance have unwittingly been included, the publisher will be pleased to make amends at the earliest possible opportunity. Cambridge International Examinations is part of the Cambridge Assessment Group. Cambridge Assessment is the brand name of University of Cambridge Local Examinations Syndicate (UCLES), which is itself a department of the University of Cambridge.
Mark scheme, page 1
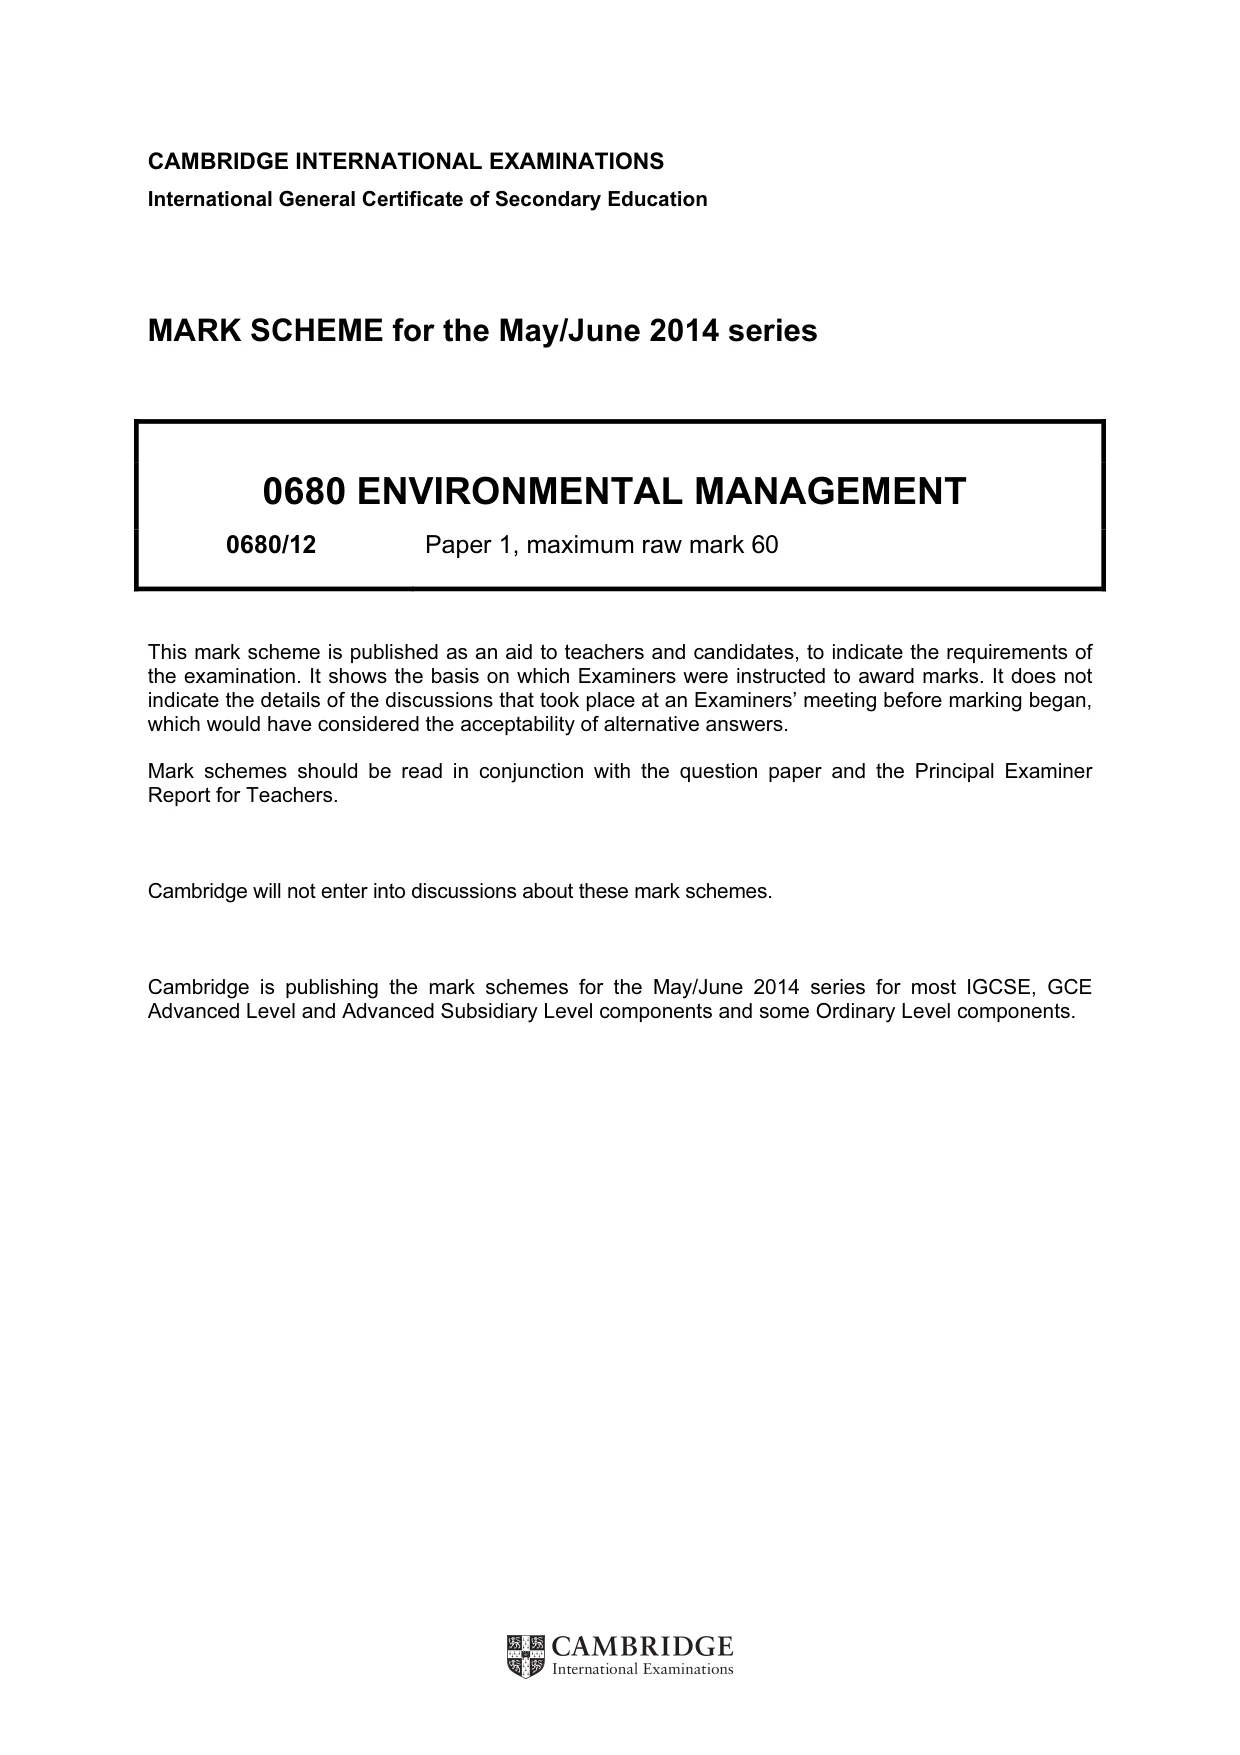
CAMBRIDGE INTERNATIONAL EXAMINATIONS International General Certificate of Secondary Education MARK SCHEME for the May/June 2014 series 0680 ENVIRONMENTAL MANAGEMENT 0680/12 Paper 1, maximum raw mark 60 This mark scheme is published as an aid to teachers and candidates, to indicate the requirements of the examination. It shows the basis on which Examiners were instructed to award marks. It does not indicate the details of the discussions that took place at an Examiners’ meeting before marking began, which would have considered the acceptability of alternative answers. Mark schemes should be read in conjunction with the question paper and the Principal Examiner Report for Teachers. Cambridge will not enter into discussions about these mark schemes. Cambridge is publishing the mark schemes for the May/June 2014 series for most IGCSE, GCE Advanced Level and Advanced Subsidiary Level components and some Ordinary Level components.
Mark scheme, page 2
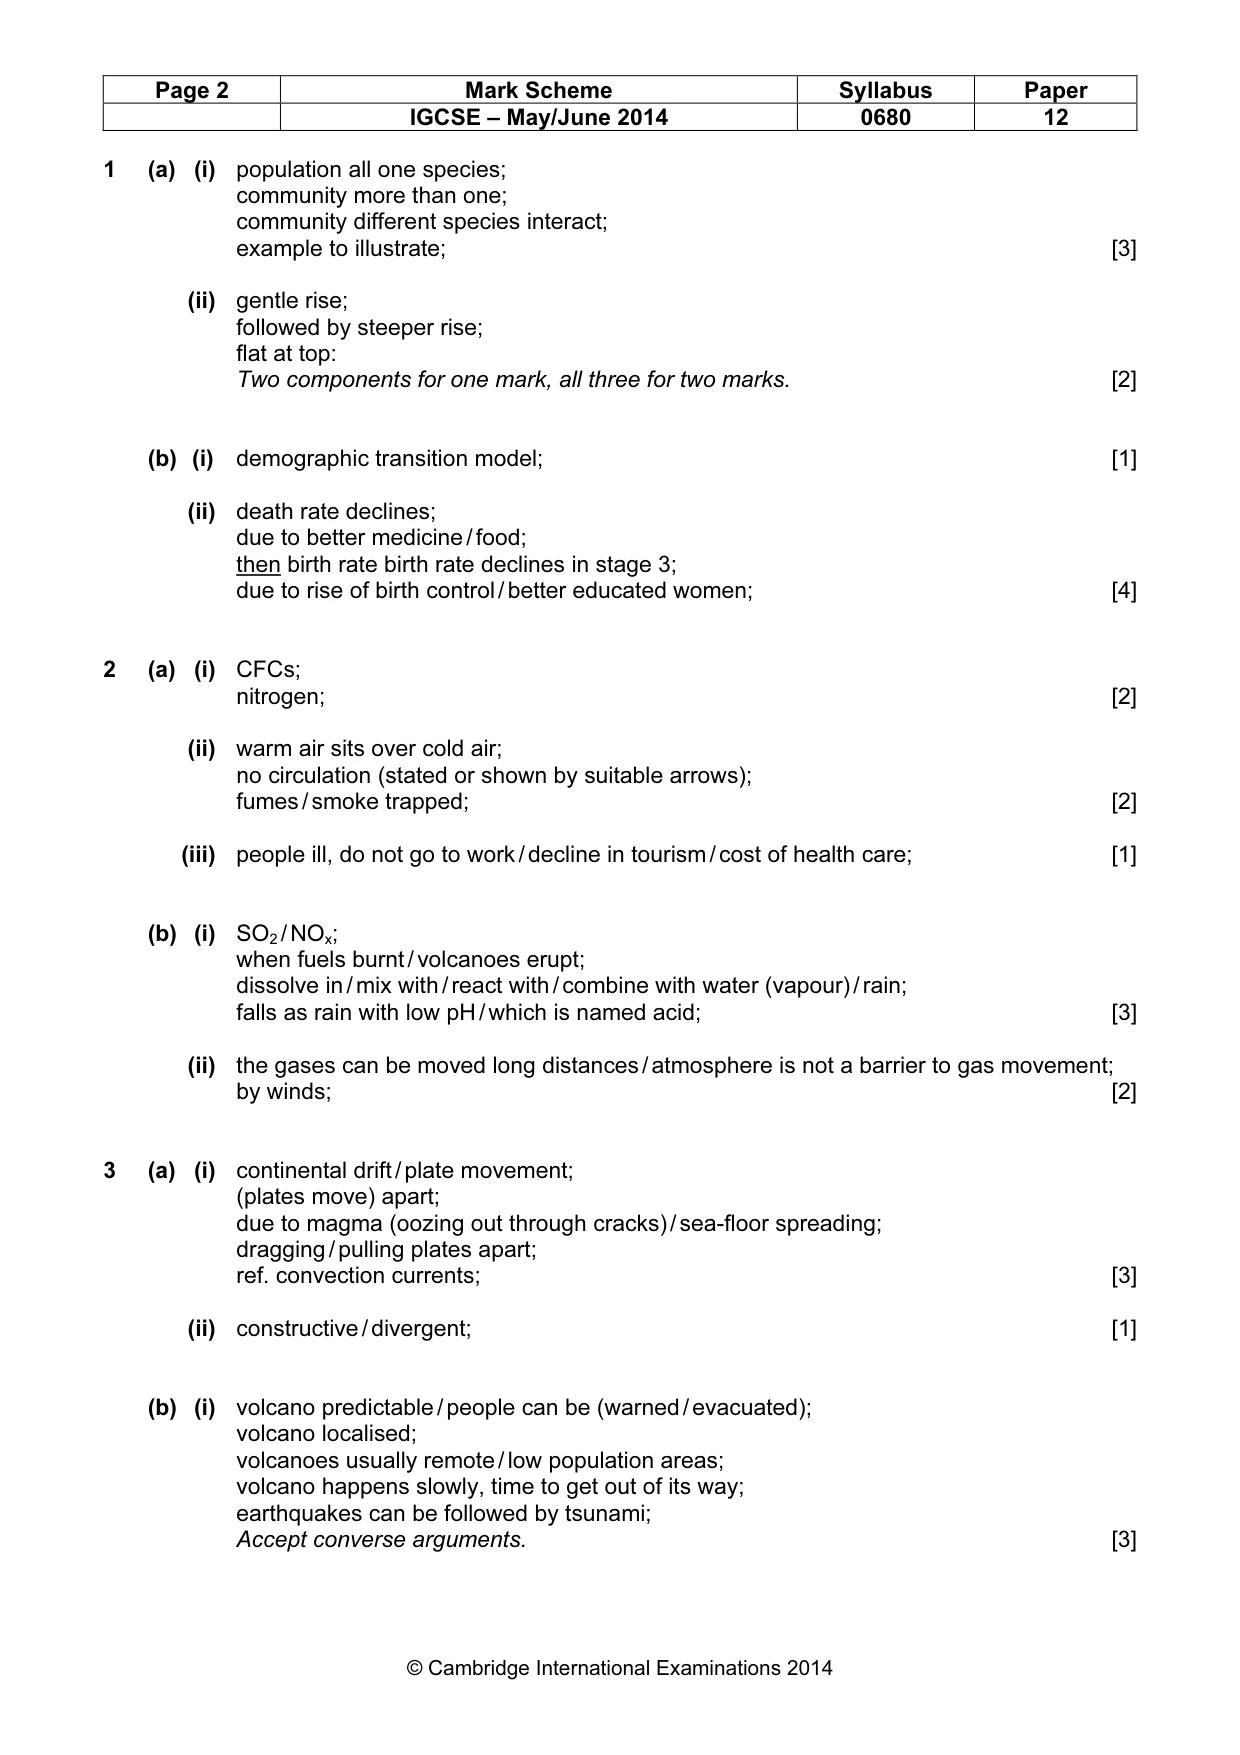
Page 2 Mark Scheme Syllabus Paper IGCSE – May/June 2014 0680 12 © Cambridge International Examinations 2014 1 (a) (i) population all one species; community more than one; community different species interact; example to illustrate; [3] (ii) gentle rise; followed by steeper rise; flat at top: Two components for one mark, all three for two marks. [2] (b) (i) demographic transition model; [1] (ii) death rate declines; due to better medicine / food; then birth rate birth rate declines in stage 3; due to rise of birth control / better educated women; [4] 2 (a) (i) CFCs; nitrogen; [2] (ii) warm air sits over cold air; no circulation (stated or shown by suitable arrows); fumes / smoke trapped; [2] (iii) people ill, do not go to work / decline in tourism / cost of health care; [1] (b) (i) SO2 / NOx; when fuels burnt / volcanoes erupt; dissolve in / mix with / react with / combine with water (vapour) / rain; falls as rain with low pH / which is named acid; [3] (ii) the gases can be moved long distances / atmosphere is not a barrier to gas movement; by winds; [2] 3 (a) (i) continental drift / plate movement; (plates move) apart; due to magma (oozing out through cracks) / sea-floor spreading; dragging / pulling plates apart; ref. convection currents; [3] (ii) constructive / divergent; [1] (b) (i) volcano predictable / people can be (warned / evacuated); volcano localised; volcanoes usually remote / low population areas; volcano happens slowly, time to get out of its way; earthquakes can be followed by tsunami; Accept converse arguments. [3]
Mark scheme, page 3
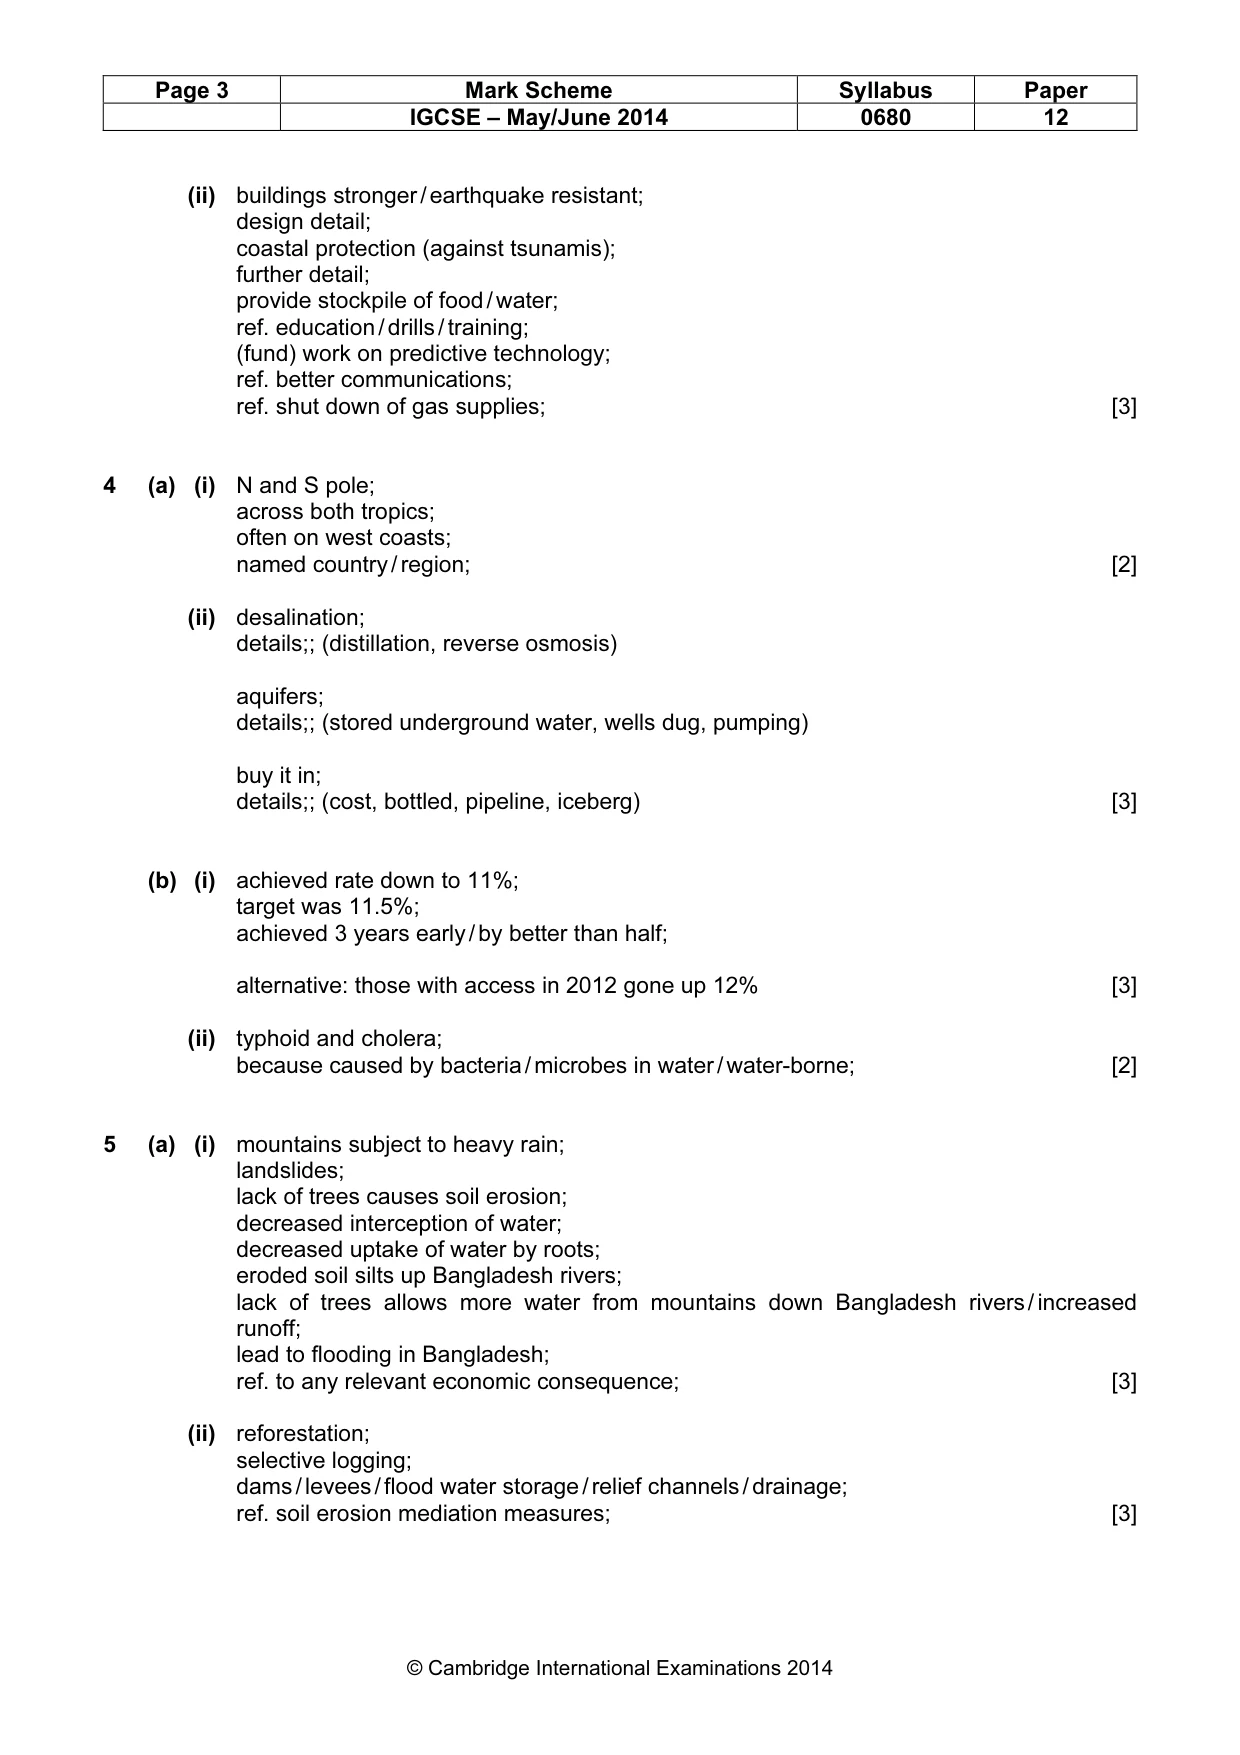
Page 3 Mark Scheme Syllabus Paper IGCSE – May/June 2014 0680 12 © Cambridge International Examinations 2014 (ii) buildings stronger / earthquake resistant; design detail; coastal protection (against tsunamis); further detail; provide stockpile of food / water; ref. education / drills / training; (fund) work on predictive technology; ref. better communications; ref. shut down of gas supplies; [3] 4 (a) (i) N and S pole; across both tropics; often on west coasts; named country / region; [2] (ii) desalination; details;; (distillation, reverse osmosis) aquifers; details;; (stored underground water, wells dug, pumping) buy it in; details;; (cost, bottled, pipeline, iceberg) [3] (b) (i) achieved rate down to 11%; target was 11.5%; achieved 3 years early / by better than half; alternative: those with access in 2012 gone up 12% [3] (ii) typhoid and cholera; because caused by bacteria / microbes in water / water-borne; [2] 5 (a) (i) mountains subject to heavy rain; landslides; lack of trees causes soil erosion; decreased interception of water; decreased uptake of water by roots; eroded soil silts up Bangladesh rivers; lack of trees allows more water from mountains down Bangladesh rivers / increased runoff; lead to flooding in Bangladesh; ref. to any relevant economic consequence; [3] (ii) reforestation; selective logging; dams / levees / flood water storage / relief channels / drainage; ref. soil erosion mediation measures; [3]
Mark scheme, page 4
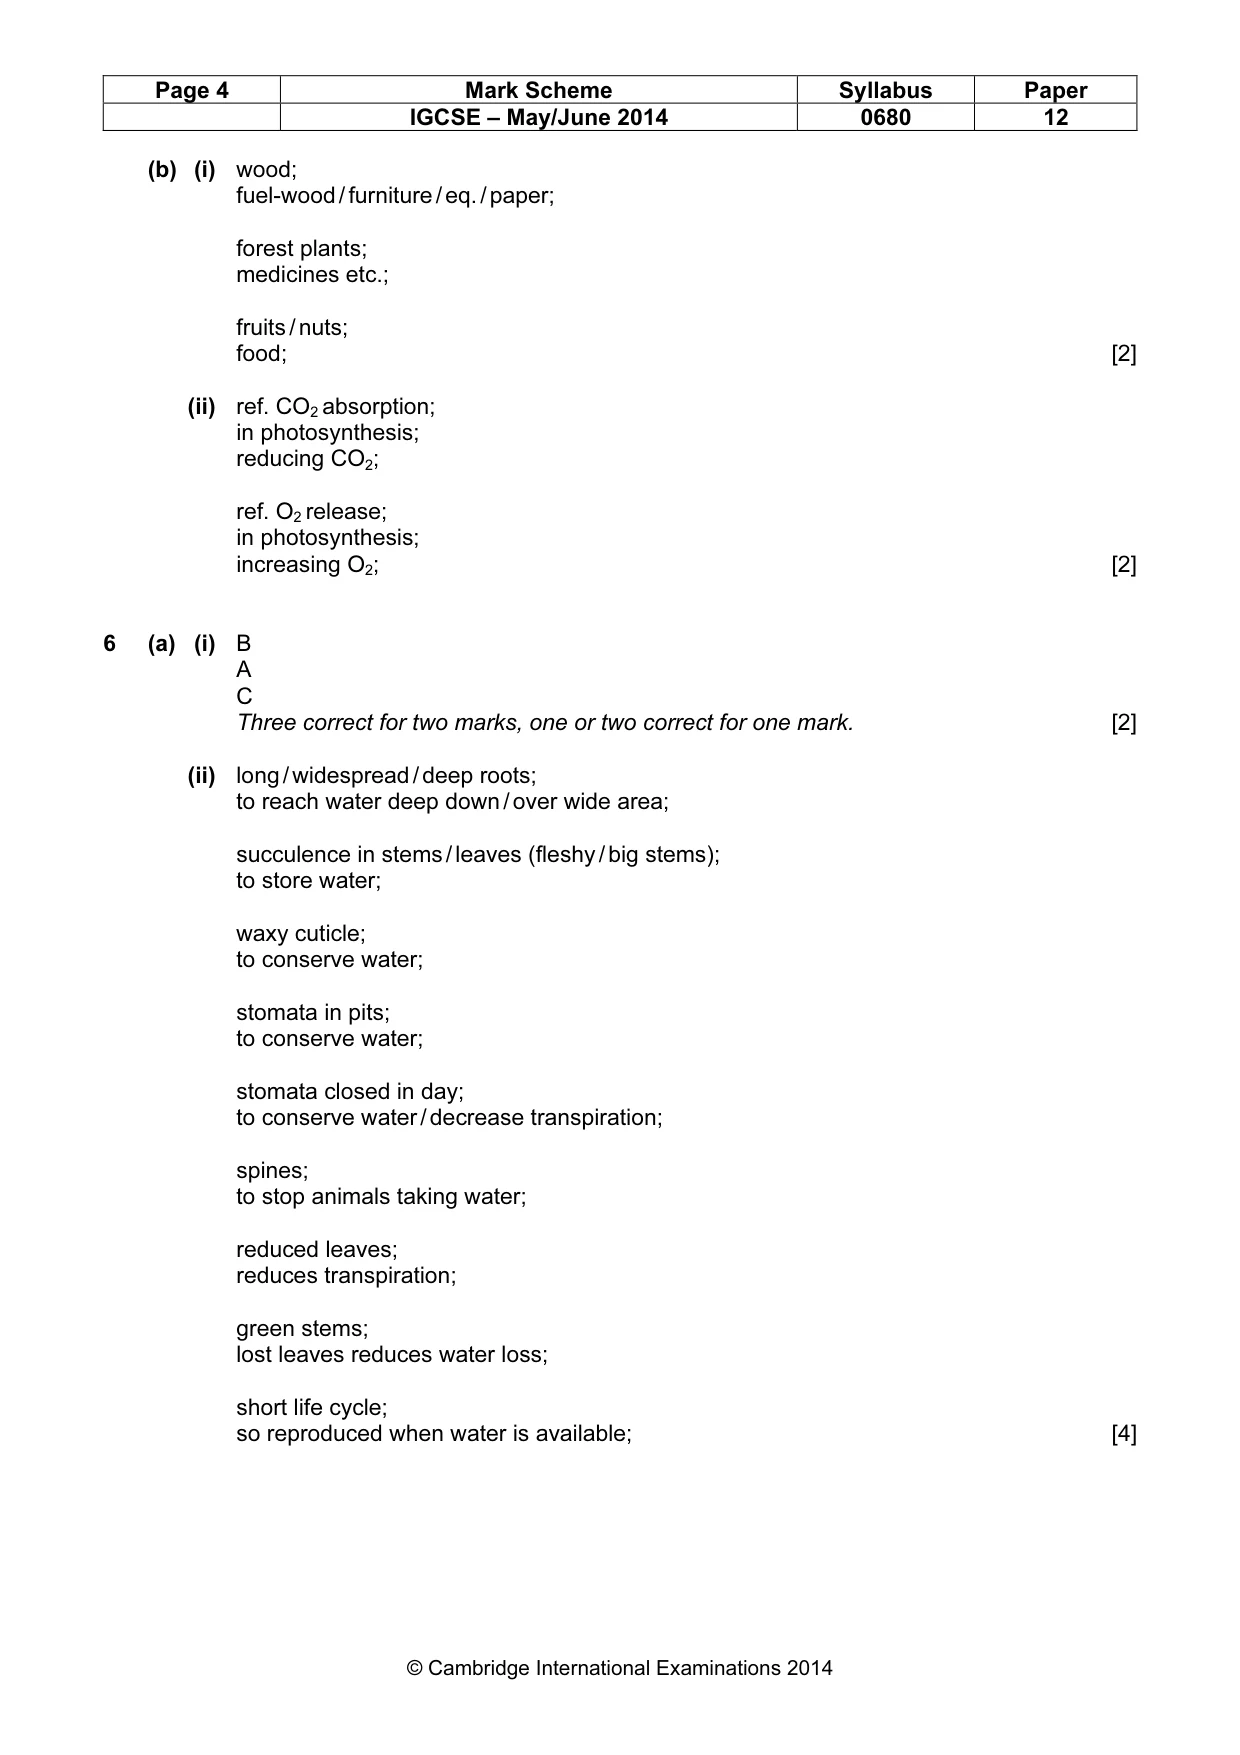
Page 4 Mark Scheme Syllabus Paper IGCSE – May/June 2014 0680 12 © Cambridge International Examinations 2014 (b) (i) wood; fuel-wood / furniture / eq. / paper; forest plants; medicines etc.; fruits / nuts; food; [2] (ii) ref. CO2 absorption; in photosynthesis; reducing CO2; ref. O2 release; in photosynthesis; increasing O2; [2] 6 (a) (i) B A C Three correct for two marks, one or two correct for one mark. [2] (ii) long / widespread / deep roots; to reach water deep down / over wide area; succulence in stems / leaves (fleshy / big stems); to store water; waxy cuticle; to conserve water; stomata in pits; to conserve water; stomata closed in day; to conserve water / decrease transpiration; spines; to stop animals taking water; reduced leaves; reduces transpiration; green stems; lost leaves reduces water loss; short life cycle; so reproduced when water is available; [4]
Mark scheme, page 5
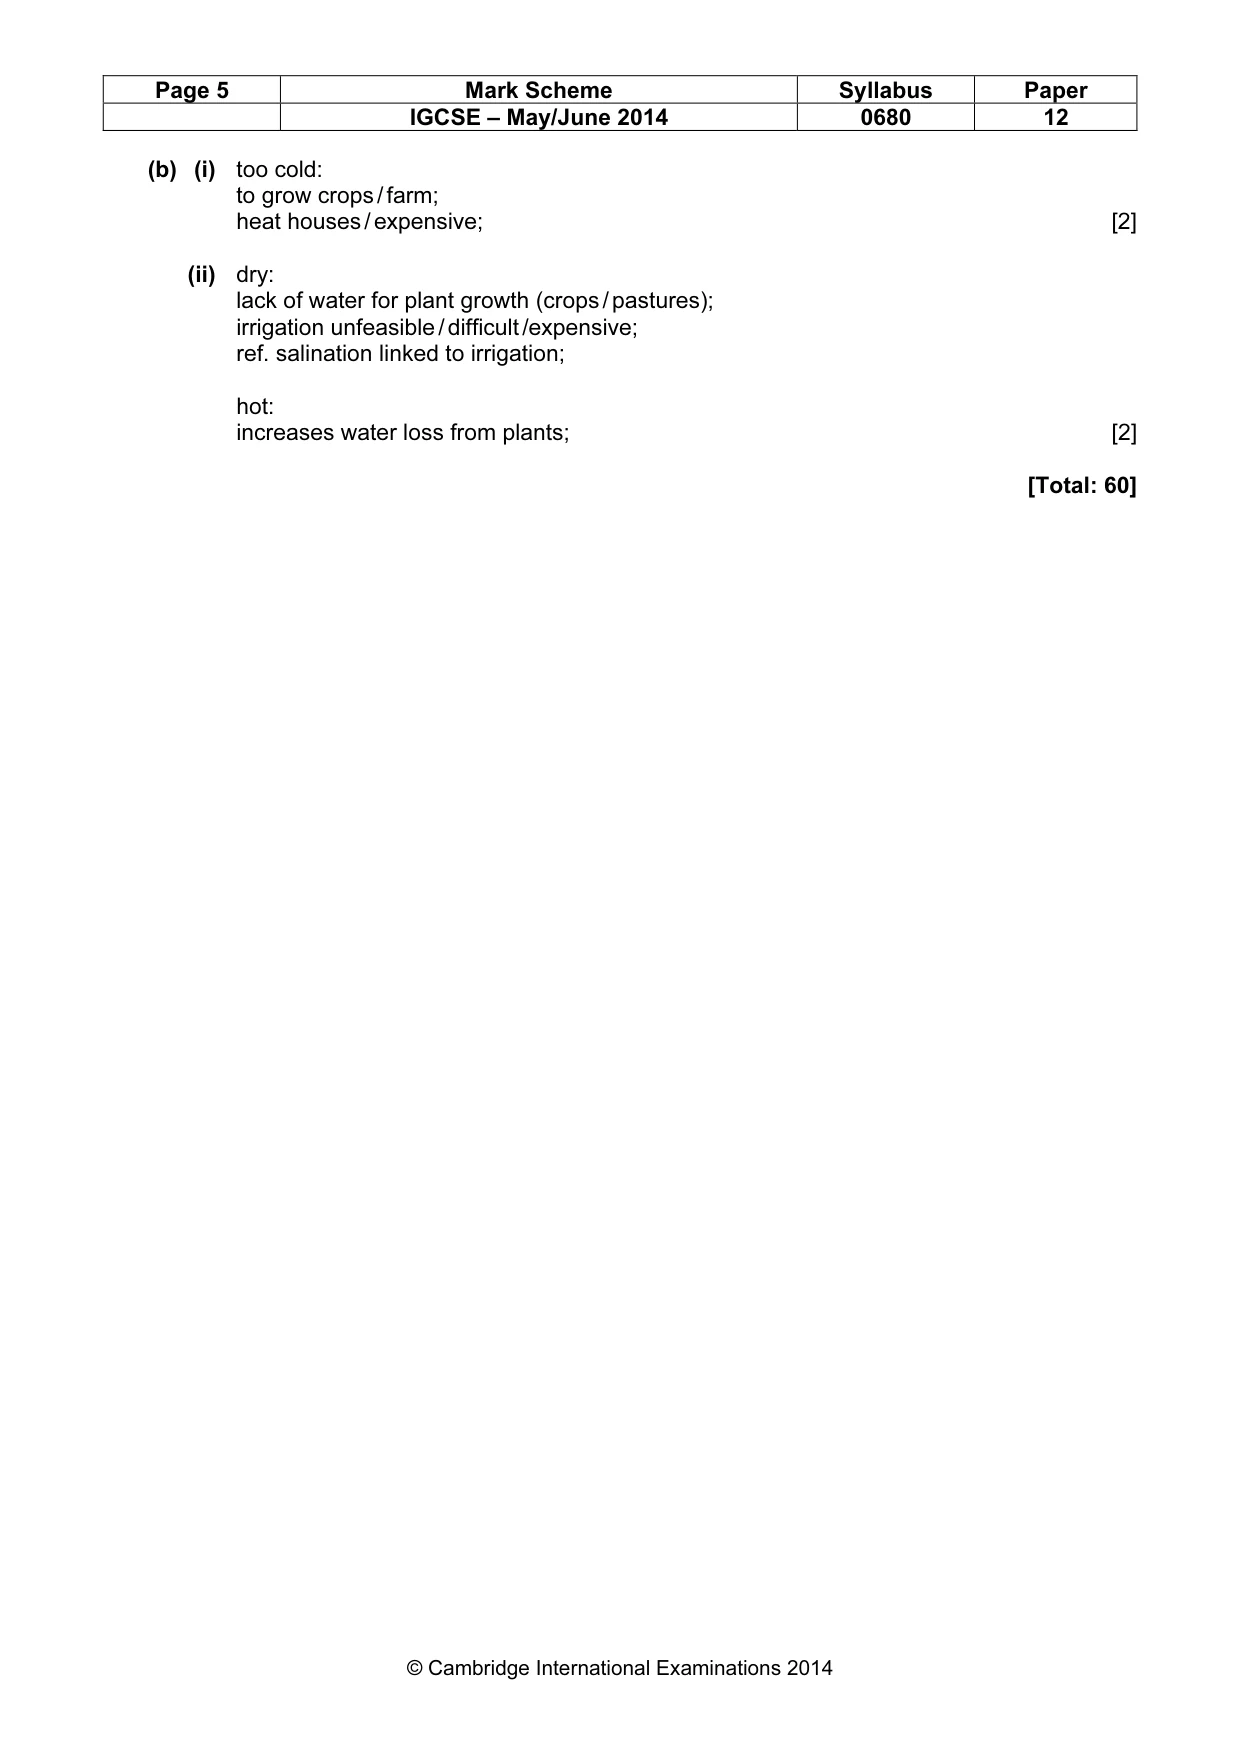
Page 5 Mark Scheme Syllabus Paper IGCSE – May/June 2014 0680 12 © Cambridge International Examinations 2014 (b) (i) too cold: to grow crops / farm; heat houses / expensive; [2] (ii) dry: lack of water for plant growth (crops / pastures); irrigation unfeasible / difficult /expensive; ref. salination linked to irrigation; hot: increases water loss from plants; [2] [Total: 60]
What you needed in this session
Cambridge’s own grade thresholds for 2014 May/June, Paper 1 · Variant 2. A higher threshold means an easier paper — the bar moves with how the cohort did.