Cambridge IGCSE Environmental Management 0680 — 2013 May/June Paper 1 · Variant 1
0680/11/M/J/13 · 60 marks · ≈68 min
The question paper and its mark scheme, free to read here and free to download. This is Cambridge’s own paper, exactly as it was sat.
Question paper20 pages


Mark scheme5 pages
Answers below. Sit the paper first if you are practising.
Paper as text
Question paper, page 1
This document consists of 19 printed pages and 1 blank page. DC (SJF/SW) 67834/3 © UCLES 2013 [Turn over UNIVERSITY OF CAMBRIDGE INTERNATIONAL EXAMINATIONS International General Certificate of Secondary Education * 4 0 9 9 6 0 3 5 4 7 * ENVIRONMENTAL MANAGEMENT 0680/11 Paper 1 May/June 2013 1 hour 30 minutes Candidates answer on the Question Paper. Additional Materials: Ruler READ THESE INSTRUCTIONS FIRST Write your Centre number, candidate number and name on all the work you hand in. Write in dark blue or black pen. You may use a soft pencil for any diagrams, graphs or rough working. Do not use staples, paper clips, highlighters, glue or correction fluid. DO NOT WRITE IN ANY BARCODES. Electronic calculators may be used. Answer all questions. At the end of the examination, fasten all your work securely together. The number of marks is given in brackets [ ] at the end of each question or part question. For Examiner’s Use 1 2 3 4 5 6 Total
Question paper, page 2
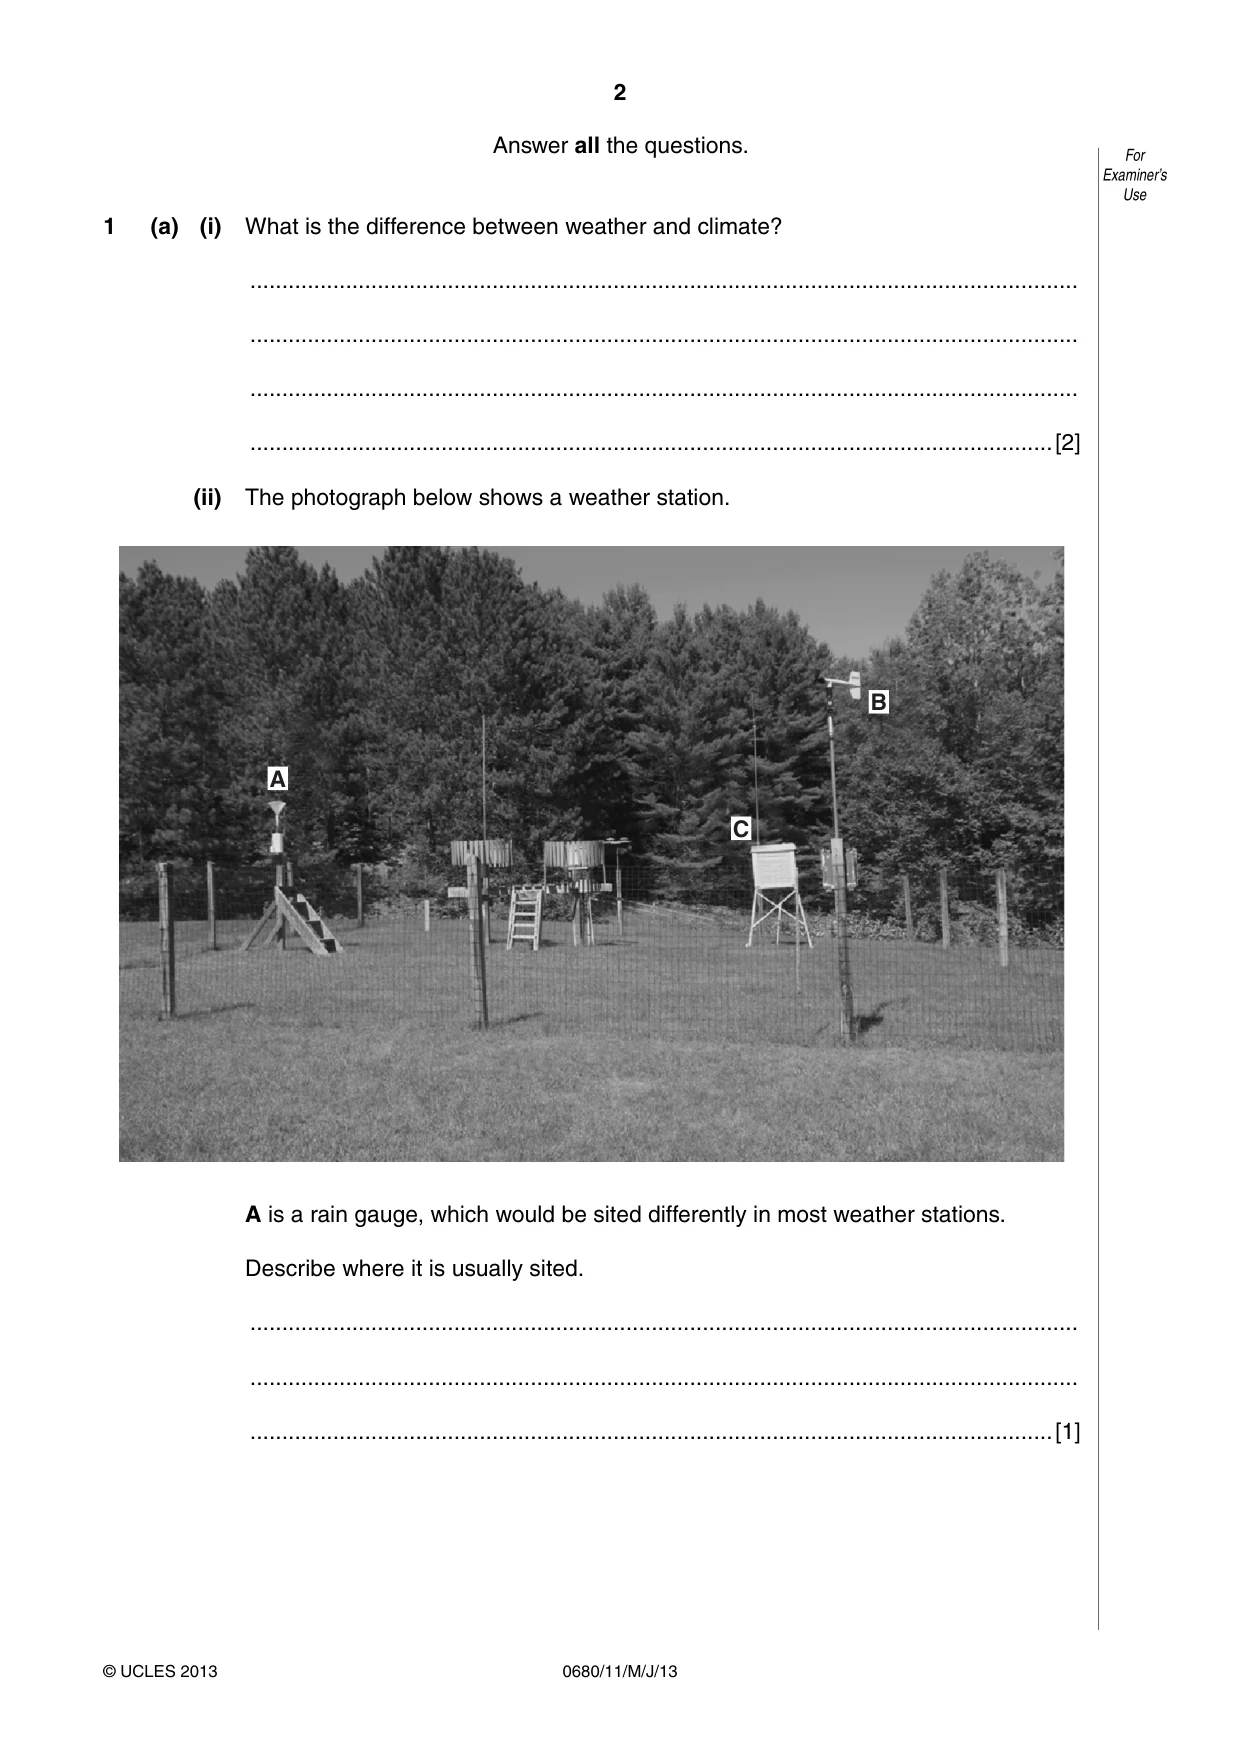
2 0680/11/M/J/13 © UCLES 2013 For Examiner’s Use Answer all the questions. 1 (a) (i) What is the difference between weather and climate? … … … …[2] (ii) The photograph below shows a weather station. A C B A is a rain gauge, which would be sited differently in most weather stations. Describe where it is usually sited. … … …[1]
Question paper, page 3
3 0680/11/M/J/13 © UCLES 2013 [Turn over For Examiner’s Use (iii) Which element of the weather is being measured and recorded by the device labelled B? B … [1] (iv) Name one instrument found in C and give reasons why it is placed there. … … … … … …[3]
Question paper, page 4
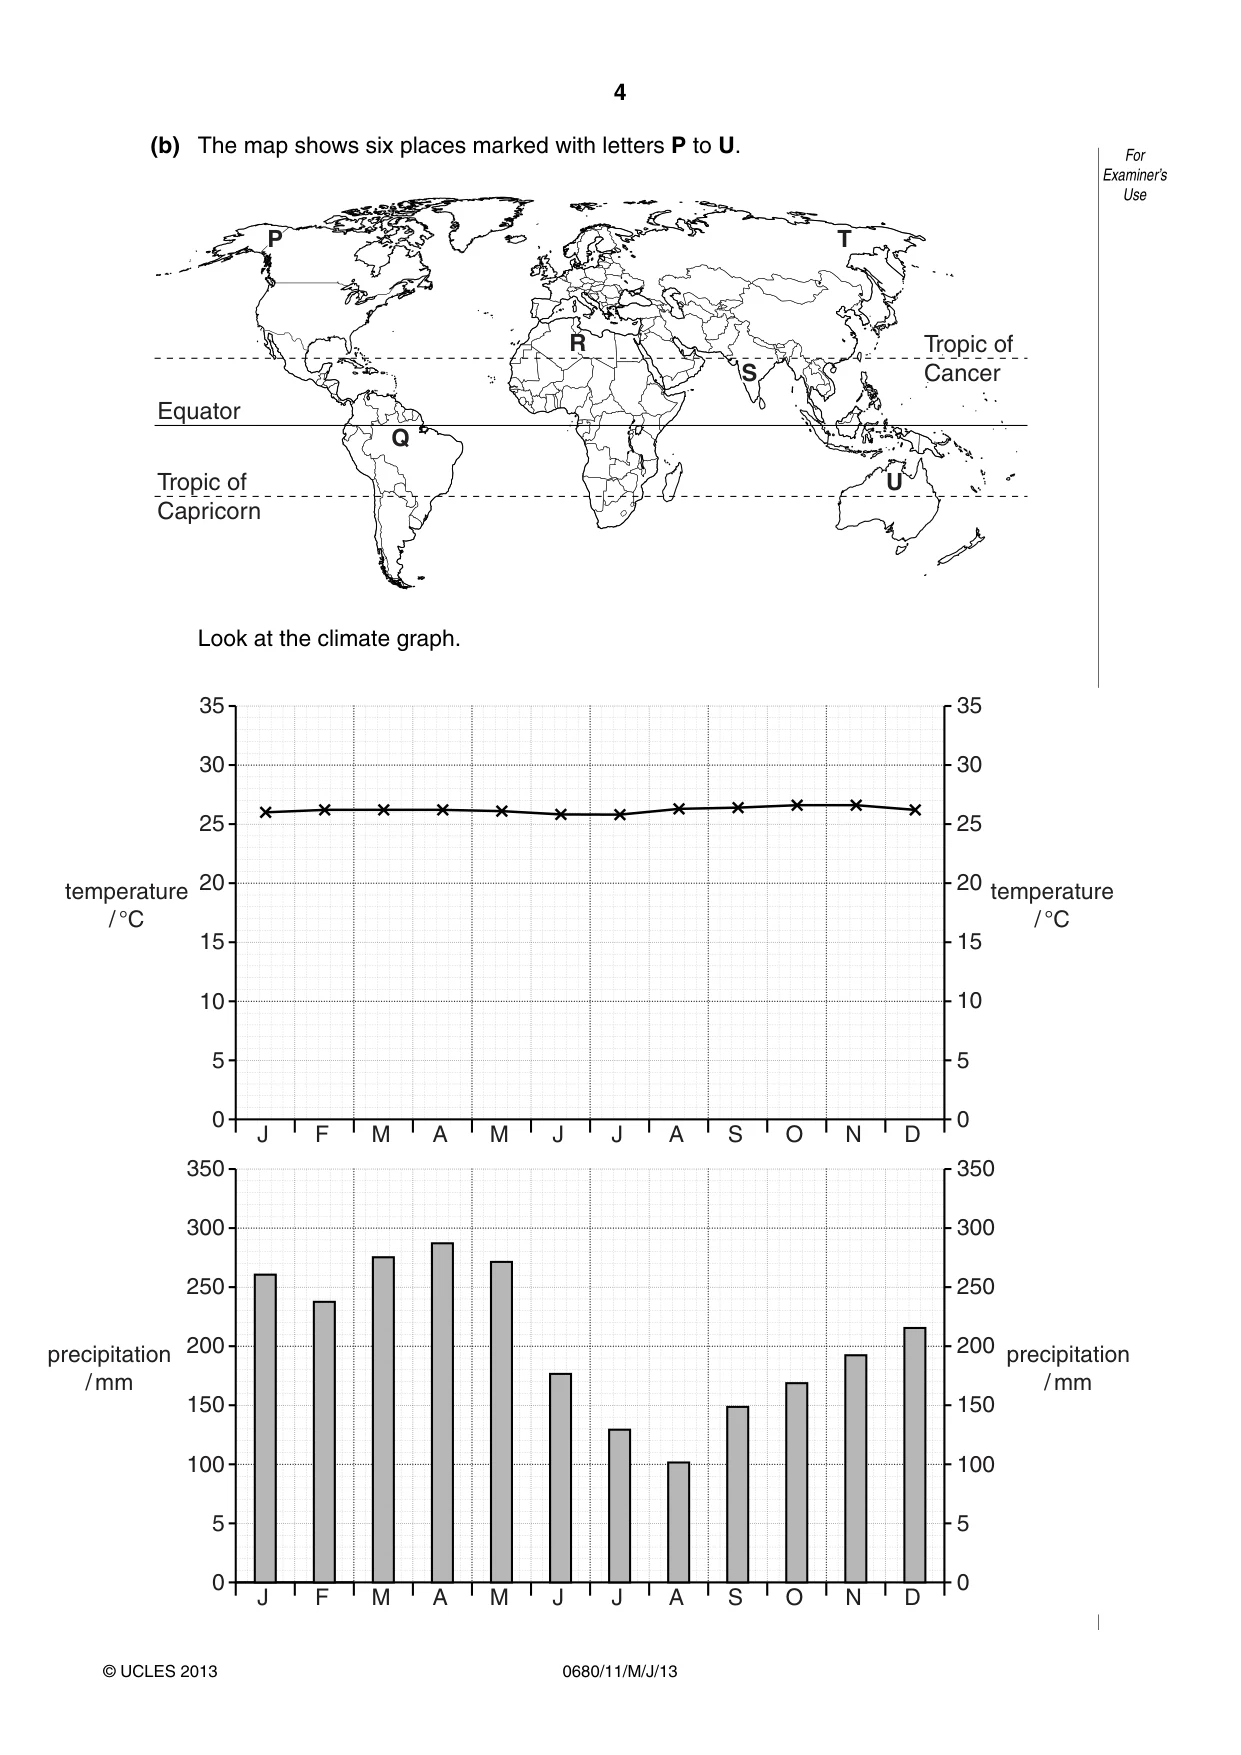
4 0680/11/M/J/13 © UCLES 2013 For Examiner’s Use (b) The map shows six places marked with letters P to U. P Q R S T U Equator Tropic of Cancer Tropic of Capricorn Look at the climate graph. J 0 5 100 150 200 250 300 350 precipitation / mm precipitation / mm 0 5 100 150 200 250 300 350 F M A M J J A S O N D J 0 5 10 15 20 25 30 35 temperature / °C temperature / °C 0 5 10 15 20 25 30 35 F M A M J J A S O N D
Question paper, page 5
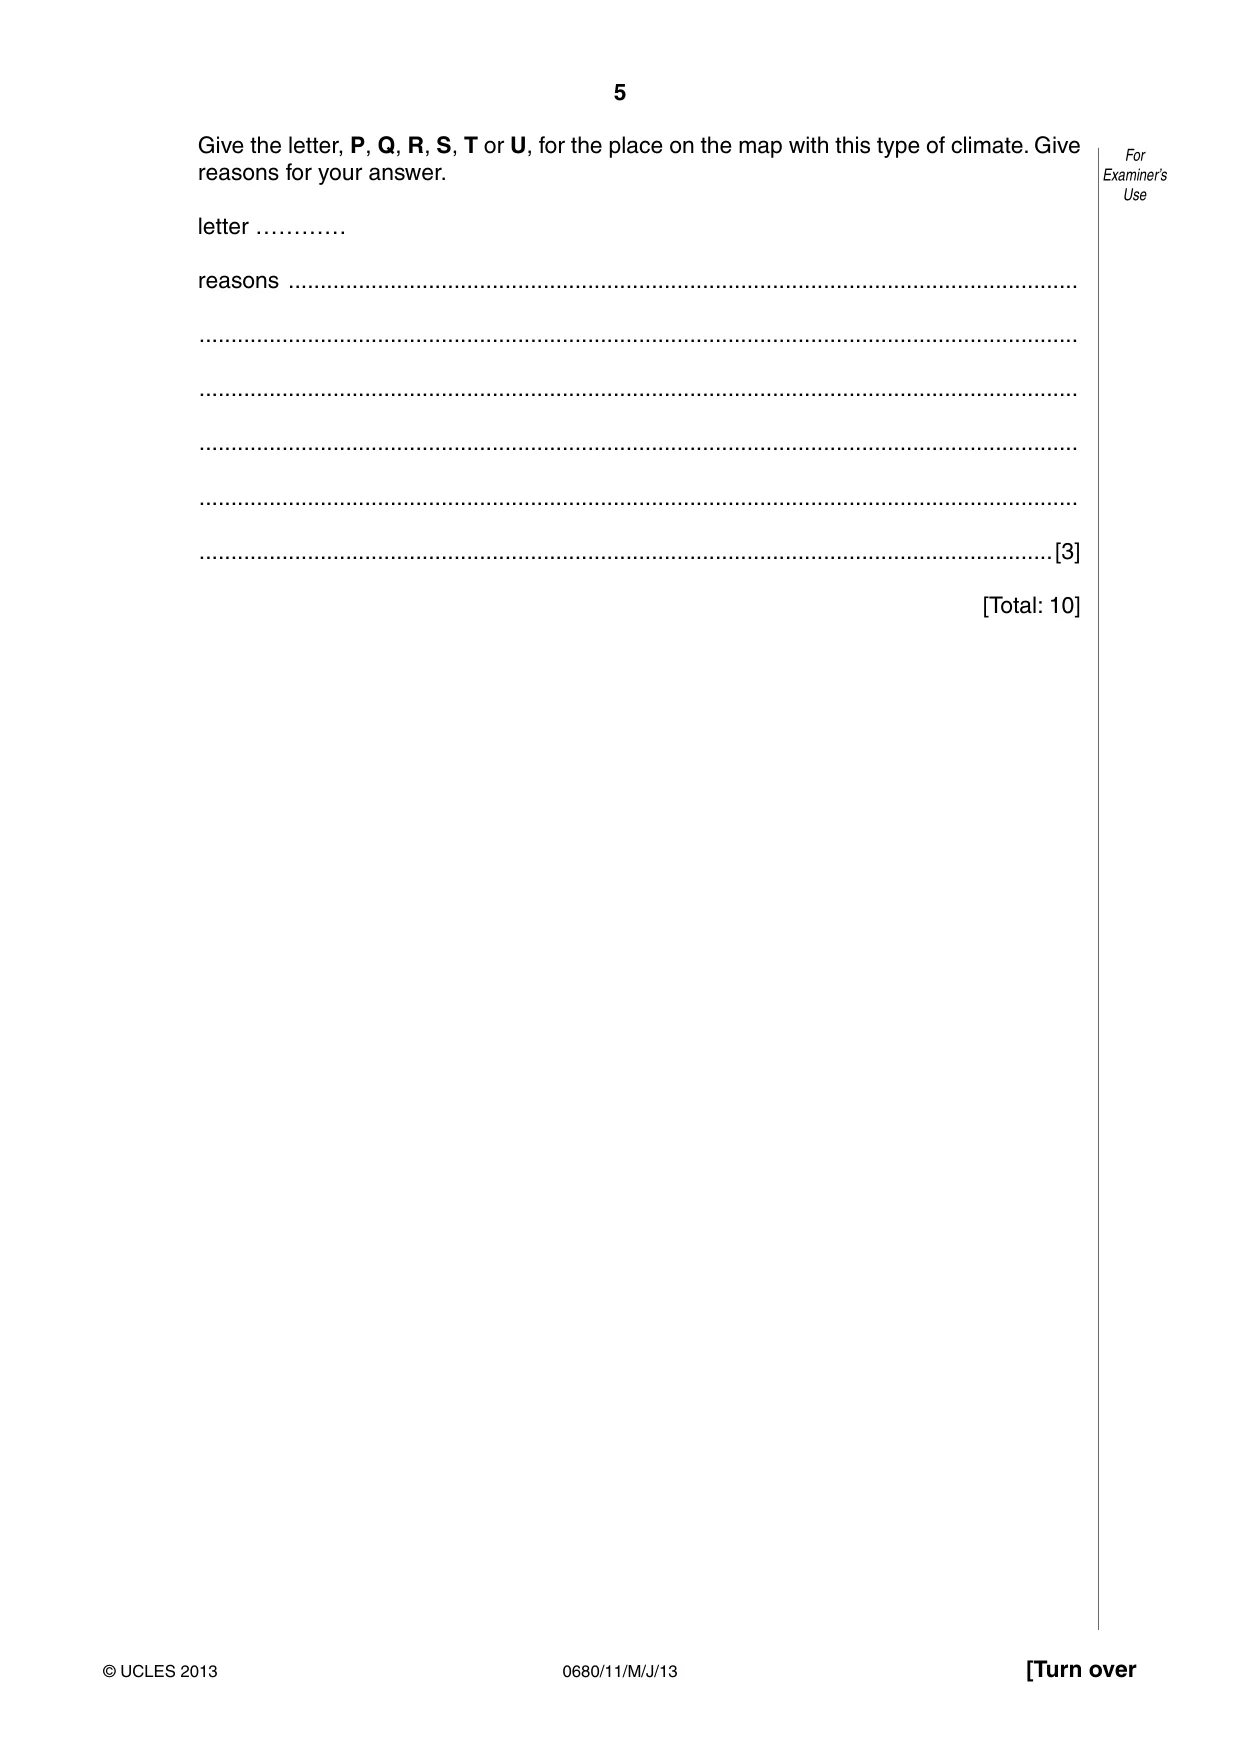
5 0680/11/M/J/13 © UCLES 2013 [Turn over For Examiner’s Use Give the letter, P, Q, R, S, T or U, for the place on the map with this type of climate. Give reasons for your answer. letter ………… reasons … … … … … …[3] [Total: 10]
Question paper, page 6
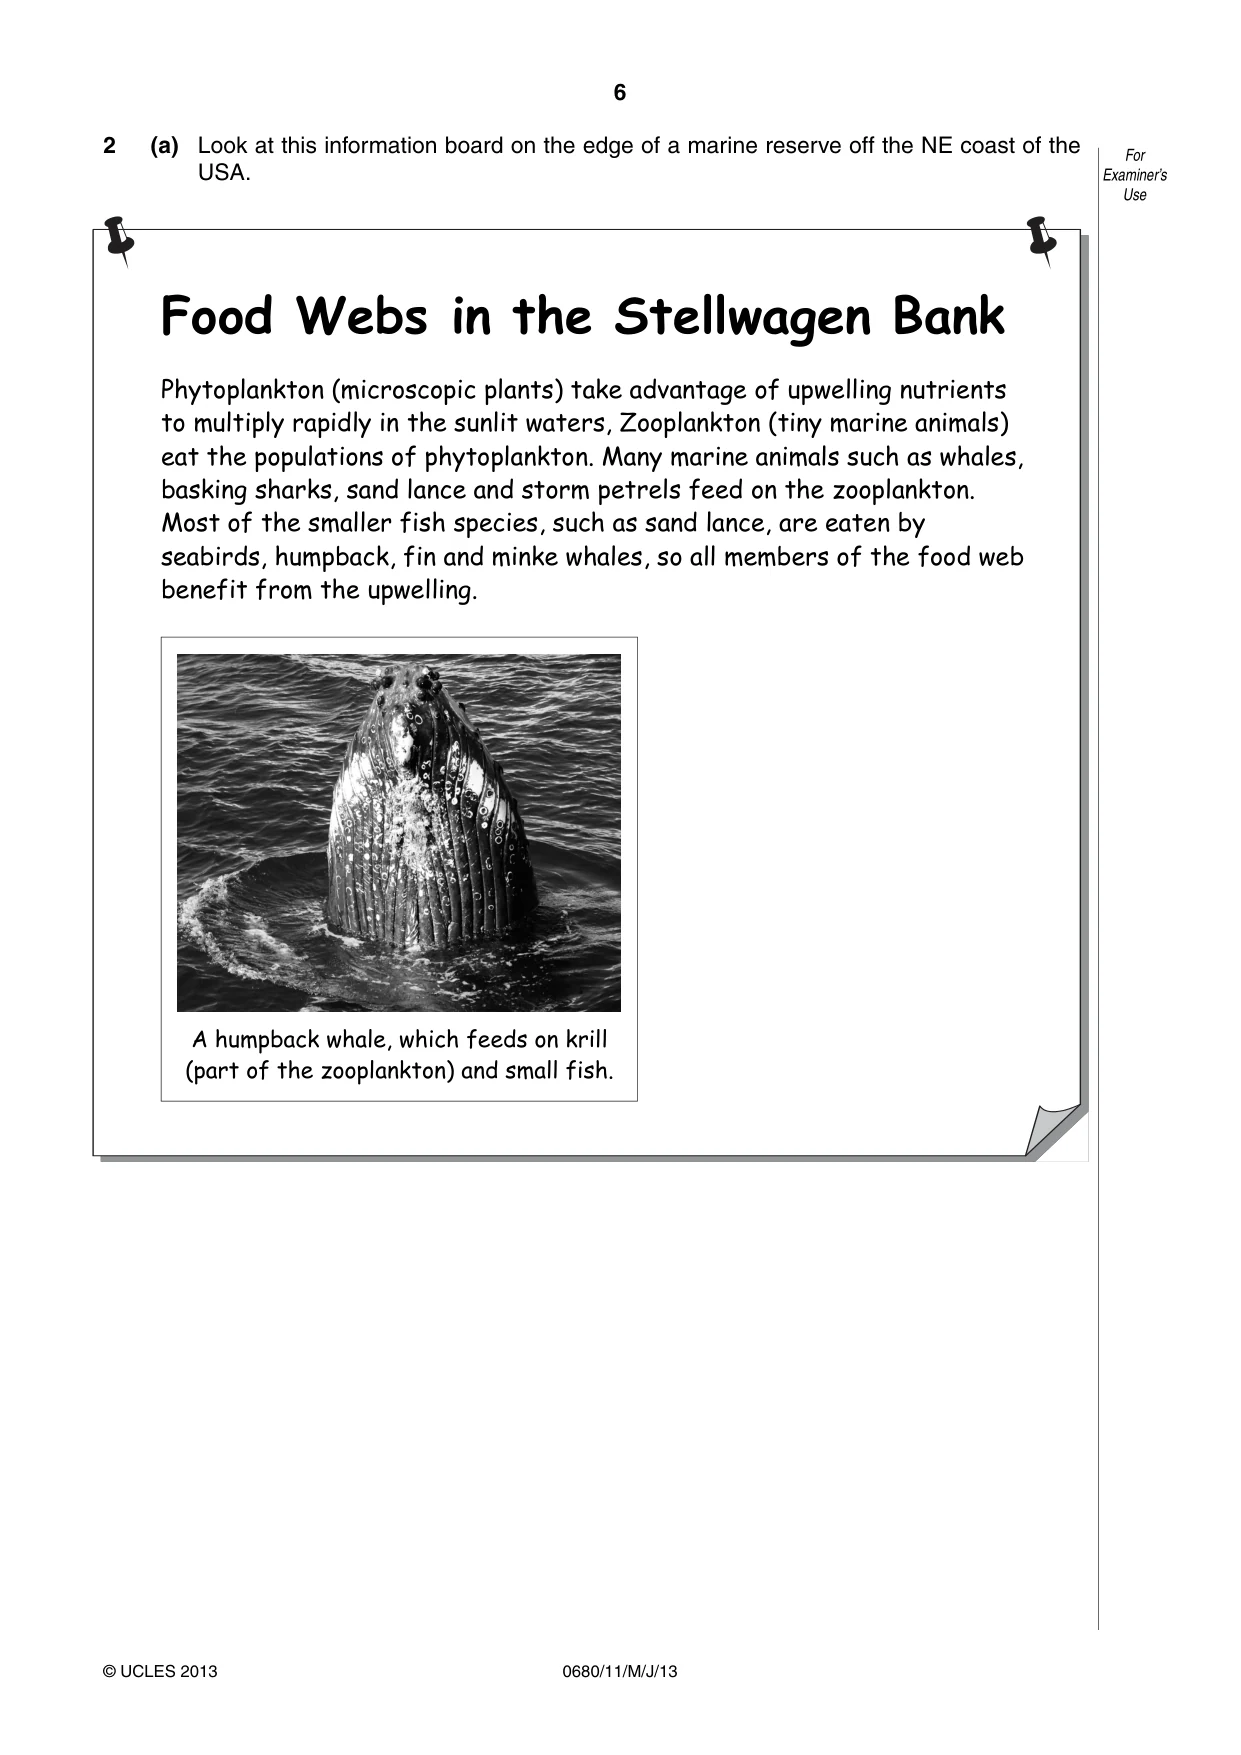
6 0680/11/M/J/13 © UCLES 2013 For Examiner’s Use 2 (a) Look at this information board on the edge of a marine reserve off the NE coast of the USA. Food Webs in the Stellwagen Bank Phytoplankton (microscopic plants) take advantage of upwelling nutrients to multiply rapidly in the sunlit waters, Zooplankton (tiny marine animals) eat the populations of phytoplankton. Many marine animals such as whales, basking sharks, sand lance and storm petrels feed on the zooplankton. Most of the smaller fish species, such as sand lance, are eaten by seabirds, humpback, fin and minke whales, so all members of the food web benefit from the upwelling. A humpback whale, which feeds on krill (part of the zooplankton) and small fish.
Question paper, page 7
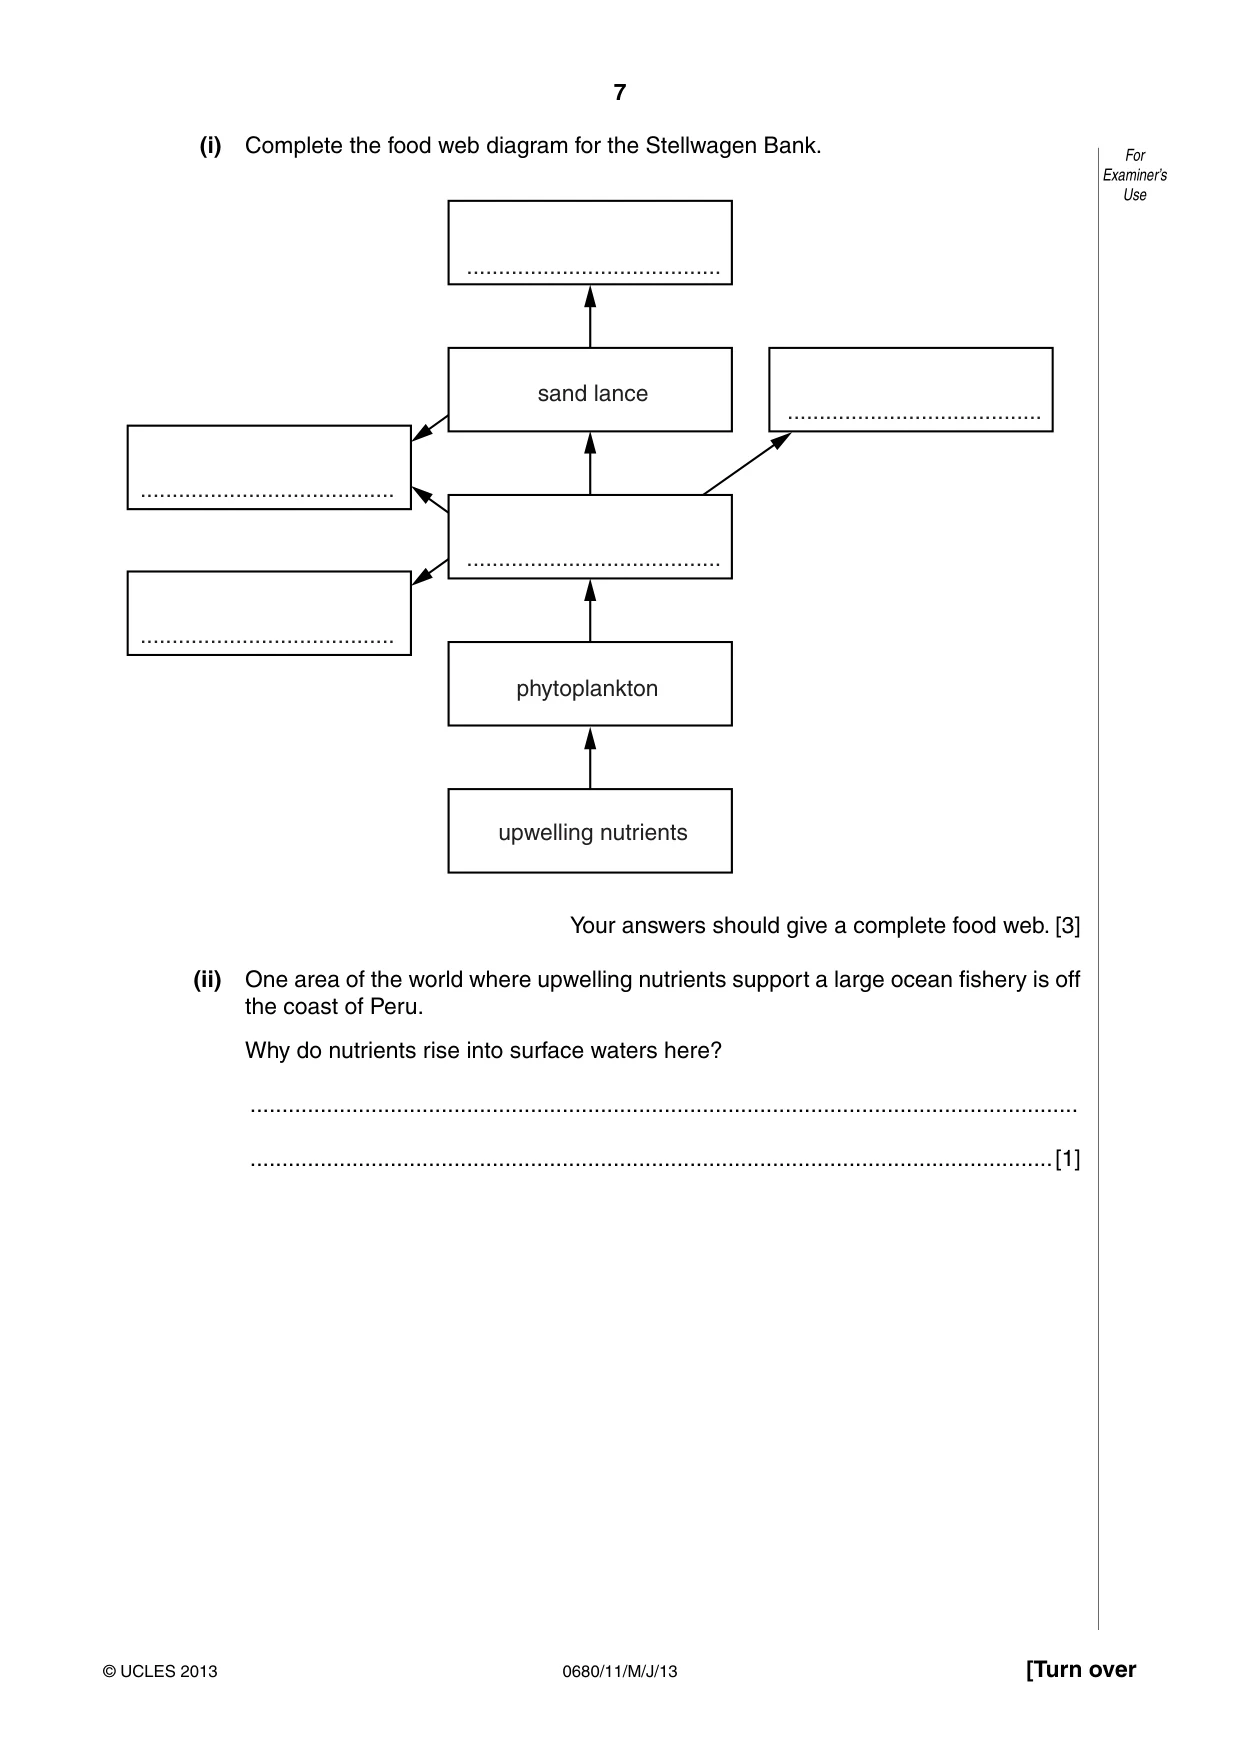
7 0680/11/M/J/13 © UCLES 2013 [Turn over For Examiner’s Use (i) Complete the food web diagram for the Stellwagen Bank. phytoplankton sand lance … … … … … upwelling nutrients Your answers should give a complete food web. [3] (ii) One area of the world where upwelling nutrients support a large ocean fishery is off the coast of Peru. Why do nutrients rise into surface waters here? … …[1]
Question paper, page 8
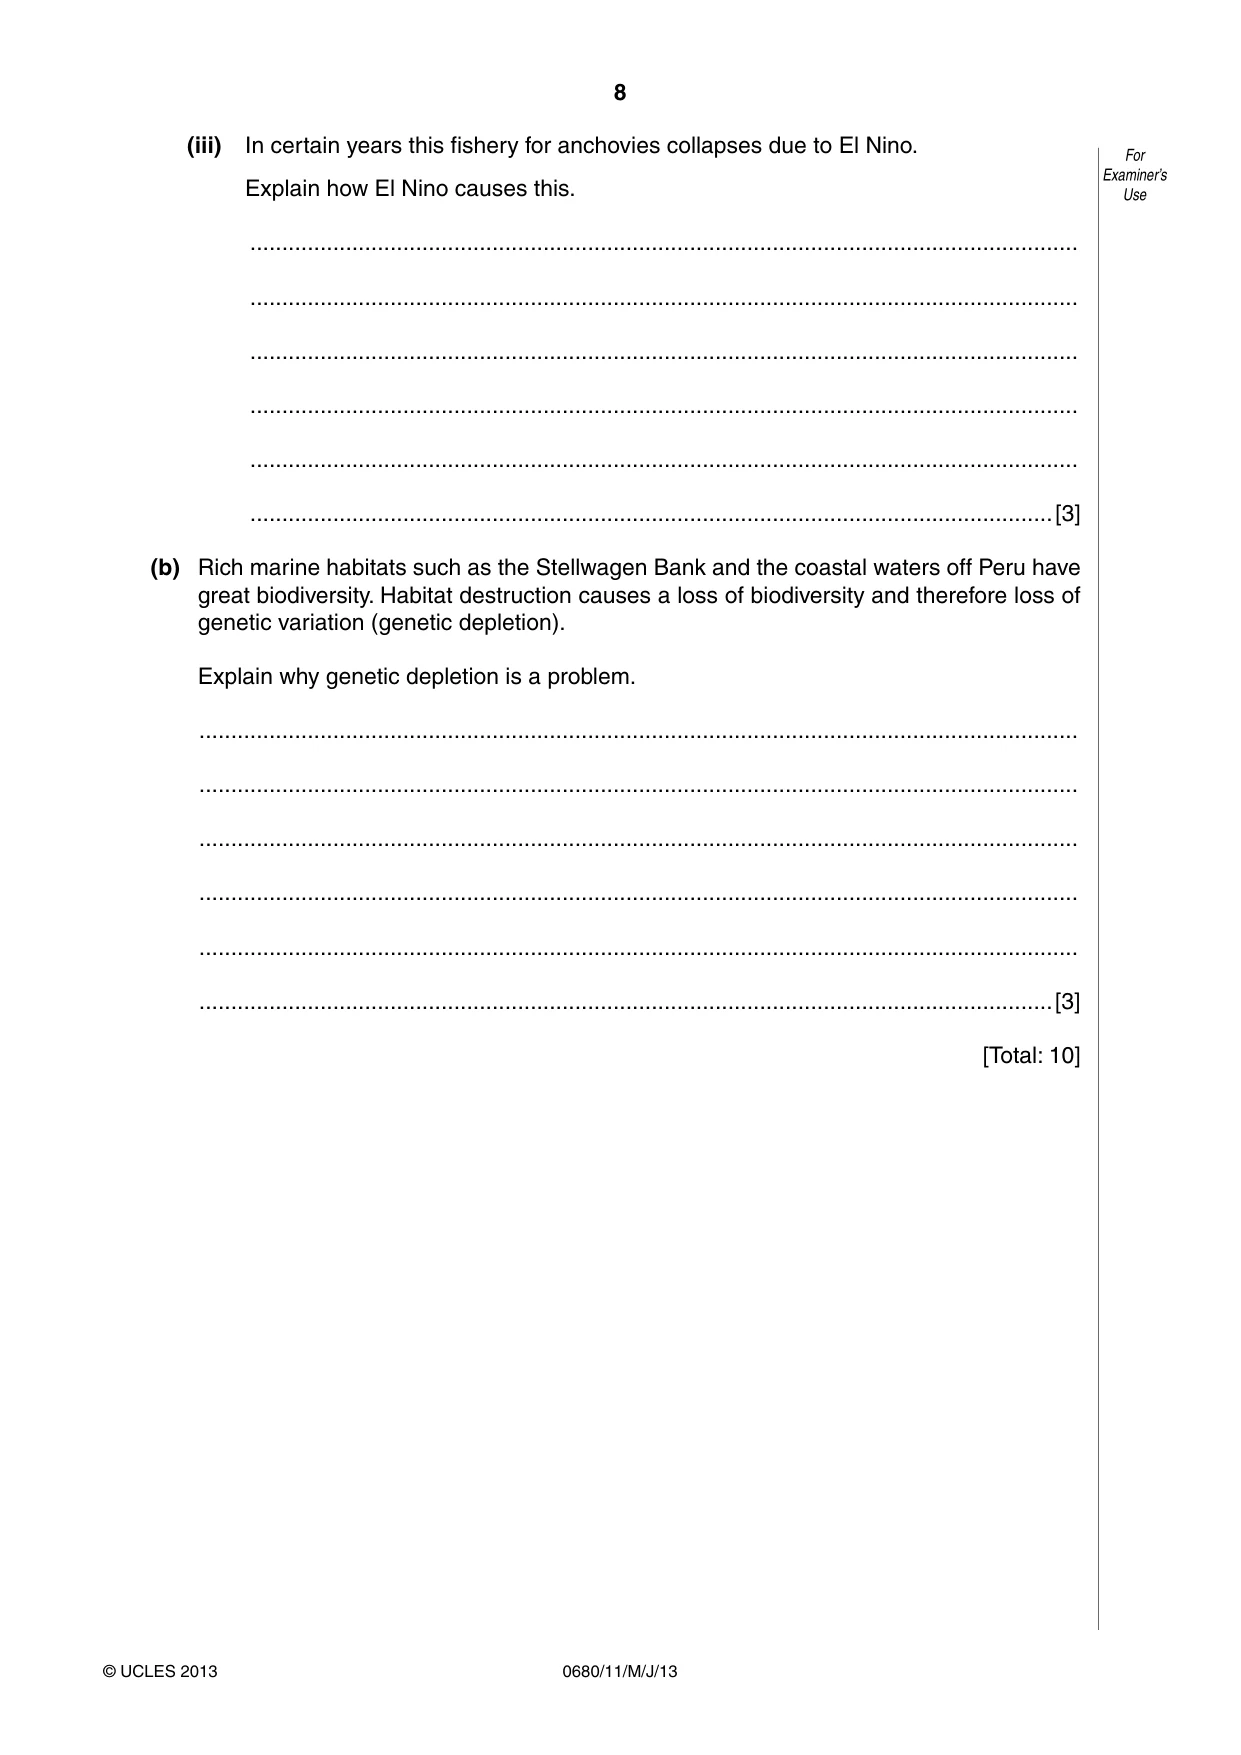
8 0680/11/M/J/13 © UCLES 2013 For Examiner’s Use (iii) In certain years this fishery for anchovies collapses due to El Nino. Explain how El Nino causes this. … … … … … …[3] (b) Rich marine habitats such as the Stellwagen Bank and the coastal waters off Peru have great biodiversity. Habitat destruction causes a loss of biodiversity and therefore loss of genetic variation (genetic depletion). Explain why genetic depletion is a problem. … … … … … …[3] [Total: 10]
Question paper, page 9
9 0680/11/M/J/13 © UCLES 2013 [Turn over Question 3 begins on page 10.
Question paper, page 10
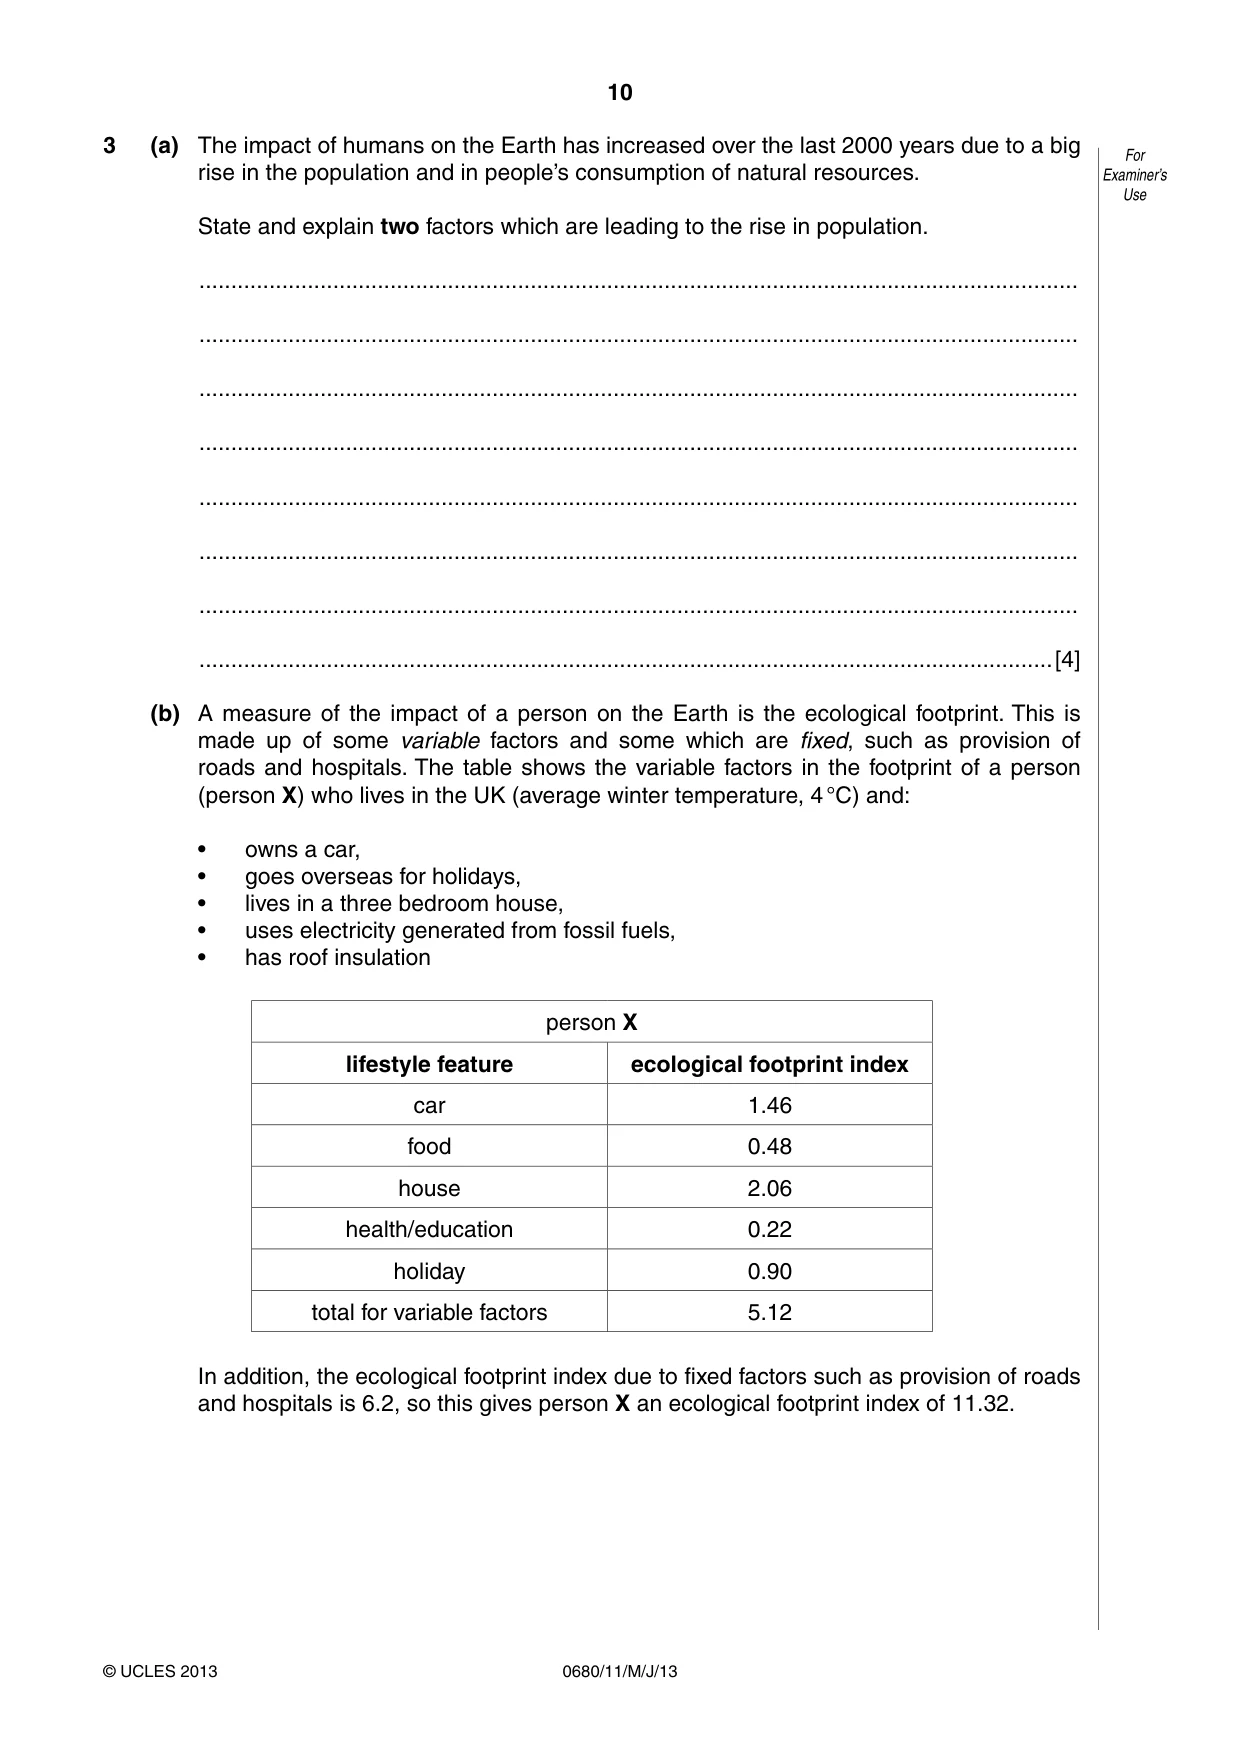
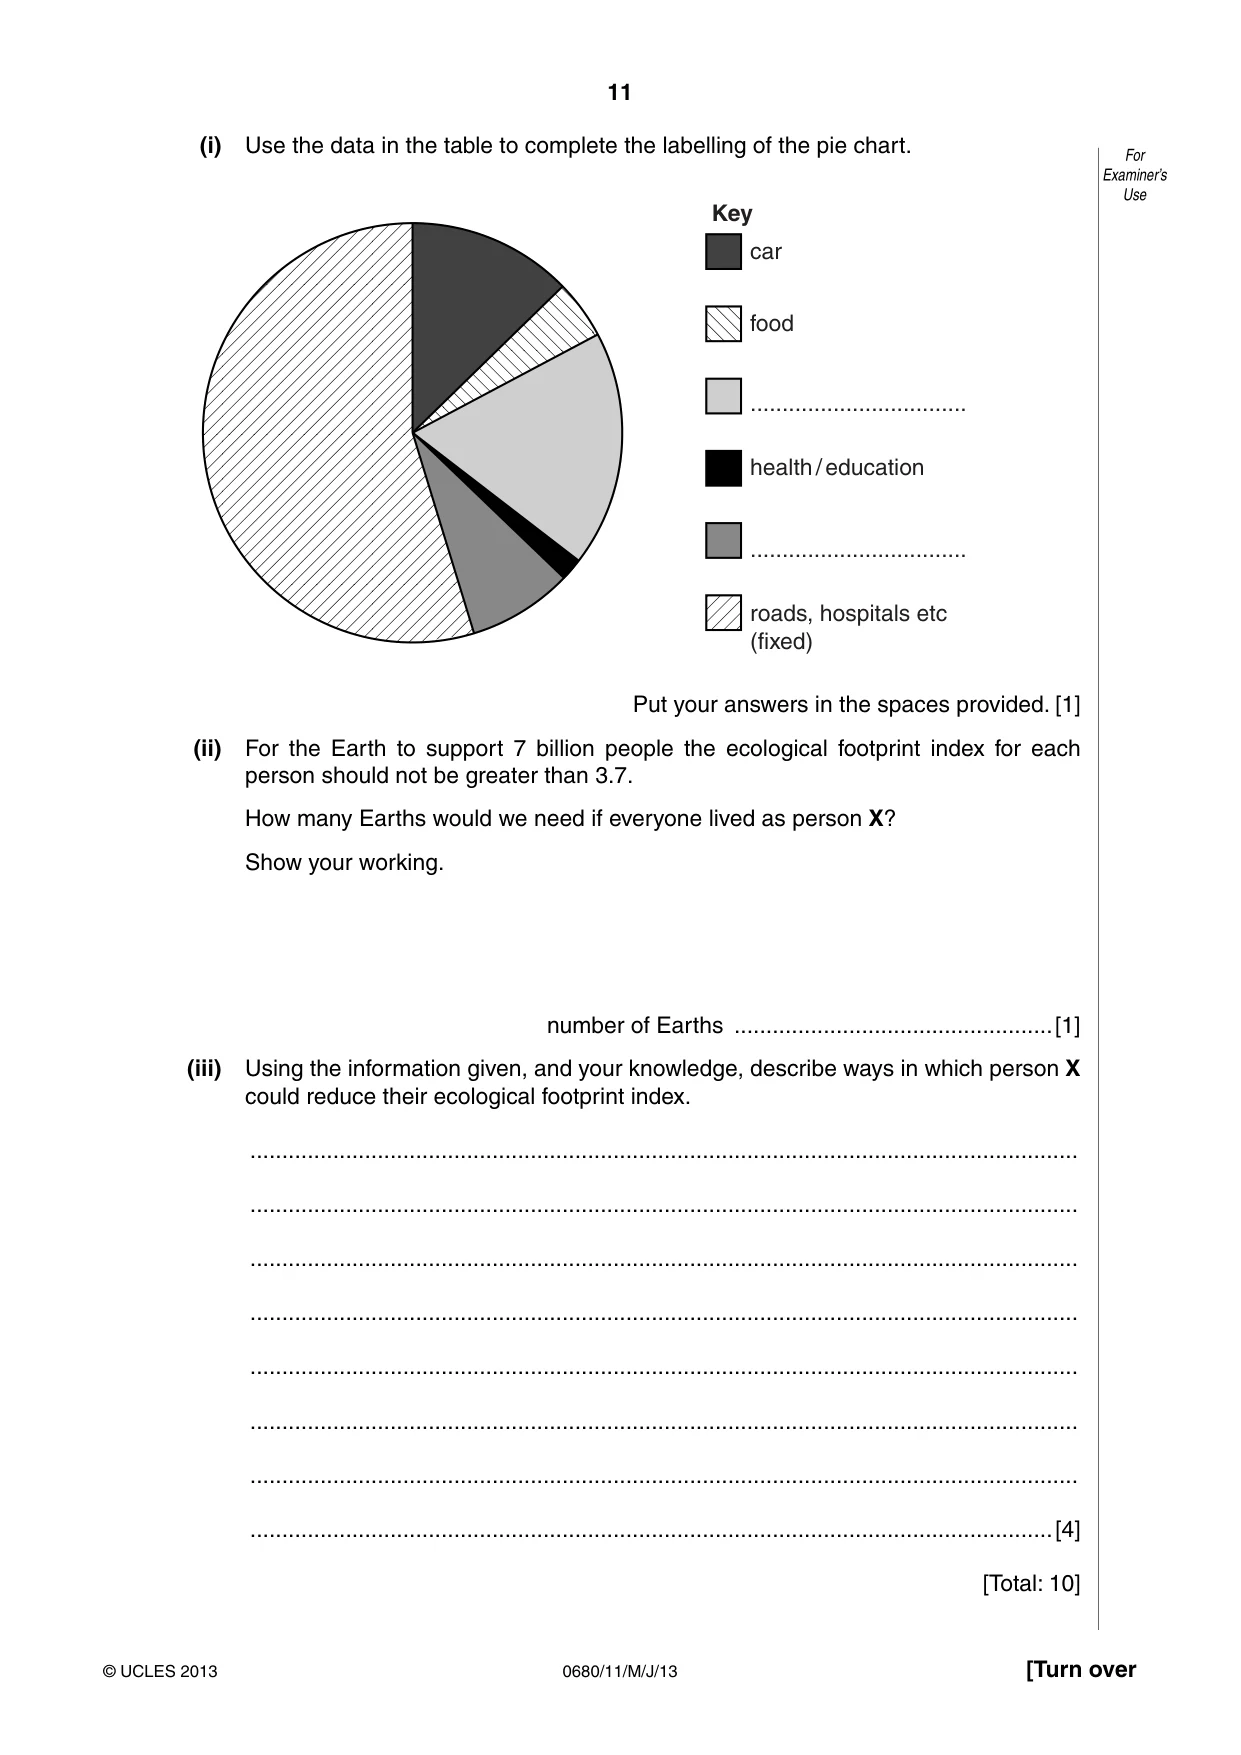
10 0680/11/M/J/13 © UCLES 2013 For Examiner’s Use 3 (a) The impact of humans on the Earth has increased over the last 2000 years due to a big rise in the population and in people’s consumption of natural resources. State and explain two factors which are leading to the rise in population. … … … … … … … …[4] (b) A measure of the impact of a person on the Earth is the ecological footprint. This is made up of some variable factors and some which are fixed, such as provision of roads and hospitals. The table shows the variable factors in the footprint of a person (person X) who lives in the UK (average winter temperature, 4 °C) and: • owns a car, • goes overseas for holidays, • lives in a three bedroom house, • uses electricity generated from fossil fuels, • has roof insulation person X lifestyle feature ecological footprint index car 1.46 food 0.48 house 2.06 health/education 0.22 holiday 0.90 total for variable factors 5.12 In addition, the ecological footprint index due to fixed factors such as provision of roads and hospitals is 6.2, so this gives person X an ecological footprint index of 11.32.
Question paper, page 11
11 0680/11/M/J/13 © UCLES 2013 [Turn over For Examiner’s Use (i) Use the data in the table to complete the labelling of the pie chart. car Key food health / education roads, hospitals etc (fixed) … … Put your answers in the spaces provided. [1] (ii) For the Earth to support 7 billion people the ecological footprint index for each person should not be greater than 3.7. How many Earths would we need if everyone lived as person X? Show your working. number of Earths …[1] (iii) Using the information given, and your knowledge, describe ways in which person X could reduce their ecological footprint index. … … … … … … … …[4] [Total: 10]
Question paper, page 12
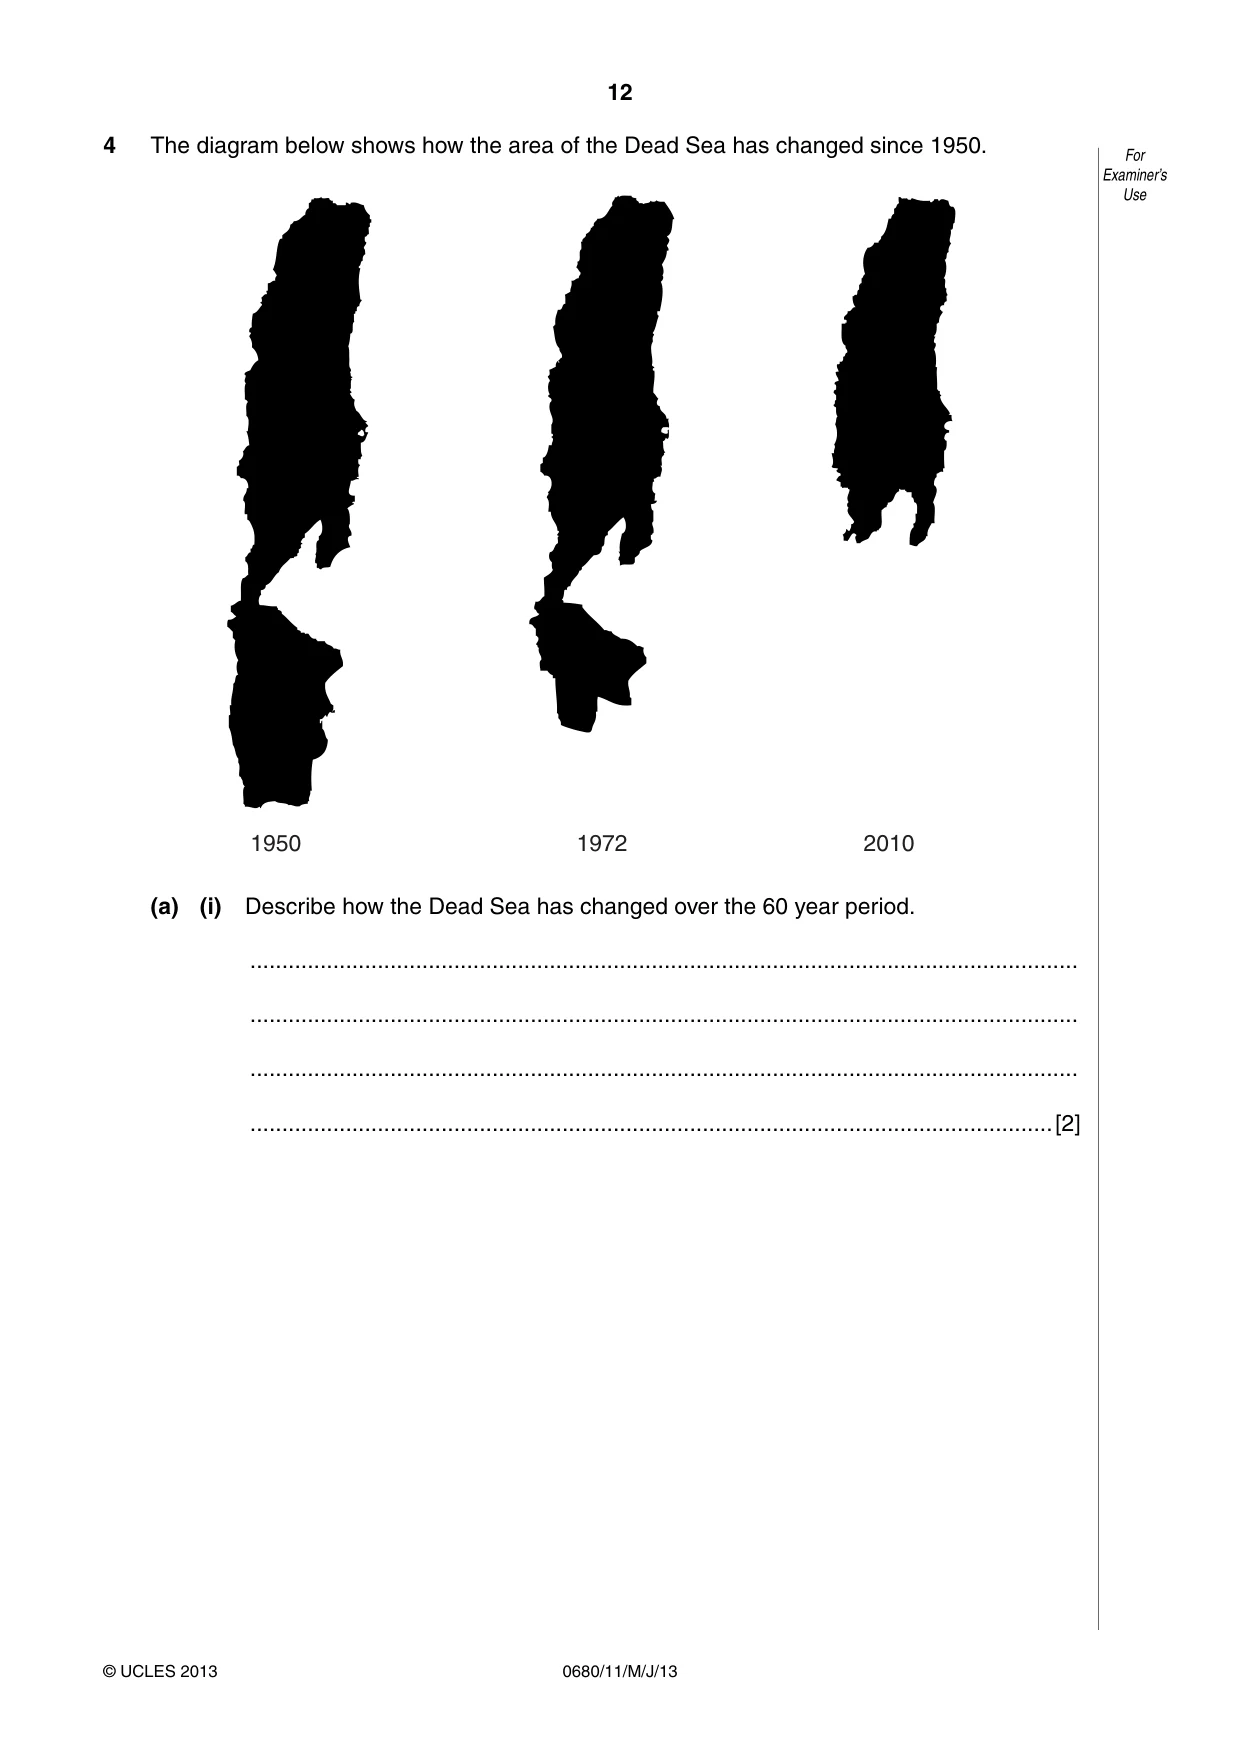
12 0680/11/M/J/13 © UCLES 2013 For Examiner’s Use 4 The diagram below shows how the area of the Dead Sea has changed since 1950. 1950 1972 2010 (a) (i) Describe how the Dead Sea has changed over the 60 year period. … … … …[2]
Question paper, page 13
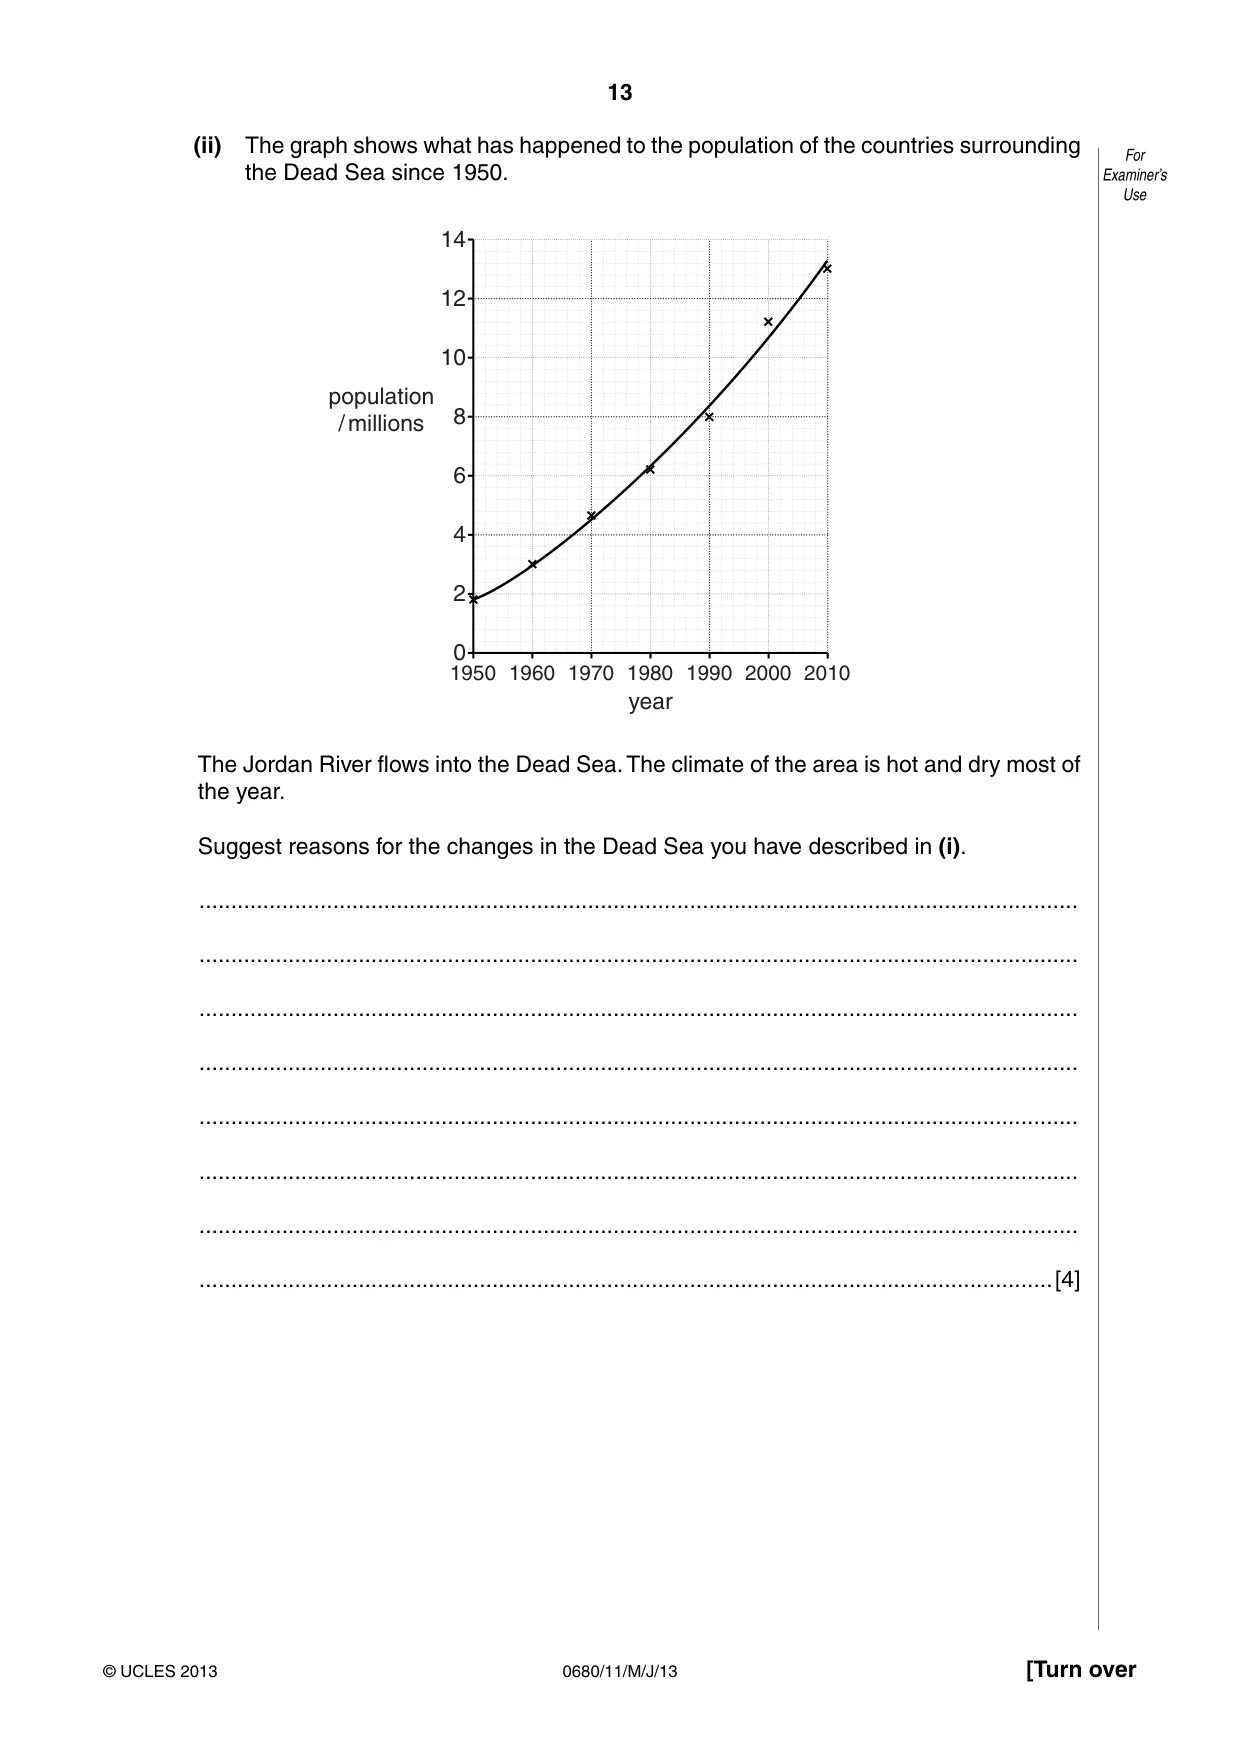
13 0680/11/M/J/13 © UCLES 2013 [Turn over For Examiner’s Use (ii) The graph shows what has happened to the population of the countries surrounding the Dead Sea since 1950. 1950 0 2 4 6 8 10 12 14 1960 1970 1980 year population / millions 1990 2000 2010 The Jordan River flows into the Dead Sea. The climate of the area is hot and dry most of the year. Suggest reasons for the changes in the Dead Sea you have described in (i). … … … … … … … …[4]
Question paper, page 14
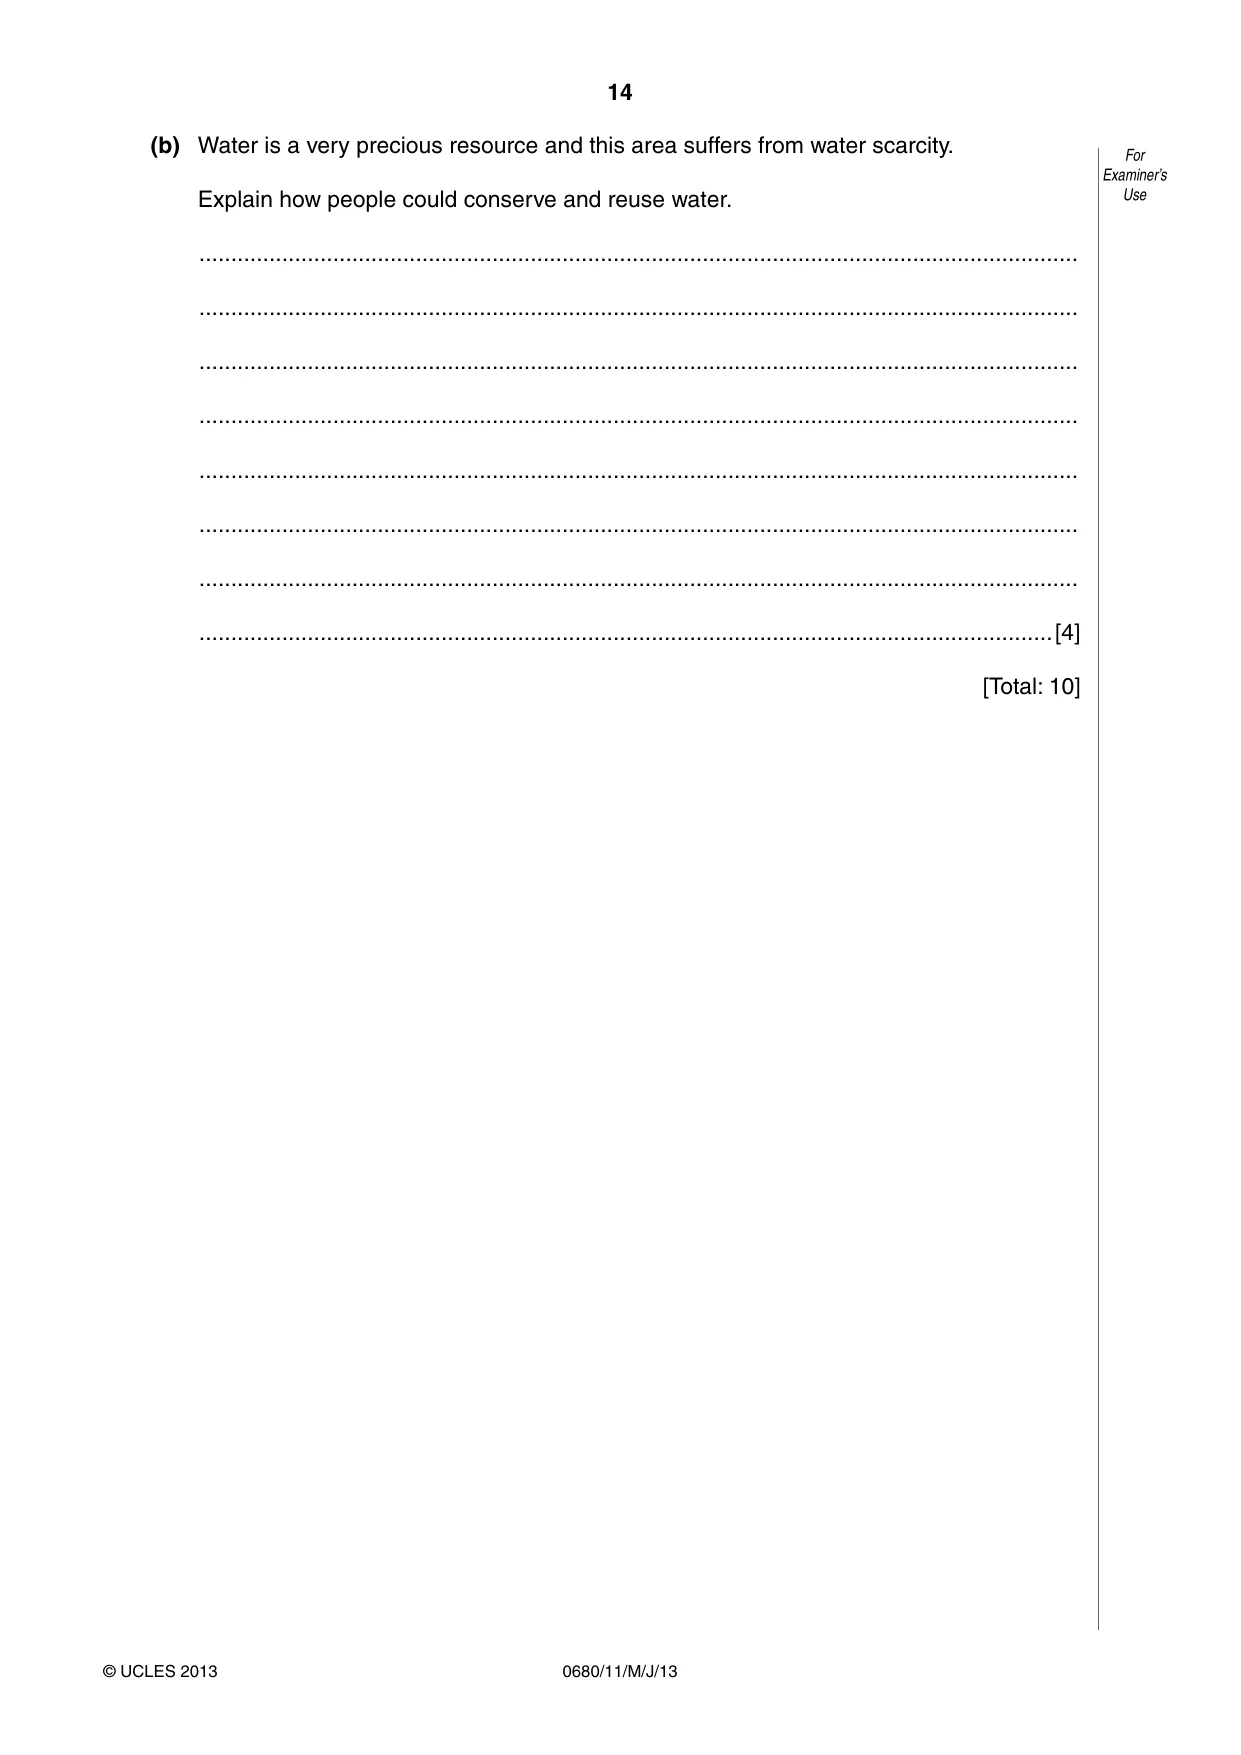
14 0680/11/M/J/13 © UCLES 2013 For Examiner’s Use (b) Water is a very precious resource and this area suffers from water scarcity. Explain how people could conserve and reuse water. … … … … … … … …[4] [Total: 10]
Question paper, page 15
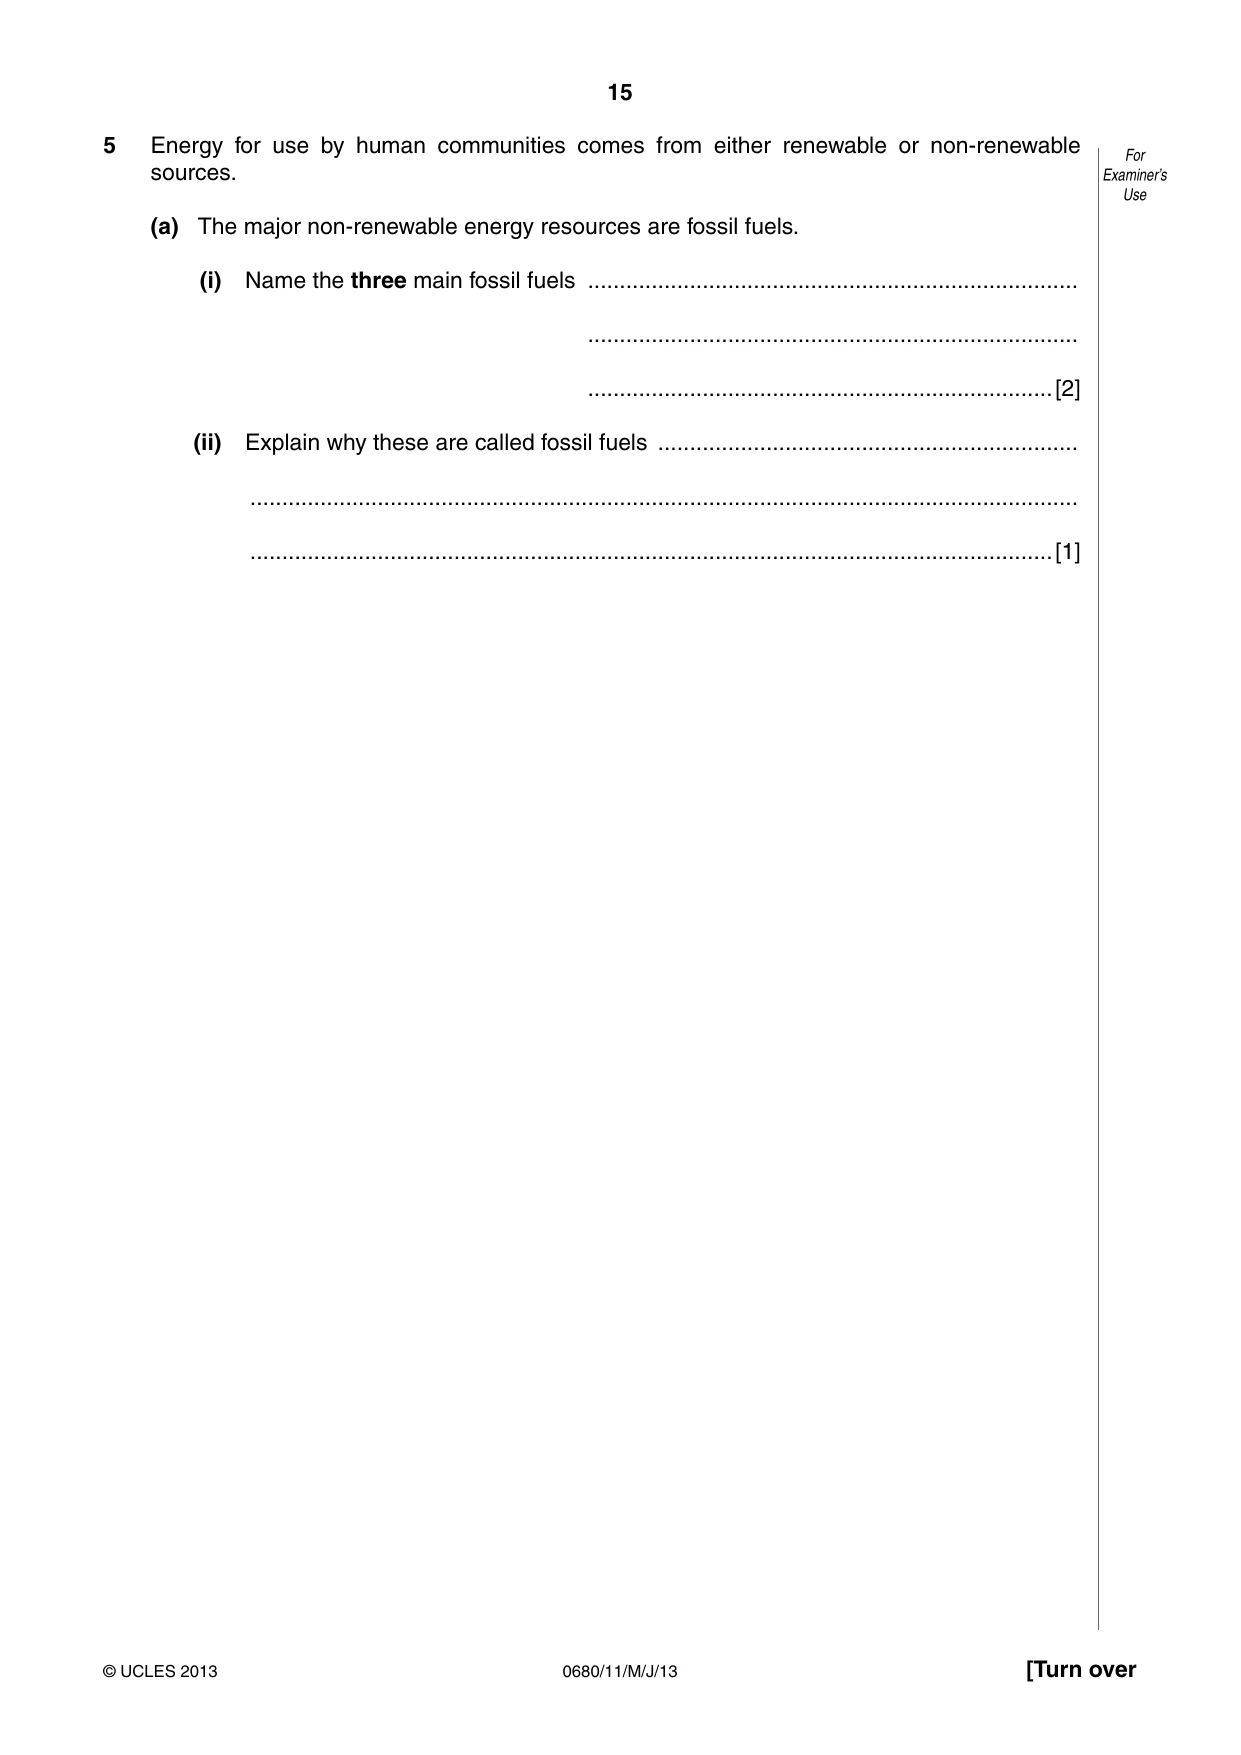
15 0680/11/M/J/13 © UCLES 2013 [Turn over For Examiner’s Use 5 Energy for use by human communities comes from either renewable or non-renewable sources. (a) The major non-renewable energy resources are fossil fuels. (i) Name the three main fossil fuels … … …[2] (ii) Explain why these are called fossil fuels … … …[1]
Question paper, page 16
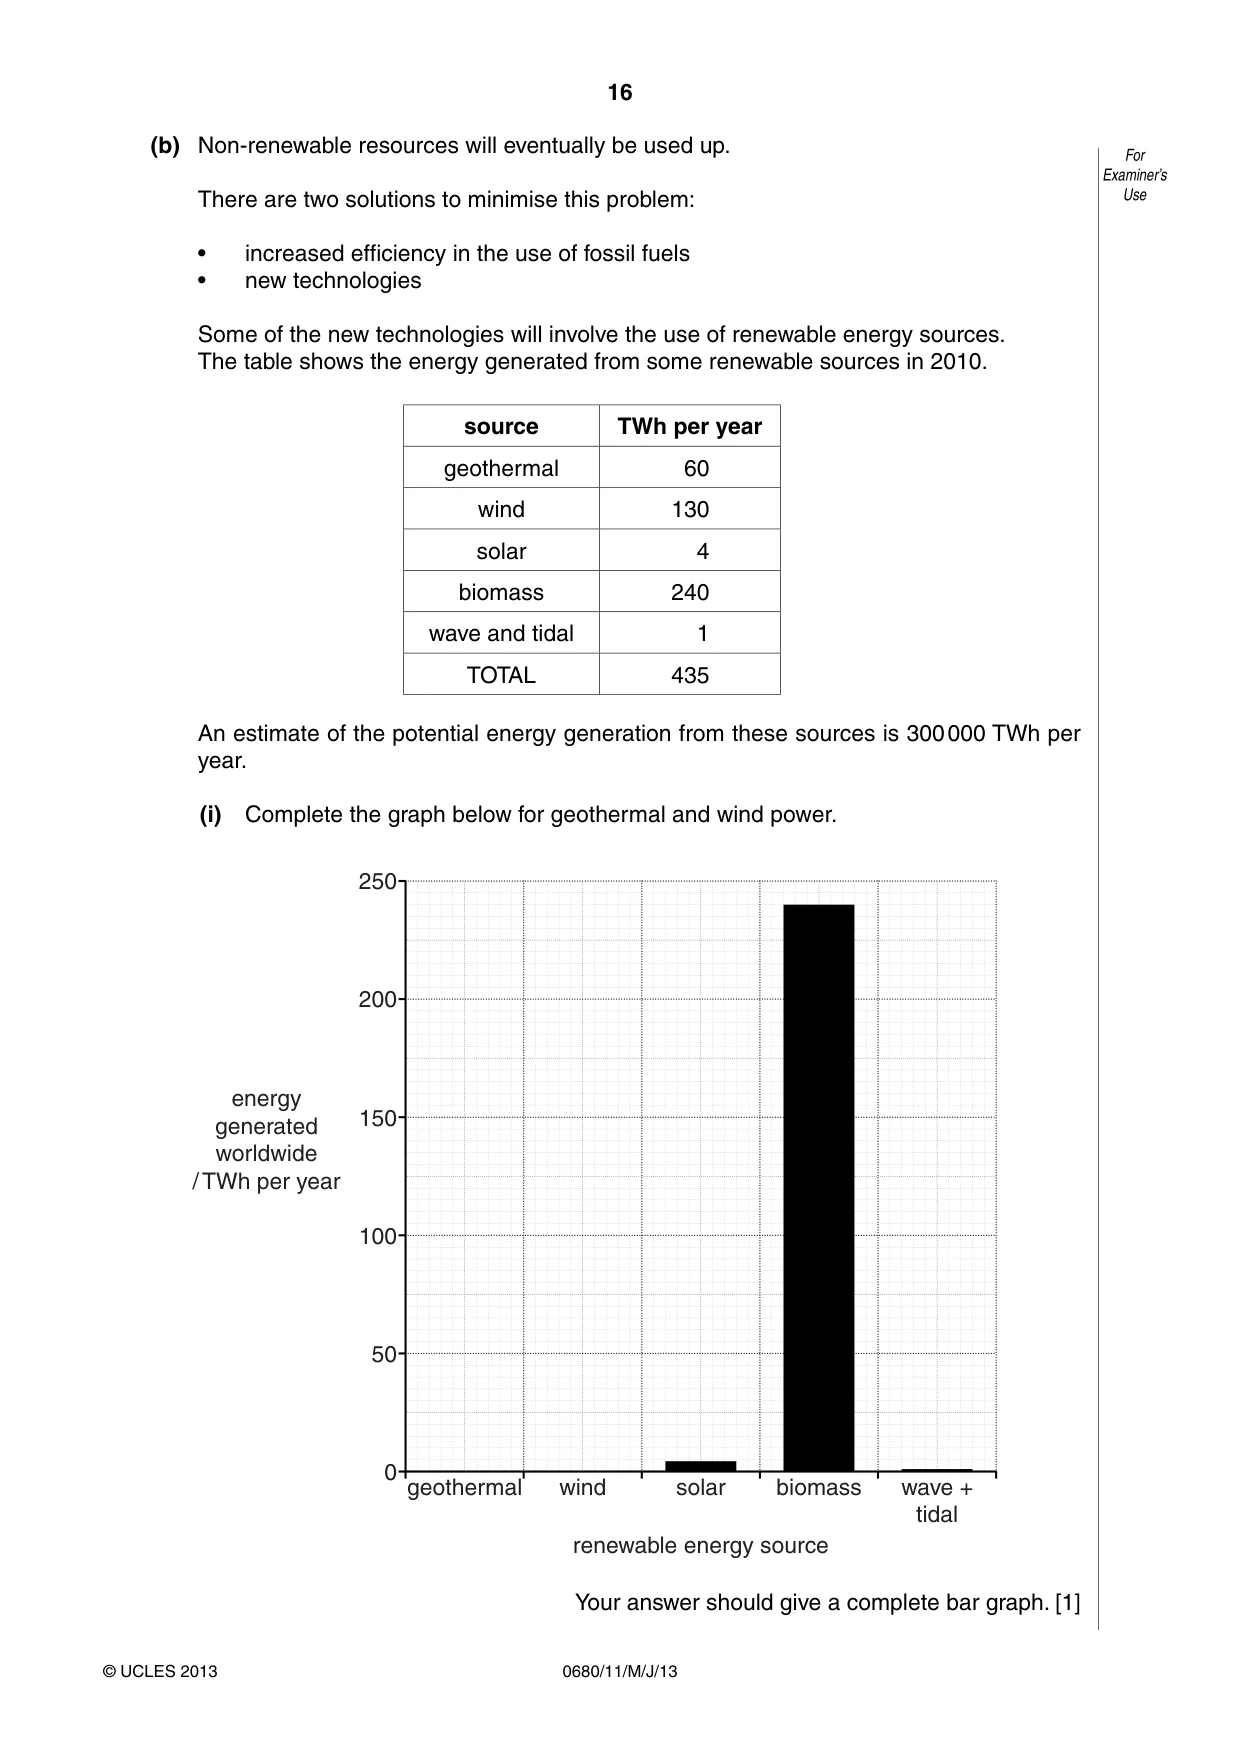
16 0680/11/M/J/13 © UCLES 2013 For Examiner’s Use (b) Non-renewable resources will eventually be used up. There are two solutions to minimise this problem: • increased efficiency in the use of fossil fuels • new technologies Some of the new technologies will involve the use of renewable energy sources. The table shows the energy generated from some renewable sources in 2010. source TWh per year geothermal 60 wind 130 solar 4 biomass 240 wave and tidal 1 TOTAL 435 An estimate of the potential energy generation from these sources is 300 000 TWh per year. (i) Complete the graph below for geothermal and wind power. geothermal 0 100 150 50 200 energy generated worldwide / TWh per year 250 wind solar renewable energy source biomass wave + tidal Your answer should give a complete bar graph. [1]
Question paper, page 17
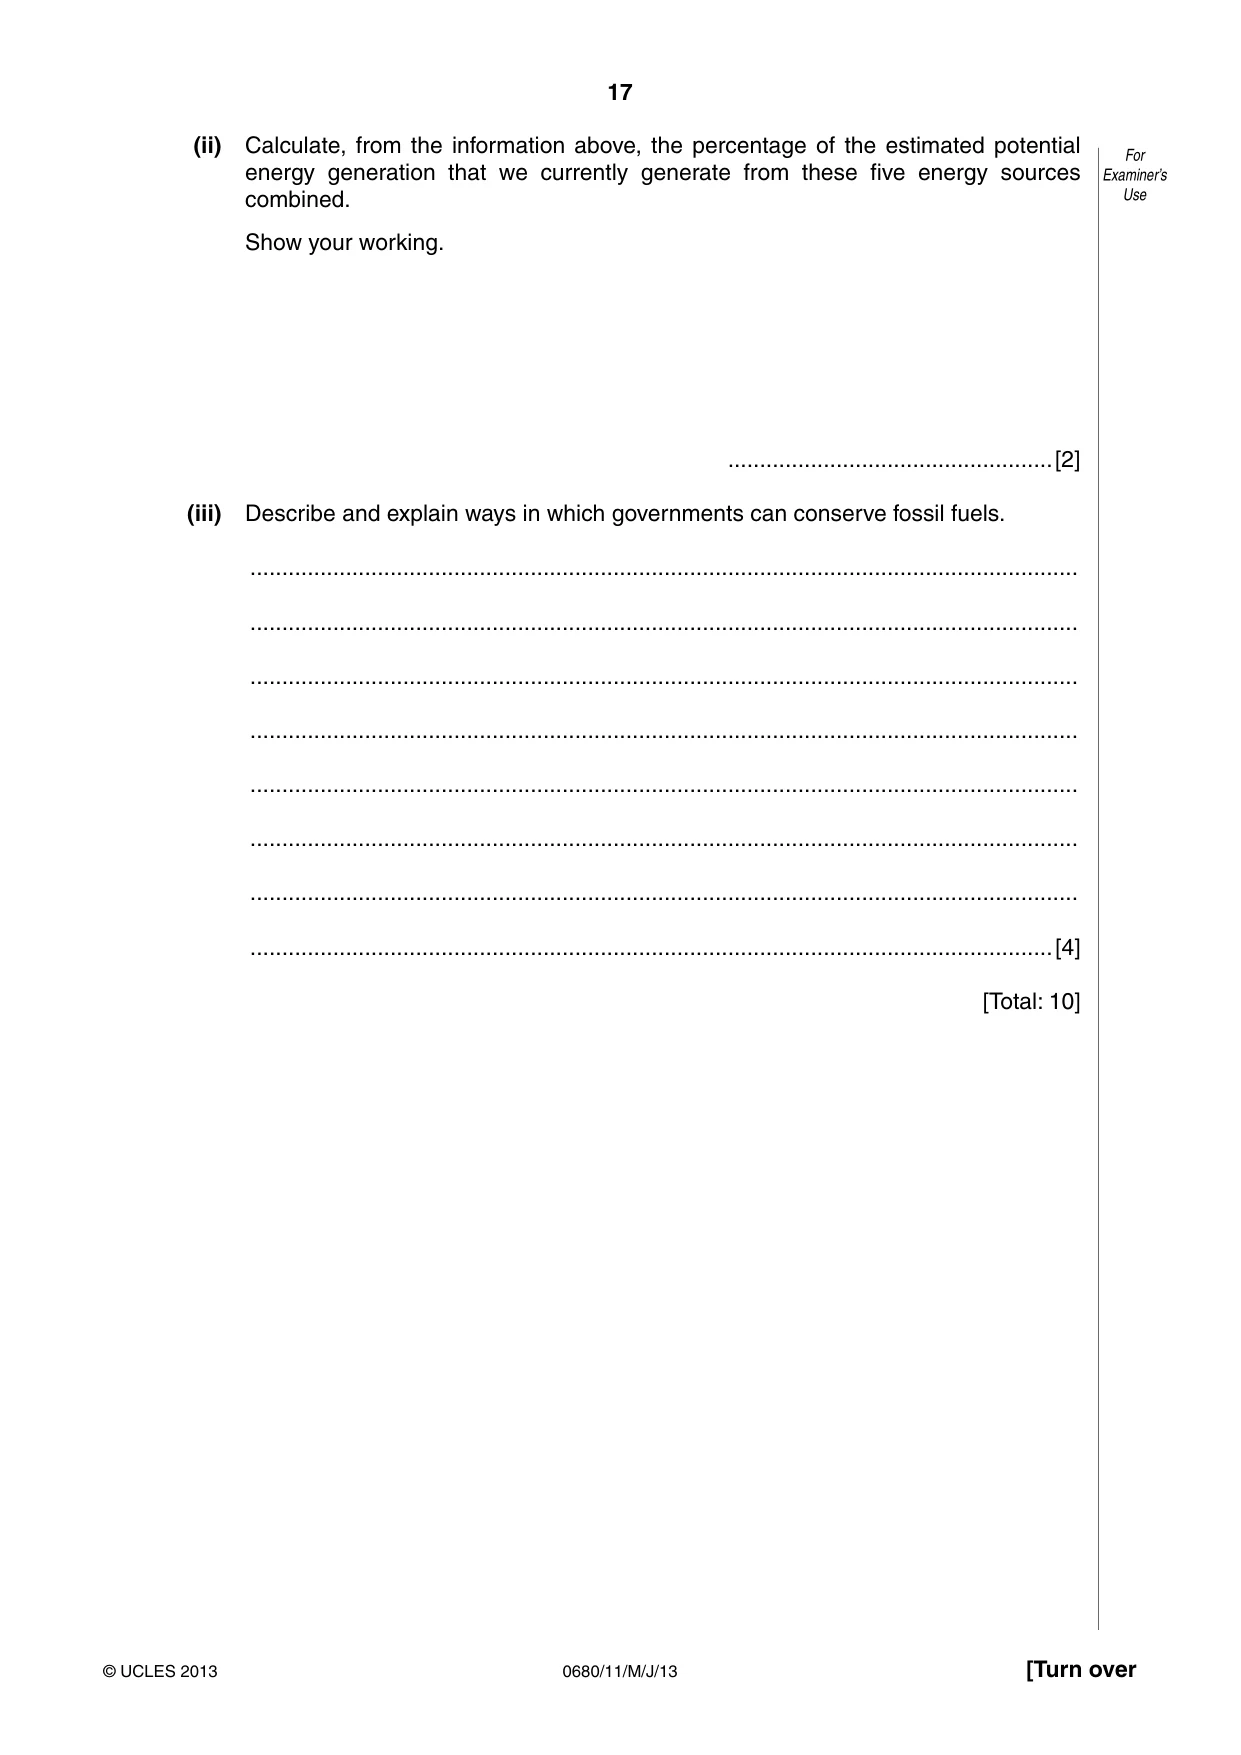
17 0680/11/M/J/13 © UCLES 2013 [Turn over For Examiner’s Use (ii) Calculate, from the information above, the percentage of the estimated potential energy generation that we currently generate from these five energy sources combined. Show your working. …[2] (iii) Describe and explain ways in which governments can conserve fossil fuels. … … … … … … … …[4] [Total: 10]
Question paper, page 18
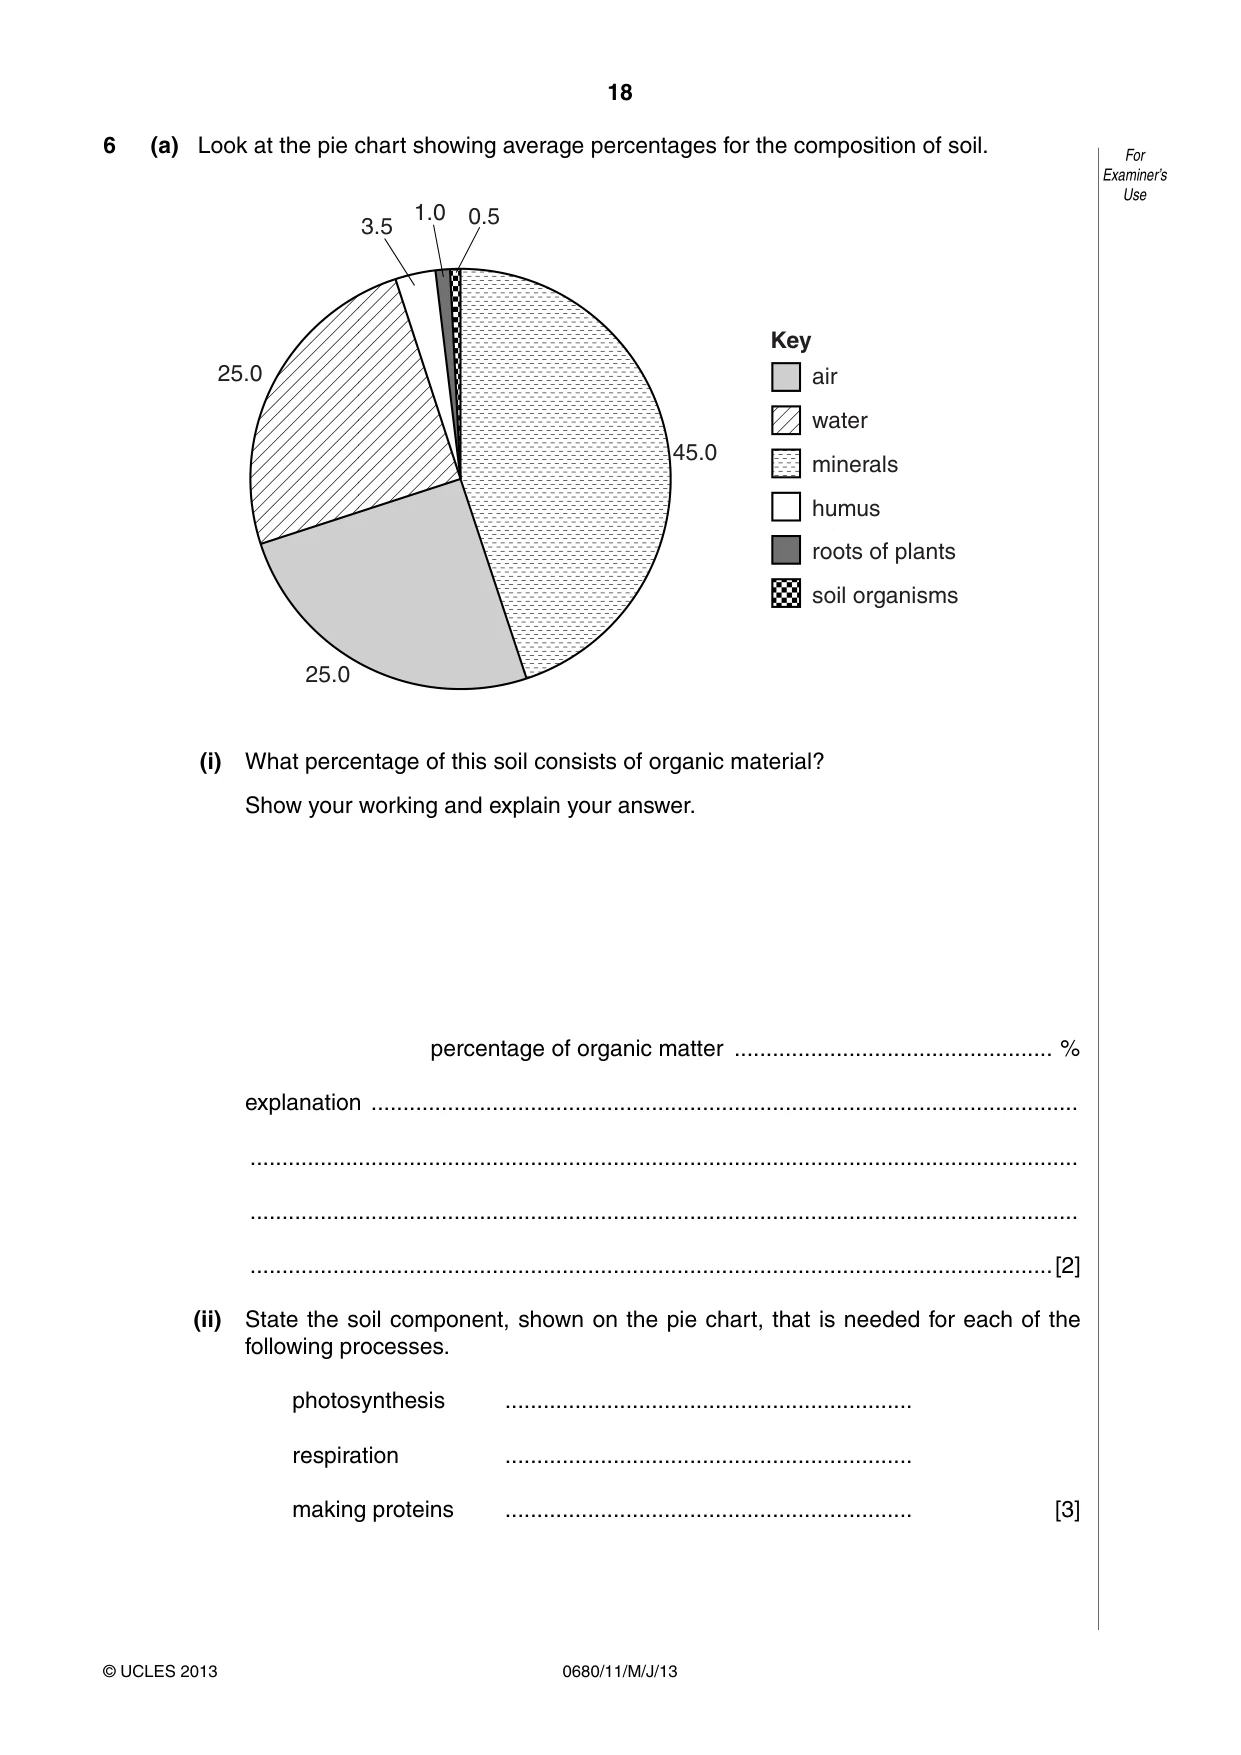
18 0680/11/M/J/13 © UCLES 2013 For Examiner’s Use 6 (a) Look at the pie chart showing average percentages for the composition of soil. air water minerals humus roots of plants soil organisms 25.0 25.0 45.0 3.5 1.0 0.5 Key (i) What percentage of this soil consists of organic material? Show your working and explain your answer. percentage of organic matter … % explanation … … … …[2] (ii) State the soil component, shown on the pie chart, that is needed for each of the following processes. photosynthesis … respiration … making proteins … [3]
Question paper, page 19
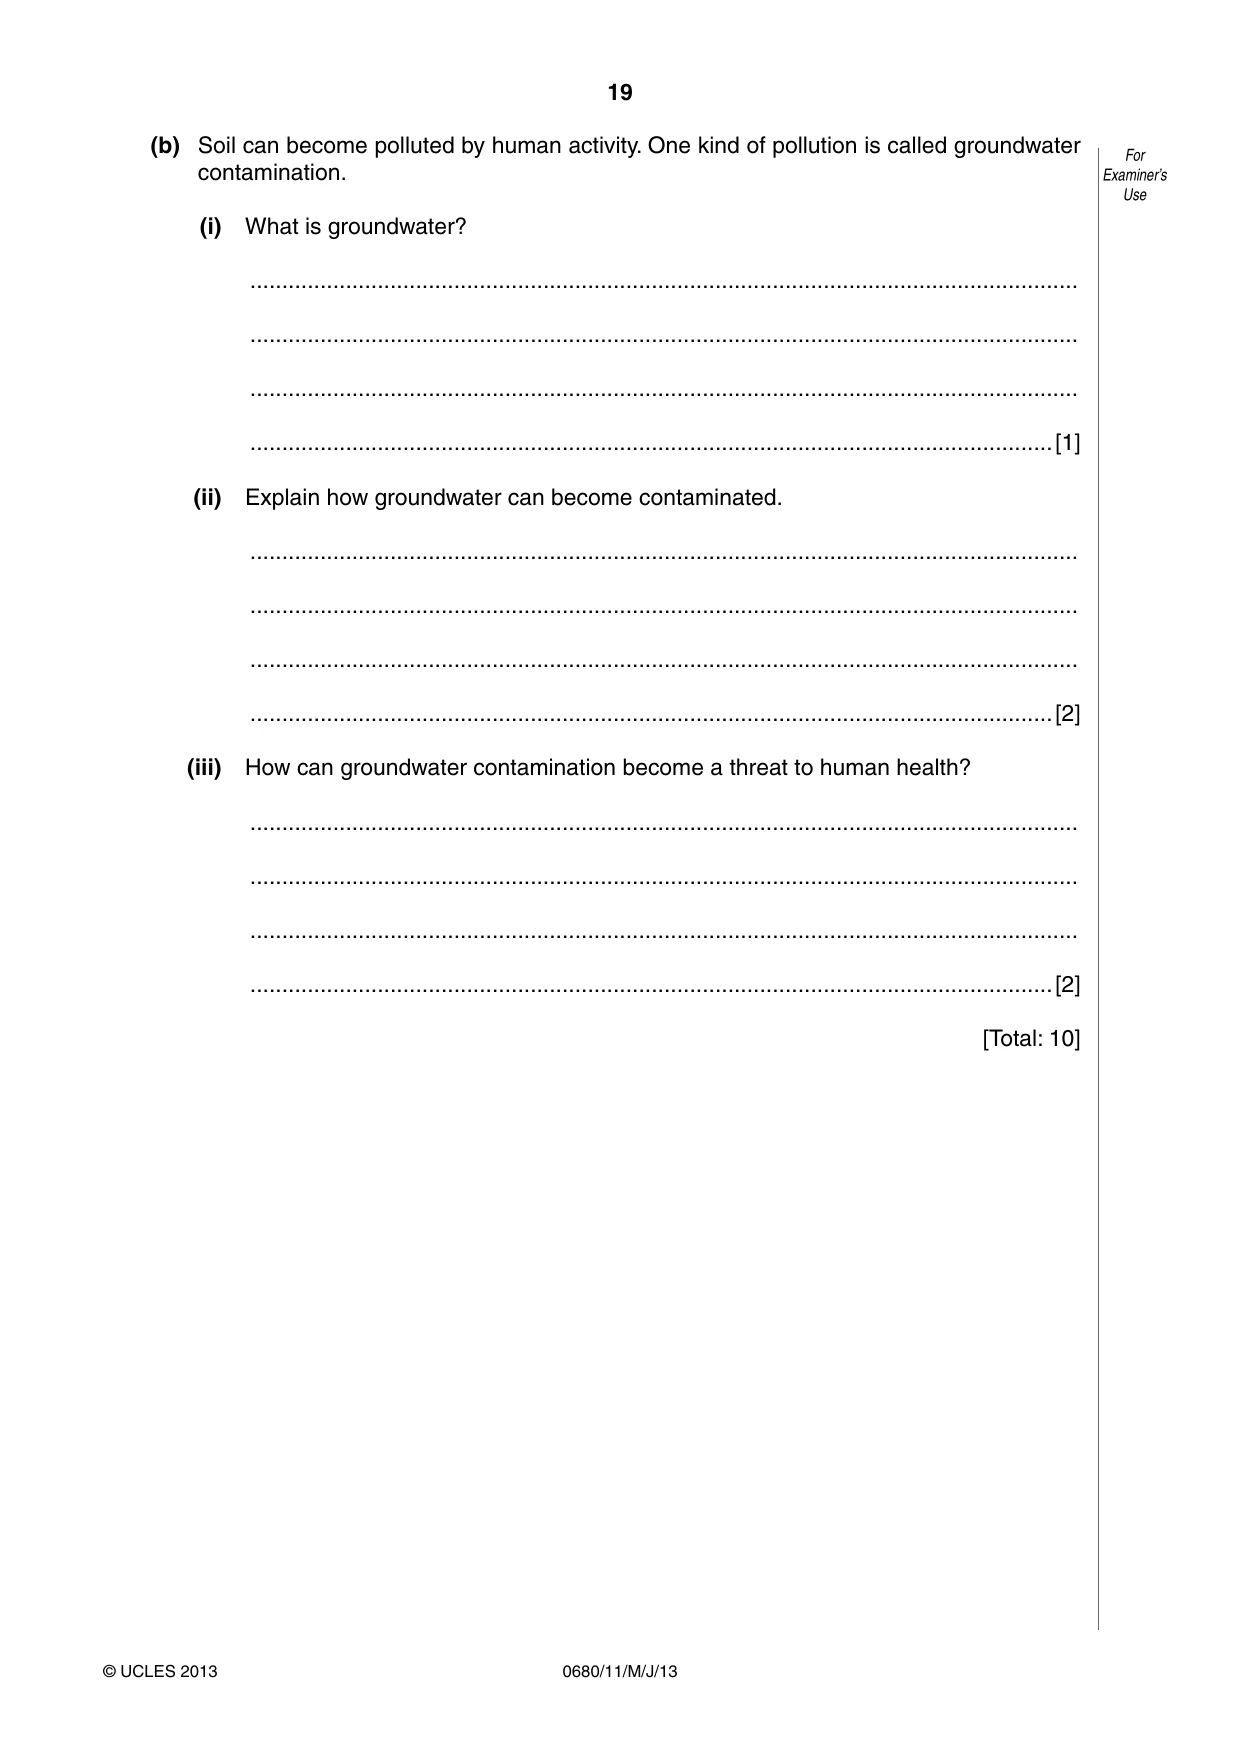
19 0680/11/M/J/13 © UCLES 2013 For Examiner’s Use (b) Soil can become polluted by human activity. One kind of pollution is called groundwater contamination. (i) What is groundwater? … … … …[1] (ii) Explain how groundwater can become contaminated. … … … …[2] (iii) How can groundwater contamination become a threat to human health? … … … …[2] [Total: 10]
Question paper, page 20
20 0680/11/M/J/13 © UCLES 2013 BLANK PAGE Permission to reproduce items where third-party owned material protected by copyright is included has been sought and cleared where possible. Every reasonable effort has been made by the publisher (UCLES) to trace copyright holders, but if any items requiring clearance have unwittingly been included, the publisher will be pleased to make amends at the earliest possible opportunity. University of Cambridge International Examinations is part of the Cambridge Assessment Group. Cambridge Assessment is the brand name of University of Cambridge Local Examinations Syndicate (UCLES), which is itself a department of the University of Cambridge.
Mark scheme, page 1
CAMBRIDGE INTERNATIONAL EXAMINATIONS International General Certificate of Secondary Education MARK SCHEME for the May/June 2013 series 0680 ENVIRONMENTAL MANAGEMENT 0680/11 Paper 1, maximum raw mark 60 This mark scheme is published as an aid to teachers and candidates, to indicate the requirements of the examination. It shows the basis on which Examiners were instructed to award marks. It does not indicate the details of the discussions that took place at an Examiners’ meeting before marking began, which would have considered the acceptability of alternative answers. Mark schemes should be read in conjunction with the question paper and the Principal Examiner Report for Teachers. Cambridge will not enter into discussions about these mark schemes. Cambridge is publishing the mark schemes for the May/June 2013 series for most IGCSE, GCE Advanced Level and Advanced Subsidiary Level components and some Ordinary Level components.
Mark scheme, page 2
Page 2 Mark Scheme Syllabus Paper IGCSE – May/June 2013 0680 11 © Cambridge International Examinations 2013 General notes Symbols used in Environmental Management mark schemes. / separates alternatives for a marking point – other valid ways of expressing the same idea are also credited ; separates points for the award of a mark [3] indicates the number of marks available italic indicates that this is information about the marking points and is not required to gain credit italic text is also used for comments about alternatives that should be accepted, ignored or rejected ora or reverse argument – shows that an argument from an alternative viewpoint will be credited AW alternative wording, sometimes called ‘or words to that effect’ – AW is used when there are many different ways of expressing the same idea ( ) the word / phrase in brackets is not required to gain marks but sets the context of the response for credit e.g. (nuclear) waste – nuclear is not needed but if it was described as a domestic waste then no mark is awarded volcanic underlined words – the answer must contain exactly this word ecf error carried forward – if an incorrect answer is given to part of a question, and this answer is subsequently used by a candidate in later parts of the question, this indicates that the candidate’s incorrect answer will be used as a starting point for marking the later parts of the question
Mark scheme, page 3
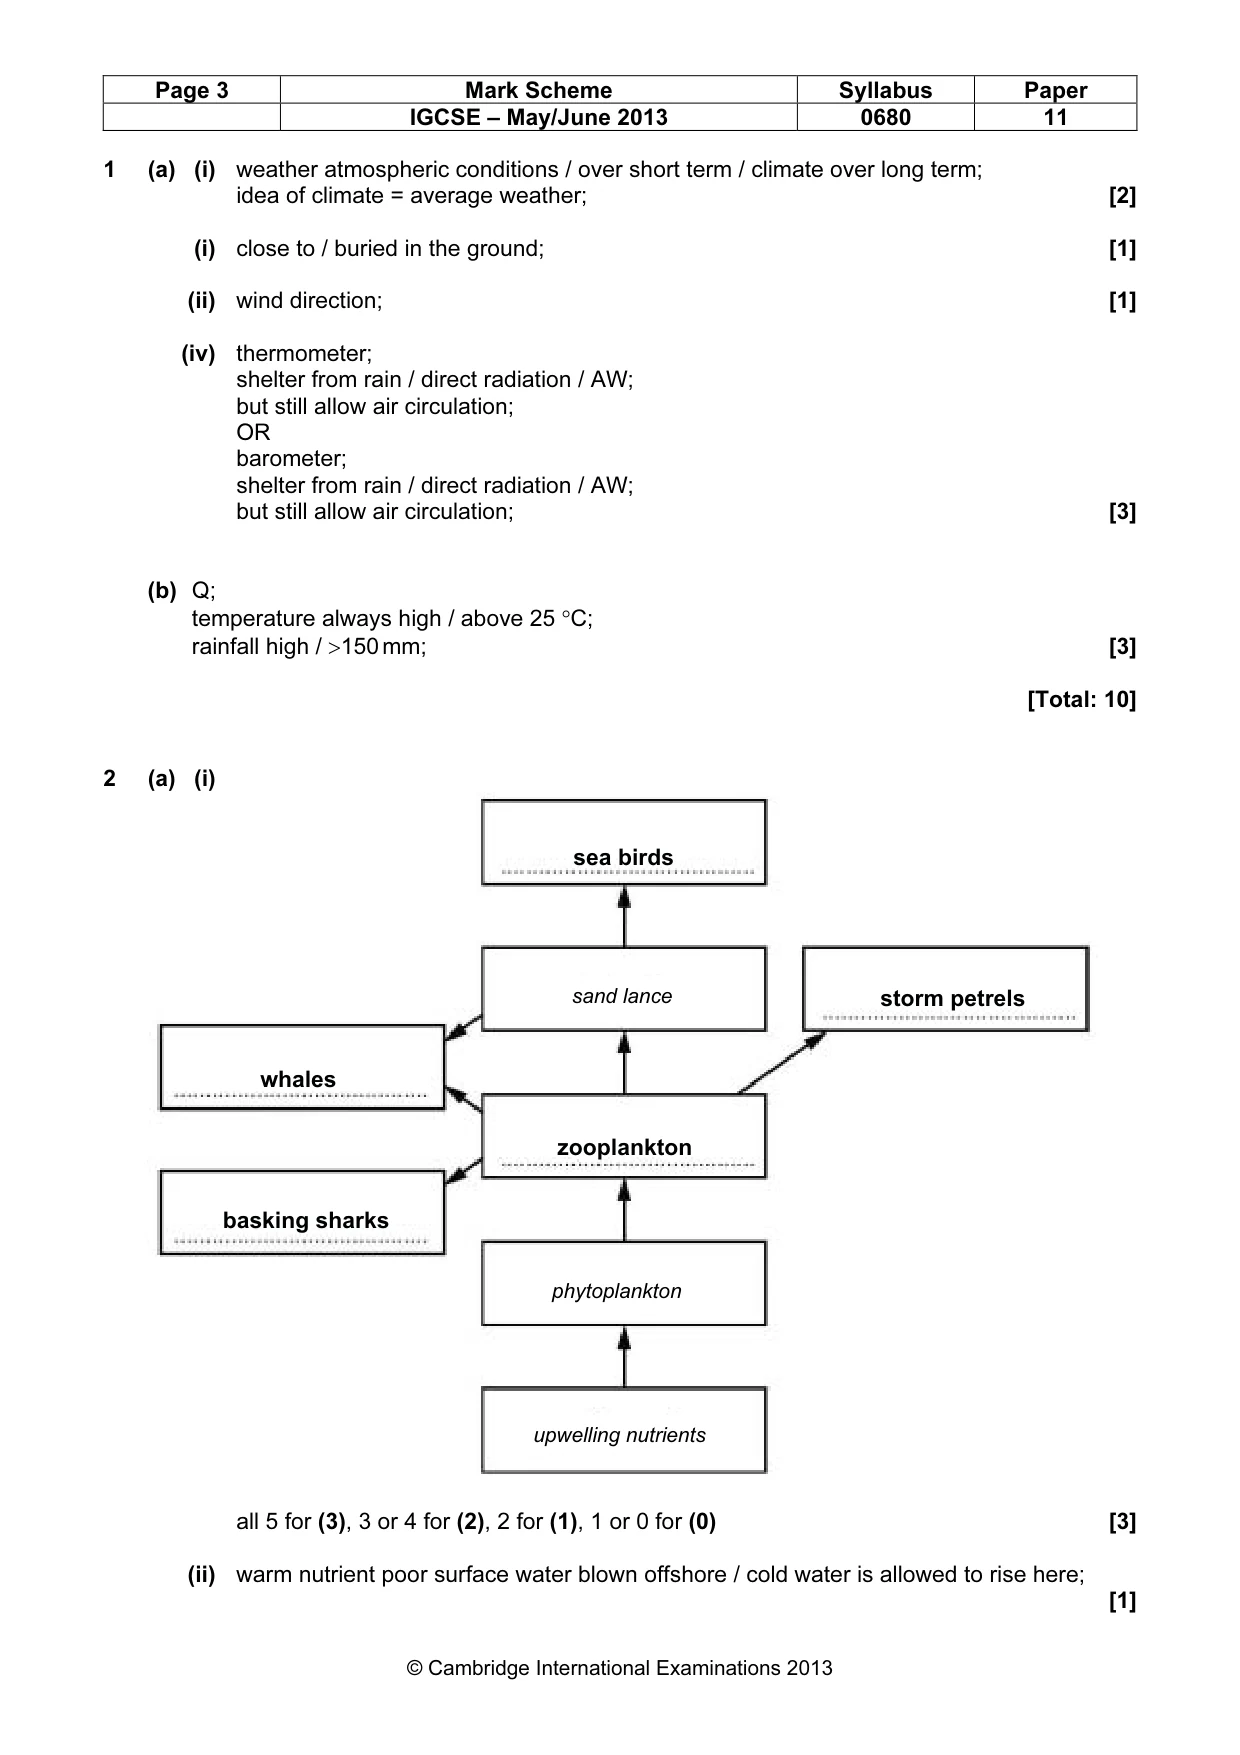
Page 3 Mark Scheme Syllabus Paper IGCSE – May/June 2013 0680 11 © Cambridge International Examinations 2013 1 (a) (i) weather atmospheric conditions / over short term / climate over long term; idea of climate = average weather; [2] (i) close to / buried in the ground; [1] (ii) wind direction; [1] (iv) thermometer; shelter from rain / direct radiation / AW; but still allow air circulation; OR barometer; shelter from rain / direct radiation / AW; but still allow air circulation; [3] (b) Q; temperature always high / above 25 °C; rainfall high / >150 mm; [3] [Total: 10] 2 (a) (i) all 5 for (3), 3 or 4 for (2), 2 for (1), 1 or 0 for (0) [3] (ii) warm nutrient poor surface water blown offshore / cold water is allowed to rise here; [1] zooplankton sea birds storm petrels whales basking sharks sand lance phytoplankton upwelling nutrients
Mark scheme, page 4
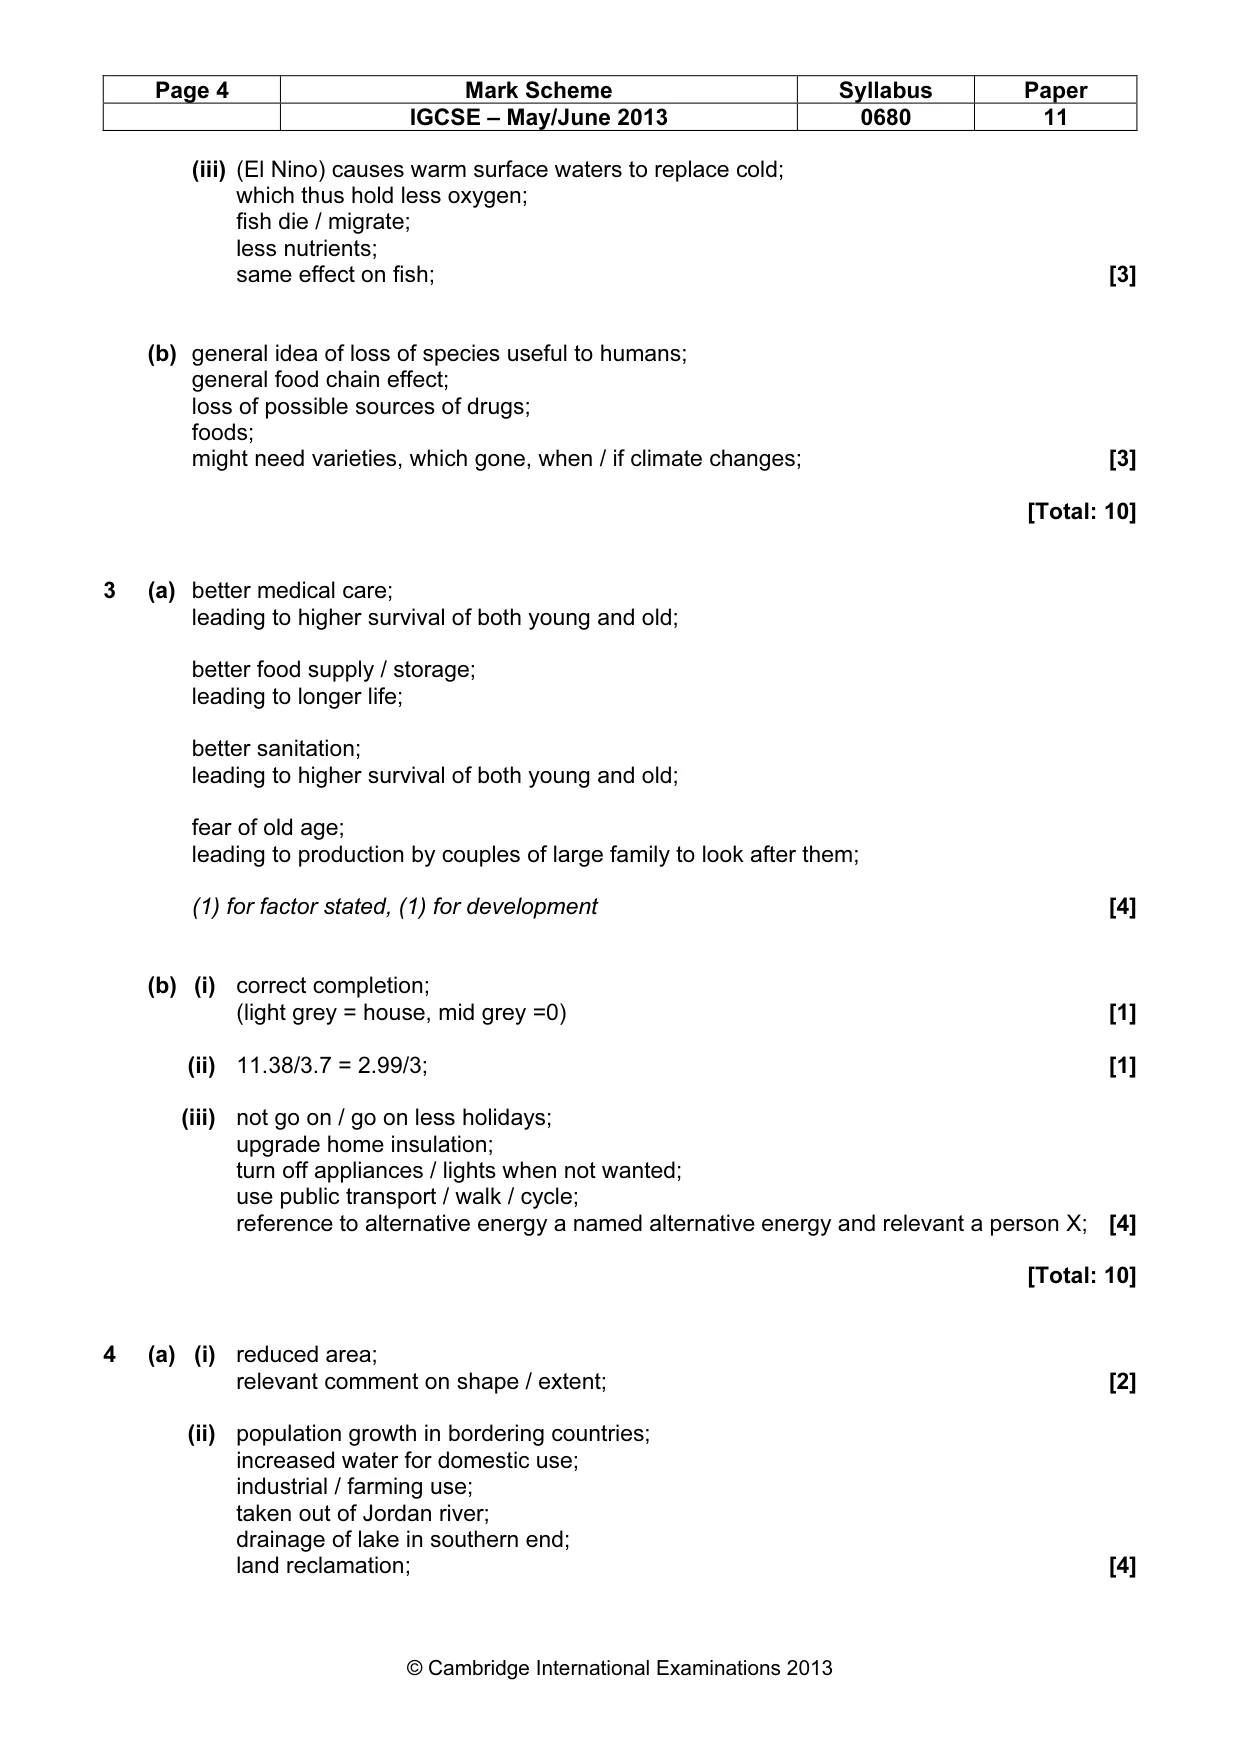
Page 4 Mark Scheme Syllabus Paper IGCSE – May/June 2013 0680 11 © Cambridge International Examinations 2013 (iii) (El Nino) causes warm surface waters to replace cold; which thus hold less oxygen; fish die / migrate; less nutrients; same effect on fish; [3] (b) general idea of loss of species useful to humans; general food chain effect; loss of possible sources of drugs; foods; might need varieties, which gone, when / if climate changes; [3] [Total: 10] 3 (a) better medical care; leading to higher survival of both young and old; better food supply / storage; leading to longer life; better sanitation; leading to higher survival of both young and old; fear of old age; leading to production by couples of large family to look after them; (1) for factor stated, (1) for development [4] (b) (i) correct completion; (light grey = house, mid grey =0) [1] (ii) 11.38/3.7 = 2.99/3; [1] (iii) not go on / go on less holidays; upgrade home insulation; turn off appliances / lights when not wanted; use public transport / walk / cycle; reference to alternative energy a named alternative energy and relevant a person X; [4] [Total: 10] 4 (a) (i) reduced area; relevant comment on shape / extent; [2] (ii) population growth in bordering countries; increased water for domestic use; industrial / farming use; taken out of Jordan river; drainage of lake in southern end; land reclamation; [4]
Mark scheme, page 5
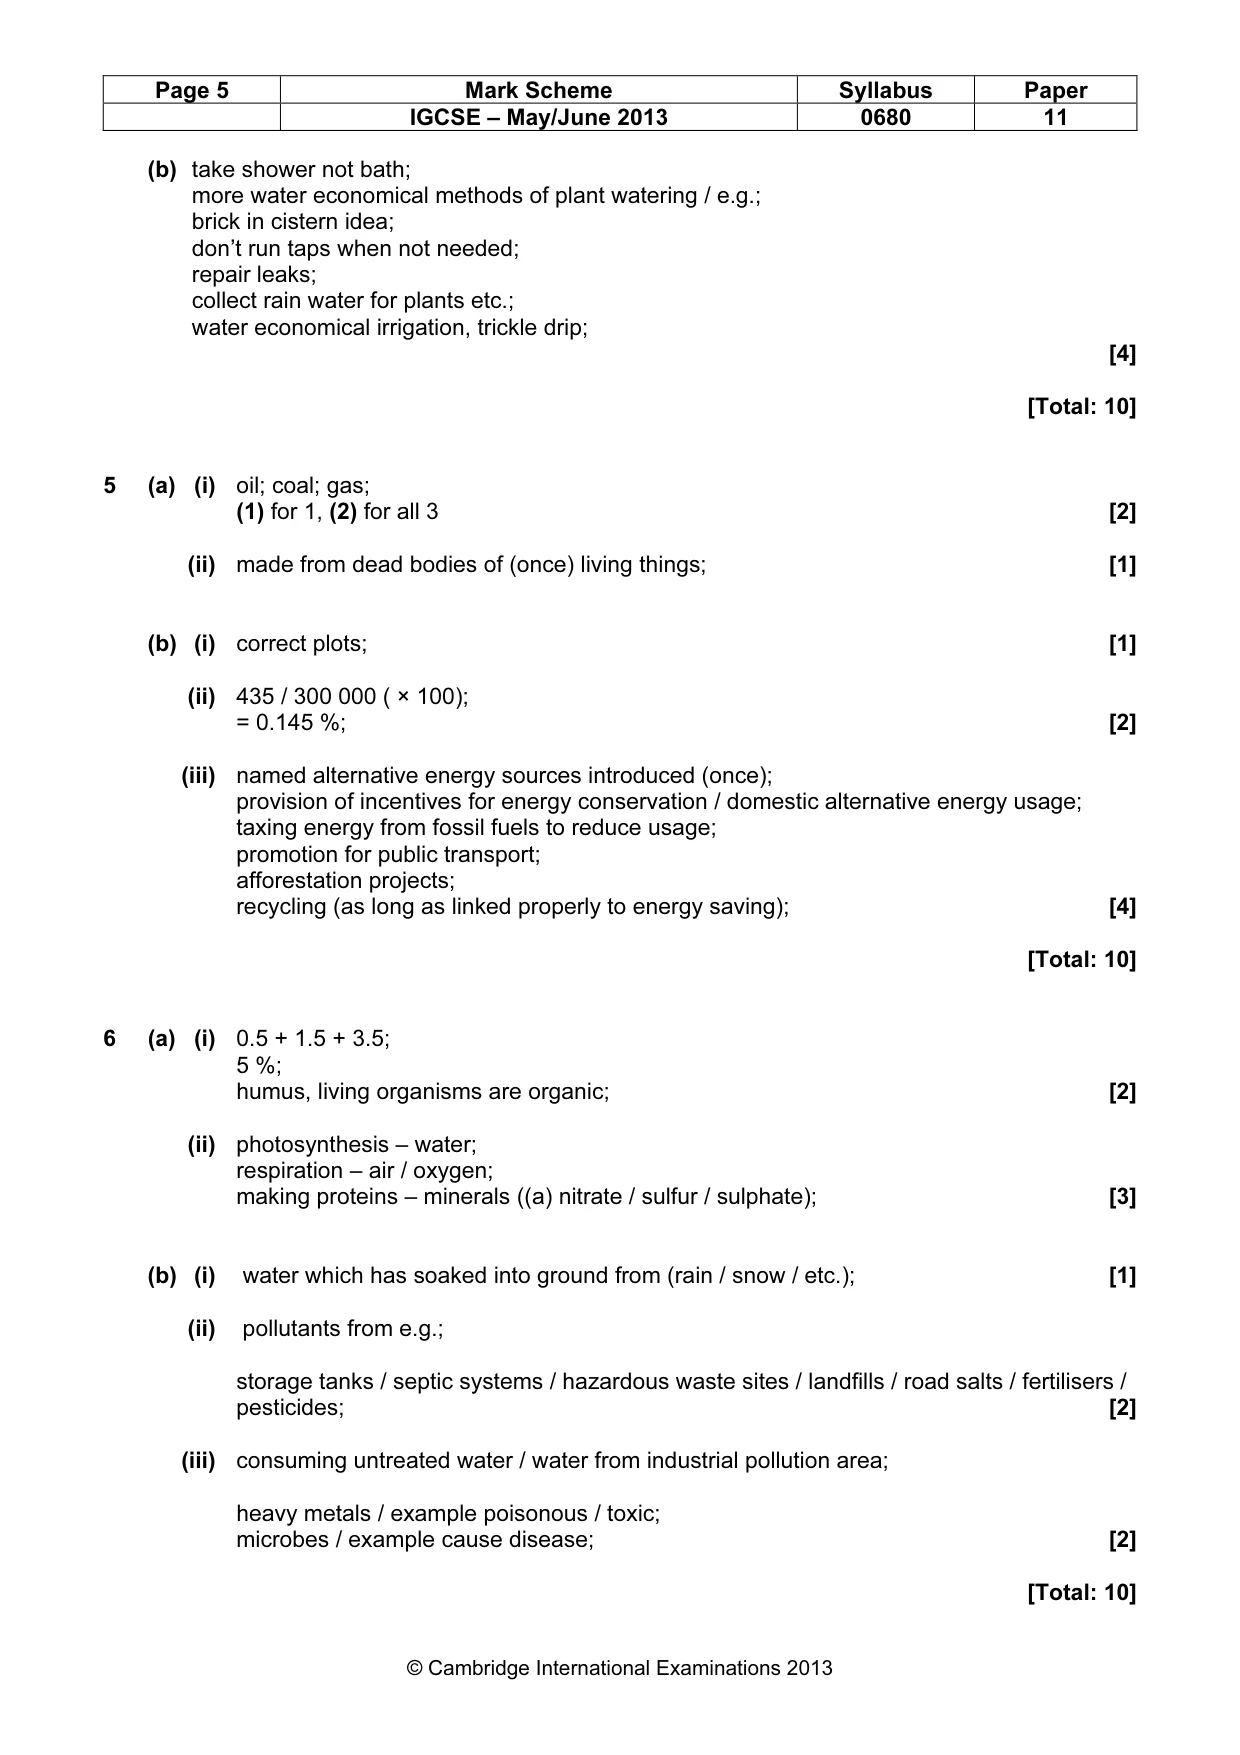
Page 5 Mark Scheme Syllabus Paper IGCSE – May/June 2013 0680 11 © Cambridge International Examinations 2013 (b) take shower not bath; more water economical methods of plant watering / e.g.; brick in cistern idea; don’t run taps when not needed; repair leaks; collect rain water for plants etc.; water economical irrigation, trickle drip; [4] [Total: 10] 5 (a) (i) oil; coal; gas; (1) for 1, (2) for all 3 [2] (ii) made from dead bodies of (once) living things; [1] (b) (i) correct plots; [1] (ii) 435 / 300 000 ( × 100); = 0.145 %; [2] (iii) named alternative energy sources introduced (once); provision of incentives for energy conservation / domestic alternative energy usage; taxing energy from fossil fuels to reduce usage; promotion for public transport; afforestation projects; recycling (as long as linked properly to energy saving); [4] [Total: 10] 6 (a) (i) 0.5 + 1.5 + 3.5; 5 %; humus, living organisms are organic; [2] (ii) photosynthesis – water; respiration – air / oxygen; making proteins – minerals ((a) nitrate / sulfur / sulphate); [3] (b) (i) water which has soaked into ground from (rain / snow / etc.); [1] (ii) pollutants from e.g.; storage tanks / septic systems / hazardous waste sites / landfills / road salts / fertilisers / pesticides; [2] (iii) consuming untreated water / water from industrial pollution area; heavy metals / example poisonous / toxic; microbes / example cause disease; [2] [Total: 10]
What you needed in this session
Cambridge’s own grade thresholds for 2013 May/June, Paper 1 · Variant 1. A higher threshold means an easier paper — the bar moves with how the cohort did.