Cambridge IGCSE Environmental Management 0680 — 2010 Oct/Nov Paper 2 · Variant 1
0680/21/O/N/10 · 80 marks · ≈90 min
The question paper and its mark scheme, free to read here and free to download. This is Cambridge’s own paper, exactly as it was sat.
Question paper16 pages
Mark scheme7 pages
Answers below. Sit the paper first if you are practising.
Paper as text
Question paper, page 1
This document consists of 16 printed pages. DC (SHW/CGW 00488 5/09) 14792/6 © UCLES 2010 [Turn over UNIVERSITY OF CAMBRIDGE INTERNATIONAL EXAMINATIONS International General Certificate of Secondary Education READ THESE INSTRUCTIONS FIRST Write your Centre number, candidate number and name on all the work you hand in. Write in dark blue or black pen. You may use a soft pencil for any diagrams, graphs or rough working. Do not use staples, paper clips, highlighters, glue or correction fluid. DO NOT WRITE IN ANY BARCODES. Answer both questions. At the end of the examination, fasten all your work securely together. The number of marks is given in brackets [ ] at the end of each question or part question. * 1 8 5 5 1 1 0 7 8 0 * ENVIRONMENTAL MANAGEMENT 0680/21 Paper 2 October/November 2010 1 hour 45 minutes Candidates answer on the Question Paper. Additional Materials: Ruler For Examiner’s Use 1 2 Total www.XtremePapers.com
Question paper, page 2
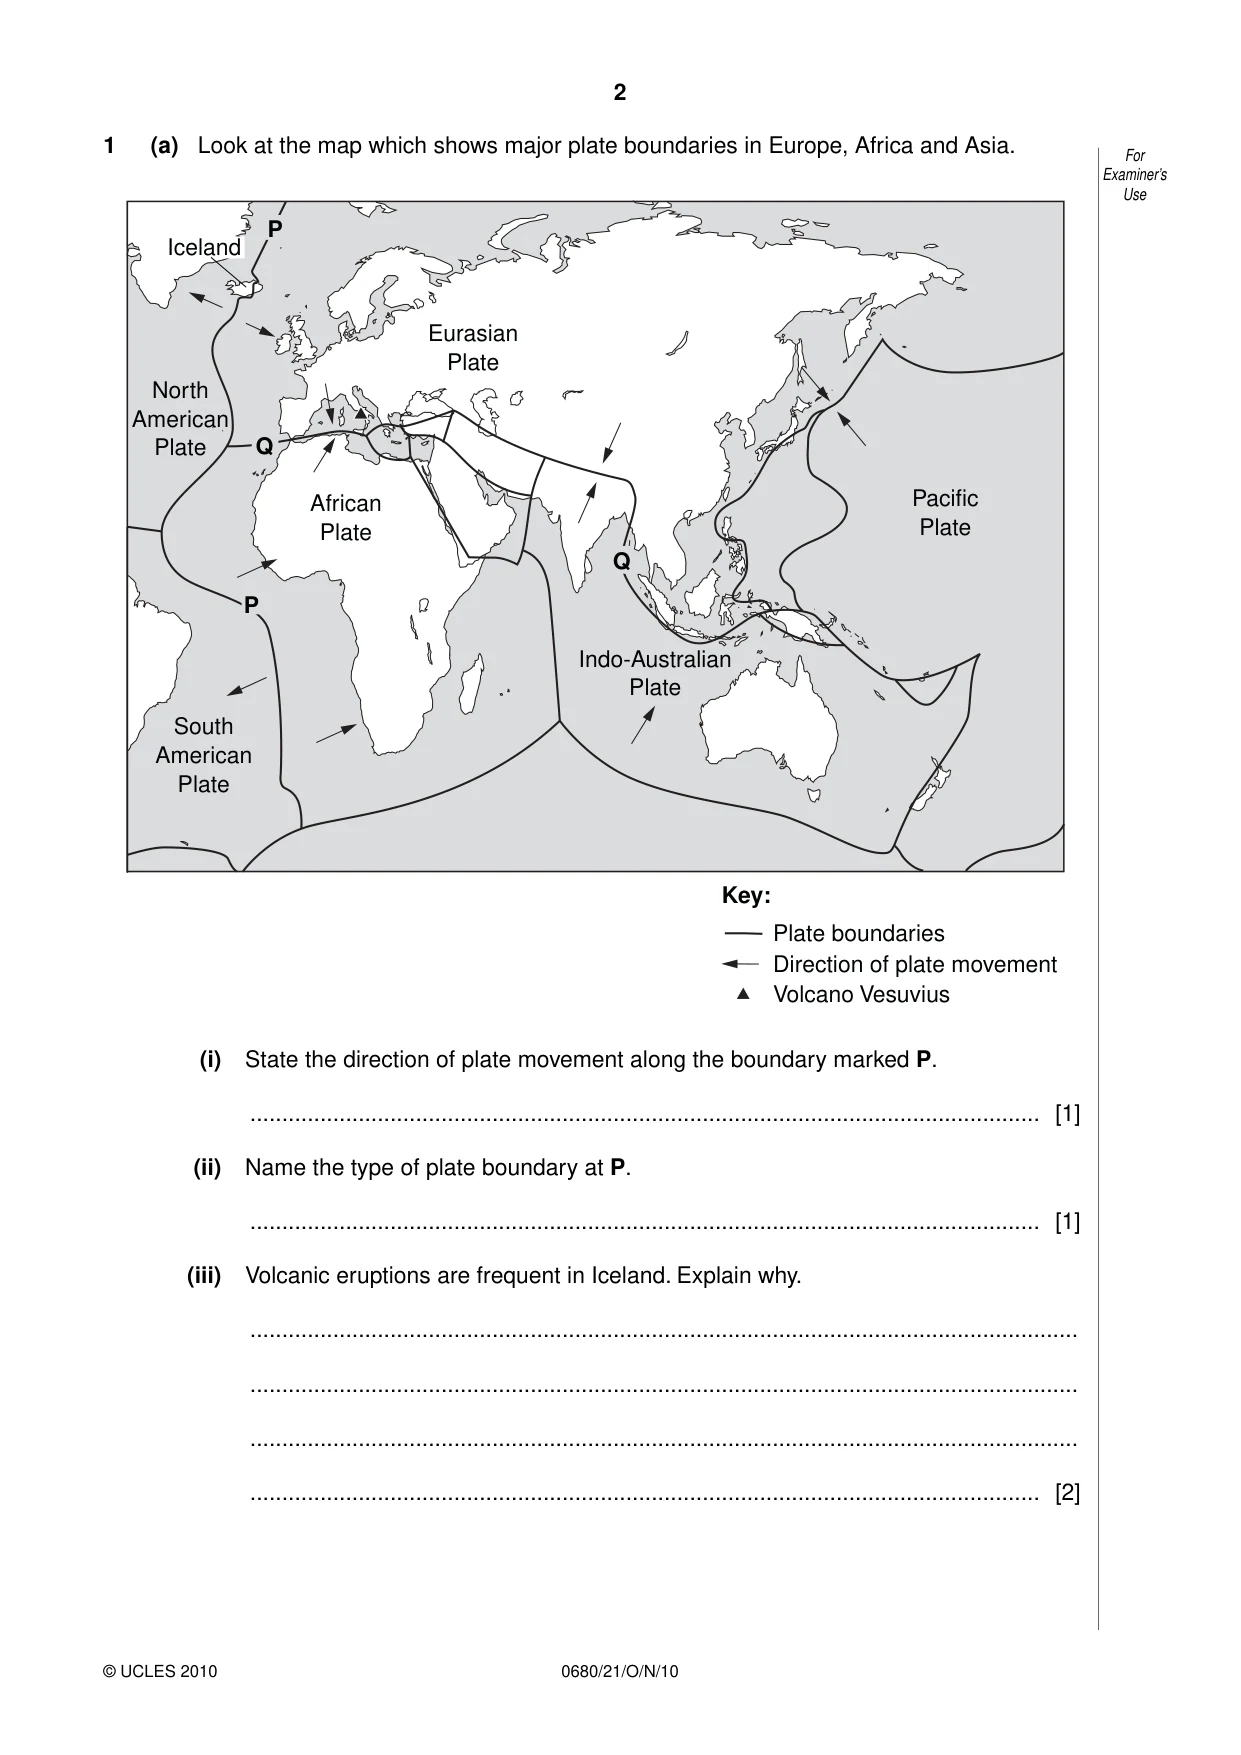
2 0680/21/O/N/10 © UCLES 2010 For Examiner’s Use 1 (a) Look at the map which shows major plate boundaries in Europe, Africa and Asia. African Plate South American Plate Eurasian Plate Pacific Plate Indo-Australian Plate Plate boundaries Key: Direction of plate movement Volcano Vesuvius Iceland P Q Q P North American Plate (i) State the direction of plate movement along the boundary marked P. … [1] (ii) Name the type of plate boundary at P. … [1] (iii) Volcanic eruptions are frequent in Iceland. Explain why. … … … … [2]
Question paper, page 3
3 0680/21/O/N/10 © UCLES 2010 [Turn over For Examiner’s Use (iv) A high percentage of Iceland’s energy needs come from renewable alternative sources. Describe how volcanic activity can be harnessed for electric power and heating. … … … … … … [3] (v) The earthquake risk is high in countries located along plate boundary Q. Explain why earthquakes often occur along plate boundaries of this type. … … … … … … … [4]
Question paper, page 4
4 0680/21/O/N/10 © UCLES 2010 For Examiner’s Use (b) Governments of countries with a high earthquake risk can prepare for future earthquakes. Describe strategies they can use that will help to (i) stop buildings from collapsing in an earthquake, … … … … … (ii) reduce the number of deaths after the earthquake. … … … … … [5]
Question paper, page 5
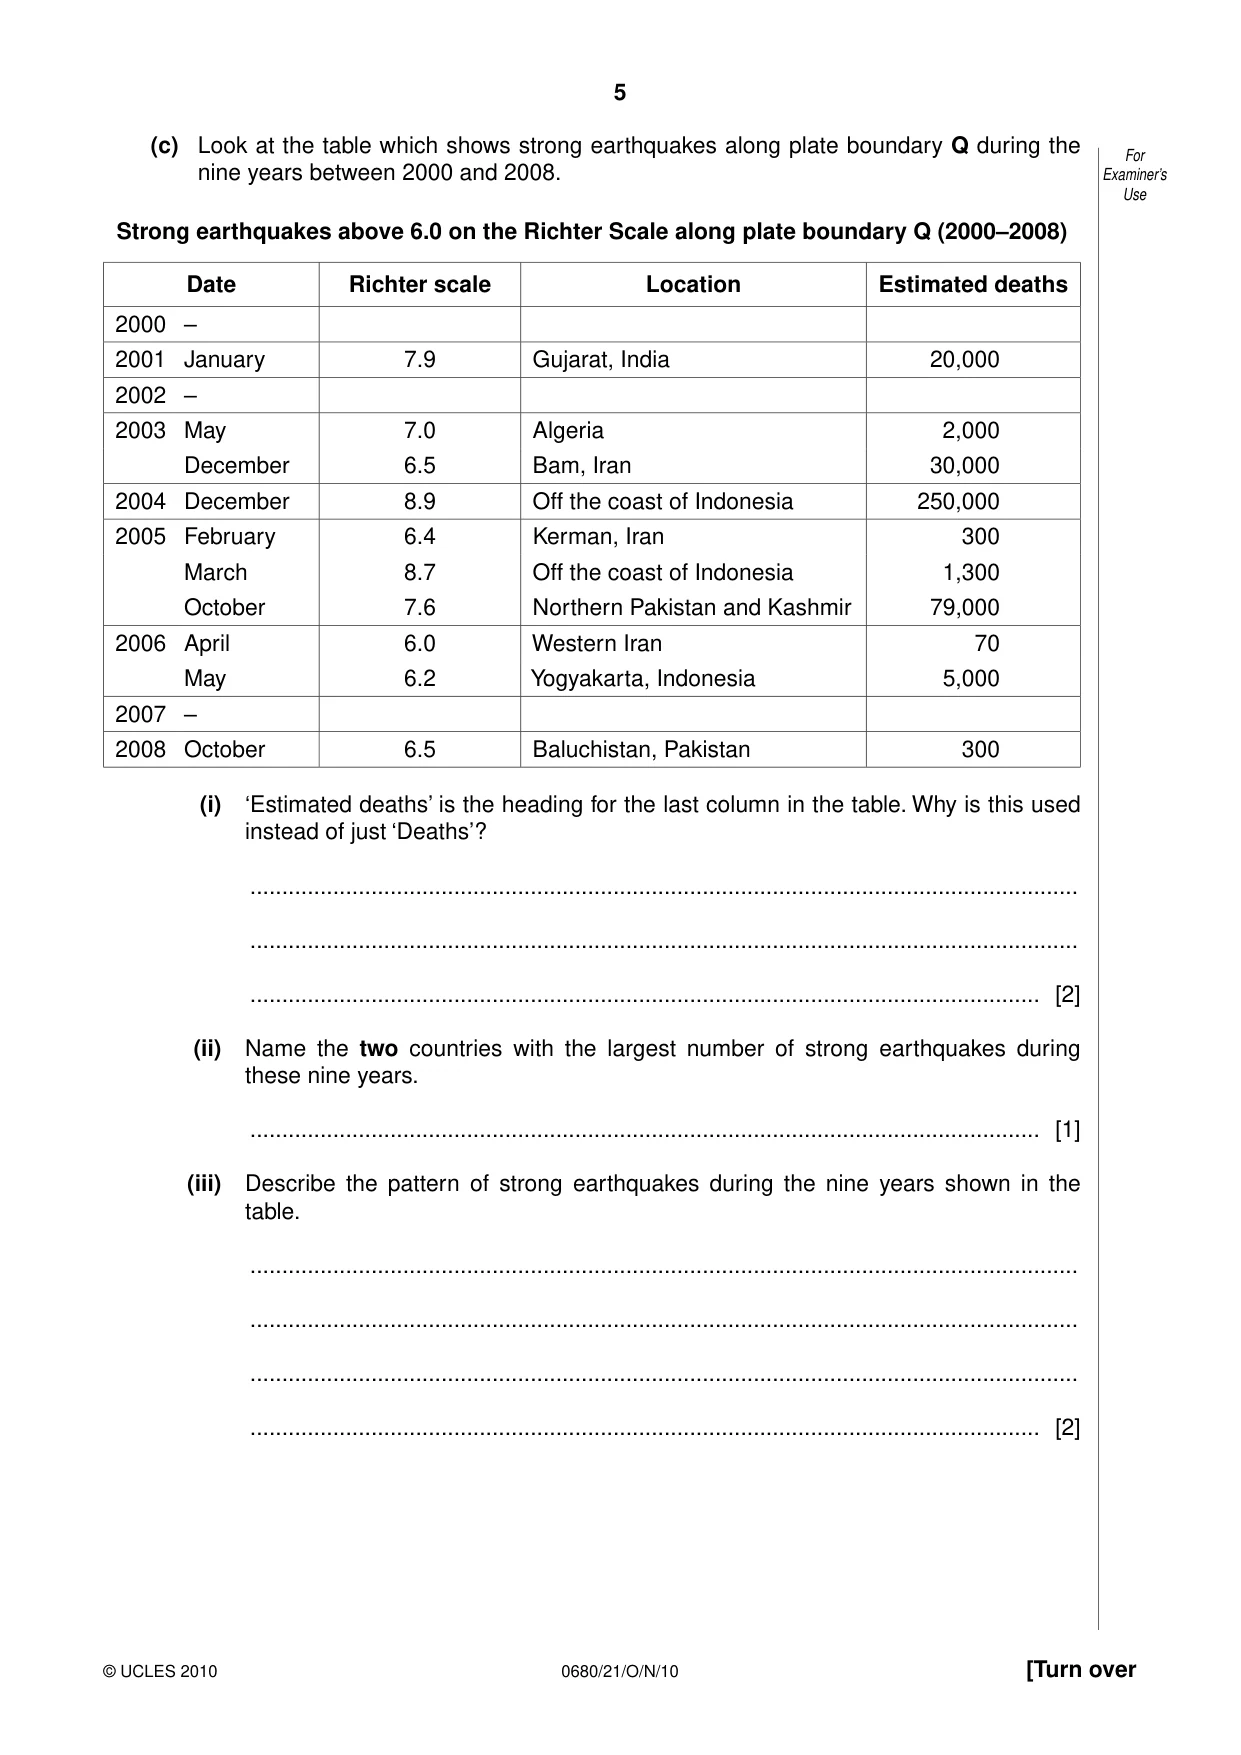
5 0680/21/O/N/10 © UCLES 2010 [Turn over For Examiner’s Use (c) Look at the table which shows strong earthquakes along plate boundary Q during the nine years between 2000 and 2008. Strong earthquakes above 6.0 on the Richter Scale along plate boundary Q (2000–2008) Date Richter scale Location Estimated deaths 2000 – 2001 January 7.9 Gujarat, India 20,000 2002 – 2003 May 7.0 Algeria 2,000 December 6.5 Bam, Iran 30,000 2004 December 8.9 Off the coast of Indonesia 250,000 2005 February 6.4 Kerman, Iran 300 March 8.7 Off the coast of Indonesia 1,300 October 7.6 Northern Pakistan and Kashmir 79,000 2006 April 6.0 Western Iran 70 May 6.2 Yogyakarta, Indonesia 5,000 2007 – 2008 October 6.5 Baluchistan, Pakistan 300 (i) ‘Estimated deaths’ is the heading for the last column in the table. Why is this used instead of just ‘Deaths’? … … … [2] (ii) Name the two countries with the largest number of strong earthquakes during these nine years. … [1] (iii) Describe the pattern of strong earthquakes during the nine years shown in the table. … … … … [2]
Question paper, page 6
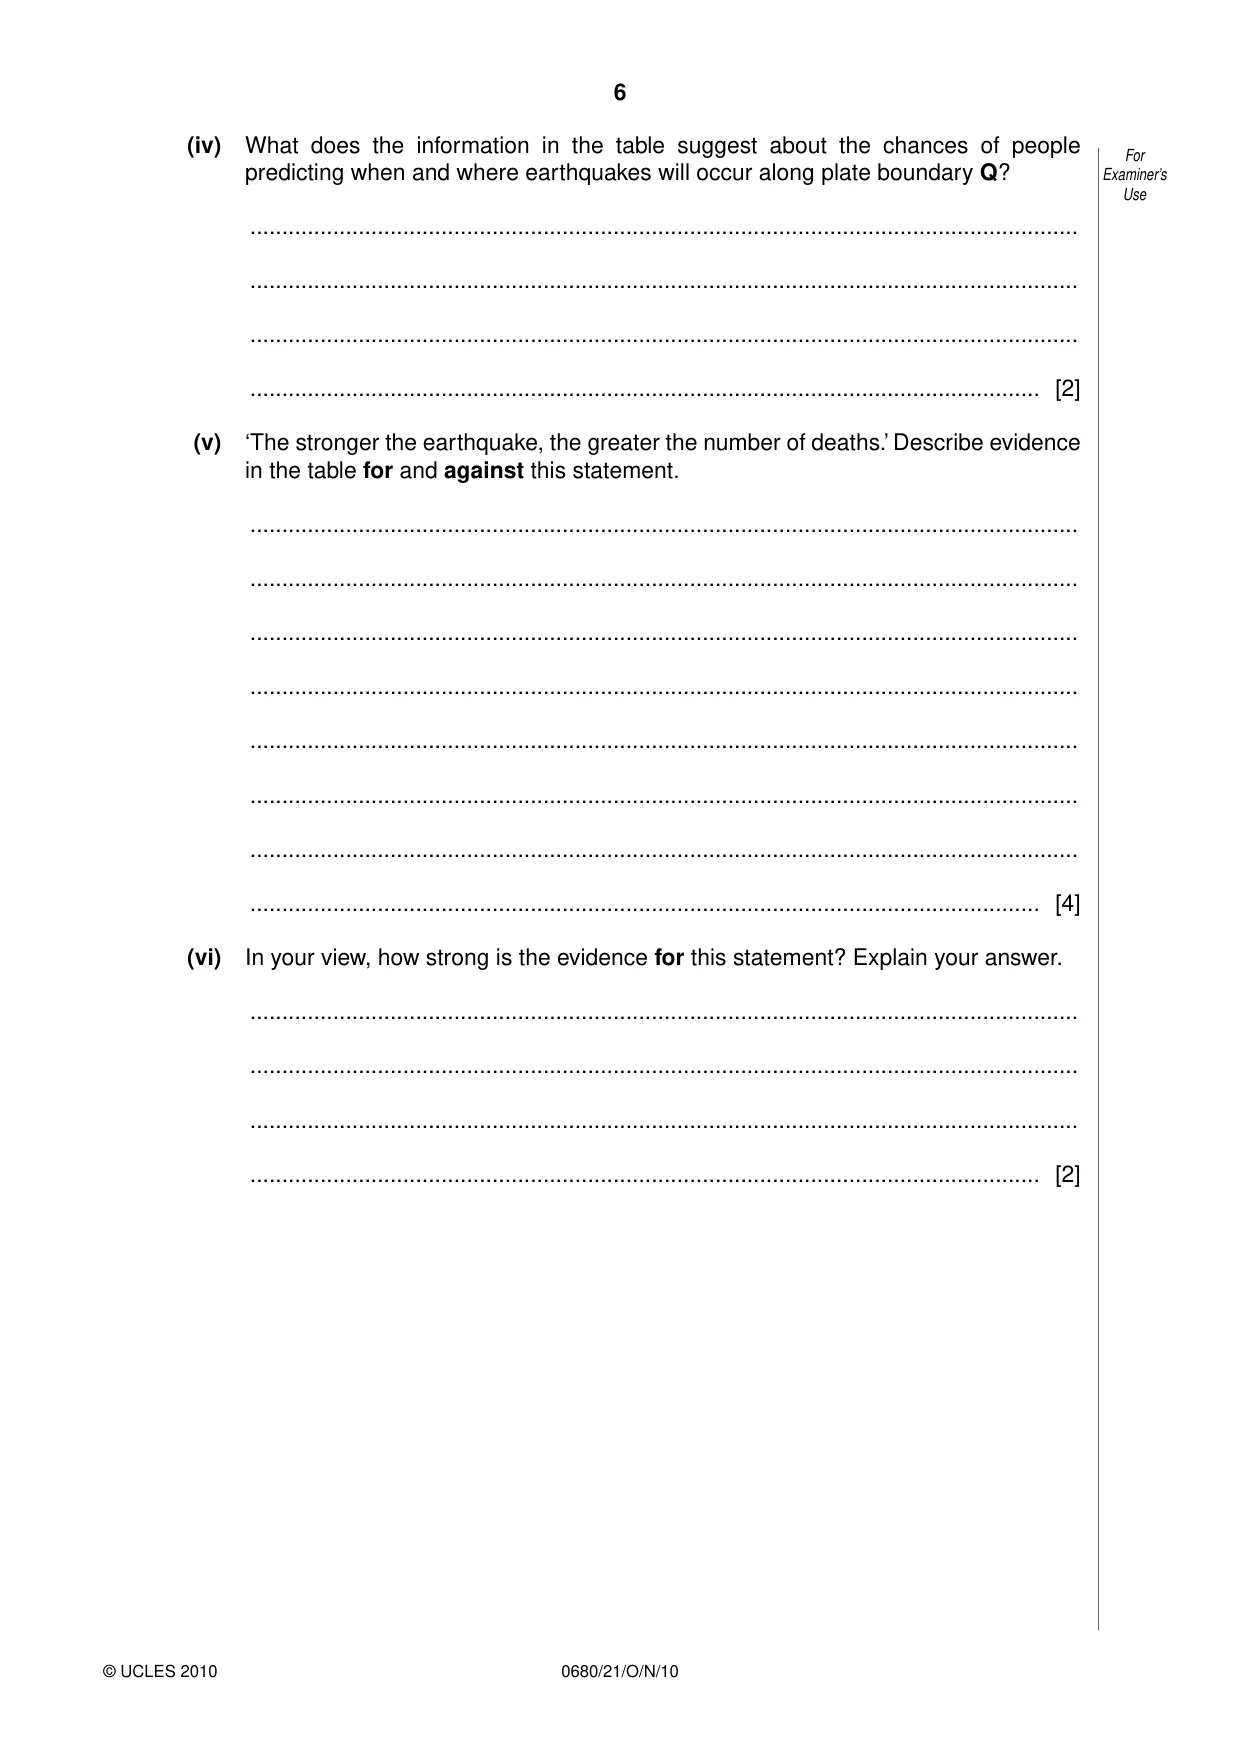
6 0680/21/O/N/10 © UCLES 2010 For Examiner’s Use (iv) What does the information in the table suggest about the chances of people predicting when and where earthquakes will occur along plate boundary Q? … … … … [2] (v) ‘The stronger the earthquake, the greater the number of deaths.’ Describe evidence in the table for and against this statement. … … … … … … … … [4] (vi) In your view, how strong is the evidence for this statement? Explain your answer. … … … … [2]
Question paper, page 7
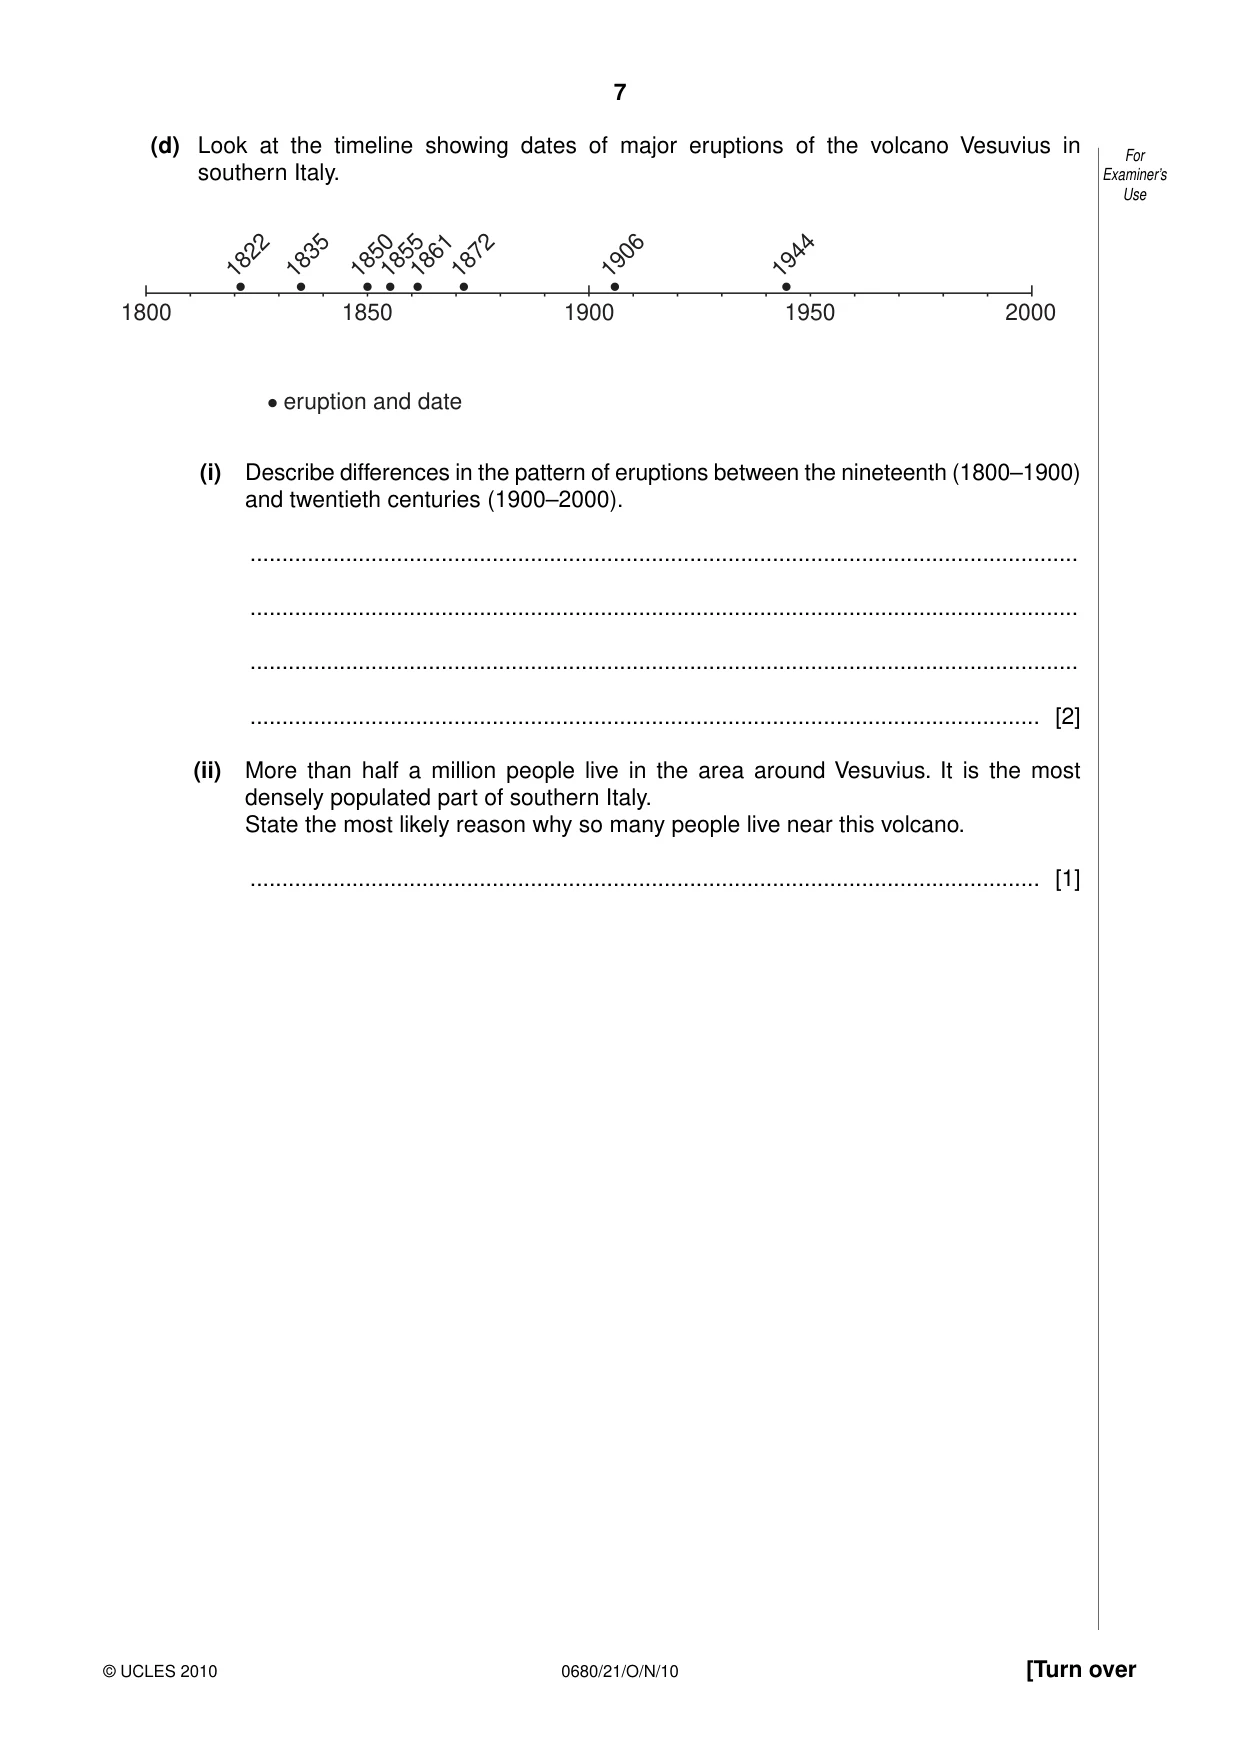
7 0680/21/O/N/10 © UCLES 2010 [Turn over For Examiner’s Use (d) Look at the timeline showing dates of major eruptions of the volcano Vesuvius in southern Italy. 1800 1822 1835 1850 1855 1861 1872 1906 1944 2000 1900 1850 1950 eruption and date (i) Describe differences in the pattern of eruptions between the nineteenth (1800–1900) and twentieth centuries (1900–2000). … … … … [2] (ii) More than half a million people live in the area around Vesuvius. It is the most densely populated part of southern Italy. State the most likely reason why so many people live near this volcano. … [1]
Question paper, page 8
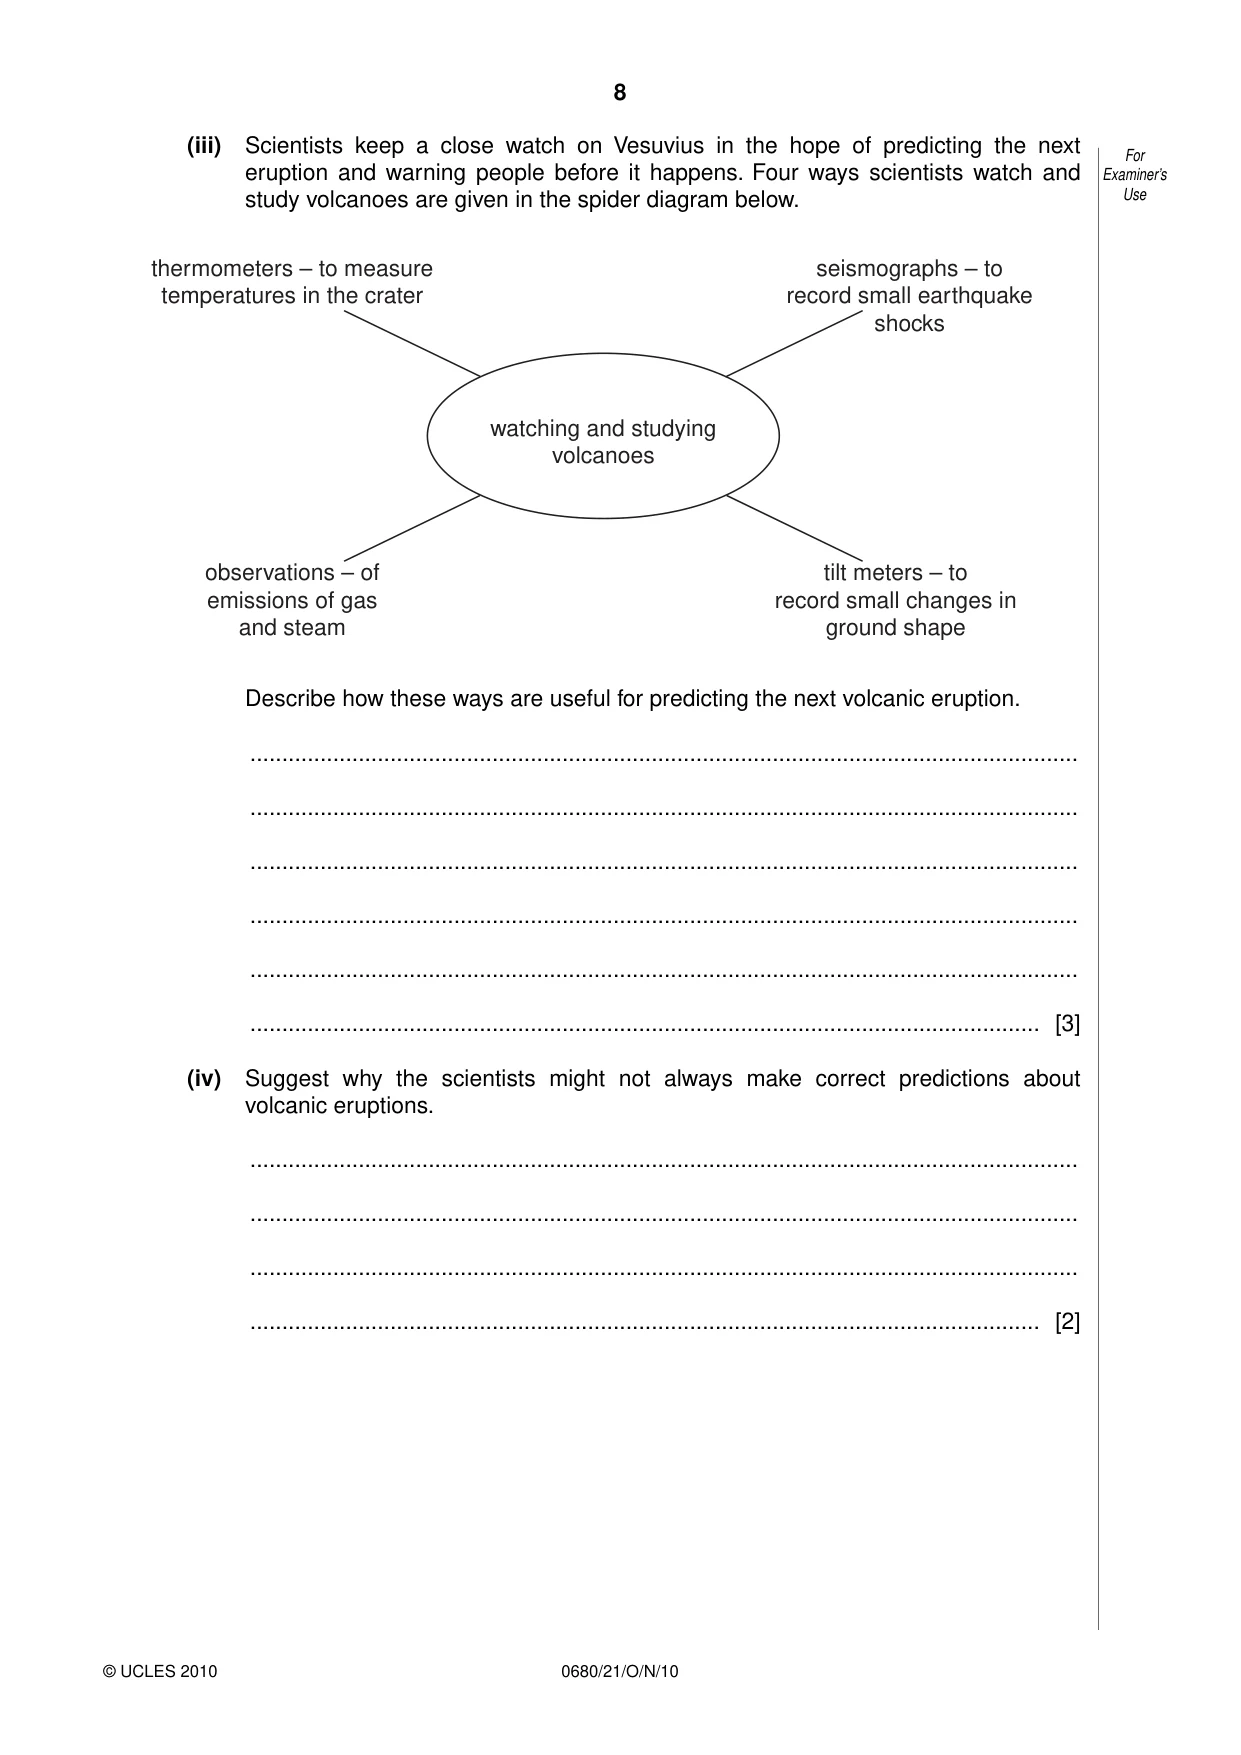
8 0680/21/O/N/10 © UCLES 2010 For Examiner’s Use (iii) Scientists keep a close watch on Vesuvius in the hope of predicting the next eruption and warning people before it happens. Four ways scientists watch and study volcanoes are given in the spider diagram below. watching and studying volcanoes thermometers – to measure temperatures in the crater observations – of emissions of gas and steam seismographs – to record small earthquake shocks tilt meters – to record small changes in ground shape Describe how these ways are useful for predicting the next volcanic eruption. … … … … … … [3] (iv) Suggest why the scientists might not always make correct predictions about volcanic eruptions. … … … … [2]
Question paper, page 9
9 0680/21/O/N/10 © UCLES 2010 [Turn over For Examiner’s Use (v) When scientists predict that Vesuvius is about to erupt again, more than half a million people will need to be evacuated from their homes. How easy or difficult will it be to put this strategy into action? Answer as fully as you can. … … … … … … [3] [Total: 40 marks]
Question paper, page 10
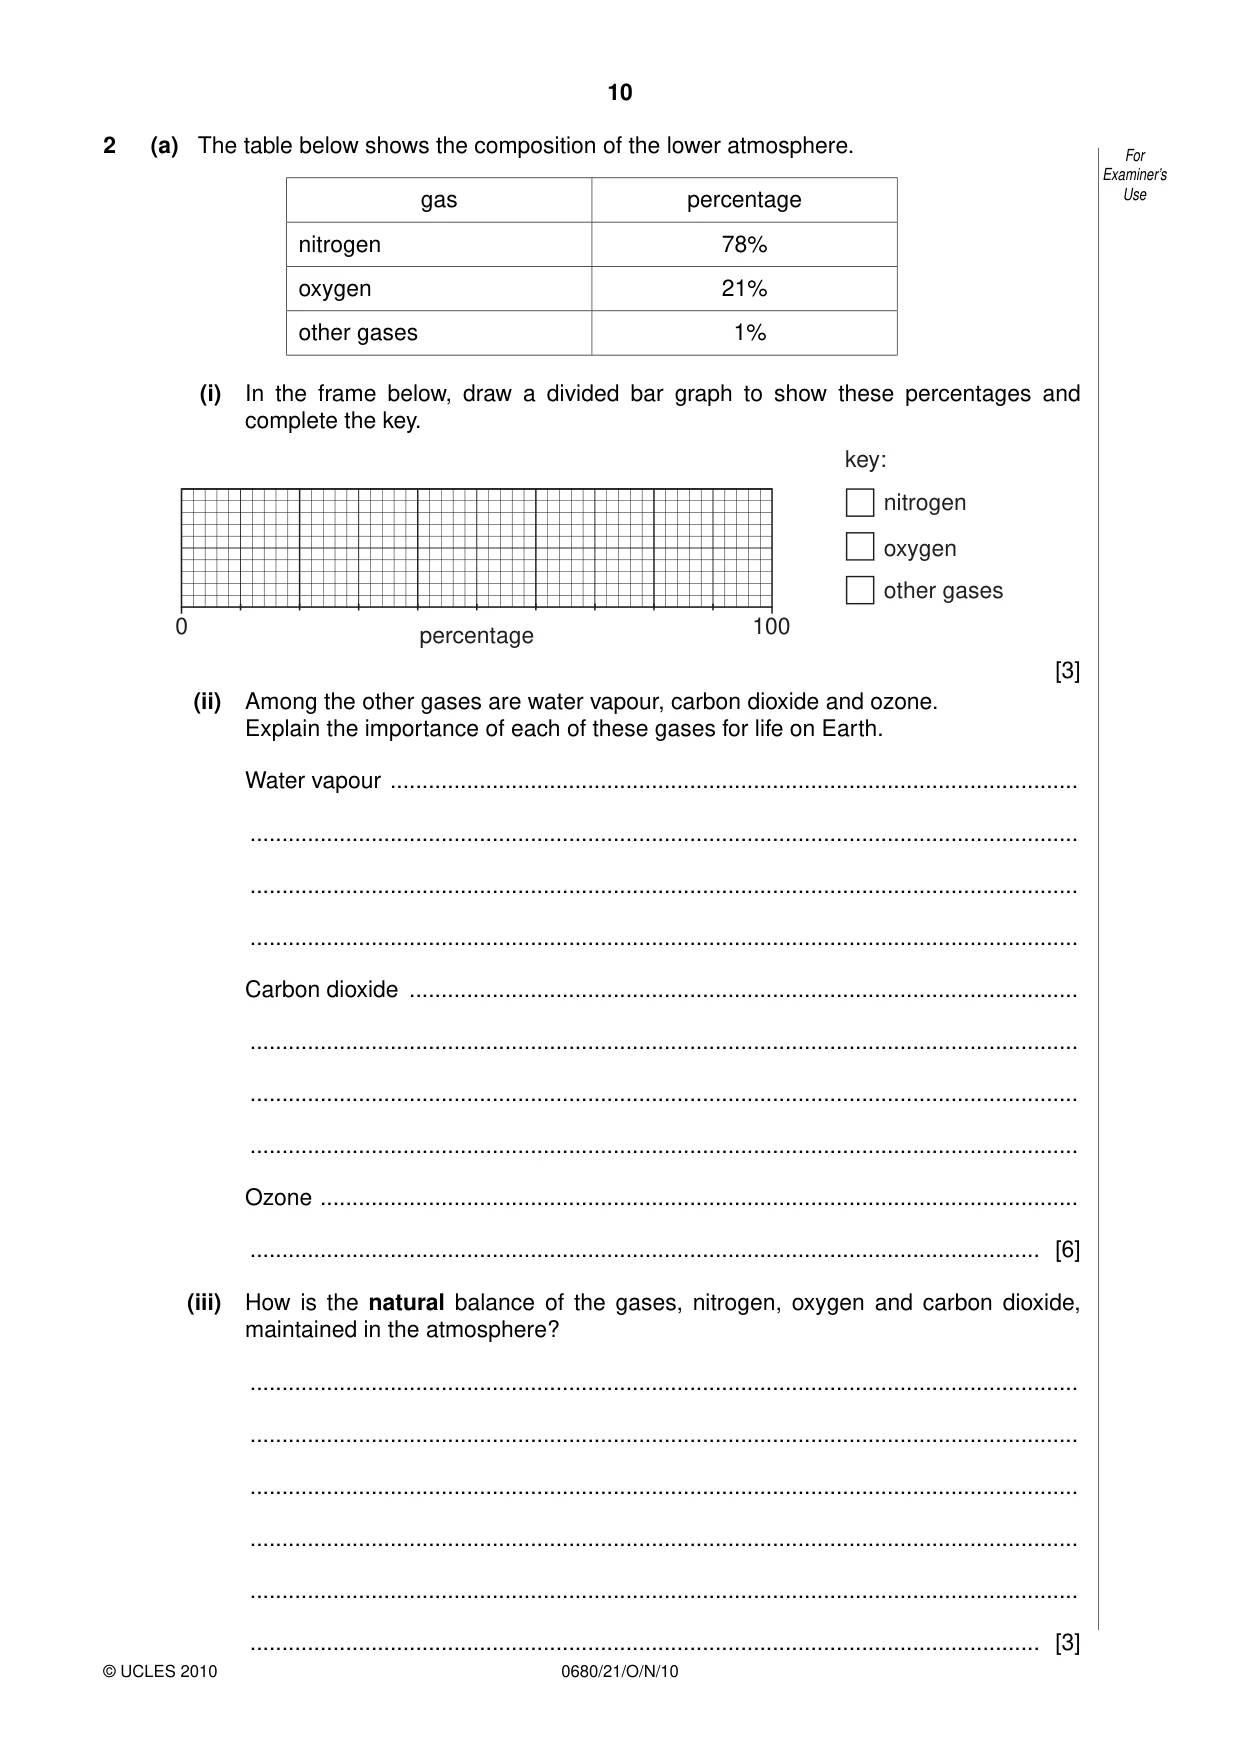
10 0680/21/O/N/10 © UCLES 2010 For Examiner’s Use 2 (a) The table below shows the composition of the lower atmosphere. gas percentage nitrogen 78% oxygen 21% other gases 1% (i) In the frame below, draw a divided bar graph to show these percentages and complete the key. percentage 100 key: nitrogen oxygen other gases 0 [3] (ii) Among the other gases are water vapour, carbon dioxide and ozone. Explain the importance of each of these gases for life on Earth. Water vapour … … … … Carbon dioxide … … … … Ozone … … [6] (iii) How is the natural balance of the gases, nitrogen, oxygen and carbon dioxide, maintained in the atmosphere? … … … … … … [3]
Question paper, page 11
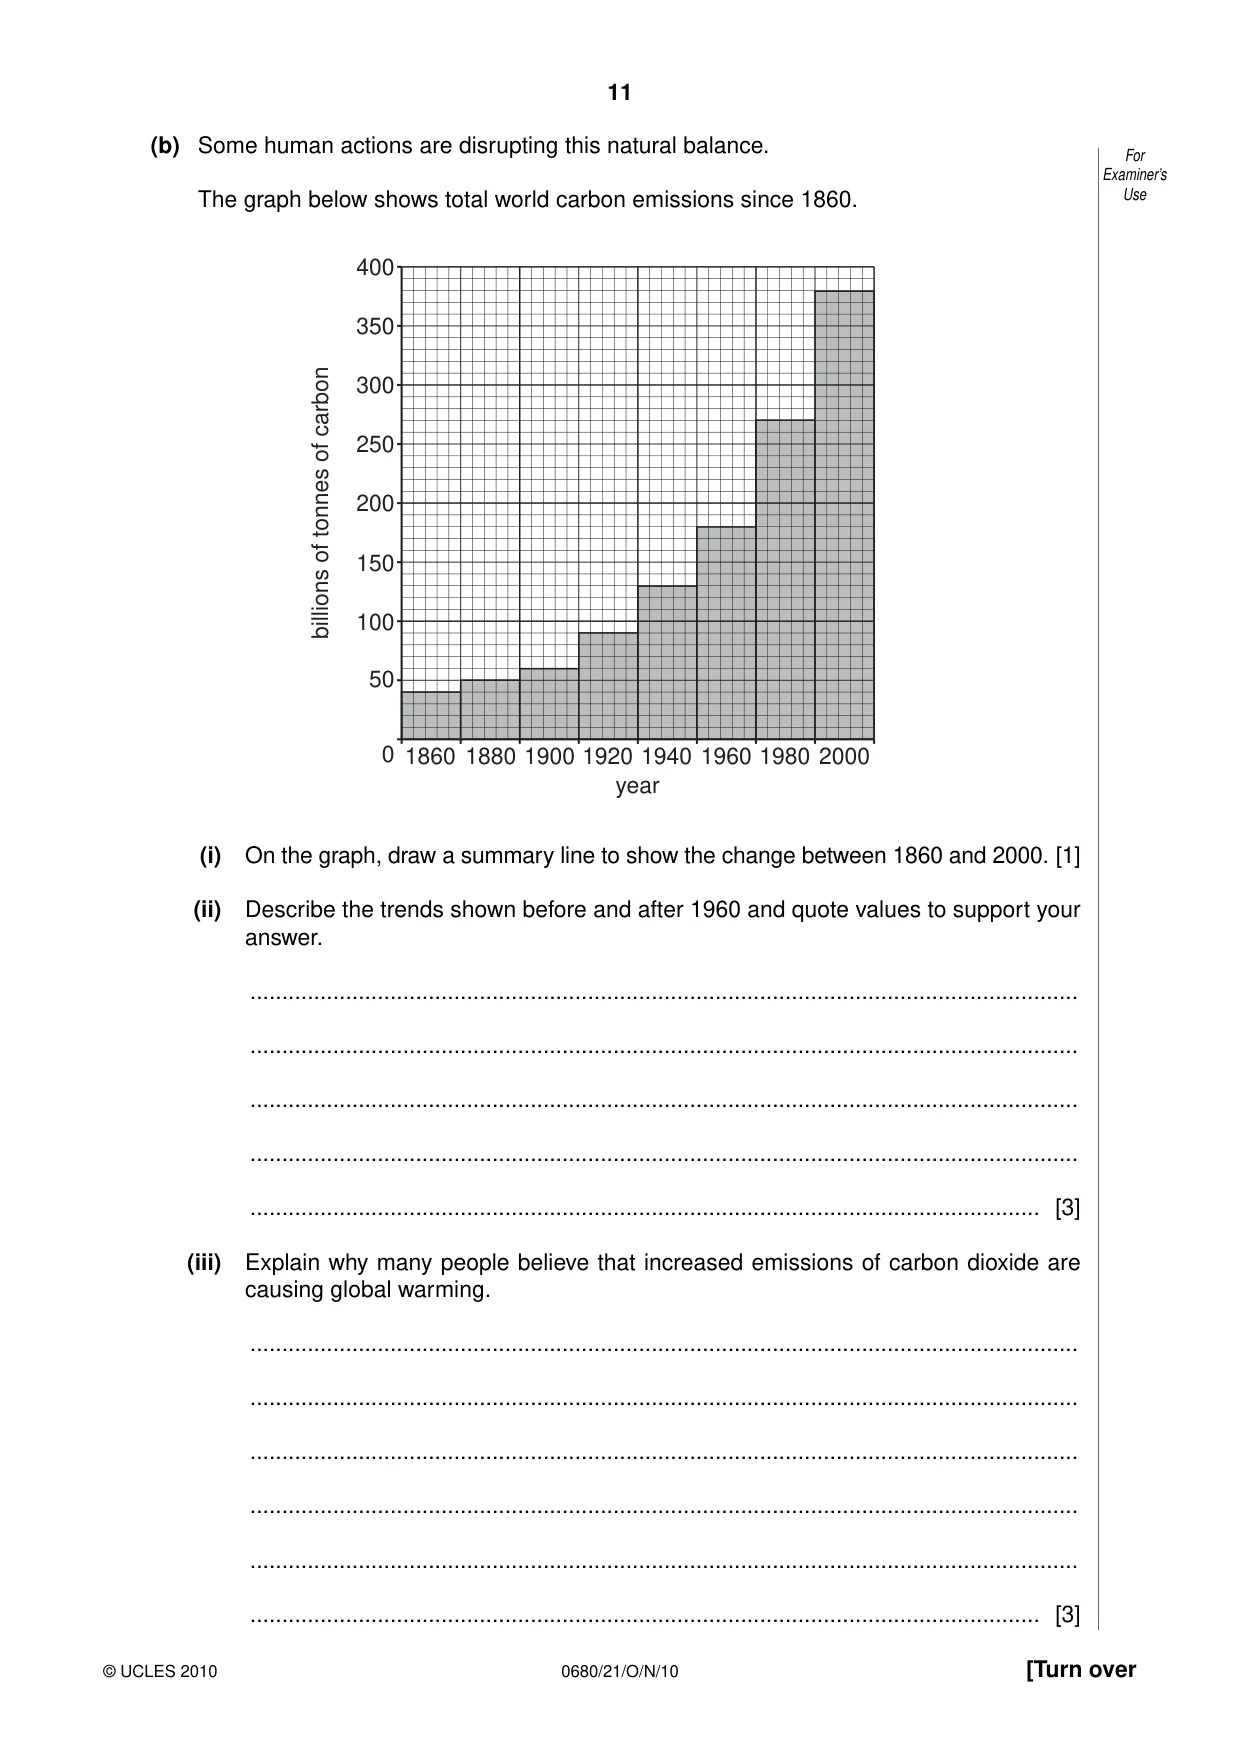
11 0680/21/O/N/10 © UCLES 2010 [Turn over For Examiner’s Use (b) Some human actions are disrupting this natural balance. The graph below shows total world carbon emissions since 1860. 1860 0 1880 1900 1920 year 1940 1960 1980 2000 billions of tonnes of carbon 250 300 350 400 50 100 150 200 (i) On the graph, draw a summary line to show the change between 1860 and 2000. [1] (ii) Describe the trends shown before and after 1960 and quote values to support your answer. … … … … … [3] (iii) Explain why many people believe that increased emissions of carbon dioxide are causing global warming. … … … … … … [3]
Question paper, page 12
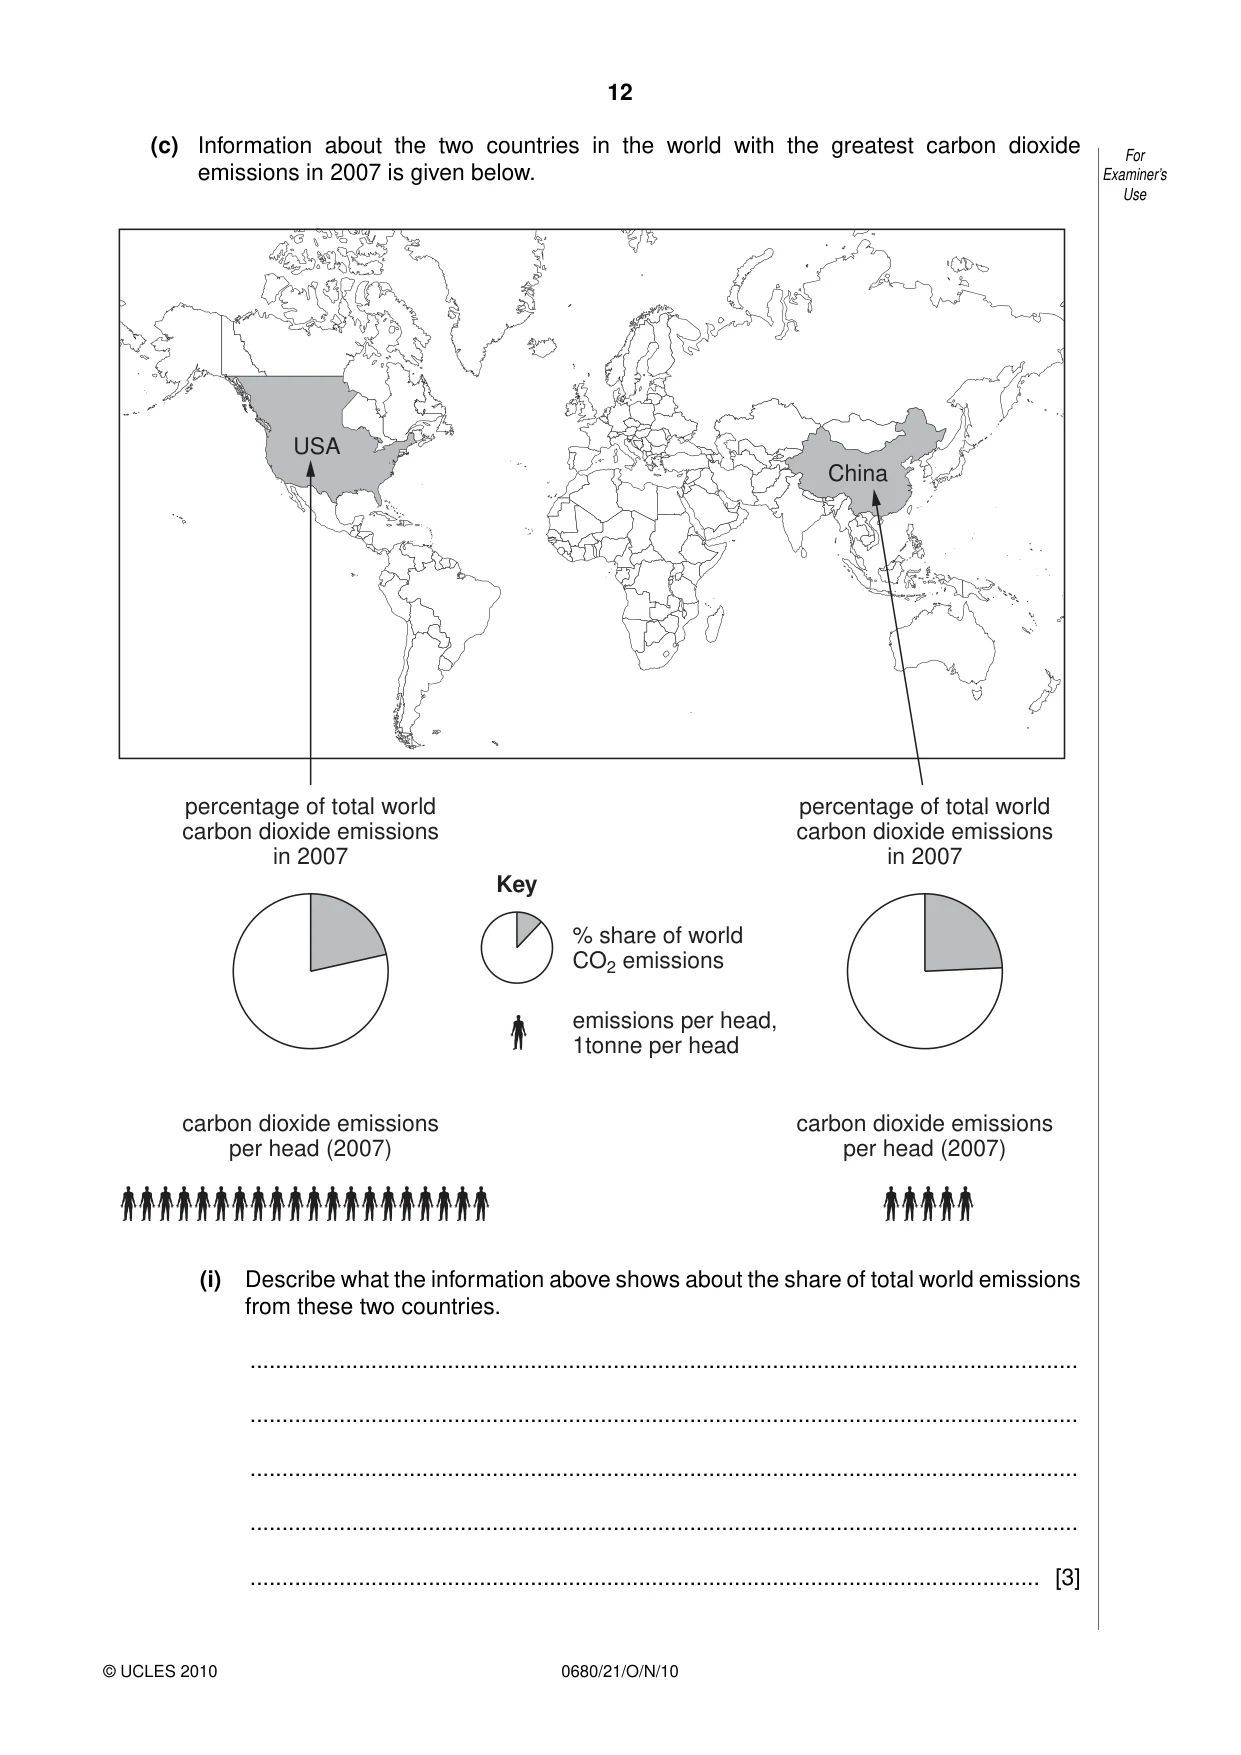
12 0680/21/O/N/10 © UCLES 2010 For Examiner’s Use (c) Information about the two countries in the world with the greatest carbon dioxide emissions in 2007 is given below. USA China percentage of total world carbon dioxide emissions in 2007 Key carbon dioxide emissions per head (2007) % share of world CO2 emissions emissions per head, 1tonne per head percentage of total world carbon dioxide emissions in 2007 carbon dioxide emissions per head (2007) (i) Describe what the information above shows about the share of total world emissions from these two countries. … … … … … [3]
Question paper, page 13
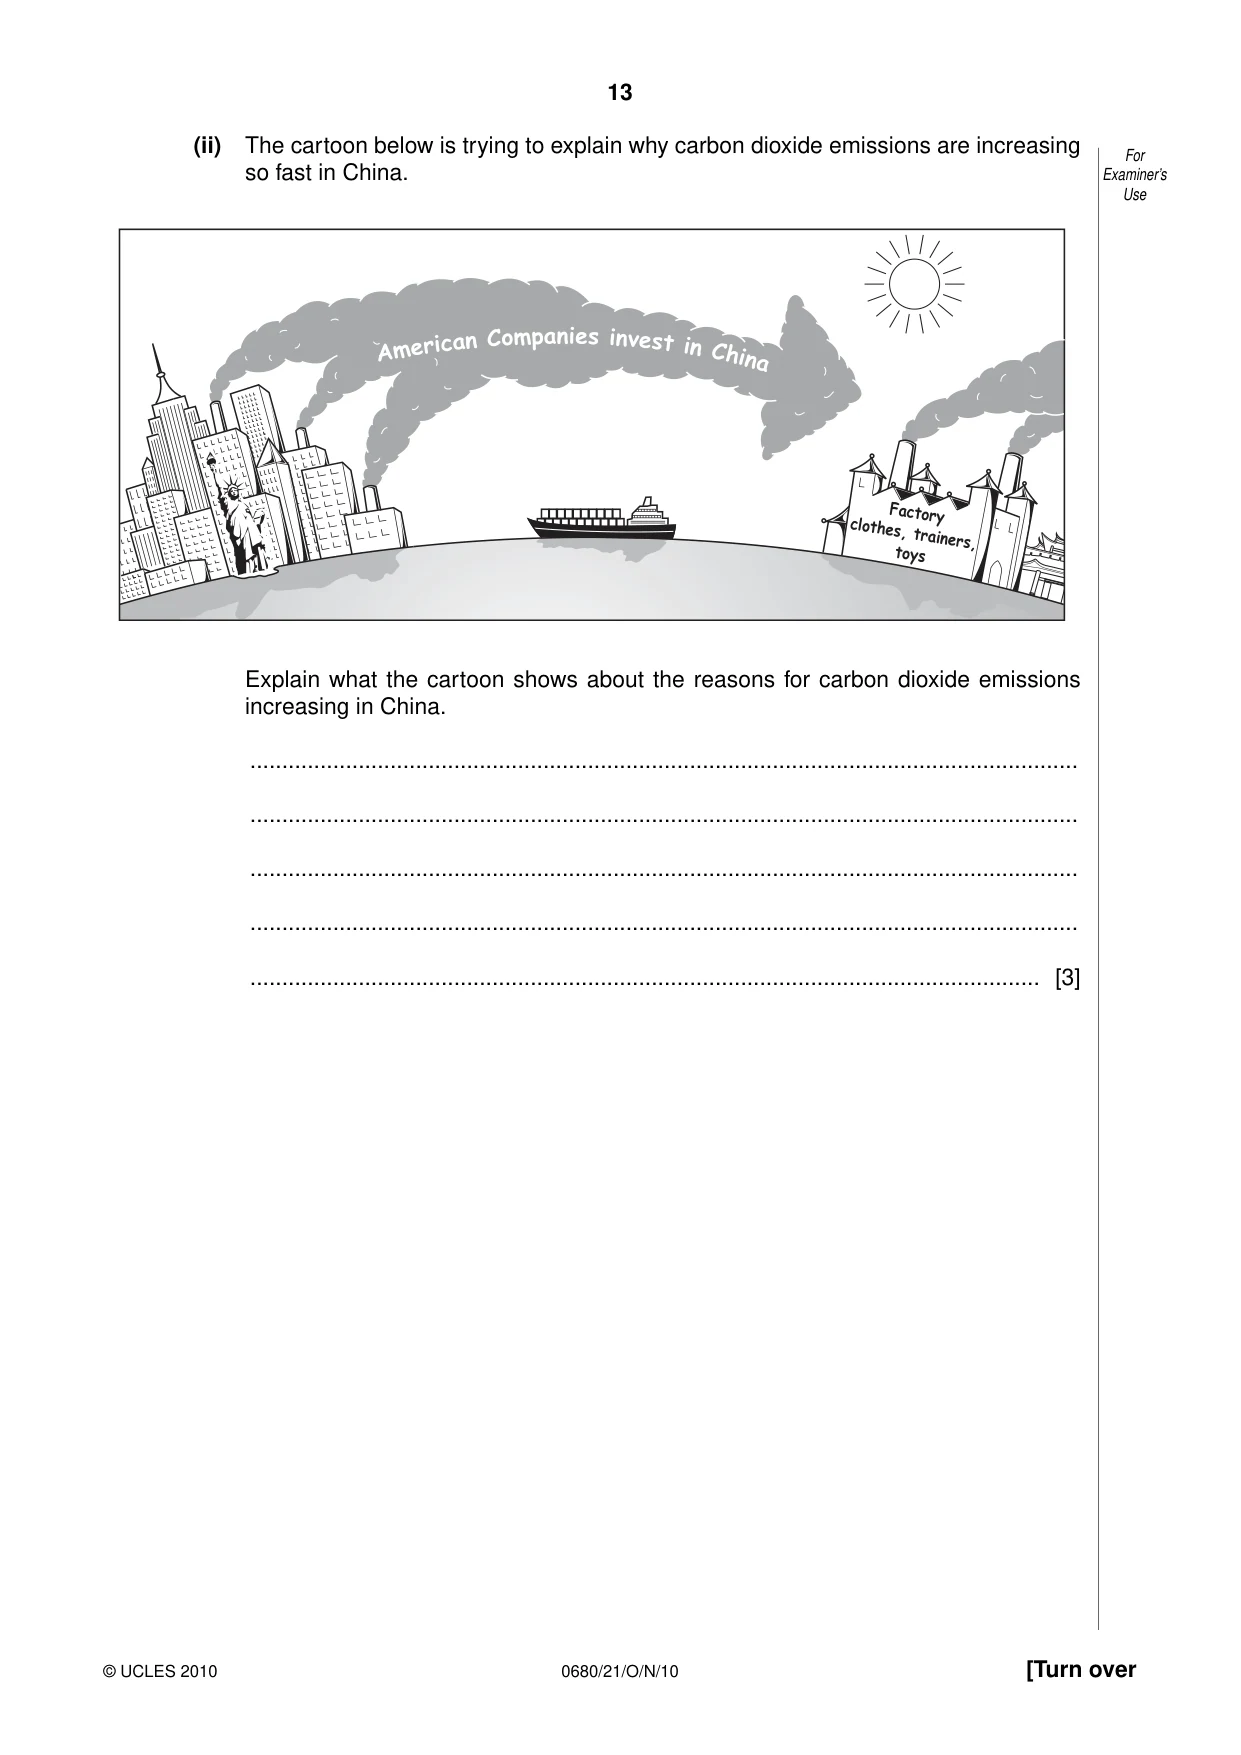
13 0680/21/O/N/10 © UCLES 2010 [Turn over For Examiner’s Use (ii) The cartoon below is trying to explain why carbon dioxide emissions are increasing so fast in China. Ame rican Com pani es i nve st i n C hin a Factory clothes, trainers, toys Explain what the cartoon shows about the reasons for carbon dioxide emissions increasing in China. … … … … … [3]
Question paper, page 14
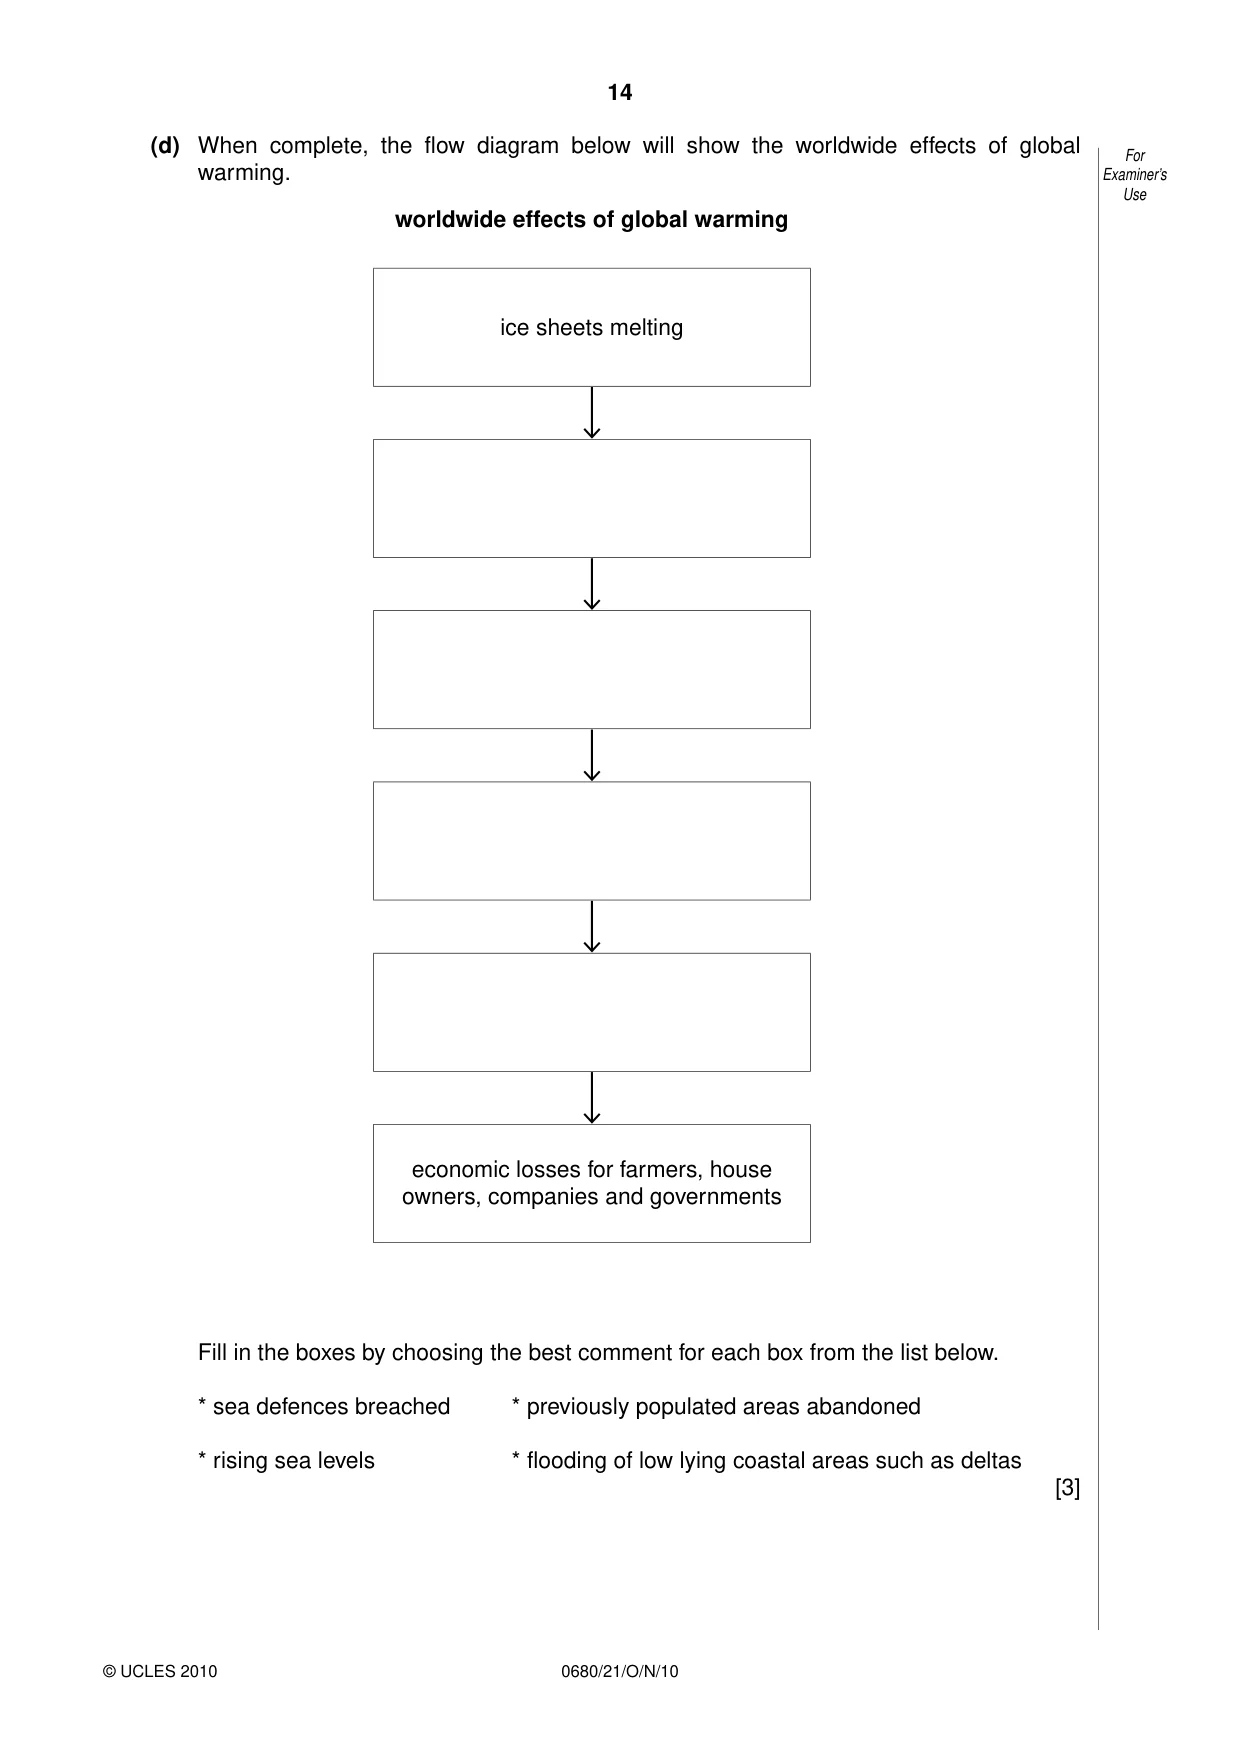
14 0680/21/O/N/10 © UCLES 2010 For Examiner’s Use (d) When complete, the flow diagram below will show the worldwide effects of global warming. worldwide effects of global warming ice sheets melting economic losses for farmers, house owners, companies and governments Fill in the boxes by choosing the best comment for each box from the list below. * sea defences breached * previously populated areas abandoned * rising sea levels * flooding of low lying coastal areas such as deltas [3]
Question paper, page 15
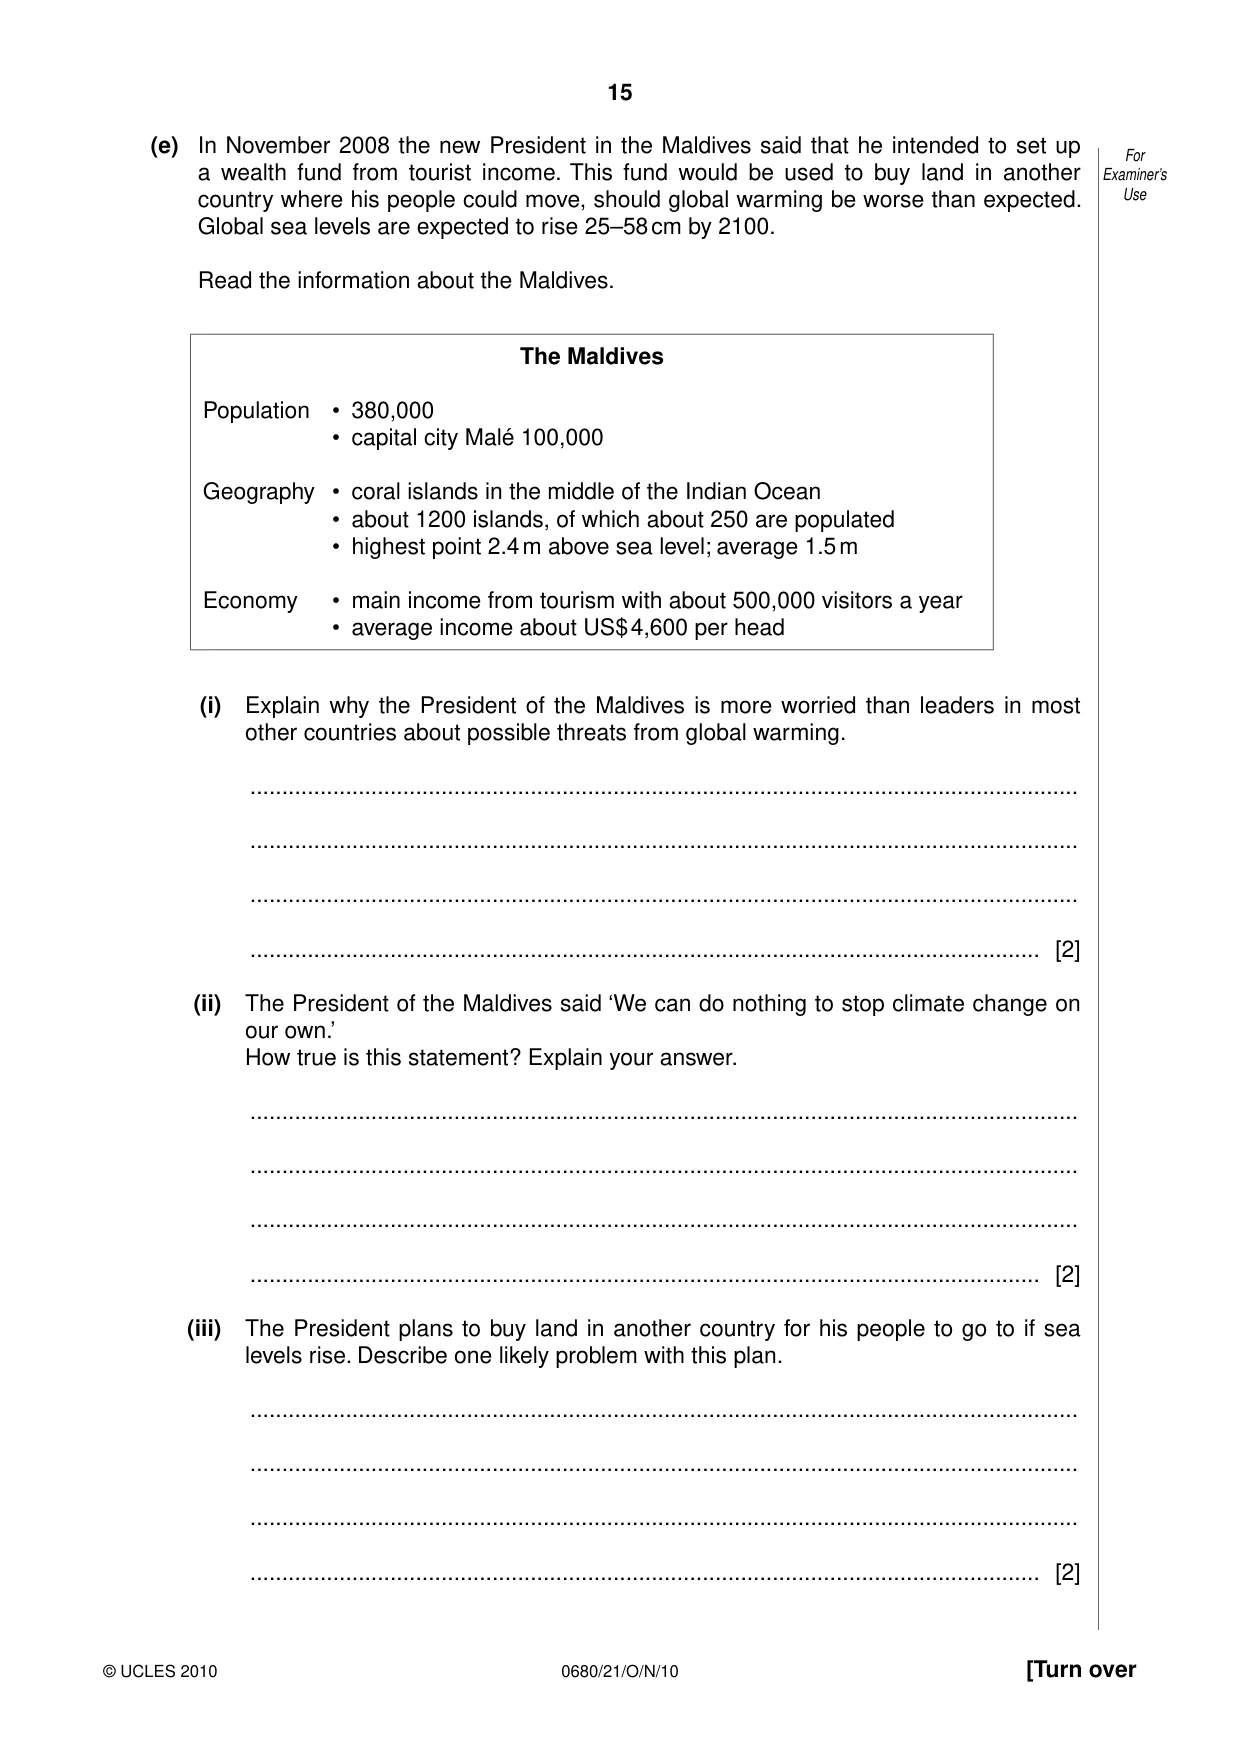
15 0680/21/O/N/10 © UCLES 2010 [Turn over For Examiner’s Use (e) In November 2008 the new President in the Maldives said that he intended to set up a wealth fund from tourist income. This fund would be used to buy land in another country where his people could move, should global warming be worse than expected. Global sea levels are expected to rise 25–58 cm by 2100. Read the information about the Maldives. The Maldives Population • 380,000 • capital city Malé 100,000 Geography • coral islands in the middle of the Indian Ocean • about 1200 islands, of which about 250 are populated • highest point 2.4 m above sea level; average 1.5 m Economy • main income from tourism with about 500,000 visitors a year • average income about US$ 4,600 per head (i) Explain why the President of the Maldives is more worried than leaders in most other countries about possible threats from global warming. … … … … [2] (ii) The President of the Maldives said ‘We can do nothing to stop climate change on our own.’ How true is this statement? Explain your answer. … … … … [2] (iii) The President plans to buy land in another country for his people to go to if sea levels rise. Describe one likely problem with this plan. … … … … [2]
Question paper, page 16
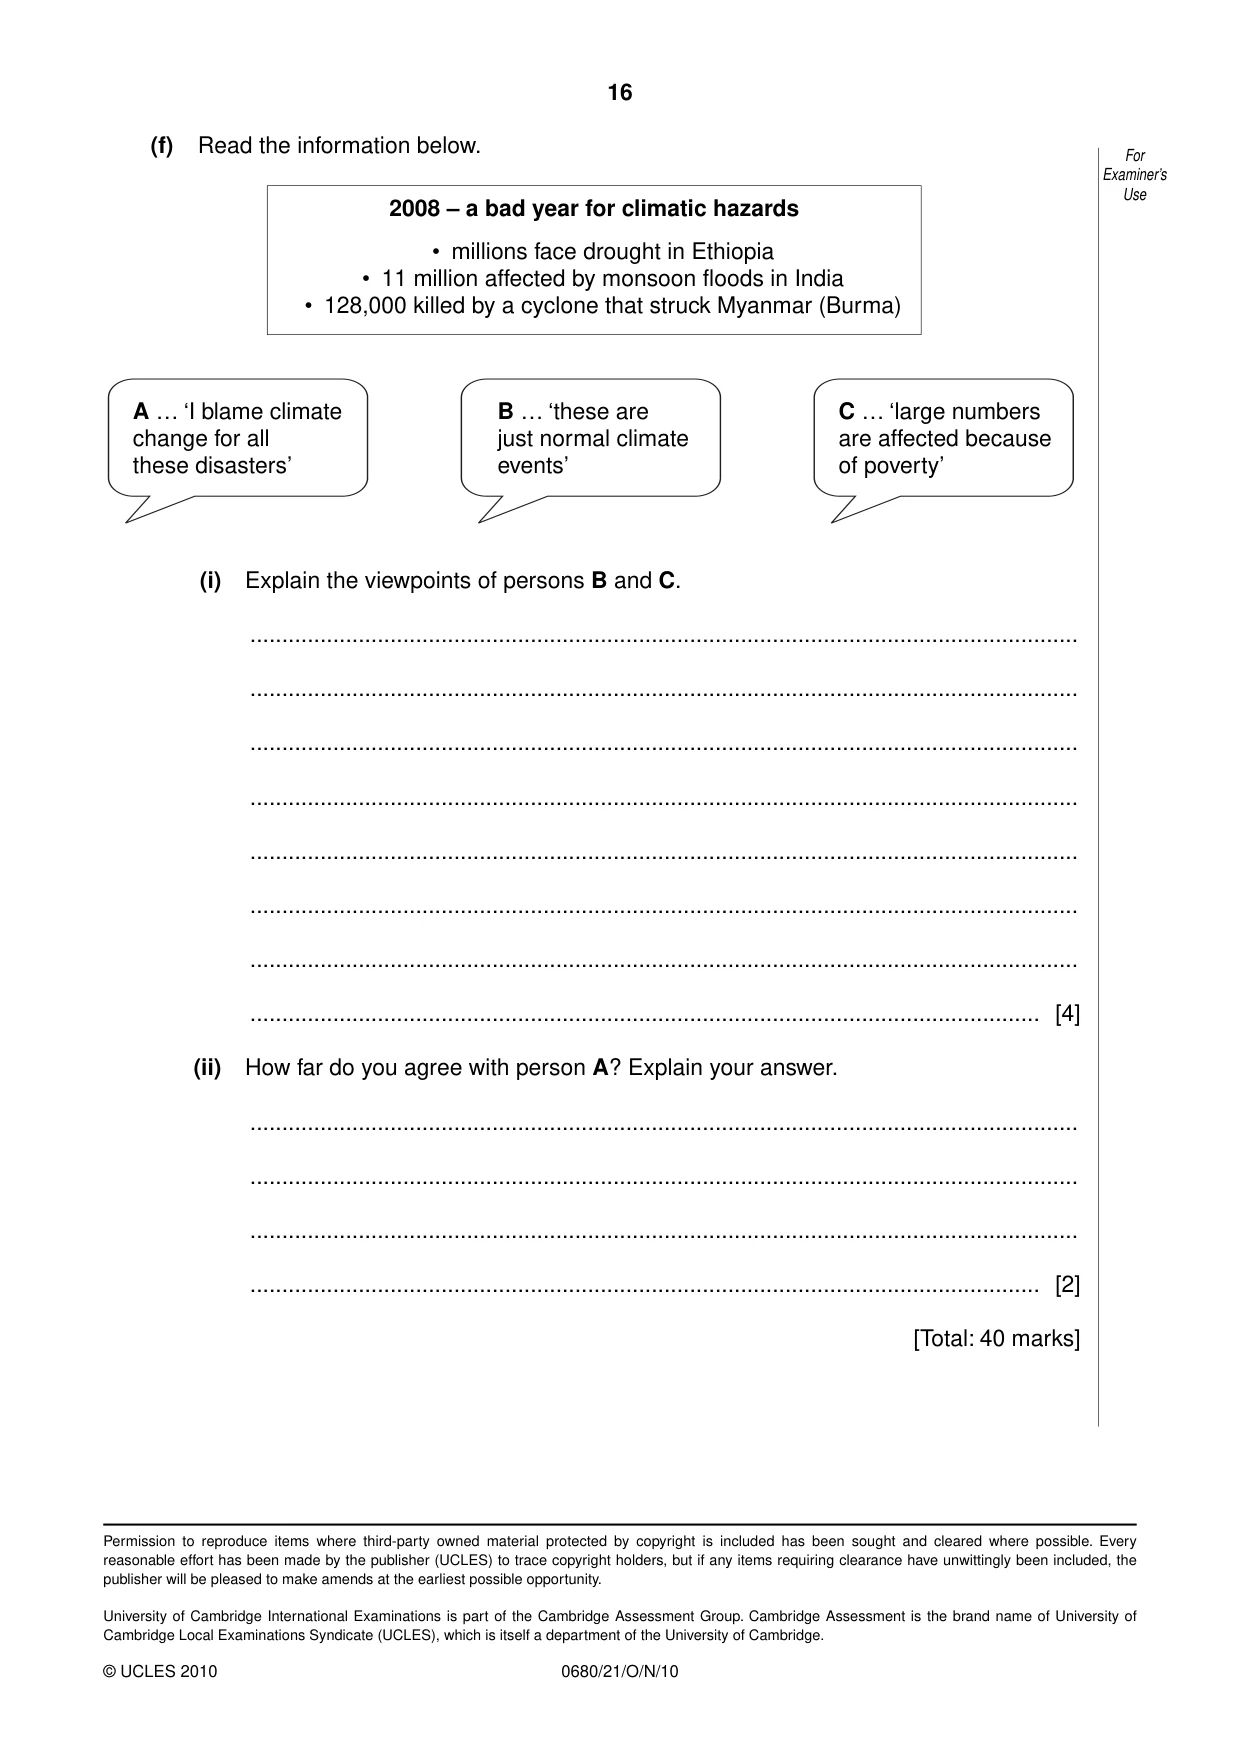
16 0680/21/O/N/10 © UCLES 2010 For Examiner’s Use (f) Read the information below. A … ‘I blame climate change for all these disasters’ B … ‘these are just normal climate events’ C … ‘large numbers are affected because of poverty’ (i) Explain the viewpoints of persons B and C. … … … … … … … … [4] (ii) How far do you agree with person A? Explain your answer. … … … … [2] [Total: 40 marks] Permission to reproduce items where third-party owned material protected by copyright is included has been sought and cleared where possible. Every reasonable effort has been made by the publisher (UCLES) to trace copyright holders, but if any items requiring clearance have unwittingly been included, the publisher will be pleased to make amends at the earliest possible opportunity. University of Cambridge International Examinations is part of the Cambridge Assessment Group. Cambridge Assessment is the brand name of University of Cambridge Local Examinations Syndicate (UCLES), which is itself a department of the University of Cambridge. 2008 – a bad year for climatic hazards • millions face drought in Ethiopia • 11 million affected by monsoon floods in India • 128,000 killed by a cyclone that struck Myanmar (Burma)
Mark scheme, page 1
UNIVERSITY OF CAMBRIDGE INTERNATIONAL EXAMINATIONS International General Certificate of Secondary Education MARK SCHEME for the October/November 2010 question paper for the guidance of teachers 0680 ENVIRONMENTAL MANAGEMENT 0680/21 Paper 2, maximum raw mark 80 This mark scheme is published as an aid to teachers and candidates, to indicate the requirements of the examination. It shows the basis on which Examiners were instructed to award marks. It does not indicate the details of the discussions that took place at an Examiners’ meeting before marking began, which would have considered the acceptability of alternative answers. Mark schemes must be read in conjunction with the question papers and the report on the examination. • CIE will not enter into discussions or correspondence in connection with these mark schemes. CIE is publishing the mark schemes for the October/November 2010 question papers for most IGCSE, GCE Advanced Level and Advanced Subsidiary Level syllabuses and some Ordinary Level syllabuses. www.XtremePapers.com
Mark scheme, page 2
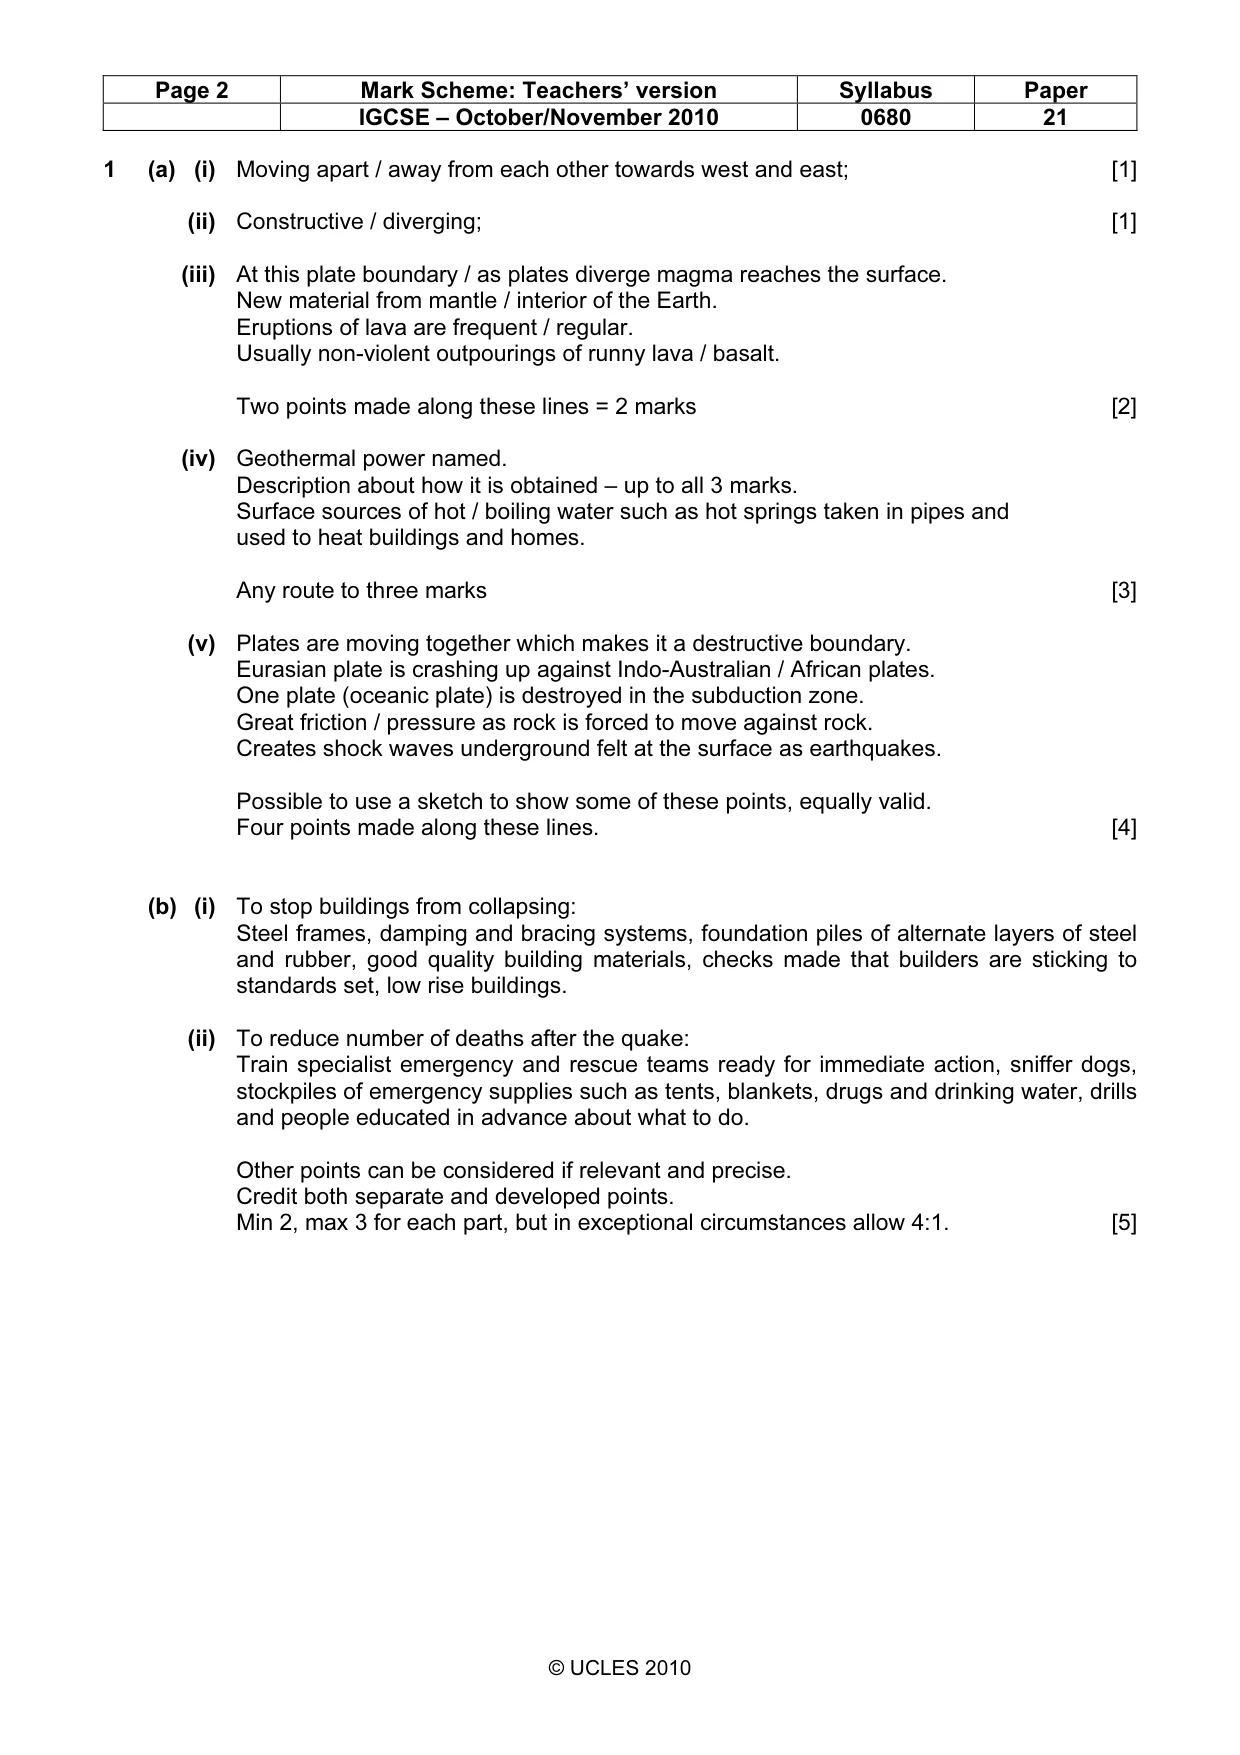
Page 2 Mark Scheme: Teachers’ version Syllabus Paper IGCSE – October/November 2010 0680 21 © UCLES 2010 1 (a) (i) Moving apart / away from each other towards west and east; [1] (ii) Constructive / diverging; [1] (iii) At this plate boundary / as plates diverge magma reaches the surface. New material from mantle / interior of the Earth. Eruptions of lava are frequent / regular. Usually non-violent outpourings of runny lava / basalt. Two points made along these lines = 2 marks [2] (iv) Geothermal power named. Description about how it is obtained – up to all 3 marks. Surface sources of hot / boiling water such as hot springs taken in pipes and used to heat buildings and homes. Any route to three marks [3] (v) Plates are moving together which makes it a destructive boundary. Eurasian plate is crashing up against Indo-Australian / African plates. One plate (oceanic plate) is destroyed in the subduction zone. Great friction / pressure as rock is forced to move against rock. Creates shock waves underground felt at the surface as earthquakes. Possible to use a sketch to show some of these points, equally valid. Four points made along these lines. [4] (b) (i) To stop buildings from collapsing: Steel frames, damping and bracing systems, foundation piles of alternate layers of steel and rubber, good quality building materials, checks made that builders are sticking to standards set, low rise buildings. (ii) To reduce number of deaths after the quake: Train specialist emergency and rescue teams ready for immediate action, sniffer dogs, stockpiles of emergency supplies such as tents, blankets, drugs and drinking water, drills and people educated in advance about what to do. Other points can be considered if relevant and precise. Credit both separate and developed points. Min 2, max 3 for each part, but in exceptional circumstances allow 4:1. [5]
Mark scheme, page 3
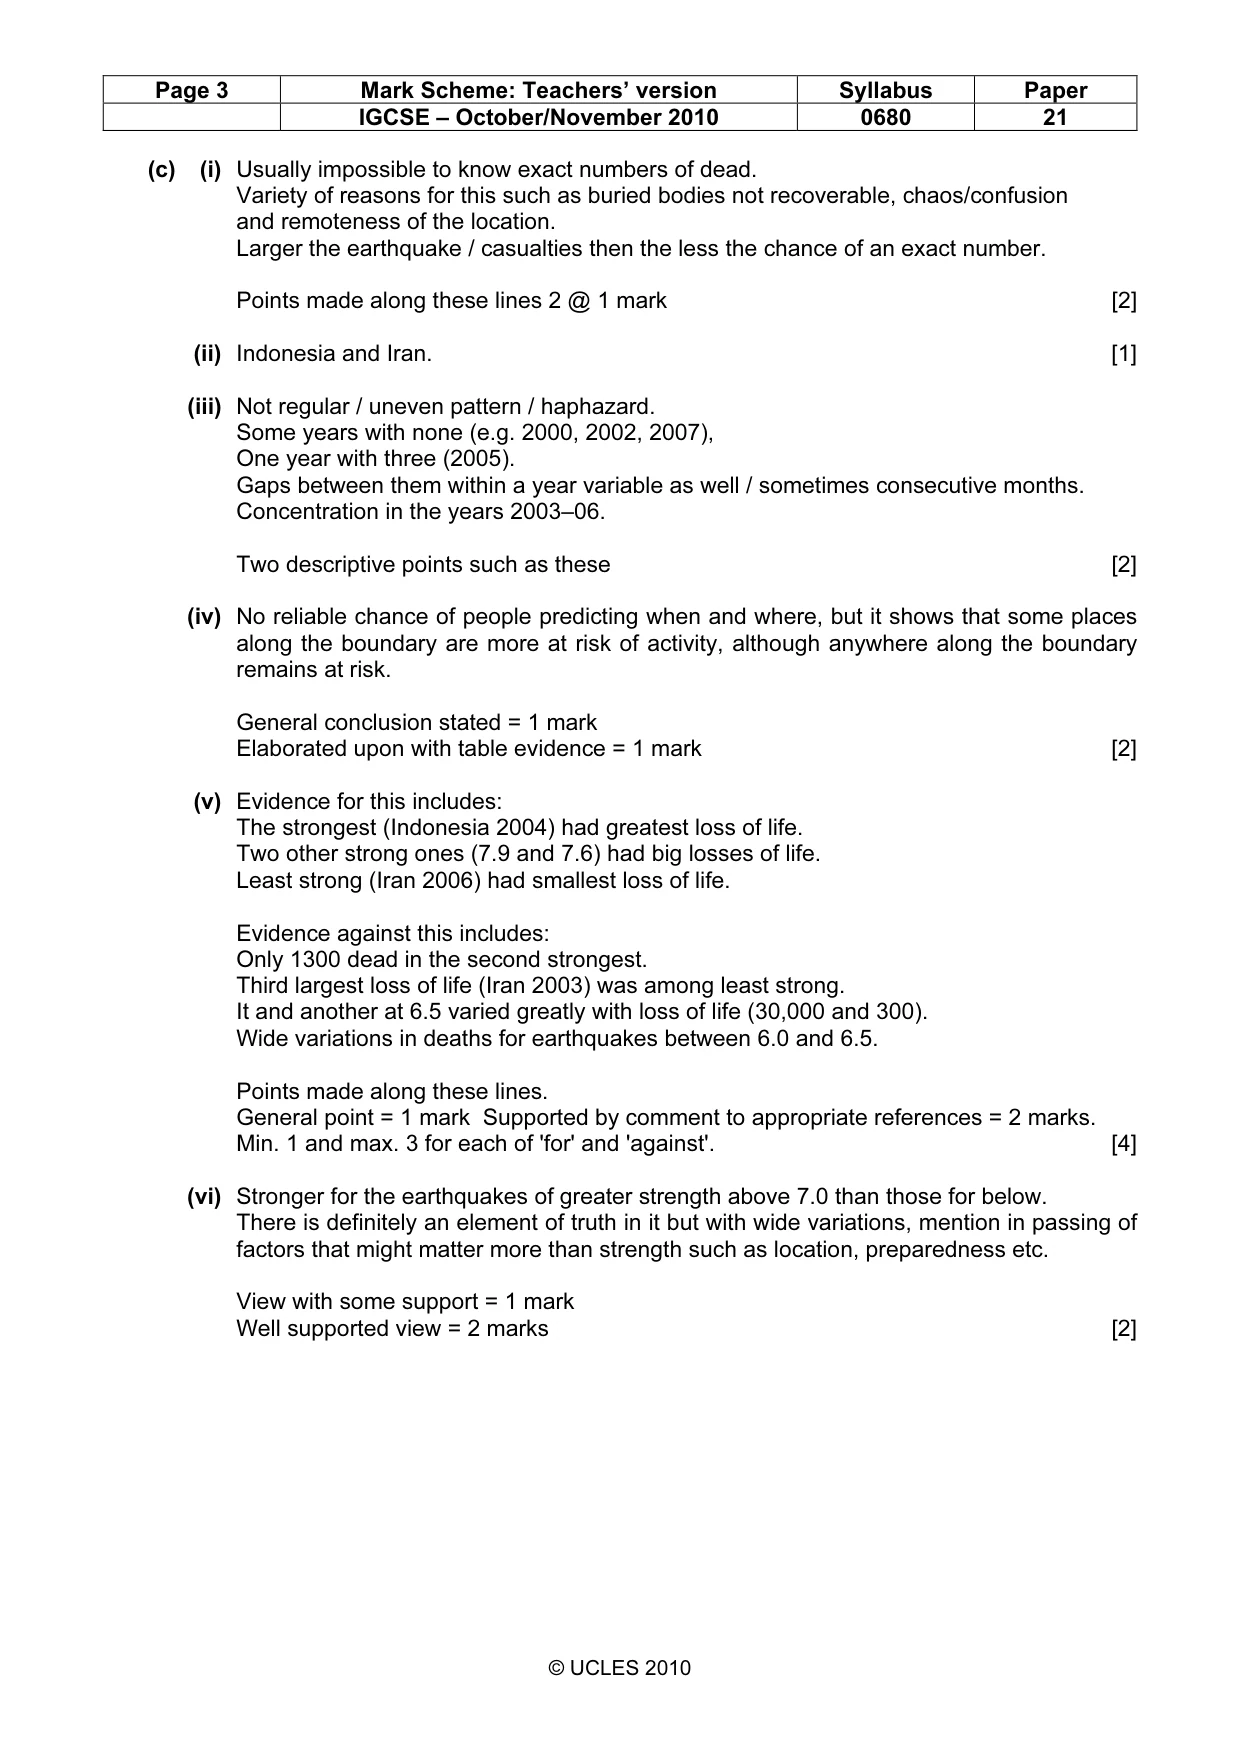
Page 3 Mark Scheme: Teachers’ version Syllabus Paper IGCSE – October/November 2010 0680 21 © UCLES 2010 (c) (i) Usually impossible to know exact numbers of dead. Variety of reasons for this such as buried bodies not recoverable, chaos/confusion and remoteness of the location. Larger the earthquake / casualties then the less the chance of an exact number. Points made along these lines 2 @ 1 mark [2] (ii) Indonesia and Iran. [1] (iii) Not regular / uneven pattern / haphazard. Some years with none (e.g. 2000, 2002, 2007), One year with three (2005). Gaps between them within a year variable as well / sometimes consecutive months. Concentration in the years 2003–06. Two descriptive points such as these [2] (iv) No reliable chance of people predicting when and where, but it shows that some places along the boundary are more at risk of activity, although anywhere along the boundary remains at risk. General conclusion stated = 1 mark Elaborated upon with table evidence = 1 mark [2] (v) Evidence for this includes: The strongest (Indonesia 2004) had greatest loss of life. Two other strong ones (7.9 and 7.6) had big losses of life. Least strong (Iran 2006) had smallest loss of life. Evidence against this includes: Only 1300 dead in the second strongest. Third largest loss of life (Iran 2003) was among least strong. It and another at 6.5 varied greatly with loss of life (30,000 and 300). Wide variations in deaths for earthquakes between 6.0 and 6.5. Points made along these lines. General point = 1 mark Supported by comment to appropriate references = 2 marks. Min. 1 and max. 3 for each of 'for' and 'against'. [4] (vi) Stronger for the earthquakes of greater strength above 7.0 than those for below. There is definitely an element of truth in it but with wide variations, mention in passing of factors that might matter more than strength such as location, preparedness etc. View with some support = 1 mark Well supported view = 2 marks [2]
Mark scheme, page 4
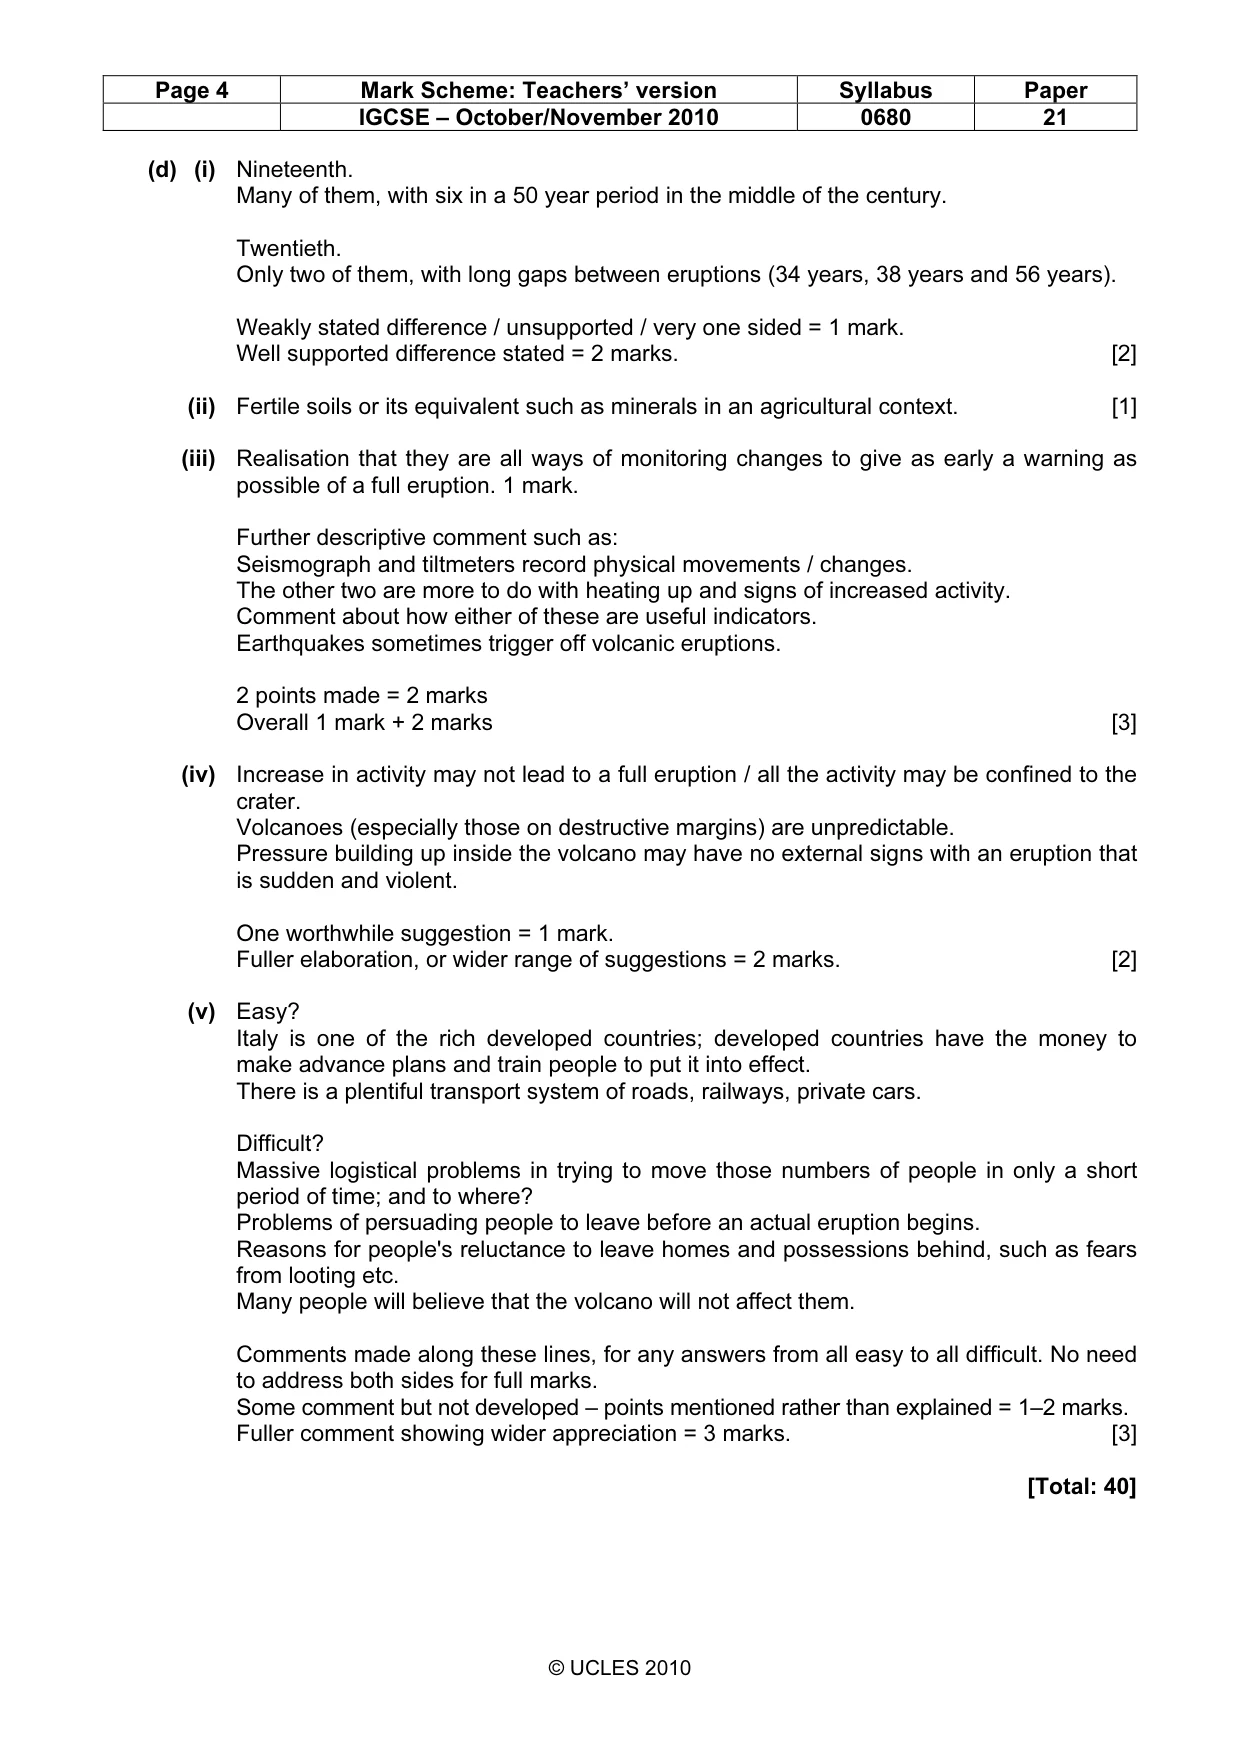
Page 4 Mark Scheme: Teachers’ version Syllabus Paper IGCSE – October/November 2010 0680 21 © UCLES 2010 (d) (i) Nineteenth. Many of them, with six in a 50 year period in the middle of the century. Twentieth. Only two of them, with long gaps between eruptions (34 years, 38 years and 56 years). Weakly stated difference / unsupported / very one sided = 1 mark. Well supported difference stated = 2 marks. [2] (ii) Fertile soils or its equivalent such as minerals in an agricultural context. [1] (iii) Realisation that they are all ways of monitoring changes to give as early a warning as possible of a full eruption. 1 mark. Further descriptive comment such as: Seismograph and tiltmeters record physical movements / changes. The other two are more to do with heating up and signs of increased activity. Comment about how either of these are useful indicators. Earthquakes sometimes trigger off volcanic eruptions. 2 points made = 2 marks Overall 1 mark + 2 marks [3] (iv) Increase in activity may not lead to a full eruption / all the activity may be confined to the crater. Volcanoes (especially those on destructive margins) are unpredictable. Pressure building up inside the volcano may have no external signs with an eruption that is sudden and violent. One worthwhile suggestion = 1 mark. Fuller elaboration, or wider range of suggestions = 2 marks. [2] (v) Easy? Italy is one of the rich developed countries; developed countries have the money to make advance plans and train people to put it into effect. There is a plentiful transport system of roads, railways, private cars. Difficult? Massive logistical problems in trying to move those numbers of people in only a short period of time; and to where? Problems of persuading people to leave before an actual eruption begins. Reasons for people's reluctance to leave homes and possessions behind, such as fears from looting etc. Many people will believe that the volcano will not affect them. Comments made along these lines, for any answers from all easy to all difficult. No need to address both sides for full marks. Some comment but not developed – points mentioned rather than explained = 1–2 marks. Fuller comment showing wider appreciation = 3 marks. [3] [Total: 40]
Mark scheme, page 5
Page 5 Mark Scheme: Teachers’ version Syllabus Paper IGCSE – October/November 2010 0680 21 © UCLES 2010 2 (a) (i) Correct plot = 2 marks. One segment correct = 1 mark. Completing the key (provided that the graph is attempted) = 1 mark. [3] (ii) Water vapour This is the source for cloud formation and precipitation in the atmosphere (water cycle). Water is needed for plants (the producers) to grow and to keep both animals and humans alive. Water is lost by transpiration and perspiration. Carbon dioxide Soaked up by plants for photosynthesis; plants are the producers upon which consumers depend, herbivores directly and carnivores indirectly, and they release oxygen – also it absorbs heat radiated from the surface and stops the Earth cooling down massively on a night. Without it, the Earth would be much colder and lifeless. Ozone Located high in the atmosphere, it absorbs ultraviolet rays which would otherwise harm plants, animals and humans (e.g. skin cancer). Minimum 1 mark, maximum 3 marks for each of these. Otherwise any combination / route to the 6 mark total. [6] (iii) Through various cycles and energy flows, e.g. carbon cycle: from intake of carbon dioxide by green plants to decay and respiration by plants and animals, e.g. nitrogen cycle from use by plants after the work of bacteria in root nodules to death, decay and excretion from plants and animals, return to atmosphere by dentrifying bacteria. Basic idea or mention of cycle(s) without use = 1 mark. Elaboration or exemplification = 2 or 3 marks. [3] (b) (i) Line drawn linking tops of bars to show trend. [1] (ii) Before 1960. Steady (but persistent) increase. Increase of 140 billion tonnes in 100 years. After 1960. Noticeably faster increase. Larger increase of 200 billion tonnes in just 40 years. Trends without fully establishing the difference = 1 mark. Trends with difference emphasised = 2 marks. Emphasised trends supported by use of values = 3 marks. [3] (iii) 'Thicker layer' / greater concentration of carbon dioxide in the upper atmosphere. More radiated heat trapped while incoming sunlight stays the same. The greenhouse effect, accelerating a natural process to increase average world temperatures by about 0.8°C between 1900 & 2000. Carbon dioxide is just one of the greenhouse gases along with methane, CFCs and nitrogen oxides. Three points made along these lines. [3]
Mark scheme, page 6
Page 6 Mark Scheme: Teachers’ version Syllabus Paper IGCSE – October/November 2010 0680 21 © UCLES 2010 (c) (i) Together they account for about half of total world emissions. China responsible for slightly more carbon dioxide emissions than USA, but much lower amount per head than in USA. Per head consumption in USA is 4 times greater than in China. Three of these. [3] (ii) Many industries owned by American companies have moved to China. They have taken their carbon emissions with them. Goods made in Chinese factories are exported and sold in the USA. Moving emissions to China has left the USA a cleaner place. Any further comment about the reasons for this movement. Three points made along these lines. [3] (d) Order of infilling for the boxes: Rising sea levels. Sea defences breached. Flooding of low lying coastal areas such as deltas. Previously populated areas abandoned. All placed in the correct order = 3 marks. 2 or 3 correct = 2 marks. 1 correct = 1 mark. [3] (e) (i) Nowhere on the Maldives is above 2.4 metres above sea level; unlike other countries, there is no place to retreat away to avoid rising sea levels, and its income heavily dependent on tourism will just disappear. Some understanding = 1 mark. Well understood including comparative mention with other countries = 2 marks. [2] (ii) Only answer easy to justify is totally true if climate change is due to the enhanced greenhouse effect. This is because industries and transport in developed countries have mainly been responsible for the emissions, the USA in particular, many of which have been reluctant to adopt measures for a reduction. Also relevant are references to recent and likely future increases in China and India. OR A supported view that climate change is natural is a way to try to explain a partly true or a not true answer. View and some supporting explanation = 1 mark Precisely explained / supported view = 2 marks [2] (iii) Possible problems: Finding a country willing to sell land. Land and environments elsewhere are likely to be very different from home. What will the economic opportunities be? Getting everyone to leave especially as flooding is likely to be phased. Likely problem identified with little further description = 1 mark. Identified and further elaborated upon = 2 marks. [2]
Mark scheme, page 7
Page 7 Mark Scheme: Teachers’ version Syllabus Paper IGCSE – October/November 2010 0680 21 © UCLES 2010 (f) (i) Person B Some of these climatic disasters are regular events in the areas named. e.g. annual monsoon in India, cyclone season each year in Bangladesh. Ethiopia is on the edge of the Sahara desert and in the Sahel. They are to do with the world pattern of pressure and winds i.e. normal climatic events, such as the hurricane season in the Gulf of Mexico. Person C Poor people in developing countries are more badly affected by natural hazards than are rich people in developed countries. The answer lies in preparation before the event and provision of emergency services after the event, both of which are money related (for both people and the economy). Reference also to big populations and rapidly increasing populations in Asia and Africa could also be made. Views explained – 2 marks for each view 2 @ 2 marks. (Exceptionally only allow 3:1 or 1:3). [4] (ii) Some people like A are now of the opinion that climate change is causing climate hazards that already exist to be worse / more intense / more frequent e.g. stronger cyclone seasons, more protracted droughts. However, it is possible that because of better communications more people learn about them faster; it could be that there are simply more people to be affected in areas regularly hit by them. Explaining strength of view A, or why the views of B and C may be stronger. Mark the explanation rather than the view expressed. Statements made that support view taken = 1 mark. 'How far' part of the question addressed as well = 2 marks. [2] [Total: 40]
What you needed in this session
Cambridge’s own grade thresholds for 2010 Oct/Nov, Paper 2 · Variant 1. A higher threshold means an easier paper — the bar moves with how the cohort did.