Questions as text
Q1 · Australian firms have been praised for introducing new technology 0987/21 May/June 2020
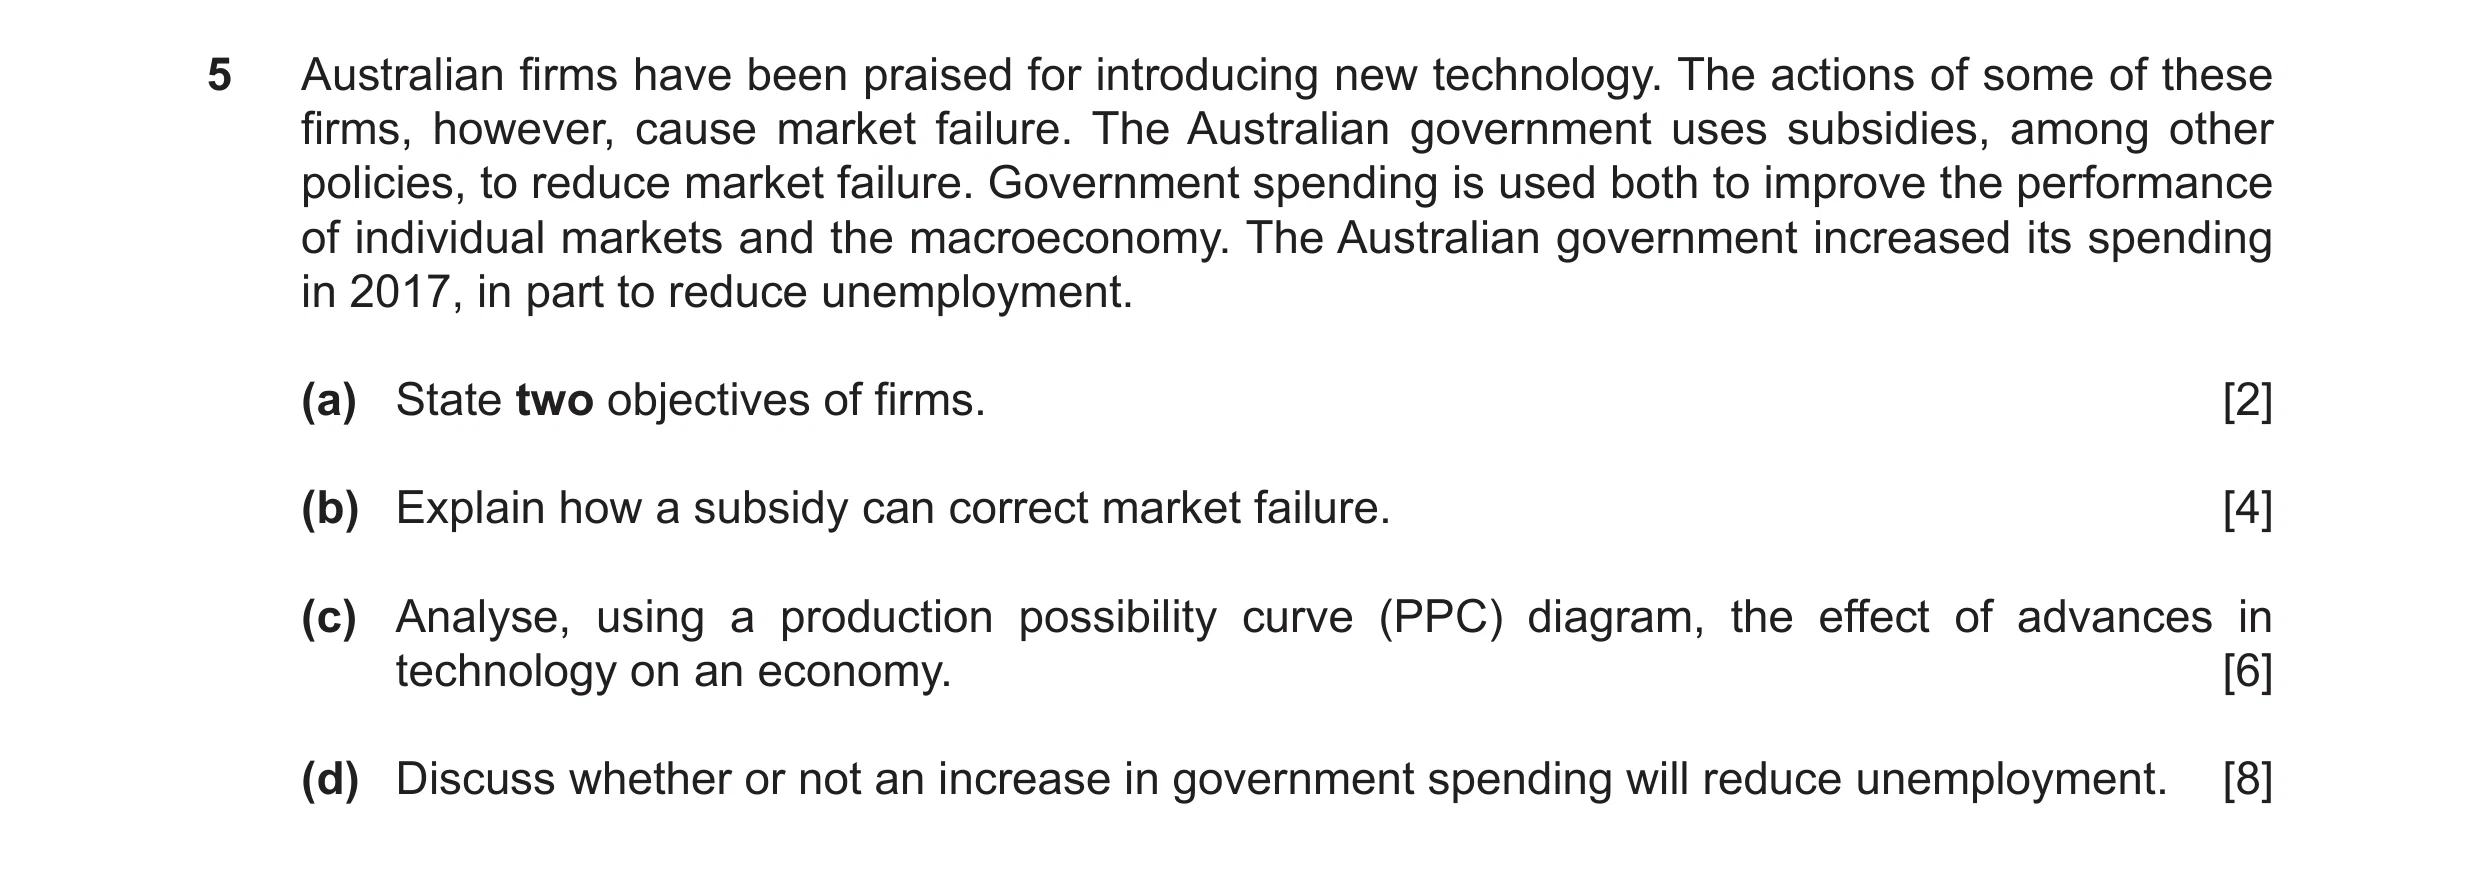
5 Australian firms have been praised for introducing new technology. The actions of some of these firms, however, cause market failure. The Australian government uses subsidies, among other policies, to reduce market failure. Government spending is used both to improve the performance of individual markets and the macroeconomy. The Australian government increased its spending in 2017, in part to reduce unemployment. (a) State two objectives of firms. [2] (b) Explain how a subsidy can correct market failure. [4] (c) Analyse, using a production possibility curve (PPC) diagram, the effect of advances in technology on an economy. [6] (d) Discuss whether or not an increase in government spending will reduce unemployment. [8]
20 marks
Mark scheme: 5(a) State two objectives of firms. 2 One mark each for two from: survival, social welfare, profit maximisation and growth. 5(b) Explain how a subsidy can correct market failure. 4 Logical explanation which might include: A payment to increase production (1) and lower price (1) can increase consumption of merit goods (1) products with positive externalities (1) which are under-consumed if left to market forces (1) can be paid to private sector firms to produce public goods (1) would not be produced if left to market forces (1). 5(c) Analyse, using a production possibility curve (PPC) diagram, the effect 6 of advances in technology on an economy. Up to 4 marks for the diagram: Axes correctly drawn (1). Initial curve drawn as a curve or a downward sloping line to the axes (1). New curve drawn as a curve or a downward sloping line to the axes (1). Shift to the right indicated by arrow or lettering (1). Up to 2 marks for logical analysis: Advances in technology raise the quality of capital (1) increase productive capacity (1). 5(d) Discuss whether or not an increase in government spending will 8 reduce unemployment. In assessing each answer, use the table below. Level Description Marks 3 A reasoned discussion which accurately examines both 6–8 sides of the economic argument, making use of economic information and clear and logical analysis to evaluate economic issues and situations. One side of the argument may have more depth than the other but, overall, both sides of the argument are considered and developed. There is thoughtful evaluation of economic concepts, terminology, information and/or data appropriate to the question. The discussion may also point out the possible uncertainties of alternative decisions and outcomes. 2 A reasoned discussion which makes use of economic 3–5 information and clear analysis to evaluate economic issues and situations. The answer may lack some depth and development may be one-sided. There is relevant use of economic concepts, terminology, information and data appropriate to the question. 1 There is a simple attempt at using economic definitions 1–2 and terminology. Some reference may be made to economic theory, with occasional understanding. 0 A mark of zero should be awarded for no creditable 0 content. Why it might: • may raise total (aggregate) demand, encouraging firms to hire more workers • may be spent on education which may increase people’s skills • may be spent on healthcare which may make people fitter and more employable • may be spent on subsidies to firms which will encourage them to increase output and take on more workers. Why it might not: • if spent on unemployment benefits, it may encourage some people to leave their jobs • if there is full employment, it will just cause inflation • spending on education may be ineffective e.g. develop the wrong skills • higher total (aggregate) demand may encourage firms to use more capital goods rather than labour.
This question in 0987/21 May/June 2020
Q2 · Calculate the percentage of total world output of palm oil produced by Indonesia in 2017 0987/22 Oct/Nov 2020
1 (a) Calculate the percentage of total world output of palm oil produced by Indonesia in 2017. [1] (b) Identify two variable costs of producing palm oil. [2] (c) Explain one opportunity cost of conserving forests in Indonesia. [2] (d) Explain two external costs of the destruction of forests in Indonesia. [4] (e) Draw a demand and supply diagram to show the effect of a ban on burning stubble on the market for rice. [4] (f) Analyse the relationship between countries’ GDP per head ranking and HDI ranking. [5] (g) Discuss whether or not the immigration of workers would be likely to benefit the Indonesian economy. [6] (h) Discuss whether or not the Indonesian tourism industry will increase in the future. [6]
30 marks
Mark scheme: 1(a) Calculate the percentage of total world output of palm oil produced by Indonesia in 2017. 60% (1). 1 Accept 60. 1(b) Identify two variable costs of producing palm oil. • fertilisers • palm oil seeds • casual labour 2 If more than two are given, consider the first two only. Accept ‘labour’, ‘workers’ or ‘wages’ for ‘casual labour’. 1(c) Explain one opportunity cost of conserving forests in Indonesia. Logical explanation which might include: Palm oil not produced / rice not produced / tourism lost as a result of building fewer hotels / lost opportunity to Norwegian government to spend on e.g. education (1) (next) best alternative forgone (1). 2 1(d) Explain two external costs of the destruction of forests in Indonesia. Logical explanation which might include: Loss of wildlife habitats (1) extinction of species / harmful effect on animals not involved in the economic decision (1). Harmful gases/air pollution/pollution (1) unpleasant atmosphere for local residents / illnesses / global warming (1). 4 One mark for each of two costs identified and one mark for each of two explanations. Question Answer Marks Guidance 1(e) Draw a demand and supply diagram to show the effect of a ban on burning stubble on the market for rice. Axes correctly labelled – price and quantity or p and q (1). Demand and supply curves correctly labelled (1). Supply curve shifted to the left (1). Equilibriums – shown by lines P1 and Q1 and P2 and Q2, or by labelling equilibrium points as E1 and E2 (1). 4 For quantity label accept Q, quantity demanded, quantity supplied. Do not reward a completely macro diagram. O S2 P2 Q2 Q1 P1 S1 D1 price of rice quantity of rice Question Answer Marks Guidance 1(f) Analyse the relationship between countries’ GDP per head ranking and HDI ranking. Coherent analysis which might include: Expected relationship: Generally, the higher the GDP per head ranking, the higher the HDI ranking / positive relationship / direct relationship (1). Supporting evidence: The top country, the top two or top three countries with the highest GDP per head ranking have the highest HDI ranking (1) the country, two countries with the lowest GDP per head ranking have the lowest HDI ranking (1). Exception: Cuba or Indonesia (1) supportive data – Cuba has a lower GDP per head ranking than Indonesia but a higher HDI ranking than Indonesia (1). Analysis: It is the expected relationship (1). GDP is a component of HDI / HDI ranking influenced by additional factors – education and/or life expectancy / higher GDP per head enables more to be spent on education and healthcare (1). 5 HDI now includes years of schooling but accept an idea that it includes education - adult literacy rate was included in the old measure. Responses do not have to be in the format suggested but they should address the expected/normal relationship, offer supporting evidence of that, highlight any exceptions to that, and analyse the overall data. Question Answer Marks Guidance 1(g) Discuss whether or not the immigration of workers would be likely to benefit the Indonesian economy. Up to 4 marks why it might: • may be skilled workers (1) who may be more productive (1) • may be motivated to work harder (1) to improve quality of life (1) • bring in new ideas (1) improving production methods / use advanced technology (1) • may pay taxes (1) enabling the government to spend more (1) • fill vacancies left by Indonesians going to work abroad (1) • increase size of labour force (1) increase productive capacity (1) reduce dependency ratio (1) • may increase exports / total (aggregate) demand (1) may result in economic growth / increase output (1). Up to 4 marks why it might not: • population is already increasing (1) immigration may take it above the optimum level / lead to overpopulation / put pressure on resources (1) • pressure may be put on housing / education / food (1) • may put downward pressure on wages (1) may replace Indonesian workers / cause unemployment (1) lowering living standards (1) • may need training (1) increasing firms’ costs (1) • may increase pollution (1) • may send money home to relatives (1) may have to import more e.g. rice (1) negative impact on the current account of the balance of payments (1). 6 For an answer that examines the effects of migration of workers from Indonesia, a maximum of 2 marks. Apply this example to all questions with the command word DISCUSS (1(g), 1(h), 2(d), 3(d), 4(d) and 5(d)). Each point may be credited only once, on either side of an argument, but separate development as to how/why the outcome may differ is rewarded. Generic example mark Tax revenue may decrease … 1 ... because of reason e.g. incomes may be lower. 1 Tax revenue may increase because incomes may be higher i.e. reverse of a previous argument. 0 Tax revenue may increase because of a different reason i.e. not the reverse of a previous argument e.g. government spending on subsidies may stimulate the economy more than spending on education. 1 Question Answer Marks Guidance 1(h) Discuss whether or not the Indonesian tourism industry will increase in the future. Up to 4 marks for why it might: • it is currently price competitive (1) • if the exchange rate continues to fall (1), price of tourism for foreign visitors will fall (1) • it has natural tourist attractions (1) may preserve forests (1) • global economy is growing (1), incomes are rising (1) enabling foreigners to afford more holidays (1) • people coming from abroad to work in high paid jobs may be skilled / highly motivated (1) raise quality of tourism (1). • Indonesian government may subsidise the tourism industry (1) lowering costs of production (1). • the industry may be promoted /advertised (1) • air travel is falling in price (1) air travel is a complement to holidays (1) • foreign investment may be attracted into the industry (1) Up to 4 marks for why it might not: • pollution may discourage visitors (1) worried about health (1) • there are substitutes (1) Indonesia has competition from neighbouring countries (1) • natural areas of beauty may be destroyed (1) by e.g. new palm oil plantations / natural disasters (1) • net emigration (1) may mean there are not enough workers (1). • Covid-19 may continue to reduce tourism (1). 6
This question in 0987/22 Oct/Nov 2020
Q3 · Australia experienced a drought in 2018 which caused its agricultural output to fall 0987/21 May/June 2021
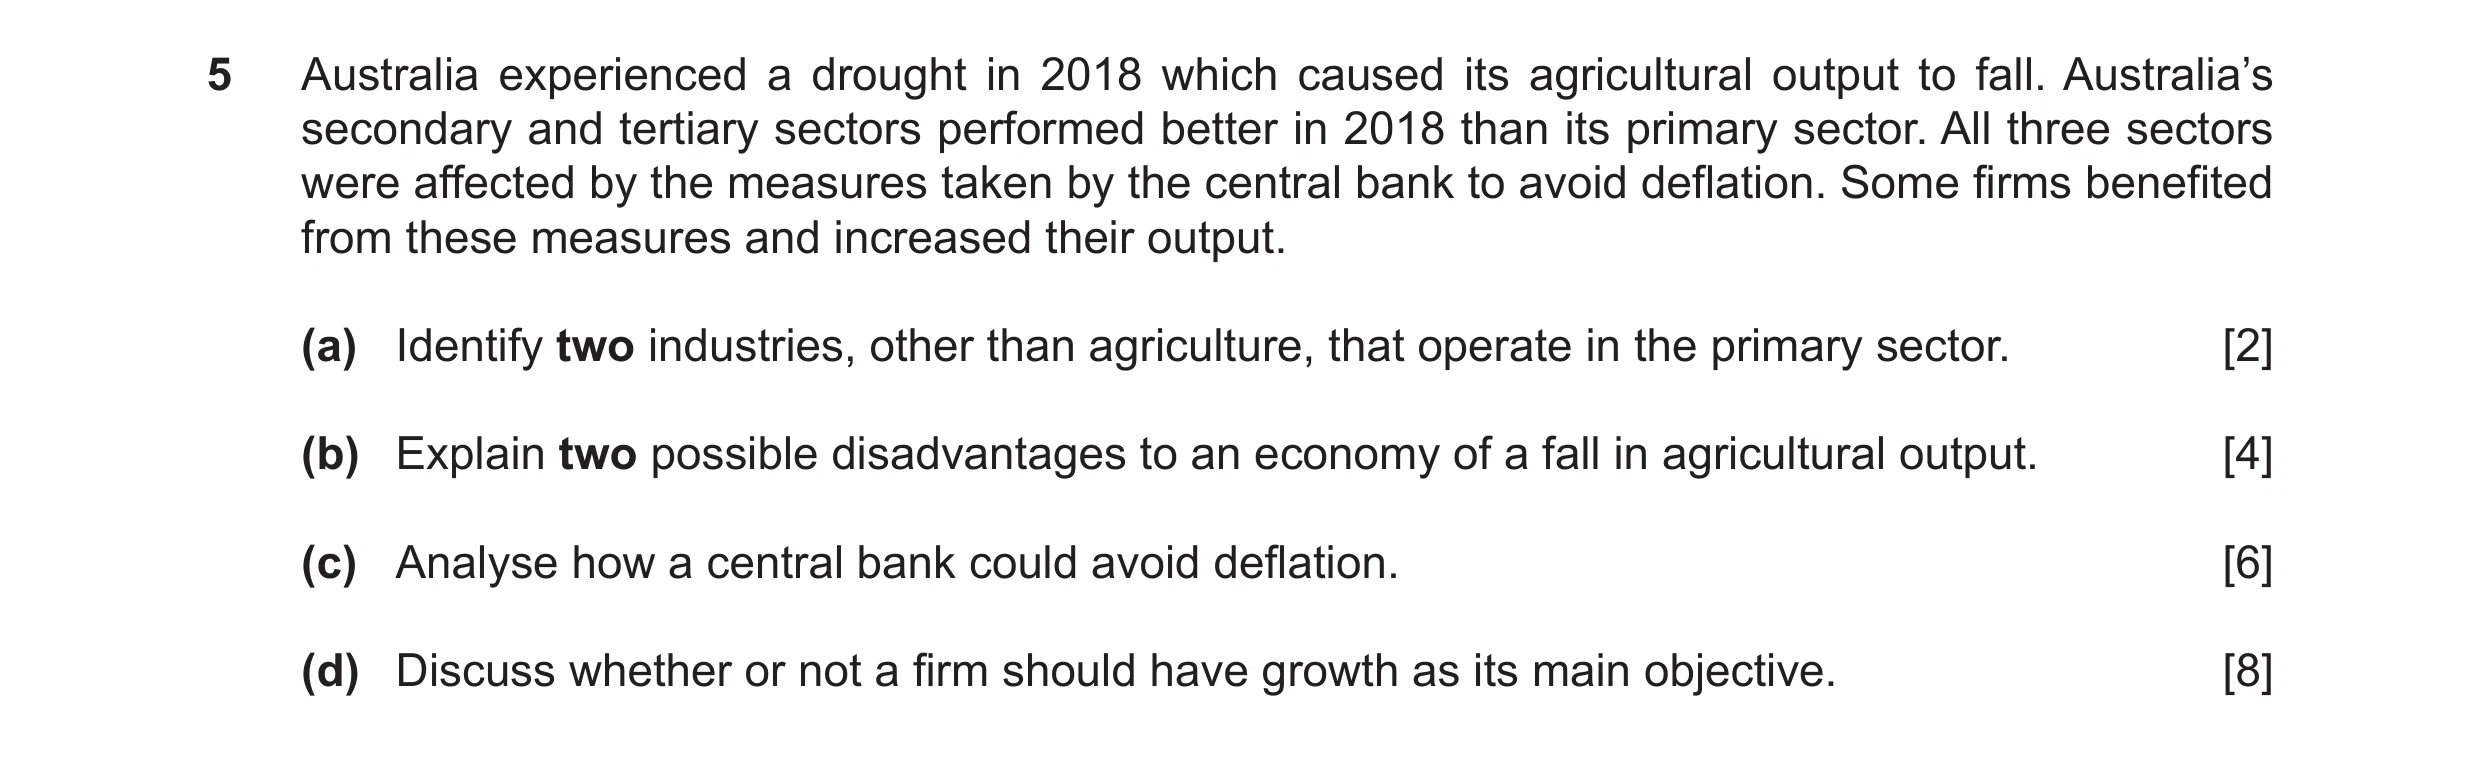
5 Australia experienced a drought in 2018 which caused its agricultural output to fall. Australia’s secondary and tertiary sectors performed better in 2018 than its primary sector. All three sectors were affected by the measures taken by the central bank to avoid deflation. Some firms benefited from these measures and increased their output. (a) Identify two industries, other than agriculture, that operate in the primary sector. [2] (b) Explain two possible disadvantages to an economy of a fall in agricultural output. [4] (c) Analyse how a central bank could avoid deflation. [6] (d) Discuss whether or not a firm should have growth as its main objective. [8]
20 marks
Mark scheme: 5(a) Identify two industries, other than agriculture, that operate in the primary sector. Two from e.g.: Mining, fishing, forestry, oil extraction 2 5(b) Explain two possible disadvantages to an economy of a fall in its agricultural output. Logical explanation which might include: • Shortage of food / famine (1) may have to import more food (1) export less food (1) worsen the current account position (1). • Price of food may rise (1) may increase poverty / might worsen health (1). • Less food production (1) unemployment may increase (1) if lack of labour mobility / structural unemployment (1). • May result in migration from rural to urban areas (1) putting pressure on resources in urban areas (1). • Economic growth / GDP will fall (1) if lower agricultural output is not offset by rise in output of secondary and tertiary sectors (1). 4 One mark each for each of two disadvantages identified and one mark each for each of two explanations. 5(c) Analyse how a central bank could avoid deflation. • Deflation is a fall in the price level (1). • The central bank could lower the rate of interest (1) reduce return from saving (1) encourage borrowing (1) encourage a rise in consumer expenditure (1) encouraging firms to raise their prices (1). • It could increase the money supply (1) increasing bank lending (1) increasing investment (1). • Expansionary monetary policy (1) increases total (aggregate) demand (1) causing prices to rise (1). 6 Question Answer Marks Guidance 5(d) Discuss whether or not a firm should have growth as its main objective. In assessing each answer, use the table opposite. Why it should: • may increase market share • may increase market power • may increase profits / keep shareholders happy • may enable the firm to take greater advantage of economies of scale • may increase pay and job security of managers / directors • may make it more difficult for another firm to take it over as will involve a greater cost Why it might not: • if demand is falling, survival may be a more appropriate main objective • if demand is limited e.g. a niche market, growth may be an unlikely objective • profit maximisation as an objective, if successful, will provide the funds for growth in the longer run • state-owned enterprise may have social welfare as an objective • growth may result in diseconomies of scale • growth may put pressure on workers which could lower productivity / result in higher labour turnover • may make it more attractive for a firm to take it over 8 Level Description Marks 3 A reasoned discussion which accurately examines both sides of the economic argument, making use of economic information and clear and logical analysis to evaluate economic issues and situations. One side of the argument may have more depth than the other, but overall both sides of the argument are considered and developed. There is thoughtful evaluation of economic concepts, terminology, information and/or data appropriate to the question. The discussion may also point out the possible uncertainties of alternative decisions and outcomes. 6–8 2 A reasoned discussion which makes use of economic information and clear analysis to evaluate economic issues and situations. The answer may lack some depth and development may be one- sided. There is relevant use of economic concepts, terminology, information and data appropriate to the question. 3–5 Question Answer Marks Guidance 5(d) Level Description Marks 1 There is a simple attempt at using economic definitions and terminology. Some reference may be made to economic theory, with occasional understanding. 1–2 0 A mark of zero should be awarded for no creditable content. 0
This question in 0987/21 May/June 2021
Q4 · Two of Uzbekistan’s main industries are cotton and gas 0987/22 Oct/Nov 2021
3 Two of Uzbekistan’s main industries are cotton and gas. Uzbekistan is the world’s seventh largest producer, and fifth largest exporter, of cotton. The Uzbek government has tried to influence the cotton industry’s price elasticity of supply. It has also nearly ended the use of child labour in cotton production. The country’s output of gas increased by 7% in 2018 and its average cost of gas production fell. (a) Identify two determinants of price elasticity of supply. [2] (b) Explain two advantages to an economy of ending child labour. [4] (c) Analyse how average cost can change as output increases. [6] (d) Discuss whether or not an economy would benefit from allocating more of its resources to agriculture. [8]
20 marks
Mark scheme: 3(a) Identify two determinants of price elasticity of supply. Two from: • ability to store • level of stocks • perishability • production time • level of spare capacity • cost of altering supply • time period under consideration – short/long run 2 Accept weather. 3(b) Explain two advantages to an economy of ending child labour. Logical explanation which might include: Enable children to be educated (1) raise productivity / workers’ skills / literacy rates / long run economic growth (1). Improve children’s health (1) increase life expectancy / raise living standards (1). Reduce cycle of poverty (1) children will later gain higher paid jobs (1). Raise wages (1) due to reduced supply of cheap labour (1). Remove international bans / encourage more foreign tourists (1) increase exports (1). Increase job opportunities for adults (1) lower unemployment / increase employment of adults (1). 4 One mark each for each of two advantages identified and one mark each for each of two explanations. Question Answer Marks Guidance 3(c) Analyse how average cost can change as output increases. Average cost may fall due to economies of scale (1) example of an economy of scale e.g. financial economy (1) explanation of the example (up to 2 marks) e.g. banks may charge lower interest rates (1) reducing firms’ cost of borrowing (1). Another example e.g. buying economy (1) explanation of the example (up to 2 marks) e.g. able to buy in bulk (1) and receive a discount (1). Higher output may enable fixed costs to be spread over a larger output (1) which may reduce average fixed costs (1) whether average total cost will fall will depend on what happens to average fixed cost plus average variable cost (1). Average cost may rise due to diseconomies of scale (1) example e.g. managerial economy (1) explanation of the example (up to 2 marks) e.g. difficulty of keeping control of a large organisation (1) leading to more mistakes / poor decision making (1). Another example e.g. poor labour relations (1) explanation of the example (up to 2 marks) e.g. lack of contact between workers and managers (1) may be strikes (1). 6 Nothing for reference to causes of changes in total costs e.g. employing more workers will increase wages paid. Question Answer Marks Guidance 3(d) Discuss whether or not an economy would benefit from allocating more of its resources to agriculture. In assessing each answer, use the table opposite. Why it might: • specialisation may increase efficiency, raise output, increase exports • may improve the current account of the balance of payments • imports of food may be reduced, reduced reliance on other countries for basic necessities • health and safety standards may be maintained • the industry is labour intensive in some countries and so may reduce unemployment Why it might not: • wages in the industry tend to be relatively low • the supply of agricultural products can fluctuate significantly due to changes in weather conditions • opportunity cost of fewer resources for manufacturing goods and for services • demand for manufactured goods and for services tend to rise more as income increases • agriculture uses up considerable amounts of water. 8 Level Description Marks 3 A reasoned discussion which accurately examines both sides of the economic argument, making use of economic information and clear and logical analysis to evaluate economic issues and situations. One side of the argument may have more depth than the other, but overall, both sides of the argument are considered and developed. There is thoughtful evaluation of economic concepts, terminology, information and/or data appropriate to the question. The discussion may also point out the possible uncertainties of alternative decisions and outcomes. 6–8 2 A reasoned discussion which makes use of economic information and clear analysis to evaluate economic issues and situations. The answer may lack some depth and development may be one-sided. There is relevant use of economic concepts, terminology, information and data appropriate to the question. 3–5 1 There is a simple attempt at u sing economic definitions and terminology. Some reference may be made to economic theory, with occasional understanding. 1–2 Question Answer Marks Guidance 3(d) Level Description Marks 0 A mark of zero should be awarded for no creditable content. 0
This question in 0987/22 Oct/Nov 2021
Q5 · Nicaragua experienced a 4% decrease in GDP in 2019, although household spending rose 0987/22 May/June 2022
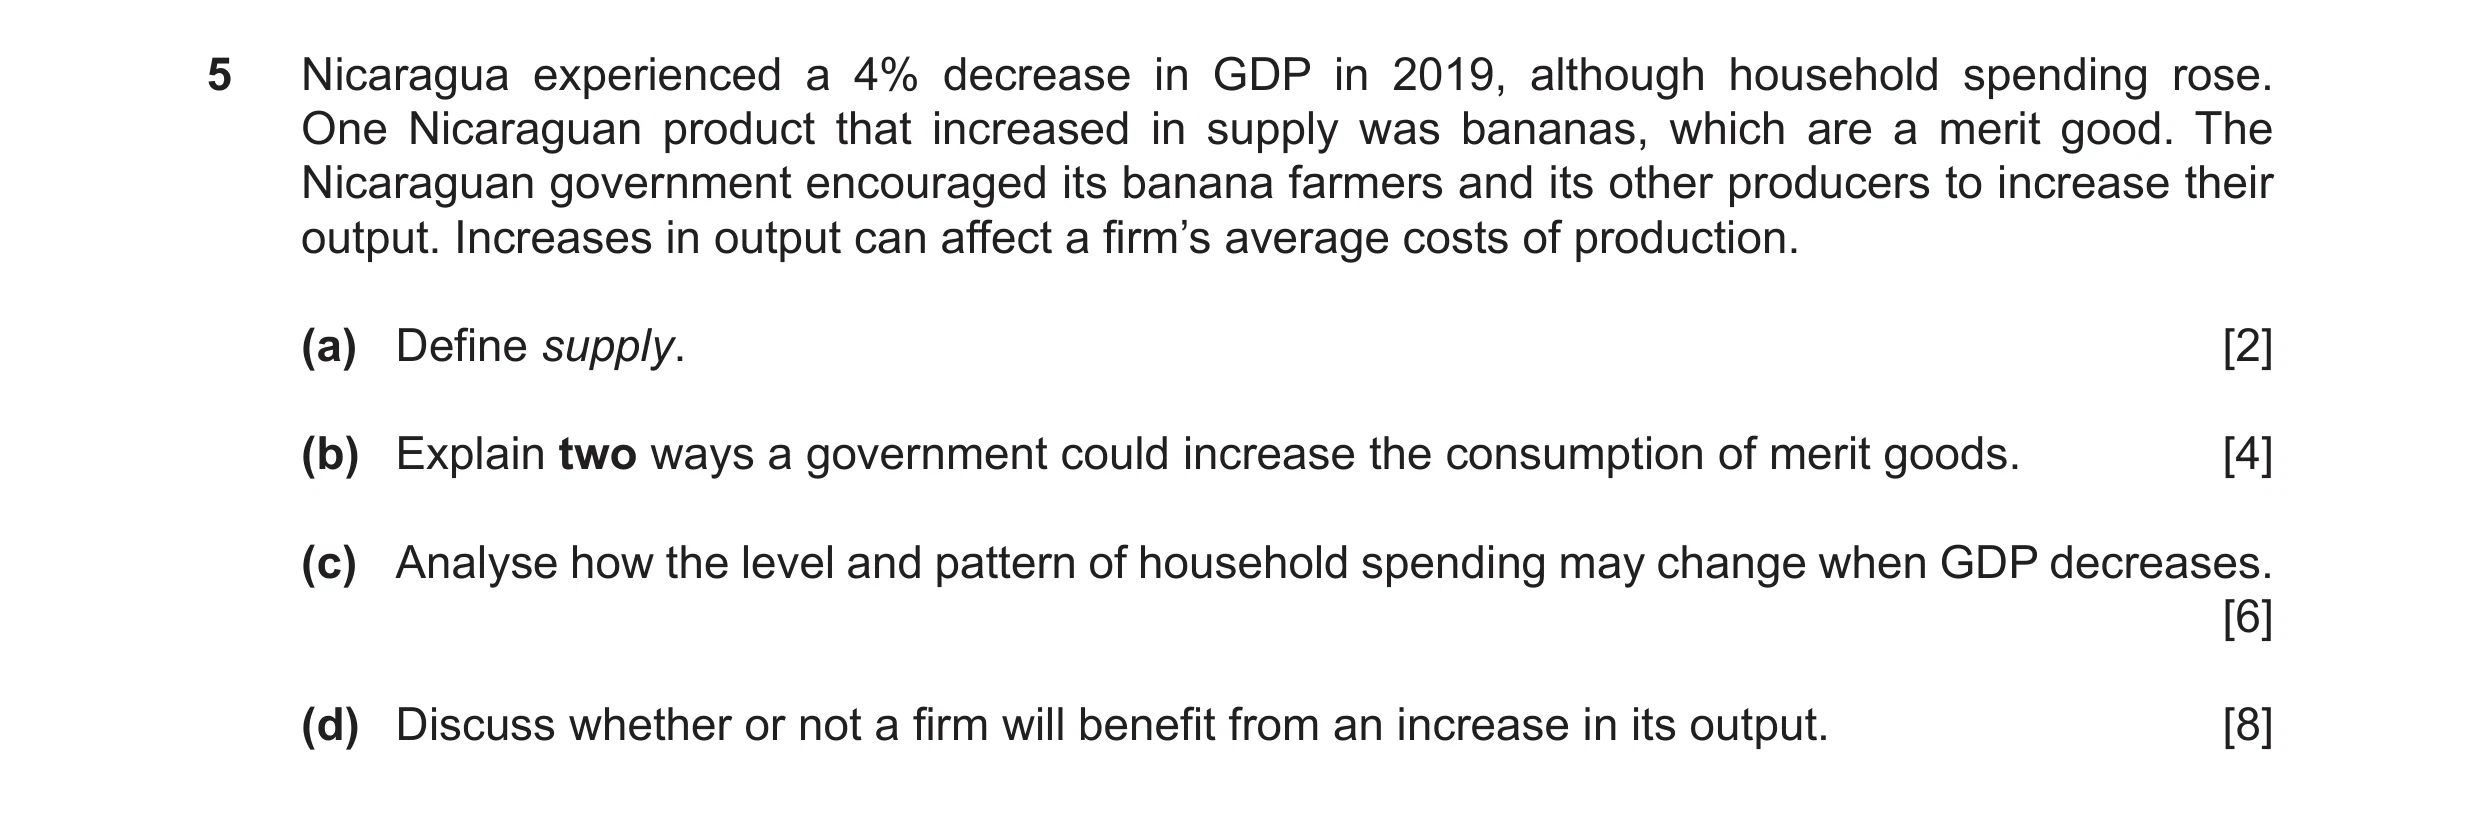
5 Nicaragua experienced a 4% decrease in GDP in 2019, although household spending rose. One Nicaraguan product that increased in supply was bananas, which are a merit good. The Nicaraguan government encouraged its banana farmers and its other producers to increase their output. Increases in output can affect a firm’s average costs of production. (a) Define supply. [2] (b) Explain two ways a government could increase the consumption of merit goods. [4] (c) Analyse how the level and pattern of household spending may change when GDP decreases. [6] (d) Discuss whether or not a firm will benefit from an increase in its output. [8]
20 marks
Mark scheme: 5(a) Define supply. Willingness to sell a product (1) and ability to sell a product (1). Supply at a given price / in a given time period (1). 2 Allow one mark in total for amount produced or amount sold. Need idea of selling / making available to consumers for full two marks. 5(b) Explain two ways a government could increase the consumption of merit goods. Logical explanation which might include: Provide information/education (1) about the benefits of merit goods / consumers may be unaware of full benefits (1). Provide merit goods free / direct provision (1) e.g. education and healthcare / nationalise industries producing merit goods (1). Subsidise the production of merit goods (1) to lower prices (1). Subsidise the consumption of merit goods (1) by e.g. providing vouchers (1). Set a maximum price / price ceiling (1) to make merit goods more affordable / to lower price (1), Pass laws / introduce regulation (1) to make consumption of merit goods compulsory (1). Remove / cut indirect taxes on merit goods (1) to make them more affordable / to lower price (1). 4 One mark for each of two ways identified and one mark for each explanation. Can accept lower price as a development of a subsidy for a mark and lower price as another mark if given as a development of indirect taxes or maximum price. Question Answer Marks Guidance 5(c) Analyse how the level and pattern of household spending may change when GDP decreases. Coherent analysis which might include: Spending may decrease (1) as households may have less income (1) less able to buy goods and services / lower purchasing power (1). Lower GDP may reduce confidence / create greater uncertainty (1) encouraging people to save more (1). May borrow less (1) may be concerned cannot repay (1). May expect prices to fall further (1) delay purchases (1). Spending may not decrease if households think the decrease is temporary (1) may borrow (1) as interest rates may be lower (1) may use past saving to finance spending (1). May spend a higher proportion on basic necessities (1) less on luxuries/wants (1). May spend a higher proportion of income (1) as saving may fall by more than spending (1). Households may spend less on imports (1) imports may be higher in price / lower in quality (1). GDP may decrease but GDP per head may rise (1) if population falls by more than GDP (1). 6 Reward but do not expect: reference to inferior and normal goods. dissaving. Nominal GDP may fall but real GDP may rise if there is deflation Question Answer Marks Guidance 5(d) Discuss whether or not a firm will benefit from an increase in its output. In assessing each answer, use the table opposite. Why it might: may increase average revenue, if higher output is result of higher demand profits may rise if average revenue raises more than average cost may be able to make greater use of spare capacity higher output may increase a firm’s market power greater advantage may be taken of technical, marketing managerial, labour and risk bearing economies of scale. Why it might not: average revenue may fall, higher output may reduce price not all of the higher output may be sold / may be a lack of demand diseconomies of scale may be experienced managerial / communication problems may occur / labour relations may decline growth achieved by vertical merger may lead to problems of co-ordination. 8 Level Description Marks 3 A reasoned discussion which accurately examines both sides of the economic argument, making use of economic information and clear and logical analysis to evaluate economic issues and situations. One side of the argument may have more depth than the other, but overall, both sides of the argument are considered and developed. There is thoughtful evaluation of economic concepts, terminology, information and/or data appropriate to the question. The discussion may also point out the possible uncertainties of alternative decisions and outcomes. 68 Question Answer Marks Guidance 5(d) 2 A reasoned discussion which makes use of economic information and clear analysis to evaluate economic issues and situations. The answer may lack some depth and development may be one-sided. There is relevant use of economic concepts, terminology, information and data appropriate to the question. 35 1 There is a simple attempt at using economic definitions and terminology. Some reference may be made to economic theory, with occasional understanding. 12 0 A mark of zero should be awarded for no creditable content. 0
This question in 0987/22 May/June 2022
Q6 · Canada’s private sector firms have a number of different objectives 0987/22 May/June 2023
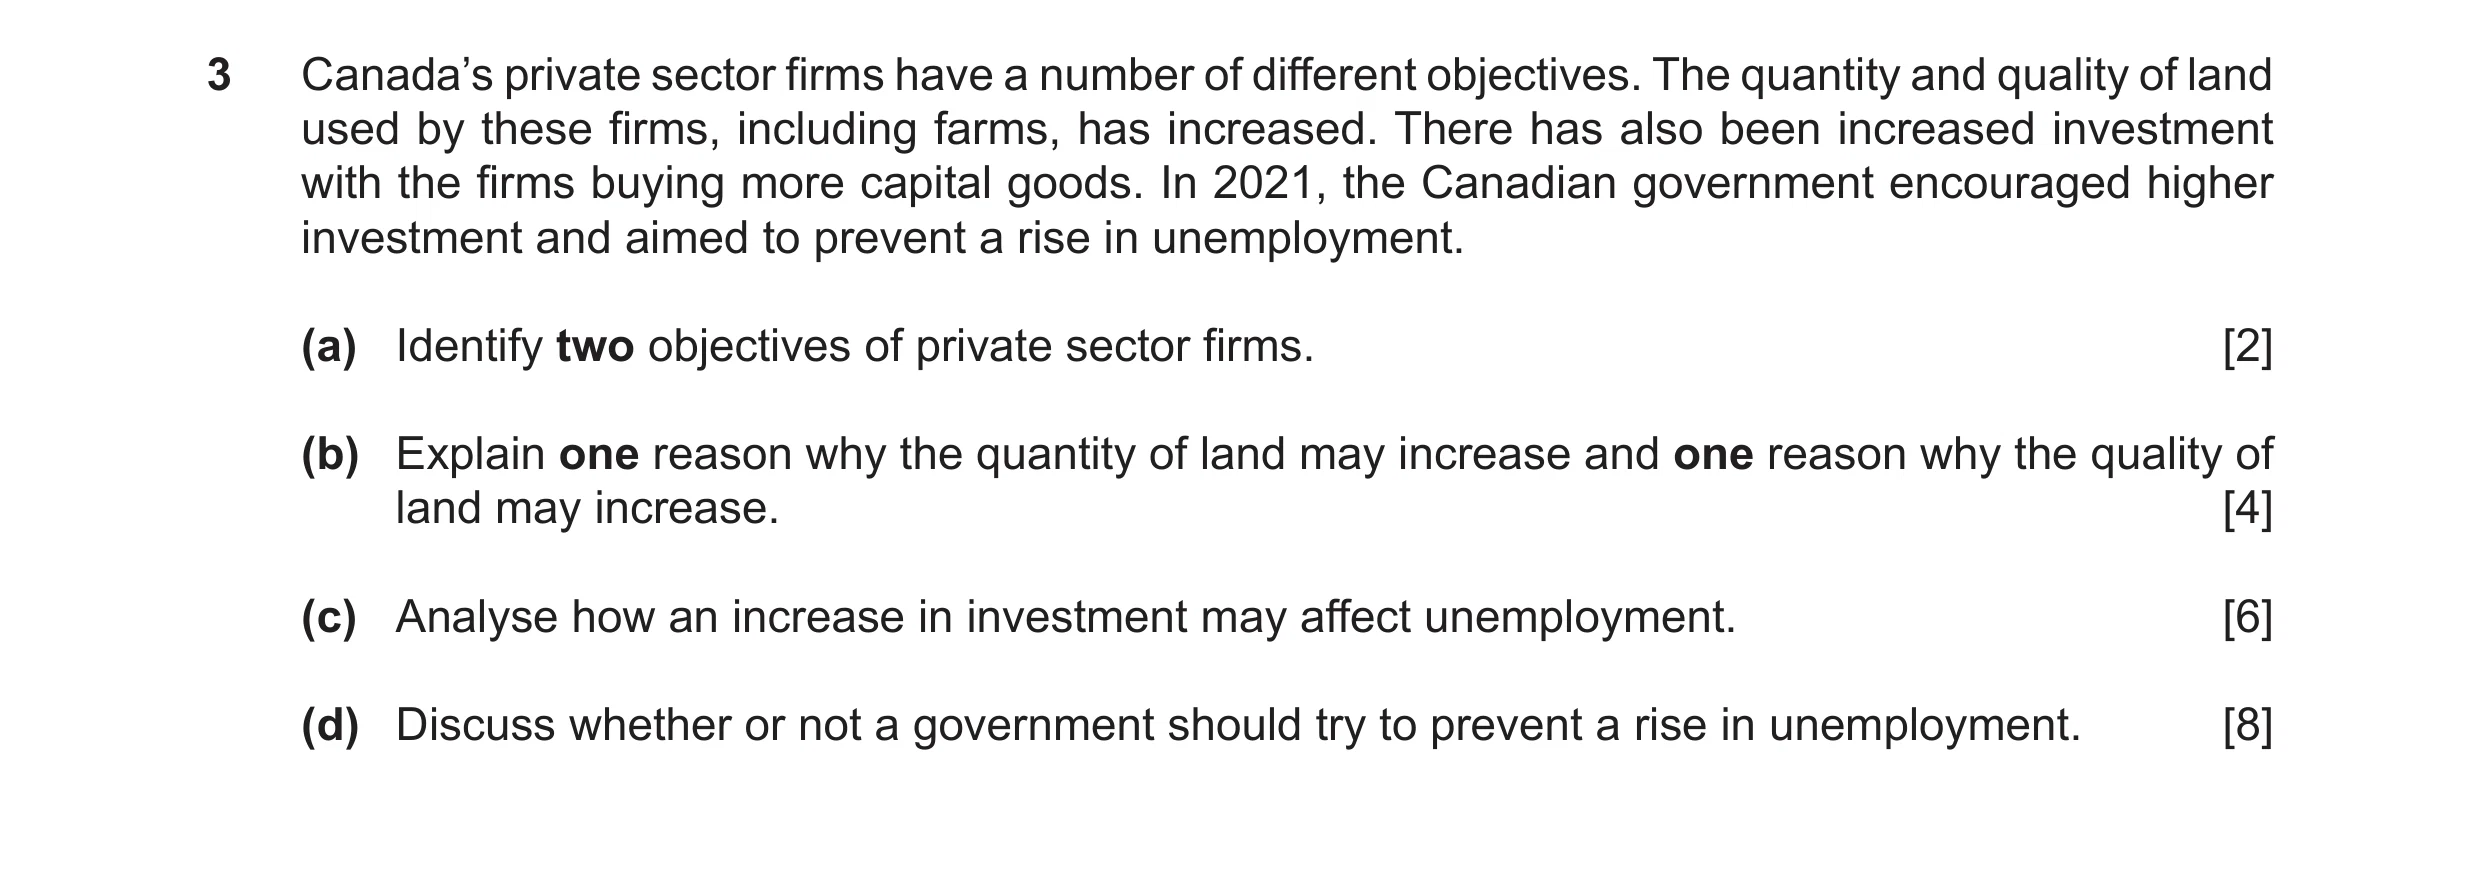
3 Canada’s private sector firms have a number of different objectives. The quantity and quality of land used by these firms, including farms, has increased. There has also been increased investment with the firms buying more capital goods. In 2021, the Canadian government encouraged higher investment and aimed to prevent a rise in unemployment. (a) Identify two objectives of private sector firms. [2] (b) Explain one reason why the quantity of land may increase and one reason why the quality of land may increase. [4] (c) Analyse how an increase in investment may affect unemployment. [6] (d) Discuss whether or not a government should try to prevent a rise in unemployment. [8]
20 marks
Mark scheme: 3(a) Identify two objectives of private sector firms. Two from: profit (maximisation) growth / high sales greater market share / market dominance survival improving the environment 2 Reward but do not expect profit satisficing, revenue maximisation, sales maximisation. Allow social welfare. If more than two objectives given, consider the first three. 3(b) Explain one reason why the quantity of land may increase and one reason why the quality of land may increase. Logical explanation which might include: Quantity of land Reclamation (1) creating land from the sea (1). Reduction in overfishing / hunting (1) restoring stocks of fish / wildlife (1). Reduction in flooding (1) avoiding soil erosion (1). Discovery of new natural resources (1) e.g. of oil (1). Quality of land Use of fertilisers (1) raising productivity / efficiency / fertility of land (1). Reduction in pollution (1) preventing damage / diseases (1). Good weather (1) raising productivity efficiency / fertility of land (1). Better equipment / more advanced technology (1) raising productivity efficiency / fertility of land (1). 4 One mark for identifying one reason why the quantity of land may increase and one mark for explaining that reason. One mark for identifying one reason why the quality of land may increase and one mark for explaining that reason. Question Answer Marks Guidance 3(c) Analyse how an increase in investment may affect unemployment. Coherent analysis which might include: Spending on capital goods (1) will increase total demand (1) firms may expand their output / new firms may set up / economic growth may occur (1) (may need more workers) to work with the capital equipment / demand for labour may increase / need more workers / increase job opportunities (1) this can reduce cyclical (1) unemployment (1). Investment in education / training/ healthcare / research and development (1) can raise productivity / skills (1) increase mobility (1) reduce structural unemployment (1). Investment in infrastructure (1) increase geographical mobility (1) reduce structural unemployment (1). It could cause unemployment (1) as capital goods may replace workers / production may become more capital- intensive / demand for workers may decrease (1) capital goods can be a substitute for labour (1) cause technological unemployment (1). 6 Credit fall in unemployment / rise in unemployment only once (1). Reference to cyclical / structural / technological (unemployment) can be given an additional mark in each case if linked to a relevant point. Question Answer Marks Guidance 3(d) Discuss whether or not a government should try to prevent a rise in unemployment. In assessing each answer, use the table opposite. Why it should: may increase output / economic growth increase tax revenue reduce spending on unemployment benefit reduce living standards / poverty Why it should not: unemployment may be low reduction in unemployment may cause inflation the resulting higher incomes may cause a current account deficit unemployment can create flexibility opportunity cost of government policy measures a government may have other objectives. 8 Level Description Marks 3 A reasoned discussion which accurately examines both sides of the economic argument, making use of economic information and clear and logical analysis to evaluate economic issues and situations. One side of the argument may have more depth than the other, but overall, both sides of the argument are considered and developed. There is thoughtful evaluation of economic concepts, terminology, information and/or data appropriate to the question. The discussion may also point out the possible uncertainties of alternative decisions and outcomes. 6–8 2 A reasoned discussion which makes use of economic information and clear analysis to evaluate economic issues and situations. The answer may lack some depth and development may be one-sided. There is relevant use of economic concepts, terminology, information and data appropriate to the question. 3–5 1 There is a simple attempt at using economic definitions and terminology. Some reference may be made to economic theory, with occasional understanding. 1–2 0 A mark of zero should be awarded for no creditable content. 0
This question in 0987/22 May/June 2023
Q7 · Calculate what percentage of Honduran people did not have access to electricity in 2020 0987/22 Oct/Nov 2023
1 (a) Calculate what percentage of Honduran people did not have access to electricity in 2020. [1] (b) Identify two benefits the Honduran economy could gain from a growth in the US economy. [2] (c) Explain one advantage of an economy specialising. [2] (d) Explain two ways a government could redistribute income. [4] (e) Draw a demand and supply diagram to show how a report stating that bananas are good for health would affect the market for bananas. [4] (f) Analyse the relationship between the percentage of population living in poverty and life expectancy. [5] (g) Discuss whether or not the cost of producing clothes in Honduras will fall in the future. [6] (h) Discuss whether or not a fall in unemployment in Honduras is likely to cause inflation. [6]
30 marks
Mark scheme: Question Answer Marks Guidance 1(a) Calculate what percentage of Honduran people did not 1 Accept 8.0 or 8.3. have access to electricity in 2020. 8.3%. 1(b) Identify two benefits the Honduran economy could gain 2 If more than two benefits are given, consider the first three. from a growth in the US economy. Accept increase trade for more exports. Sell more exports to the US (1). Receive more money from Honduran workers in the US (1). Accept increase employment / lower unemployment for More job opportunities for Honduran workers in the US (1). more job opportunities. 1(c) Explain one advantage of an economy specialising. 2 One mark for an advantage identified and one mark an explanation. Gain skills (1) raise productivity / raise efficiency / ‘practice Identification mark must come directly from the source makes perfect’ / lower costs of production / raise quality / material. increase output / supply / less waste (1). A relevant explanation mark can be given even in the Gain a good reputation (1) increase demand (1). absence of an identification. 1(d) Explain two ways a government could redistribute 4 One mark each for each of two ways identified and one income. mark each for each of two explanations. Logical explanation which might include: If more than two reasons given, consider the first three. Provision of unemployment benefit / state benefit / welfare benefit / benefits (1) raise income of those on low or no One mark for taxing the rich and giving to the poor. income / enable the unemployed to buy basic necessities / reduce absolute poverty (1). Progressive income tax system (1) takes a higher proportion of the income of the rich / use some of tax revenue raised to increase spending to help those on low incomes (1). 1(e) Draw a demand and supply diagram to show how a 4 report stating that bananas are good for health would affect the market for bananas. Coherent analysis which might include: Demand and supply diagram: Axes correctly labelled – price and quantity or p and q (1). Original demand and supply curves correctly labelled (1). Demand curve shifted to the right (1). Equilibriums – shown by lines P1 and Q1 and P2 and Q2 or equilibrium points marked as E1 and E2 (1). If a candidate draws two diagrams, they may be able to get 3 marks: 1 mark for axes 1 mark for D & S labelled correctly 1 mark for the demand curve shifted to the right. They would not get the mark for the equilibriums as the two diagrams are likely to conflict on this. 1(f) Analyse the relationship between the percentage of 5 Responses do not have to be in the format suggested but population living in poverty and life expectancy. they should address the expected/normal relationship, offer supporting evidence of that, highlight any exceptions to that, Coherent analysis which might include: and analyse the overall data. Expected relationship: Inverse / negative (1) the higher the level of poverty, the lower the life expectancy / the lower the level of poverty, the higher the life expectancy (1). Supporting evidence: Sweden has the lowest % of population living in poverty and the highest life expectancy / The country / two countries / three countries / four countries with the lowest levels of poverty head had the longest life expectancy (1) the two countries, Chad and South Sudan, with the highest level of poverty had the lowest life expectancy (1). Analysis of expected relationship: A high level of poverty is likely to mean poor healthcare (1) low nutrition / poor housing / poor sanitation / low levels of education (1). Exception: Chad / South Sudan (1) Chad had a lower level of poverty but also a lower level of life expectancy than South Sudan (1) Analysis of exception: Life expectancy is determined by other influences e.g. wars (1). 1(g) Discuss whether or not the cost of producing clothes in 6 Allow higher productivity / efficiency once either in Honduras will fall in the future. connection with labour or capital. Some points may be given in reverse e.g. price of raw Award up to 4 marks for logical reasons why it might, which materials may fall. may include: Not accepting subsidising the clothes industry as the source • more training (1) better working conditions (1) may material indicates that it is a successful industry. increase labour productivity / efficiency / skills (1) reduce labour costs (1) Apply this example to all questions with the command • more use of capital goods (1) may reduce disruption to word DISCUSS production / make fewer mistakes / less waste (1) speed (1(g), 1(h), 2(d), 3(d), 4(d) and 5(d)) up production / increase productivity / efficiency (1) • improved working conditions (1) may reduce industrial Each point may be credited only once, on either side of an action (1) more motivation (1) argument, but separate development as to how/why the • successful clothes industry so firms may grow in size (1) outcome may differ is rewarded. more able to take advantage of economies of scale (1). Generic example Mark Award up to 4 marks for logical reasons why it might not, which may include: Tax revenue may decrease… 1 • price of raw materials may rise (1) may be subject to bad weather (1) exchange rate may fall / tariffs may be ...because of reason e.g. incomes 1 imposed on imported raw materials (1) reduce supply may be lower. (1) country has experience of inflation (1) • unemployment may fall (1) making it more difficult for Tax revenue may increase 0 the clothes industry to recruit labour (1) strengthening because incomes may be higher the bargaining power of workers (1) raising wages / i.e. reverse of a previous increasing labour costs (1) argument. • providing training (1) and better working conditions will involve a cost (1) Tax revenue may increase 1 • more use of capital goods may involve initial high because of a different reason i.e. not the reverse of a previous spending on equipment (1) firms may experience argument e.g. government diseconomies of scale (1) • higher indirect tax / tax may be imposed (on clothes / spending on subsidies may stimulate the economy more than clothes firms) (1). spending on education. 1(h) Discuss whether or not a fall in unemployment in 6 Honduras is likely to cause inflation. Award up to 4 marks for logical reasons why it might, which may include: • unemployment is already low (1) may move towards full employment (1) may push up wages (1) increase (average) costs (1) cause cost-push inflation / total supply less than total demand (1) • lower unemployment may increase incomes (1) causing a rise in consumer spending / purchasing power (1) increasing total demand (1) causing demand-pull inflation / total demand higher than total supply (1). • inflation already exists (1) which may lead workers to expect it to continue (1) increasing wage claims (1). Award up to 4 marks for logical reasons why it might not, which may include: • may be higher investment (1) could increase total supply / total supply may rise in line with total demand (1) reducing cost-push inflation (1) • lower unemployment could reduce spending on unemployment benefit (1) increase tax revenue (1) reduce the budget deficit (1) reduce the growth in total demand (1) some of higher tax revenue could be spent on supply-side policy / unemployment may have fallen due to supply-side policy (1) • the extra income may be saved / spent on imports (1) due to uncertainty about the future (1) • A fall in unemployment does not necessarily mean a rise in employment (1) the unemployed could have e.g. retired / emigrated (1).
This question in 0987/22 Oct/Nov 2023
Q8 · In 2020, some firms in Suriname, a South American country, stopped production 0987/22 Oct/Nov 2023
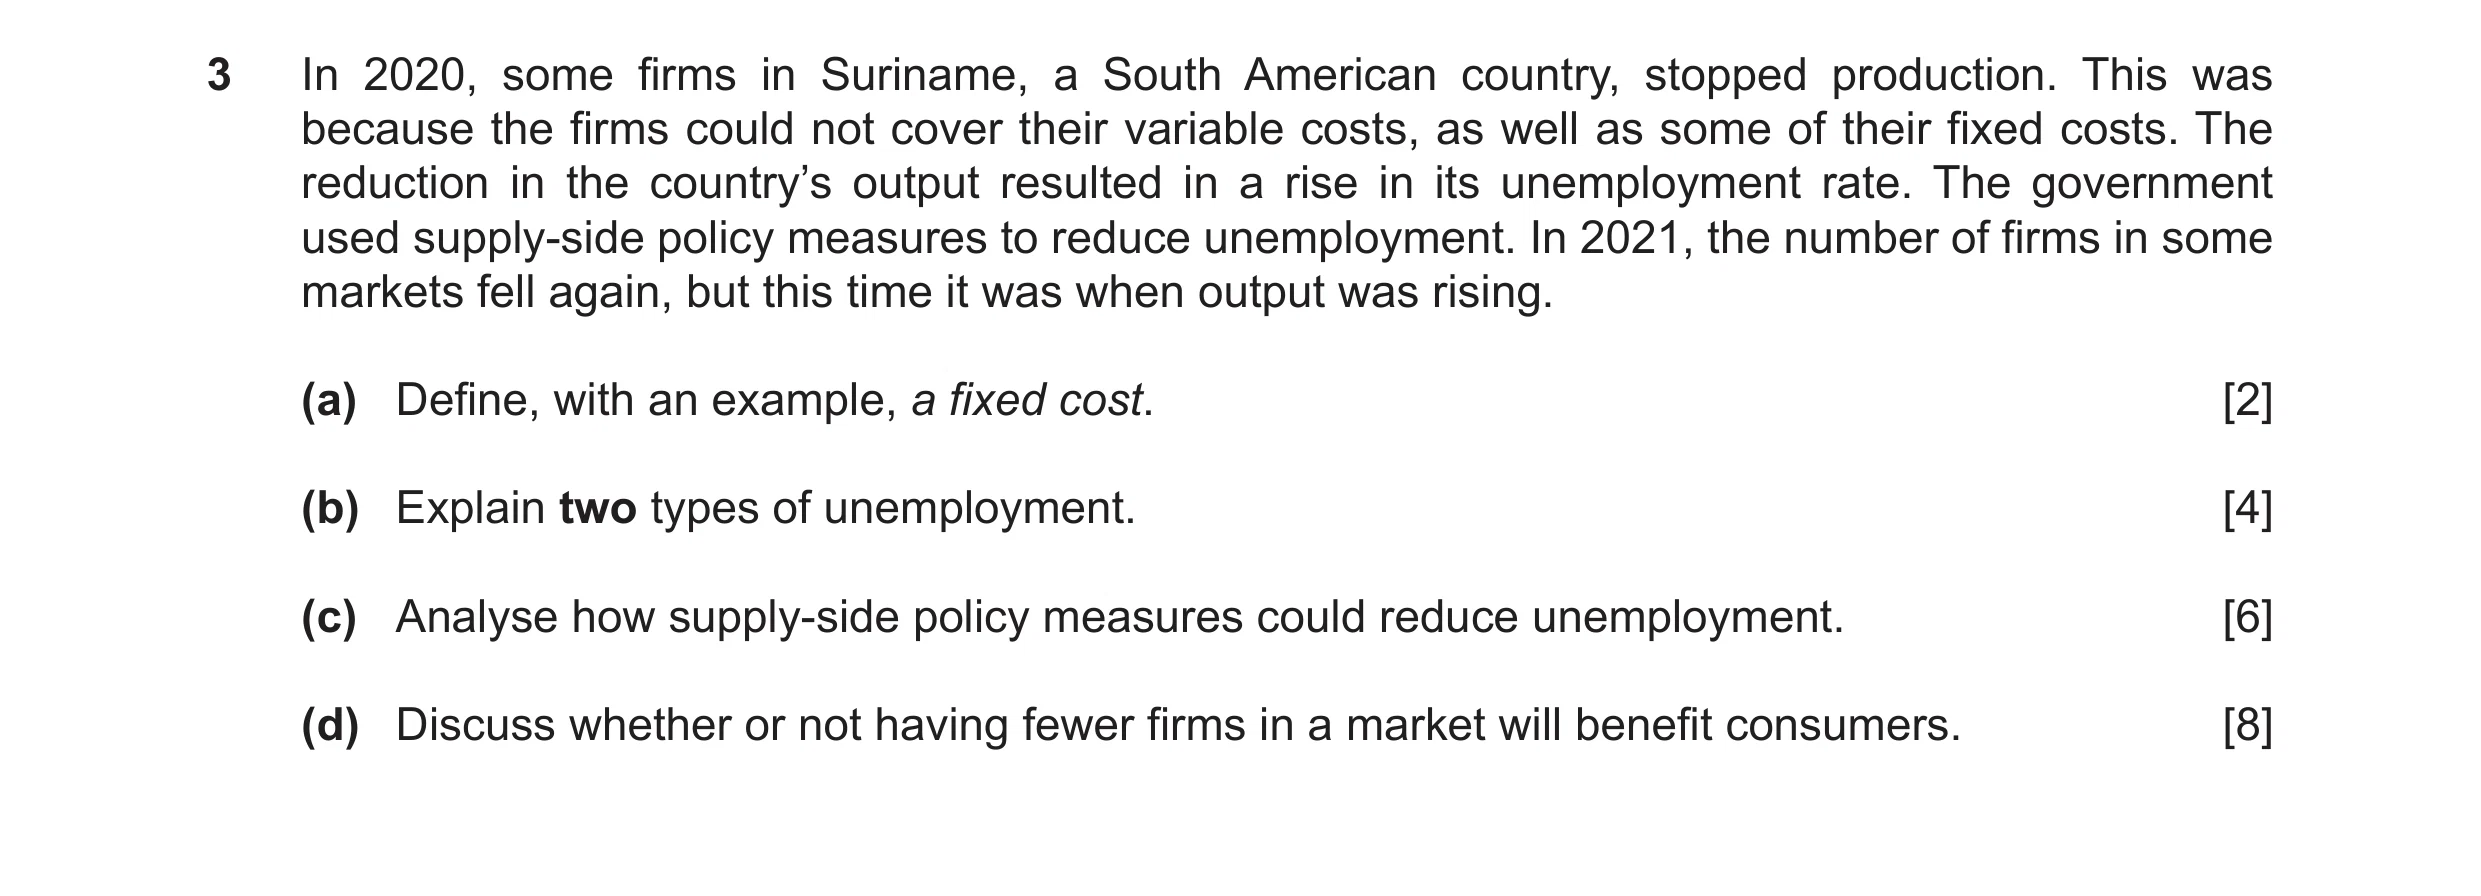
3 In 2020, some firms in Suriname, a South American country, stopped production. This was because the firms could not cover their variable costs, as well as some of their fixed costs. The reduction in the country’s output resulted in a rise in its unemployment rate. The government used supply-side policy measures to reduce unemployment. In 2021, the number of firms in some markets fell again, but this time it was when output was rising. (a) Define, with an example, a fixed cost. [2] (b) Explain two types of unemployment. [4] (c) Analyse how supply-side policy measures could reduce unemployment. [6] (d) Discuss whether or not having fewer firms in a market will benefit consumers. [8]
20 marks
Mark scheme: 3(a) Define, with an example, a fixed cost. 2 Not sufficient to state a cost that does not change. A cost that does not change with output / a cost that has to Accepting electricity / electricity bills and wages. be paid even when output is zero (1) e.g. rent (1). 3(b) Explain two types of unemployment. 4 Allow explanation of two types of frictional unemployment i.e. search, casual or seasonal and two types of structural Logical explanation which might include: unemployment i.e. regional and technological. Also allow • frictional unemployment (1) workers in between jobs voluntary and involuntary. (1) • structural unemployment (1) changes in demand and One mark each for each of two types identified and one supply conditions / skills not matching vacancies / mark each for each of two explanations. lack of labour mobility (1) • cyclical / demand-deficient unemployment (1) lack of total demand / occurs during a recession (1) 3(c) Analyse how supply-side policy measures could reduce 6 Reward the same point e.g. ‘raise productivity’ only once. unemployment. Coherent analysis which might include: Accept lower interest rate if linked to encouraging investment. Education (1) can increase qualifications / literacy rate (1) training (1) can increase skills / productivity / quality of labour (1) raise mobility / increase job opportunities (1) reduce structural unemployment (1). Lower income tax (1) reduce unemployment benefit (1) increases the incentive for the unemployed to find work quickly (1) reduce frictional unemployment (1). Lower corporation tax / tax incentives (1) encourage firms to invest / expand output (1). Privatisation (1) deregulation (1) can increase efficiency (1) reduce firms’ costs (1) enabling firms to afford more workers (1). Reform of trade unions / labour market reforms (1) Deregulation / removing labour regulations (1) making it easier to hire and fire workers (1). Government spending on infrastructure (1) can reduce firms’ costs of production / reduce transport costs (1) encouraging firms to expand (1) increase labour mobility (1). Minimum wage legislation (1) reducing may encourage employer to employ more workers / increasing may encourage the unemployed to search more actively for work (1). Subsidies (1) encouraging firms to expand / prevent firms going out of business (1). Better/more healthcare (1) can increase productivity / reduce working time lost (1). 3(d) Discuss whether or not having fewer firms in a market 8 will benefit consumers. Level Description Marks In assessing each answer, use the table opposite. 3 A reasoned discussion which 6–8 accurately examines both sides of Why it might: the economic argument, making • firms may be larger, may be able to benefit from use of economic information and economies of scale clear and logical analysis to • economies of scale may include e.g. financial, evaluate economic issues and managerial, technical situations. One side of the • lower costs may result in lower prices argument may have more depth • firms may have more market power - firms may make than the other, but overall, both more profit and may reinvest which can improve quality sides of the argument are • firms may have moved to another market in response to considered and developed. There changes in consumer demand is thoughtful evaluation of • firms that were creating pollution and other external economic concepts, terminology, costs may close down information and/or data appropriate • may reduce the time consumers spend shopping to the question. The discussion around may also point out the possible uncertainties of alternative decisions and outcomes. Why it might not: • firms may experience diseconomies of scale 2 A reasoned discussion which 3–5 • diseconomies of scale may include e.g. communication makes use of economic information problems, control problems and poor industrial relations and clear analysis to evaluate • less choice economic issues and situations. • lack of competition / move towards monopoly resulting The answer may lack some depth and development may be one- in lower quality and higher prices sided. There is relevant use of • lower availability. economic concepts, terminology, information and data appropriate to the question. 3(d) 1 There is a simple attempt at using 1–2 economic definitions and terminology. Some reference may be made to economic theory, with occasional understanding. 0 A mark of zero should be awarded 0 for no creditable content.
This question in 0987/22 Oct/Nov 2023
Q9 · Calculate the value of Gabon’s oil production as a percentage of Gabon’s GDP 0987/21 May/June 2025
1 (a) Calculate the value of Gabon’s oil production as a percentage of Gabon’s GDP. [1] (b) Identify two external benefits of rainforests. [2] (c) Explain what effect an increase in tourism may have on Gabon’s current account of the balance of payments. [2] (d) Explain two reasons why the Gabonese Government wants to reduce reliance on oil. [4] (e) Draw a demand and supply diagram to show the effect of the discovery of new gold deposits on the market for gold. [4] (f) Analyse the relationship between the literacy rate and the percentage of the labour force employed in agriculture. [5] (g) Discuss whether or not a government should pay private sector firms to give work experience to unemployed young people. [6] (h) Discuss whether or not a growth in the size of firms in Gabon’s textile industry will reduce their average cost of production. [6]
30 marks
Mark scheme: Question Answer Marks Guidance 1(a) Calculate the value of Gabon’s oil production as a 1 Accept 30 without %. percentage of Gabon’s GDP. 30% 1(b) Identify two external benefits of rainforests. 2 If more than two benefits given, consider the first three. Two from: • reduce air pollution / pollution / improves air quality (1) • protect against floods (1) • prevent soil erosion (1). 1(c) Explain what effect an increase in tourism may have on 2 No marks for simply saying current account of the balance of Gabon’s current account of the balance of payments. payments increases. • Increase in exports (1) • increase trade in services (invisible) surplus / reduces deficit (1) • Improves the current account balance surplus / reduces deficit (1). 1(d) Explain two reasons why the Gabonese Government 4 One mark each for each of two reasons identified and one wants to reduce reliance on oil. mark each for each of two explanations. Logical explanation which might include: Only these two reasons are acceptable. • Running out of oil / create a shortage (1) revenue from the industry will decline / employment in the industry will decline / GDP will decline /cause recession / conserve for future generations / may need to import oil / price for oil may rise (1). • Oil industry creates water pollution / pollution (1) an external cost / harms health / reduces standard of living / protect the environment / attract tourists (1). 1(e) Draw a demand and supply diagram to show the effect 4 of the discovery of new gold deposits on the market for gold. Coherent analysis which might include: D&S diagram: Axes correctly labelled – price and quantity or p and q (1). Original demand and supply curves correctly labelled (1). New supply curve shifted to the right (1). Equilibriums – shown by lines P1 and Q1 and P2 and Q2 or equilibrium points marked as E1 and E2 (1). 1(f) Analyse the relationship between the literacy rate and 5 Responses do not have to be in the format suggested but the percentage of the labour force employed in they should address the expected/normal relationship, offer agriculture. supporting evidence of that, highlight any exceptions to that, and analyse the overall data. Coherent analysis which might include: Supporting evidence should involve interpretation, not just Expected relationship: description. Simply stating percentages without analysis of • Generally, an inverse / negative relationship (1) the being high or low gets no marks. higher the literacy rate, the smaller the % of the labour force employed in agriculture (1). Accept as analysis where two countries with different levels of adult literacy and percentage employed in agriculture are Supporting evidence: directly compared. • South Africa had the highest literacy rate and the lowest % of the labour force employed in agriculture (1). • Zambia / Sierra Leone / Mali had the lowest literacy rates and the highest %s of labour force employed in agriculture (1). Analysis of expected relationship: • A high literacy rate may increase the chance of workers gaining jobs in high paid tertiary jobs (1) a low literacy rate may mean workers have to undertake unskilled jobs in agriculture / a high proportion of workers employed in agriculture may mean that high literacy rate is not required (1). Exception: • Gabon (1) Gabon has a high literacy rate but also a high % of the labour force employed in agriculture (1). Analysis of exception: • Some jobs in agriculture are skilled / secondary and tertiary sectors may be small (1). 1(g) Discuss whether or not a government should pay 6 Apply this example to all questions with the command private sector firms to give work experience to word DISCUSS unemployed young people. (1(g), 1(h), 2(d), 3(d), 4(d) and 5(d)) Award up to 4 marks for logical reasons why it should, Each point may be credited only once, on either side of an which may include: argument, but separate development as to how/why the outcome may differ is rewarded. • can enable young workers to develop their skills / raise their productivity (1) increase their confidence / Generic example mark motivation to get a job / get higher paid jobs (1) young people may make mistakes and cost firm money while Tax revenue may decrease 1 being trained (1) • can increase the chances of young people gaining a job because of reason e.g. incomes may be lower. 1 (1) reduce unemployment (1) reduce the cost of unemployment benefits (1) reduce future training costs Tax revenue may increase because incomes 0 (1) increase tax revenue (1) leads to economic growth may be higher i.e. reverse of a previous (1). argument. Award up to 4 marks for logical reasons why it should Tax revenue may increase because of a 1 not, which may include: different reason i.e. not the reverse of a previous argument e.g. government spending • the quality of the work experience may not be good (1) on subsidies may stimulate the economy more the young may be given unskilled jobs (1) poor working than spending on education. conditions / not regulated (1) • opportunity cost [implied] (1) government spending could be used to e.g. improve state education (1) government incurs additional expenditure / raises taxes to pay for it (1) the young may have been employed by the private sector without payment by the government (1) • it may reduce the efficiency of private firms (1) reduce their output (1) firms may be corrupt (1). 1(h) Discuss whether or not a growth in the size of firms in 6 Maximum of 2 marks for just listing different types of Gabon’s textile industry will reduce their average cost economies and diseconomies of scale or just stating of production. economies of scale and diseconomies of scale may be experienced without references to examples. Award up to 4 marks for logical reasons why it might, which may include: Essentially full marks can be gained for identification and explanation of two economies of scale and one diseconomy • labour economies (1) workers can specialise / increase of scale OR one economy of scale and two diseconomies of labour productivity (1) scale. • managerial economies (1) employ specialists (1) • technical economies (1) using advanced capital Note there is no marks awarded for simply stating that equipment (1) average costs may or rise or for drawing a diagram showing • buying / purchasing economies (1) receiving a discount average costs changing as a firm grows in size. as buying in bulk (1) • selling economies (1) reducing transport costs (1) • marketing economies (1) spreads fixed costs over more output (1) • financial economies (1) easier / cheaper to borrow (1) • research and development economies (1) introduce new products / new production methods (1) • risk bearing economies (1) able to suffer fall in demand for one product or supply problems connected to one product (1) • may experience external economies of scale (1) example (1). Award up to 4 marks for logical reasons why it might not, which may include: • difficulty of controlling a large firm (1) may be slower to make decisions (1) 1(h) • communication problems (1) may be more difficult to 6 keep everyone informed (1) • poor industrial relations (1) may be less contact between managers and workers / decreasing productivity (1).
This question in 0987/21 May/June 2025
Q10 · In April 2023, a French cosmetics firm merged with an Australian cosmetics firm 0987/22 Oct/Nov 2025
3 In April 2023, a French cosmetics firm merged with an Australian cosmetics firm. It is expected the merger will lower average total cost as the new firm is likely to benefit from greater internal economies of scale. A manager stated that a key aim is to make the firm’s production more sustainable by using raw materials taken from renewable sources. In most countries, the cosmetics firm’s products, including perfume, are taxed at a higher rate than food. (a) Define average total cost. [2] (b) Explain how using renewable raw materials may affect a firm’s profits. [4] (c) Analyse the internal economies of scale that a cosmetics firm could experience. [6] (d) Discuss whether or not perfume should be taxed at a higher rate than food. [8]
20 marks
Mark scheme: 3(a) Define average total cost. 2 Total cost divided by output (2). Cost per unit (1). 3(b) Explain how using renewable raw materials may affect a 4 A simple statement that profits rise or fall with no relevant firm’s profits. explanation is 0 marks. Logical explanation which might include the following. Profits rising and profits falling can both be credited if each is explained. • Using renewable resources may be more expensive (1) increase costs of production (1) reduce profits (1). • Can advertise that renewable resources which create less pollution / improve environmental sustainability are being used (1) increase image of the firm (1) raise demand (1) increase profits (1). • Using renewable resources may be subsidised (1). May become cheaper to use renewable resources in the long run (1). • Resources will not be depleted / firms have a constant supply of raw materials (1) raise profits (1). 3(c) Analyse the internal economies of scale that a 6 Maximum of 3 marks for a list of different types of internal cosmetics firm could experience. economies of scale with no development / explanation. Coherent analysis which might include the following. • Buying / purchasing economies (1) buy ingredients in bulk at a discount (1). • Labour economies (1) workers specialising e.g. designing the packaging (1). • Managerial economies (1) e.g. specialist human resource manager (1). • Technical economies (1) advanced technology could be used to produce perfume (1). • Financial economies (1) the firm finding it cheaper / easier to borrow from banks (1). • Research and development economies (1) develop new perfumes (1). • Selling / marketing economies (1) lower average advertising costs (1). • Risk-bearing economies (1) selling perfume in more markets (1). 3(d) Discuss whether or not perfume should be taxed at a 8 Level Description Marks higher rate than food. 3 A reasoned discussion which accurately 6–8 In assessing each answer, use the table opposite. examines both sides of the economic argument, making use of economic Why it should: information and clear and logical • perfume is a luxury whereas food is a necessity analysis to evaluate economic issues • rich spend more on perfume than the poor and situations. One side of the • taxing food more may increase poverty as poor spend a argument may have more depth than high proportion of their income on food the other, but overall, both sides of the • perfume is less likely than food to be a merit good argument are considered and • a higher price for perfume will not significantly contribute developed. There is thoughtful to inflation, not a significant item in CPI evaluation of economic concepts, • perfume may be imported while food may be supplied terminology, information and/or data by domestic firms. appropriate to the question. The discussion may also point out the Why it should not: possible uncertainties of alternative • demand for perfume may be elastic and so may not decisions and outcomes. raise much revenue. In contrast, inelastic demand for food so may raise high tax revenue 2 A reasoned discussion which makes 3–5 • perfume may be an important domestic industry. Higher use of economic information and clear taxes may result in closure / unemployment analysis to evaluate economic issues • some food is a demerit good e.g. food with a high sugar and situations. The answer may lack content some depth and development may be • taxing demerit food may improve health one-sided. There is relevant use of • taxing food may reduce obesity. economic concepts, terminology, information and data appropriate to the question. 3(d) Level Description Marks 1 There is a simple attempt at using 1–2 economic definitions and terminology. Some reference may be made to economic theory, with occasional understanding. 0 A mark of zero should be awarded for 0 no creditable content.
This question in 0987/22 Oct/Nov 2025
![Question 2: (a) Calculate the percentage of total world output of palm oil produced by Indonesia in 2017. [1] (b) Identify two variable costs of produc…](https://img.pastlit.com/crops/847013c1-db27-4afd-ab9f-ca88aa9bd41c/q1.webp)
 1 / 4
1 / 4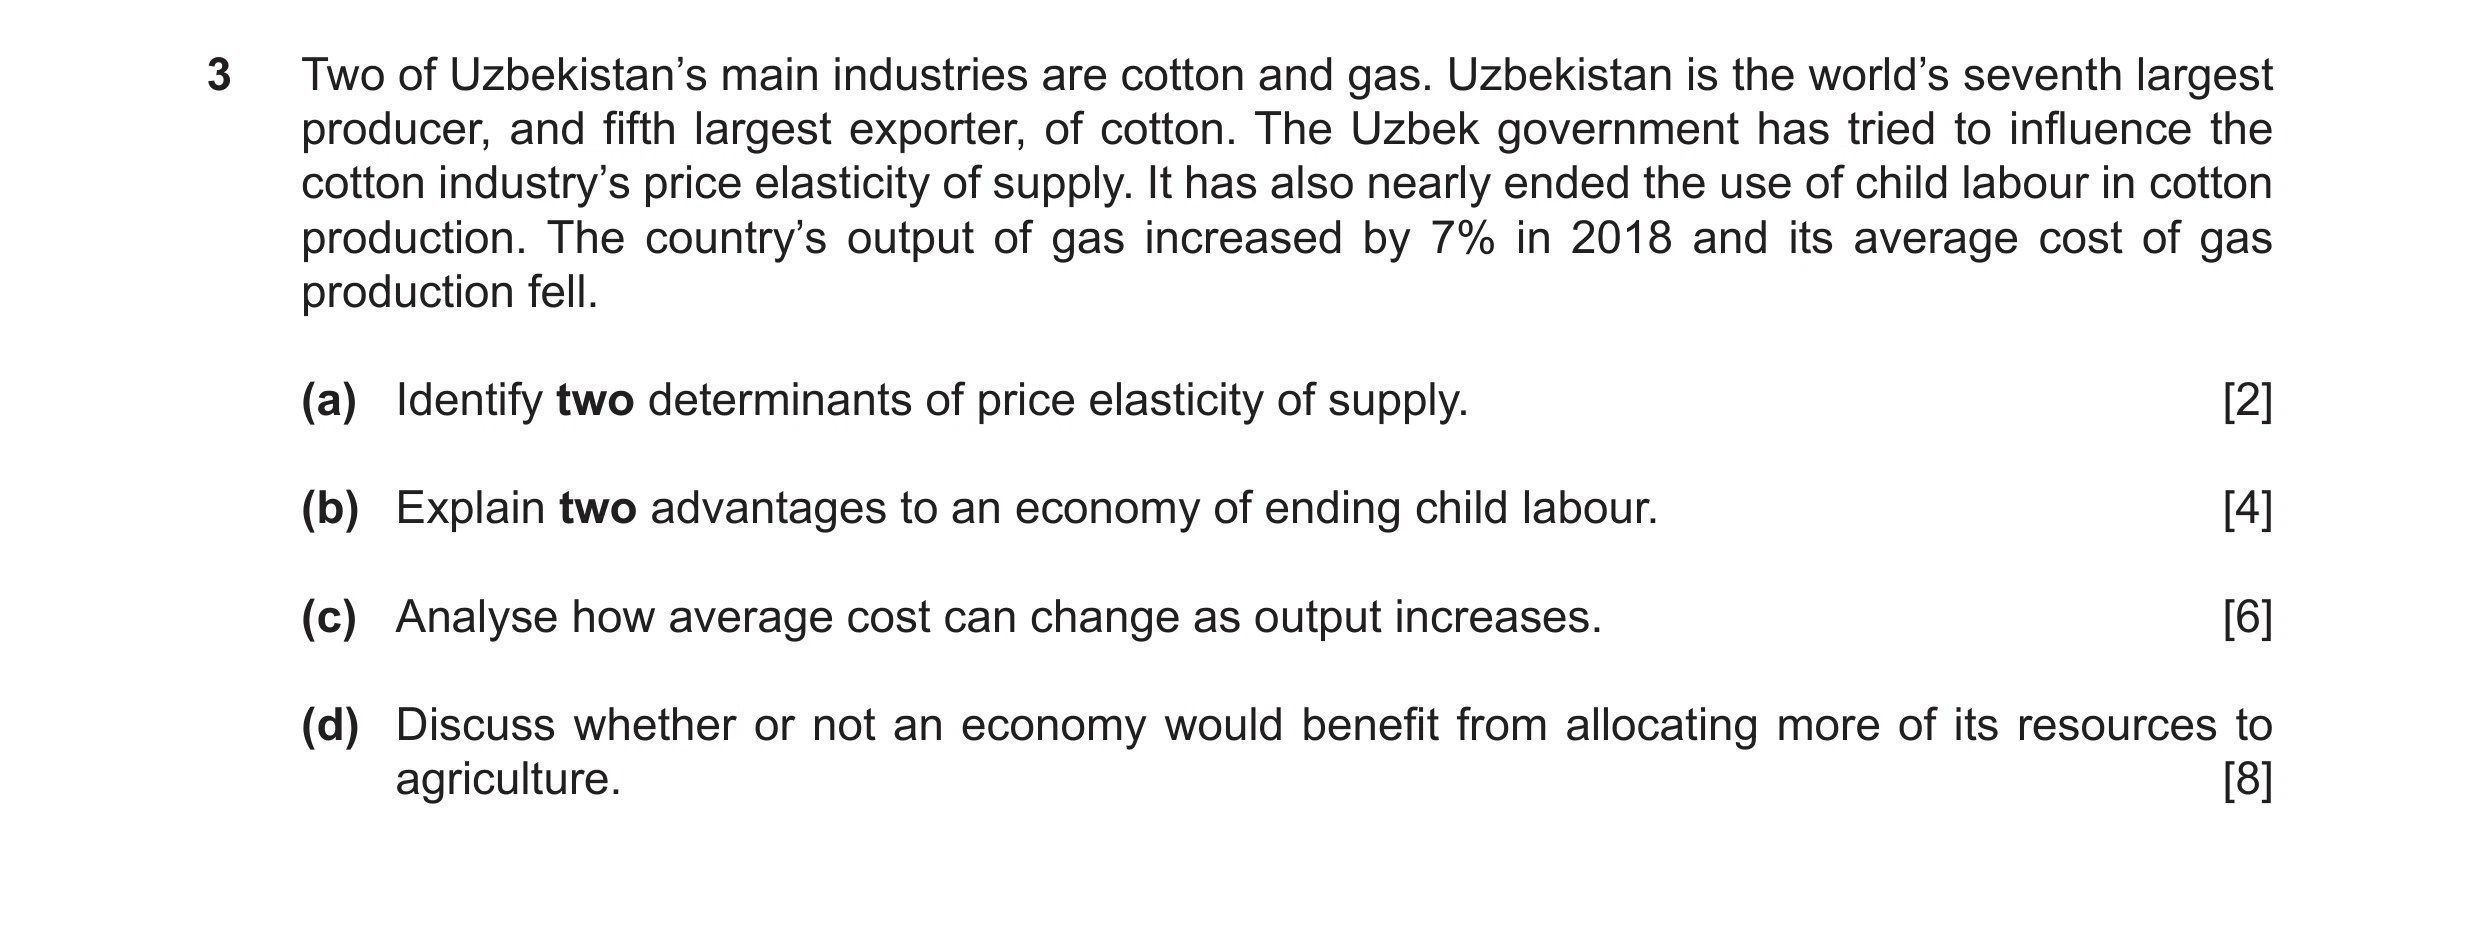
 2 / 4
2 / 4![Question 7: (a) Calculate what percentage of Honduran people did not have access to electricity in 2020. [1] (b) Identify two benefits the Honduran eco…](https://img.pastlit.com/crops/711b4dae-d871-4d27-988e-be99e0e00694/q1.webp)
![Question 9: (a) Calculate the value of Gabon’s oil production as a percentage of Gabon’s GDP. [1] (b) Identify two external benefits of rainforests. [2…](https://img.pastlit.com/crops/38796cc5-8cea-4c9d-9bcb-21653d7326ee/q1.webp) 3 / 4
3 / 4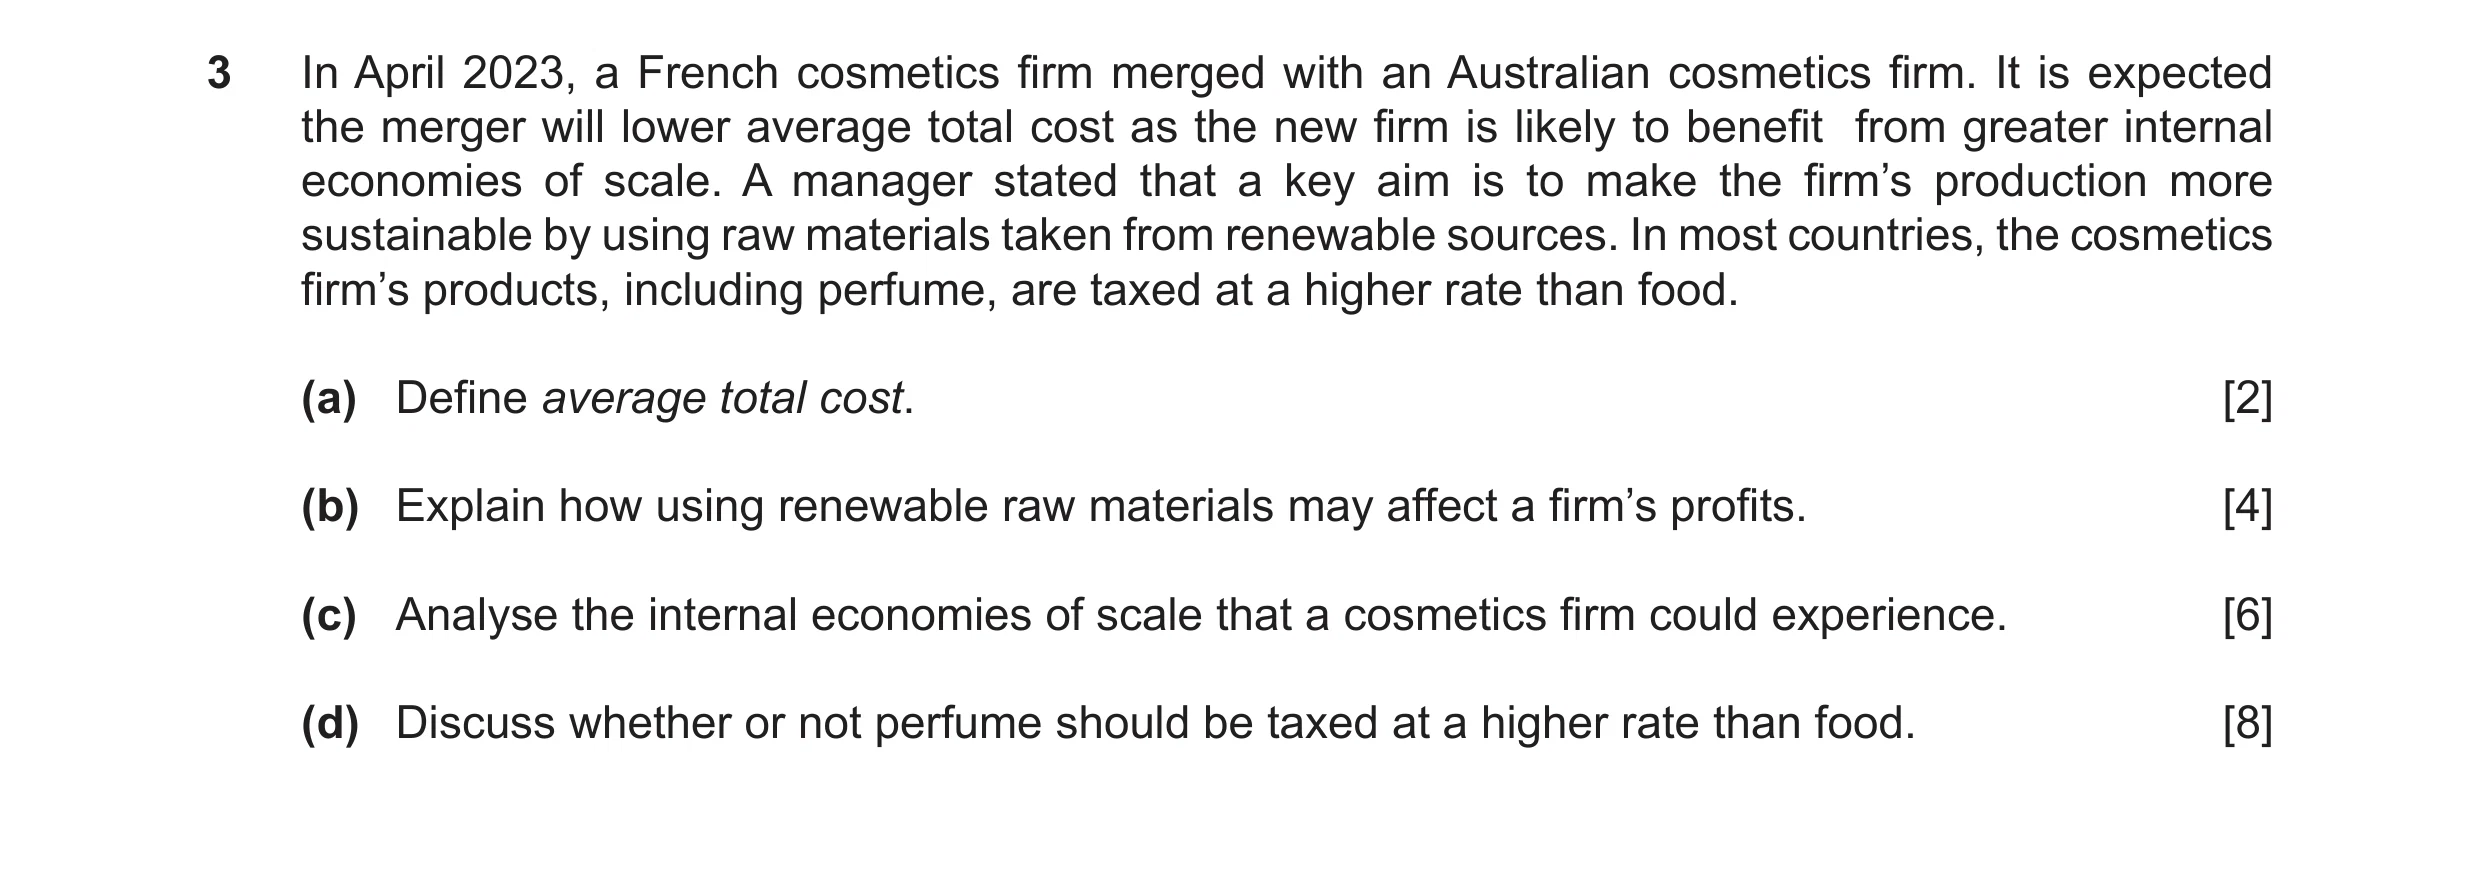 4 / 4
4 / 4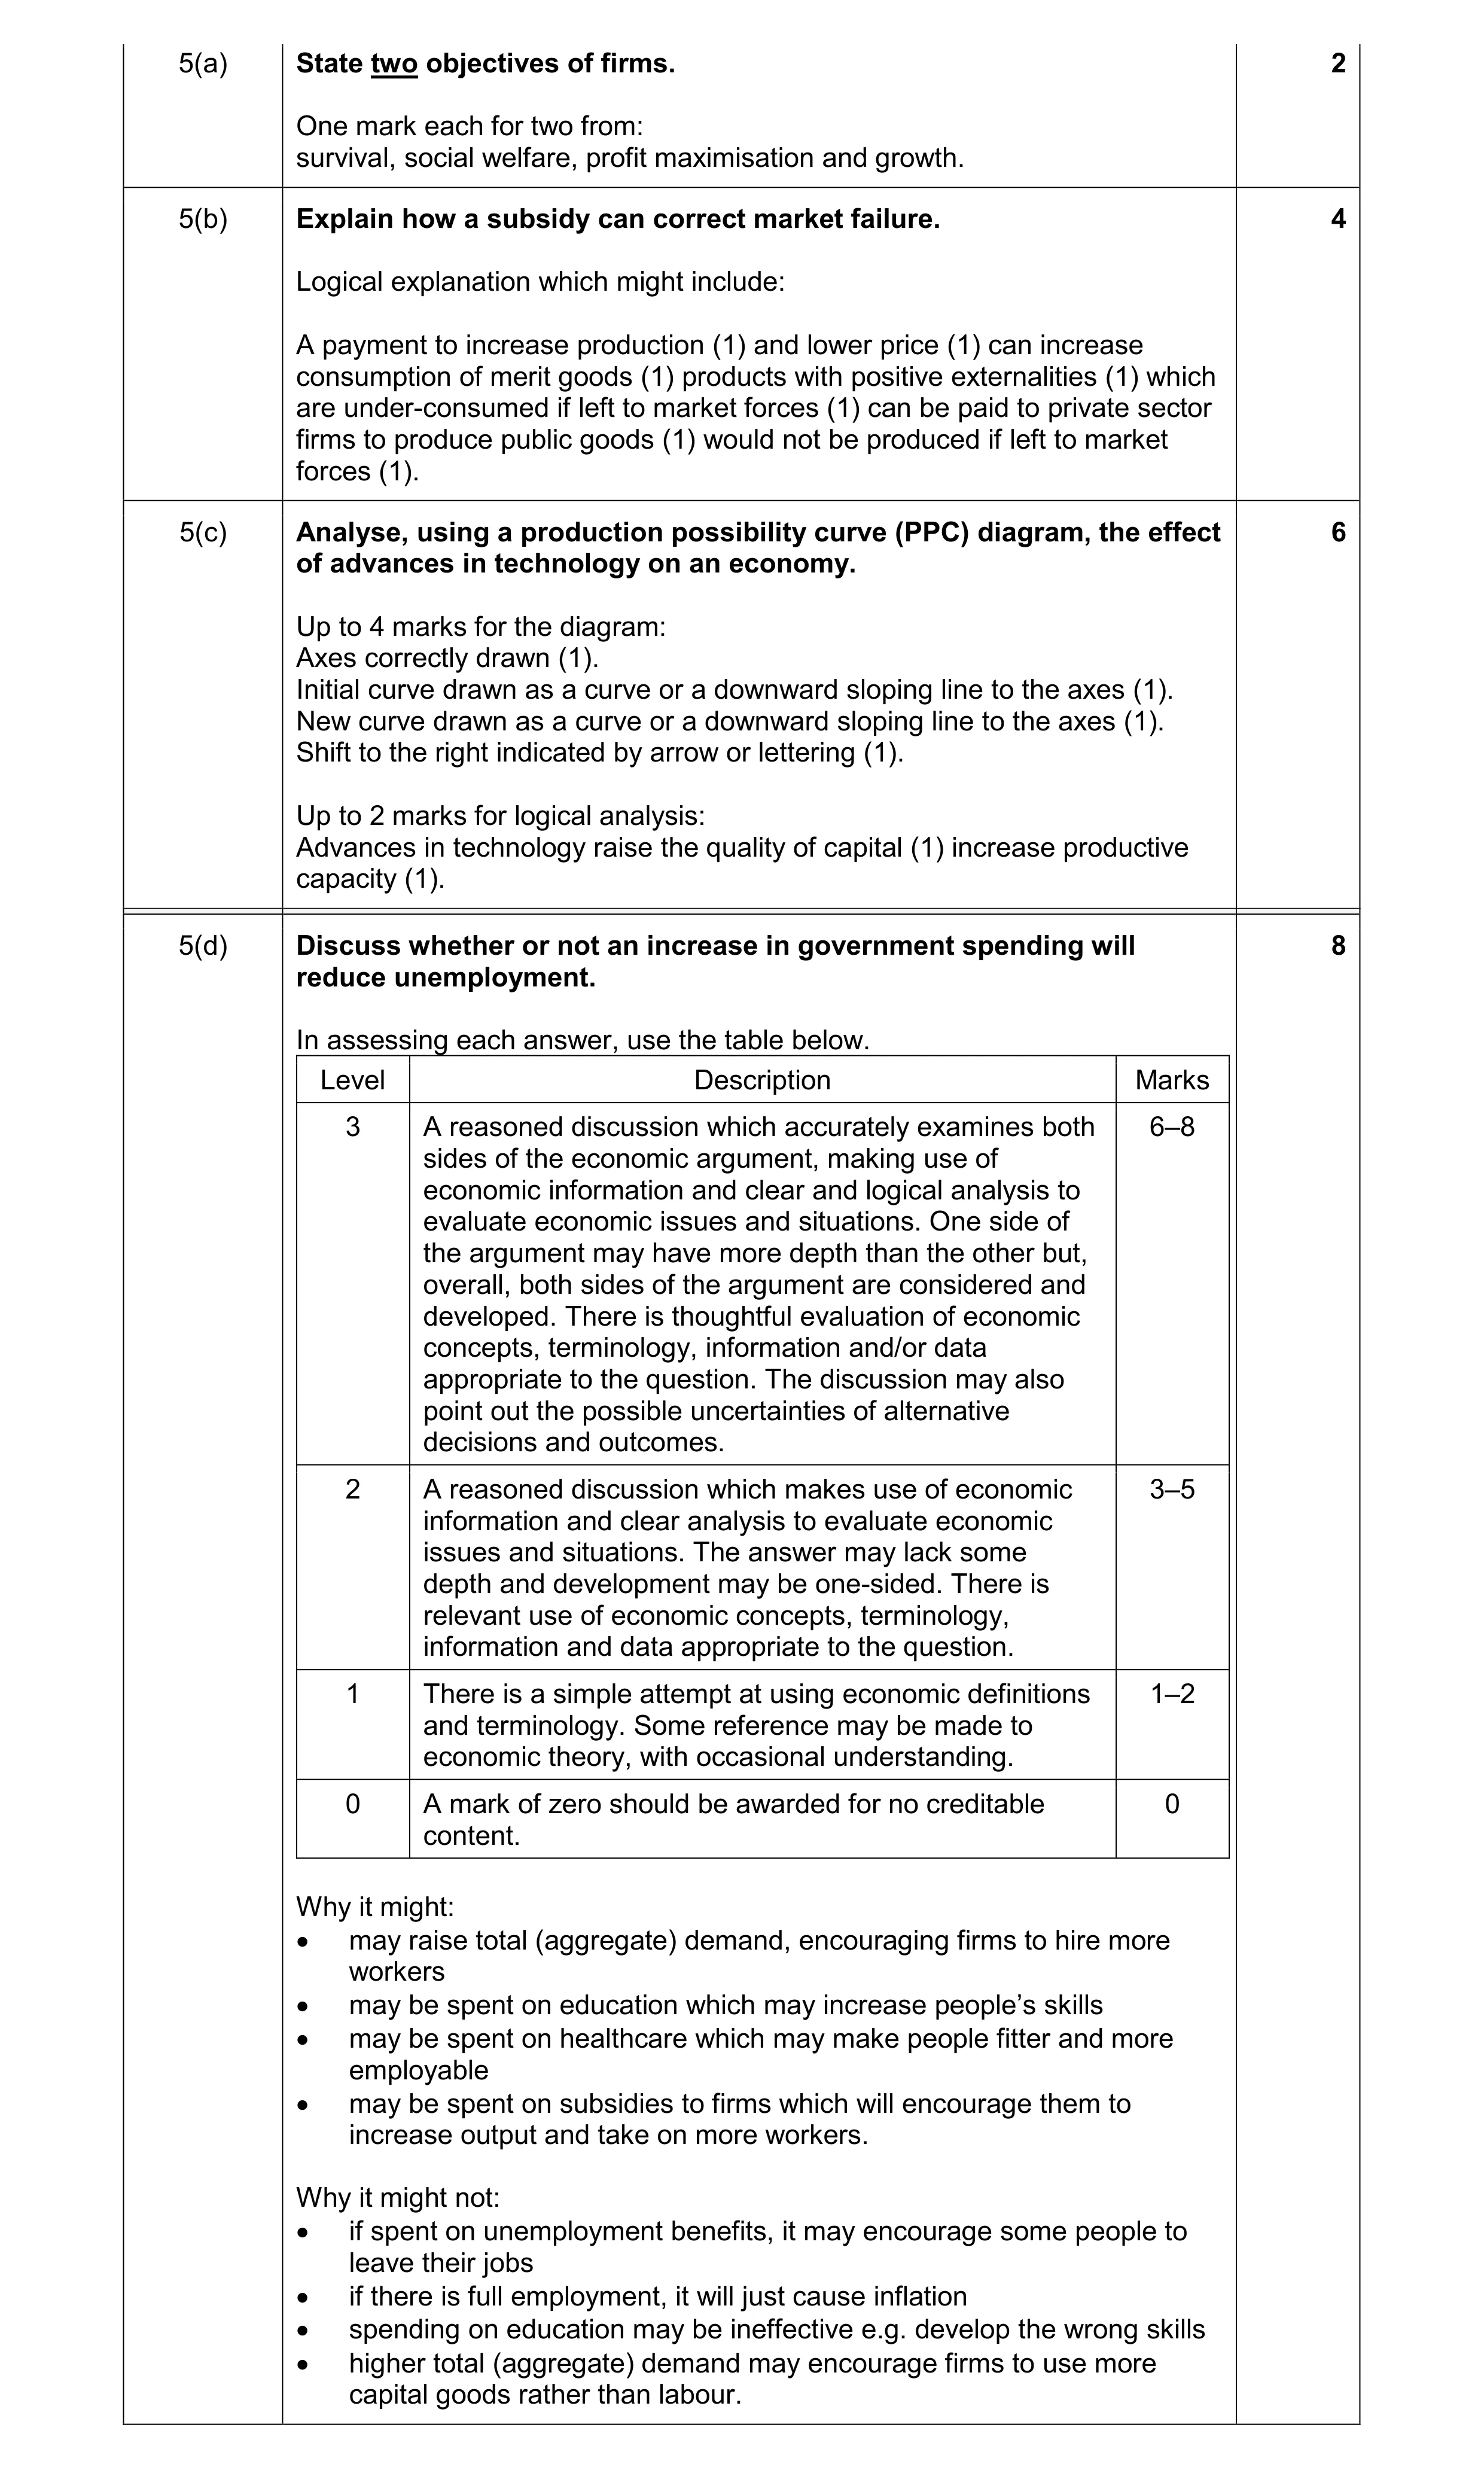 20
20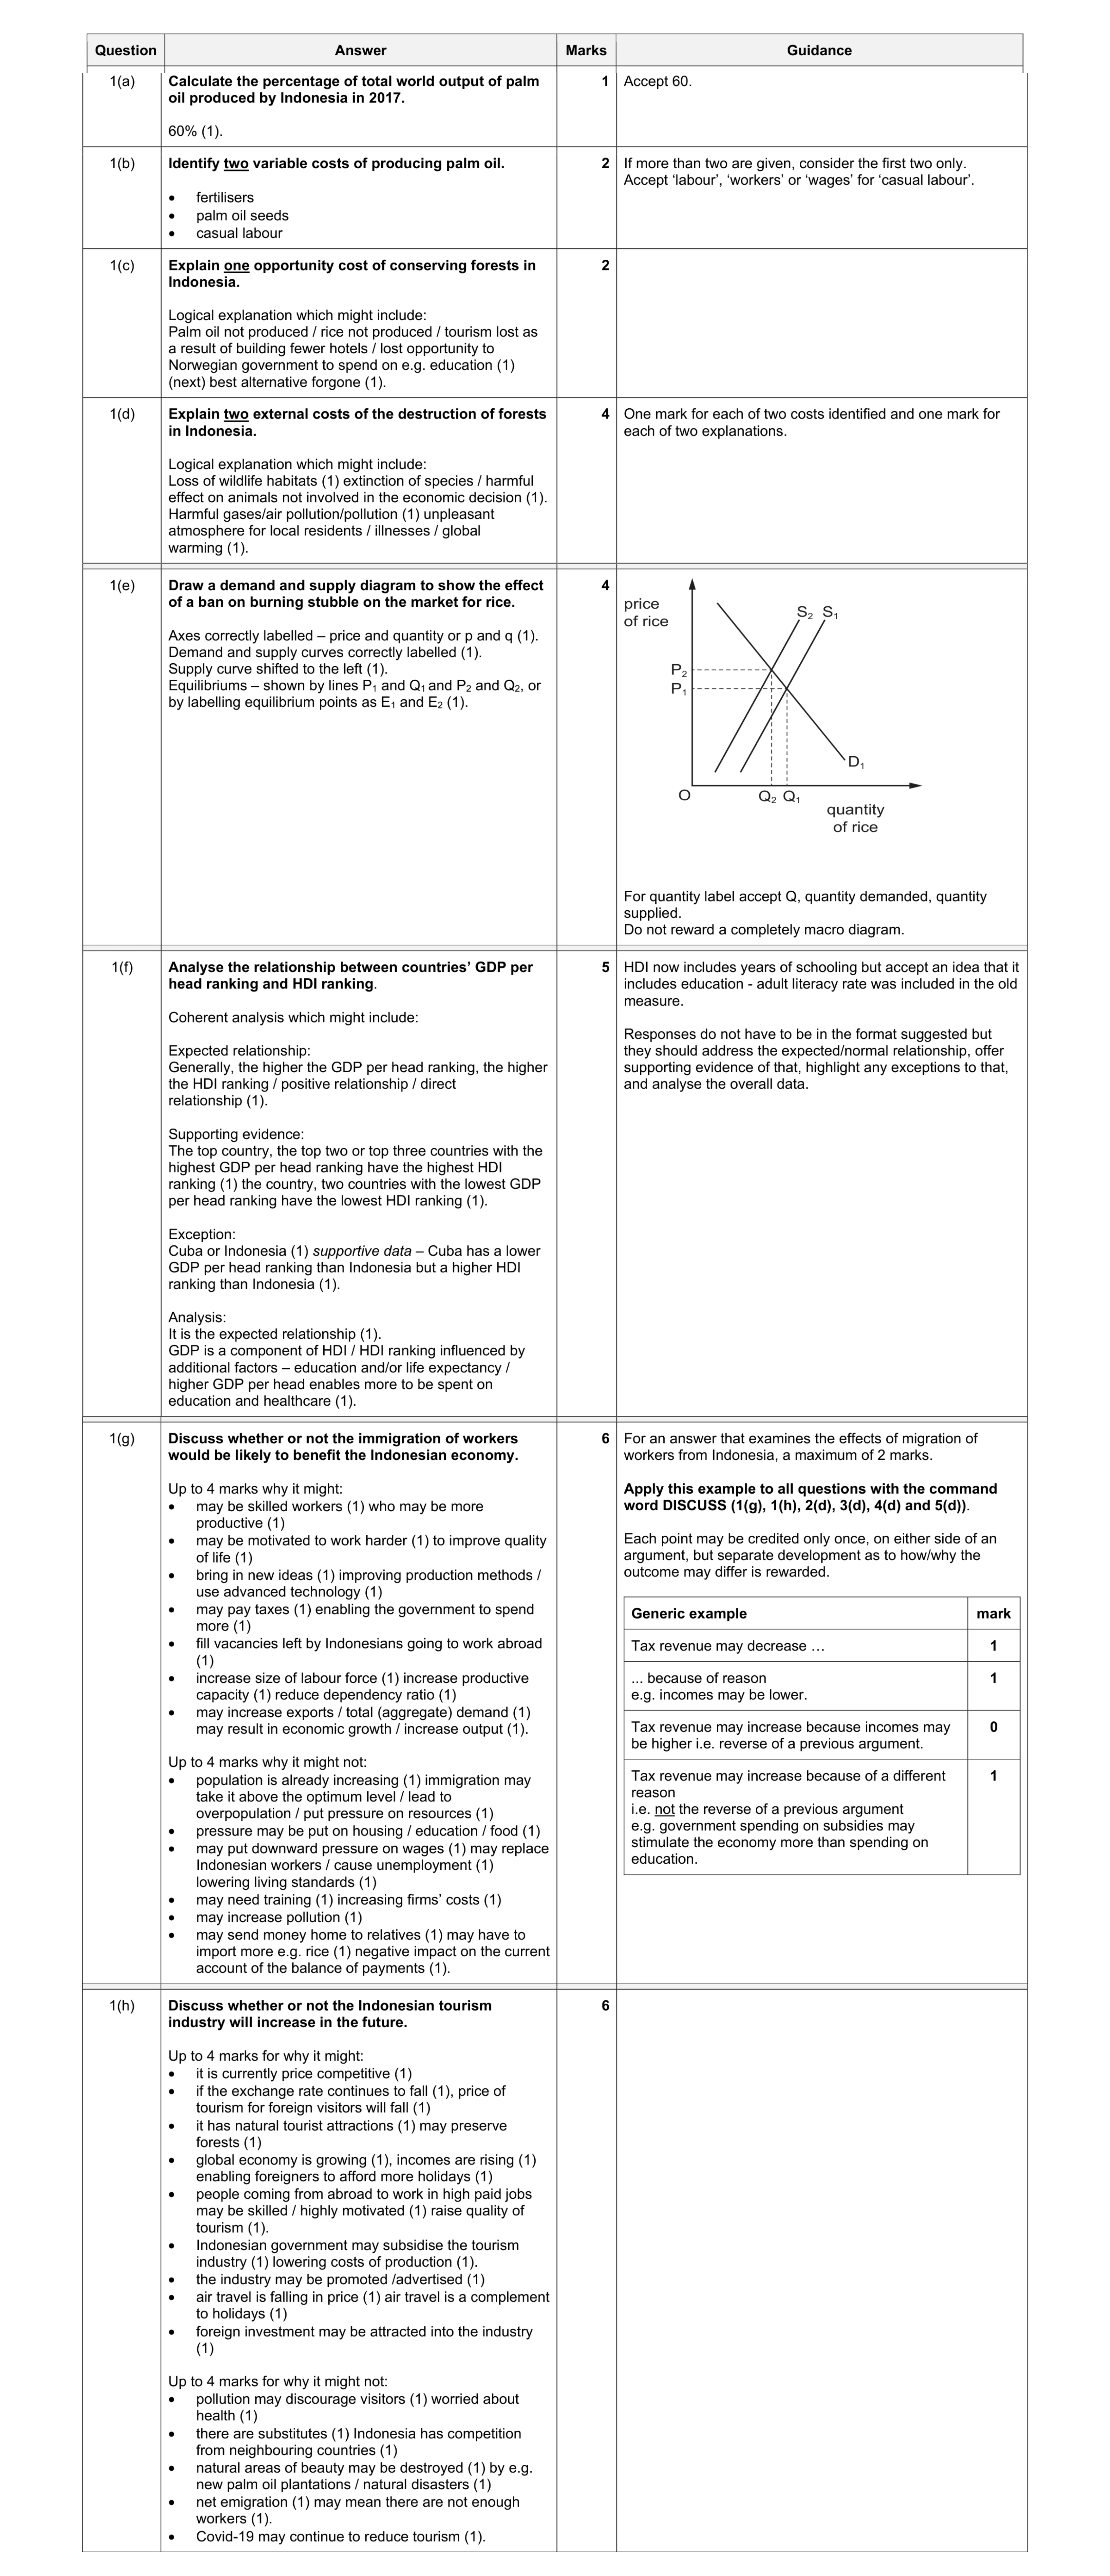 30
30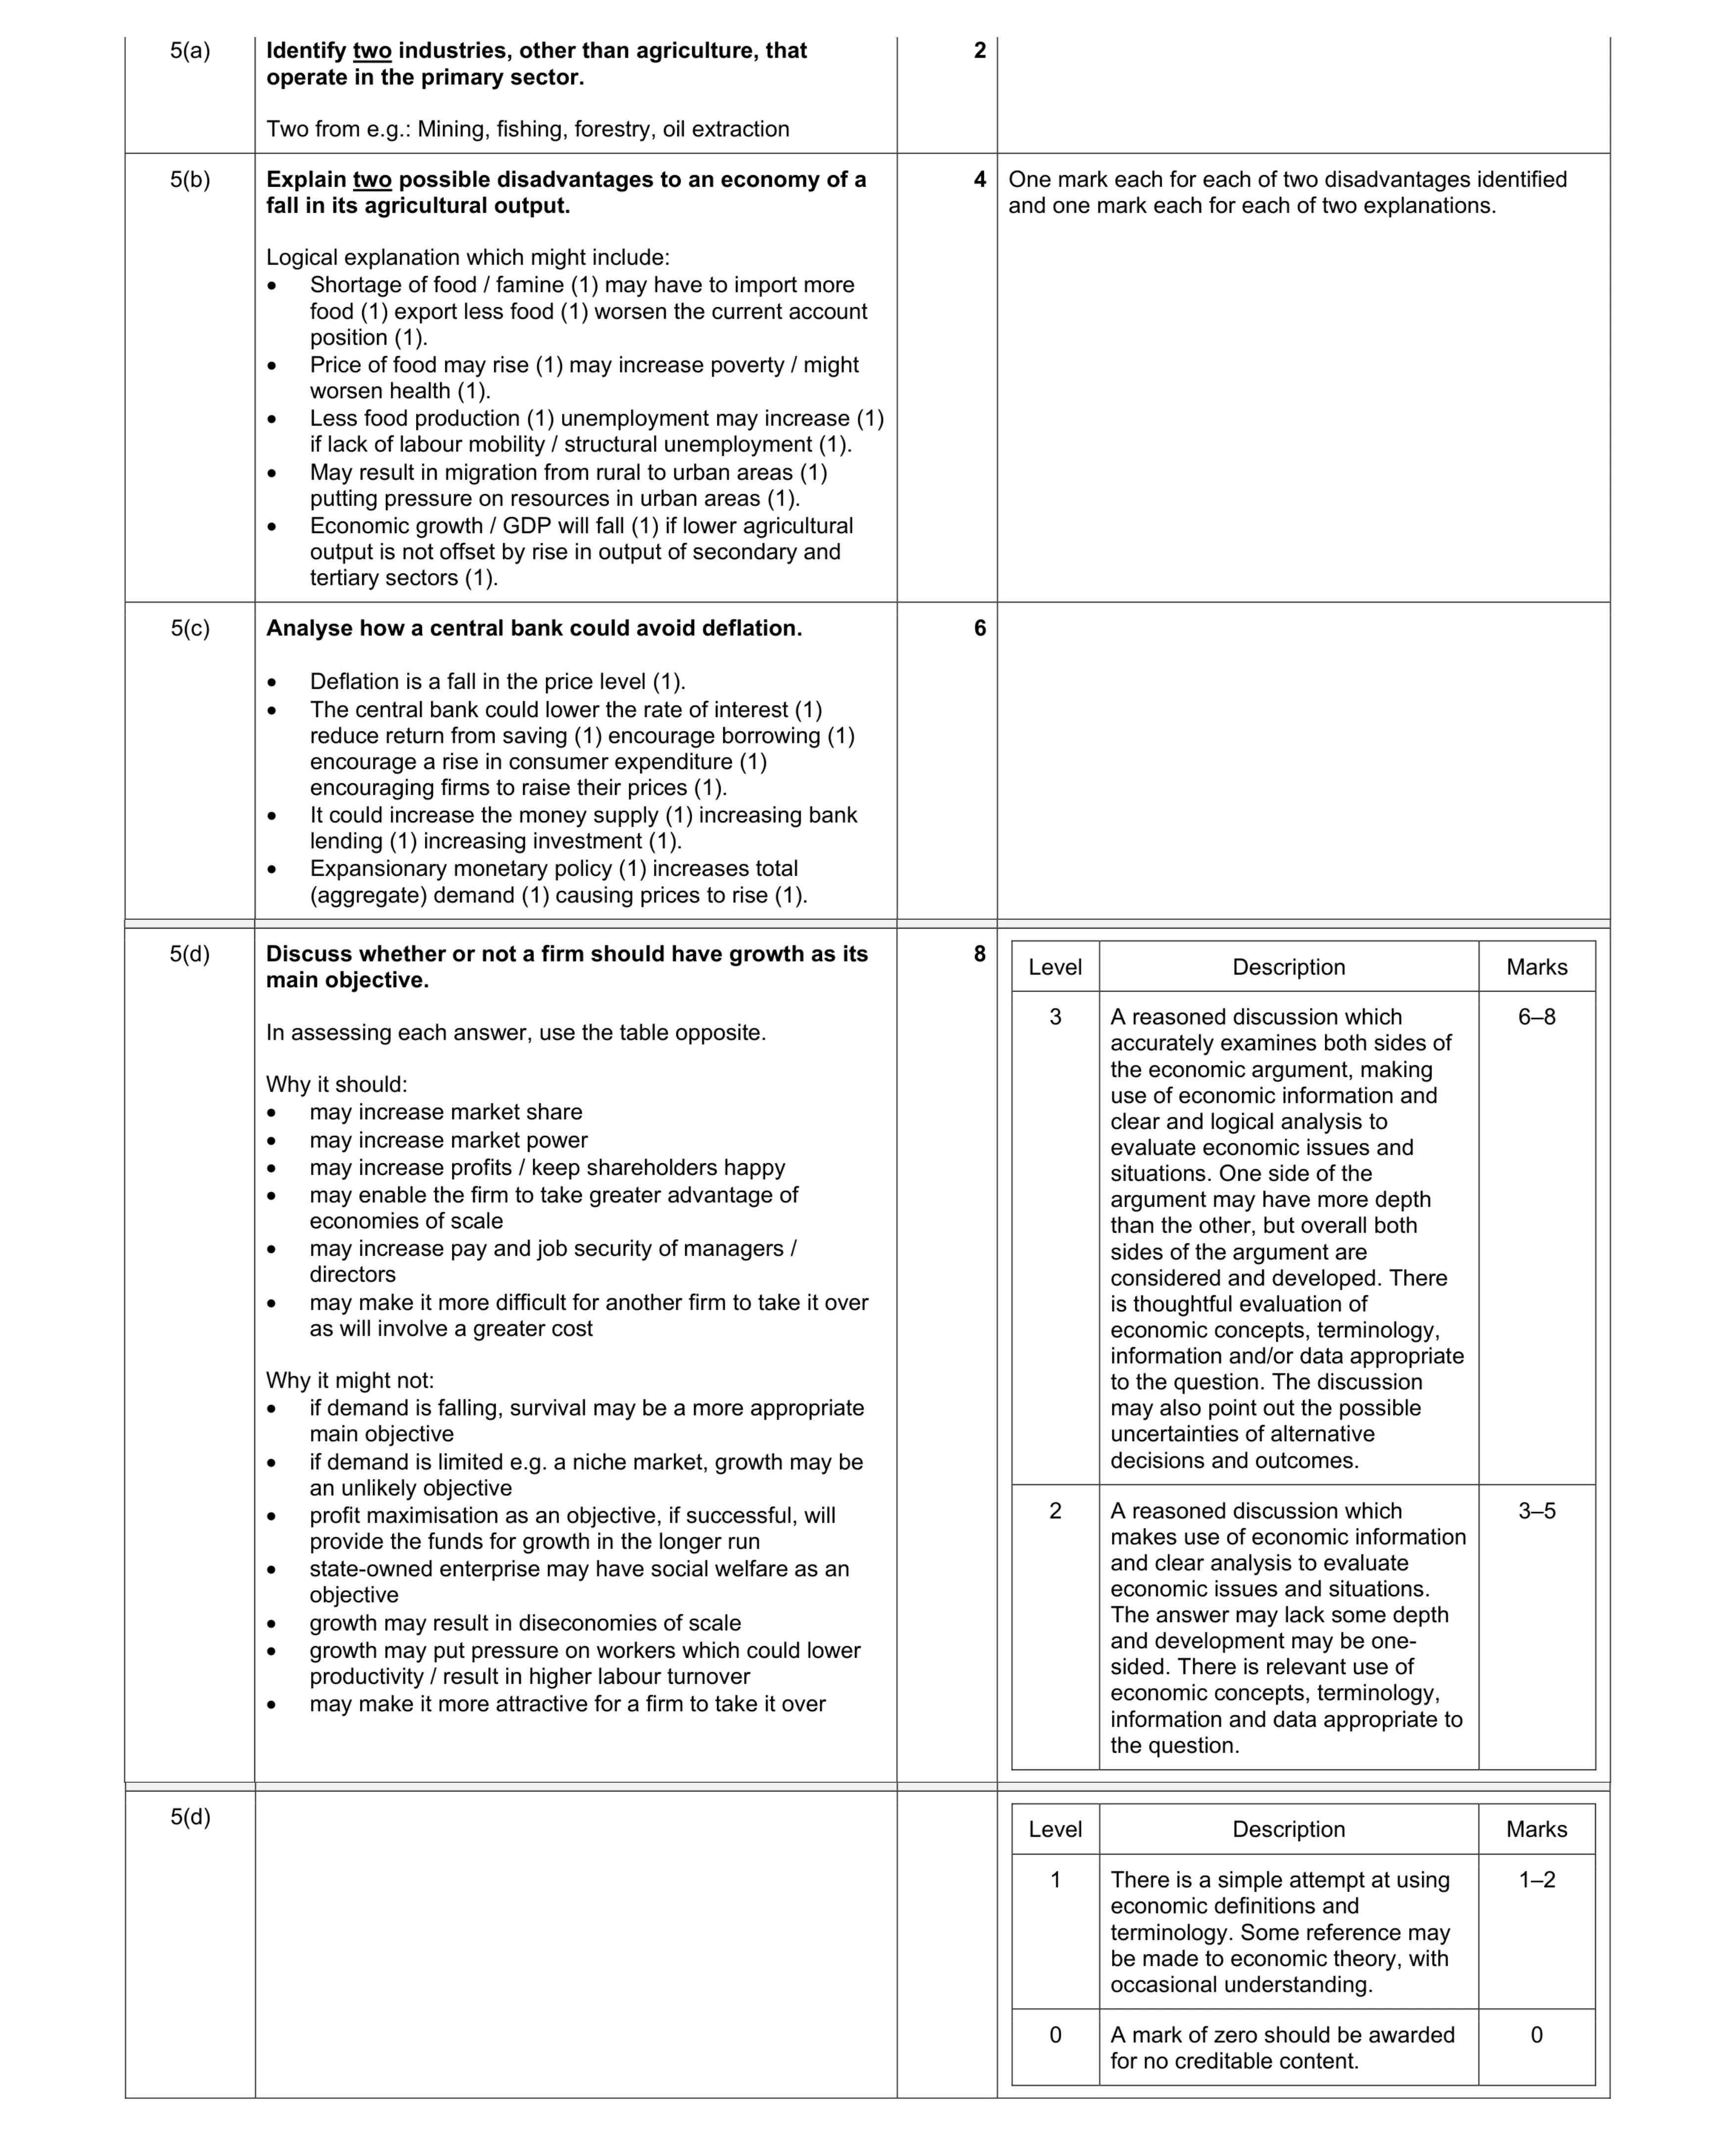 20
20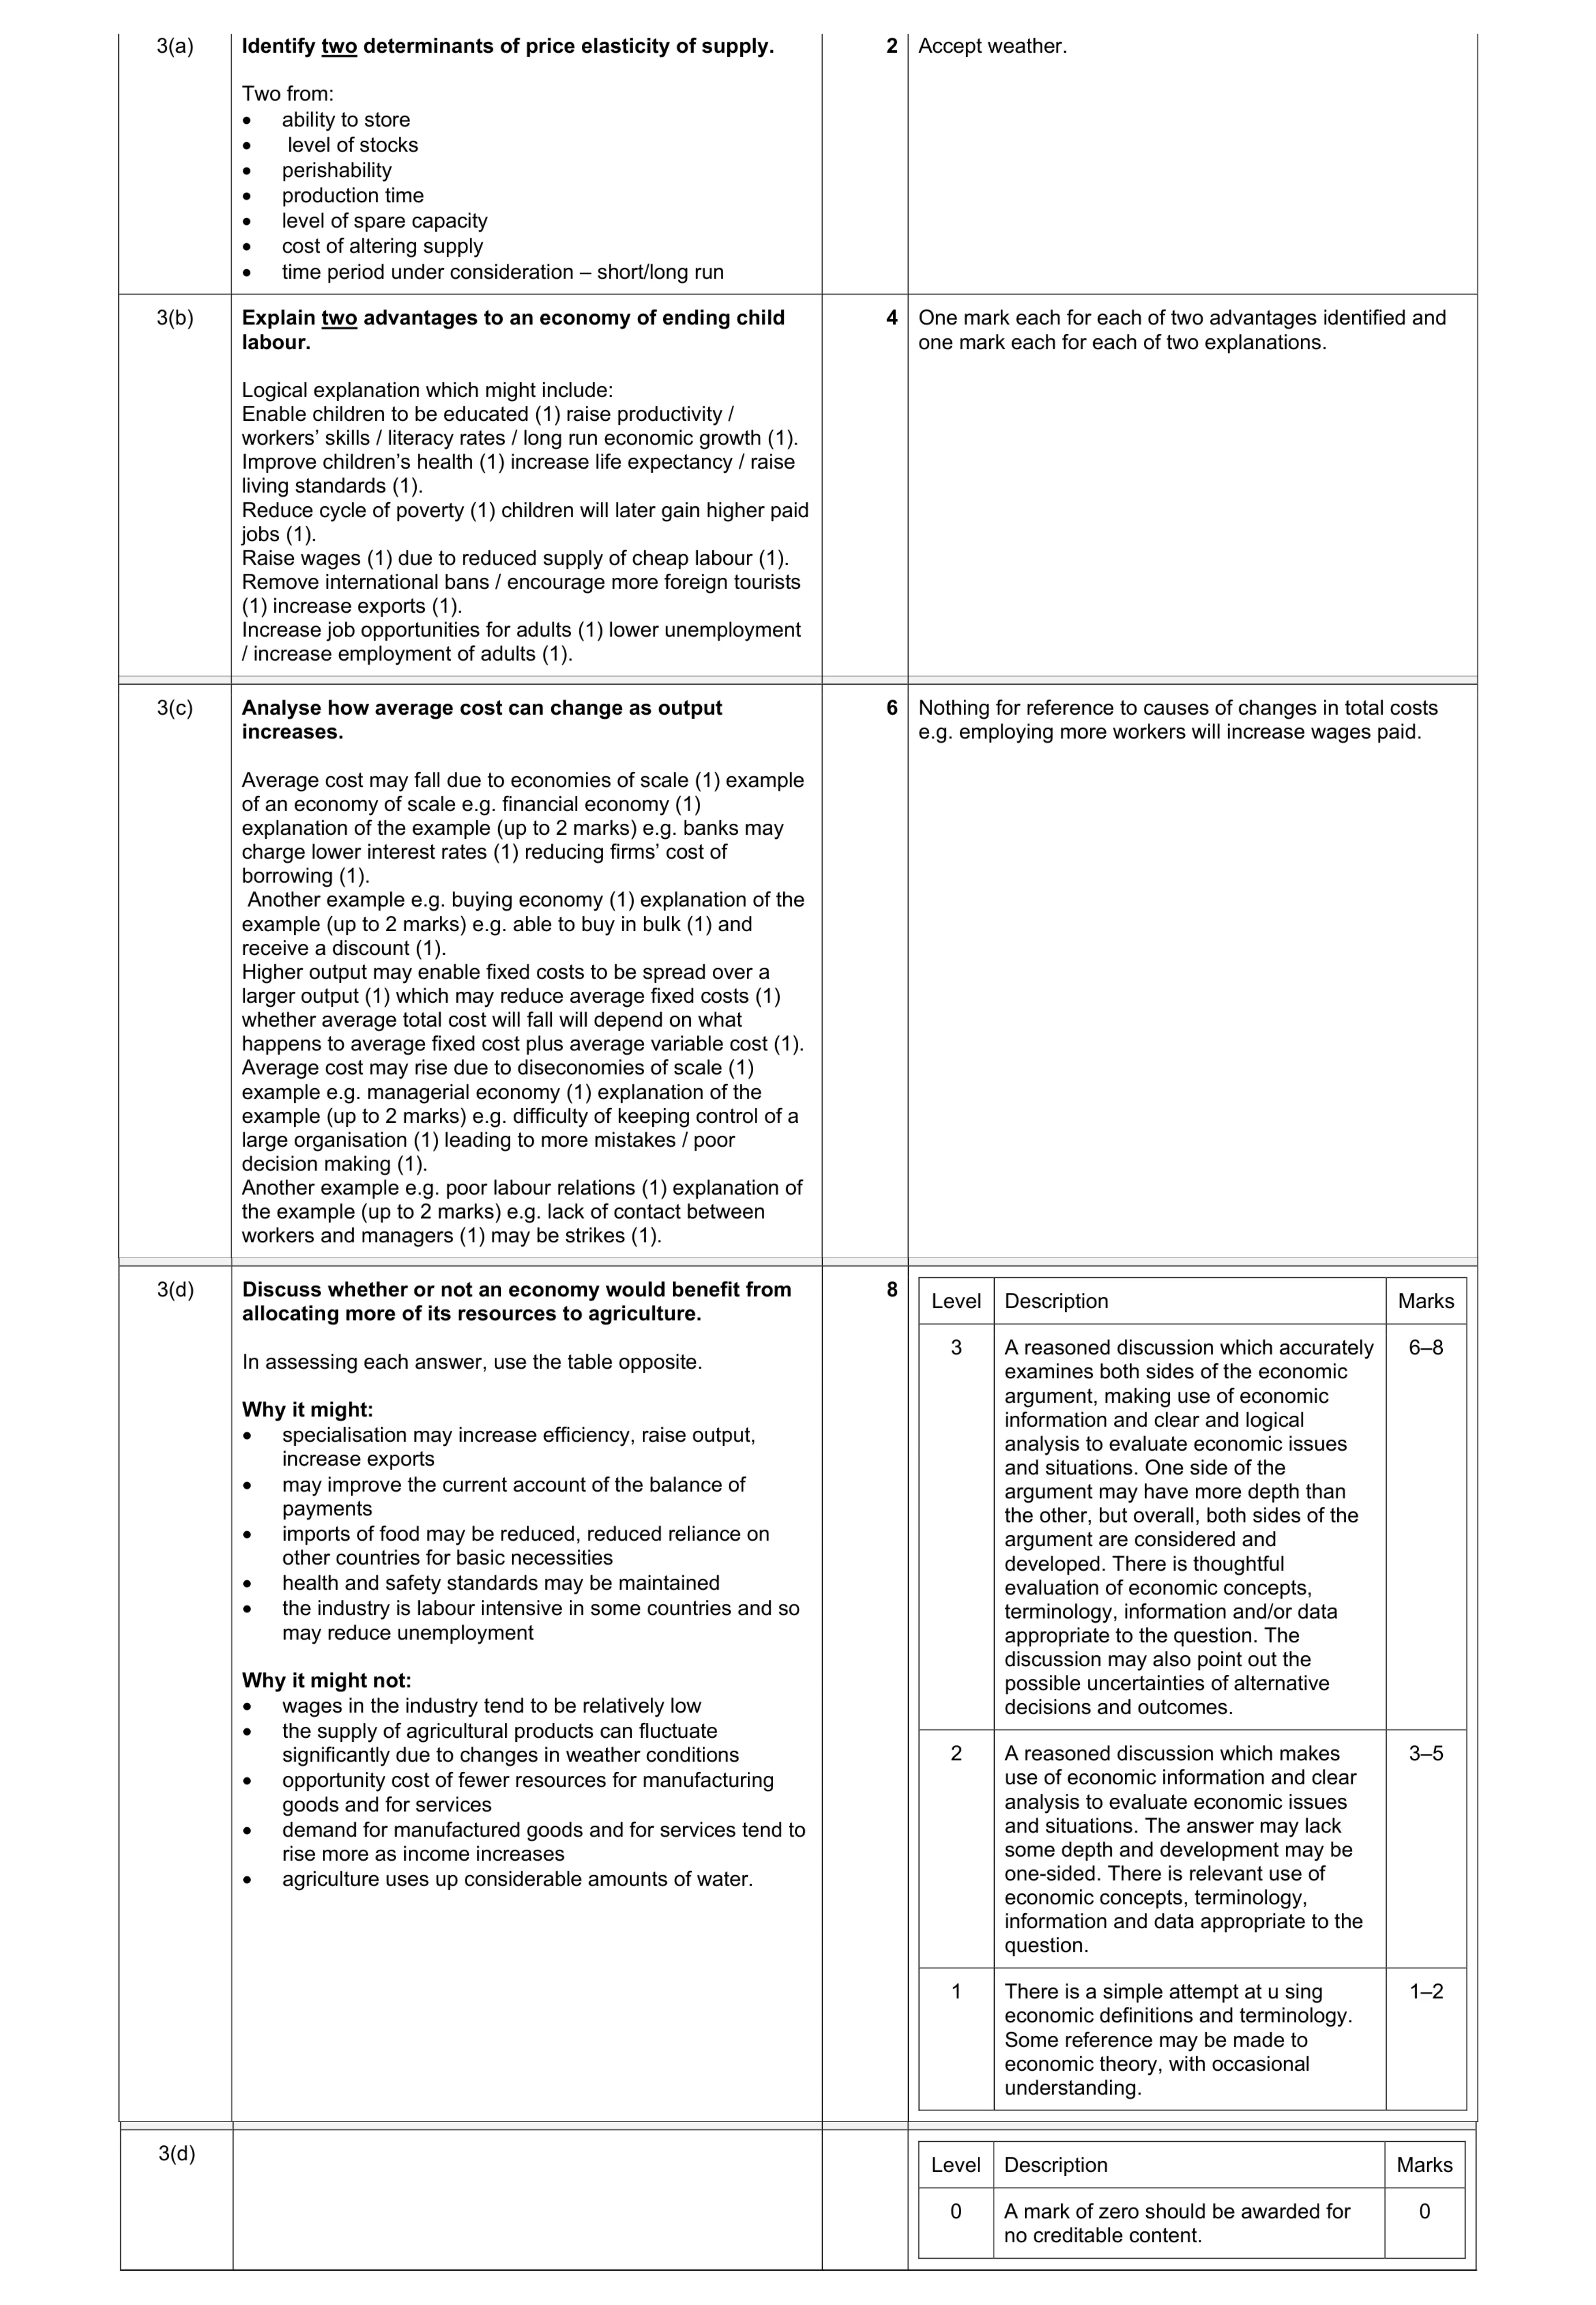 20
20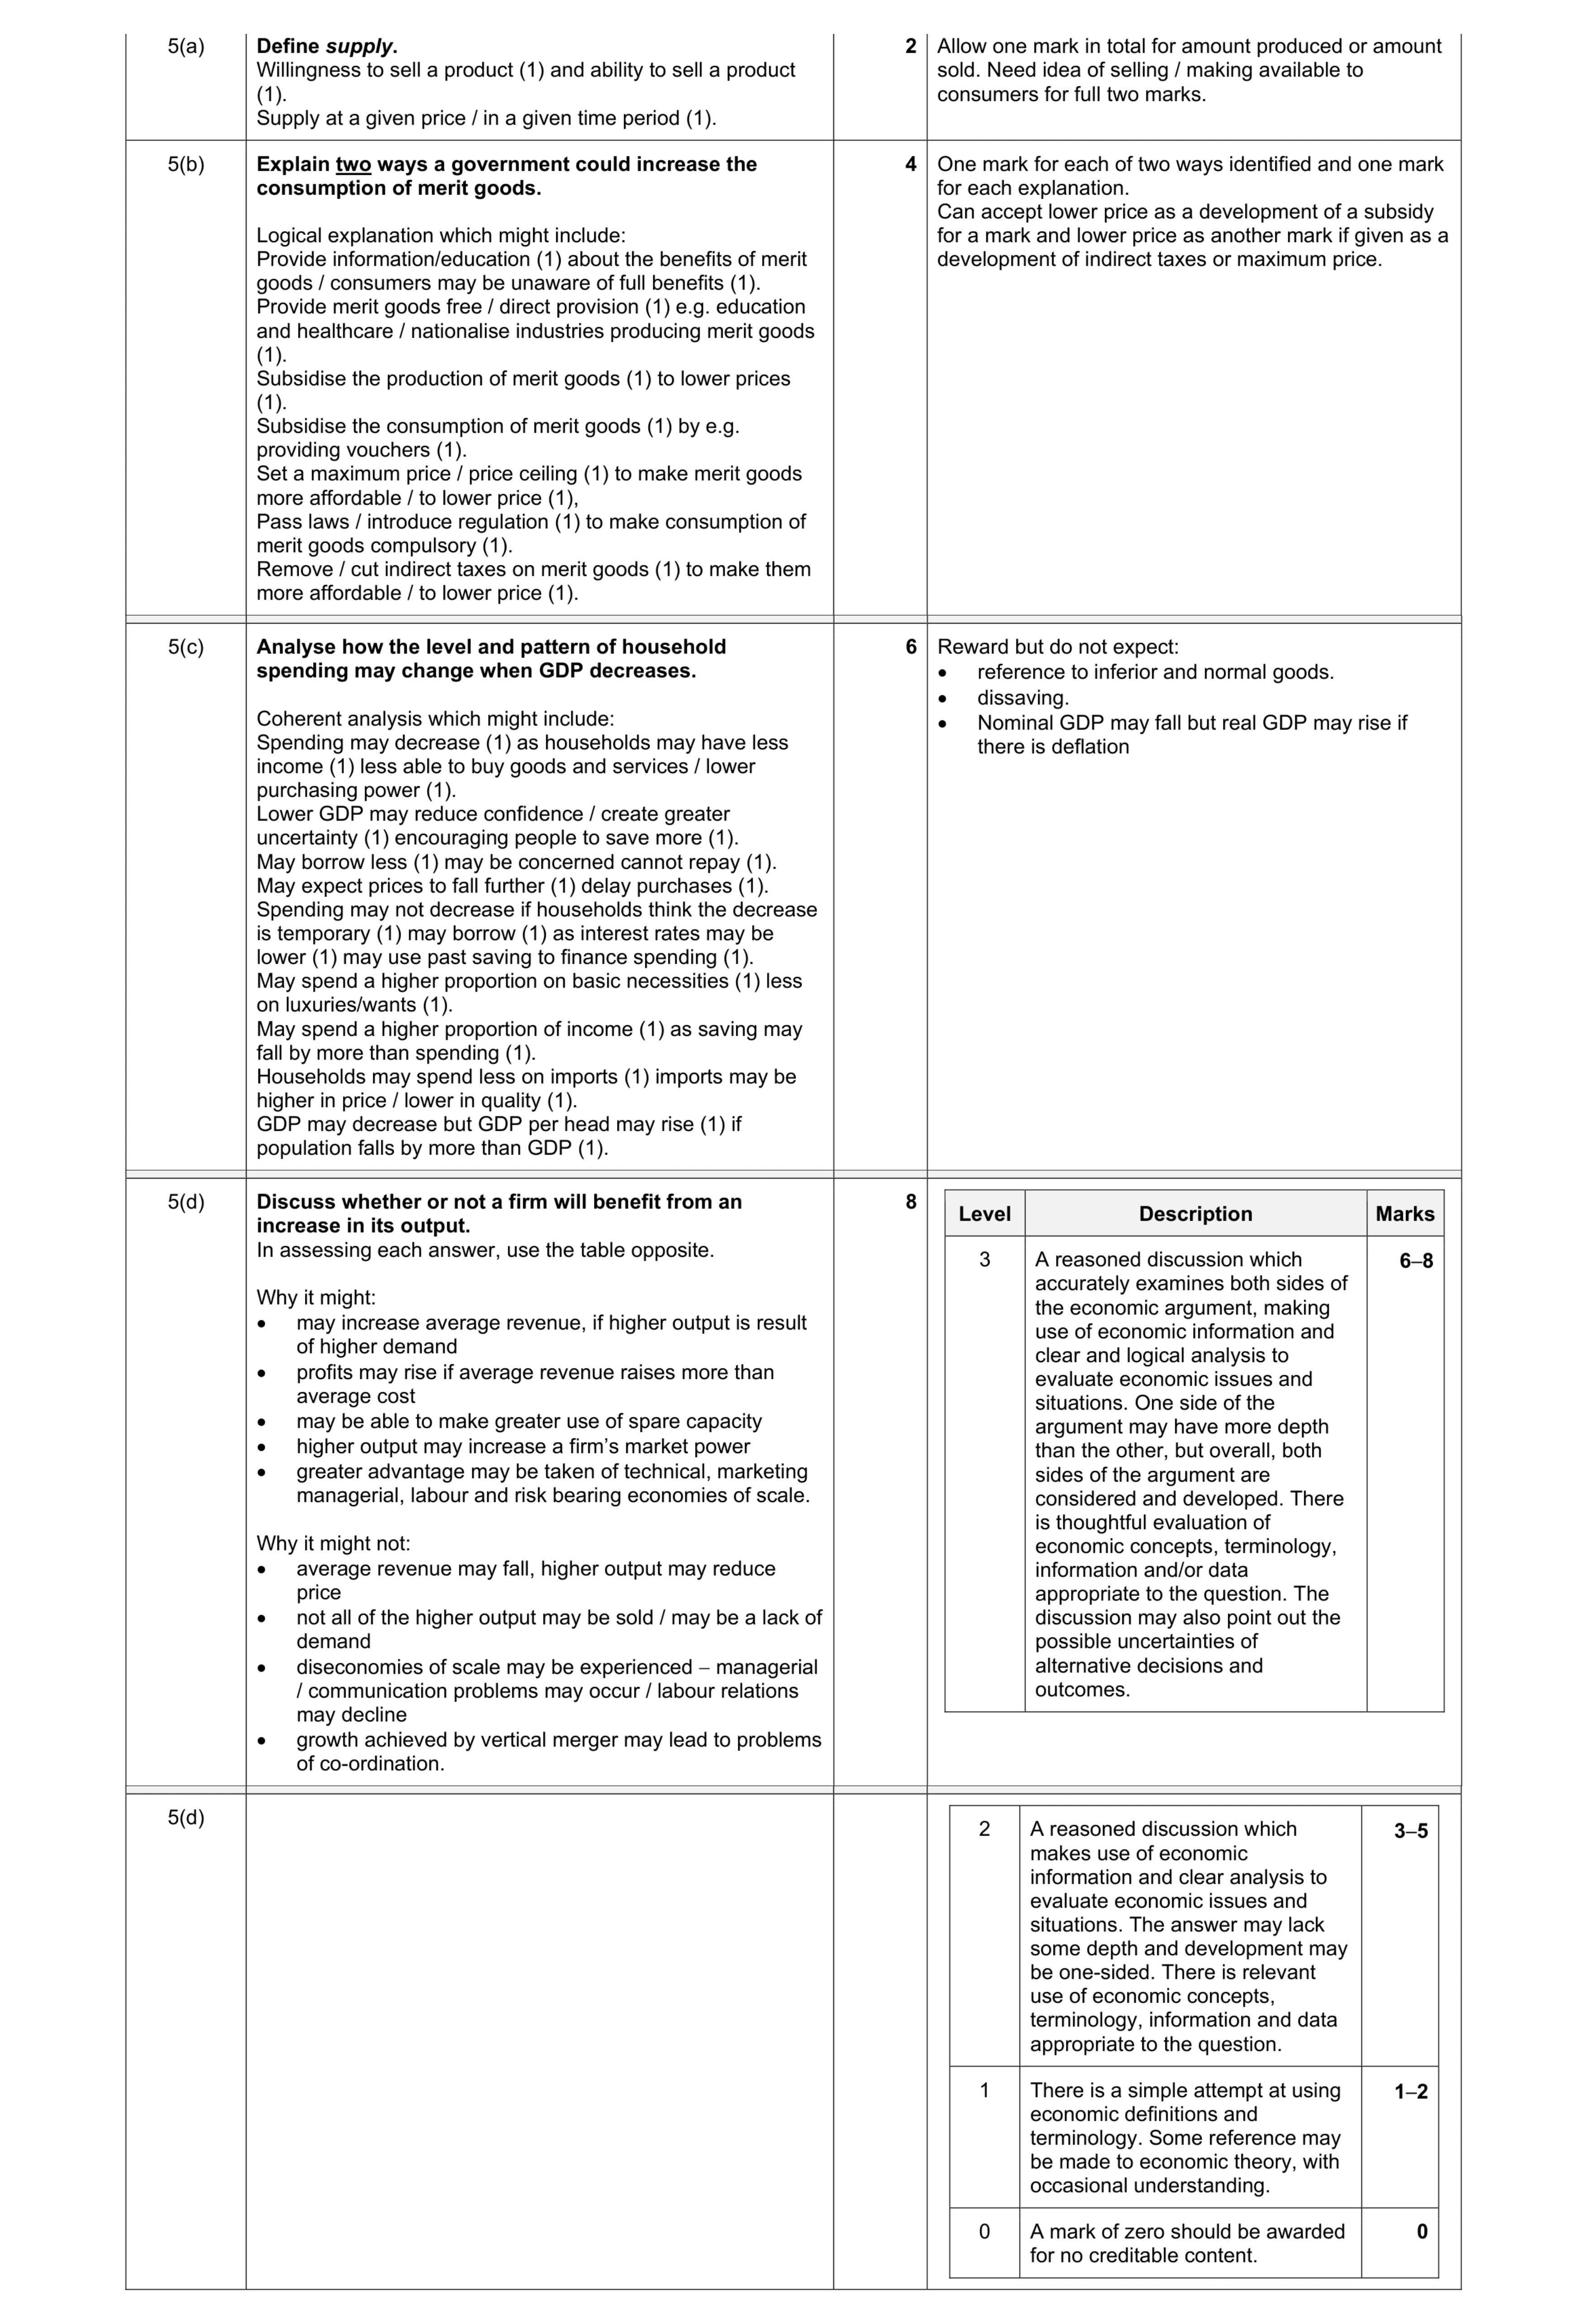 20
20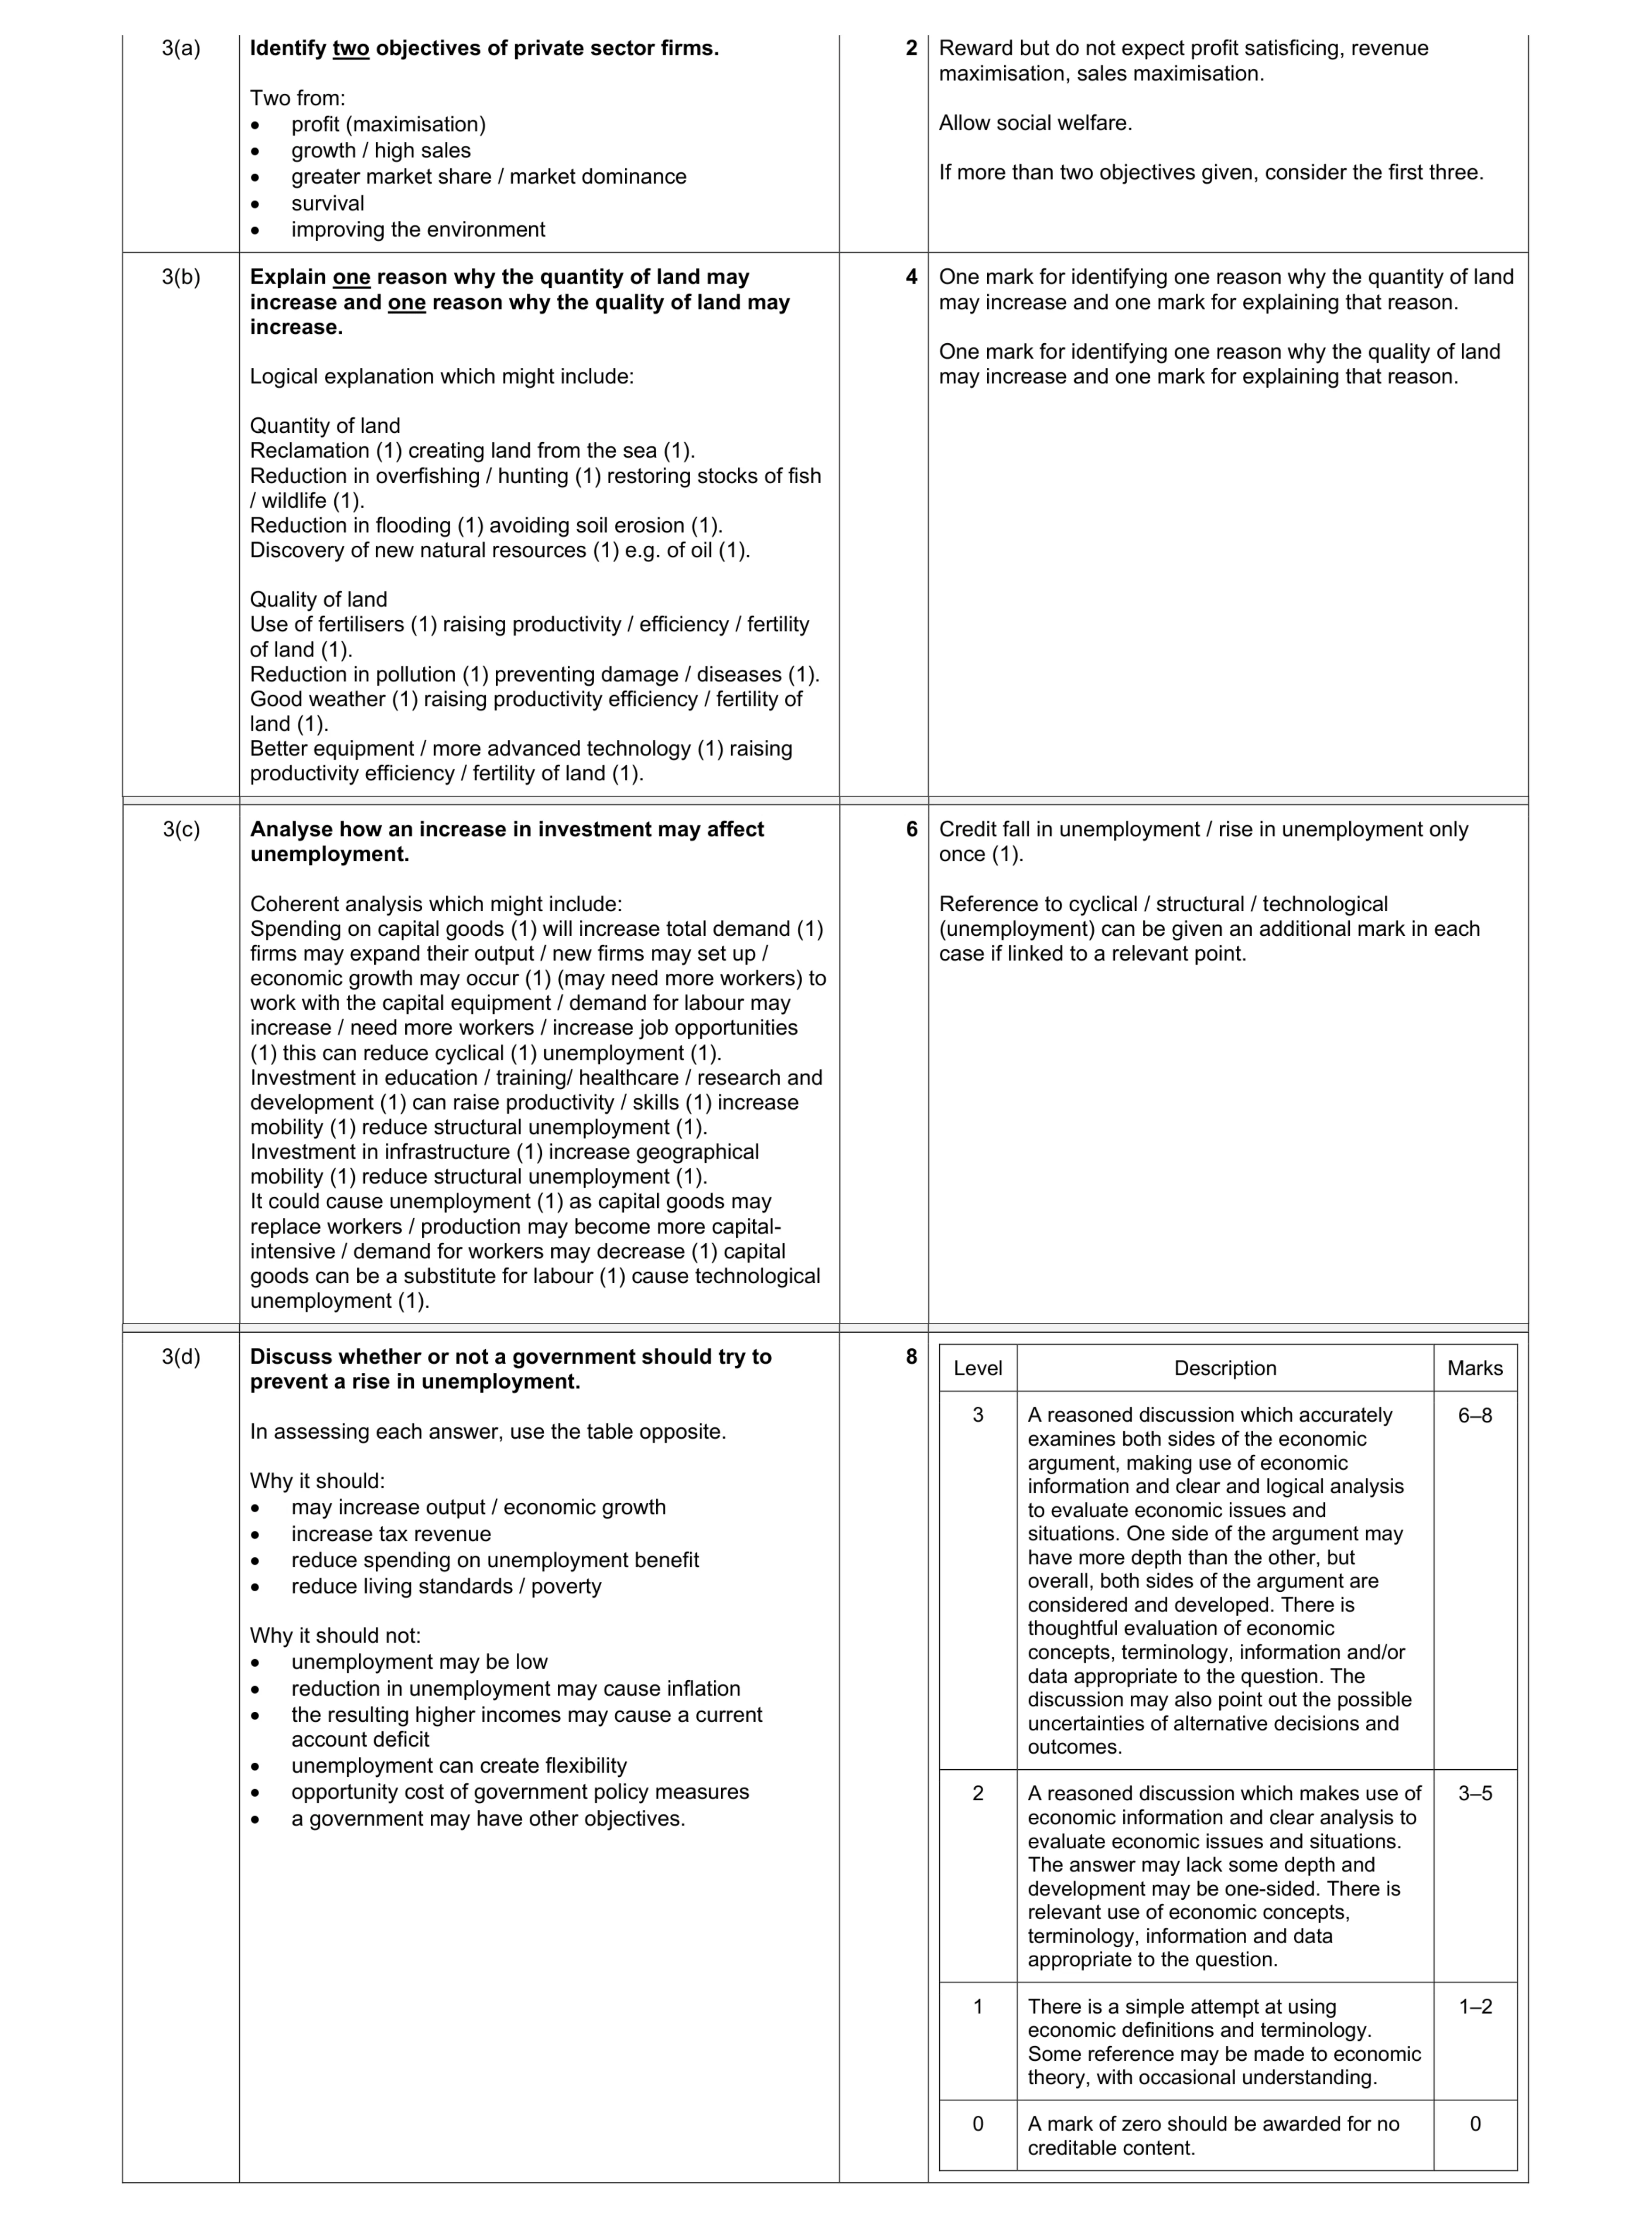 20
20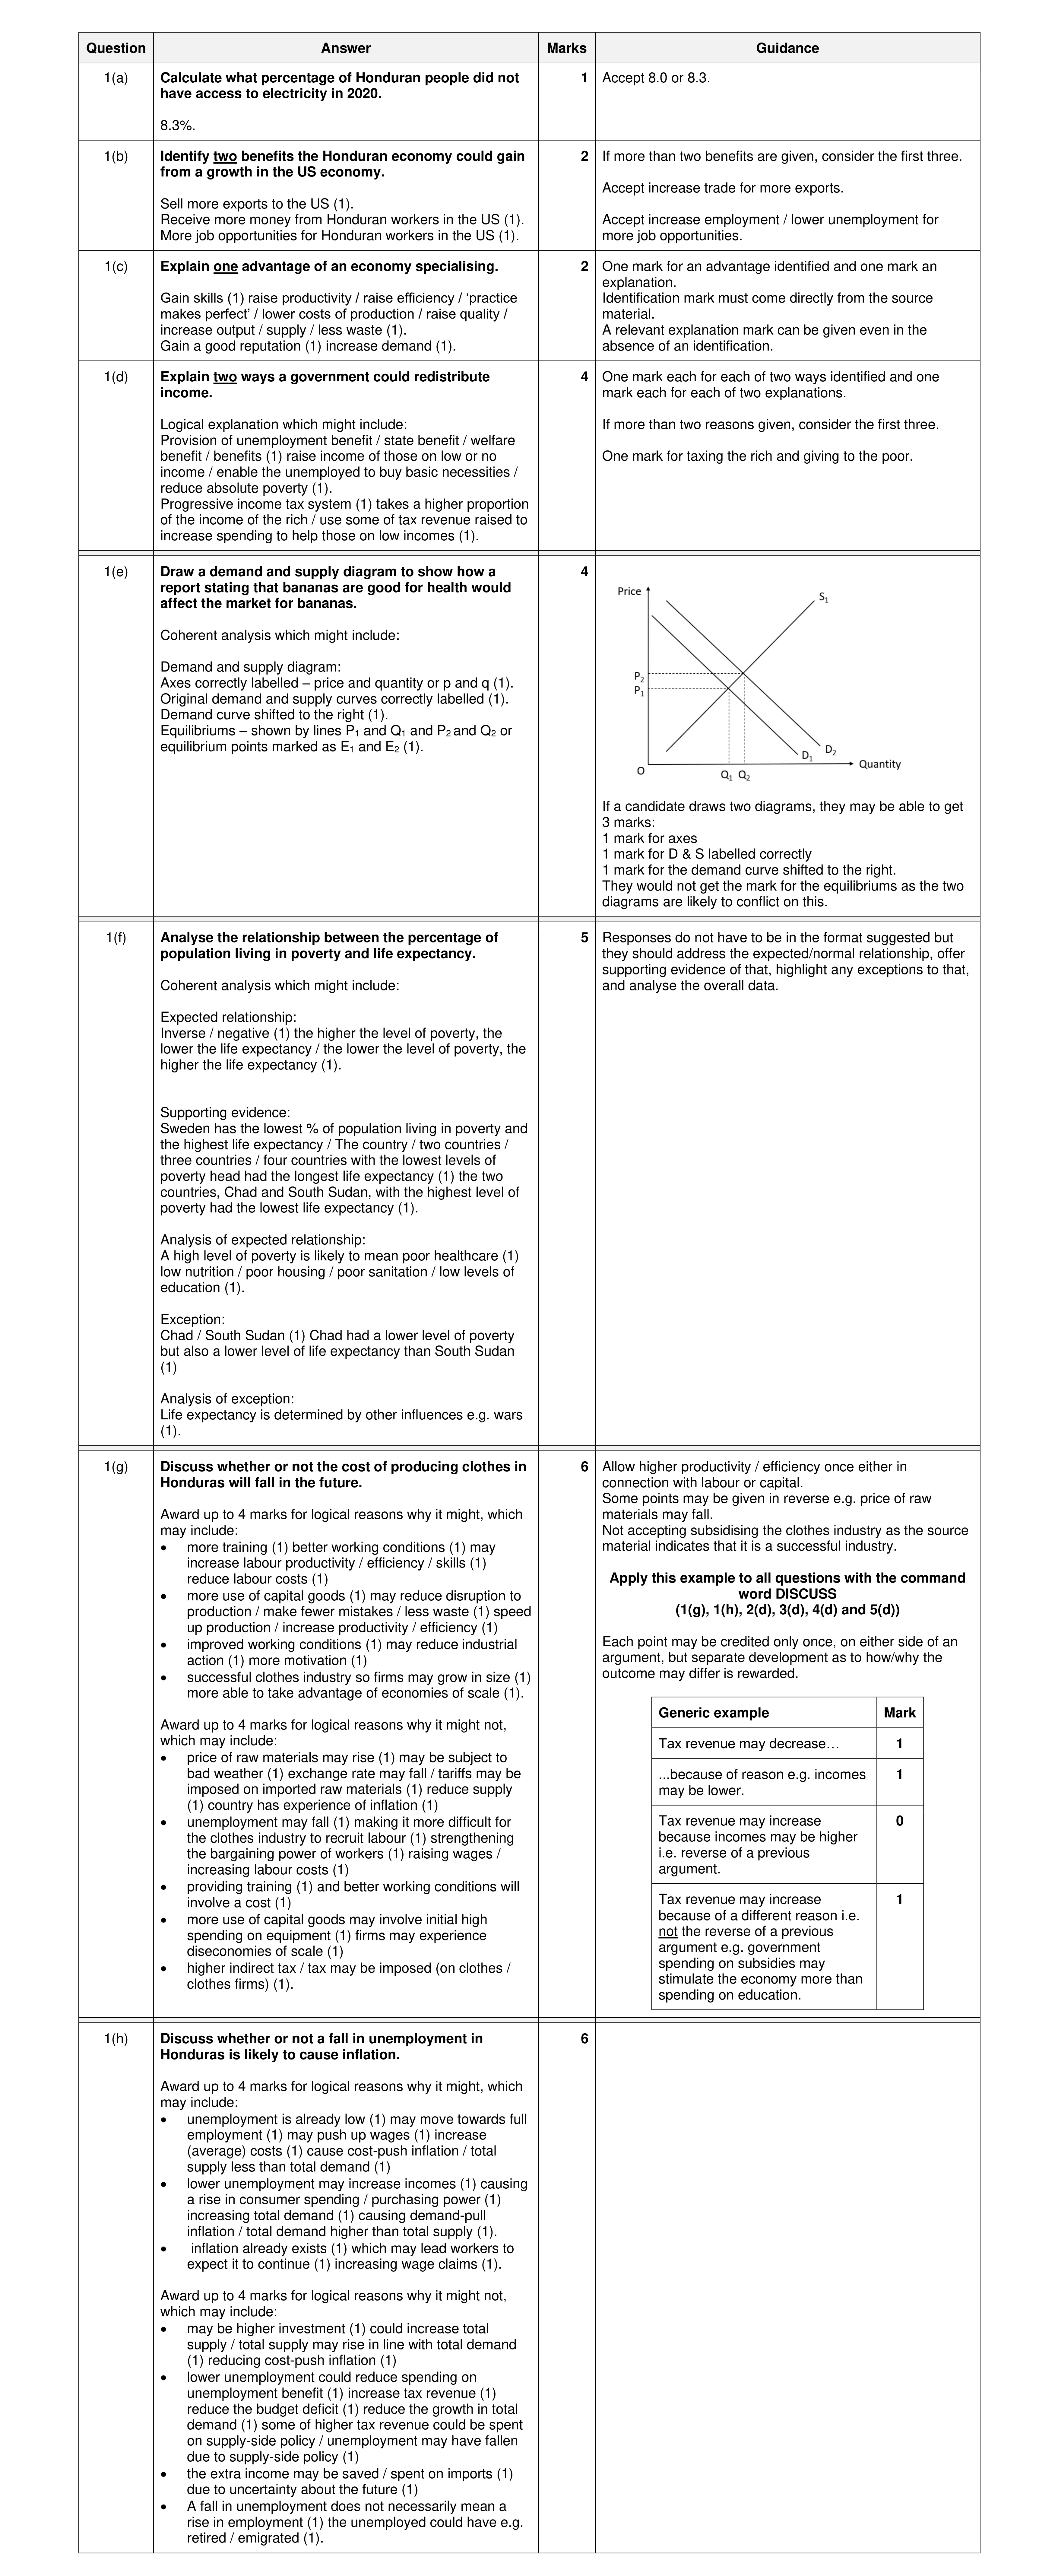 30
30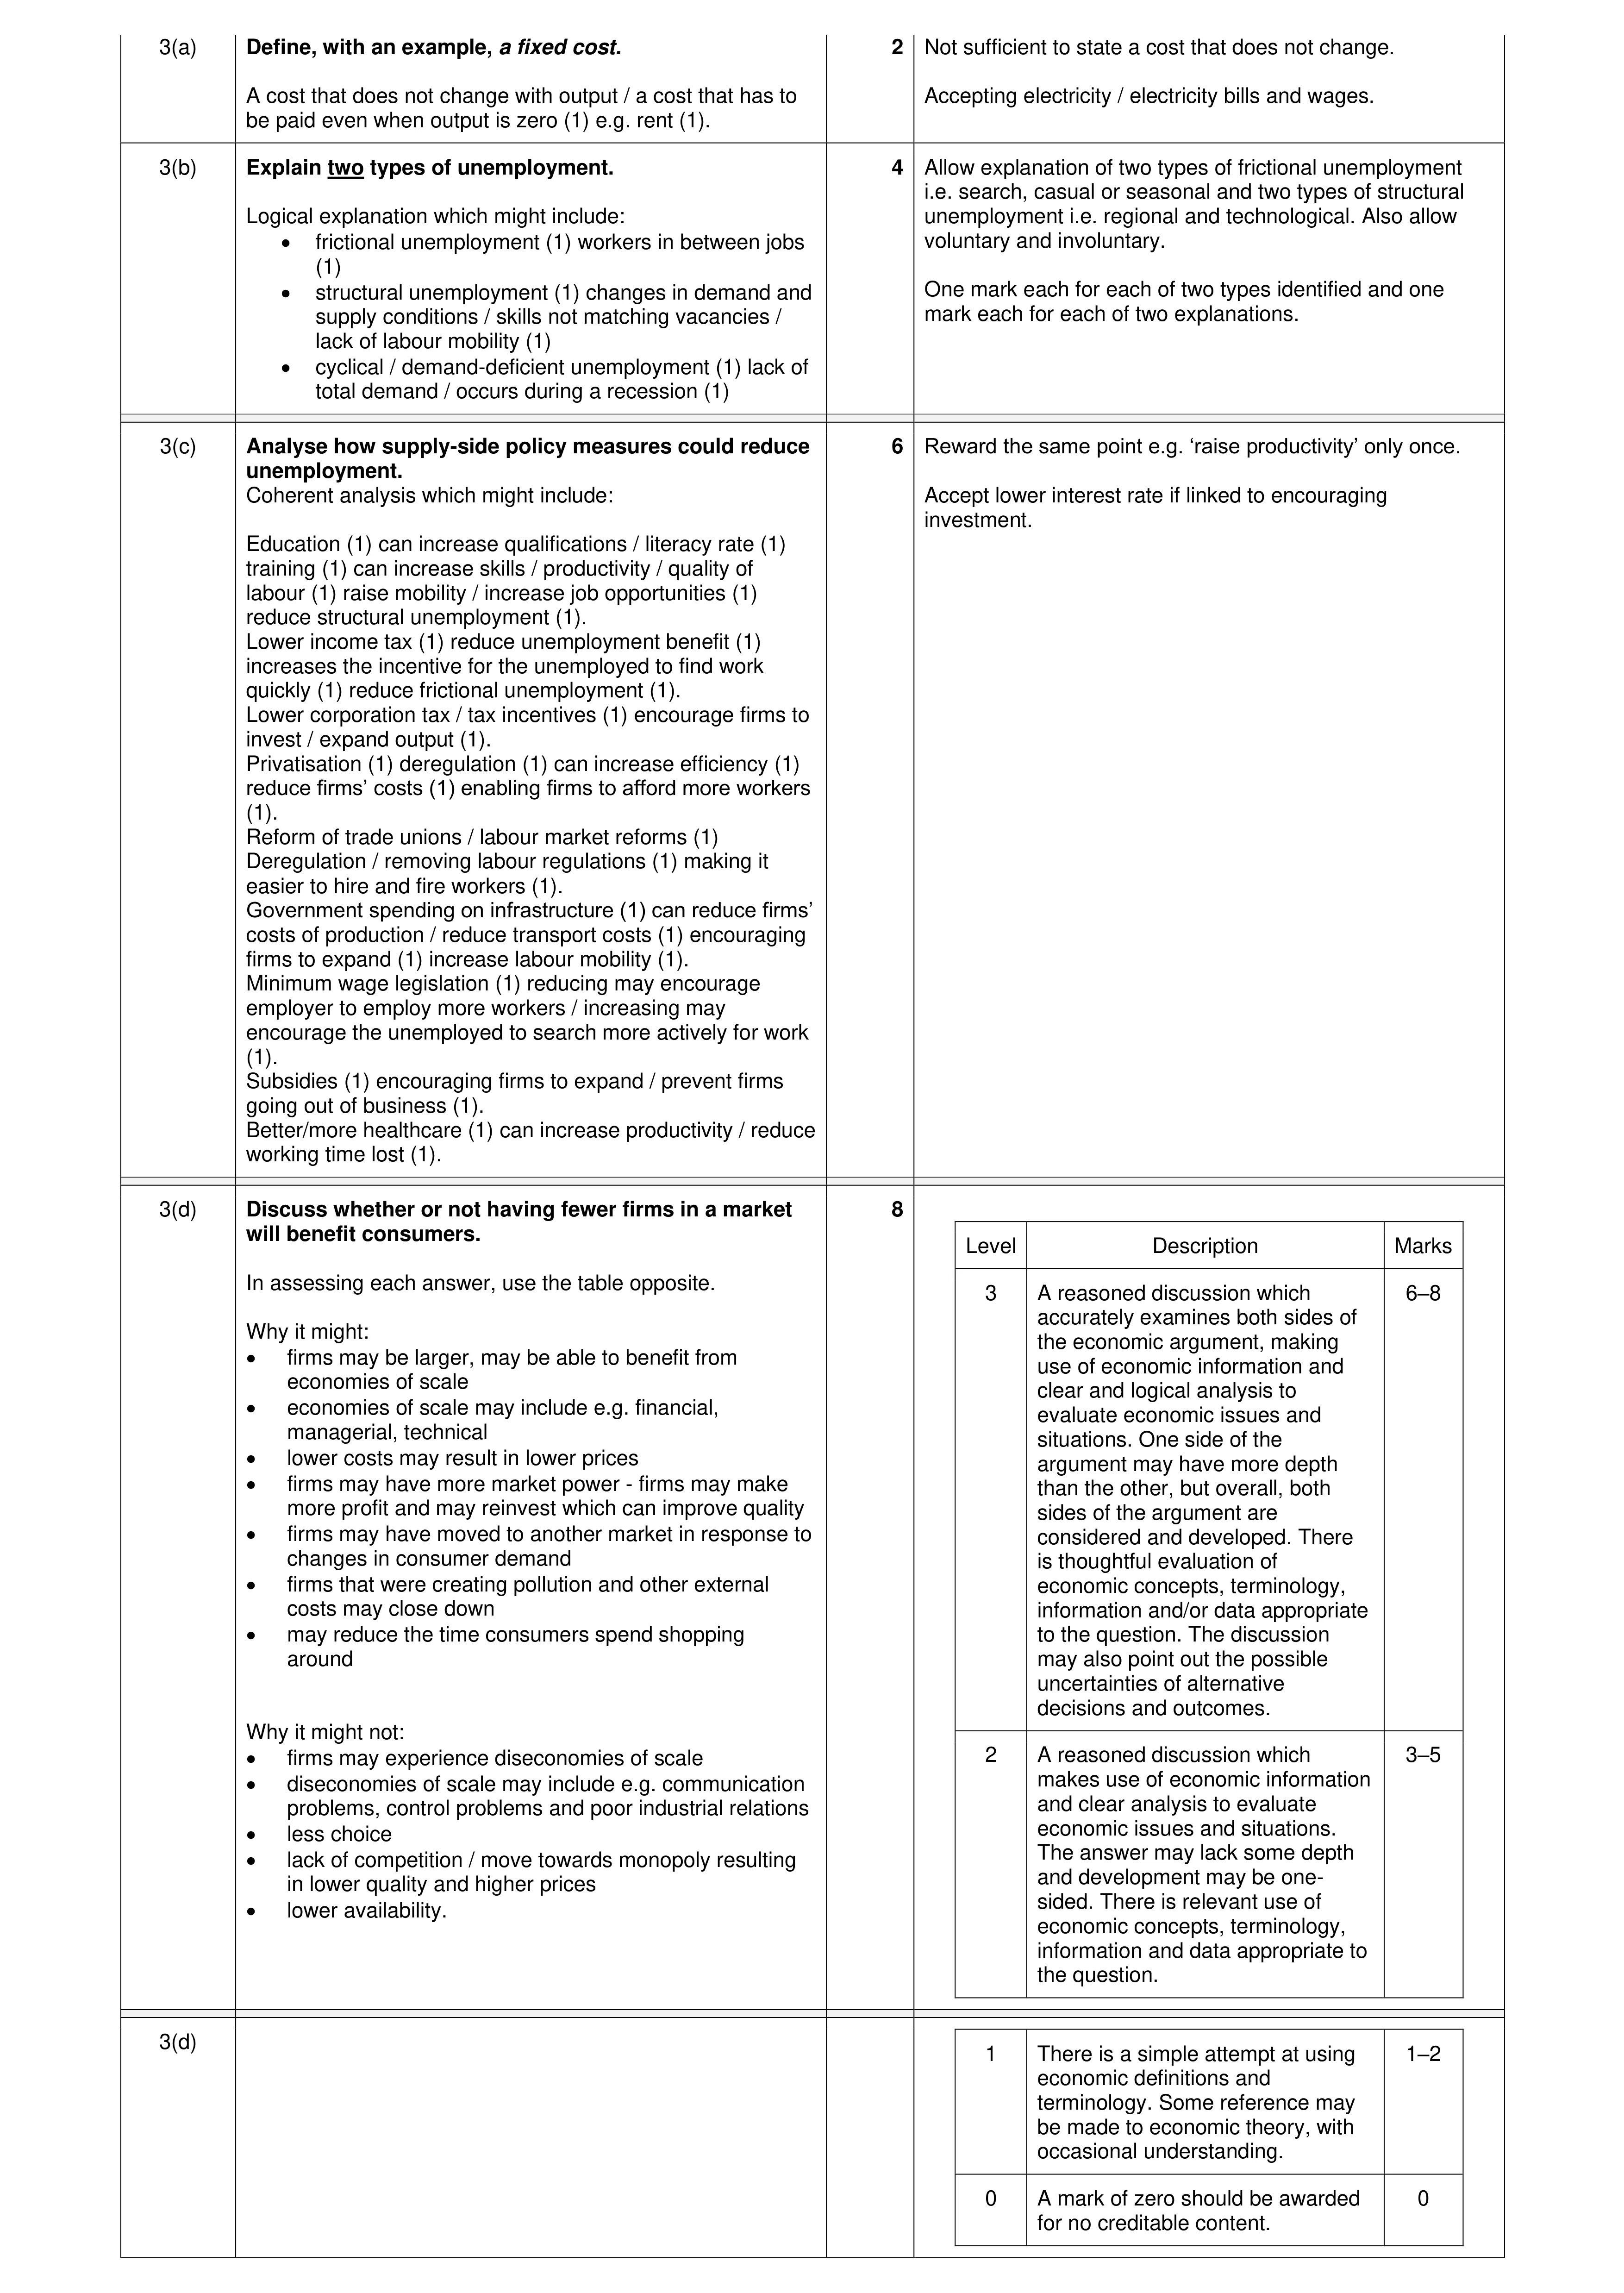 20
20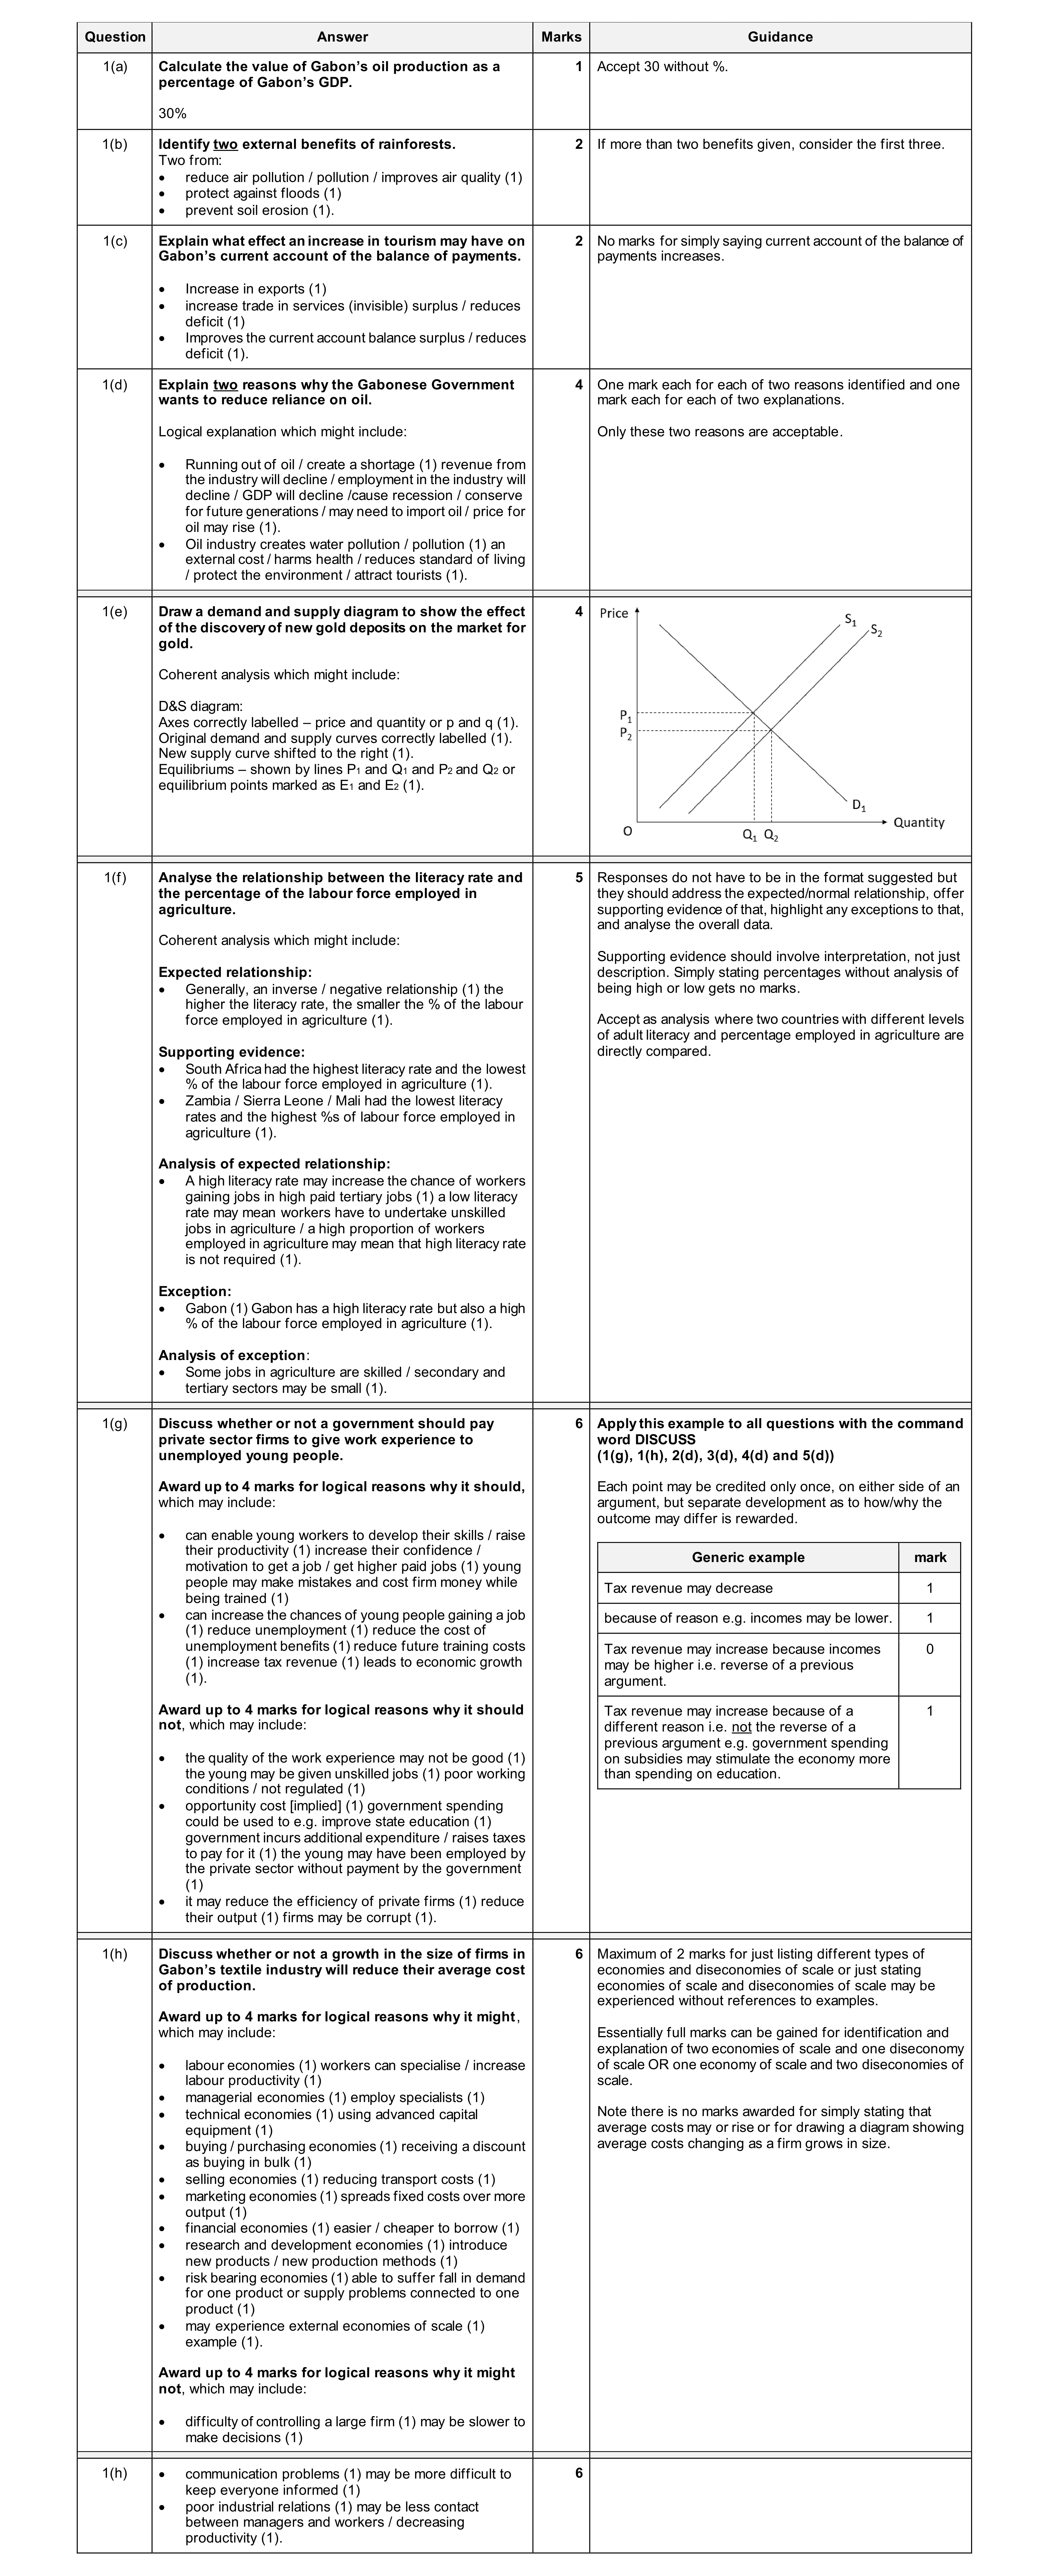 30
30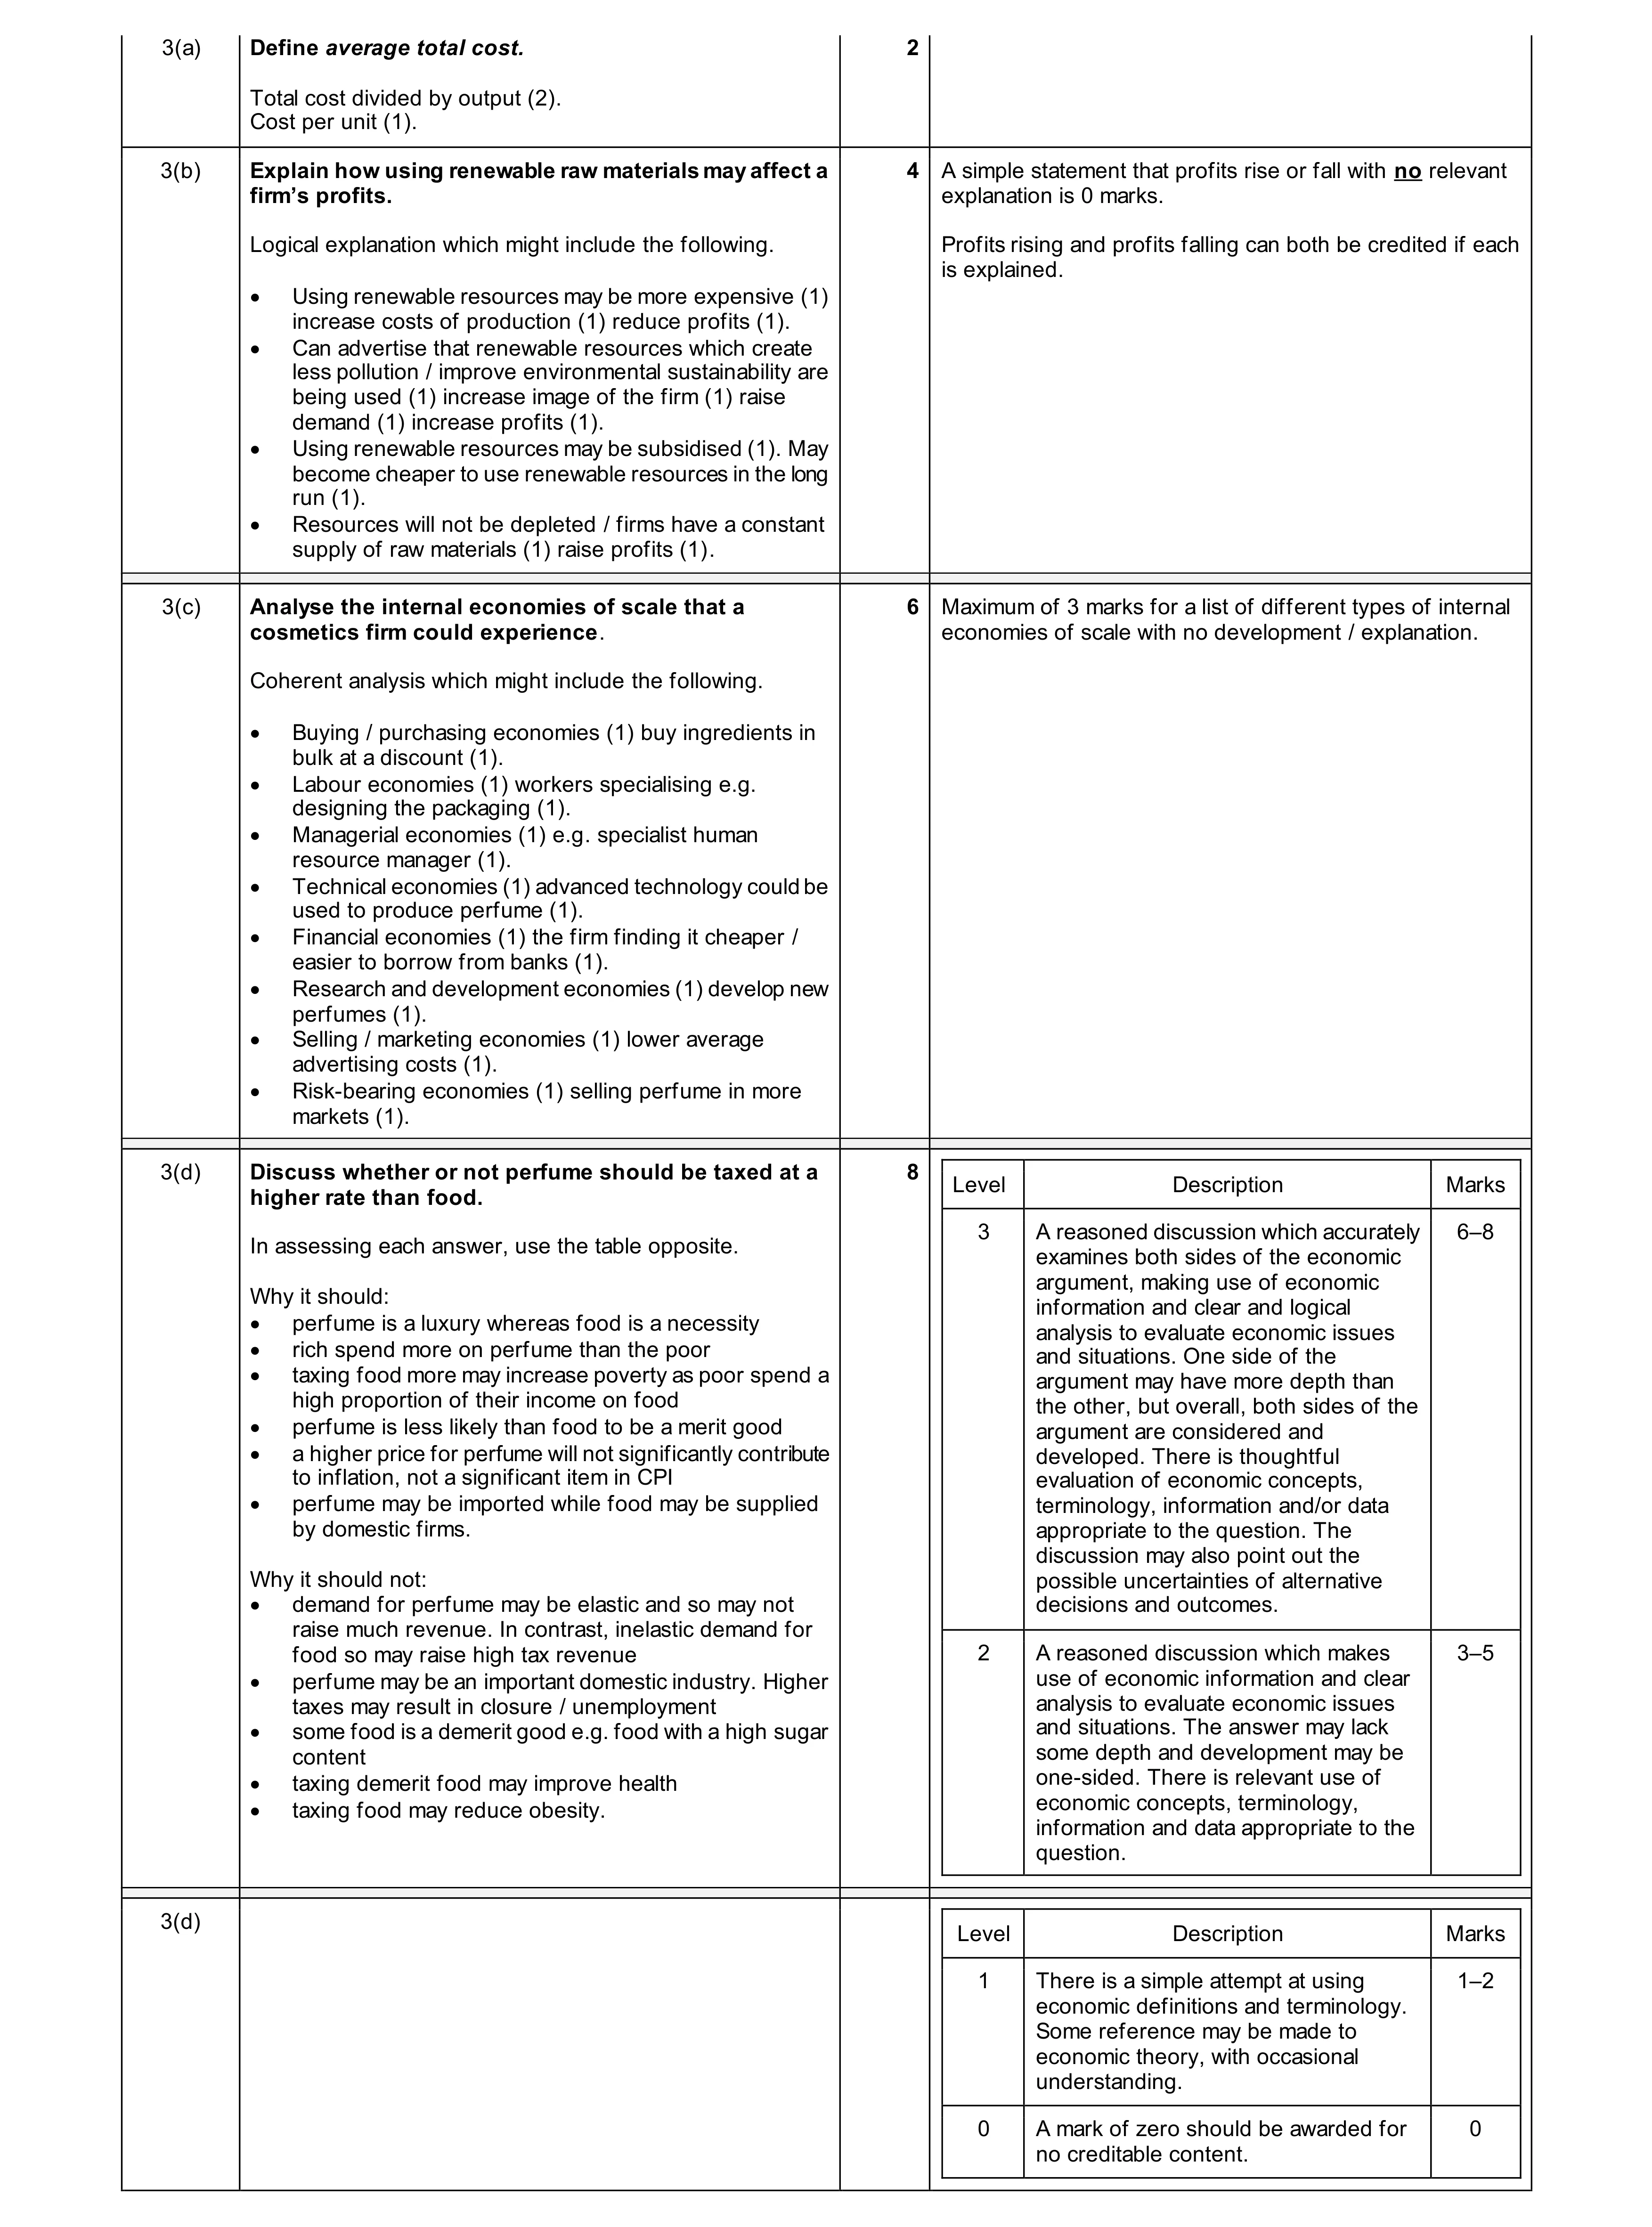 20
20