Questions as text
Q1 · Australian firms have been praised for introducing new technology 0987/21 May/June 2020
5 Australian firms have been praised for introducing new technology. The actions of some of these firms, however, cause market failure. The Australian government uses subsidies, among other policies, to reduce market failure. Government spending is used both to improve the performance of individual markets and the macroeconomy. The Australian government increased its spending in 2017, in part to reduce unemployment. (a) State two objectives of firms. [2] (b) Explain how a subsidy can correct market failure. [4] (c) Analyse, using a production possibility curve (PPC) diagram, the effect of advances in technology on an economy. [6] (d) Discuss whether or not an increase in government spending will reduce unemployment. [8]
20 marks
Mark scheme: 5(a) State two objectives of firms. 2 One mark each for two from: survival, social welfare, profit maximisation and growth. 5(b) Explain how a subsidy can correct market failure. 4 Logical explanation which might include: A payment to increase production (1) and lower price (1) can increase consumption of merit goods (1) products with positive externalities (1) which are under-consumed if left to market forces (1) can be paid to private sector firms to produce public goods (1) would not be produced if left to market forces (1). 5(c) Analyse, using a production possibility curve (PPC) diagram, the effect 6 of advances in technology on an economy. Up to 4 marks for the diagram: Axes correctly drawn (1). Initial curve drawn as a curve or a downward sloping line to the axes (1). New curve drawn as a curve or a downward sloping line to the axes (1). Shift to the right indicated by arrow or lettering (1). Up to 2 marks for logical analysis: Advances in technology raise the quality of capital (1) increase productive capacity (1). 5(d) Discuss whether or not an increase in government spending will 8 reduce unemployment. In assessing each answer, use the table below. Level Description Marks 3 A reasoned discussion which accurately examines both 6–8 sides of the economic argument, making use of economic information and clear and logical analysis to evaluate economic issues and situations. One side of the argument may have more depth than the other but, overall, both sides of the argument are considered and developed. There is thoughtful evaluation of economic concepts, terminology, information and/or data appropriate to the question. The discussion may also point out the possible uncertainties of alternative decisions and outcomes. 2 A reasoned discussion which makes use of economic 3–5 information and clear analysis to evaluate economic issues and situations. The answer may lack some depth and development may be one-sided. There is relevant use of economic concepts, terminology, information and data appropriate to the question. 1 There is a simple attempt at using economic definitions 1–2 and terminology. Some reference may be made to economic theory, with occasional understanding. 0 A mark of zero should be awarded for no creditable 0 content. Why it might: • may raise total (aggregate) demand, encouraging firms to hire more workers • may be spent on education which may increase people’s skills • may be spent on healthcare which may make people fitter and more employable • may be spent on subsidies to firms which will encourage them to increase output and take on more workers. Why it might not: • if spent on unemployment benefits, it may encourage some people to leave their jobs • if there is full employment, it will just cause inflation • spending on education may be ineffective e.g. develop the wrong skills • higher total (aggregate) demand may encourage firms to use more capital goods rather than labour.
This question in 0987/21 May/June 2020
Q2 · Calculate Pakistan’s trade in goods balance in 2017 0987/22 May/June 2020
1 (a) Calculate Pakistan’s trade in goods balance in 2017. [1] (b) Identify two possible causes of demand-pull inflation in Pakistan in 2017. [2] (c) Explain the opportunity cost to Pakistan of producing consumer goods. [2] (d) Explain two reasons why education is a merit good. [4] (e) Analyse why the children of poor families tend to receive less education than the children of rich families. [4] (f) Analyse the relationship between GDP per head and imports per head. [5] (g) Discuss whether or not the supply of teachers in Pakistan is likely to increase in the future. [6] (h) Discuss whether or not an increase in its import tariffs would be likely to benefit the Pakistani economy. [6]
30 marks
Mark scheme: Question Answer Marks 1(a) Calculate Pakistan’s trade in goods balance in 2017. 1 –$36.5bn (1). 1(b) Identify two possible causes of demand-pull inflation in Pakistan in 2 2017. Any two from: Higher government spending (1) higher consumer spending / rising population (1) increased investment (1). 1(c) Explain the opportunity cost to Pakistan of producing consumer 2 goods. Logical explanation which might include: Capital goods (1) resources that could have been used to produce capital goods are being used to produce consumer goods / (next) best alternative forgone (1). 1(d) Explain two reasons why education is a merit good. 4 Logical explanation which might include: People underestimate full benefit / private benefit (1) not appreciating health and job opportunity benefits (1). People not taking into account external benefits (1) e.g. better quality products/larger quantity of products or economic growth (1). 1(e) Analyse why the children of poor families tend to receive less 4 education than the children of rich families. Coherent analysis which might include: The children of the poor may not attend school (1) they may have to work (1) to help support their families (1). Poor families are likely to have difficulty paying to have their children educated (1) some schools in Pakistan are in the private sector (1) there seems to be a lack of low-cost schools (1). The children of the poor may leave school at a younger age (1) may miss more school days due to ill health (1). 1(f) Analyse the relationship between GDP per head and imports per head. 5 Coherent analysis which might include: Generally the countries with the highest GDP per head spend the most per head on imports (1) examples e.g. Norway has the highest income per head and the highest spending on imports per head and Haiti has the lowest income and the lowest spending on imports (up to 2) exception: Russia has a higher income per head than Mexico but a lower spending per head on imports (1). Expected relationship as income rises (1) people can afford more imports (1). The four countries with above average GDP per head spend above the global average on imports (1). The two countries with below average GDP per head spend more on imports (1). 1(g) Discuss whether or not the supply of teachers in Pakistan is likely to 6 increase in the future. Generic example mark Tax revenue may decrease… 1 ...because of reason e.g. incomes may be lower. 1 Tax revenue may increase because incomes may be higher i.e. 0 reverse of a previous argument. Tax revenue may increase because of a different reason i.e. not the reverse of a previous argument e.g. government spending on 1 subsidies may stimulate the economy more than spending on education. Award up to 4 marks for logical reasons why it might, which may include: • education standards may rise (1) which may increase those qualified to be teachers (1) • working conditions may improve (1) with better buildings (1) • population is increasing (1) which may increase the size of the labour force (1). Award up to 4 marks for logical reasons why it might not, which may include: • wages may not rise (1) teachers may switch to other jobs (1) • teachers may emigrate to other countries (1) • the qualifications required to be a teacher may increase (1) by more than educational standards rise (1). 1(h) Discuss whether or not an increase in its import tariffs would be likely 6 to benefit the Pakistani economy. Award up to 4 marks for logical reasons why it might, which may include: • may reduce the trade deficit (1) by reducing demand for imports (1) • tax revenue may increase (1) enabling the government to increase its spending (1) • may help protect infant industries (1) until they can take advantage of economies of scale (1). Award up to 4 marks for logical reasons why it might not, which may include: • demand for some finished imports may be price inelastic (1) • demand for capital goods / raw materials may be inelastic (1) • incomes may rise (1), leading to higher spending on imports (1) • other countries may impose trade restrictions (1) reducing Pakistan’s ability to export (1).
This question in 0987/22 May/June 2020
Q3 · The Indian government has declared that the country, now a major car producer, will sell… 0987/22 May/June 2020
2 The Indian government has declared that the country, now a major car producer, will sell only electric cars by 2030. The government wants to reduce external costs, some of which are caused by petrol and diesel cars. Demand for electric cars is currently relatively low and price-elastic. The government, however, thinks that it will not need to subsidise the production of electric cars to achieve its target. (a) Define external costs. [2] (b) Explain two influences on whether demand for a product is price-elastic or price-inelastic. [4] (c) Analyse, using a demand and supply diagram, how a subsidy given to producers could affect the market for electric cars. [6] (d) Discuss whether cars should be produced by the private sector or the public sector. [8]
20 marks
Mark scheme: 2(a) Define external costs. 2 Harmful effects (1) on third parties (1). Social costs – private costs (1). 2(b) Explain two influences on whether demand for a product is price- 4 elastic or price-inelastic. Logical explanation which might include: Availability of substitutes (1) close substitutes will be likely to result in demand being price-elastic (1). Whether the product is a luxury or necessity (1) luxuries tend to have elastic demand/necessities tend to have inelastic demand (1). Proportion of income spent on the production (1) demand tends to be inelastic if a small proportion is spent on it/ elastic if a high proportion is spent on it (1) Whether the purchase can be postponed (1) if so, demand is likely to be elastic, if not inelastic. Addictiveness of the product (1) addictive products are likely to have inelastic demand (1). Time period (1) demand tends to become elastic over time (1). 2(c) Analyse, using a demand and supply diagram, how a subsidy given to 6 producers could affect the market for electric cars. Up to 4 marks for the diagram: Axes correctly labelled – price and quantity or p and q (1). Demand and supply curves correctly labelled (1). Supply curve shifted to the right (1). Equilibriums – shown by lines P1 and P2 / Q1 and Q2 or equilibrium points E1 and E2 (1). Up to 2 marks for coherent analysis which might include: A subsidy encourages firms to produce more/equivalent to a reduction in costs (1). Price will fall/quantity traded will rise (1). 2(d) Discuss whether cars should be produced by the private sector or the 8 public sector. In assessing each answer, use the table below. Level Description Marks 3 A reasoned discussion which accurately examines both 6–8 sides of the economic argument, making use of economic information and clear and logical analysis to evaluate economic issues and situations. One side of the argument may have more depth than the other but, overall, both sides of the argument are considered and developed. There is thoughtful evaluation of economic concepts, terminology, information and/or data appropriate to the question. The discussion may also point out the possible uncertainties of alternative decisions and outcomes. 2 A reasoned discussion which makes use of economic 3–5 information and clear analysis to evaluate economic issues and situations. The answer may lack some depth and development may be one-sided. There is relevant use of economic concepts, terminology, information and data appropriate to the question. 1 There is a simple attempt at using economic definitions 1–2 and terminology. Some reference may be made to economic theory, with occasional understanding. 0 A mark of zero should be awarded for no creditable 0 content. Why cars should be produced by the private sector: • may be a more competitive market and so prices may be lower • profit incentive may raise efficiency and encourage firms to produce what consumers want and keep costs low • may be higher investment which could improve quality and lower costs • may be easier to raise finance as can sell shares • may be forced to be efficient as may not be supported by the government Why cars should be produced by the public sector: • a private sector monopoly may abuse market power and may restrict supply and raise price • public sector firm to charge low prices/prices below cost for cheap cars to help the poor • public sector firms may take into account external costs and benefits/welfare • the state may have more financial resources and be able to invest on a larger scale.
This question in 0987/22 May/June 2020
Q4 · Calculate the percentage of total world output of palm oil produced by Indonesia in 2017 0987/22 Oct/Nov 2020
1 (a) Calculate the percentage of total world output of palm oil produced by Indonesia in 2017. [1] (b) Identify two variable costs of producing palm oil. [2] (c) Explain one opportunity cost of conserving forests in Indonesia. [2] (d) Explain two external costs of the destruction of forests in Indonesia. [4] (e) Draw a demand and supply diagram to show the effect of a ban on burning stubble on the market for rice. [4] (f) Analyse the relationship between countries’ GDP per head ranking and HDI ranking. [5] (g) Discuss whether or not the immigration of workers would be likely to benefit the Indonesian economy. [6] (h) Discuss whether or not the Indonesian tourism industry will increase in the future. [6]
30 marks
Mark scheme: 1(a) Calculate the percentage of total world output of palm oil produced by Indonesia in 2017. 60% (1). 1 Accept 60. 1(b) Identify two variable costs of producing palm oil. • fertilisers • palm oil seeds • casual labour 2 If more than two are given, consider the first two only. Accept ‘labour’, ‘workers’ or ‘wages’ for ‘casual labour’. 1(c) Explain one opportunity cost of conserving forests in Indonesia. Logical explanation which might include: Palm oil not produced / rice not produced / tourism lost as a result of building fewer hotels / lost opportunity to Norwegian government to spend on e.g. education (1) (next) best alternative forgone (1). 2 1(d) Explain two external costs of the destruction of forests in Indonesia. Logical explanation which might include: Loss of wildlife habitats (1) extinction of species / harmful effect on animals not involved in the economic decision (1). Harmful gases/air pollution/pollution (1) unpleasant atmosphere for local residents / illnesses / global warming (1). 4 One mark for each of two costs identified and one mark for each of two explanations. Question Answer Marks Guidance 1(e) Draw a demand and supply diagram to show the effect of a ban on burning stubble on the market for rice. Axes correctly labelled – price and quantity or p and q (1). Demand and supply curves correctly labelled (1). Supply curve shifted to the left (1). Equilibriums – shown by lines P1 and Q1 and P2 and Q2, or by labelling equilibrium points as E1 and E2 (1). 4 For quantity label accept Q, quantity demanded, quantity supplied. Do not reward a completely macro diagram. O S2 P2 Q2 Q1 P1 S1 D1 price of rice quantity of rice Question Answer Marks Guidance 1(f) Analyse the relationship between countries’ GDP per head ranking and HDI ranking. Coherent analysis which might include: Expected relationship: Generally, the higher the GDP per head ranking, the higher the HDI ranking / positive relationship / direct relationship (1). Supporting evidence: The top country, the top two or top three countries with the highest GDP per head ranking have the highest HDI ranking (1) the country, two countries with the lowest GDP per head ranking have the lowest HDI ranking (1). Exception: Cuba or Indonesia (1) supportive data – Cuba has a lower GDP per head ranking than Indonesia but a higher HDI ranking than Indonesia (1). Analysis: It is the expected relationship (1). GDP is a component of HDI / HDI ranking influenced by additional factors – education and/or life expectancy / higher GDP per head enables more to be spent on education and healthcare (1). 5 HDI now includes years of schooling but accept an idea that it includes education - adult literacy rate was included in the old measure. Responses do not have to be in the format suggested but they should address the expected/normal relationship, offer supporting evidence of that, highlight any exceptions to that, and analyse the overall data. Question Answer Marks Guidance 1(g) Discuss whether or not the immigration of workers would be likely to benefit the Indonesian economy. Up to 4 marks why it might: • may be skilled workers (1) who may be more productive (1) • may be motivated to work harder (1) to improve quality of life (1) • bring in new ideas (1) improving production methods / use advanced technology (1) • may pay taxes (1) enabling the government to spend more (1) • fill vacancies left by Indonesians going to work abroad (1) • increase size of labour force (1) increase productive capacity (1) reduce dependency ratio (1) • may increase exports / total (aggregate) demand (1) may result in economic growth / increase output (1). Up to 4 marks why it might not: • population is already increasing (1) immigration may take it above the optimum level / lead to overpopulation / put pressure on resources (1) • pressure may be put on housing / education / food (1) • may put downward pressure on wages (1) may replace Indonesian workers / cause unemployment (1) lowering living standards (1) • may need training (1) increasing firms’ costs (1) • may increase pollution (1) • may send money home to relatives (1) may have to import more e.g. rice (1) negative impact on the current account of the balance of payments (1). 6 For an answer that examines the effects of migration of workers from Indonesia, a maximum of 2 marks. Apply this example to all questions with the command word DISCUSS (1(g), 1(h), 2(d), 3(d), 4(d) and 5(d)). Each point may be credited only once, on either side of an argument, but separate development as to how/why the outcome may differ is rewarded. Generic example mark Tax revenue may decrease … 1 ... because of reason e.g. incomes may be lower. 1 Tax revenue may increase because incomes may be higher i.e. reverse of a previous argument. 0 Tax revenue may increase because of a different reason i.e. not the reverse of a previous argument e.g. government spending on subsidies may stimulate the economy more than spending on education. 1 Question Answer Marks Guidance 1(h) Discuss whether or not the Indonesian tourism industry will increase in the future. Up to 4 marks for why it might: • it is currently price competitive (1) • if the exchange rate continues to fall (1), price of tourism for foreign visitors will fall (1) • it has natural tourist attractions (1) may preserve forests (1) • global economy is growing (1), incomes are rising (1) enabling foreigners to afford more holidays (1) • people coming from abroad to work in high paid jobs may be skilled / highly motivated (1) raise quality of tourism (1). • Indonesian government may subsidise the tourism industry (1) lowering costs of production (1). • the industry may be promoted /advertised (1) • air travel is falling in price (1) air travel is a complement to holidays (1) • foreign investment may be attracted into the industry (1) Up to 4 marks for why it might not: • pollution may discourage visitors (1) worried about health (1) • there are substitutes (1) Indonesia has competition from neighbouring countries (1) • natural areas of beauty may be destroyed (1) by e.g. new palm oil plantations / natural disasters (1) • net emigration (1) may mean there are not enough workers (1). • Covid-19 may continue to reduce tourism (1). 6
This question in 0987/22 Oct/Nov 2020
Q5 · The population of Hungary is the most obese in Europe 0987/22 Oct/Nov 2020
3 The population of Hungary is the most obese in Europe. Hungarians eat fewer vegetables than most Europeans and more food types that may be considered to be demerit goods. In 2017, the Hungarian government introduced a tax on unhealthy food, known as the chips tax. The tax has had some success in moving demand to healthier foods. Some economists suggest that governments should use price controls as well as taxes to influence the food market. (a) Define demerit good. [2] (b) Explain the difference between an extension in demand and an increase in demand. [4] (c) Analyse the effects on income distribution and tax revenue of an increase in indirect taxes. [6] (d) Discuss whether or not a government should impose a maximum price on food. [8]
20 marks
Mark scheme: 3(a) Define demerit good. A product which is more harmful to consumers than they realise / the government considers is more harmful (2). It is over-consumed / overproduced (1) it creates external costs (1). A product that is harmful (1). 3(b) Explain the difference between an extension in demand and an increase in demand. Logical explanation which might include: An extension in demand is caused by a change in the price of the product (1) rise in quantity demanded (1) it is shown by a movement along the demand curve (1). An increase in demand is caused by a change in an influence on demand other than a change in the price of the product / means more is demanded at each and every price (1) example of a cause of an increase in demand e.g. rise in incomes (1) it is shown by a shift in the demand curve (1). 4 Up to 2 marks for diagram(s) showing the difference. Maximum of 2 marks for extension in demand and a maximum of 2 marks for an increase in demand. Question Answer Marks Guidance 3(c) Analyse the effects on income distribution and tax revenue of an increase in indirect taxes. Coherent analysis which might include: Income is likely to become less evenly distributed (1) indirect taxes are usually regressive (1) taking a larger percentage of income of the poor (1). Tax revenue likely to rise (1) will rise more on goods with inelastic demand (1) e.g. food (1) may fall if demand falls significantly (1). If any extra tax revenue is spent on lower income groups (1) e.g. welfare benefits (1) the effect on income distribution is less certain / income may be more evenly distributed (1). Tax evasion and avoidance is less common in the case of indirect taxes (1) though there may be informal markets (1). 6 Question Answer Marks Guidance 3(d) Discuss whether or not a government should impose a maximum price on food. In assessing each answer, use the table opposite. Why it should: • may influence price and quantity purchased • if set below the equilibrium level, will reduce price • some people will be able to purchase food at a lower price • may reduce poverty – food is a basic necessity • may stop monopoly food producers setting high prices. Why it should not: • if set above the equilibrium, it will have no effect • it set below the equilibrium, will result in shortages • some additional measure will have to be introduced to ration out food • some foods may be harmful to health and their consumption should be discouraged • may result in firms making losses and so reducing quality of food or employment of workers • free market forces may result in a more efficient allocation of resources. 8 Level Descriptors Mark 3 A reasoned discussion which accurately examines both sides of the economic argument, making use of economic information and clear and logical analysis to evaluate economic issues and situations. One side of the argument may have more depth than the other, but overall both sides of the argument are considered and developed. There is thoughtful evaluation of economic concepts, terminology, information and/or data appropriate to the question. The discussion may also point out the possible uncertainties of alternative decisions and outcomes. 6–8 2 A reasoned discussion which makes use of economic information and clear analysis to evaluate economic issues and situations. The answer may lack some depth and development or may be one-sided. There is relevant use of economic concepts, terminology, information and data appropriate to the question. 3–5 1 There is a simple attempt at using economic definitions and terminology. Some reference may be made to economic theory, with occasional understanding. 1–2 0 A mark of zero should be awarded for no creditable content. 0 Question Answer Marks Guidance 3(d) Example of L2 answer: Government should impose a maximum price on foods. Price is likely to fall and this will aid those in poverty. They will be able to buy basic necessities easier and allow them to spend on other things. Governments should not impose a maximum price on food as it can cause businesses to make a loss and need government subsidisation. Principal Examiner comment: Reasonable on one side and limited on the other side. The effect on price, quantity demanded and quantity supplied may be shown on a diagram.
This question in 0987/22 Oct/Nov 2020
Q6 · There is an area of rubbish, three times the size of France, floating in the Pacific… 0987/21 May/June 2021
2 There is an area of rubbish, three times the size of France, floating in the Pacific Ocean called the Great Pacific Garbage Patch. It is made up of rubbish including old fishing nets but most is plastic waste. It is forecast that, by 2050, there will be more plastic in the Pacific Ocean than fish. A number of islands in the Pacific Ocean specialise in fishing. Greater pollution will increase the social cost of the fishing industry. (a) Identify the two types of costs that make up social cost. [2] (b) Explain two causes of a shift to the right in the demand curve for fish. [4] (c) Analyse how cleaning up pollution could benefit an economy. [6] (d) Discuss whether or not countries specialising benefits consumers. [8]
20 marks
Mark scheme: 2(a) Identify the two types of costs that make up social cost. Private costs (1) External costs (1). 2 2(b) Explain two causes of a shift to the right in the demand curve for fish. Logical explanation which might include: • Rise in the price of a substitute for fish (1) people will switch away from buying e.g. chicken to buying fish (1). • Fall in the price of a complement for fish (1) people will buy more of the complement (1). • A rise in income (1) people will be able to afford to buy more fish (1). • A report stating eating fish is good for health / changes in tastes (1) people may buy more fish to try to increase their life expectancy (1). • Increase in population size (1) more people to buy fish (1). • A successful advertising campaign (1) may persuade more people to buy fish (1). 4 One mark each for each of two causes identified and one mark each for each of two explanations. Question Answer Marks Guidance 2(c) Analyse how cleaning up pollution could benefit an economy. Coherent analysis which might include: • Will reduce external costs (1) improve health / less sickness (1) raise quality of life / standard of living (1). • Less (government) spending on healthcare (1) more can be spent on other priorities e.g., education (1). • Cleaning up pollution may create jobs / employment (1) reduce unemployment (1) may attract MNCs (1) increase in incomes (1) reduction in poverty (1). • Recycling of some of the material collected (1) could increase the country’s output (1) less use of non- renewable resources (1). • Better working conditions (1) productivity of labour could increase (1) reduce costs of production (1) increase output (1) reduce unemployment (1) reduce inflation (1). • Improve the environment (1) Increase tourism (1) increase exports of services (1) improve the current account position (1). • Reduction in ocean pollution (1) will improve fish stock (1) improve quality of fish (1) greater catches of fish (1) leading to rise in incomes / revenue / GDP (1). 6 Question Answer Marks Guidance 2(d) Discuss whether or not countries specialising benefits consumers. In assessing each answer, use the table opposite. Why it might: • countries may specialise in what they are best at producing • output may rise • greater availability • costs of production may fall • prices may fall • quality may rise • better paid jobs increasing purchasing power of consumers Why it might not: • a country may gain a monopoly of production, raising price and lowering quality • choice may be reduced / greater reliance on imports • other countries’ producers may have lower health and safety standards • supply problems may affect a particular country, cutting off supplies • trade disputes may cut off supplies 8 Reward but do not expect reference to absolute and comparative advantage. Level Description Marks 3 A reasoned discussion which accurately examines both sides of the economic argument, making use of economic information and clear and logical analysis to evaluate economic issues and situations. One side of the argument may have more depth than the other, but overall both sides of the argument are considered and developed. There is thoughtful evaluation of economic concepts, terminology, information and/or data appropriate to the question. The discussion may also point out the possible uncertainties of alternative decisions and outcomes. 6–8 2 A reasoned discussion which makes use of economic information and clear analysis to evaluate economic issues and situations. The answer may lack some depth and development may be one- sided. There is relevant use of economic concepts, terminology, information and data appropriate to the question. 3–5 Question Answer Marks Guidance 2(d) Level Description Marks 1 There is a simple attempt at using economic definitions and terminology. Some reference may be made to economic theory, with occasional understanding. 1–2 0 A mark of zero should be awarded for no creditable content. 0
This question in 0987/21 May/June 2021
Q7 · In 2019, France produced inside its production possibility curve (PPC) 0987/22 May/June 2022
3 In 2019, France produced inside its production possibility curve (PPC). France exports a wide range of its products. It is the world’s top exporter of luxury perfume and the 7th largest exporter of soap. Changes in technology affect the products people produce and buy. The French government plans to upgrade its infrastructure for all households to have internet access. (a) Define a production possibility curve. [2] (b) Explain why demand for soap is more price-inelastic than demand for a luxury brand of perfume. [4] (c) Analyse, using a demand and supply diagram, how an increase in income will affect the market for a luxury brand of perfume. [6] (d) Discuss whether or not the public sector should be responsible for the supply of all internet services. [8]
20 marks
Mark scheme: 3(a) Define a production possibility curve. A diagram showing maximum output / possible combinations (1) of two types of products / of capital and consumer goods (1) with given resources / given technology / in a given time period (1) shows opportunity cost (1). 2 Nothing for a diagram, 3(b) Explain why demand for soap is more price-inelastic than demand for a luxury brand of perfume. Logical explanation which might include: Soap is more essential / necessary than a luxury brand of perfume (2) OR soap is a necessity (1) luxury brand of perfume does not have to be purchased / not essential / a want (1). Soap has fewer substitutes than a luxury brand of perfume (2) OR soap does not have close substitutes (1) whereas a luxury brand of perfume may have close substitutes (1). Soap is likely to take up a smaller proportion of income than a luxury brand of soap (2) OR soap is likely to take only a small proportion of income (1) whereas a luxury brand of perfume is likely to take up a large proportion (1). It is harder to delay the purchase of soap than the purchase of a luxury brand of perfume OR the purchase of soap cannot be delayed (1) while the purchase of a luxury brand of perfume can be (1). 4 Question Answer Marks Guidance 3(c) Analyse, using a demand and supply diagram, how an increase in income will affect the market for a luxury brand of perfume. Coherent analysis which might include: Up to 4 marks for the diagram: D and S diagram: Axes correctly labelled – price and quantity or p and q (1). Original demand and supply curves correctly labelled (1). New demand curve shifted to the right (1). Equilibriums – shown by lines or equilibrium points (1). Up to 2 marks for written analysis which might include: Luxury perfume will be more affordable / greater purchasing power / luxury perfume will take a smaller proportion of income / more will be demanded at the same price (1) price will rise / quantity traded will increase (1). 6 Written analysis An increase in income will cause an increase in demand for luxury perfume is not sufficient for a mark. Reward but do not expect reference to a luxury brand of perfume being a normal good. Question Answer Marks Guidance 3(d) Discuss whether or not the public sector should be responsible for the supply of all internet services. In assessing each answer, use the table opposite. Why it might: government may charge a low price enable poor to gain access to the internet, help children with education government may base decisions on social costs and benefits government can control what is on the internet may be more able to take advantage of economies of scale avoidance of wasteful duplication government may take a longer-term view on investing. Why it might not: opportunity cost – could have spent the money on e.g. healthcare private sector may invest more private sector may be more efficient / have lower costs of production profit incentive may encourage private sector to raise quality private sector may make decisions quicker. 8 Level Description Marks 3 A reasoned discussion which accurately examines both sides of the economic argument, making use of economic information and clear and logical analysis to evaluate economic issues and situations. One side of the argument may have more depth than the other, but overall, both sides of the argument are considered and developed. There is thoughtful evaluation of economic concepts, terminology, information and/or data appropriate to the question. The discussion may also point out the possible uncertainties of alternative decisions and outcomes. 68 Question Answer Marks Guidance 3(d) 2 A reasoned discussion which makes use of economic information and clear analysis to evaluate economic issues and situations. The answer may lack some depth and development may be one-sided. There is relevant use of economic concepts, terminology, information and data appropriate to the question. 35 1 There is a simple attempt at using economic definitions and terminology. Some reference may be made to economic theory, with occasional understanding. 12 0 A mark of zero should be awarded for no creditable content. 0
This question in 0987/22 May/June 2022
Q8 · Nicaragua experienced a 4% decrease in GDP in 2019, although household spending rose 0987/22 May/June 2022
5 Nicaragua experienced a 4% decrease in GDP in 2019, although household spending rose. One Nicaraguan product that increased in supply was bananas, which are a merit good. The Nicaraguan government encouraged its banana farmers and its other producers to increase their output. Increases in output can affect a firm’s average costs of production. (a) Define supply. [2] (b) Explain two ways a government could increase the consumption of merit goods. [4] (c) Analyse how the level and pattern of household spending may change when GDP decreases. [6] (d) Discuss whether or not a firm will benefit from an increase in its output. [8]
20 marks
Mark scheme: 5(a) Define supply. Willingness to sell a product (1) and ability to sell a product (1). Supply at a given price / in a given time period (1). 2 Allow one mark in total for amount produced or amount sold. Need idea of selling / making available to consumers for full two marks. 5(b) Explain two ways a government could increase the consumption of merit goods. Logical explanation which might include: Provide information/education (1) about the benefits of merit goods / consumers may be unaware of full benefits (1). Provide merit goods free / direct provision (1) e.g. education and healthcare / nationalise industries producing merit goods (1). Subsidise the production of merit goods (1) to lower prices (1). Subsidise the consumption of merit goods (1) by e.g. providing vouchers (1). Set a maximum price / price ceiling (1) to make merit goods more affordable / to lower price (1), Pass laws / introduce regulation (1) to make consumption of merit goods compulsory (1). Remove / cut indirect taxes on merit goods (1) to make them more affordable / to lower price (1). 4 One mark for each of two ways identified and one mark for each explanation. Can accept lower price as a development of a subsidy for a mark and lower price as another mark if given as a development of indirect taxes or maximum price. Question Answer Marks Guidance 5(c) Analyse how the level and pattern of household spending may change when GDP decreases. Coherent analysis which might include: Spending may decrease (1) as households may have less income (1) less able to buy goods and services / lower purchasing power (1). Lower GDP may reduce confidence / create greater uncertainty (1) encouraging people to save more (1). May borrow less (1) may be concerned cannot repay (1). May expect prices to fall further (1) delay purchases (1). Spending may not decrease if households think the decrease is temporary (1) may borrow (1) as interest rates may be lower (1) may use past saving to finance spending (1). May spend a higher proportion on basic necessities (1) less on luxuries/wants (1). May spend a higher proportion of income (1) as saving may fall by more than spending (1). Households may spend less on imports (1) imports may be higher in price / lower in quality (1). GDP may decrease but GDP per head may rise (1) if population falls by more than GDP (1). 6 Reward but do not expect: reference to inferior and normal goods. dissaving. Nominal GDP may fall but real GDP may rise if there is deflation Question Answer Marks Guidance 5(d) Discuss whether or not a firm will benefit from an increase in its output. In assessing each answer, use the table opposite. Why it might: may increase average revenue, if higher output is result of higher demand profits may rise if average revenue raises more than average cost may be able to make greater use of spare capacity higher output may increase a firm’s market power greater advantage may be taken of technical, marketing managerial, labour and risk bearing economies of scale. Why it might not: average revenue may fall, higher output may reduce price not all of the higher output may be sold / may be a lack of demand diseconomies of scale may be experienced managerial / communication problems may occur / labour relations may decline growth achieved by vertical merger may lead to problems of co-ordination. 8 Level Description Marks 3 A reasoned discussion which accurately examines both sides of the economic argument, making use of economic information and clear and logical analysis to evaluate economic issues and situations. One side of the argument may have more depth than the other, but overall, both sides of the argument are considered and developed. There is thoughtful evaluation of economic concepts, terminology, information and/or data appropriate to the question. The discussion may also point out the possible uncertainties of alternative decisions and outcomes. 68 Question Answer Marks Guidance 5(d) 2 A reasoned discussion which makes use of economic information and clear analysis to evaluate economic issues and situations. The answer may lack some depth and development may be one-sided. There is relevant use of economic concepts, terminology, information and data appropriate to the question. 35 1 There is a simple attempt at using economic definitions and terminology. Some reference may be made to economic theory, with occasional understanding. 12 0 A mark of zero should be awarded for no creditable content. 0
This question in 0987/22 May/June 2022
Q9 · Advances in technology have changed how trees (wood) are cut down, transported and used… 0987/22 Oct/Nov 2022
4 Advances in technology have changed how trees (wood) are cut down, transported and used in the manufacture of furniture, such as tables. Wood is in inelastic supply. Wood can be supplied in all economic systems. However, public goods are not supplied in a market economic system. (a) Define inelastic supply. [2] (b) Explain why public goods would not be supplied in a market economic system. [4] (c) Analyse, using a demand and supply diagram, the effect on the market for furniture of an increase in the price of wood. [6] (d) Discuss whether or not advances in technology will benefit a country’s population. [8]
20 marks
Mark scheme: 4(a) Define inelastic supply. 2 Allow one mark for PES = 0. Quantity supplied / supply changes by a smaller percentage change than price (2). Supply changing by less than price / PES less than 1 / PES < 1 / supply unresponsive to change in price (1). 4(b) Explain why public goods would not be supplied in a 4 No marks for examples. market economic system. Logical explanation which might include: Public goods are non-excludable (1) it is not possible to stop people who are not prepared to pay for them, from consuming them (1) free rider problem (1). Public goods are non-rival (1) if supplied for one, supplied for everyone and so cannot charge additional consumers (1). Private sector firms are profit motivated (1) they will not produce products if they cannot get revenue from them (1) would make a loss (1). 4(c) Analyse, using a demand and supply diagram, the 6 effect on the market for furniture of an increase in the price of wood. Coherent analysis which might include: Up to 4 marks for the diagram: D&S diagram: Axes correctly labelled – price and quantity or p and q (1). Original demand and supply curves correctly labelled (1). New supply curve shifted to the left (1). Equilibriums – shown by lines P1 and Q1 and P2 and Q2 or equilibrium points E1 and E2 (1). Up to 2 marks for coherent analysis which might include: Would increase costs of production (1) raise price / reduce Accept increase in price or fall in quantity on their own but quantity (traded) (1). not an increase in price of wood or fall in quantity of wood. 4(d) Discuss whether or not advances in technology will 8 Level Description Marks benefit a country’s population. 3 A reasoned discussion which 6–8 In assessing each answer, use the table opposite. accurately examines both sides of the economic argument, making use of Why it might: economic information and clear and • may reduce costs of production logical analysis to evaluate economic • may increase significance of technical economies of issues and situations. One side of the argument may have more depth than scale the other, but overall both sided of the • may lower prices argument are considered and • may make the country’s firms more internationally developed. There is thoughtful competitive evaluation of economic concepts, • may promote globalisation terminology, information and/or data • may encourage firms to expand and take on more appropriate to the question. The workers discussion may also point out the • economic growth may increase incomes possible uncertainties of alternative • may increase quality – less subject to human error decisions and outcomes. • may create new products • may improve working conditions 2 A reasoned discussion which makes 3–5 • may extend education through online learning. use of economic information and clear analysis to evaluate economic issues and situations. The answer may lack Why it might not: some depth and development may be • may increase unemployment one-sided. There is relevant use of • may make products more standardised / not produced economic concepts, terminology, to individual needs information and data appropriate to • may increase stress the question. • may be over dependence on technology which can fail • may increase fraud 1 There is a simple attempt at using 1–2 • may cause negative externalities e.g. fracking. economic definitions and terminology. Some reference may be made to economic theory, with occasional understanding. 0 A mark of zero should be awarded for 0 no creditable content.
This question in 0987/22 Oct/Nov 2022
Q10 · Many people from the Philippines work in another country, often in industries that… 0987/21 May/June 2023
4 Many people from the Philippines work in another country, often in industries that provide merit goods and public goods. In 2020, the Philippine government raised more tax revenue. Some was spent on policy measures to increase life expectancy and some on policy measures to reduce unemployment. The country’s unemployment rate was also affected by a rise in the country’s foreign exchange rate. (a) Identify two influences on which country a person decides to work in. [2] (b) Explain, with examples, the difference between a merit good and a public good. [4] (c) Analyse how an increase in government spending could increase life expectancy. [6] (d) Discuss whether or not a rise in a country’s foreign exchange rate would benefit its economy. [8]
20 marks
Mark scheme: 4(a) Identify two influences on which country a person decides to work in. Two from: wages / GDP per head working conditions job opportunities / job security qualifications required family ties language spoken immigration restrictions personal safety/ freedom from persecution living standards / cost of living better welfare / healthcare / education provision 2 If more than two influences are given, consider the first three. 4(b) Explain, with examples, the difference between a merit good and a public good. Logical explanation which might include: A merit good e.g. education / fruit (1) is beneficial / is under- consumed / people unaware of benefits / so underproduced without government intervention / government encourage consumption (1). A public good e.g. defence / streetlighting / police / sea defences / roads (1) would not be produced by the private sector / needs to be financed by the government/ non-rival/ non-excludable (1). 4 One mark each for each of two differences identified and one mark each for each of two examples Question Answer Marks Guidance 4(c) Analyse how an increase in government spending could increase life expectancy. Coherent analysis which might include increased government spending on: Healthcare (1) could raise quality / accessibility of healthcare (1). Education (1) may result in people leading healthier lives (1) more exercise (1) better nutrition (1). Benefits (1) may increase access to basic necessities / reduce poverty (1). Green energy (1) may reduce pollution (1). Infrastructure (1) could reduce traffic accidents (1) reduce traffic congestion (1) reduce stress (1). Police (1) reduces deaths through crime (1). Increased government spending (in total) (1) may increase employment / raise income / raise standards of living (1). 6 MAX of three marks for just identifying areas of government spending MAX of three marks for analysis of any single area of spending. One item analysed well MAX 4 marks. Question Answer Marks Guidance 4(d) Discuss whether or not a rise in a country’s foreign exchange rate would benefit its economy. In assessing each answer, use the table opposite. Why it might: reduce price of imports this could lower inflation as raw material costs may fall and more competitive pressure for firms to keep price rises low enables a country to buy more imports for any given quantity of exports could reduce a current account surplus which may enable more products to be consumed. Why it might not: increase the price of exports this could reduce exports and export revenue economic growth could fall unemployment could rise could increase a current account deficit. 8 Level Description Marks 3 A reasoned discussion which accurately examines both sides of the economic argument, making use of economic information and clear and logical analysis to evaluate economic issues and situations. One side of the argument may have more depth than the other, but overall, both sides of the argument are considered and developed. There is thoughtful evaluation of economic concepts, terminology, information and/or data appropriate to the question. The discussion may also point out the possible uncertainties of alternative decisions and outcomes. 6–8 2 A reasoned discussion which makes use of economic information and clear analysis to evaluate economic issues and situations. The answer may lack some depth and development may be one-sided. There is relevant use of economic concepts, terminology, information and data appropriate to the question. 3–5 1 There is a simple attempt at using economic definitions and terminology. Some reference may be made to economic theory, with occasional understanding. 1–2 0 A mark of zero should be awarded for no creditable content. 0
This question in 0987/21 May/June 2023
Q11 · Healthcare is in the tertiary sector 0987/21 May/June 2024
4 Healthcare is in the tertiary sector. Healthcare provides both private and external benefits. In 2019, there were five mergers between large US healthcare firms. As well as operating in the US, US healthcare firms operate in a number of host countries, including Singapore. (a) Define tertiary sector using an example apart from healthcare. [2] (b) Explain the difference between a private benefit and an external benefit of healthcare. [4] (c) Analyse why a government may prevent a horizontal merger. [6] (d) Discuss whether or not a foreign multinational company (MNC) will continue to produce in a host country for many years. [8]
20 marks
Mark scheme: 4(a) Define tertiary sector using an example apart from healthcare. The sector covering the provision of services (1). Example e.g. banking / car showroom / coffee shop / education (1). 4(b) Explain the difference between a private benefit and an external benefit of healthcare. Logical explanation which might include: A private benefit is enjoyed by the person consuming the product (1) e.g. a person may enjoy better health / longer life expectancy (1). OR A provider of healthcare e.g. hospital (1) and revenue / profits made (1). An external benefit is a benefit enjoyed by a third party / someone not directly involved in the consumption or production of the product (1) e.g. less risk of catching a virus when other people are vaccinated / higher output (1). 4 Question Answer Mark Guidance 4(c) Analyse why a government may prevent a horizontal merger. Coherent analysis which might include: A horizontal merger is a merger between two firms in the same industry and same stage of production (1). A government may prevent a merger if it thinks it will give the new firm monopoly power (1) and result in market failure (1). Less competition may result in higher prices (1) lower quality (1) there may be a substantial loss of jobs (1) through rationalisation (1). A government may be concerned that the new firm may be too large (1) may experience diseconomies of scale (1) example (1) may become less internationally competitive (1) lower exports (1). A government may want to avoid a reduction the number of suppliers (1) resulting in less choice for consumers / less innovation (1). 6 Note: need both same industry and same stage of production to get the mark for horizontal merger. Question Answer Mark Guidance 4(d) Discuss whether or not a foreign multinational company (MNC) will continue to produce in a host country for many years. In assessing each answer, use the table opposite. Why it might: may earn a high revenue / profit due to high demand may experience low costs due to low wages / low raw material costs in the country may have access to high quality labour due to good education and training in the country may be subsidised by the host country’s government. Why it might not: natural resources it was extracting may run out tax in the host country may increase a rise in the host country’s foreign exchange rate may increase the price of its exports there may be industrial action undertaken by trade unions in the host country more profitable opportunities may occur in other countries may be changes in regulations. 8 See Guidance table at the end of the mark scheme.
This question in 0987/21 May/June 2024
Q12 · In 2021, there were extensions and contractions in demand for a number of South African… 0987/22 Oct/Nov 2024
4 In 2021, there were extensions and contractions in demand for a number of South African products. In that year, a South African court stopped a multinational company (MNC) exploring for oil along South Africa’s coastline. South Africa experienced an increase in output, driven largely by the growth in its tertiary sector. However, its unemployment rate was 35%, a long way from full employment. (a) Define an extension in demand. [2] (b) Explain two external costs that may be caused by exploring for oil. [4] (c) Analyse how growth in a country’s tertiary sector can increase its living standards. [6] (d) Discuss whether or not workers who lose their jobs are likely to stay unemployed for a long time. [8]
20 marks
Mark scheme: 4(a) Define an extension in demand. 2 May be shown by a movement down a demand curve caused by a fall in price. A movement along a demand curve (1) higher demand (1) caused by a fall (1) in price (1). Not accepting: an increase in demand but accepting: an increase in quantity demanded. 4(b) Explain two external costs that may be caused by 4 One mark each for each of two costs identified and one exploring for oil. mark for each of two explanations. Logical explanation which might include: Reduce tourism may be given as an identification or as an explanation of e.g. ‘Damage to the natural environment’ Air pollution / pollution (1) those living nearby may experience a reduction in air quality / contribute to climate change/global warming / reduced health (1). Noise pollution (1) disturbing sleep (1). Water pollution / oil spillage (1) damage health (1). Damage to the natural environment / land / deforestation (1) destroy wildlife habitats / cause global warming / climate change (1). Reduce tourism (1) lower employment (1). Congestion (1) increasing transport costs (1). 4(c) Analyse how growth in a country’s tertiary sector can 6 increase its living standards. Coherent analysis which might include: May have high productivity (1) increase output (1) increase employment / reduce unemployment (1). May pay higher wages (1) allowing workers to consume more goods and services / afford education / afford healthcare / reduce poverty / buy more necessities / buy some luxuries/wants (1). May provide good working conditions (1) less tiring / less physically demanding (1) resulting in good health of workers (1) few accidents (1). May involve expansion of education (1) increasing future employment / workers’ skills (1) earning prospects (1) increase quality of output (1) increase HDI value (1). More transport services (1) could reduce prices / lower congestion / reduce stress (1). Growth of entertainment industry (1) improve leisure time (1). May involve expansion of healthcare (1) increase life expectancy / better health (1). May increase tax revenue (1) enabling the government to spend more on e.g. education (1). Less pollution (1) less environmental damage / less climate change / less global warming (1). 4(d) Discuss whether or not workers who lose their jobs are 8 Reward but do not expect reference to hysteresis. likely to stay unemployed for a long time. Level Description Marks In assessing each answer, use the table opposite. 3 A reasoned discussion which 6–8 Why they might: accurately examines both sides of the • may lose skills / unskilled workers may have greater economic argument, making use of difficulty than skilled workers in finding another job economic information and clear and • may become out of date with advances in technology / logical analysis to evaluate economic working practices issues and situations. One side of the • may be expensive for firms to employ as may need argument may have more depth than extra training the other, but overall both sides of the • may lose confidence argument are considered and • may become less attractive to employers developed. There is thoughtful • more likely to stay unemployed if a result of evaluation of economic concepts, cyclical/structural rather than frictional unemployment terminology, information and/or data • may be high unemployment benefits. appropriate to the question. The discussion may also point out the Why they might not: possible uncertainties of alternative • may receive government training decisions and outcomes. • may be geographically/occupationally mobile • gap between wages and state benefits may encourage 2 A reasoned discussion which makes 3–5 the unemployed to seek work use of economic information and clear • economy may grow, expanding employment analysis to evaluate economic issues and situations. The answer may lack opportunities some depth and development may be • may leave the labour force, e.g. retire / emigrate one-sided. There is relevant use of • may be seasonally unemployed. economic concepts, terminology, information and data appropriate to the question. 4(d) Level Description Marks 1 There is a simple attempt at using 1–2 economic definitions and terminology. Some reference may be made to economic theory, with occasional understanding. 0 A mark of zero should be awarded for 0 no creditable content.
This question in 0987/22 Oct/Nov 2024
Q13 · Calculate the value of Gabon’s oil production as a percentage of Gabon’s GDP 0987/21 May/June 2025
1 (a) Calculate the value of Gabon’s oil production as a percentage of Gabon’s GDP. [1] (b) Identify two external benefits of rainforests. [2] (c) Explain what effect an increase in tourism may have on Gabon’s current account of the balance of payments. [2] (d) Explain two reasons why the Gabonese Government wants to reduce reliance on oil. [4] (e) Draw a demand and supply diagram to show the effect of the discovery of new gold deposits on the market for gold. [4] (f) Analyse the relationship between the literacy rate and the percentage of the labour force employed in agriculture. [5] (g) Discuss whether or not a government should pay private sector firms to give work experience to unemployed young people. [6] (h) Discuss whether or not a growth in the size of firms in Gabon’s textile industry will reduce their average cost of production. [6]
30 marks
Mark scheme: Question Answer Marks Guidance 1(a) Calculate the value of Gabon’s oil production as a 1 Accept 30 without %. percentage of Gabon’s GDP. 30% 1(b) Identify two external benefits of rainforests. 2 If more than two benefits given, consider the first three. Two from: • reduce air pollution / pollution / improves air quality (1) • protect against floods (1) • prevent soil erosion (1). 1(c) Explain what effect an increase in tourism may have on 2 No marks for simply saying current account of the balance of Gabon’s current account of the balance of payments. payments increases. • Increase in exports (1) • increase trade in services (invisible) surplus / reduces deficit (1) • Improves the current account balance surplus / reduces deficit (1). 1(d) Explain two reasons why the Gabonese Government 4 One mark each for each of two reasons identified and one wants to reduce reliance on oil. mark each for each of two explanations. Logical explanation which might include: Only these two reasons are acceptable. • Running out of oil / create a shortage (1) revenue from the industry will decline / employment in the industry will decline / GDP will decline /cause recession / conserve for future generations / may need to import oil / price for oil may rise (1). • Oil industry creates water pollution / pollution (1) an external cost / harms health / reduces standard of living / protect the environment / attract tourists (1). 1(e) Draw a demand and supply diagram to show the effect 4 of the discovery of new gold deposits on the market for gold. Coherent analysis which might include: D&S diagram: Axes correctly labelled – price and quantity or p and q (1). Original demand and supply curves correctly labelled (1). New supply curve shifted to the right (1). Equilibriums – shown by lines P1 and Q1 and P2 and Q2 or equilibrium points marked as E1 and E2 (1). 1(f) Analyse the relationship between the literacy rate and 5 Responses do not have to be in the format suggested but the percentage of the labour force employed in they should address the expected/normal relationship, offer agriculture. supporting evidence of that, highlight any exceptions to that, and analyse the overall data. Coherent analysis which might include: Supporting evidence should involve interpretation, not just Expected relationship: description. Simply stating percentages without analysis of • Generally, an inverse / negative relationship (1) the being high or low gets no marks. higher the literacy rate, the smaller the % of the labour force employed in agriculture (1). Accept as analysis where two countries with different levels of adult literacy and percentage employed in agriculture are Supporting evidence: directly compared. • South Africa had the highest literacy rate and the lowest % of the labour force employed in agriculture (1). • Zambia / Sierra Leone / Mali had the lowest literacy rates and the highest %s of labour force employed in agriculture (1). Analysis of expected relationship: • A high literacy rate may increase the chance of workers gaining jobs in high paid tertiary jobs (1) a low literacy rate may mean workers have to undertake unskilled jobs in agriculture / a high proportion of workers employed in agriculture may mean that high literacy rate is not required (1). Exception: • Gabon (1) Gabon has a high literacy rate but also a high % of the labour force employed in agriculture (1). Analysis of exception: • Some jobs in agriculture are skilled / secondary and tertiary sectors may be small (1). 1(g) Discuss whether or not a government should pay 6 Apply this example to all questions with the command private sector firms to give work experience to word DISCUSS unemployed young people. (1(g), 1(h), 2(d), 3(d), 4(d) and 5(d)) Award up to 4 marks for logical reasons why it should, Each point may be credited only once, on either side of an which may include: argument, but separate development as to how/why the outcome may differ is rewarded. • can enable young workers to develop their skills / raise their productivity (1) increase their confidence / Generic example mark motivation to get a job / get higher paid jobs (1) young people may make mistakes and cost firm money while Tax revenue may decrease 1 being trained (1) • can increase the chances of young people gaining a job because of reason e.g. incomes may be lower. 1 (1) reduce unemployment (1) reduce the cost of unemployment benefits (1) reduce future training costs Tax revenue may increase because incomes 0 (1) increase tax revenue (1) leads to economic growth may be higher i.e. reverse of a previous (1). argument. Award up to 4 marks for logical reasons why it should Tax revenue may increase because of a 1 not, which may include: different reason i.e. not the reverse of a previous argument e.g. government spending • the quality of the work experience may not be good (1) on subsidies may stimulate the economy more the young may be given unskilled jobs (1) poor working than spending on education. conditions / not regulated (1) • opportunity cost [implied] (1) government spending could be used to e.g. improve state education (1) government incurs additional expenditure / raises taxes to pay for it (1) the young may have been employed by the private sector without payment by the government (1) • it may reduce the efficiency of private firms (1) reduce their output (1) firms may be corrupt (1). 1(h) Discuss whether or not a growth in the size of firms in 6 Maximum of 2 marks for just listing different types of Gabon’s textile industry will reduce their average cost economies and diseconomies of scale or just stating of production. economies of scale and diseconomies of scale may be experienced without references to examples. Award up to 4 marks for logical reasons why it might, which may include: Essentially full marks can be gained for identification and explanation of two economies of scale and one diseconomy • labour economies (1) workers can specialise / increase of scale OR one economy of scale and two diseconomies of labour productivity (1) scale. • managerial economies (1) employ specialists (1) • technical economies (1) using advanced capital Note there is no marks awarded for simply stating that equipment (1) average costs may or rise or for drawing a diagram showing • buying / purchasing economies (1) receiving a discount average costs changing as a firm grows in size. as buying in bulk (1) • selling economies (1) reducing transport costs (1) • marketing economies (1) spreads fixed costs over more output (1) • financial economies (1) easier / cheaper to borrow (1) • research and development economies (1) introduce new products / new production methods (1) • risk bearing economies (1) able to suffer fall in demand for one product or supply problems connected to one product (1) • may experience external economies of scale (1) example (1). Award up to 4 marks for logical reasons why it might not, which may include: • difficulty of controlling a large firm (1) may be slower to make decisions (1) 1(h) • communication problems (1) may be more difficult to 6 keep everyone informed (1) • poor industrial relations (1) may be less contact between managers and workers / decreasing productivity (1).
This question in 0987/21 May/June 2025
Question 14 0987/22 May/June 2025
1 (a) Calculate St. Kitts and Nevis’s government budget deficit in 2022. [1] (b) Identify two examples of the factor of production ‘land’ in St. Kitts and Nevis. [2] (c) Explain how tourism causes external costs in St. Kitts and Nevis. [2] (d) Explain two reasons why a foreign bank may open a branch in St. Kitts and Nevis. [4] (e) Draw a demand and supply diagram to show the effect of an increase in the productivity of onion farmers on the market for onions. [4] (f) Analyse the relationship between healthcare spending as a percentage of GDP and life expectancy. [5] (g) Discuss whether or not an increase in the size of its fishing industry would benefit St. Kitts and Nevis. [6] (h) Discuss whether or not deflation is likely to have harmed St. Kitts and Nevis. [6]
30 marks
Mark scheme: Question Answer Mark Guidance 1(a) Calculate St. Kitts and Nevis’s Government budget 1 Accept 18m. deficit in 2022. ($)18 000 000 / – ($)18 000 000. $18 m / – $18 m (1). 1(b) Identify two examples of the factor of production land in 2 If more than two examples given, consider the first three. St. Kitts and Nevis. Two from: beaches (1), (coral) reefs (1), marine life / fish (1) rainforests (1) and soil (1). 1(c) Explain how tourism causes external costs in St. Kitts 2 One mark for explanation of external costs. and Nevis. One mark for example based on tourism. • Social costs are greater than private costs / social costs include private costs and external costs / harmful effects on third parties / those not directly involved in producing or consuming the product (1). • Example of an external cost caused by tourism in St Kitts and Nevis e.g. pollution / environmental damage / death of wildlife / death of marine life / overcrowding (1). 1(d) Explain two reasons why a foreign bank may open a 4 One mark each for each of two reasons identified and one branch in St. Kitts and Nevis. mark each for each of two explanations. Logical explanation which might include: If more than two reasons given, consider the first three. • High incomes in the country (1) high demand for Most of the explanation points e.g. high profit could be banking services / high demand for loans / may save linked to any of the three identification points except high more / borrowers likely to be able to repay loans / high disposable income should be linked to absence of personal profit / high revenue (1). income tax. • Absence (low) of personal income tax (1) workers would be able to keep all of their income / more disposable Do not give two explanation marks for one identification. income / firms may be able to pay lower wages / increase workers’ motivation (1). Explanation marks here are dependent on the • Relatively high literacy rates (1) awareness of benefits identifications. of having a bank account / saving / skilled workers / high productivity (1). 1(e) Draw a demand and supply diagram to show the effect 4 of an increase in the productivity of onion farmers on the market for onions. D&S diagram: Axes correctly labelled – price and quantity or p and q (1). Original demand and supply curves correctly labelled (1). New supply curve shifted to the right (1). Equilibriums – shown by lines P1 and Q1 and P2 and Q2 or equilibrium points marked as E1 and E2 (1). 1(f) Analyse the relationship between healthcare spending 5 Responses do not have to be in the format suggested but as a percentage of GDP and life expectancy. they should address the expected/normal relationship, offer supporting evidence of that, highlight any exceptions to that, Expected relationship: and analyse the overall data. Direct / positive relationship (1). Generally, the higher healthcare spending, the higher the life expectancy (1). Supporting evidence should involve interpretation, not just description. Supporting evidence: E.g.: Haiti has the second lowest % healthcare spending and the shortest life expectancy (1) Canada spends a higher % on healthcare than Egypt and has a longer life expectancy / Canada spends the highest percentage on health care and has the second highest longest life expectancy / Canada and Sweden spend a high % on healthcare and have long life expectancy (1). Analysis of the supporting information: Higher spending on healthcare would be expected to raise the health of the population / provide better quality healthcare (1) increase awareness of need for healthy living / provide more check-ups / preventative medical care / reduce the death rate (1). Exception: Monaco (1) spends the lowest % on healthcare but has the longest life expectancy (1). Analysis of exception: 1.9% of a very high GDP can mean higher spending than e.g. 12.9% of a lower GDP / Monaco may have a high GDP (1). There are other influences on life expectancy e.g. nutrition / education/housing/war (1). 1(g) Discuss whether or not an increase in the size of its 6 Award one mark in total for higher / lower average costs, fishing industry would benefit St. Kitts and Nevis. one mark for lower / higher fish prices, one mark for higher / lower profits (1). Award up to 4 marks for logical reasons why it might, which may include: Higher / lower profits should be linked to the fishing industry. • may reduce imports of fish (1) reduce risk of supply-side shocks / imports being cut off (1) enable fish to be Apply this example to all questions with the command exported (1) may improve the current account word DISCUSS balance / improve the balance of payments (1) (1(g), 1(h), 2(d), 3(d), 4(d) and 5(d)) • may increase employment / increase job opportunities / reduce unemployment (1) raise incomes Each point may be credited only once, on either side of an (1) increase living standards (1) increase argument, but separate development as to how/why the GDP / increase output / cause economic growth (1) outcome may differ is rewarded. higher tax revenue (1) • may enable greater advantage to be taken of Generic example Mark economies of scale (1) example (1) lower average cost (1) lower fish prices (1) Tax revenue may decrease … 1 • (larger boats) may be more efficient / more productive (1) make the industry more profitable / increase profits ... because of reason e.g. incomes may be 1 from fishing (1). lower. Tax revenue may increase because incomes 0 may be higher i.e. reverse of a previous argument. Tax revenue may increase because of a different 1 reason i.e. not the reverse of a previous argument e.g. government spending on subsidies may stimulate the economy more than spending on education. 1(g) Award up to 4 marks for logical reasons why it might not, which may include: • opportunity cost (1) could use resources in other industries / government can spend more on e.g. education / increase budget deficit (1) • over-fishing (1) deplete fish stocks / lose marine life / deplete resources (1) raise fish prices in the long run (1) • may experience diseconomies of scale (1) example (1) higher average cost (1) reduce profit (1) • may cause external costs / environmental harm (1) may damage coral reefs / cause pollution (1) harm tourism (1) • may be a dangerous occupation (1) may be low-paid (1) low-skilled (1) may experience seasonal unemployment (1) • risk of over specialisation / too great a dependency on the industry (1) may be harmed by a fall in demand for fish / rise in competition from other countries (1). 1(h) Discuss whether or not deflation is likely to have 6 Award one mark for malign (bad) deflation is harmful harmed St. Kitts and Nevis. whereas benign (good) deflation is beneficial. Award up to 4 marks for logical reasons why it might, which Mark for higher employment and mark for higher GDP can may include: only be awarded if come from higher total supply. • may have increased real value of debt (1) may default (1) may have decreased investment (1) ‘save more’ may be credited on either side but only once. • may have resulted in a deflationary spiral (1) may have resulted from lower total demand (1) lower GDP / lower output / reduce economic growth / may cause a recession (1) lower employment / increased unemployment (1) lowered wages / income (1) • may reduce confidence (1) may discourage MNCs (1) • may reduce consumer expenditure / save more / create uncertainty (1) delay buying goods and services (until price is lower) (1). Award up to 4 marks for logical reasons why it might not, which may include: • may have increased purchasing power / real income / with the same income more goods and services can be purchased (1) (some) people may spend / consume more (1) • value of saving may have increased (1) increasing wealth (1) • may be the result of higher total supply (1) due to advances in technology / lower costs of production (1) higher output / economic growth (1) higher employment (1) • may have increased international competitiveness of its products / lower export prices (1) increased exports / export revenue (1) reduced imports / import expenditure (1) improve current account balance (1).
This question in 0987/22 May/June 2025
Q15 · In 2022, Paraguay’s production possibility curve (PPC) shifted to the right 0987/22 May/June 2025
3 In 2022, Paraguay’s production possibility curve (PPC) shifted to the right. Paraguay has a mixed economic system. Its government provides merit goods and public goods. The country’s private sector is a major producer of shampoo. The firms in the shampoo industry make use of division of labour. There are several firms in the industry, but the number is declining. There is a possibility that soon there may be just one firm in the industry. (a) Identify what is measured on the axes of a production possibility curve. [2] (b) Explain, with an example of each, the difference between a merit good and a public good. [4] (c) Analyse how division of labour can benefit firms. [6] (d) Discuss whether or not consumers would benefit from only one firm producing shampoo. [8]
20 marks
Mark scheme: 3(a) Identify what is measured on the axes of a production 2 Two types of products may be shown on the axes on a PPC possibility curve. diagram for two marks. (Output of) two types of product (2). If more than two items are given, consider the first three. Output (1) one type of product (1) another type of product (1). 3(b) Explain, with an example of each, the difference 4 One mark for an explanation of a merit good and one mark between a merit good and a public good. for an example of a merit good. One mark for an explanation of a public good and one mark Logical explanation which might include: for an example of a public good. A merit good is under-consumed / underproduced / Accept but do not expect reference to non-rejectable / zero consumers do not appreciate its full value / has external cost of producing an extra unit for a public good. benefits / can be produced by the private sector / can be produced by the private sector and the public sector / is a Allow public park. private good / is rival and excludable (1) e.g. education / healthcare / fruit (1). No mark for roads unless qualified by e.g. uncrowded roads A public good would not be produced by the private sector / with many entry and exit points. is (usually) supplied / produced by the government / funded by the government (1) non-excludable / non-rival (1) e.g. street lighting / defence / flood control (1). 3(c) Analyse how division of labour can benefit firms. 6 Coherent analysis which might include: • Workers can specialise (1) in what they are best at producing (1) save time / speed up production (1) reduce waste (1) reduce mistakes (1) increase productivity /skill / efficiency (1) increase output / supply (1) lower (average) cost (1). • Increase quality (1) lower prices (1) raise demand / increase sales (1) increase revenue (1) increase profits (1). • Make it easier to mechanise production (1) reduce labour required (1). • Reduce training / training costs (1) as reduce tasks undertaken / division of labour involves breaking production down into different tasks (1). 3(d) Discuss whether or not consumers would benefit from 8 Level Description Marks only one firm producing shampoo. 3 A reasoned discussion which accurately 6–8 In assessing each answer, use the table opposite. examines both sides of the economic argument, making use of economic Why they might: information and clear and logical • one firm may be able to benefit from economies of scale analysis to evaluate economic issues • lower average cost may lead to lower prices and situations. One side of the argument • firm may spend a large amount on research and may have more depth than the other, but development due to high profits and security overall both sides of the argument are • quality of product may be high considered and developed. There is • less time / less effort choosing shampoo. thoughtful evaluation of economic concepts, terminology, information Why they might not: and/or data appropriate to the question. • lack of competition may drive up prices The discussion may also point out the • lack of choice possible uncertainties of alternative • if quality is poor, cannot switch to substitutes decisions and outcomes. • firm may experience diseconomies of scale. 2 A reasoned discussion which makes use 3–5 of economic information and clear analysis to evaluate economic issues and situations. The answer may lack some depth and development may be one-sided. There is relevant use of economic concepts, terminology, information and data appropriate to the question. 3(d) Level Description Marks 1 There is a simple attempt at using 1–2 economic definitions and terminology. Some reference may be made to economic theory, with occasional understanding. 0 A mark of zero should be awarded for no 0 creditable content.
This question in 0987/22 May/June 2025
![Question 2: (a) Calculate Pakistan’s trade in goods balance in 2017. [1] (b) Identify two possible causes of demand-pull inflation in Pakistan in 2017.…](https://img.pastlit.com/crops/9e729439-a502-4a20-ab10-b68bff6b3496/q1.webp)
 1 / 5
1 / 5![Question 4: (a) Calculate the percentage of total world output of palm oil produced by Indonesia in 2017. [1] (b) Identify two variable costs of produc…](https://img.pastlit.com/crops/847013c1-db27-4afd-ab9f-ca88aa9bd41c/q1.webp)
 2 / 5
2 / 5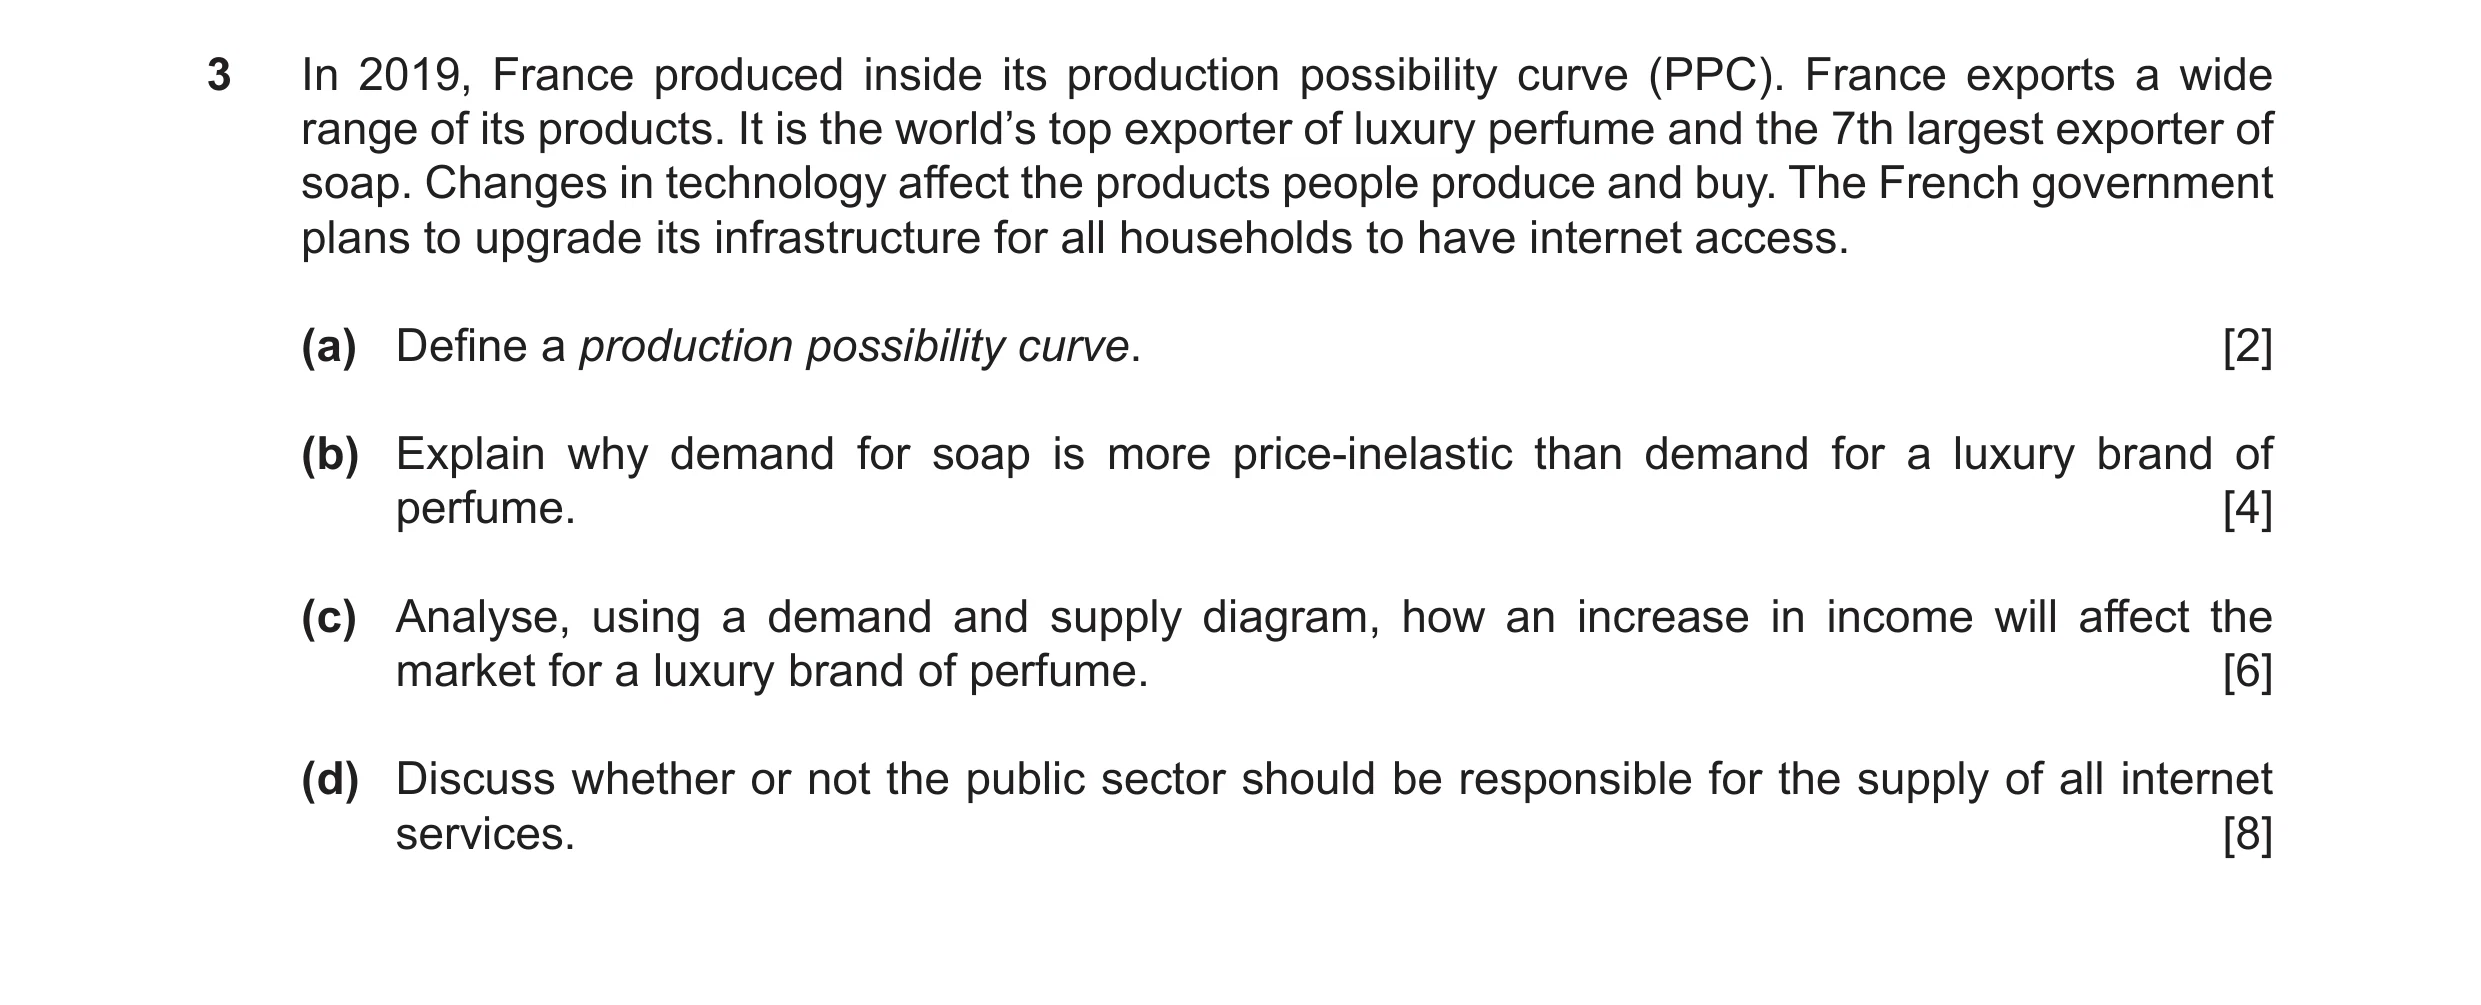
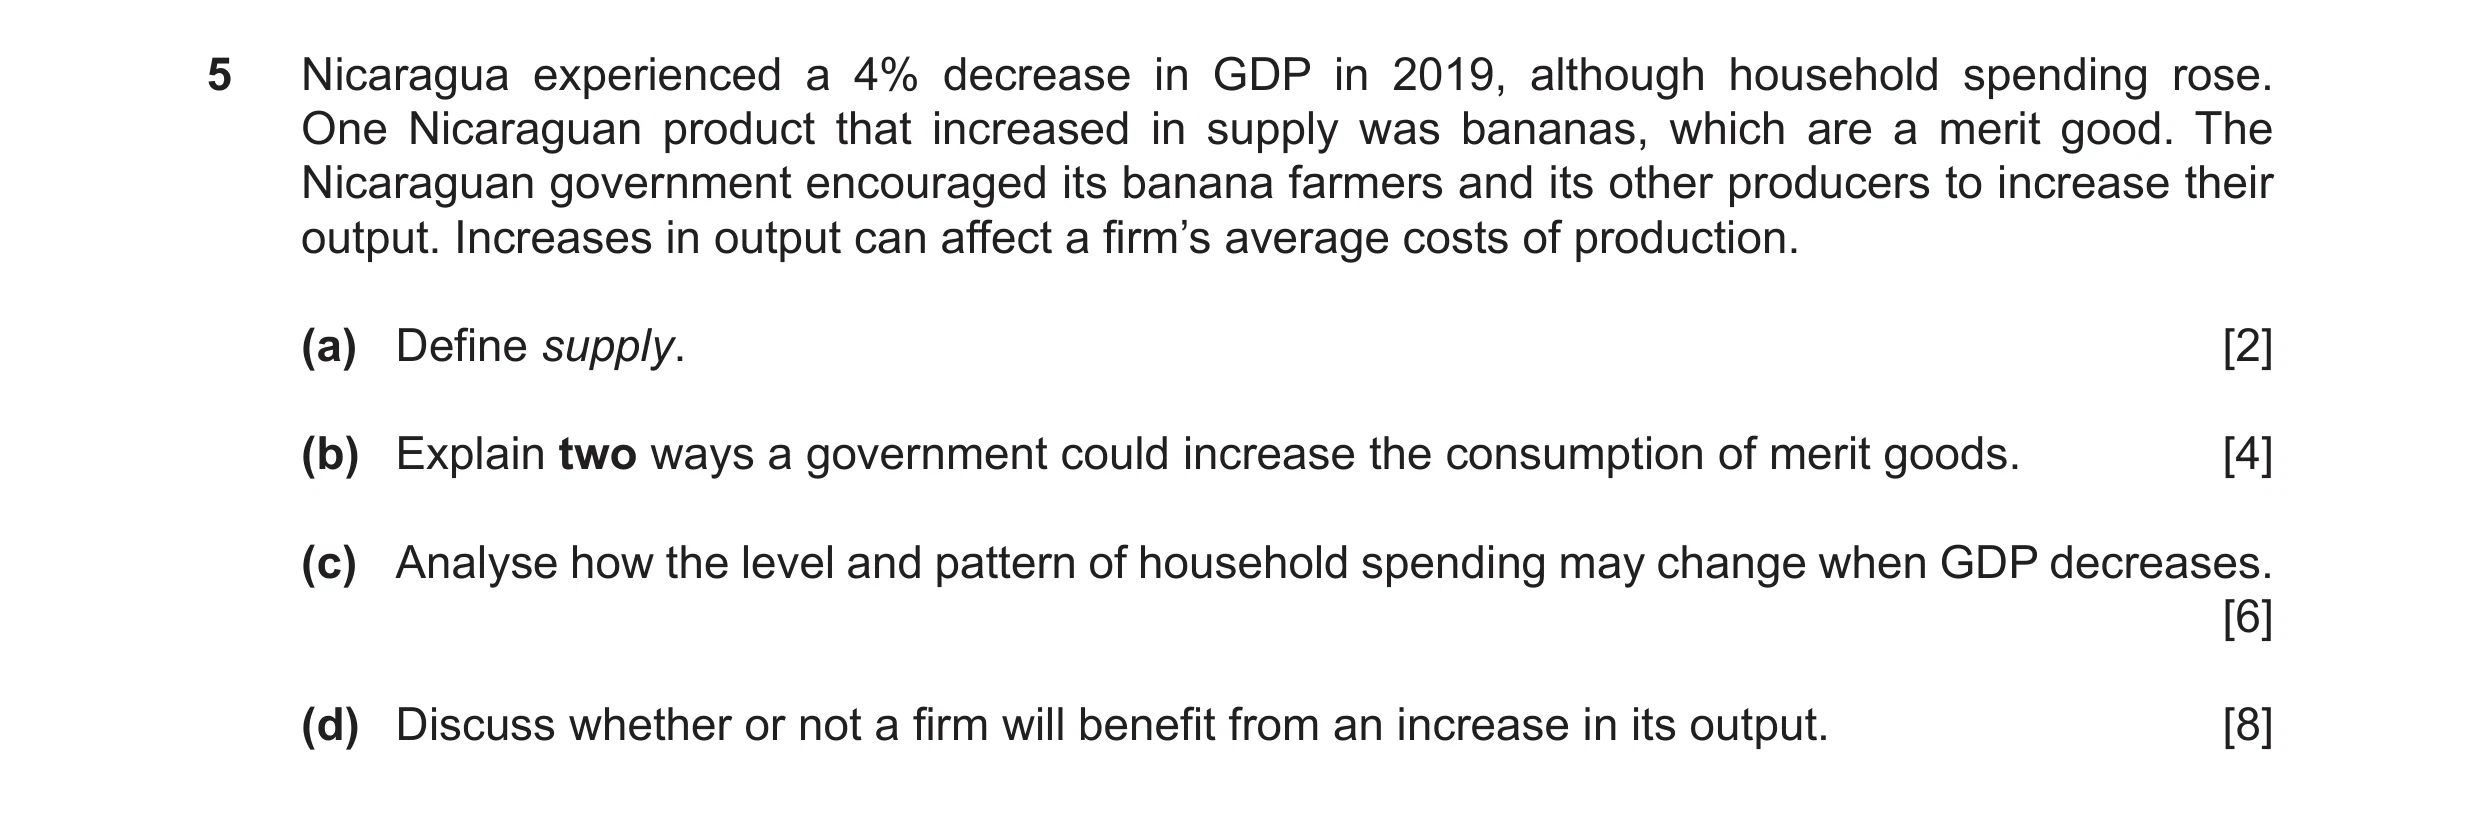
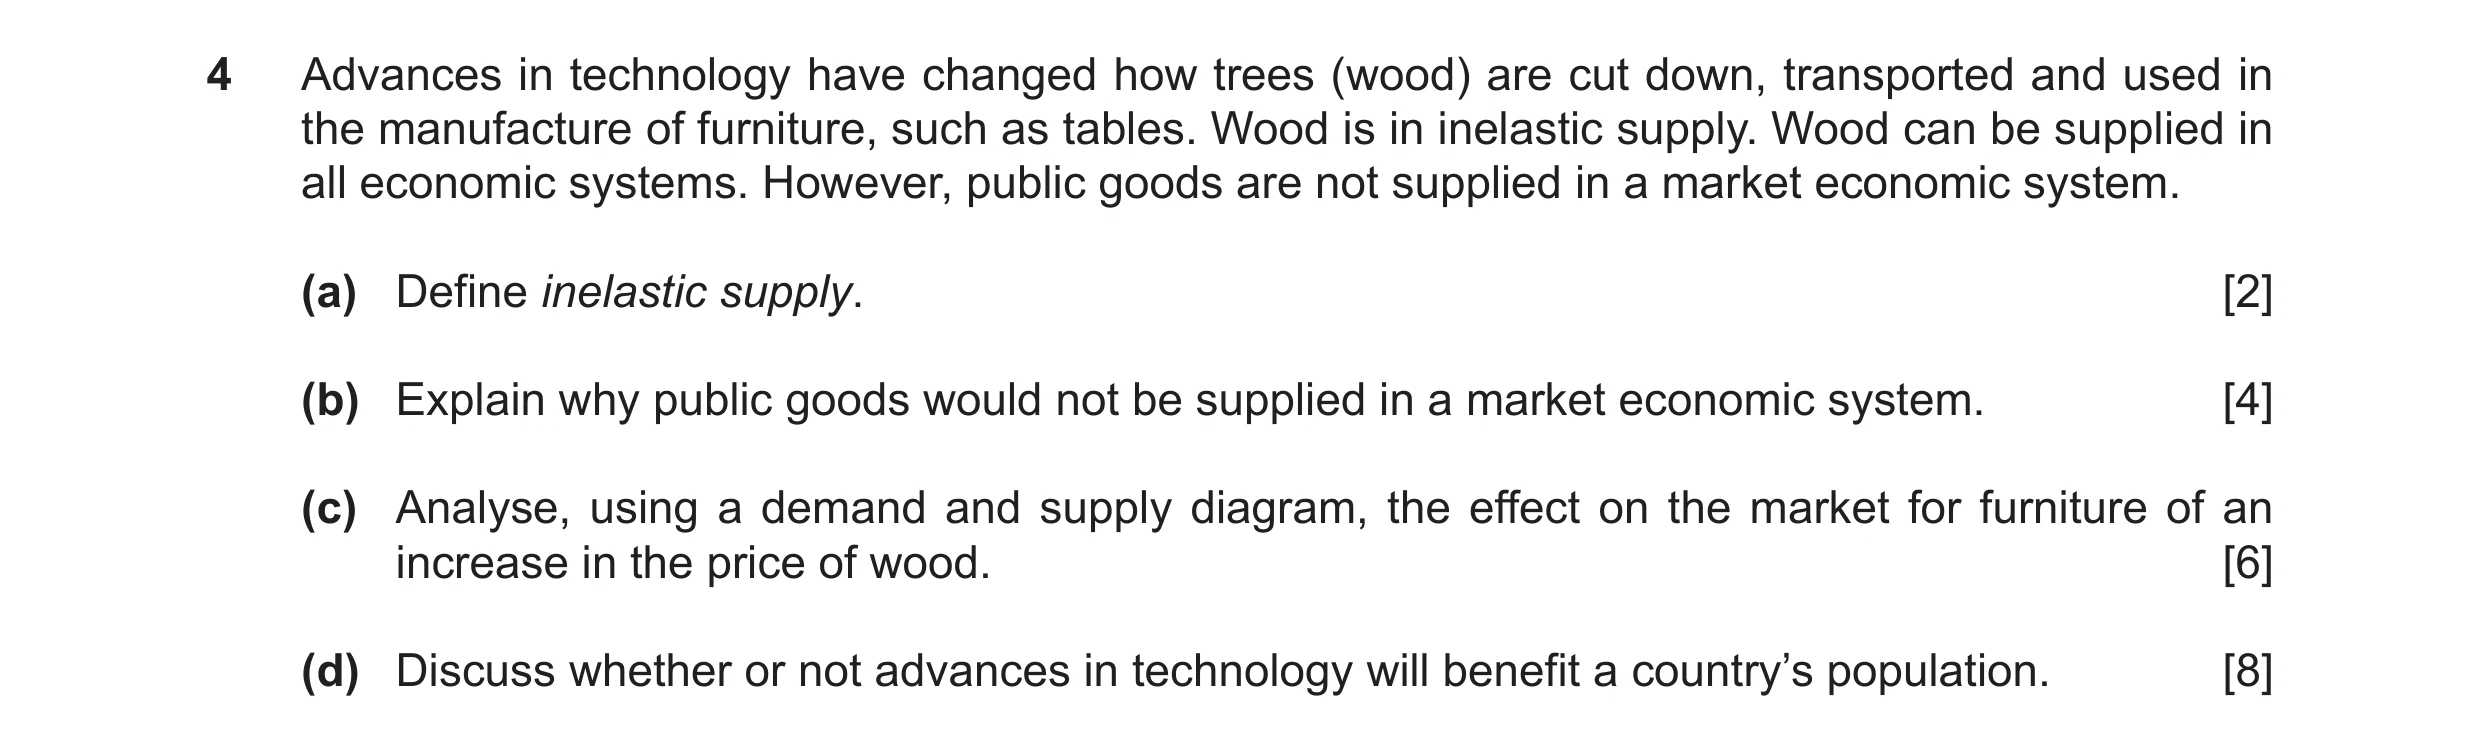 3 / 5
3 / 5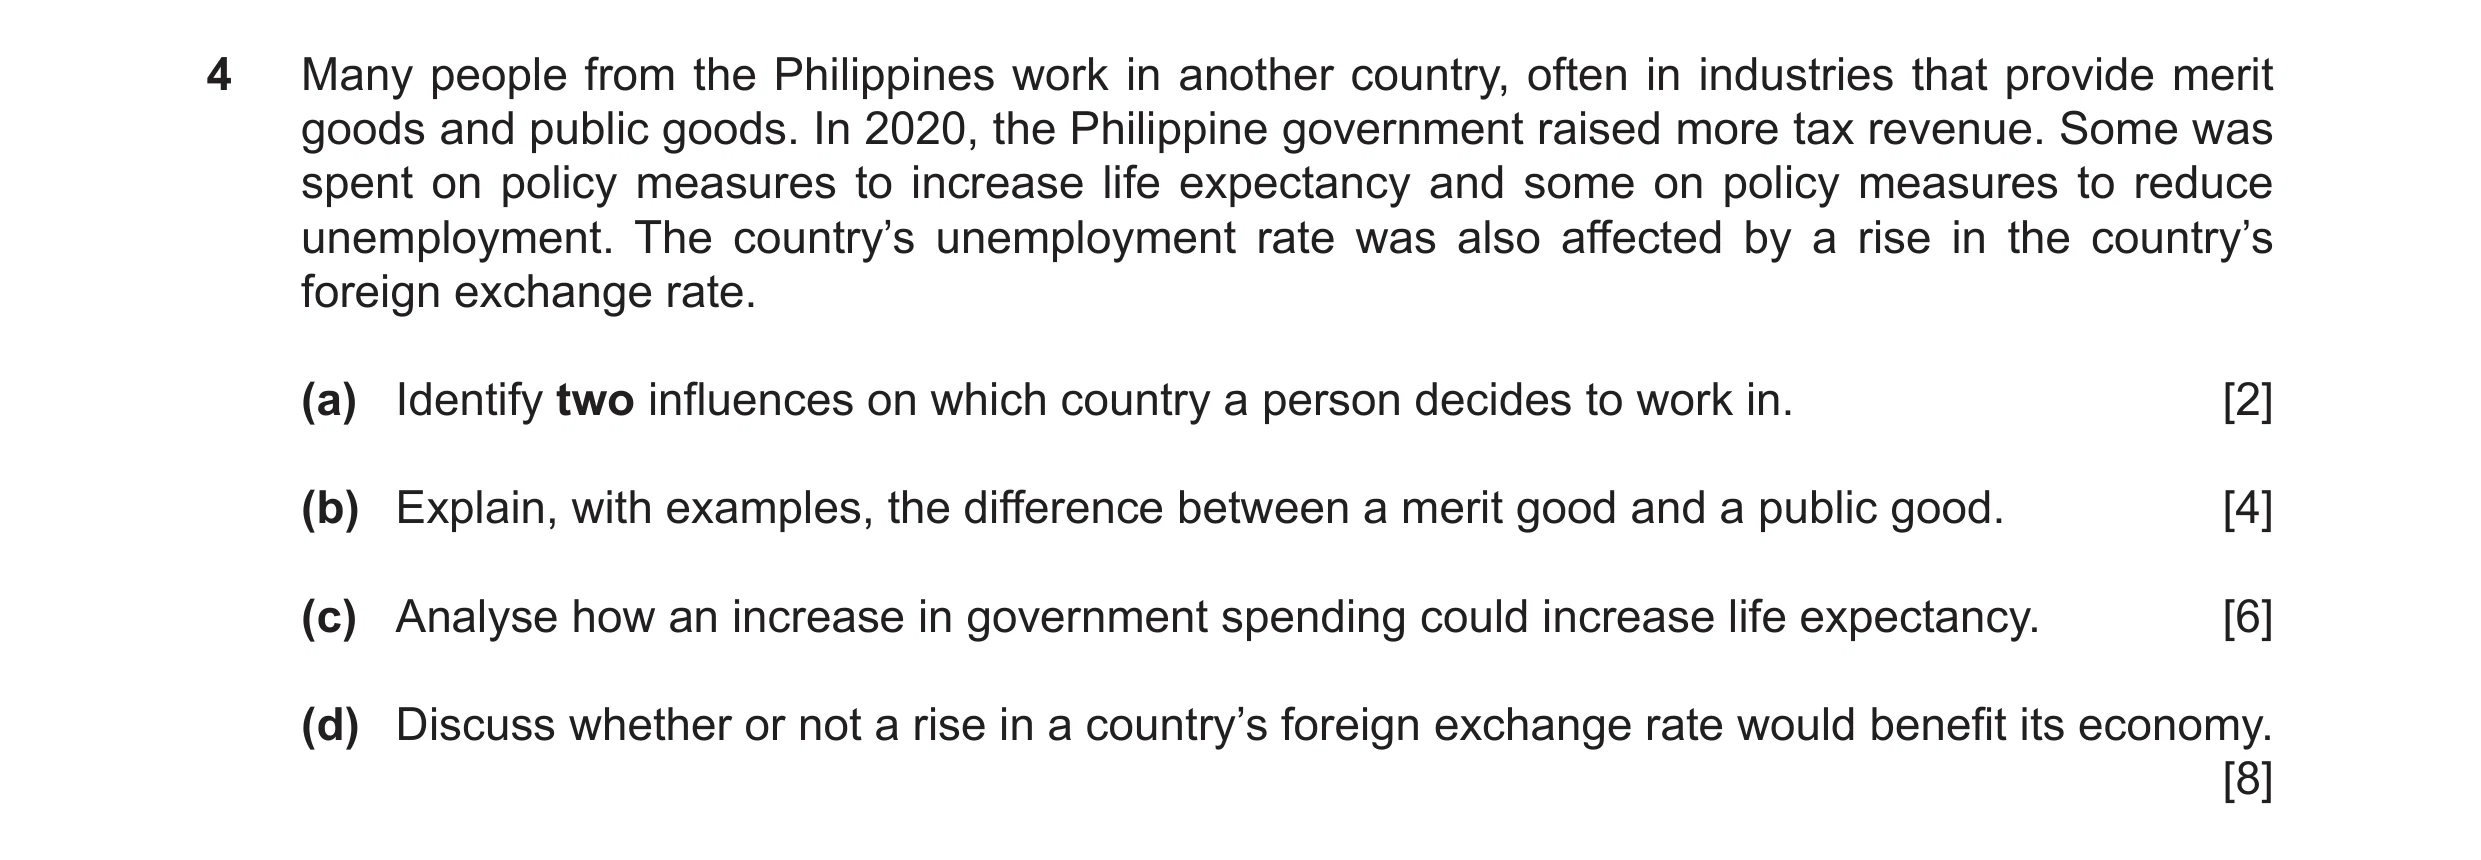
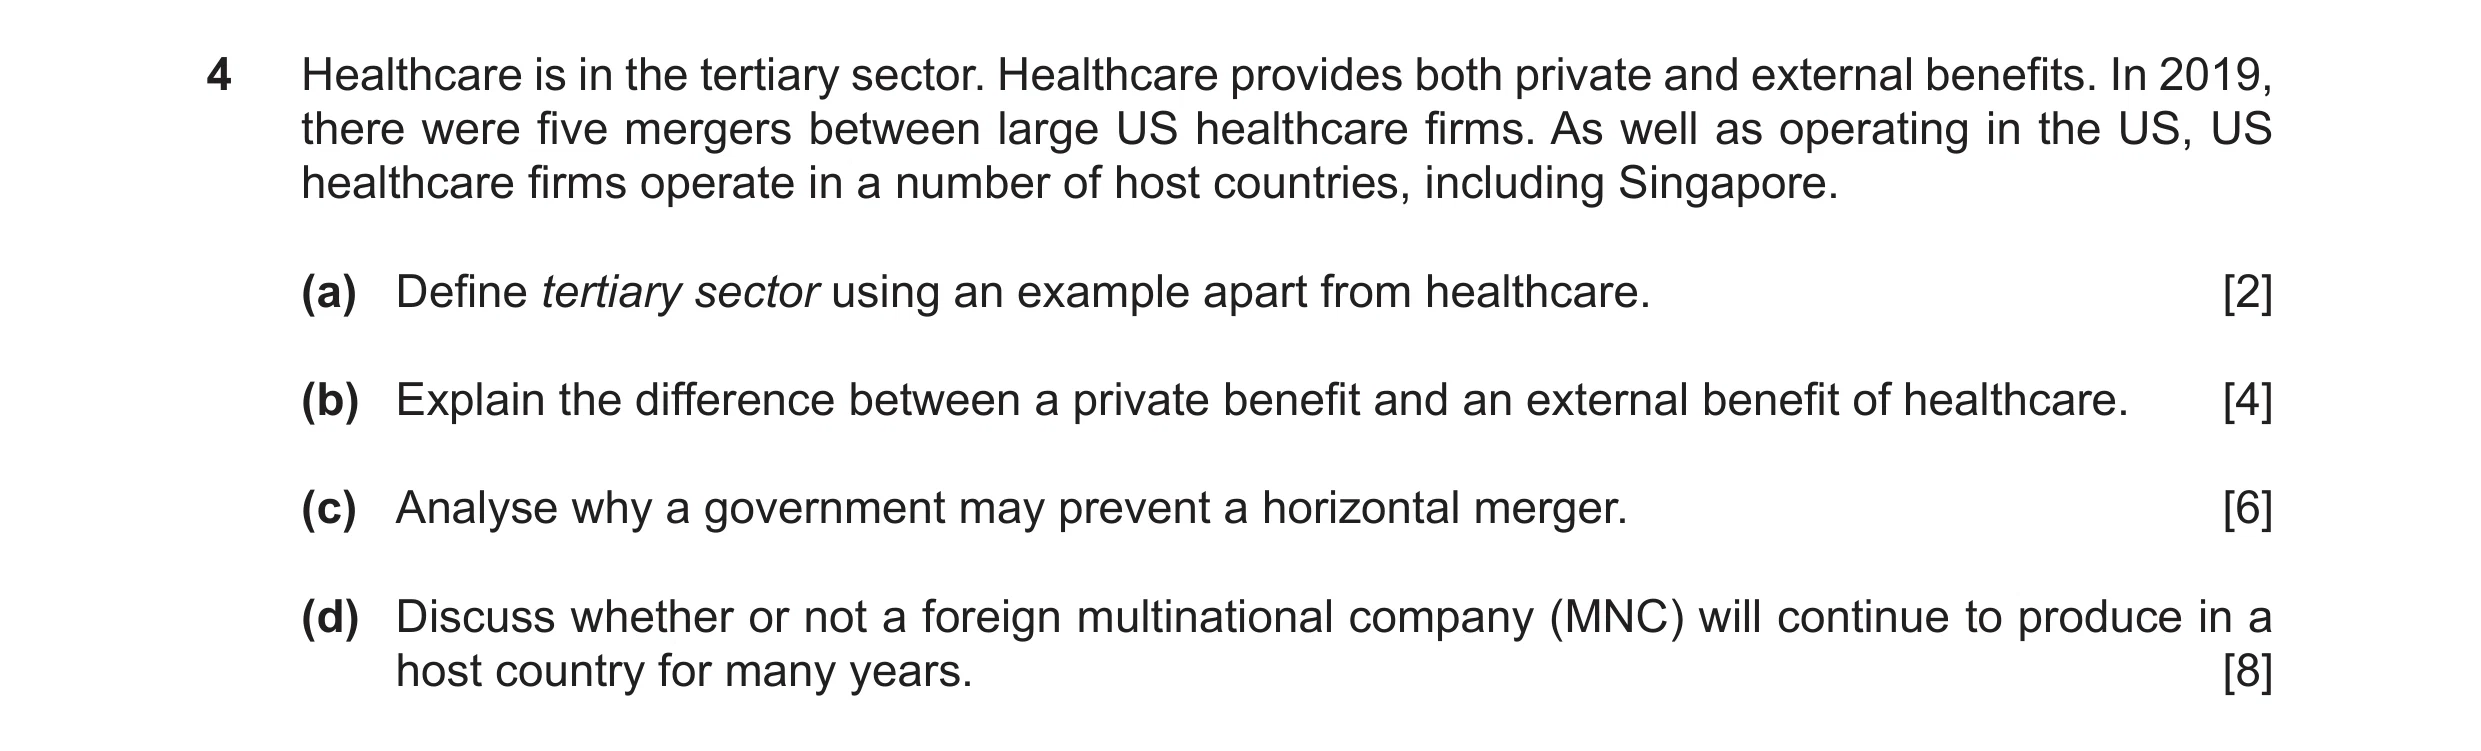
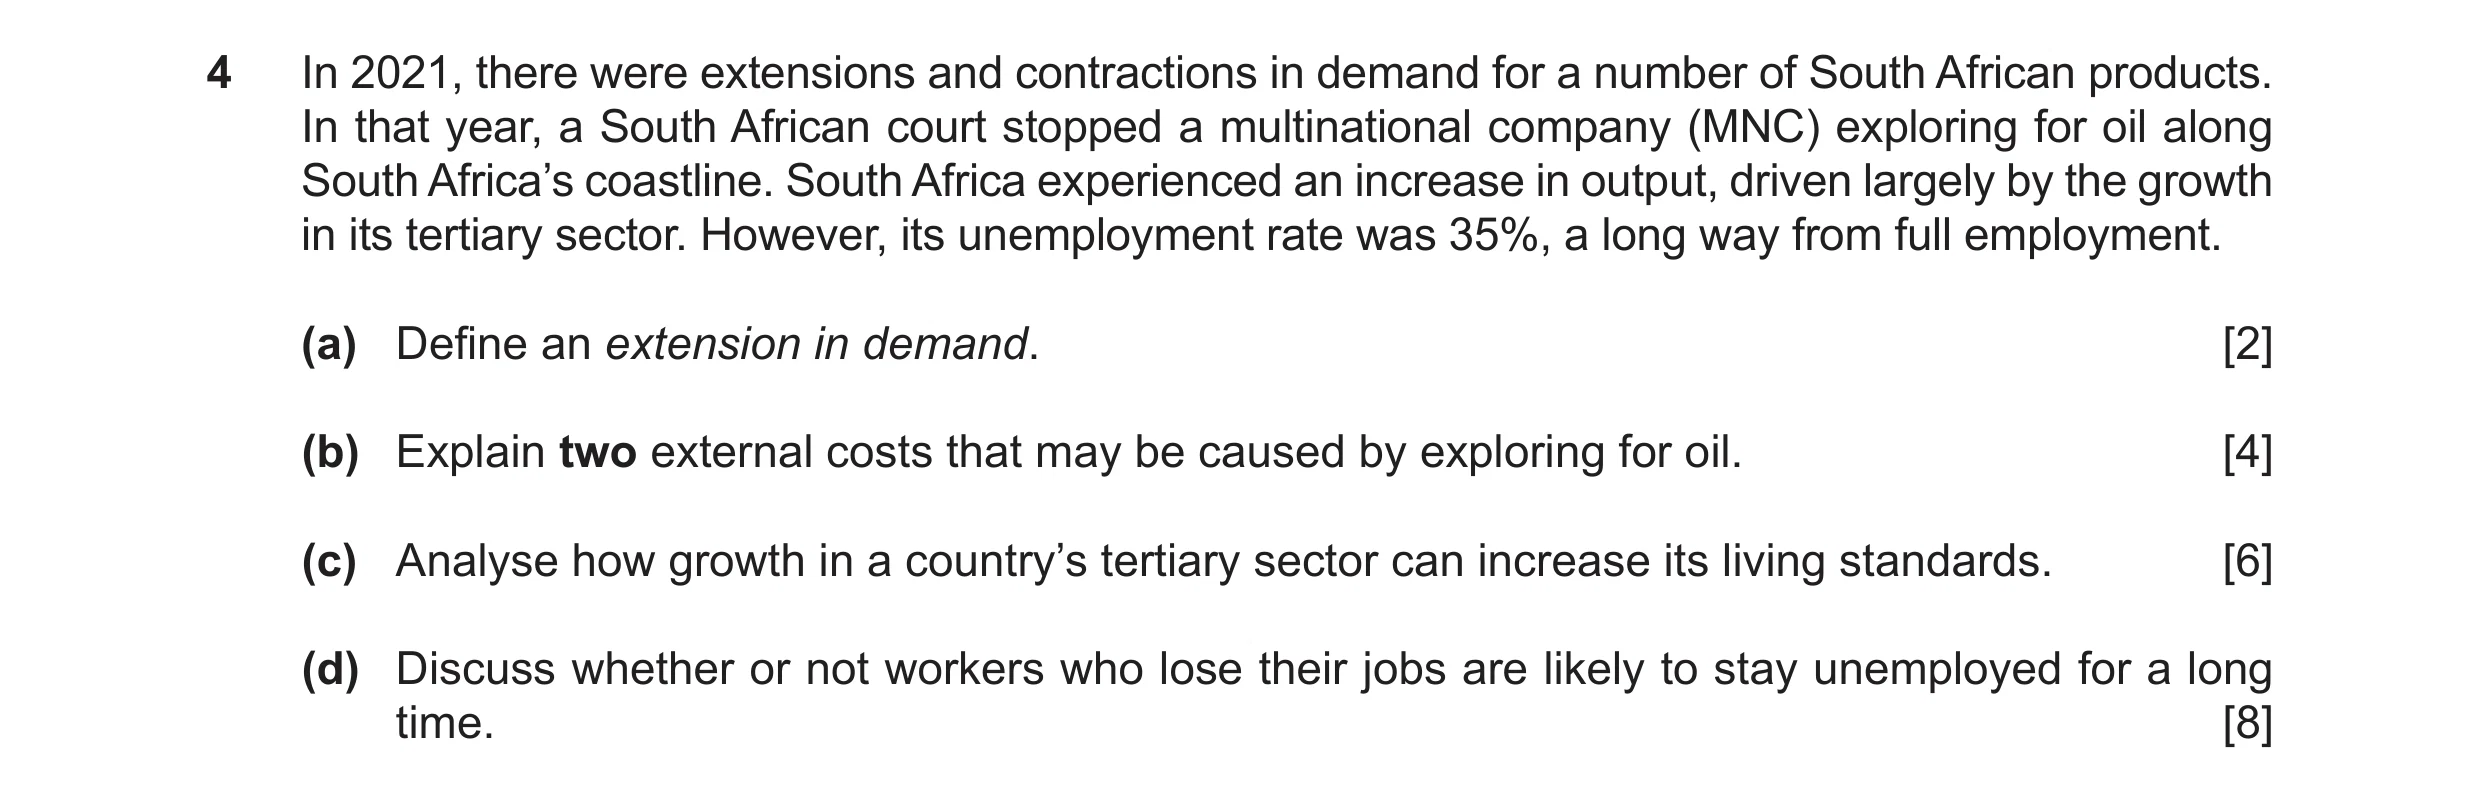 4 / 5
4 / 5![Question 13: (a) Calculate the value of Gabon’s oil production as a percentage of Gabon’s GDP. [1] (b) Identify two external benefits of rainforests. [2…](https://img.pastlit.com/crops/38796cc5-8cea-4c9d-9bcb-21653d7326ee/q1.webp)
![Question 14: (a) Calculate St. Kitts and Nevis’s government budget deficit in 2022. [1] (b) Identify two examples of the factor of production ‘land’ in …](https://img.pastlit.com/crops/7f3a3e23-0756-4085-9a60-51f9514dc33e/q1.webp)
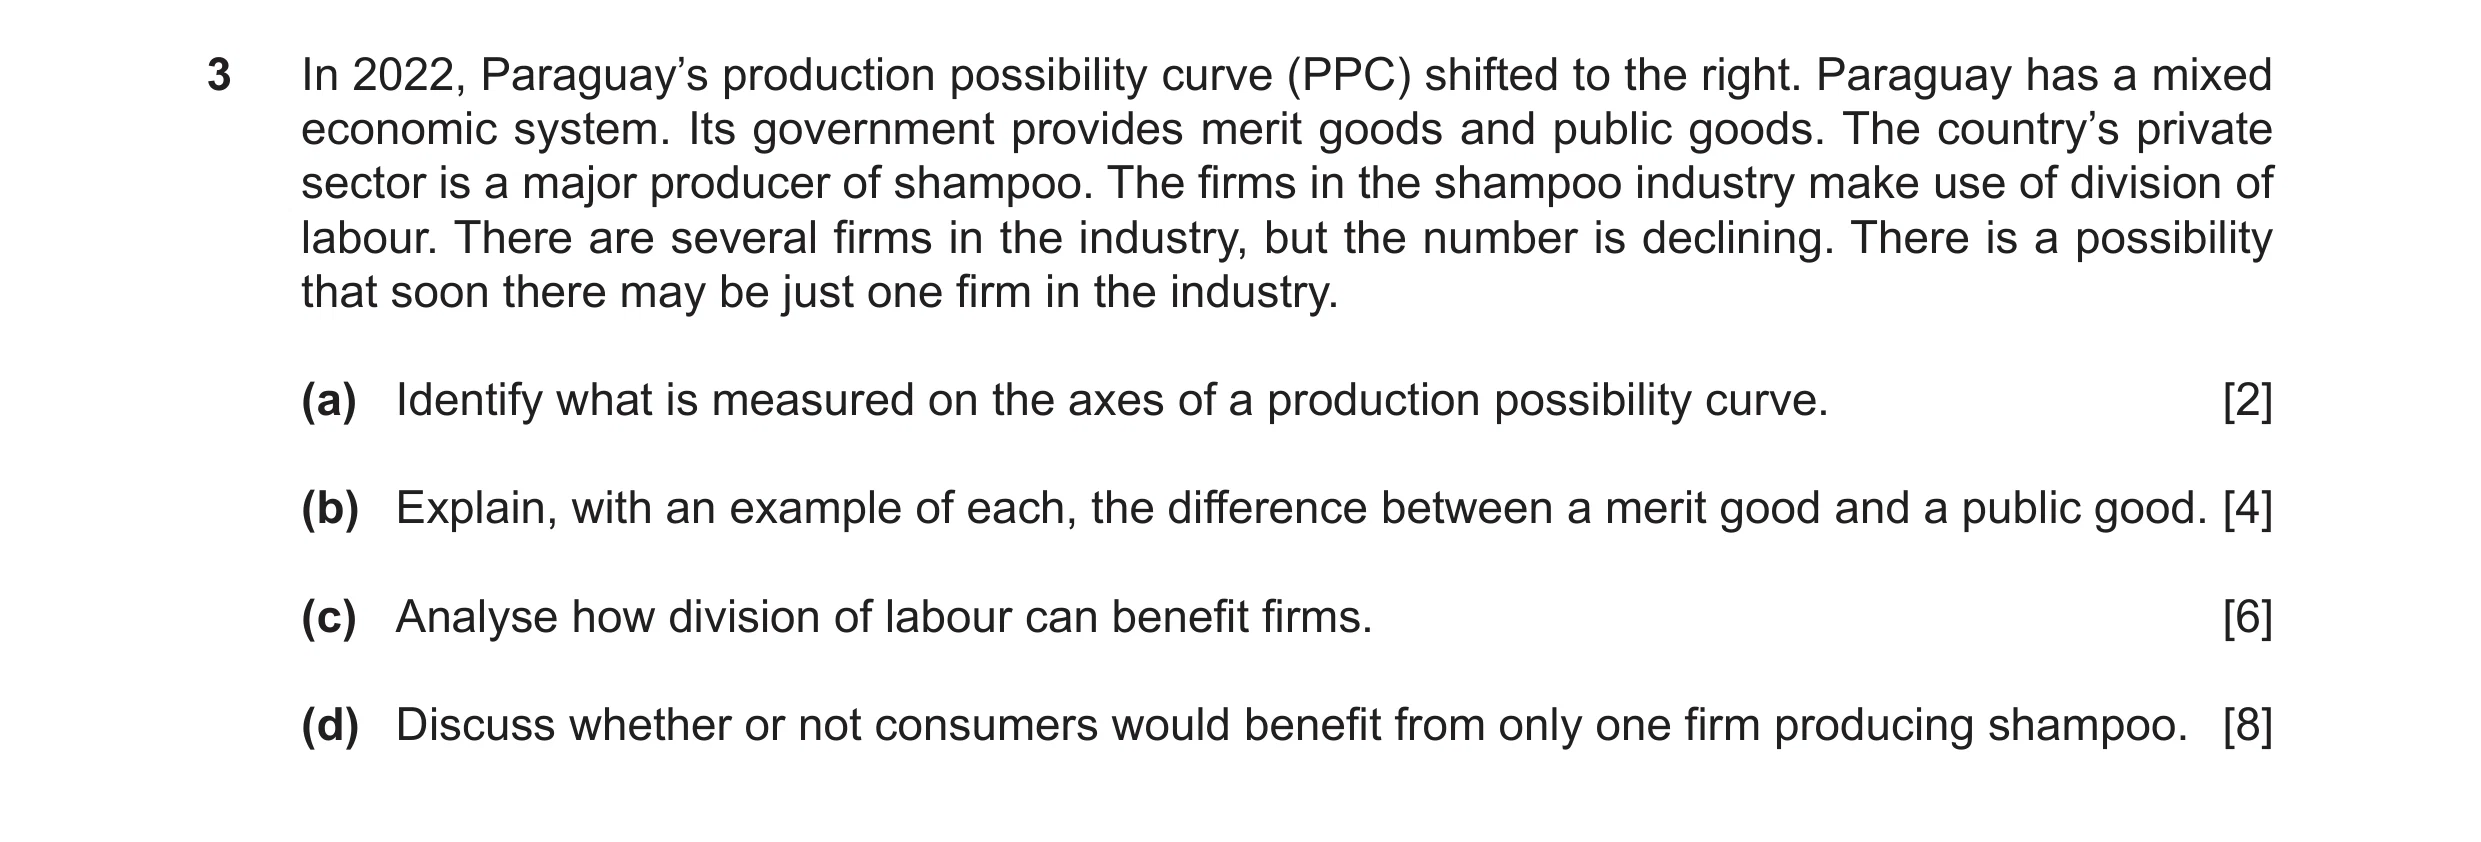 5 / 5
5 / 5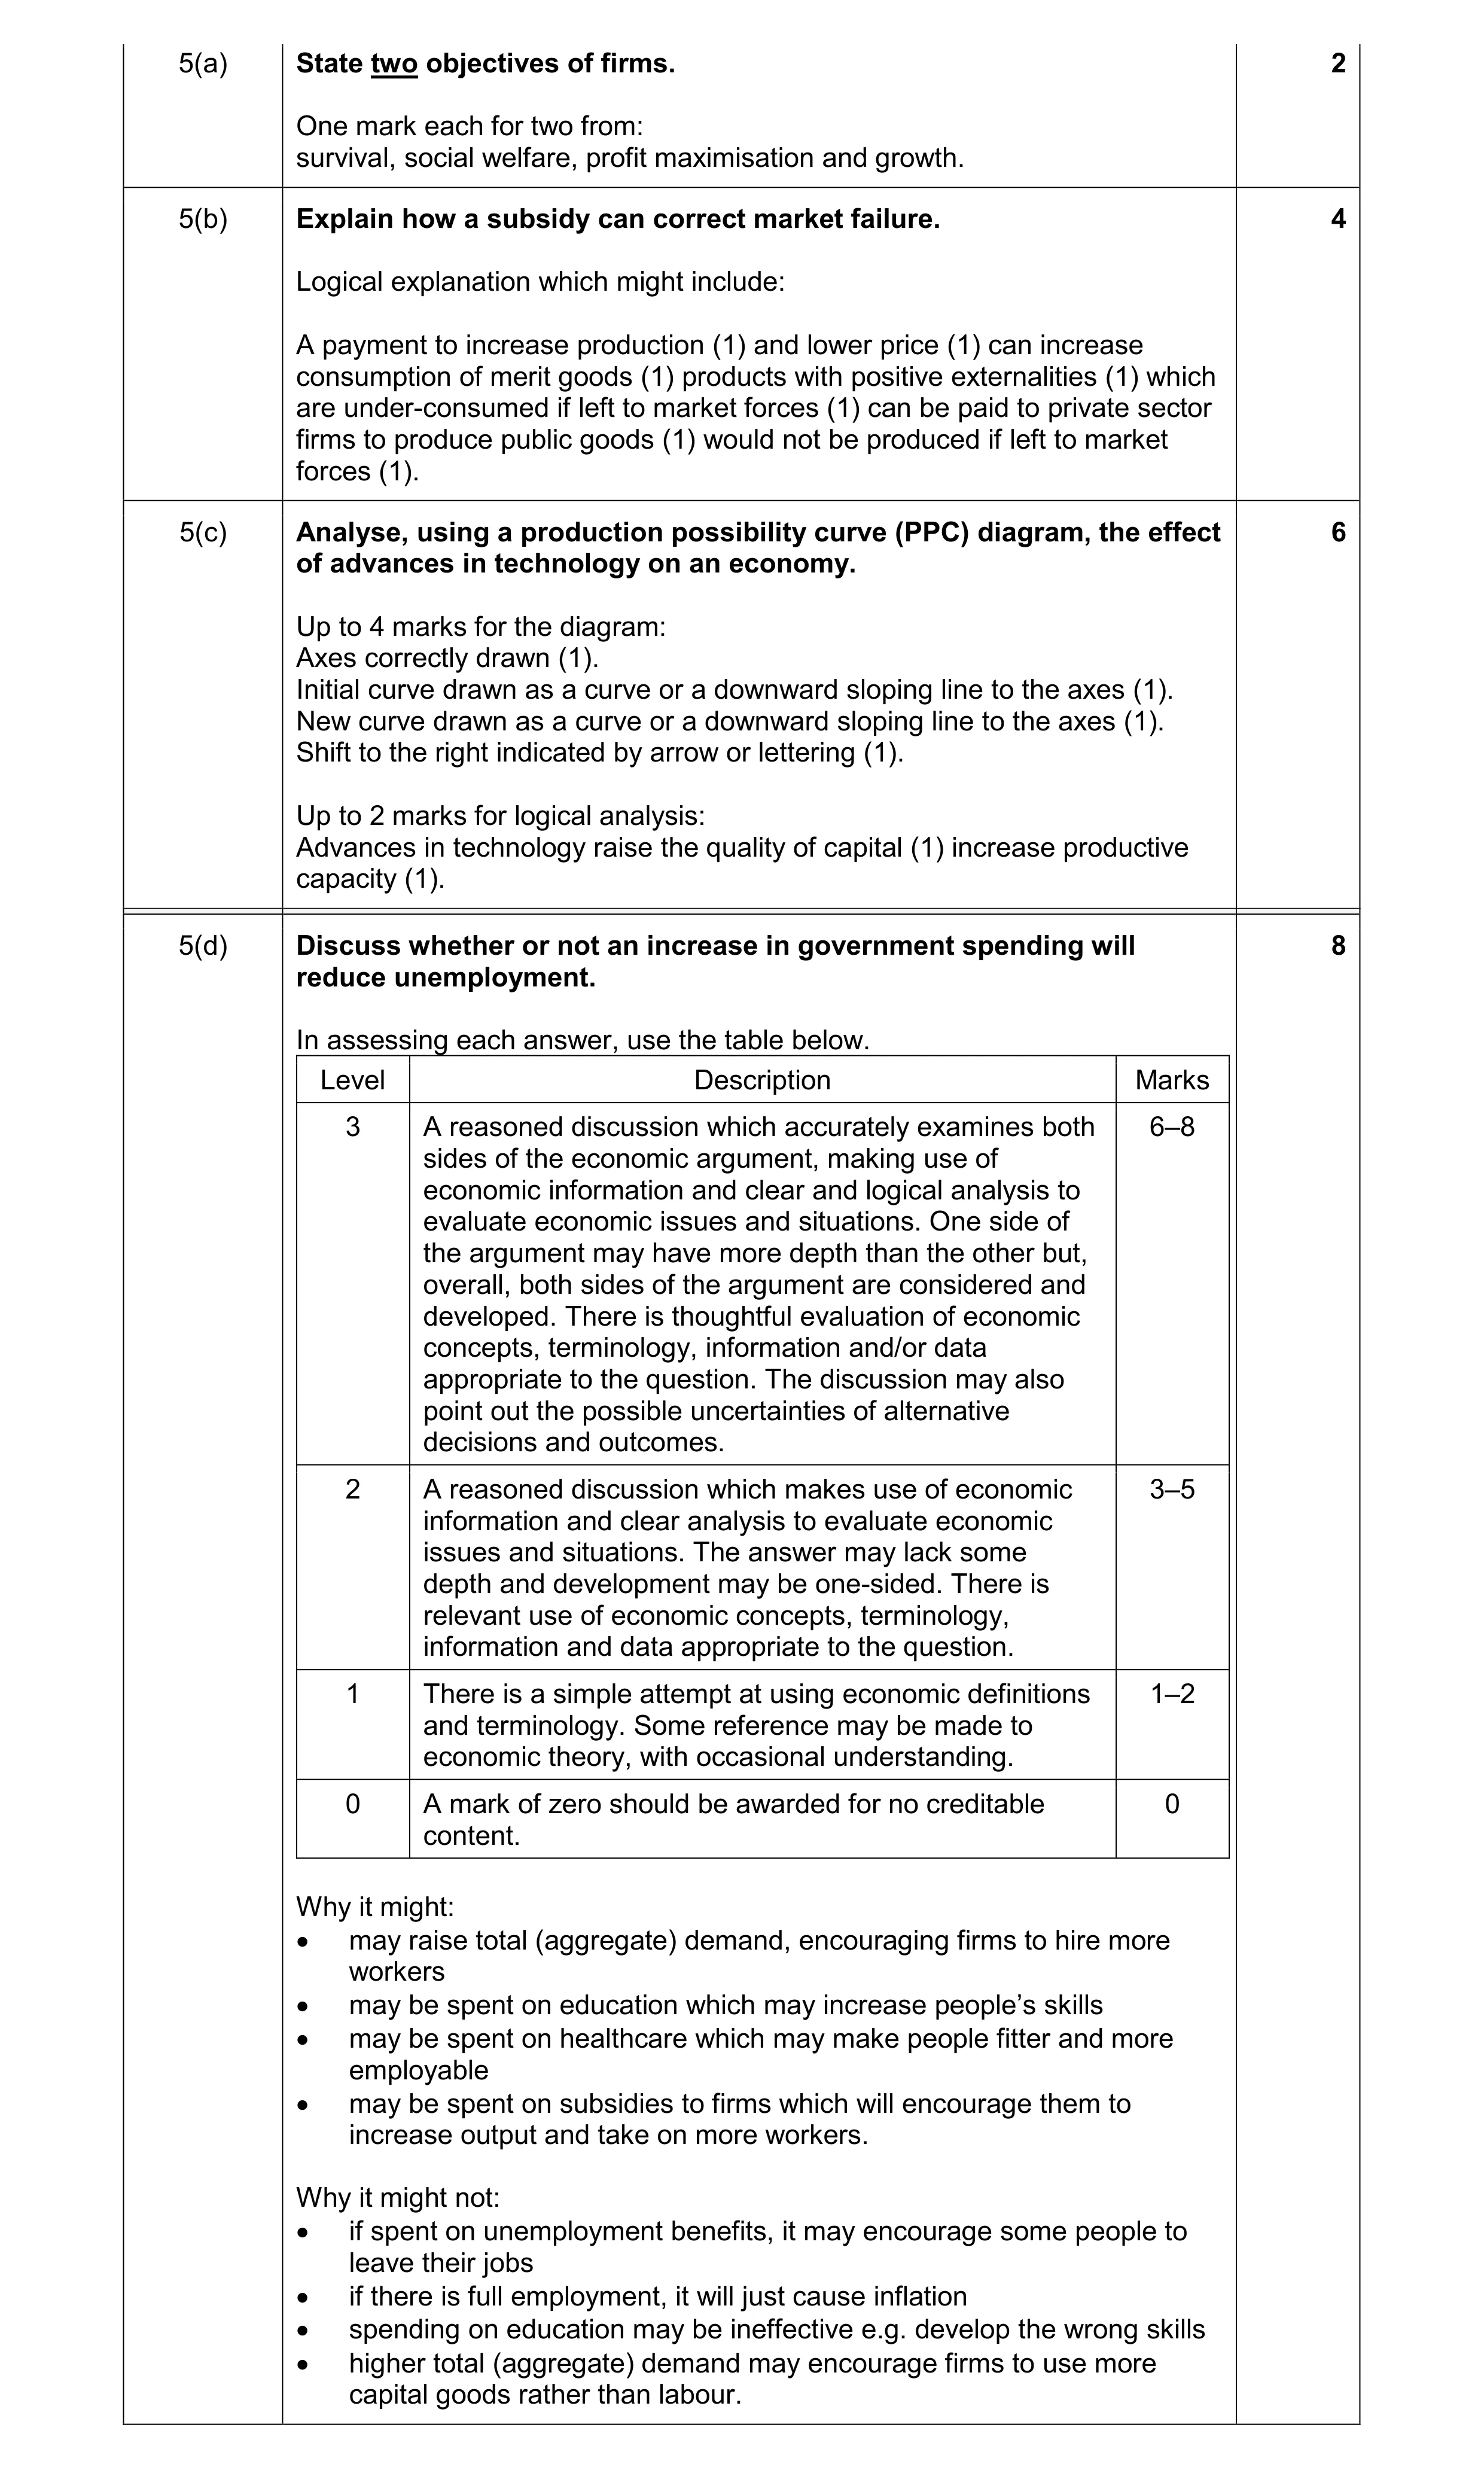 20
20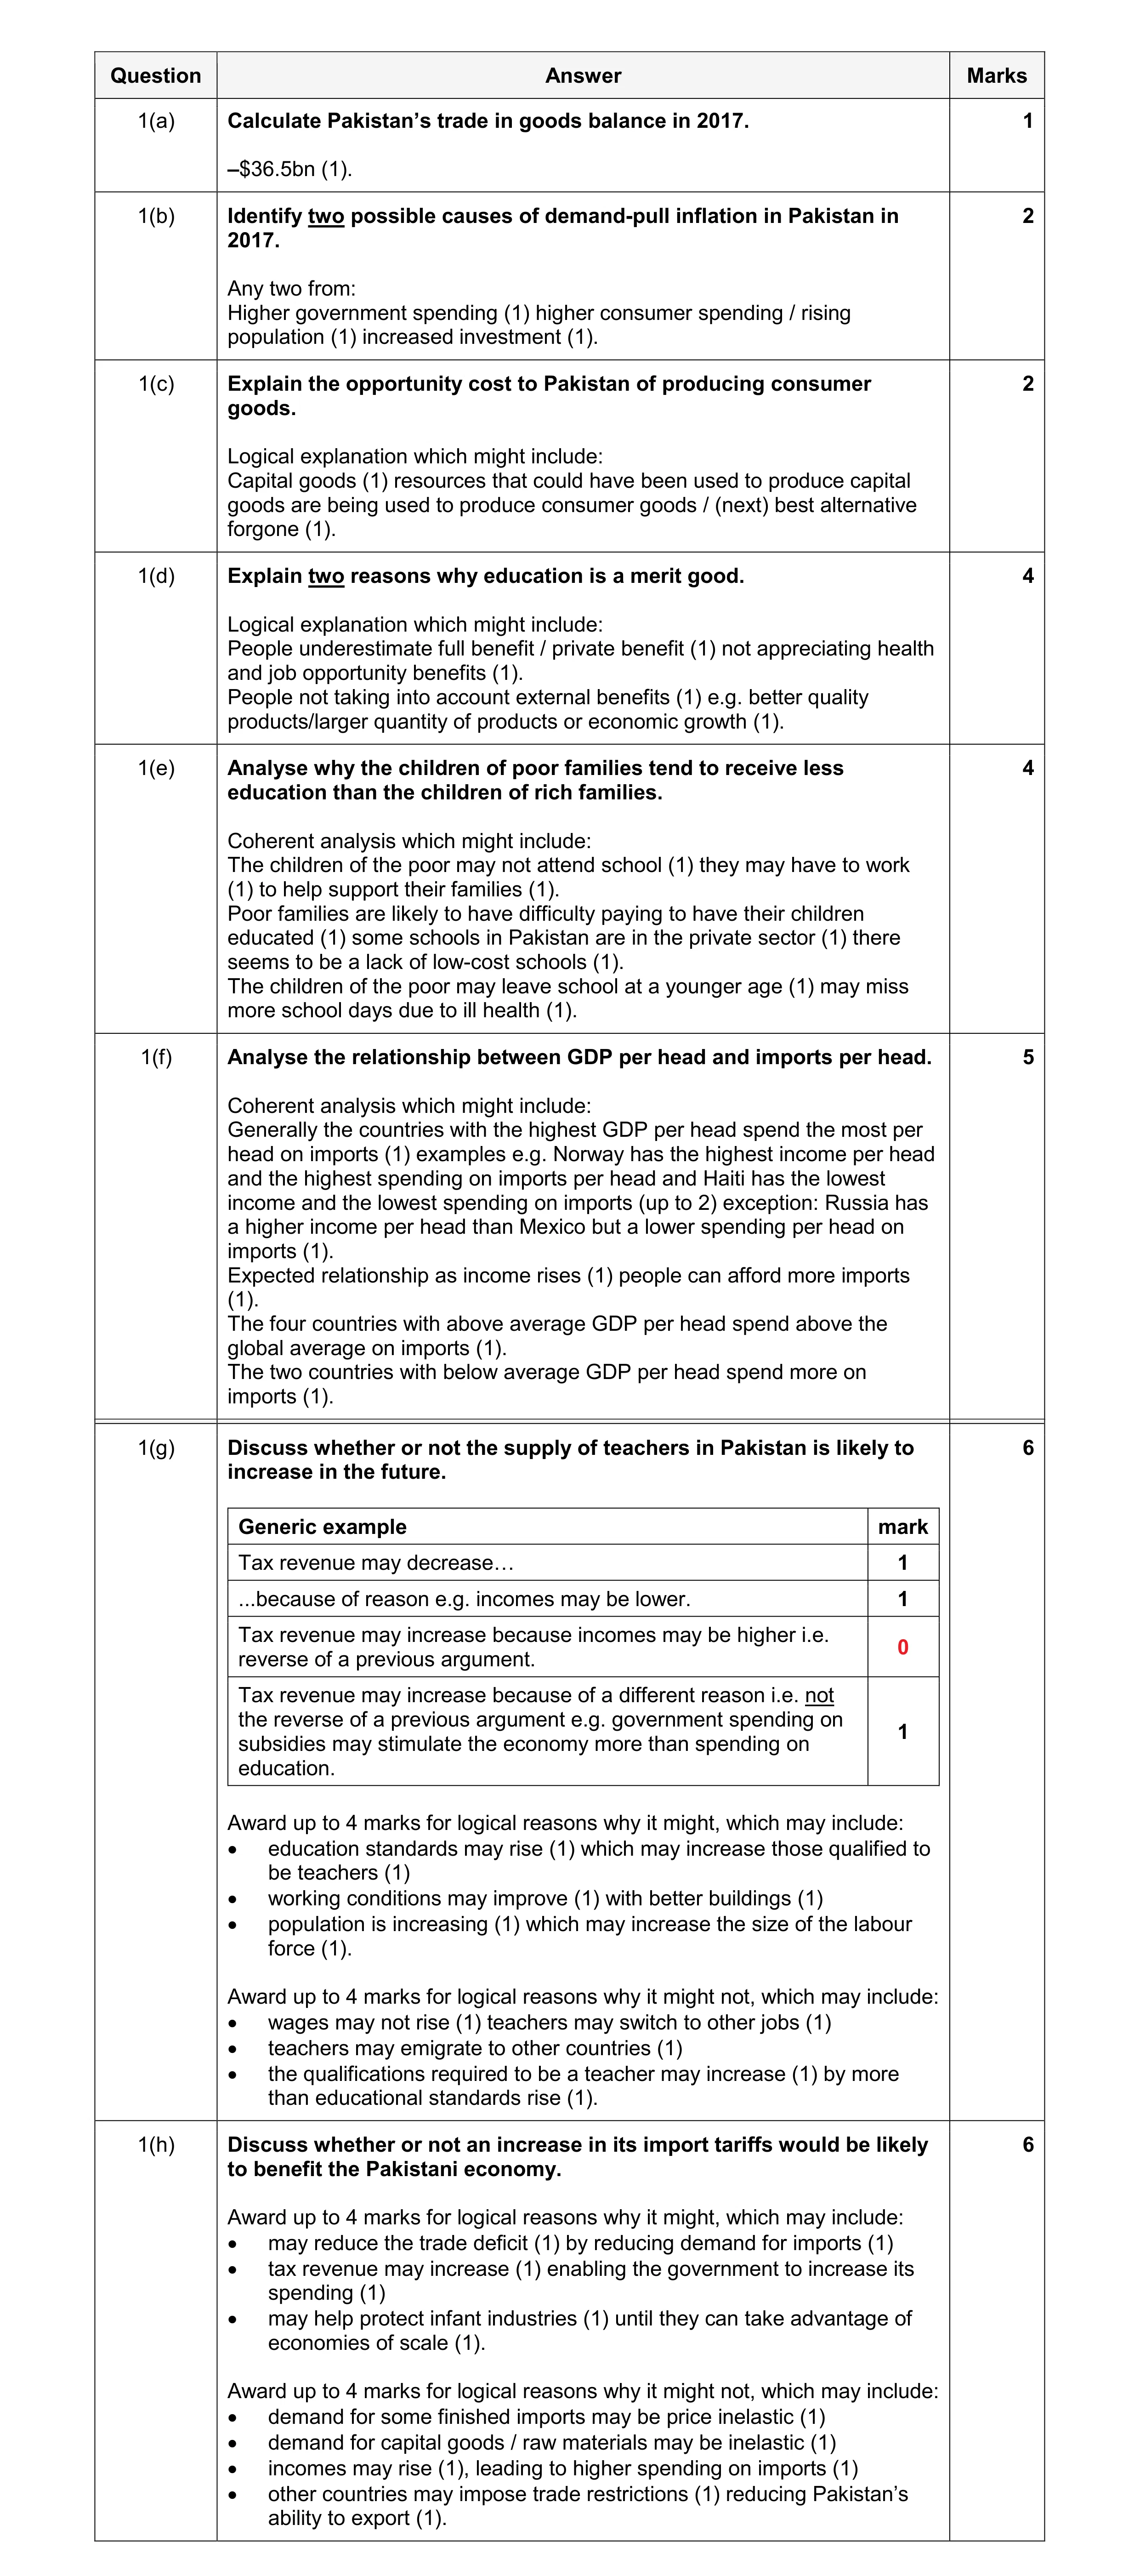 30
30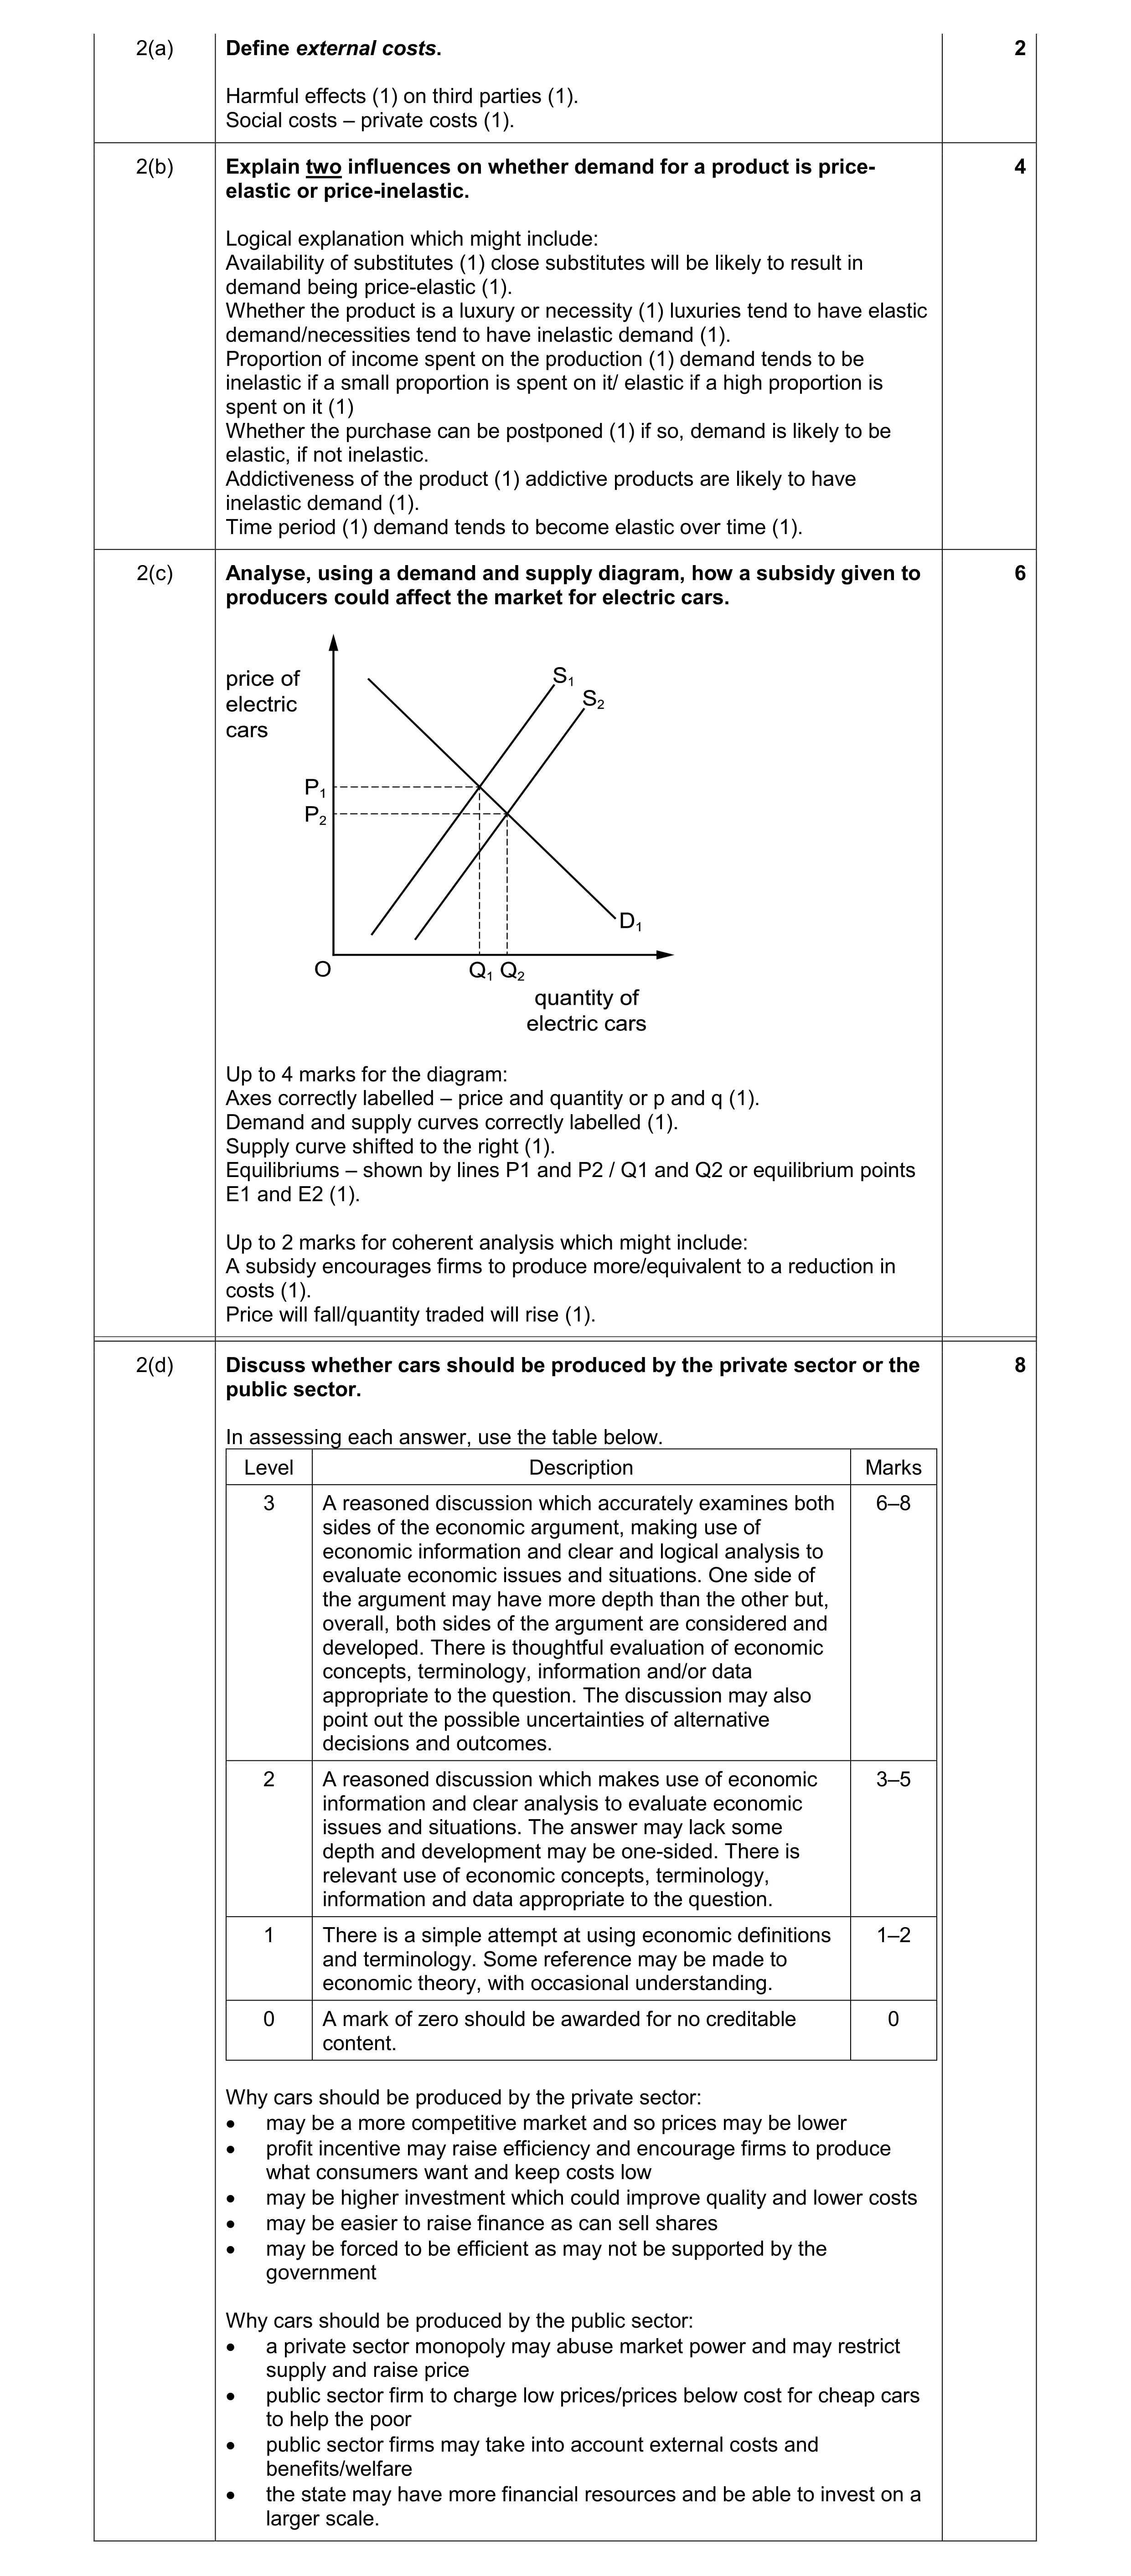 20
20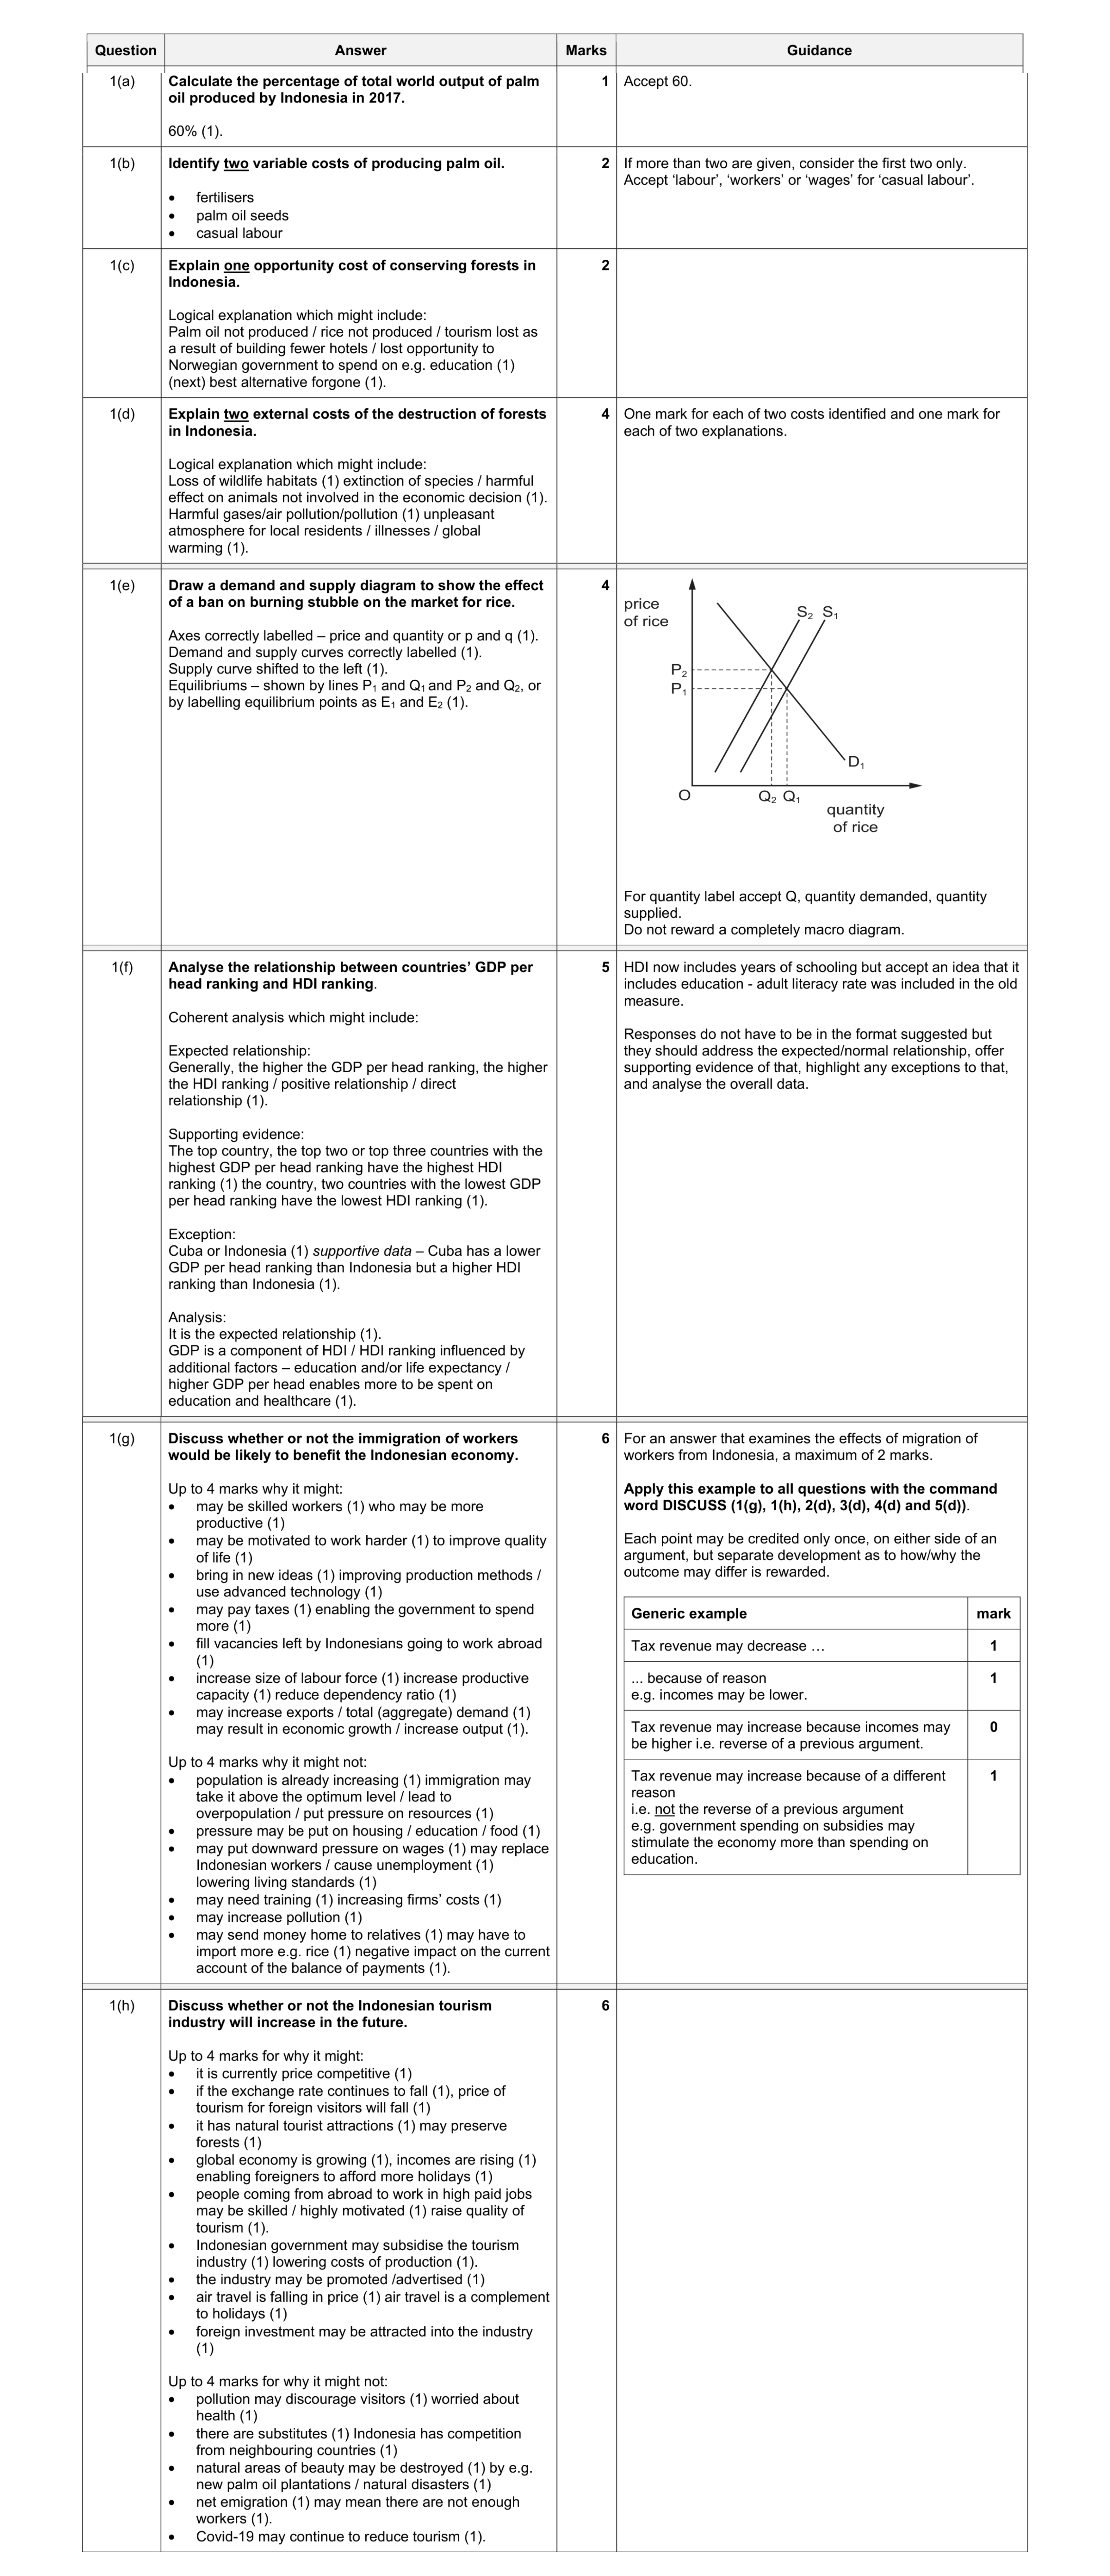 30
30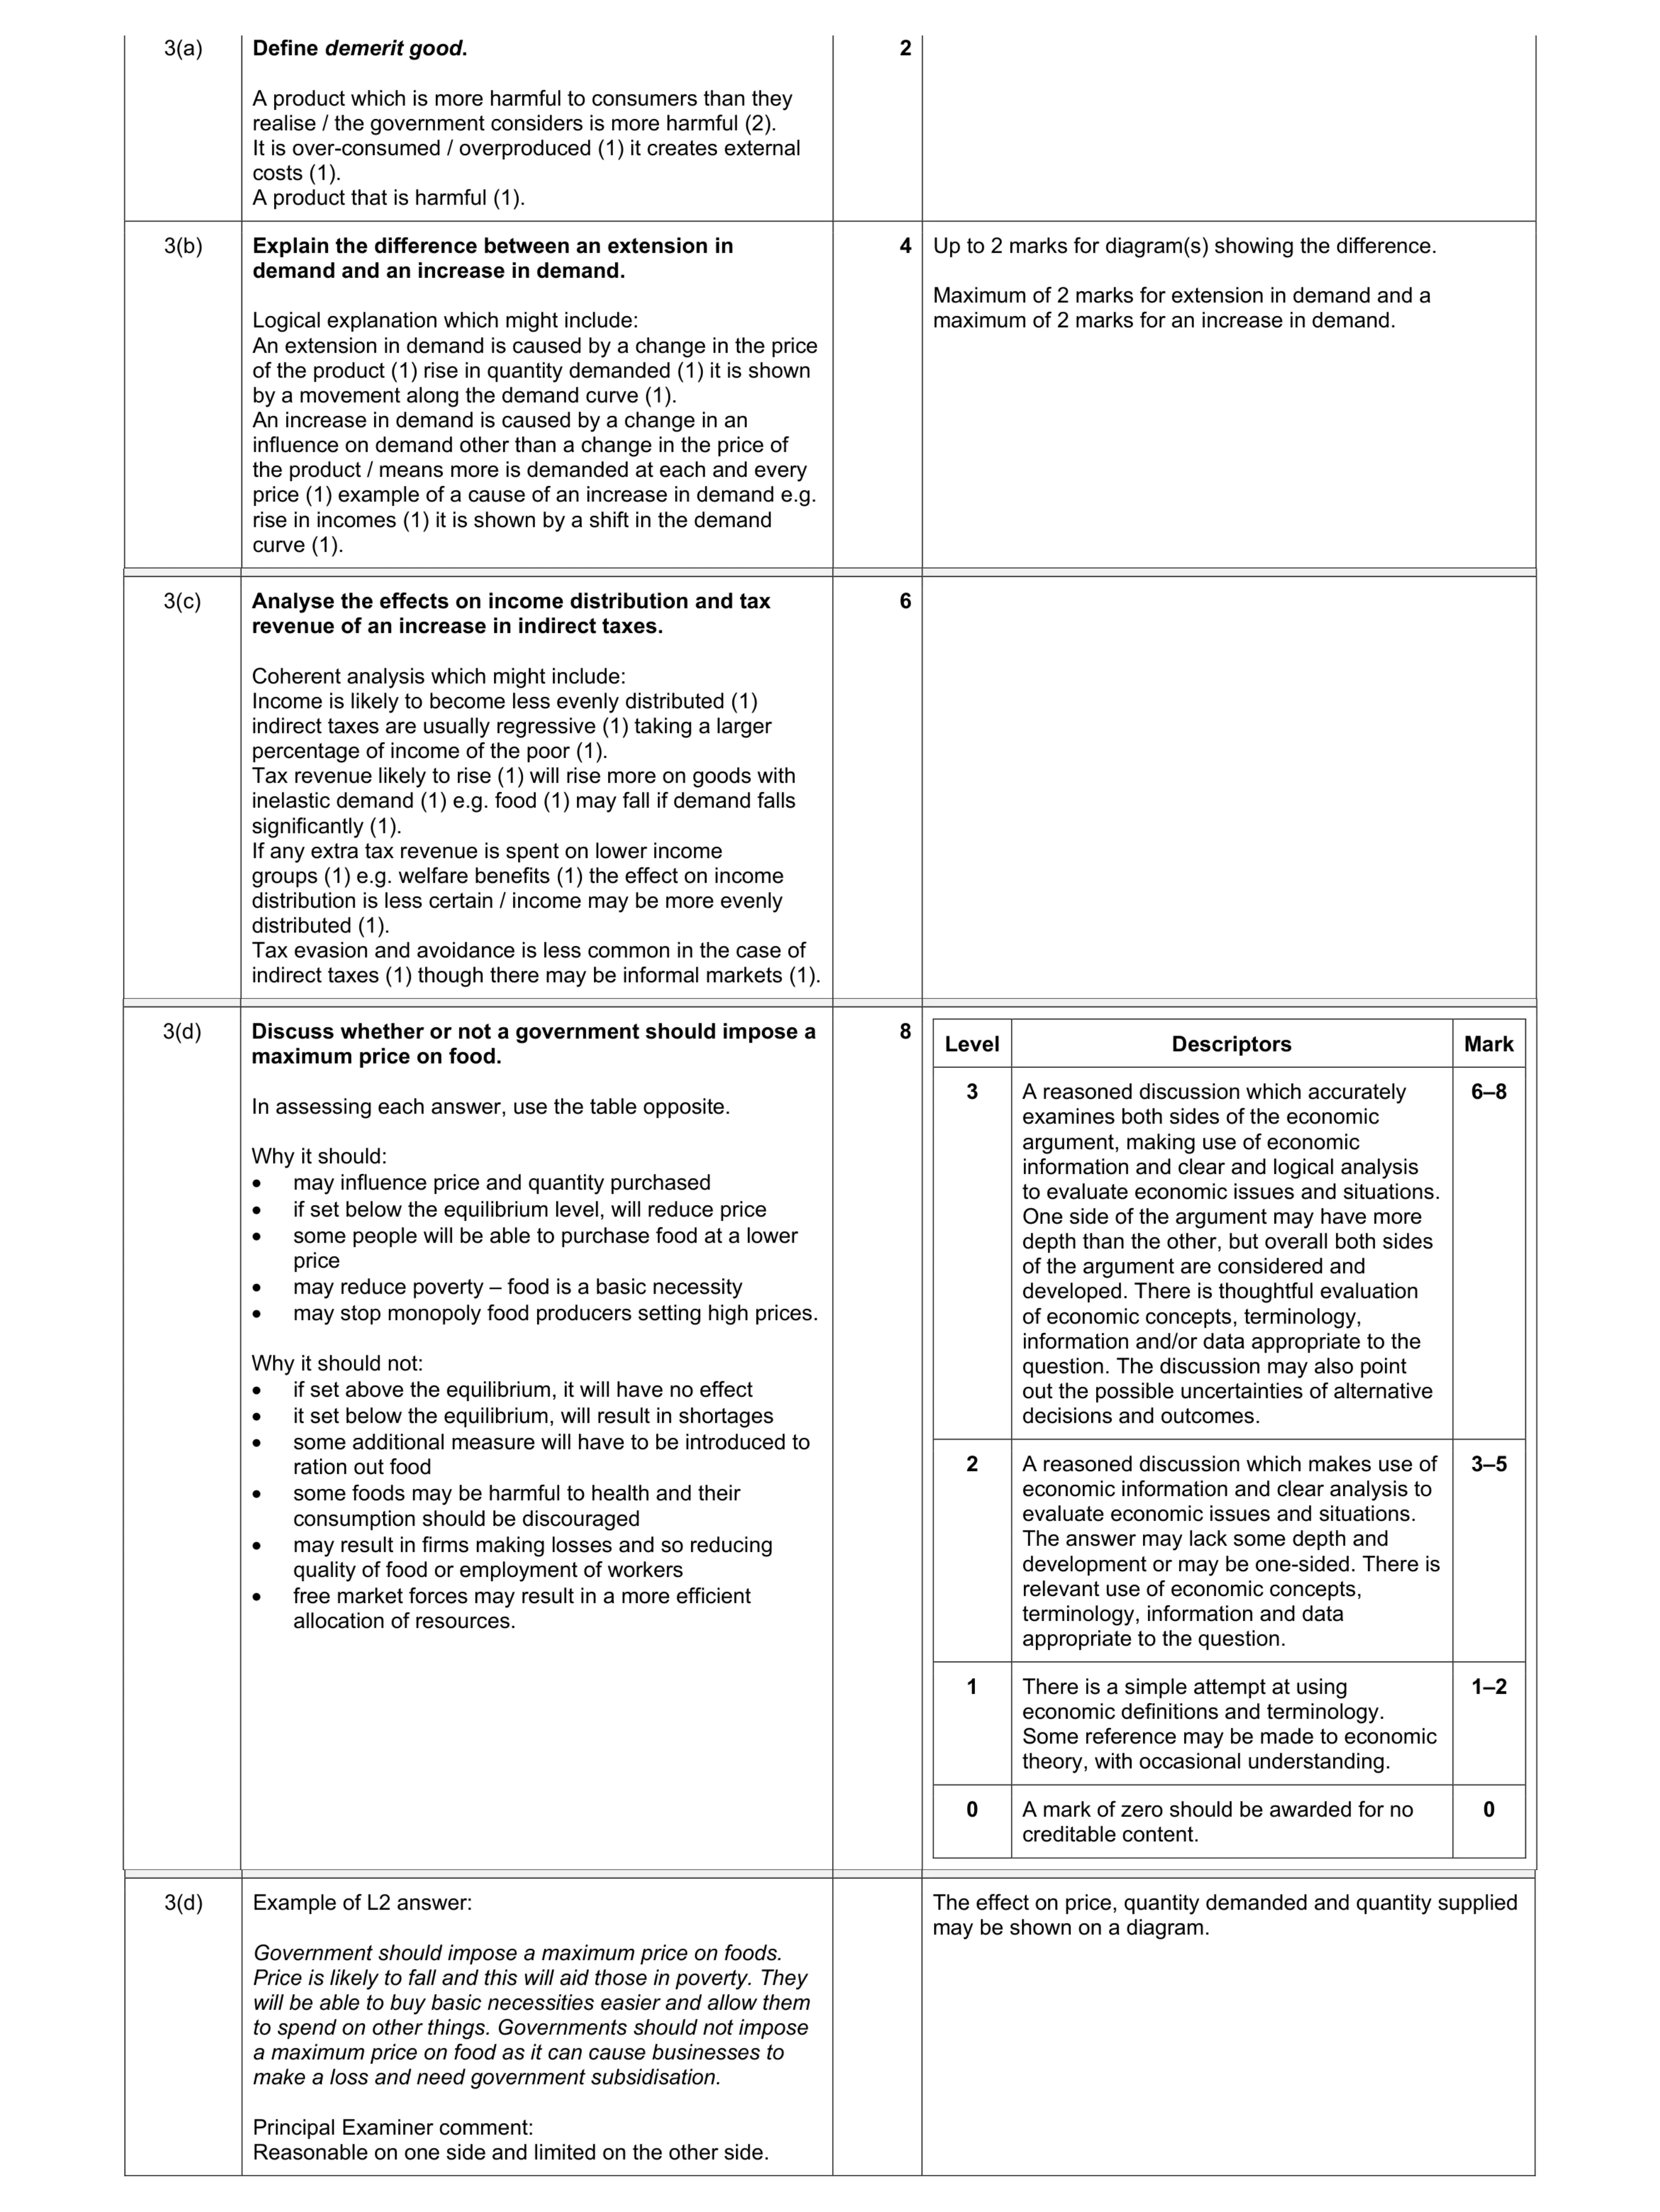 20
20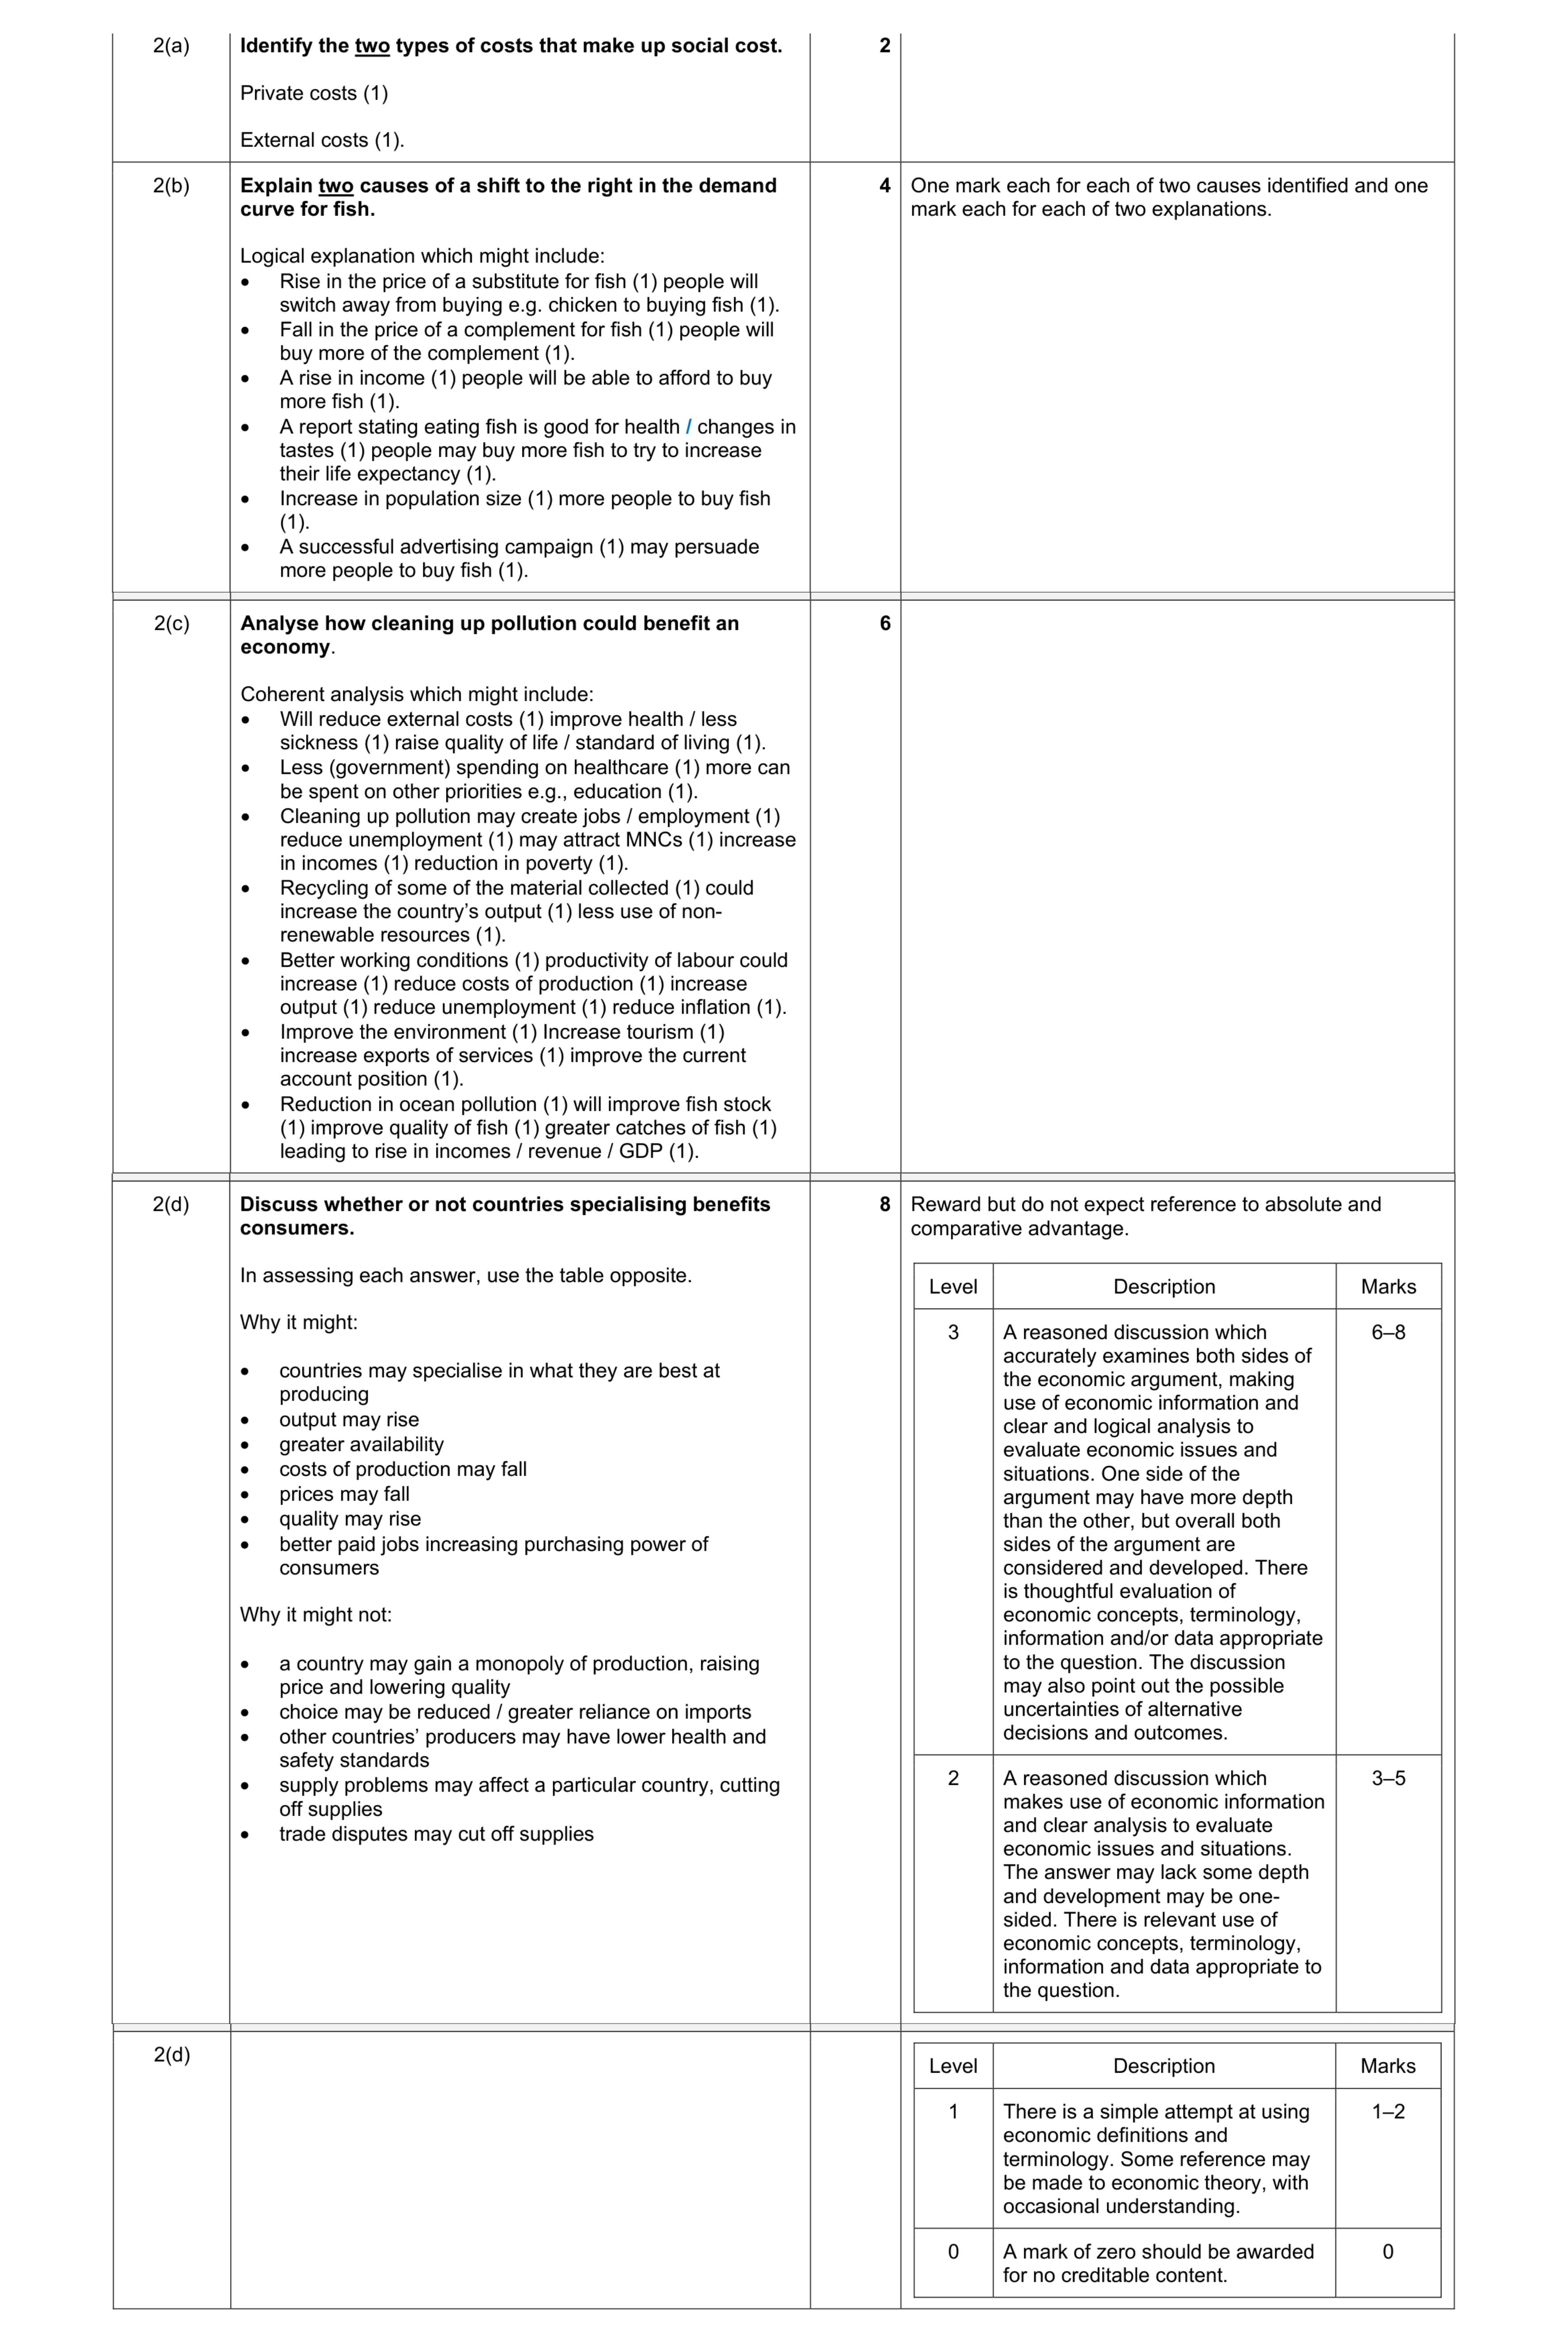 20
20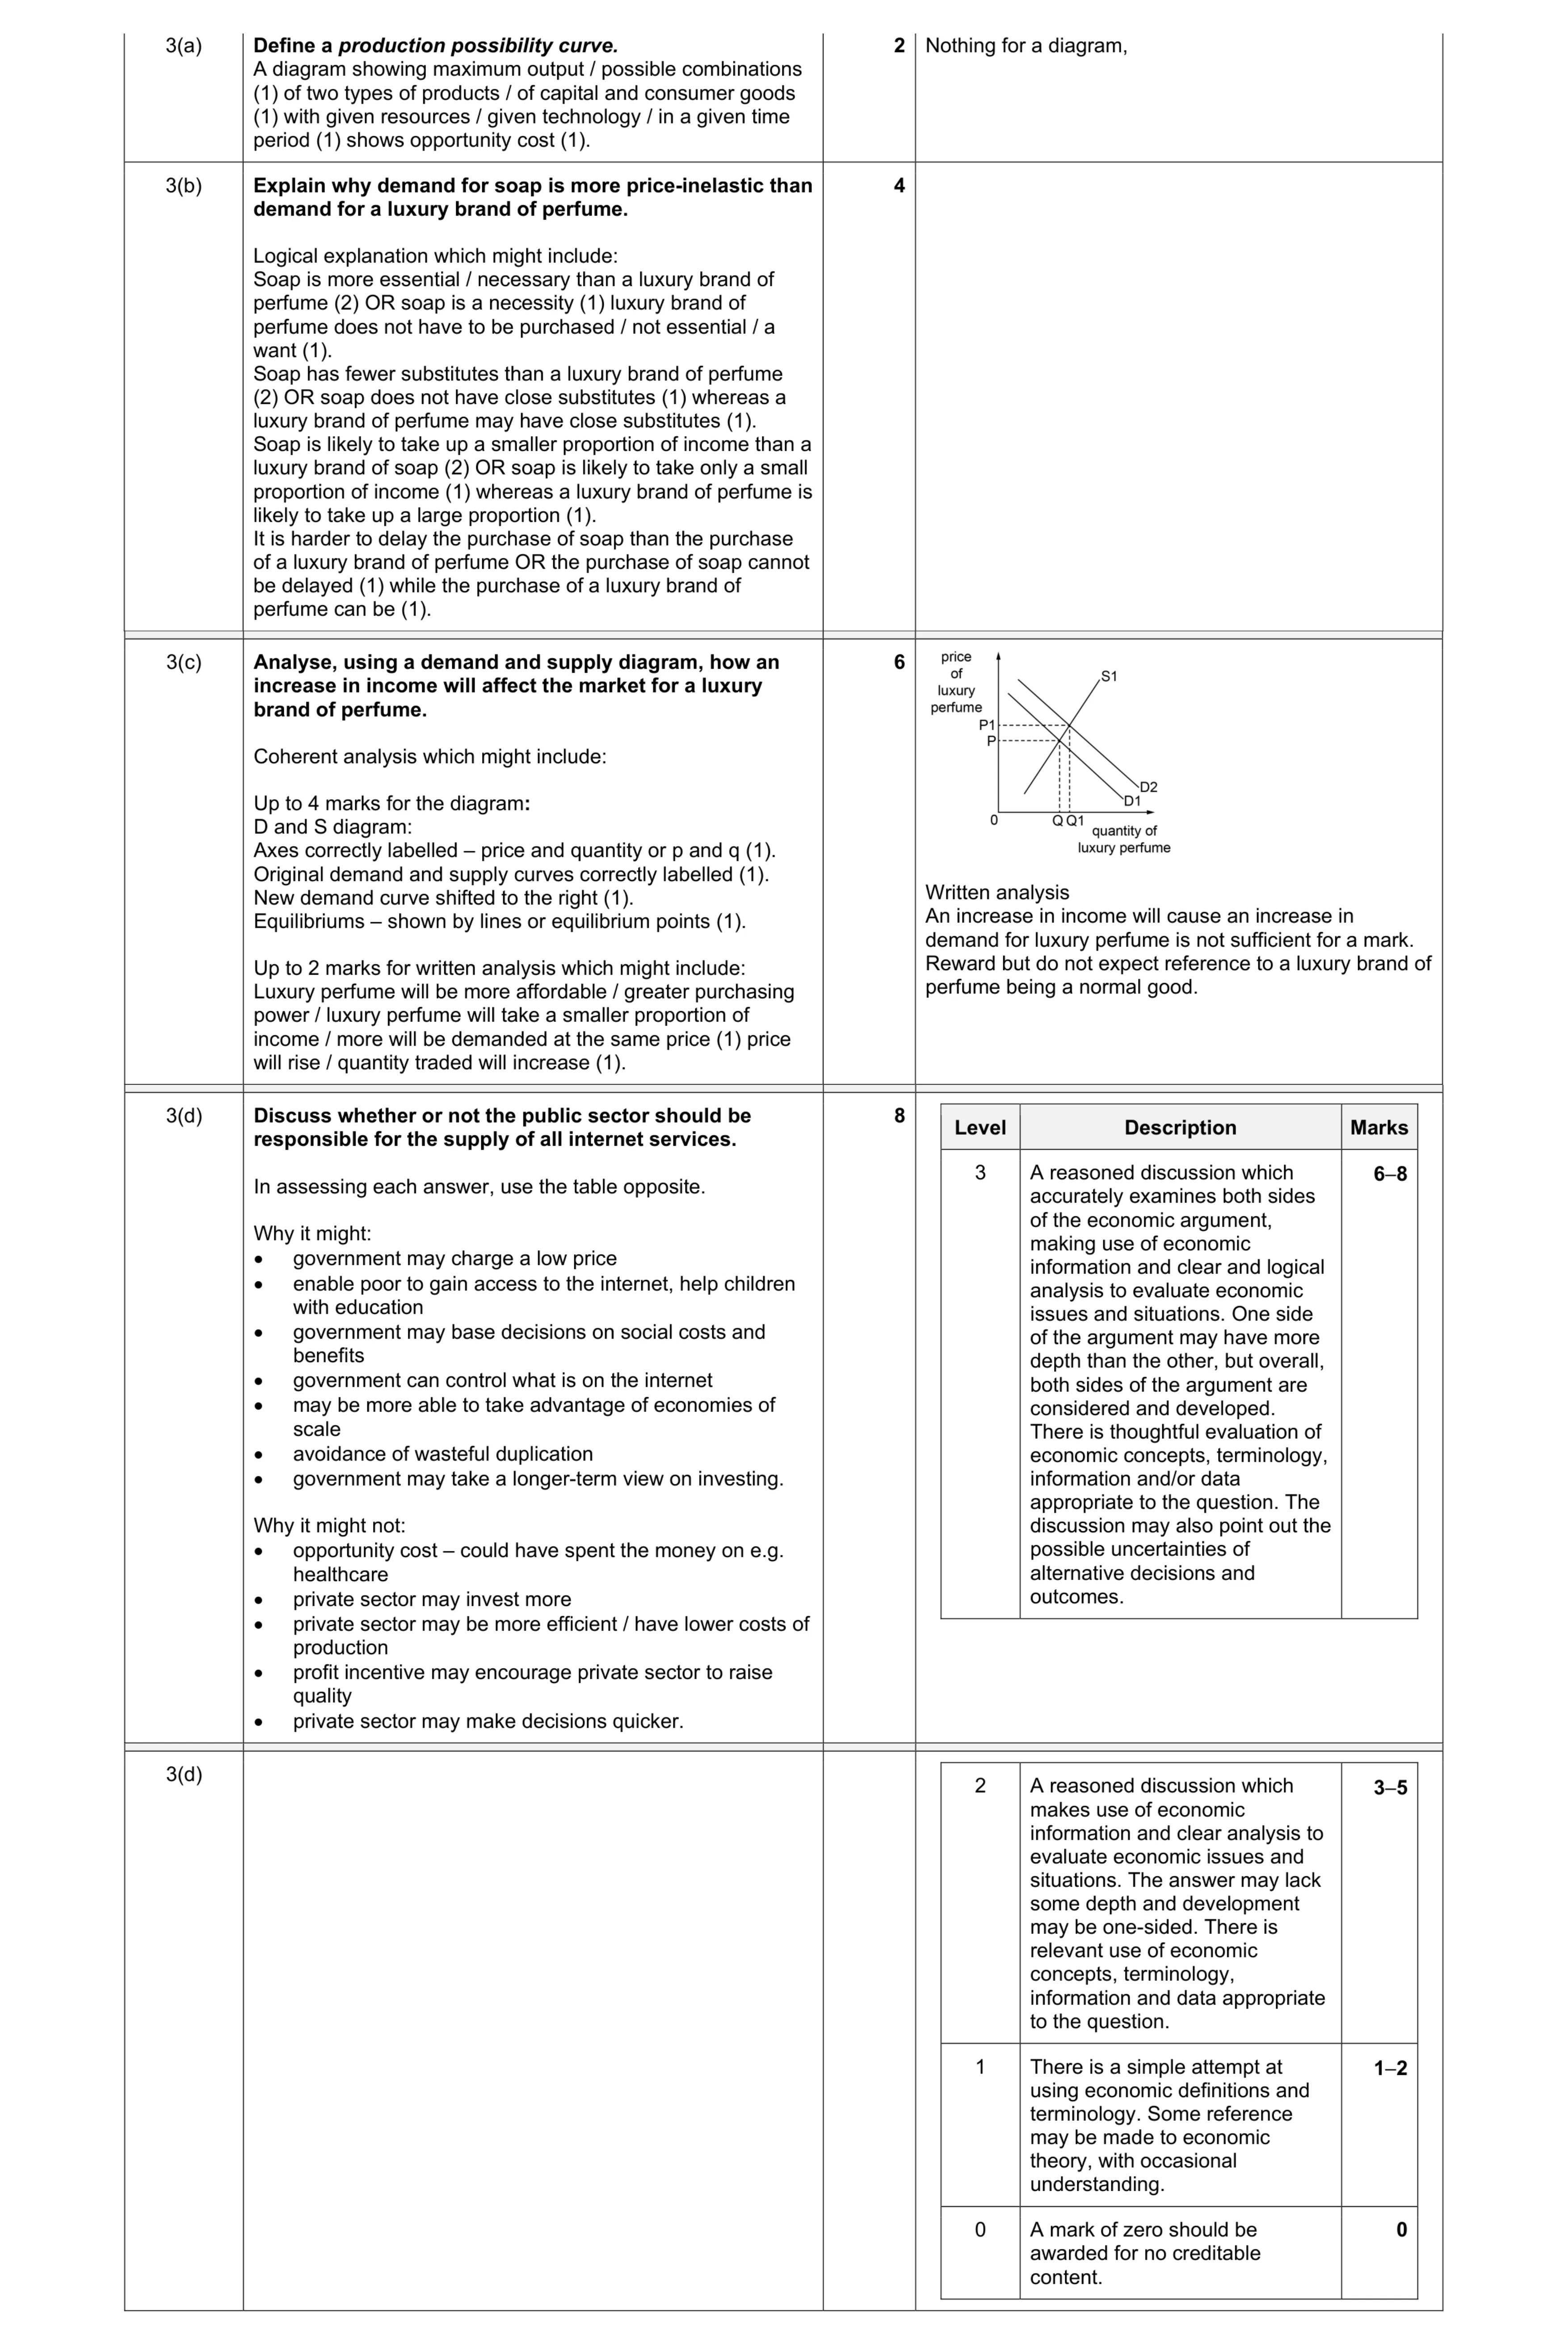 20
20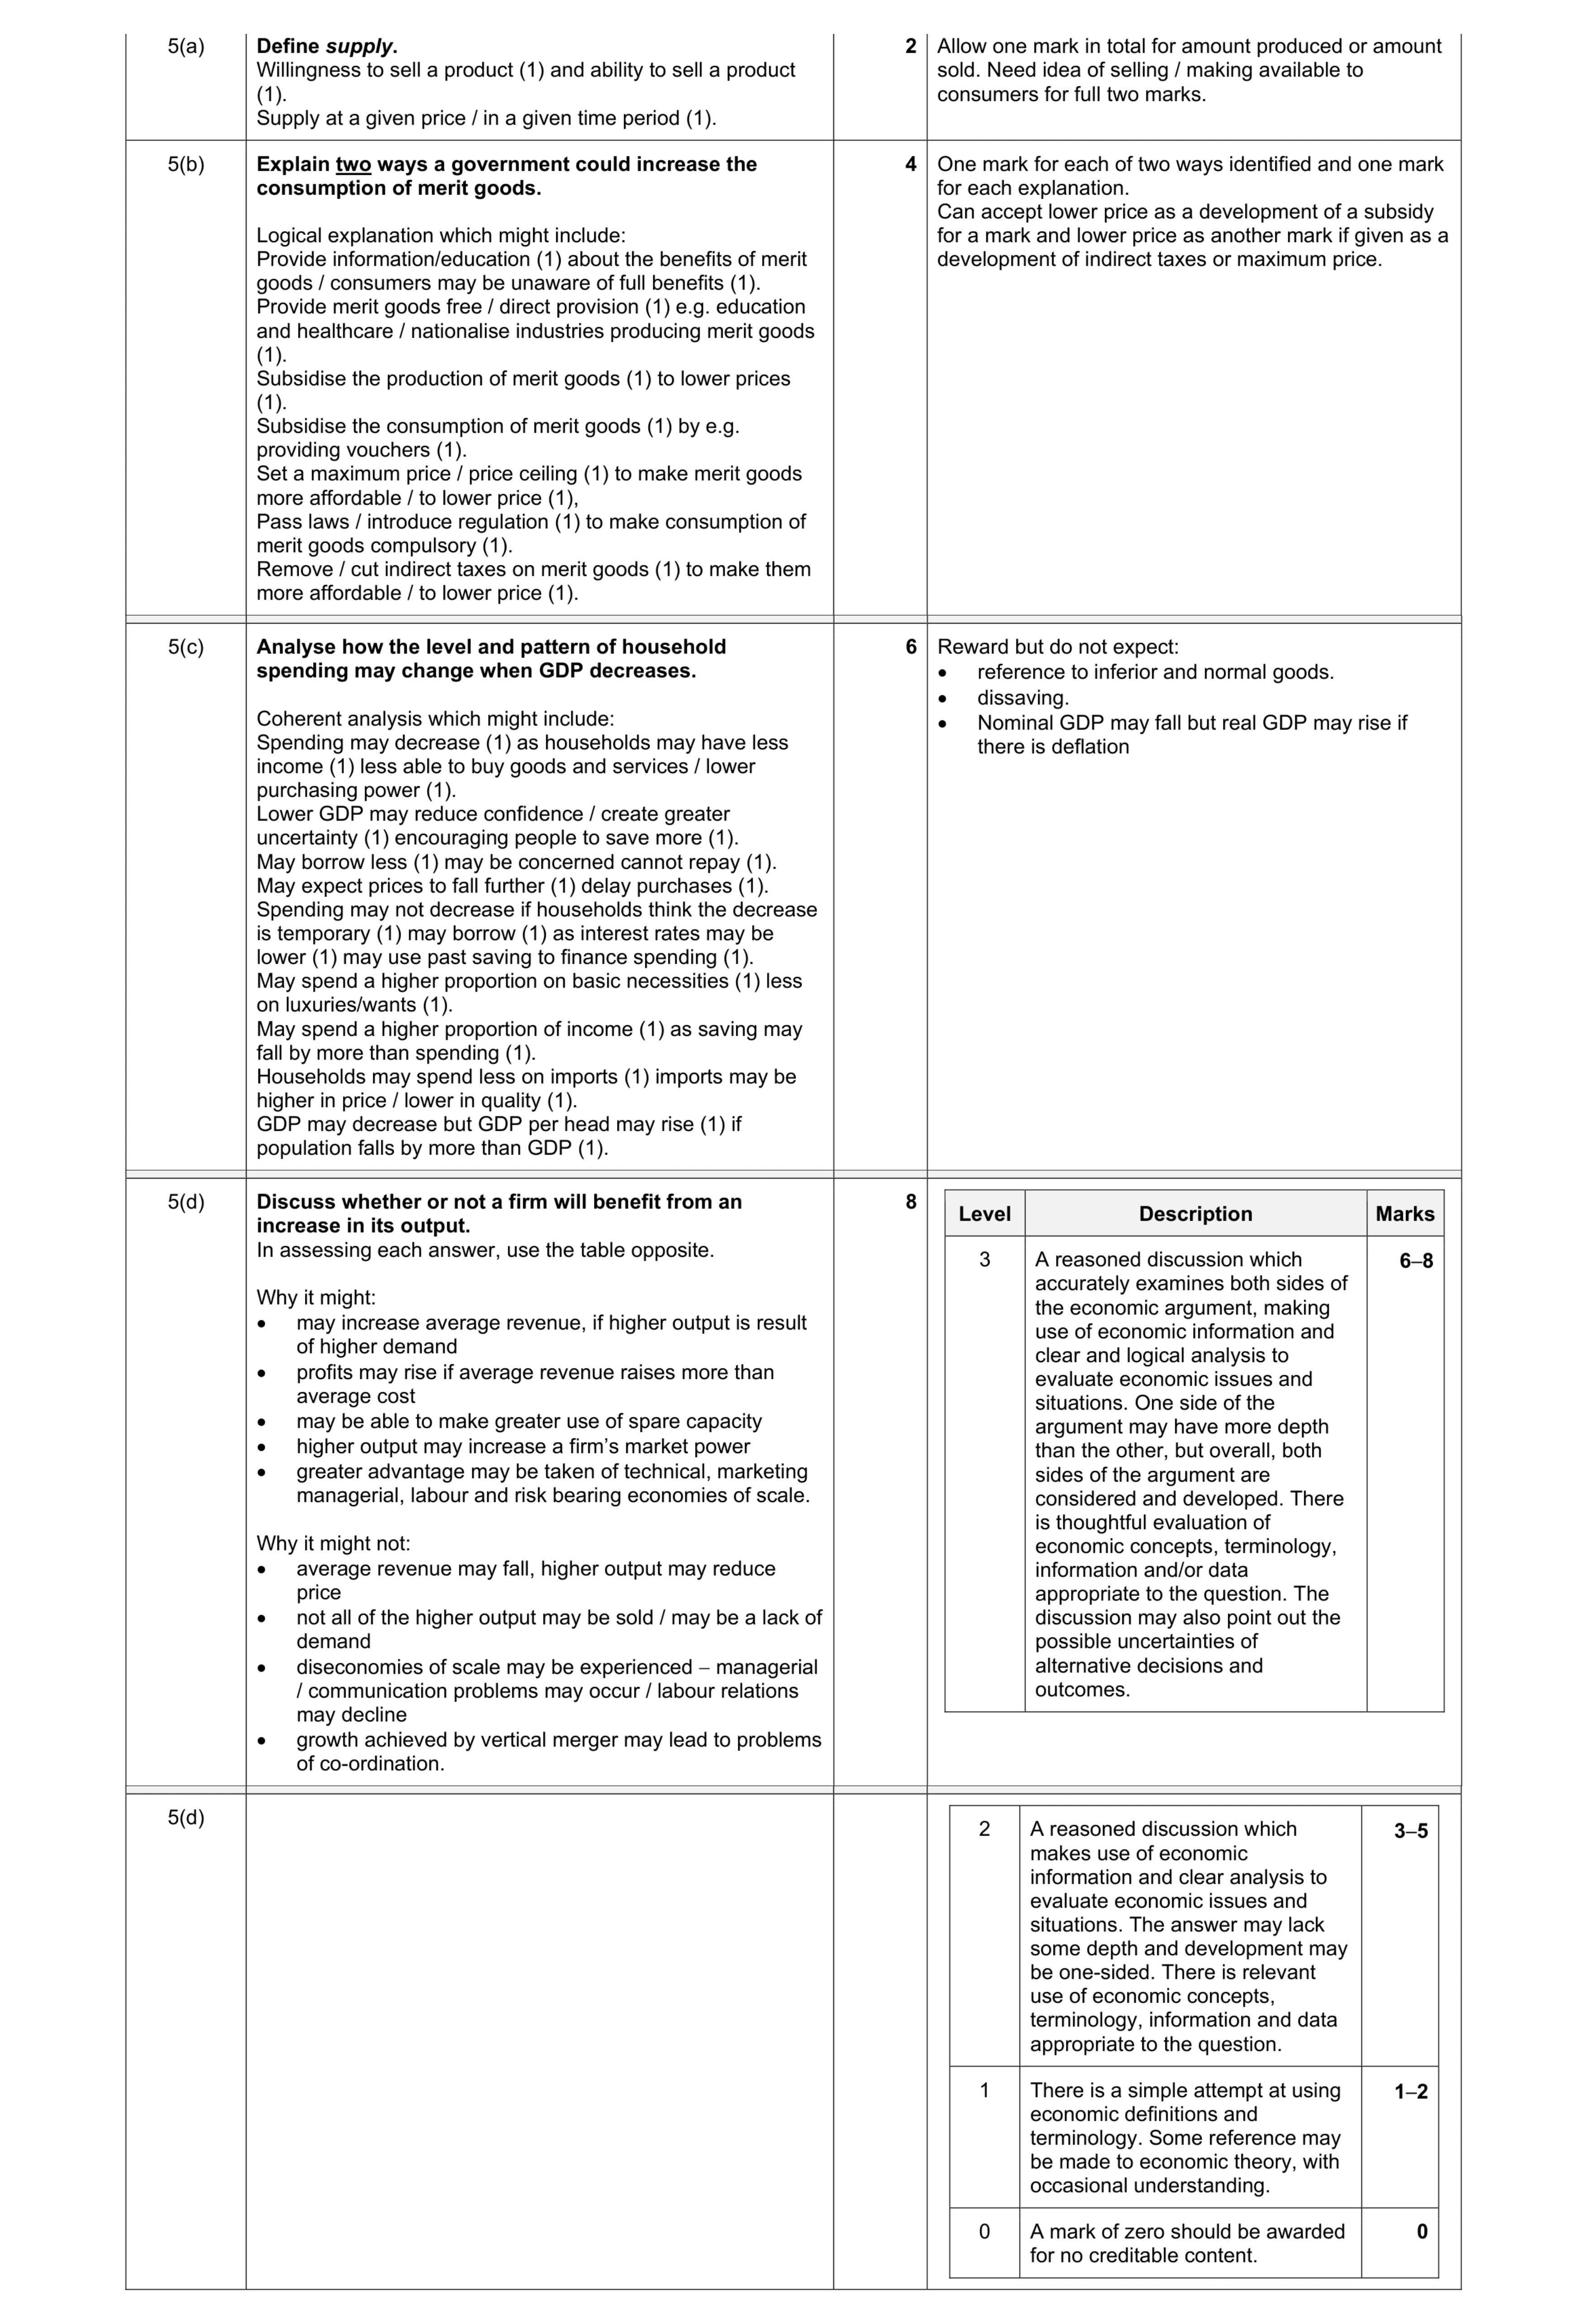 20
20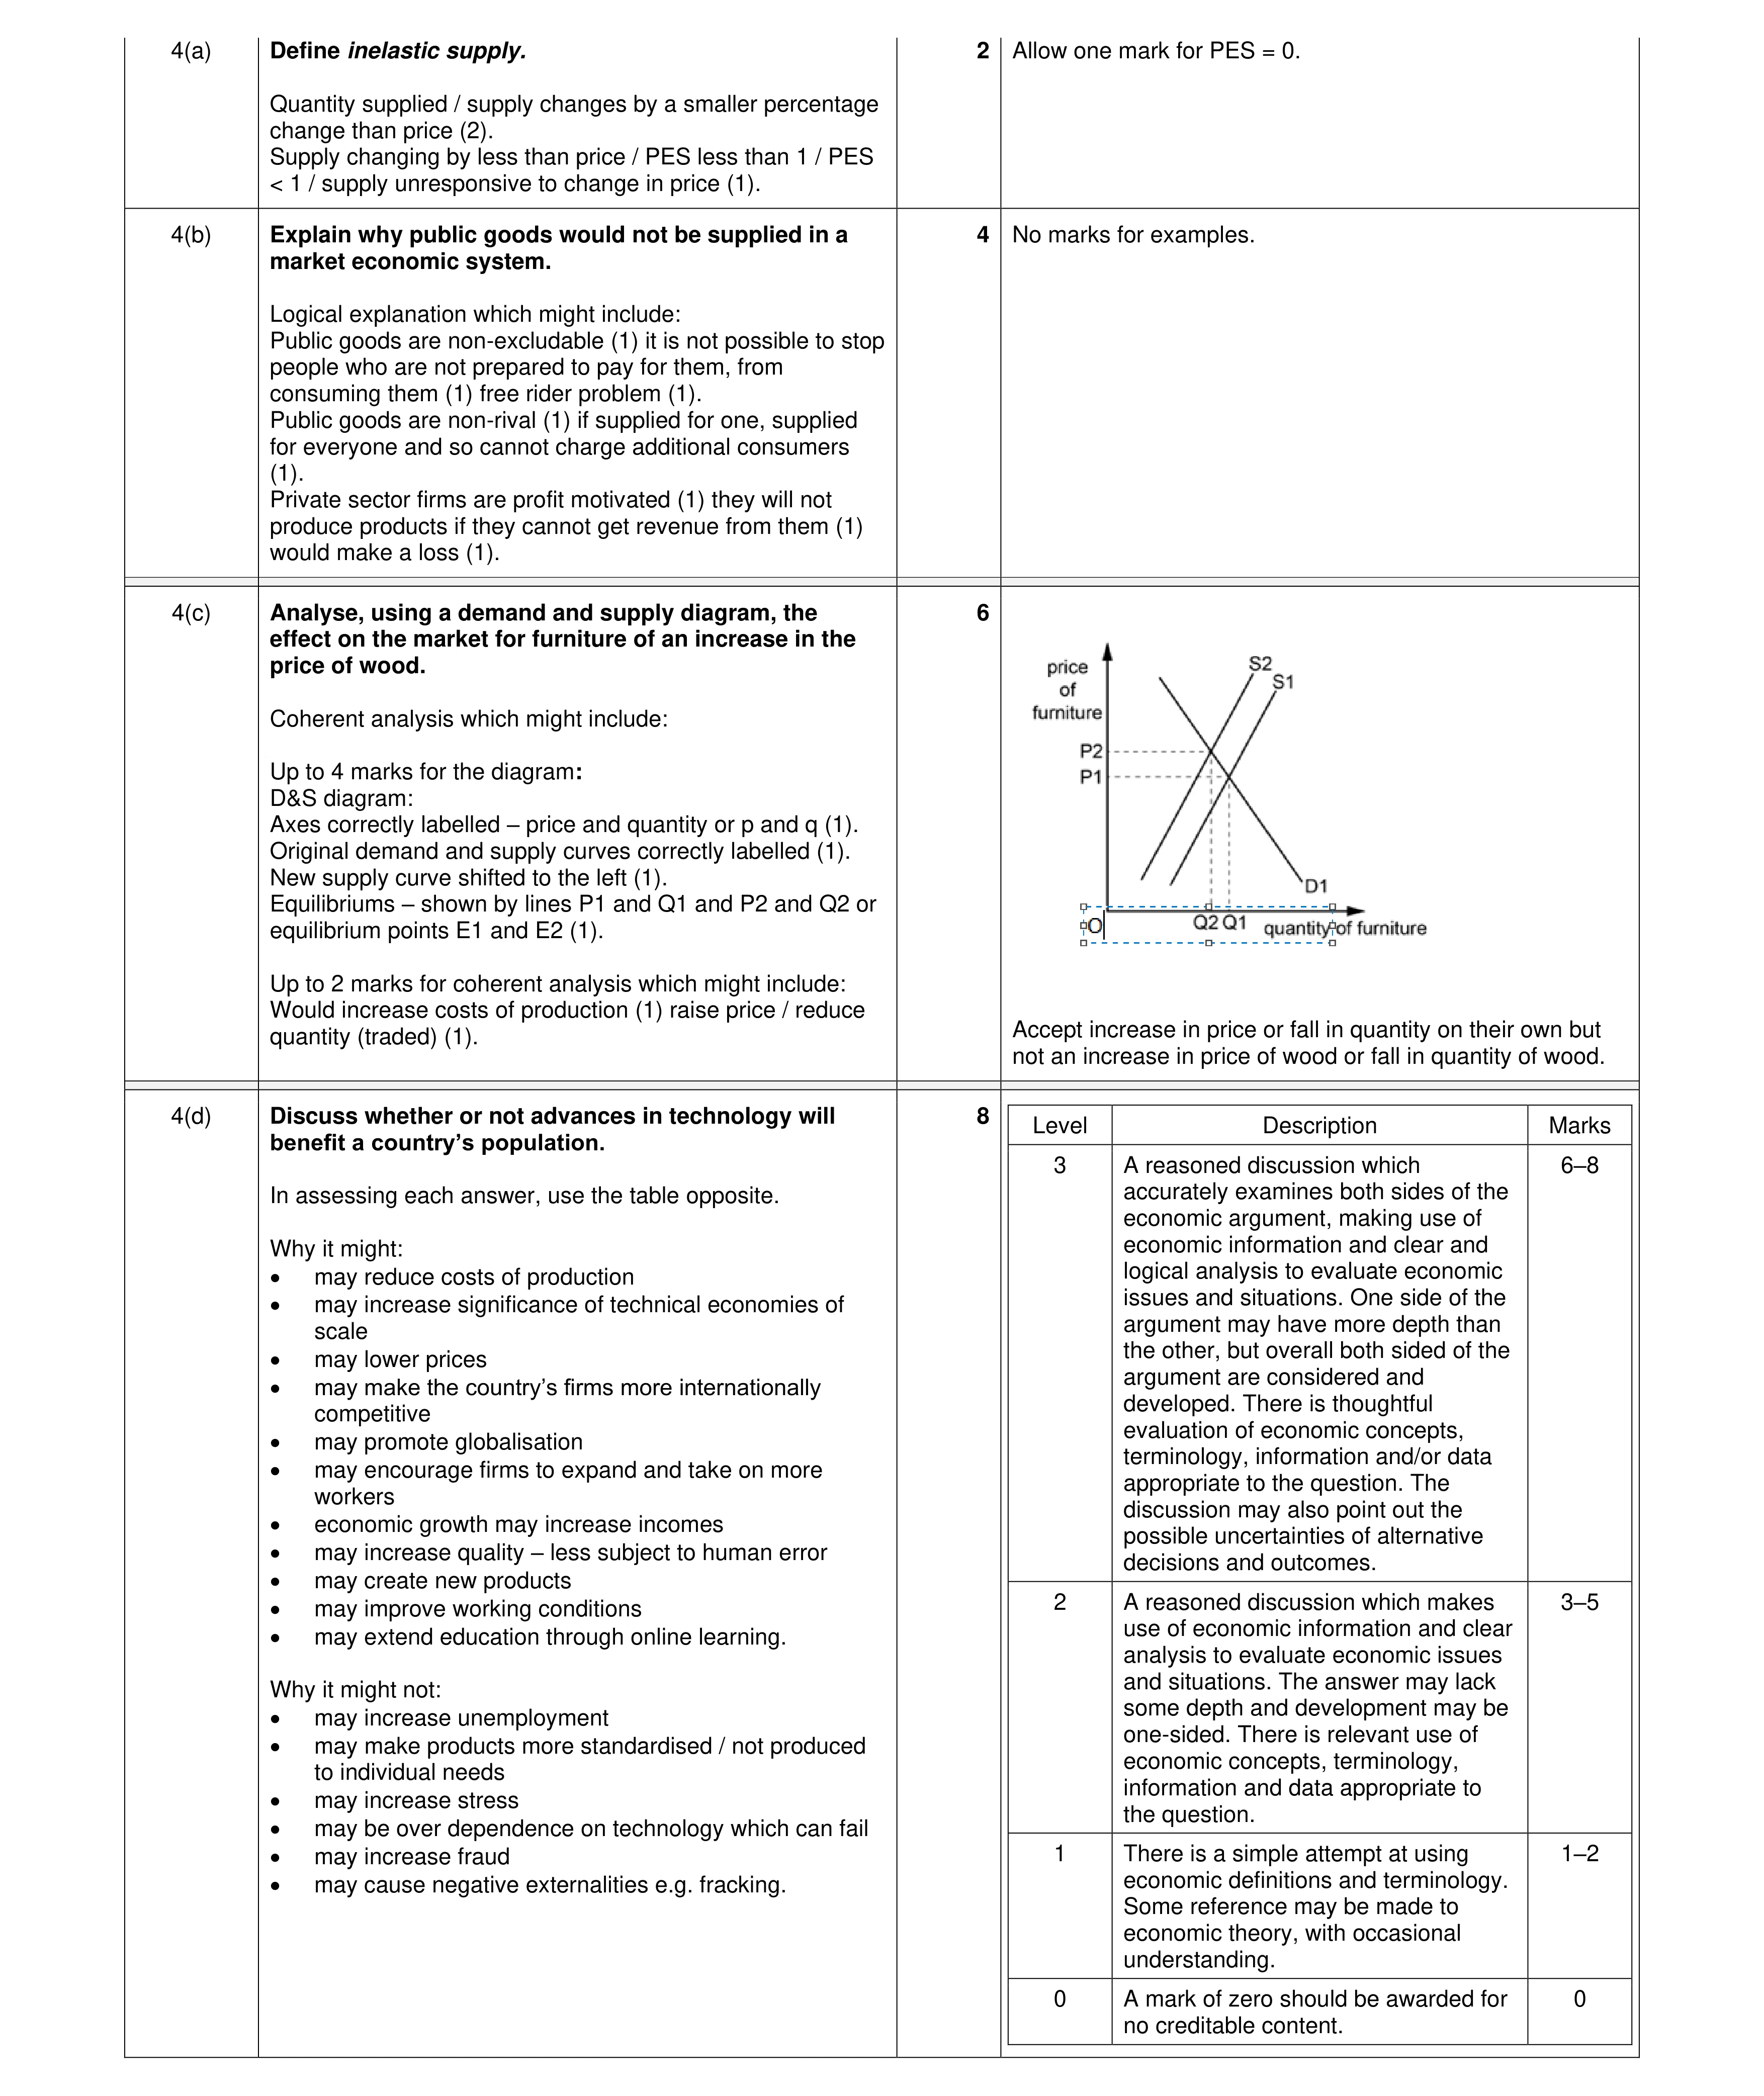 20
20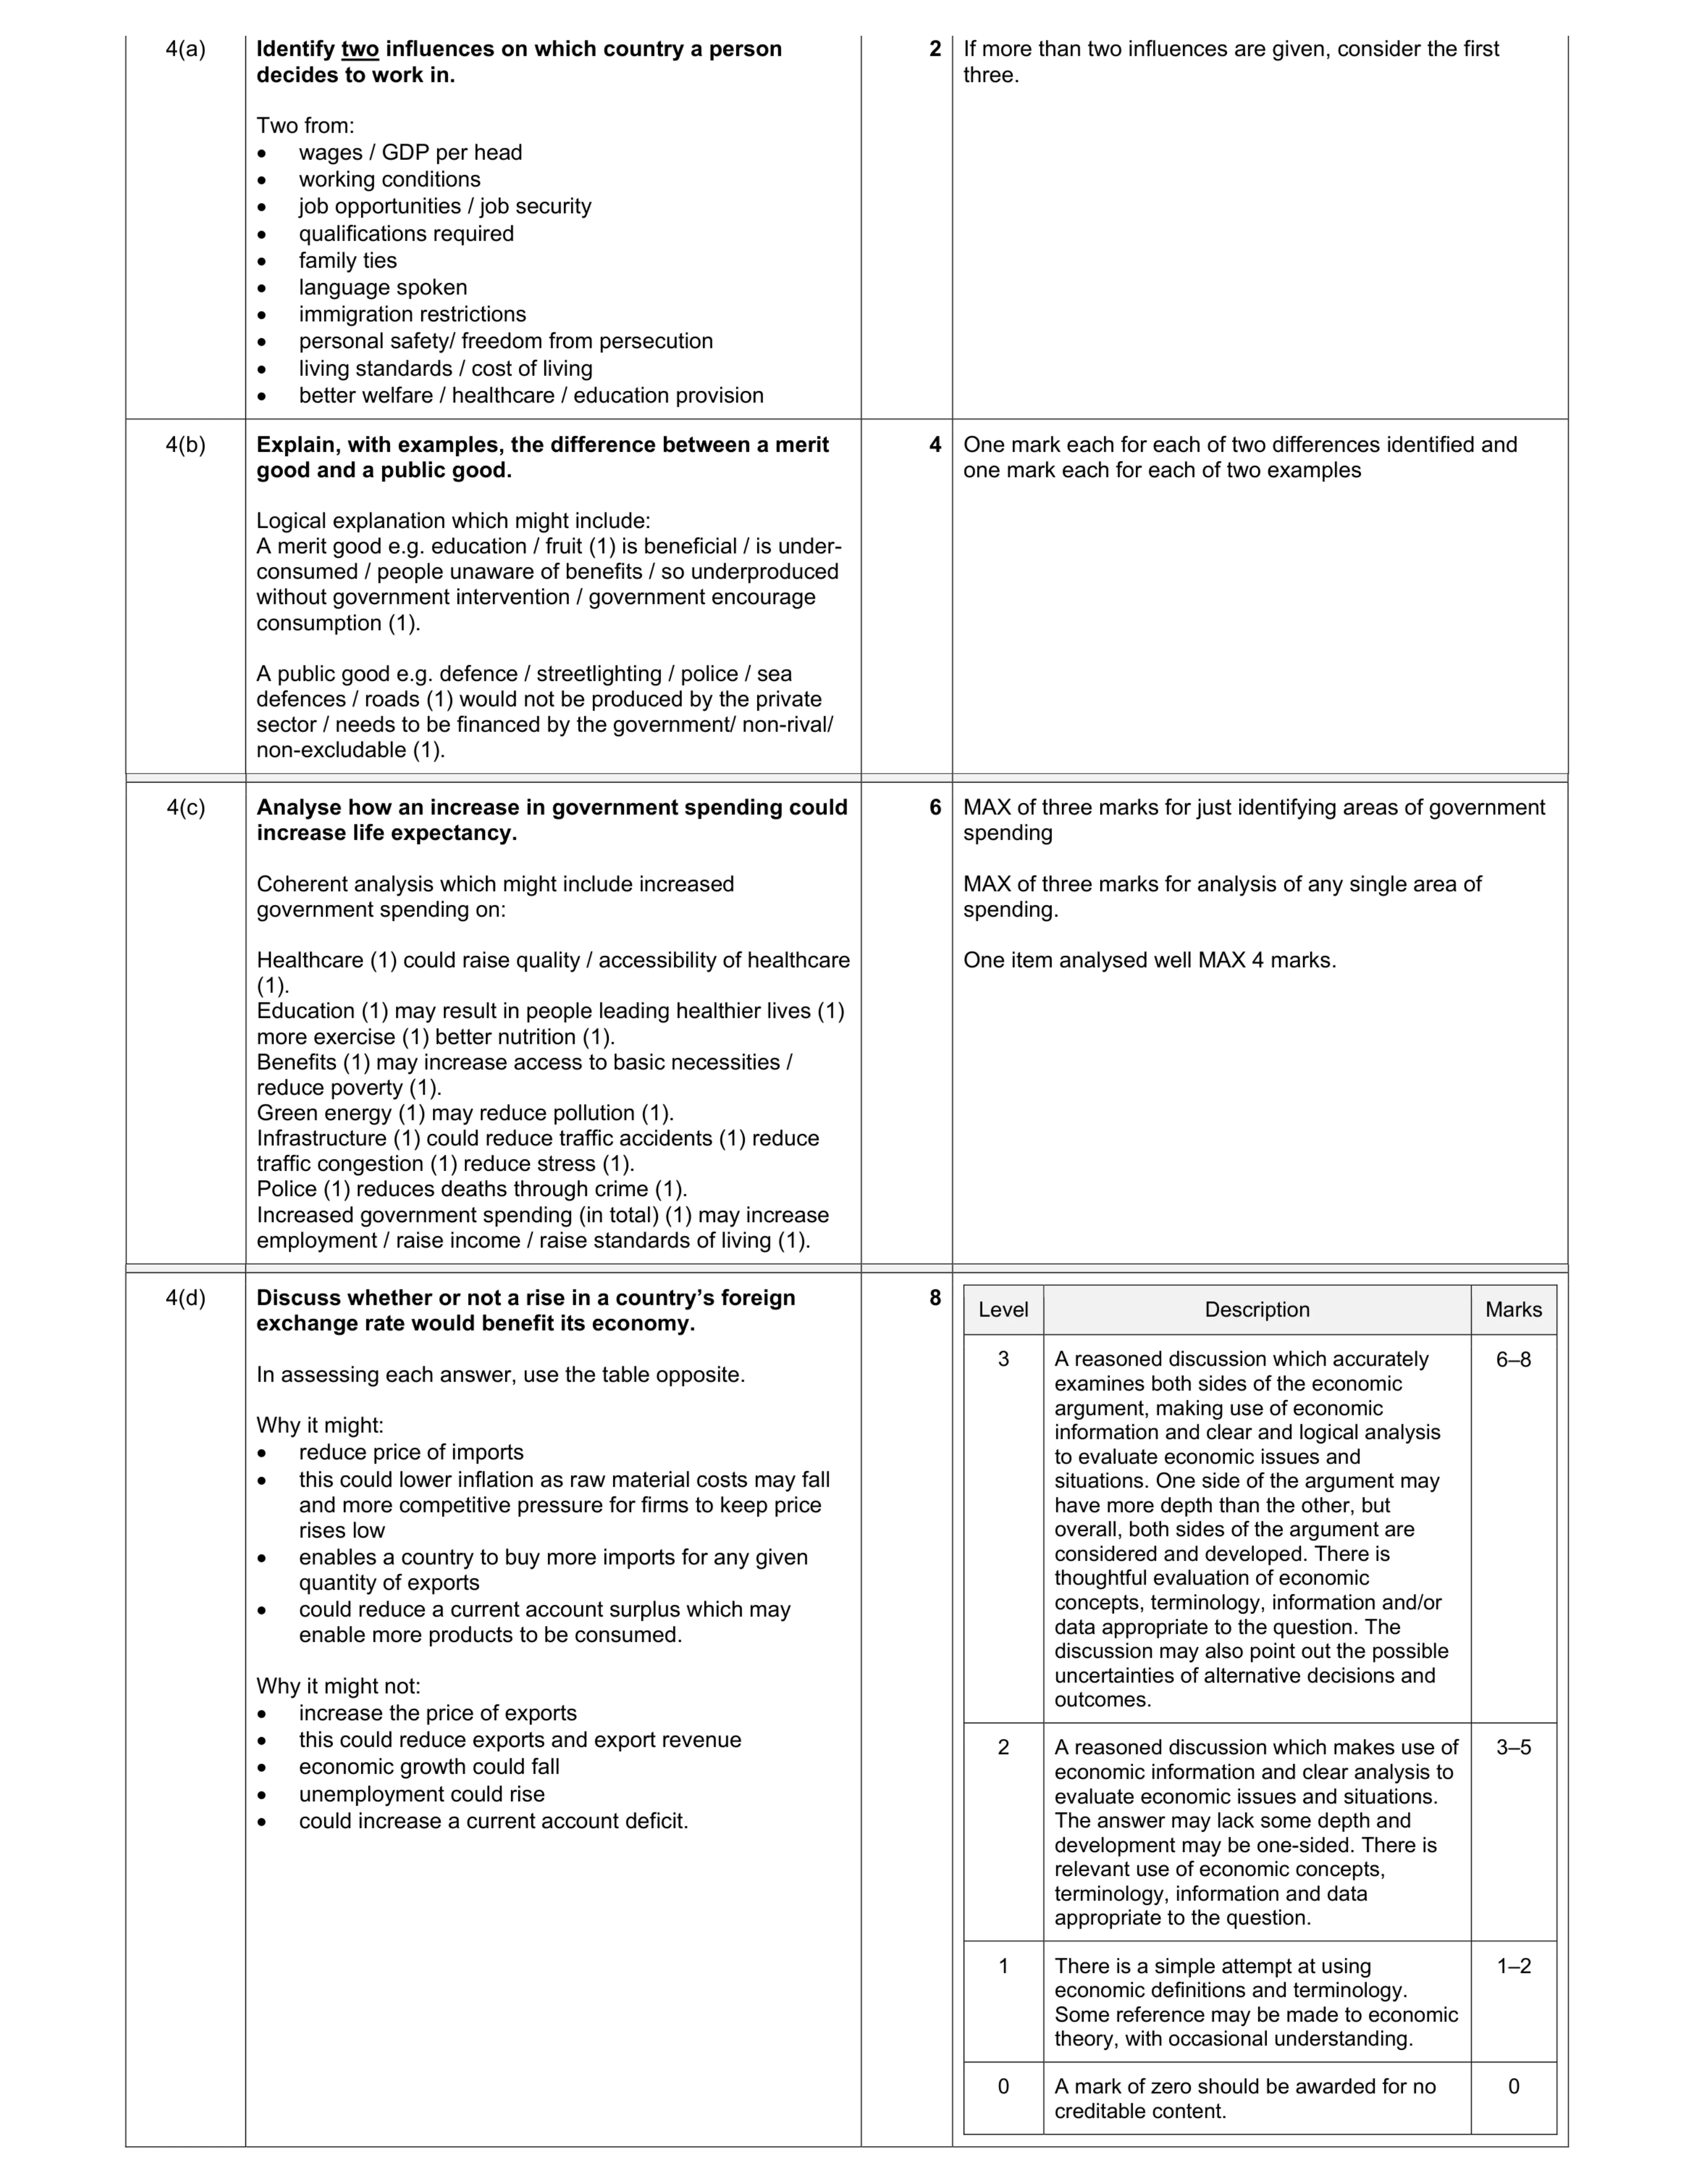 20
20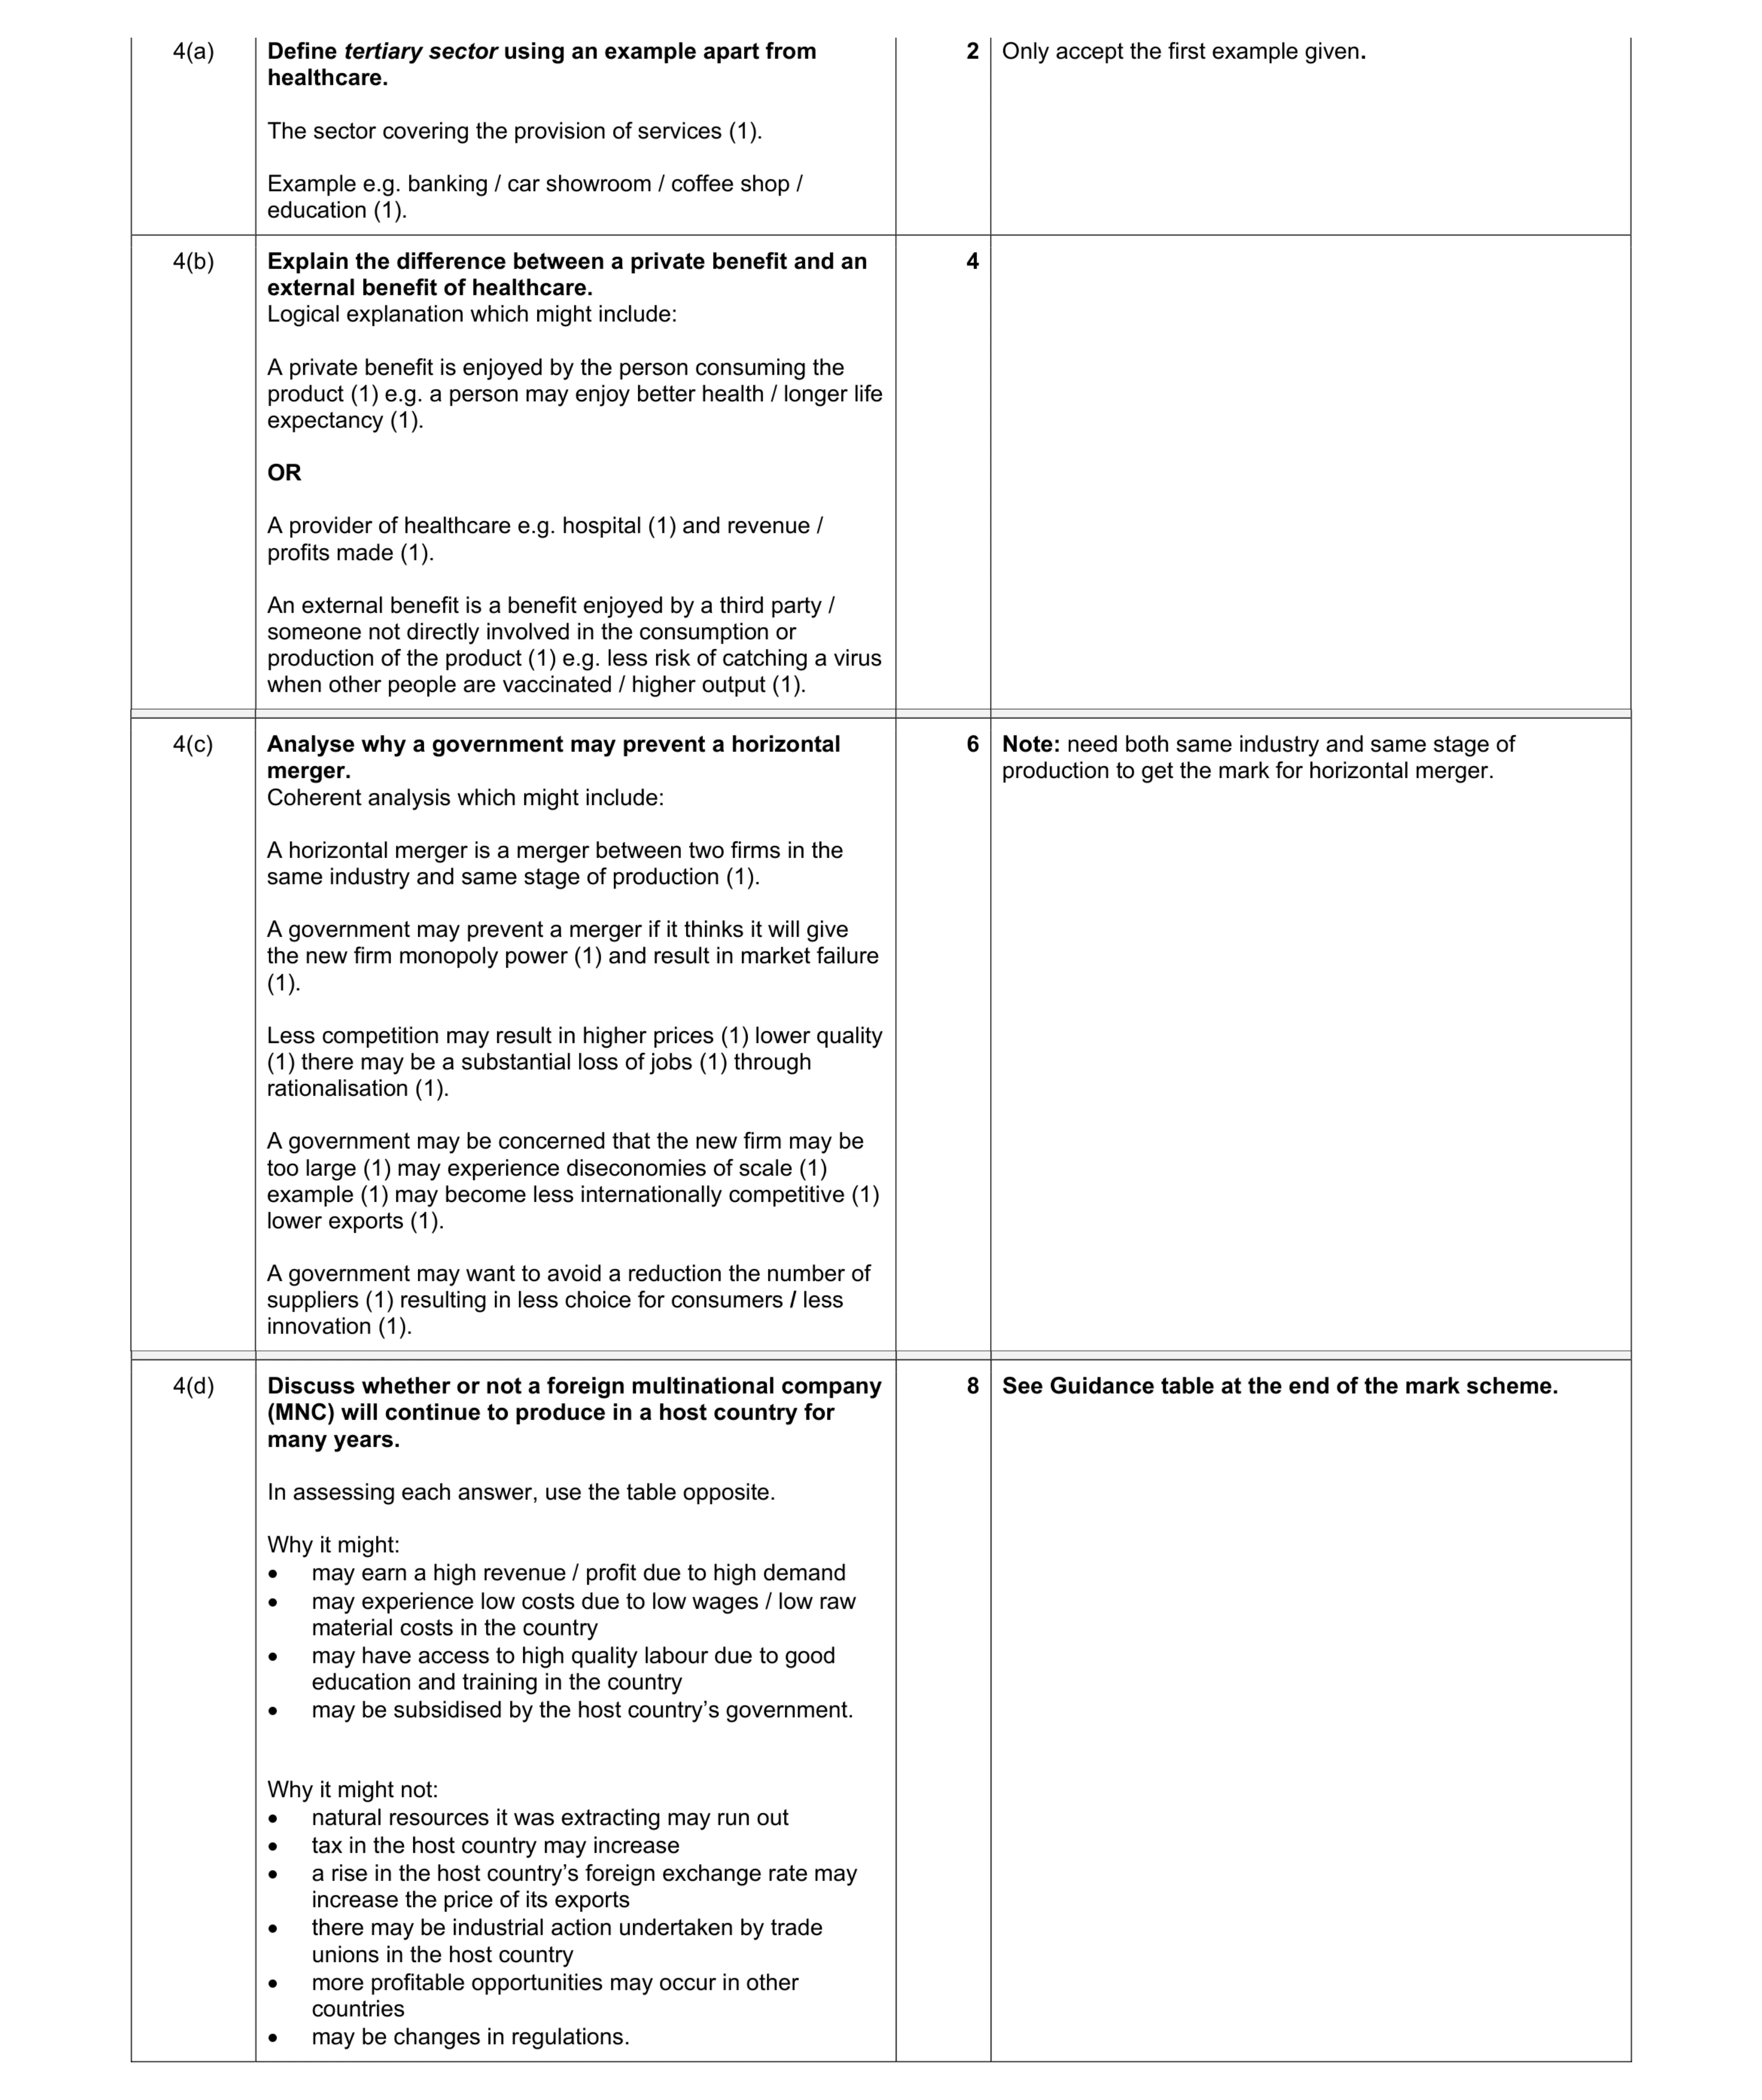 20
20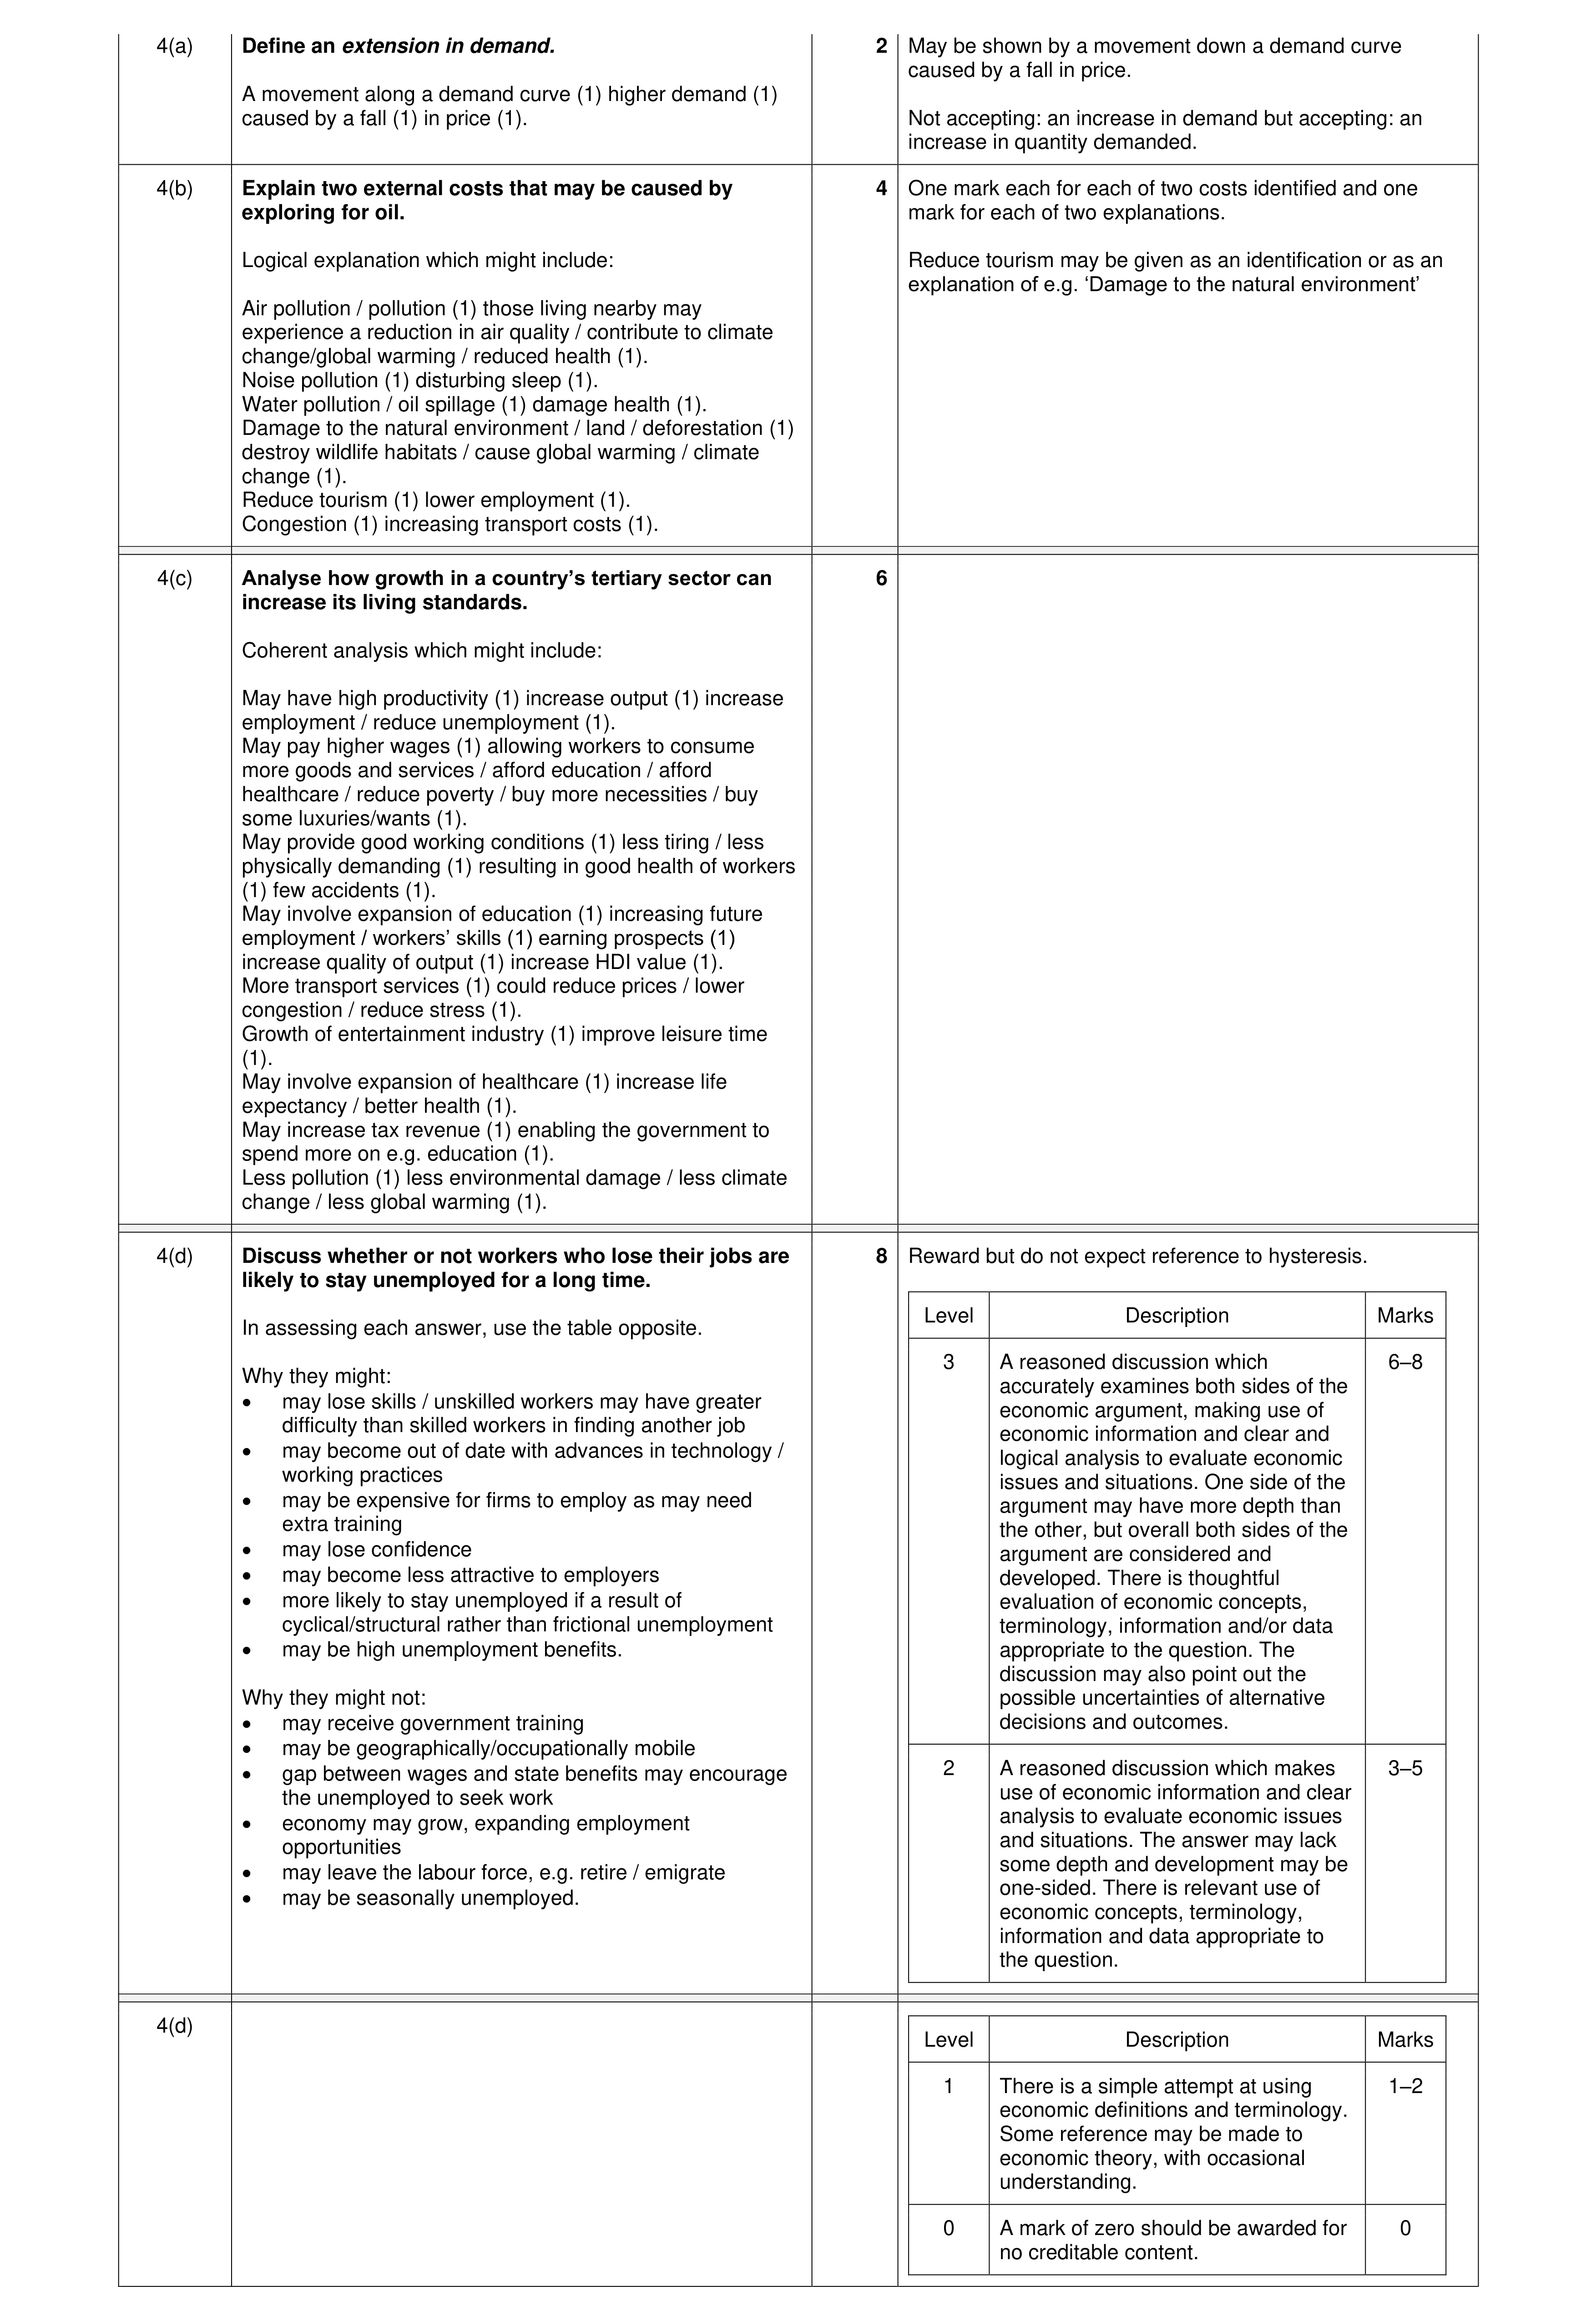 20
20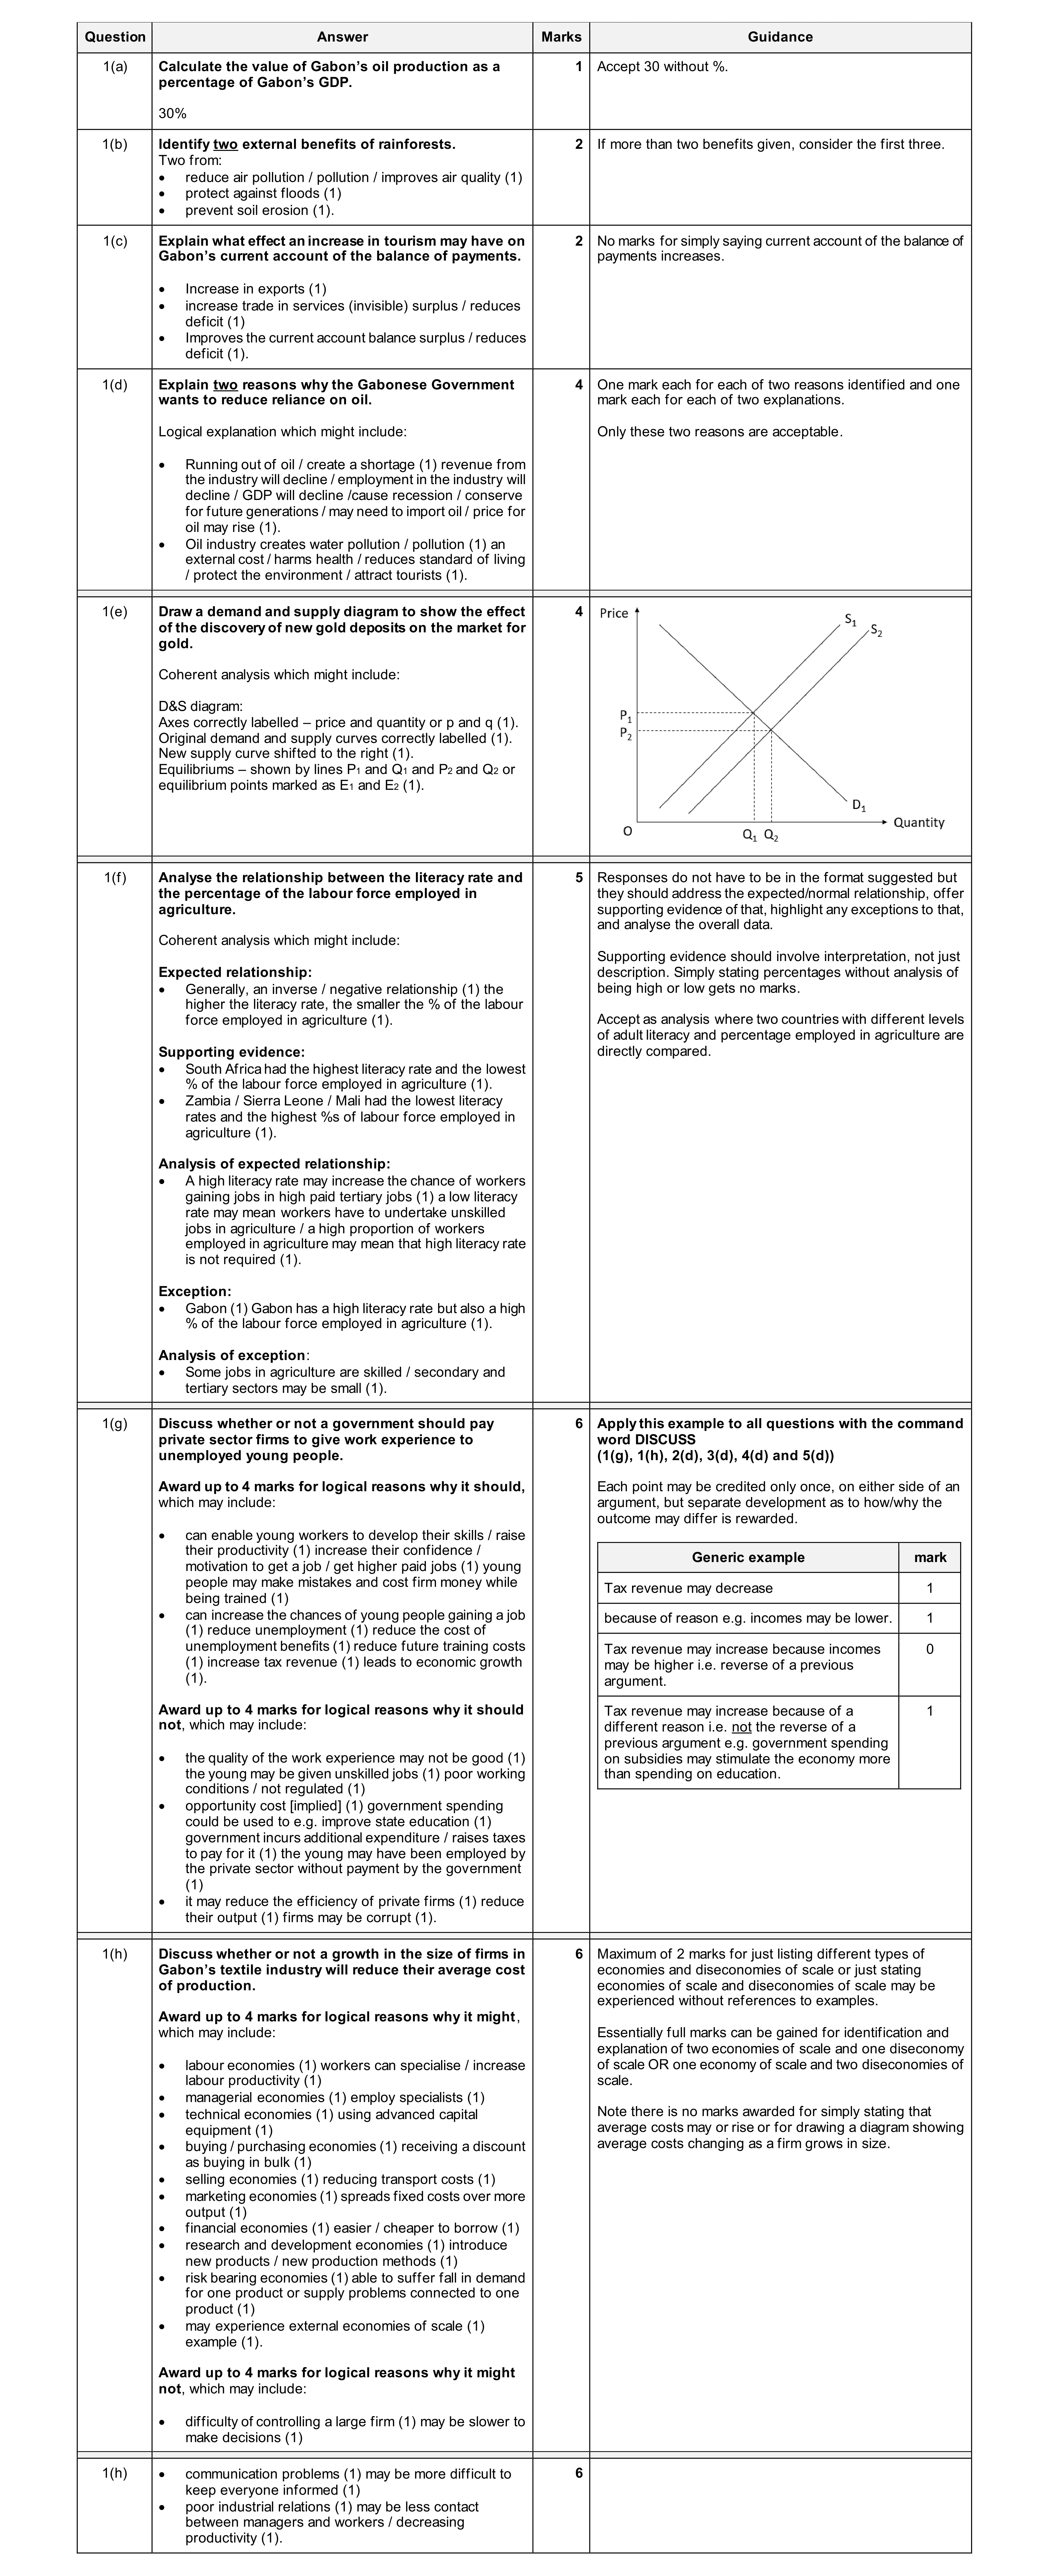 30
30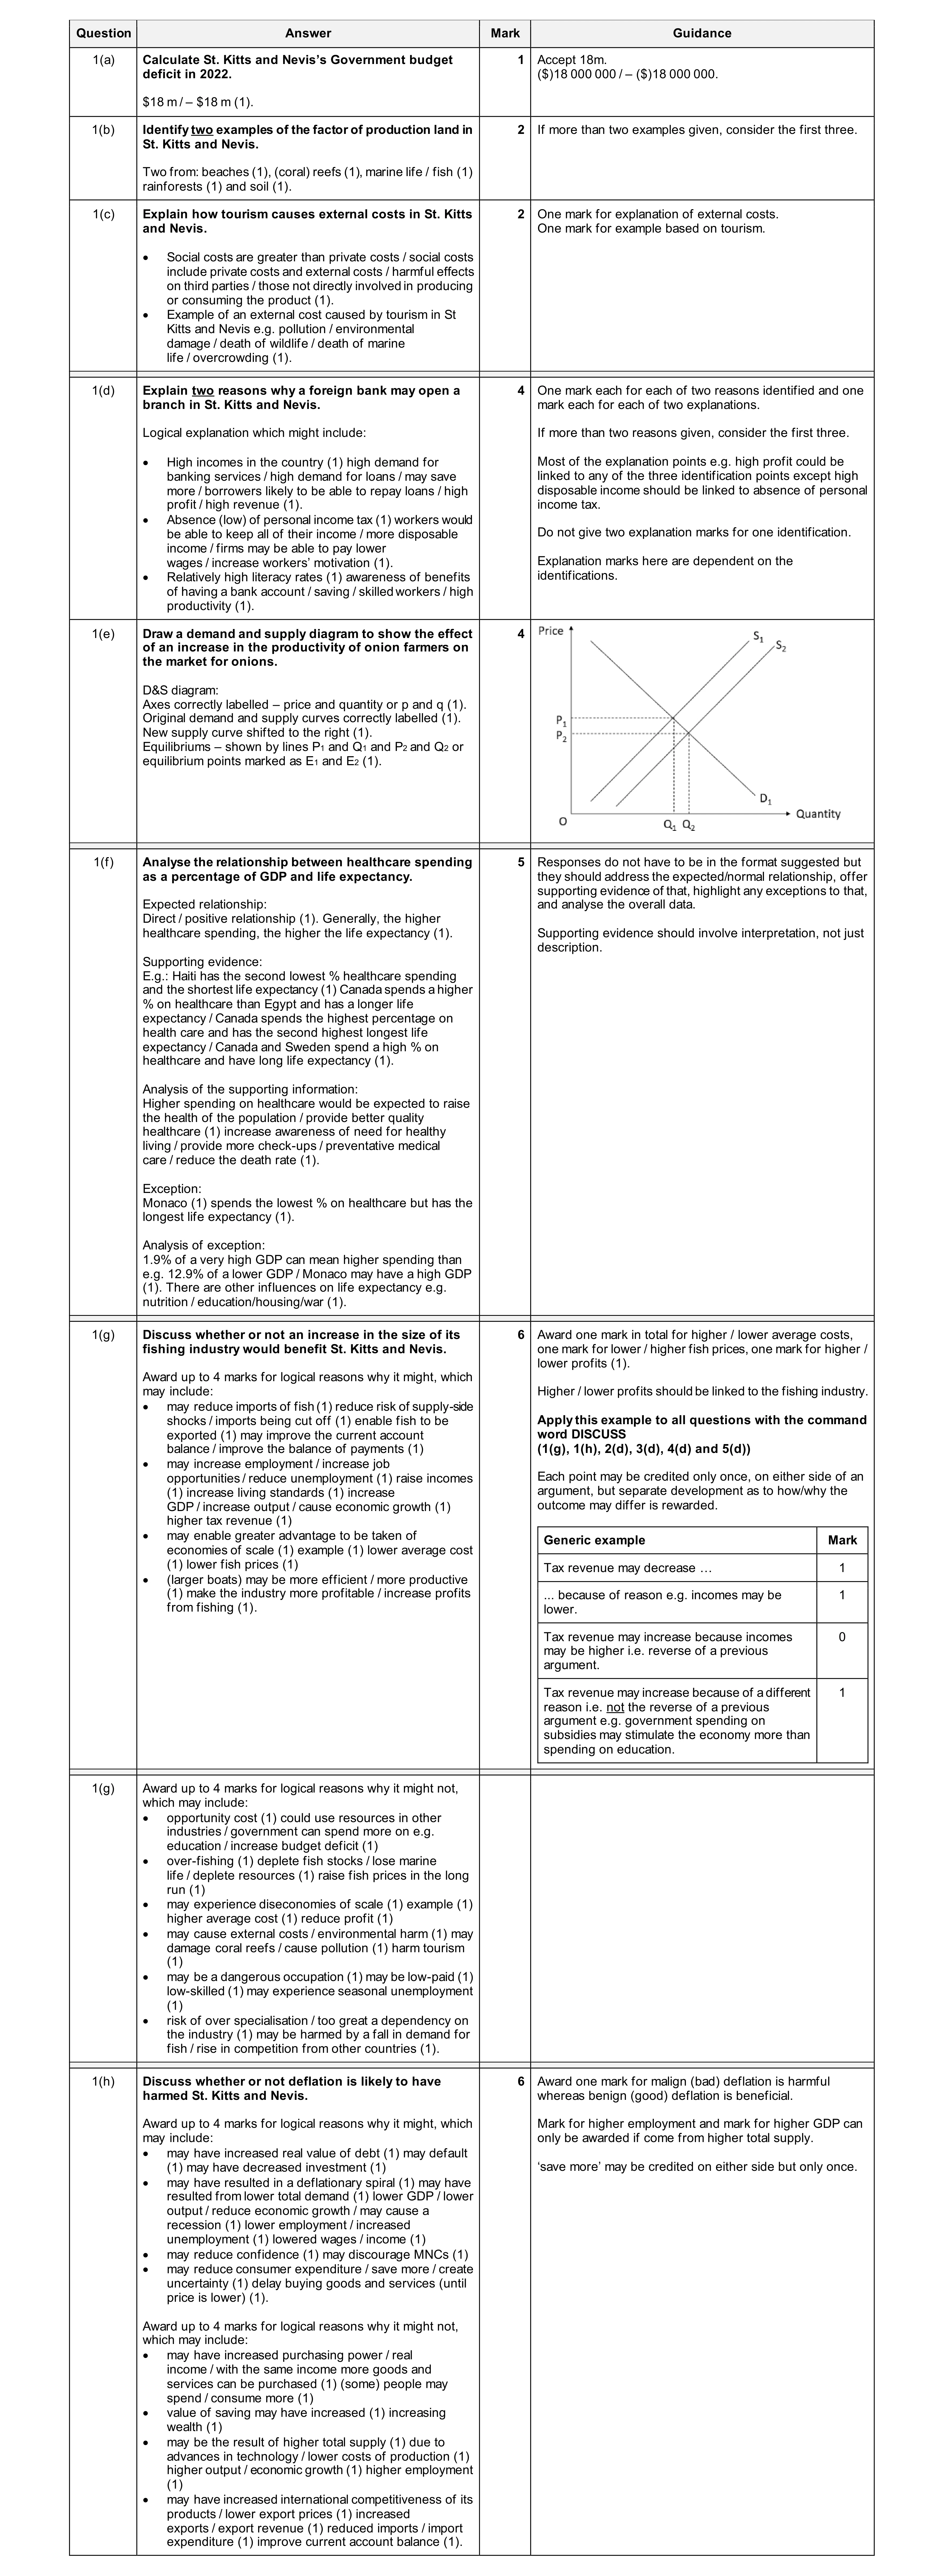 30
30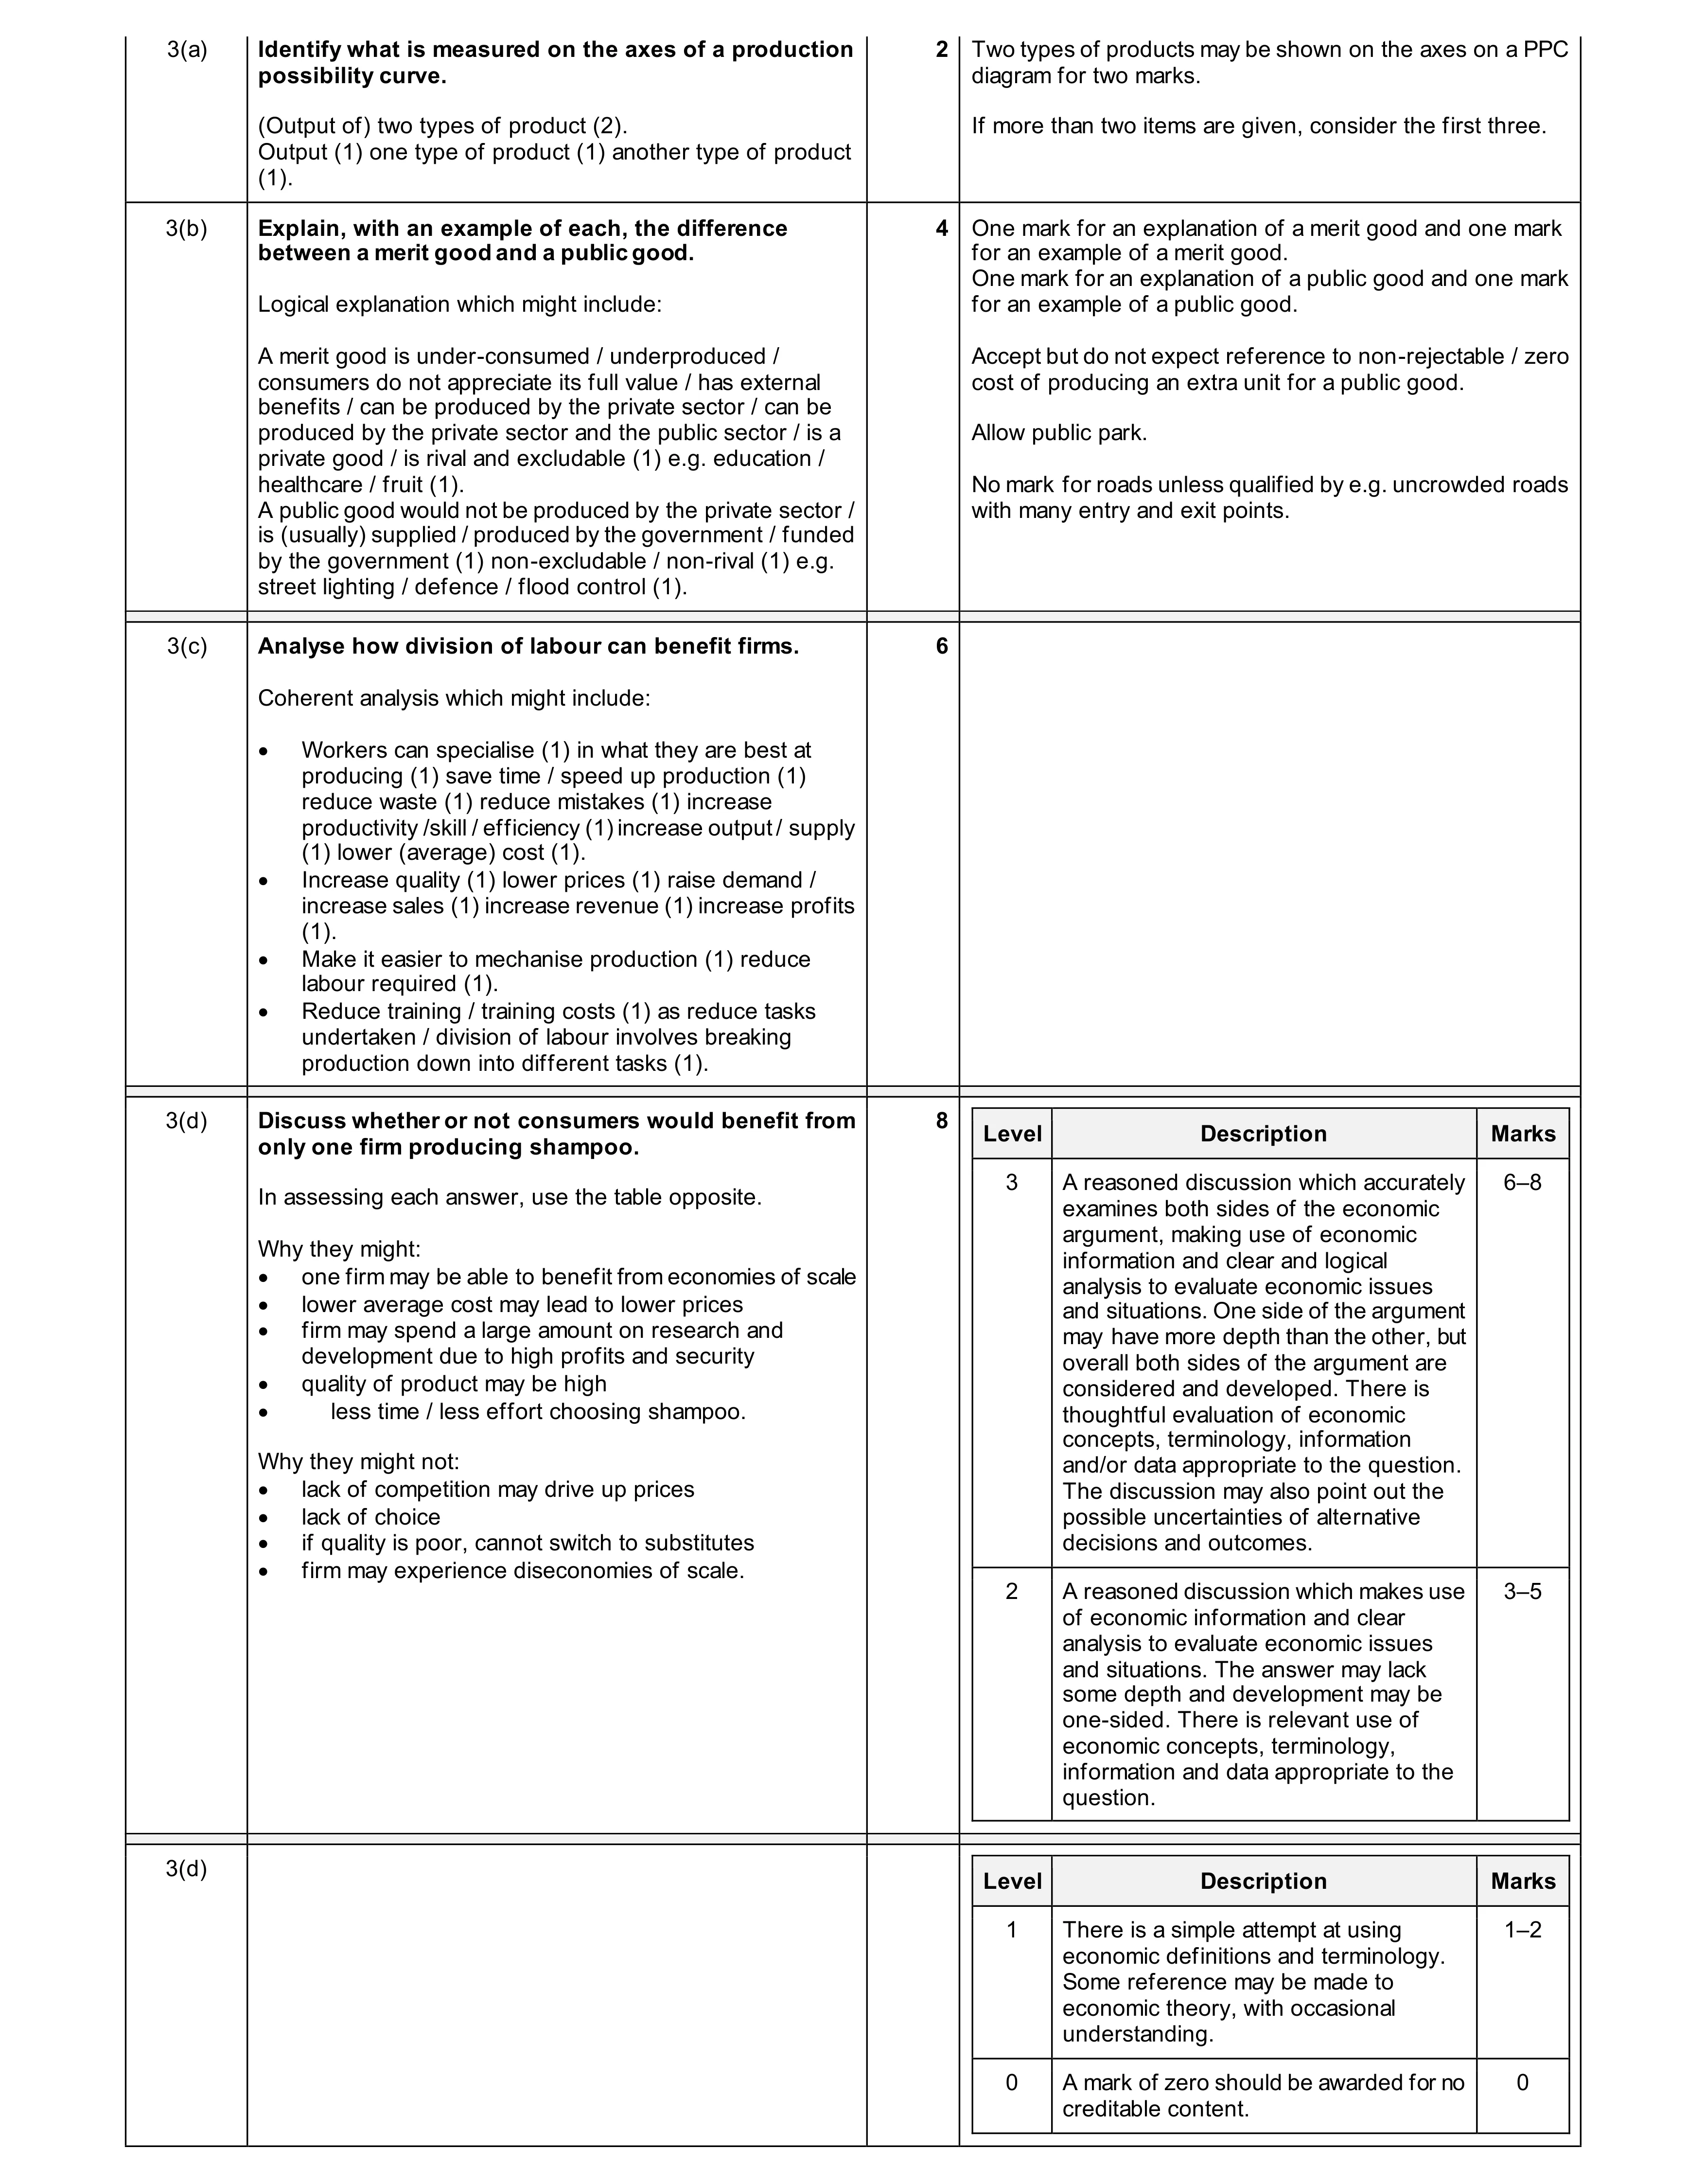 20
20