Cambridge IGCSE Biology (9-1) 0970 — 2025 May/June Paper 3 · Variant 2
0970/32/M/J/25 · 7 questions · 80 marks · ≈90 min
The question paper and its mark scheme, free to read here and free to download. This is Cambridge’s own paper, exactly as it was sat.
Question paper20 pages

Mark scheme14 pages
Answers below. Sit the paper first if you are practising.
Questions as text
Q1 · Photosynthesis occurs in leaves
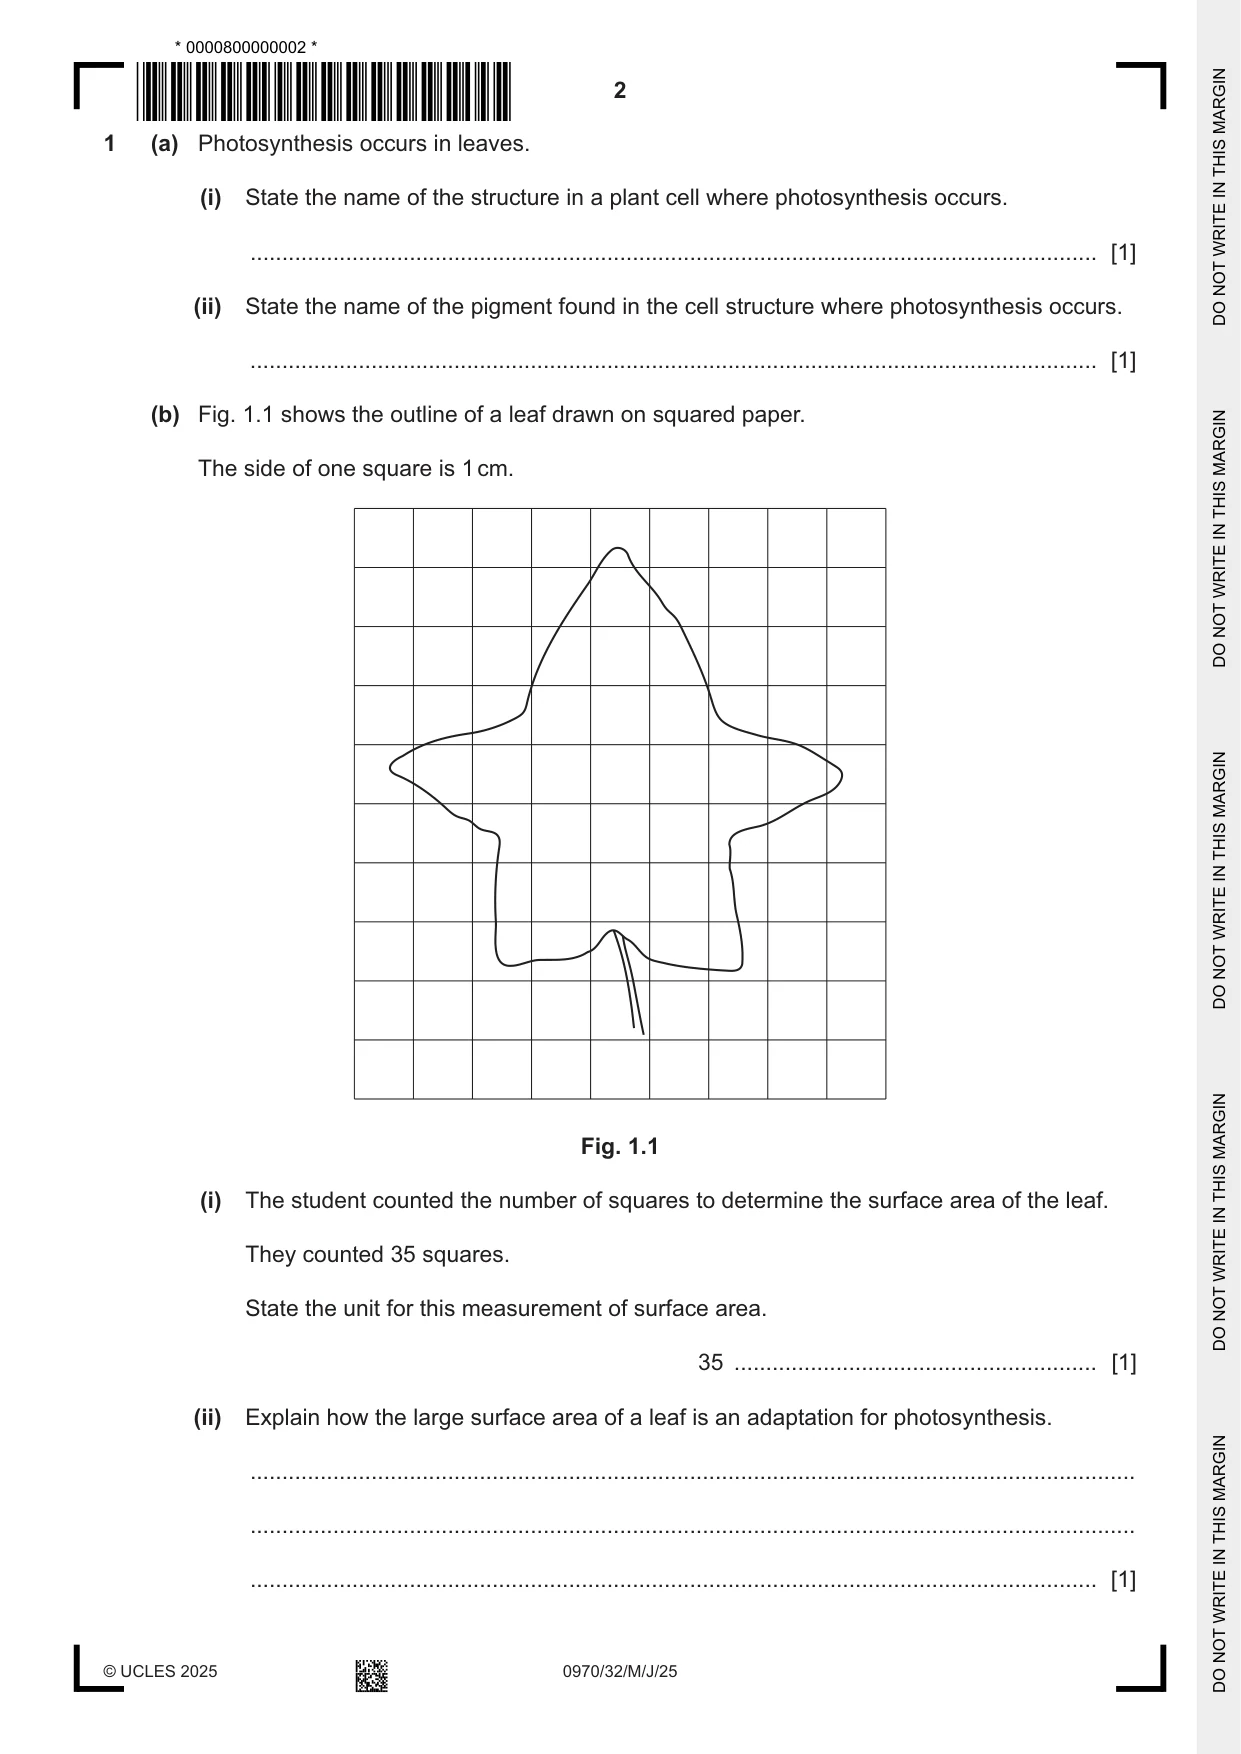
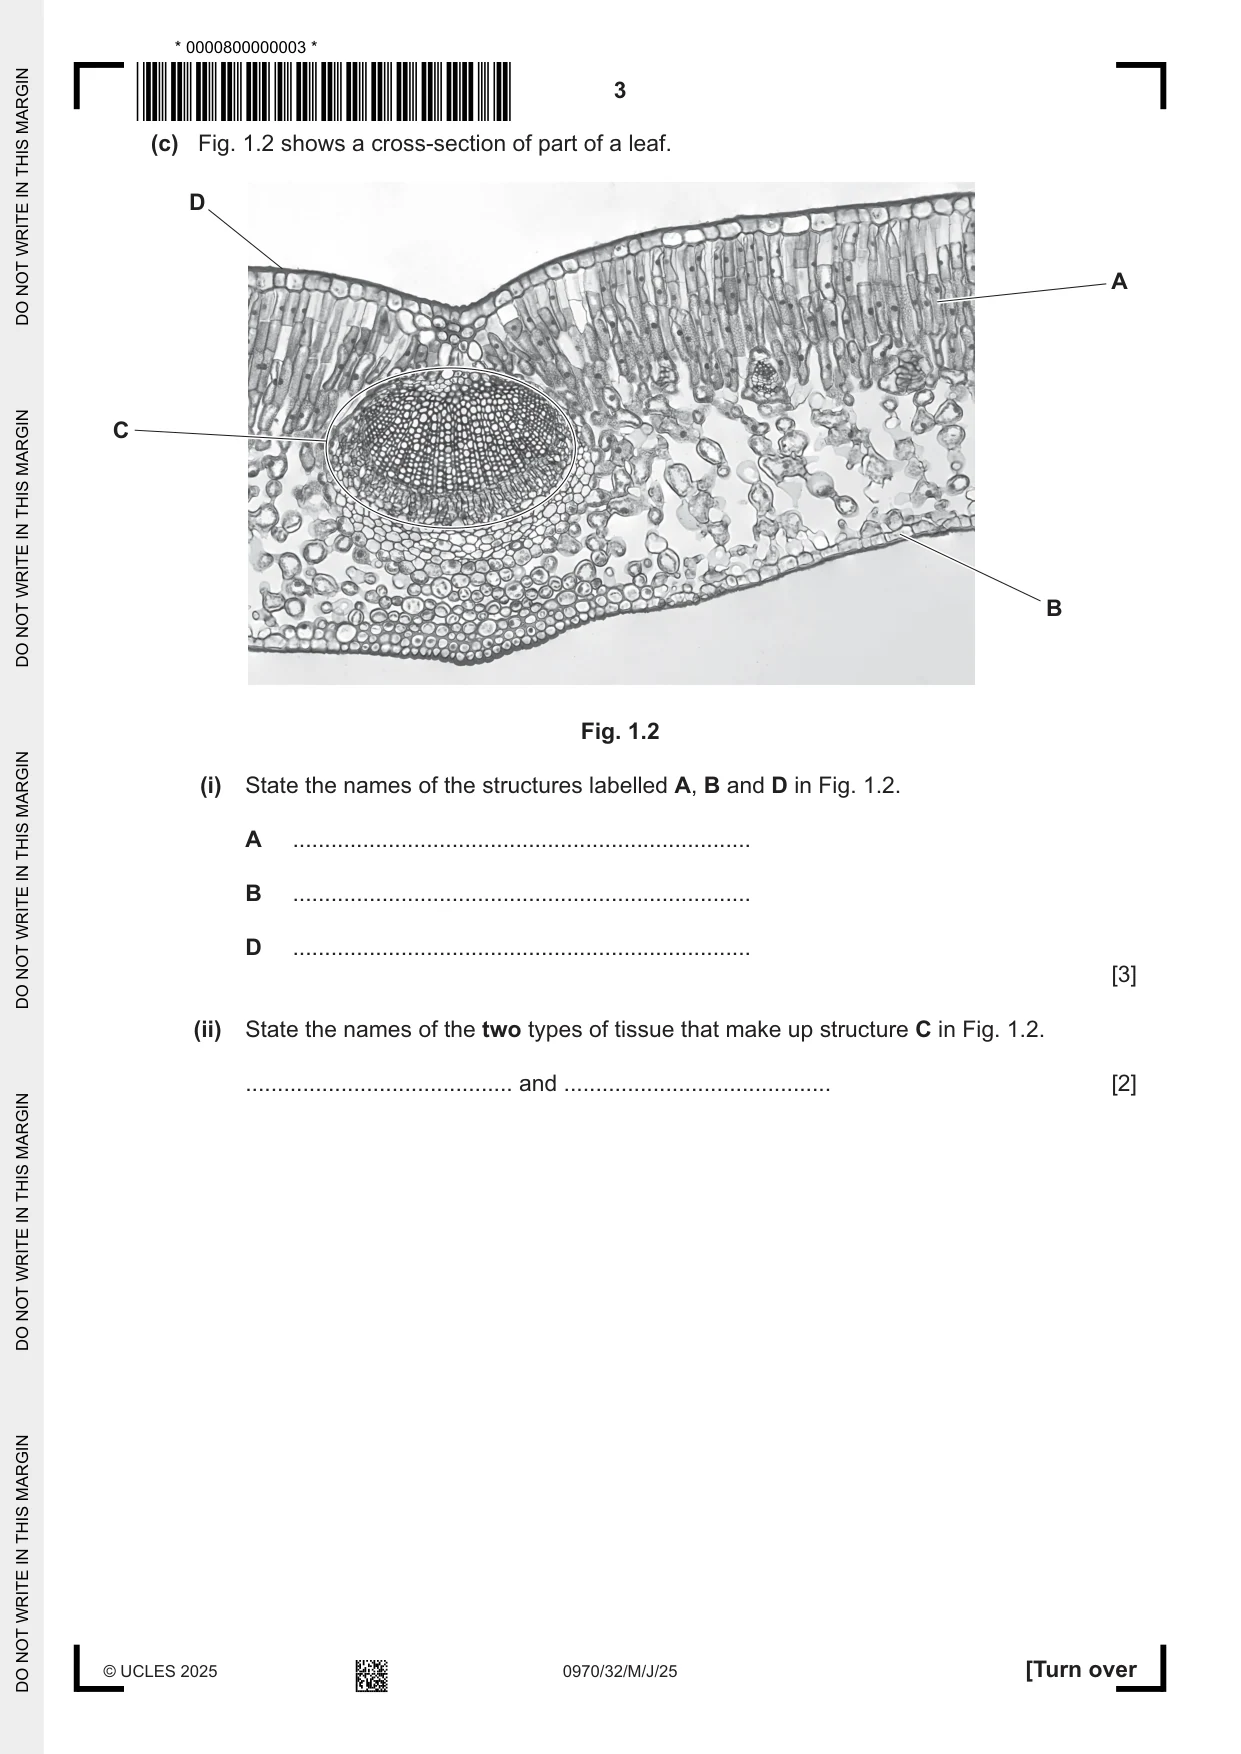
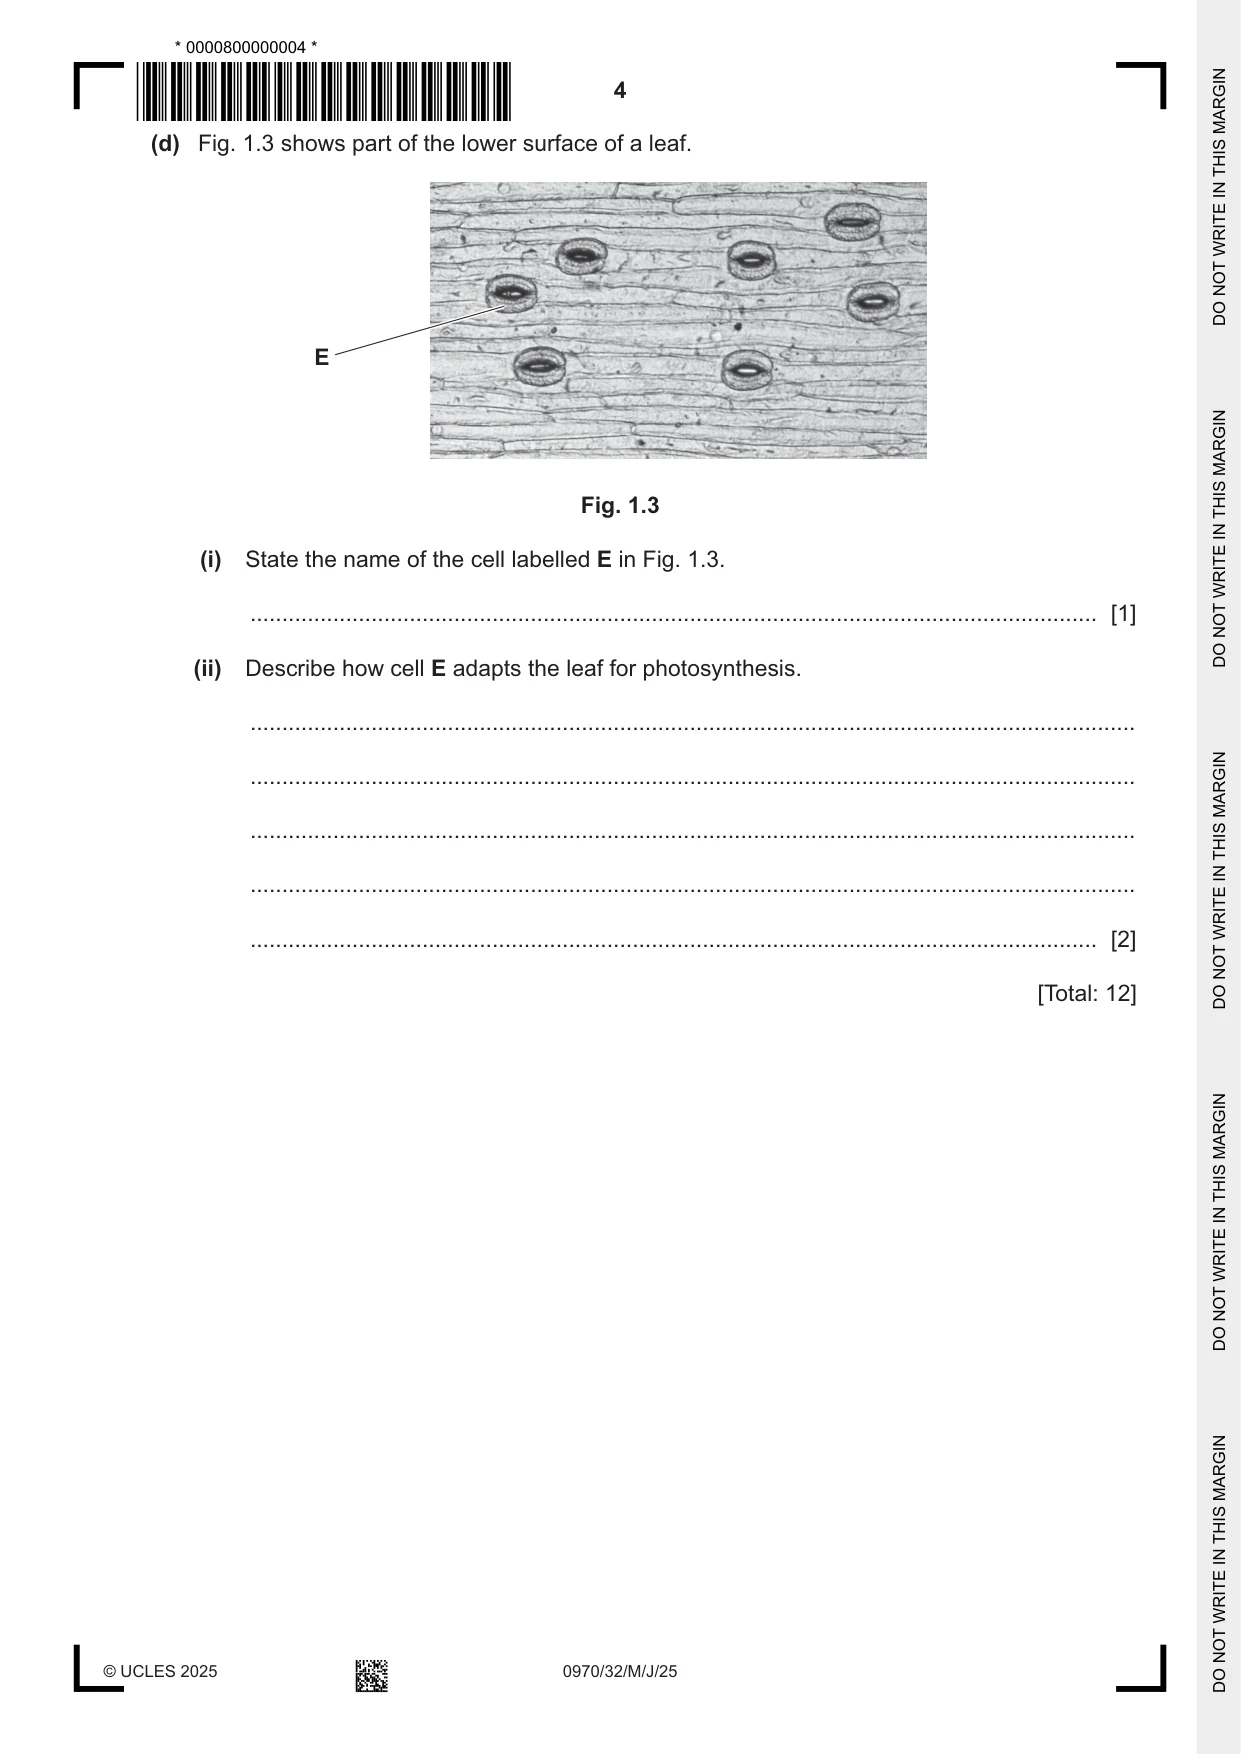
1 (a) Photosynthesis occurs in leaves. (i) State the name of the structure in a plant cell where photosynthesis occurs. ..................................................................................................................................... [1] (ii) State the name of the pigment found in the cell structure where photosynthesis occurs. ..................................................................................................................................... [1] (b) Fig. 1.1 shows the outline of a leaf drawn on squared paper. The side of one square is 1 cm. Fig. 1.1 (i) The student counted the number of squares to determine the surface area of the leaf. They counted 35 squares. State the unit for this measurement of surface area. 35 ......................................................... [1] (ii) Explain how the large surface area of a leaf is an adaptation for photosynthesis. ........................................................................................................................................... ........................................................................................................................................... ..................................................................................................................................... [1] (c) Fig. 1.2 shows a cross‑section of part of a leaf. D A C B Fig. 1.2 (i) State the names of the structures labelled A, B and D in Fig. 1.2. A ........................................................................ B ........................................................................ D ........................................................................ [3] (ii) State the names of the two types of tissue that make up structure C in Fig. 1.2. .......................................... and .......................................... [2] (d) Fig. 1.3 shows part of the lower surface of a leaf. E Fig. 1.3 (i) State the name of the cell labelled E in Fig. 1.3. ..................................................................................................................................... [1] (ii) Describe how cell E adapts the leaf for photosynthesis. ........................................................................................................................................... ........................................................................................................................................... ........................................................................................................................................... ........................................................................................................................................... ..................................................................................................................................... [2] [Total: 12]
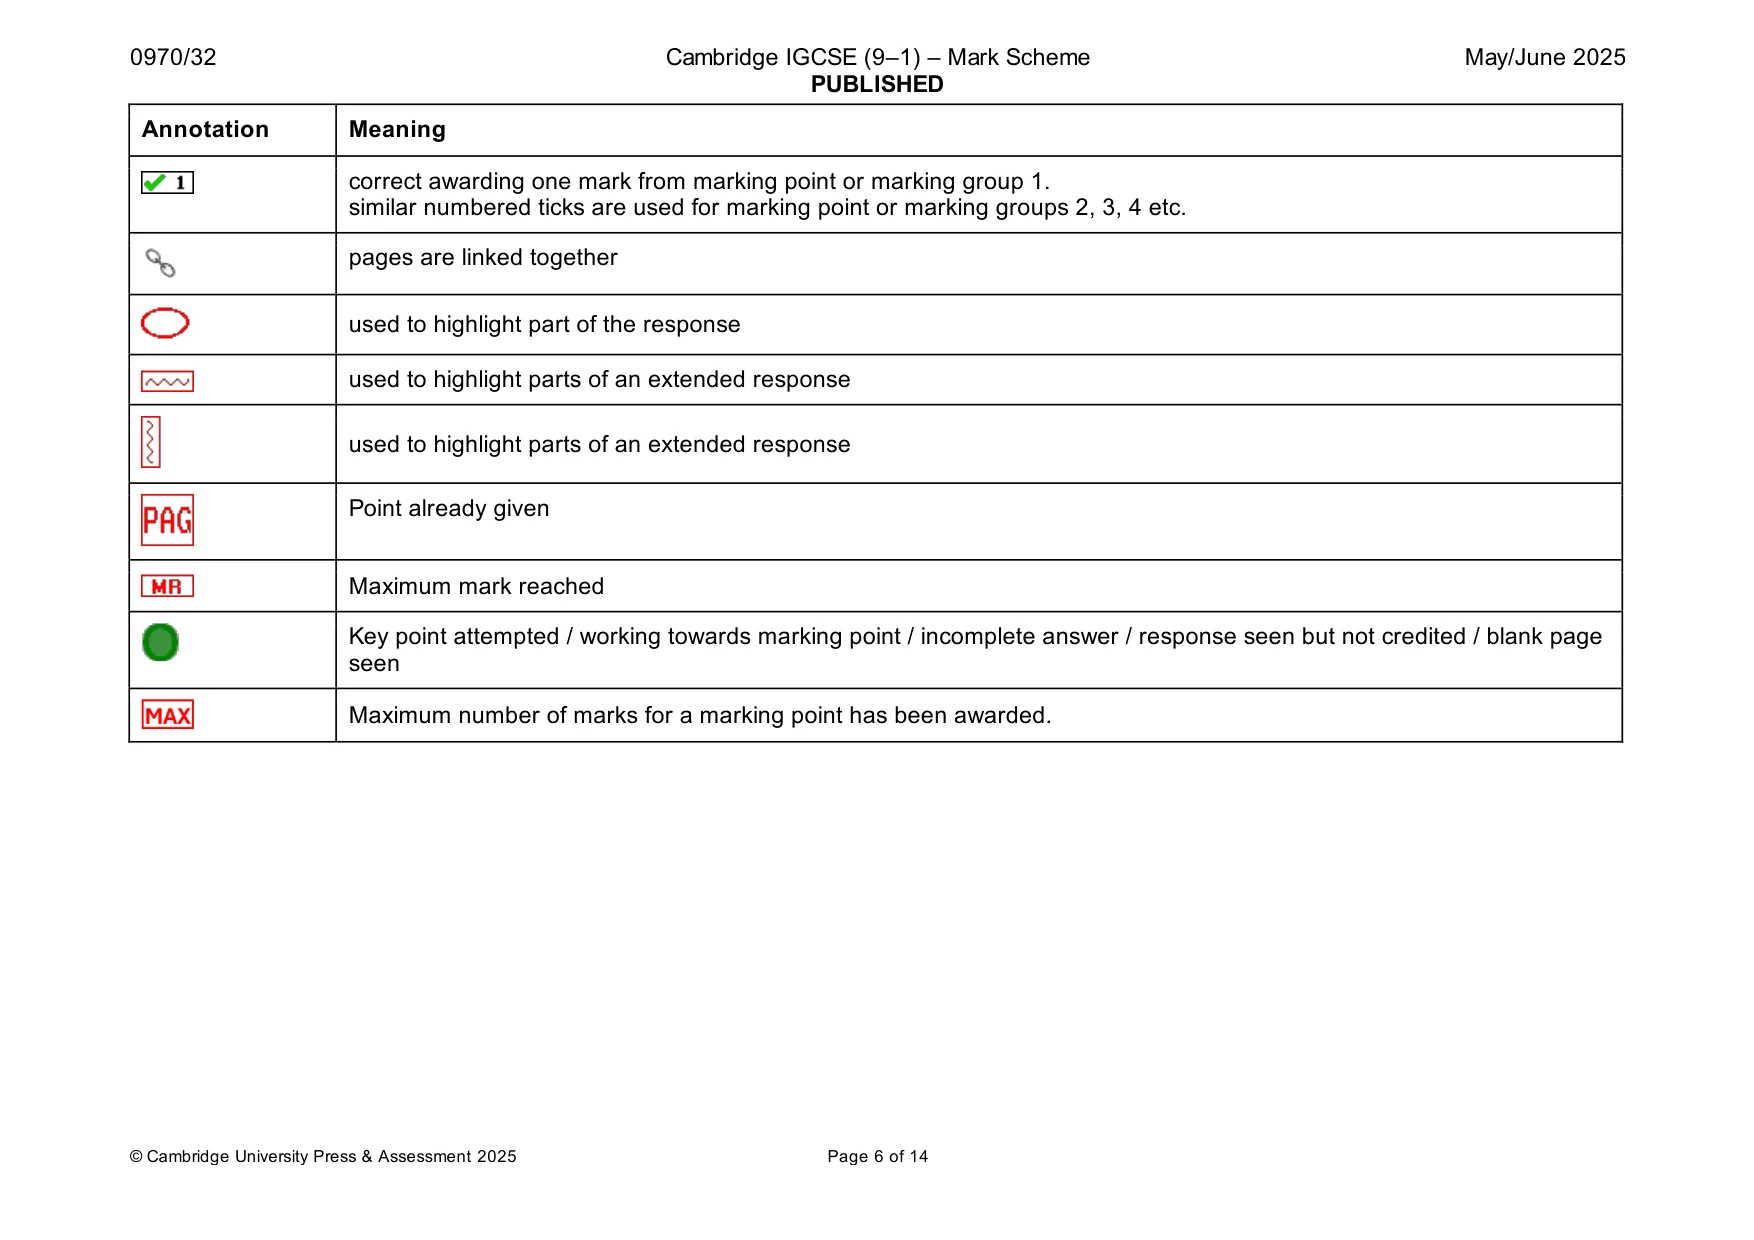
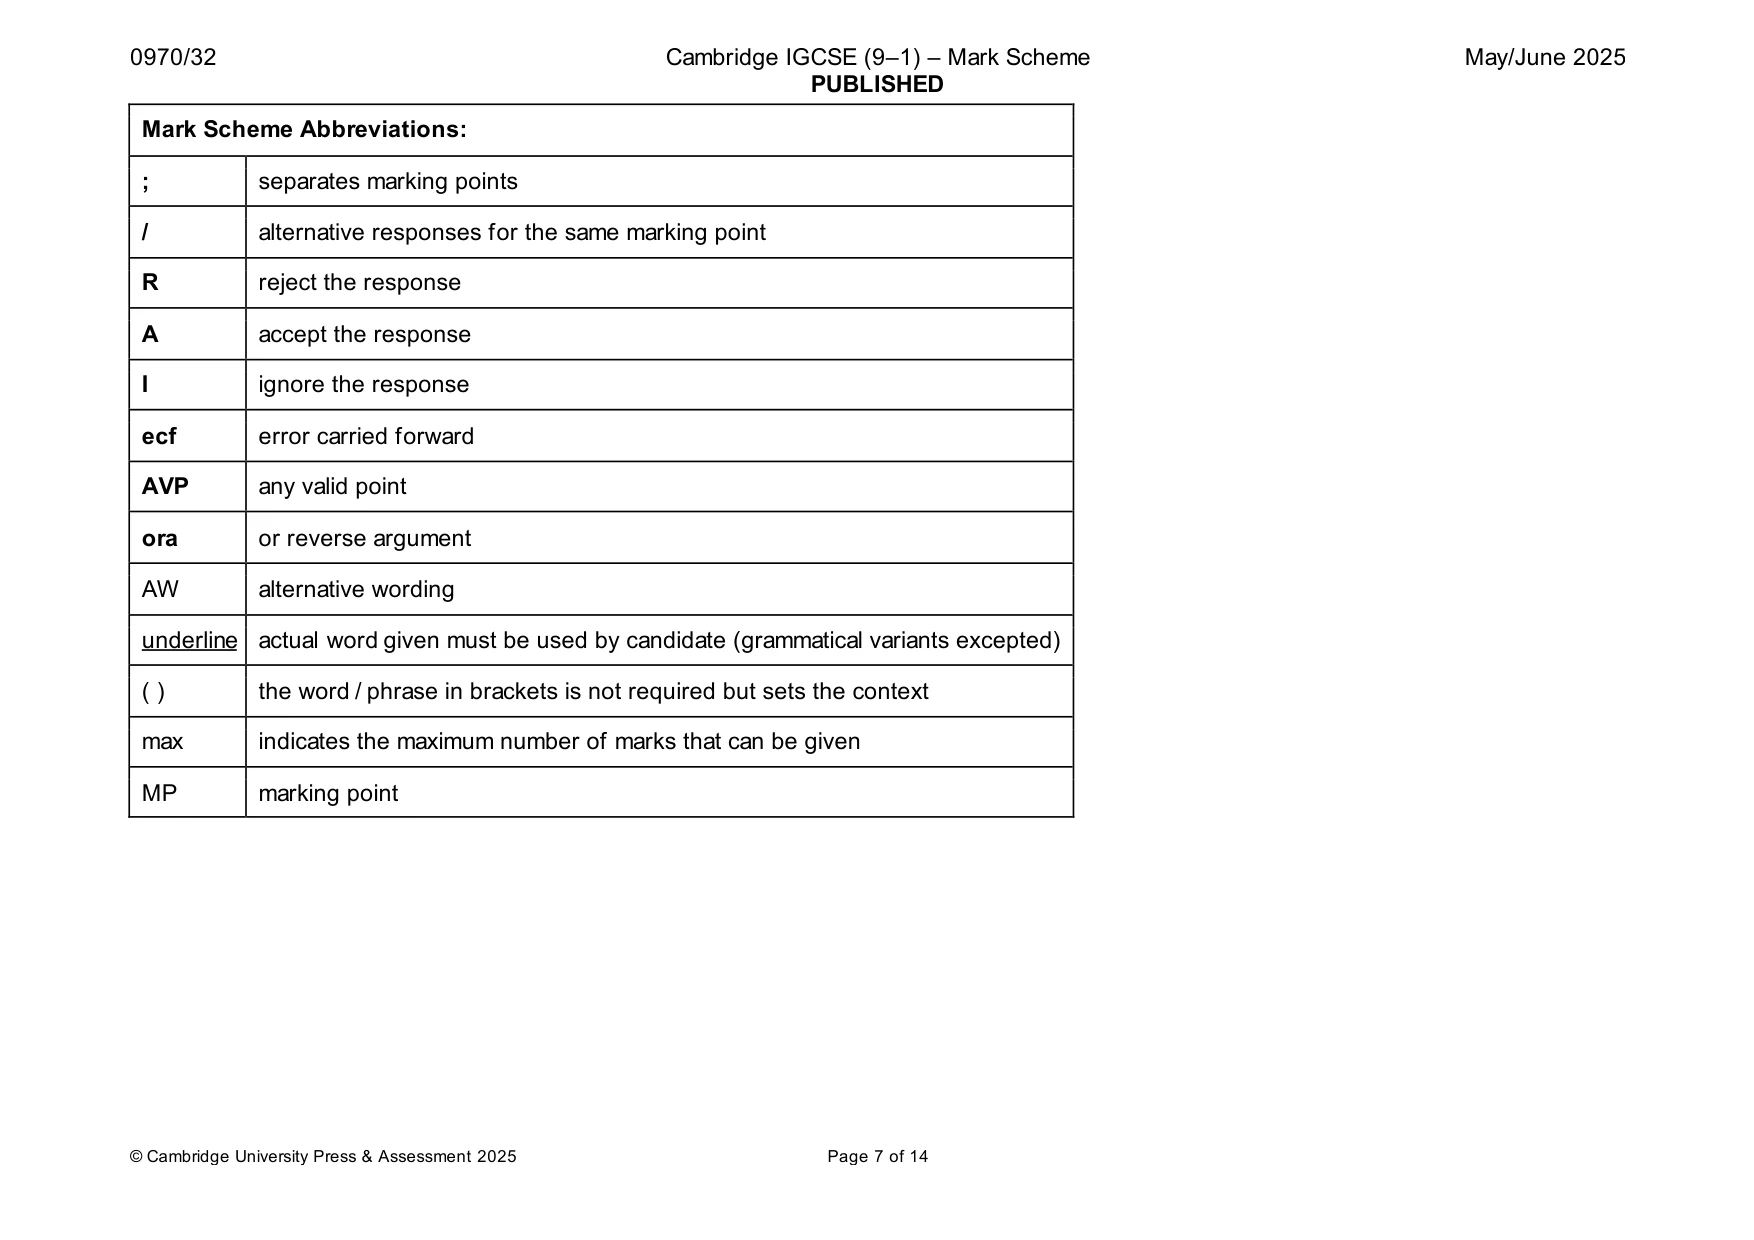
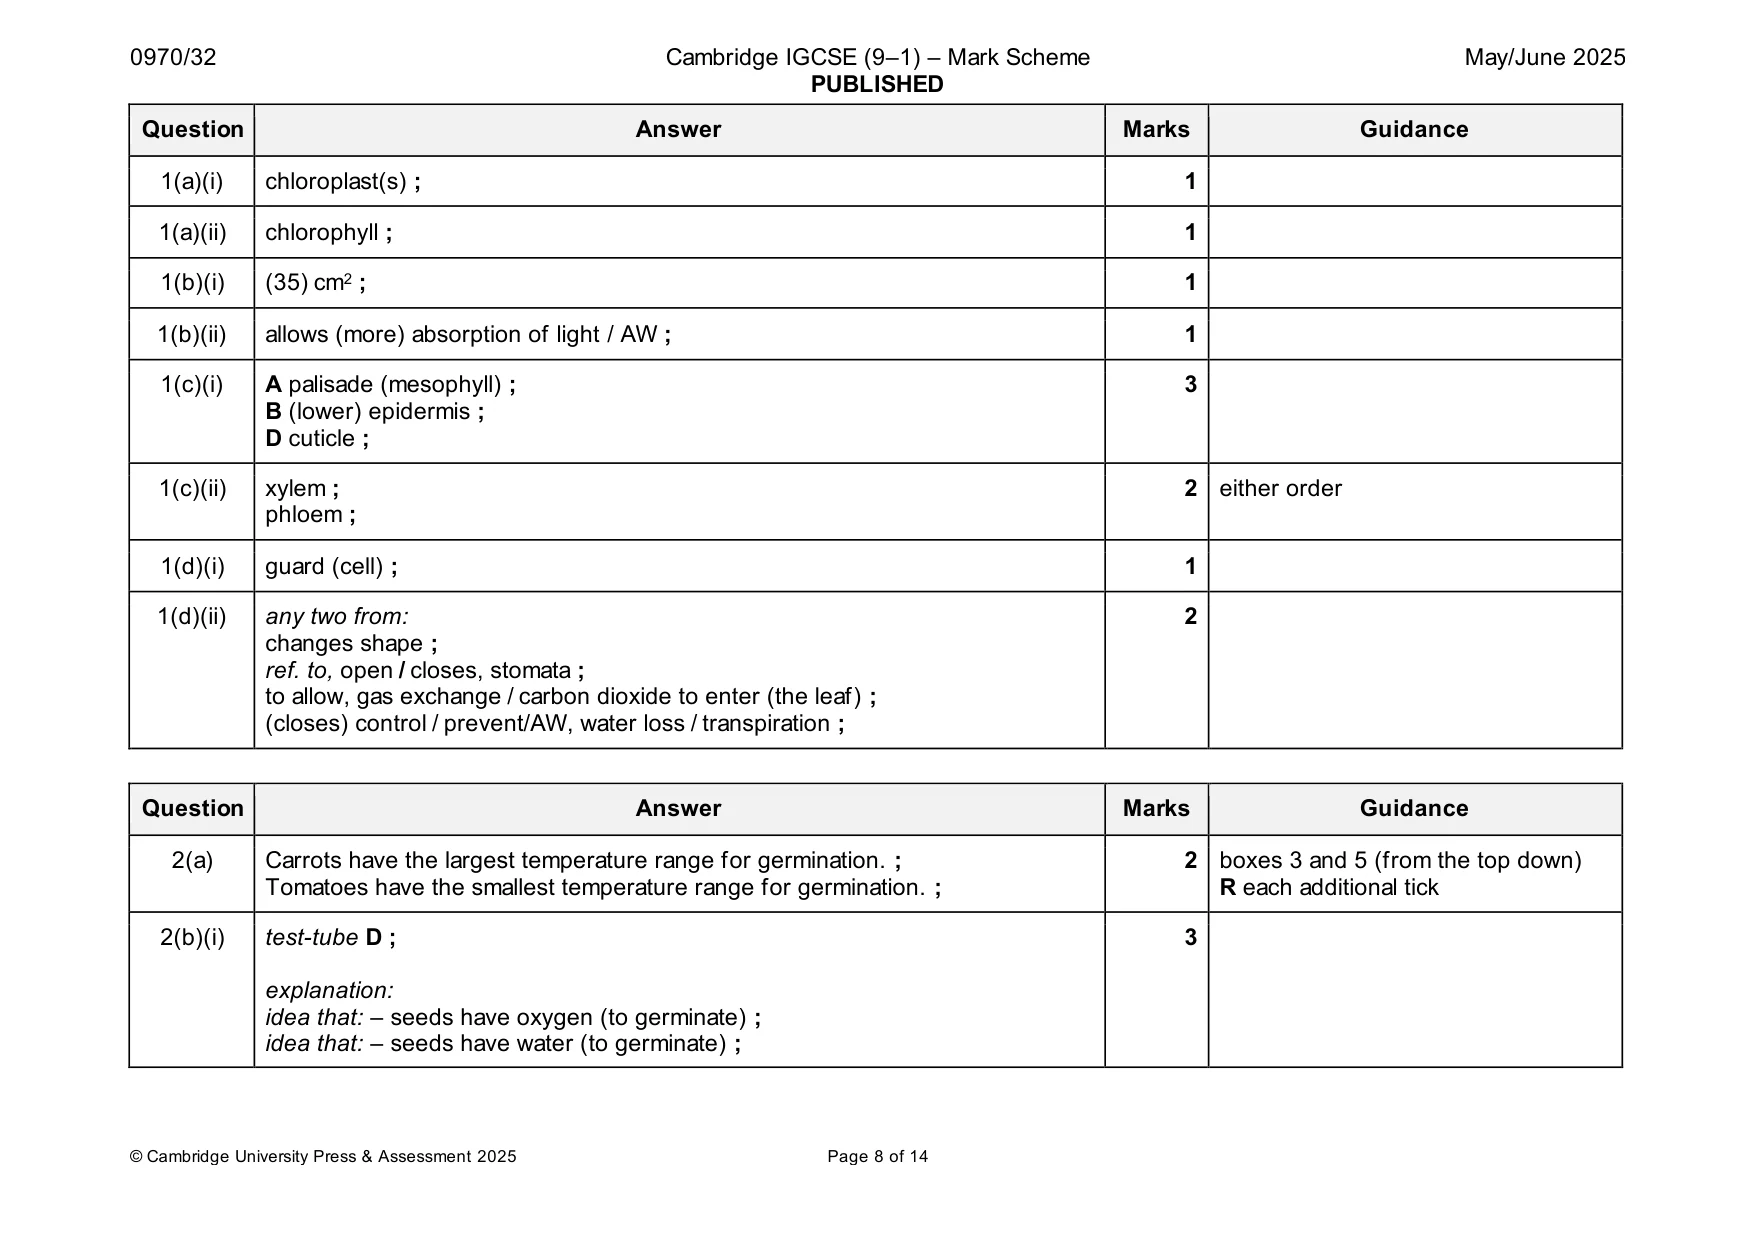
Mark scheme: Question Answer Marks Guidance 1(a)(i) chloroplast(s) ; 1 1(a)(ii) chlorophyll ; 1 1(b)(i) (35) cm2 ; 1 1(b)(ii) allows (more) absorption of light / AW ; 1 1(c)(i) A palisade (mesophyll) ; 3 B (lower) epidermis ; D cuticle ; 1(c)(ii) xylem ; 2 either order phloem ; 1(d)(i) guard (cell) ; 1 1(d)(ii) any two from: 2 changes shape ; ref. to, open / closes, stomata ; to allow, gas exchange / carbon dioxide to enter (the leaf) ; (closes) control / prevent/AW, water loss / transpiration ;
Q2 · Seeds of different crop plants germinate at different temperatures
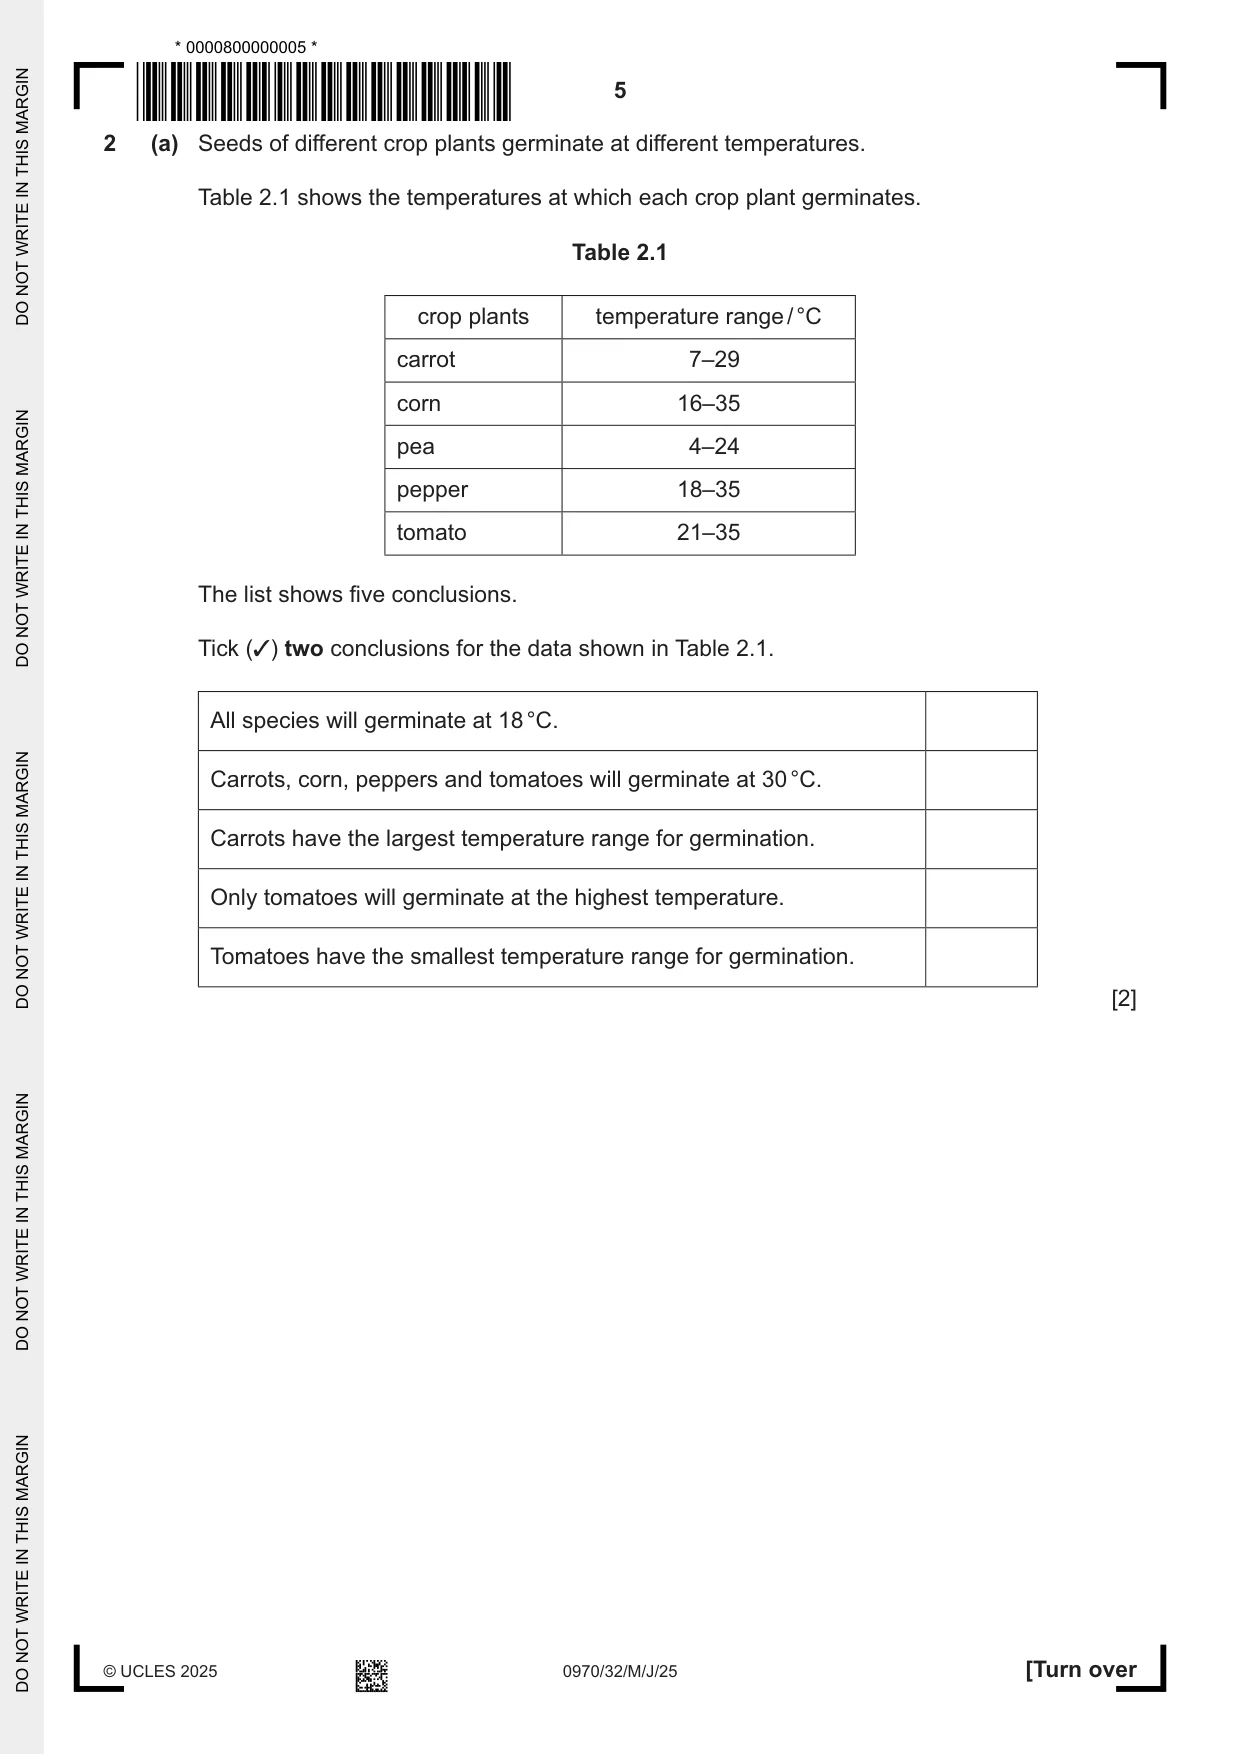
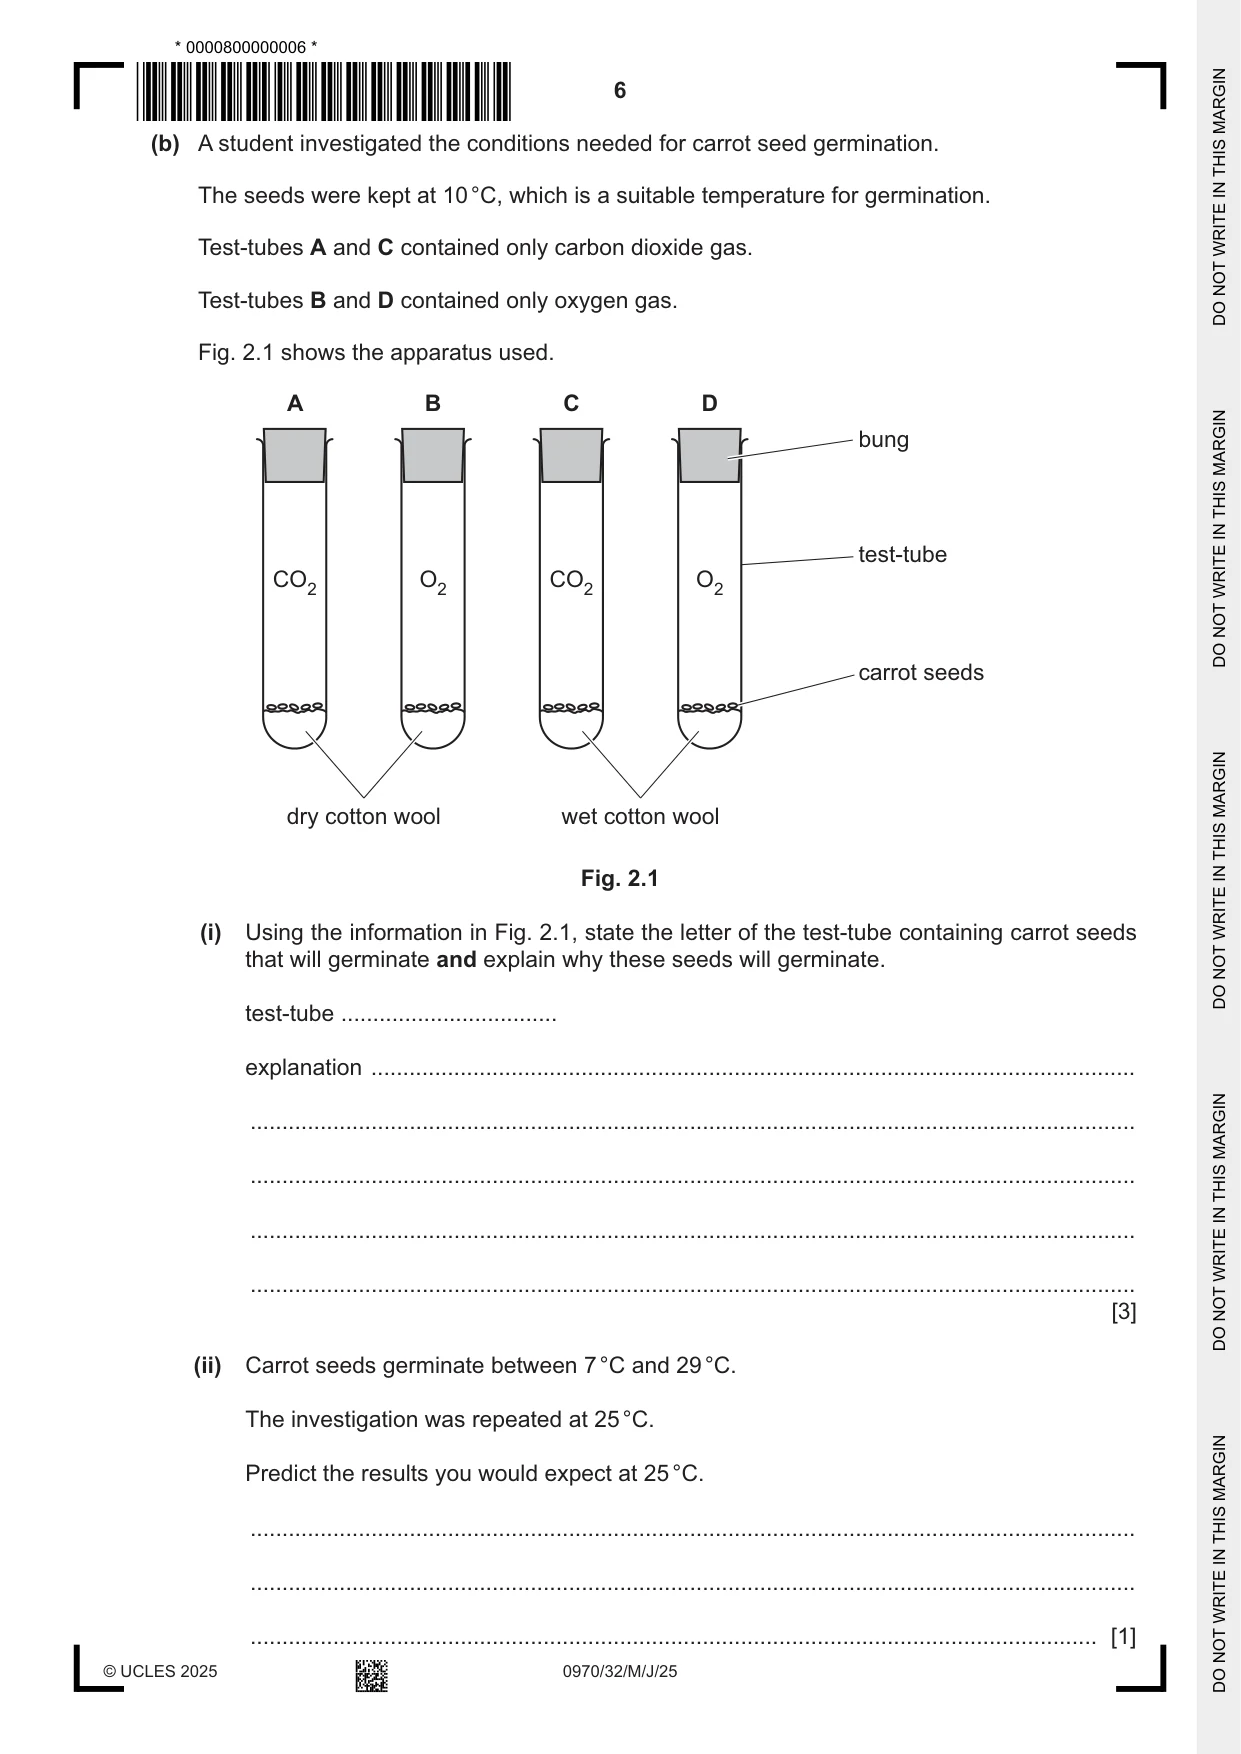
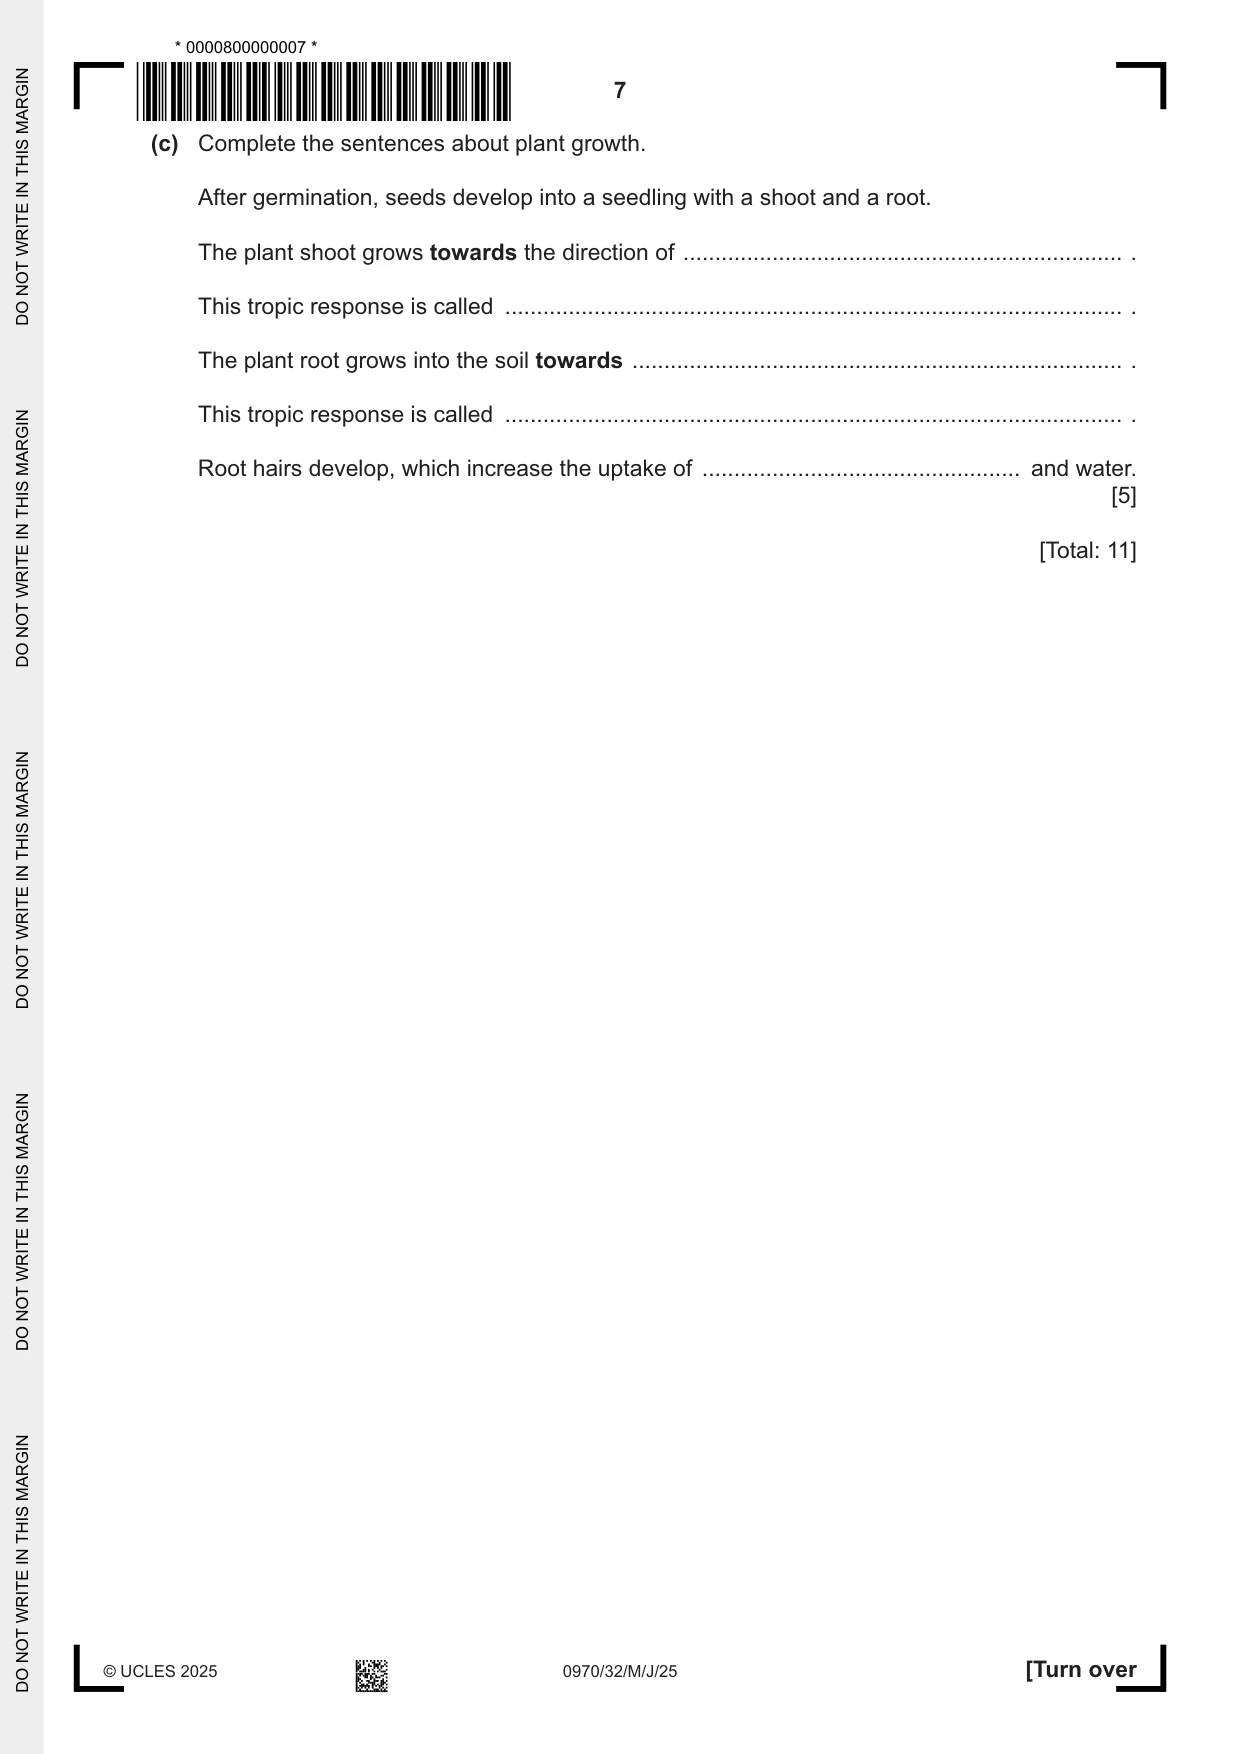
2 (a) Seeds of different crop plants germinate at different temperatures. Table 2.1 shows the temperatures at which each crop plant germinates. Table 2.1 crop plants temperature range / °C carrot 7–29 corn 16–35 pea 4–24 pepper 18–35 tomato 21–35 The list shows five conclusions. Tick (3) two conclusions for the data shown in Table 2.1. All species will germinate at 18 °C. Carrots, corn, peppers and tomatoes will germinate at 30 °C. Carrots have the largest temperature range for germination. Only tomatoes will germinate at the highest temperature. Tomatoes have the smallest temperature range for germination. [2] (b) A student investigated the conditions needed for carrot seed germination. The seeds were kept at 10 °C, which is a suitable temperature for germination. Test‑tubes A and C contained only carbon dioxide gas. Test‑tubes B and D contained only oxygen gas. Fig. 2.1 shows the apparatus used. A B C D bung test-tube CO2 O2 CO2 O2 carrot seeds dry cotton wool wet cotton wool Fig. 2.1 (i) Using the information in Fig. 2.1, state the letter of the test‑tube containing carrot seeds that will germinate and explain why these seeds will germinate. test‑tube .................................. explanation ........................................................................................................................ ........................................................................................................................................... ........................................................................................................................................... ........................................................................................................................................... ........................................................................................................................................... [3] (ii) Carrot seeds germinate between 7 °C and 29 °C. The investigation was repeated at 25 °C. Predict the results you would expect at 25 °C. ........................................................................................................................................... ........................................................................................................................................... ..................................................................................................................................... [1] (c) Complete the sentences about plant growth. After germination, seeds develop into a seedling with a shoot and a root. The plant shoot grows towards the direction of ..................................................................... . This tropic response is called ................................................................................................. . The plant root grows into the soil towards ............................................................................. . This tropic response is called ................................................................................................. . Root hairs develop, which increase the uptake of .................................................. and water. [5] [Total: 11]
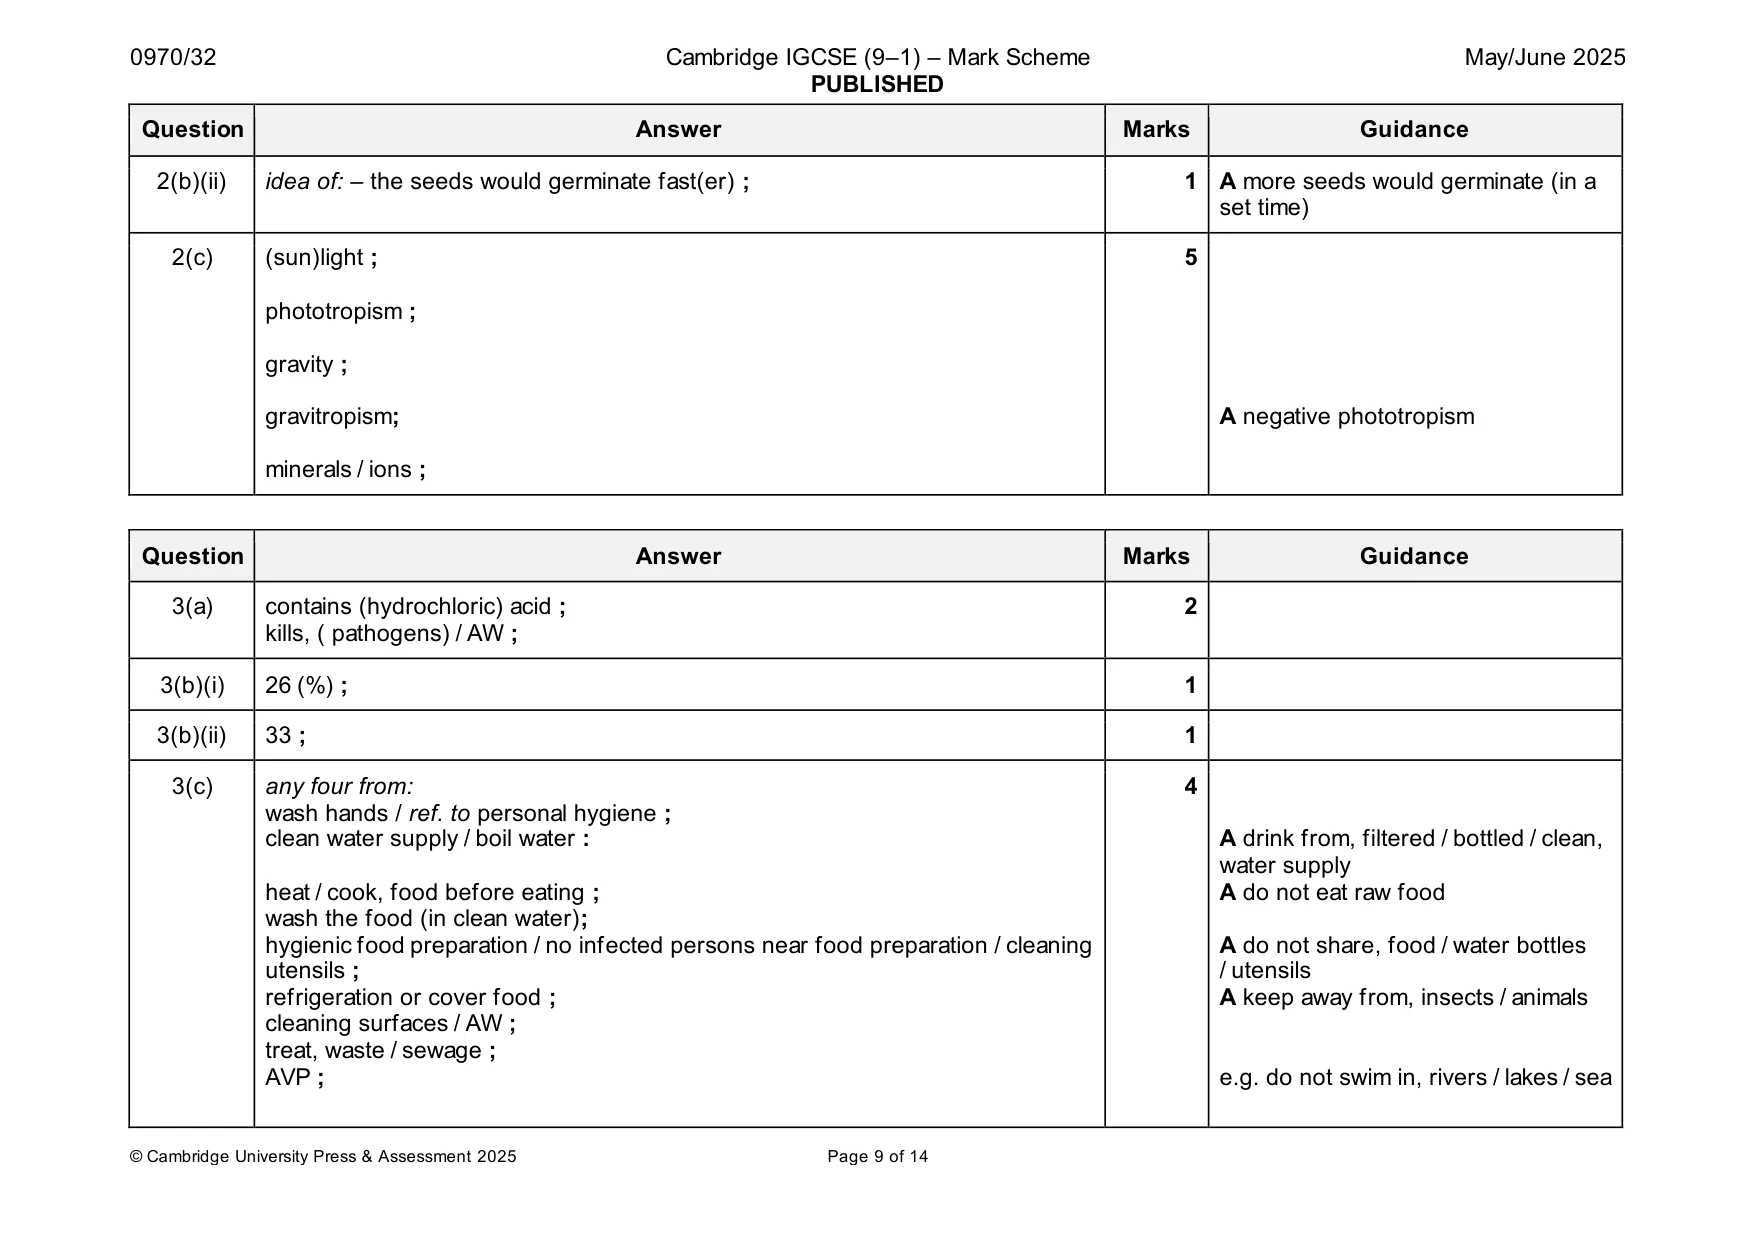
Mark scheme: 2(a) Carrots have the largest temperature range for germination. ; 2 boxes 3 and 5 (from the top down) Tomatoes have the smallest temperature range for germination. ; R each additional tick 2(b)(i) test-tube D ; 3 explanation: idea that: – seeds have oxygen (to germinate) ; idea that: – seeds have water (to germinate) ; 2(b)(ii) idea of: – the seeds would germinate fast(er) ; 1 A more seeds would germinate (in a set time) 2(c) (sun)light ; 5 phototropism ; gravity ; gravitropism; A negative phototropism minerals / ions ;
Q3 · Pathogens are disease‑causing organisms
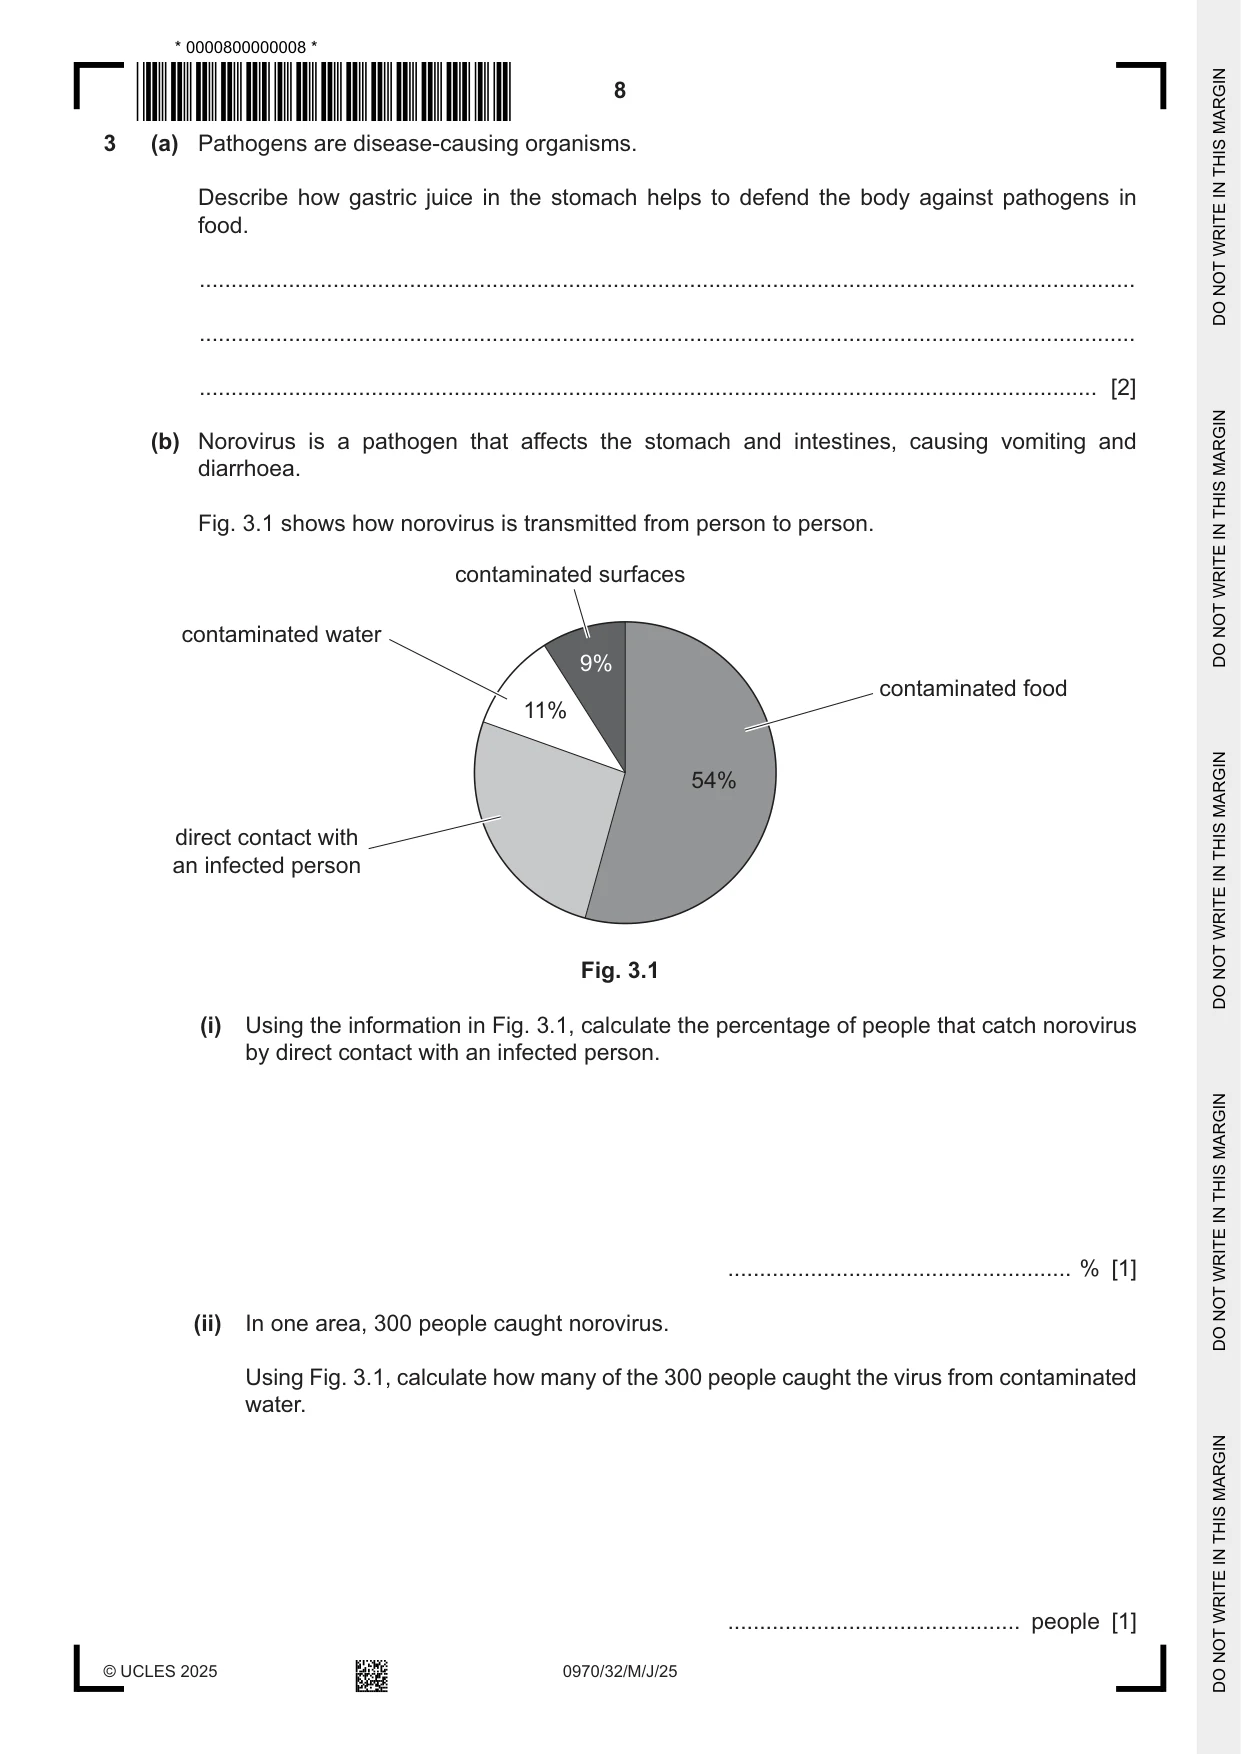
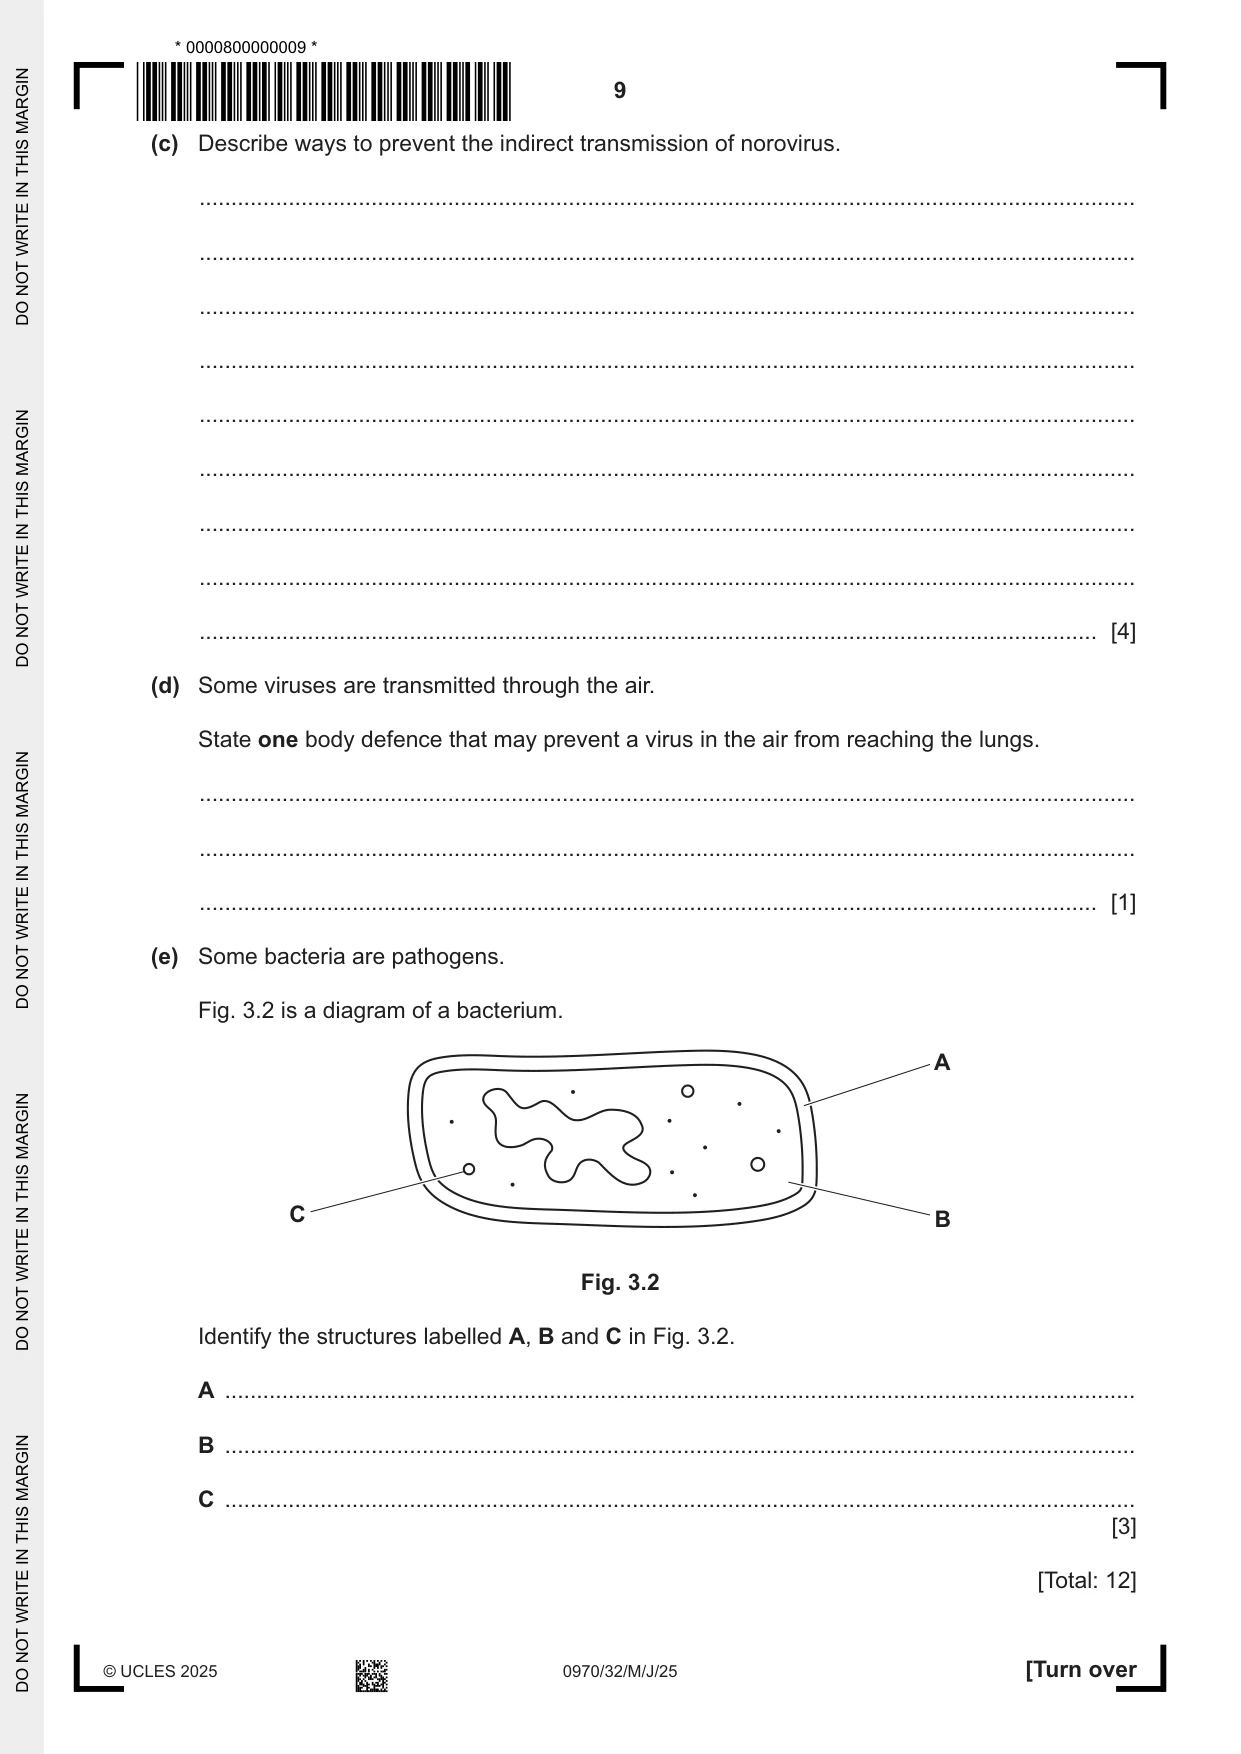
3 (a) Pathogens are disease‑causing organisms. Describe how gastric juice in the stomach helps to defend the body against pathogens in food. ................................................................................................................................................... ................................................................................................................................................... ............................................................................................................................................. [2] (b) Norovirus is a pathogen that affects the stomach and intestines, causing vomiting and diarrhoea. Fig. 3.1 shows how norovirus is transmitted from person to person. contaminated surfaces contaminated water 9% contaminated food 11% 54% direct contact with an infected person Fig. 3.1 (i) Using the information in Fig. 3.1, calculate the percentage of people that catch norovirus by direct contact with an infected person. ...................................................... % [1] (ii) In one area, 300 people caught norovirus. Using Fig. 3.1, calculate how many of the 300 people caught the virus from contaminated water. .............................................. people [1] (c) Describe ways to prevent the indirect transmission of norovirus. ................................................................................................................................................... ................................................................................................................................................... ................................................................................................................................................... ................................................................................................................................................... ................................................................................................................................................... ................................................................................................................................................... ................................................................................................................................................... ................................................................................................................................................... ............................................................................................................................................. [4] (d) Some viruses are transmitted through the air. State one body defence that may prevent a virus in the air from reaching the lungs. ................................................................................................................................................... ................................................................................................................................................... ............................................................................................................................................. [1] (e) Some bacteria are pathogens. Fig. 3.2 is a diagram of a bacterium. A C B Fig. 3.2 Identify the structures labelled A, B and C in Fig. 3.2. A ............................................................................................................................................... B ............................................................................................................................................... C ............................................................................................................................................... [3] [Total: 12]
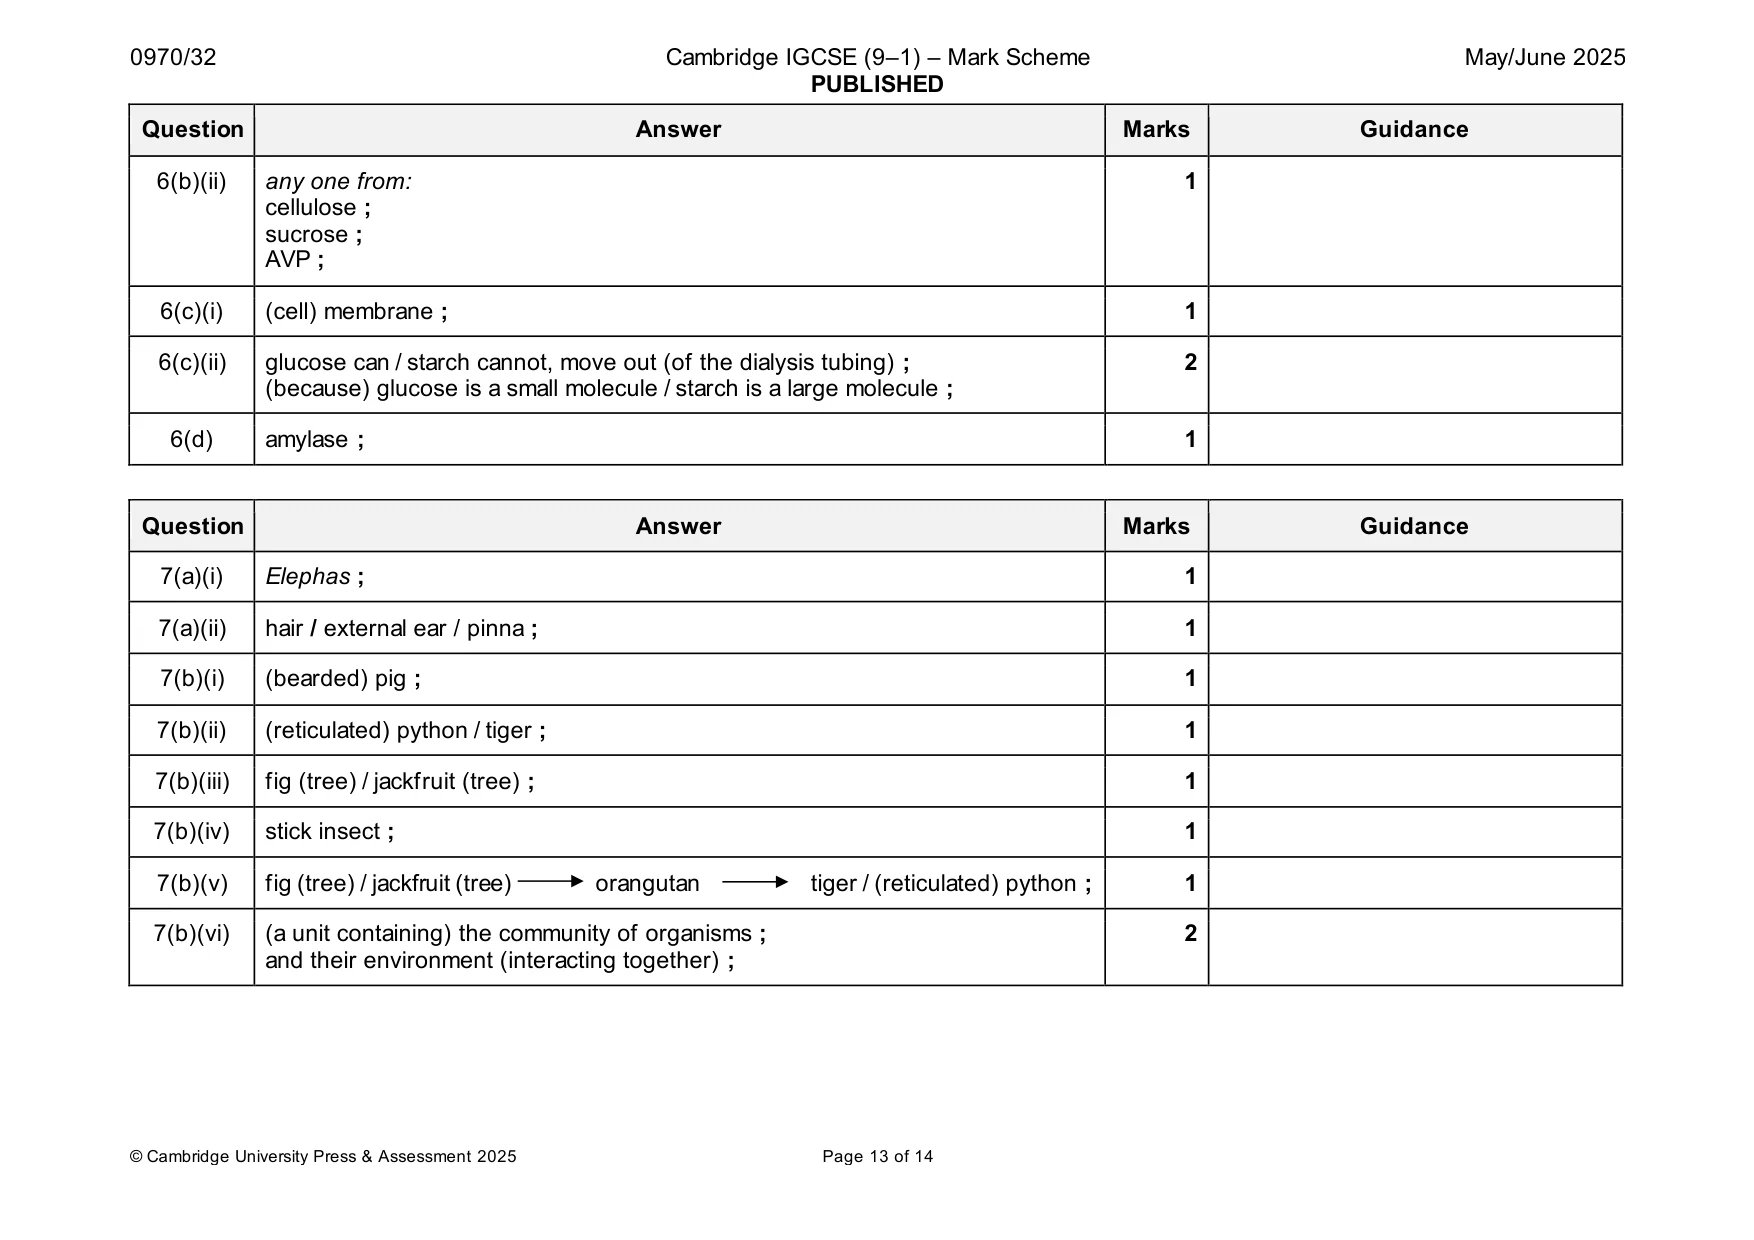
Mark scheme: 3(a) contains (hydrochloric) acid ; 2 kills, ( pathogens) / AW ; 3(b)(i) 26 (%) ; 1 3(b)(ii) 33 ; 1 3(c) any four from: 4 wash hands / ref. to personal hygiene ; clean water supply / boil water : A drink from, filtered / bottled / clean, water supply heat / cook, food before eating ; A do not eat raw food wash the food (in clean water); hygienic food preparation / no infected persons near food preparation / cleaning A do not share, food / water bottles utensils ; / utensils refrigeration or cover food ; A keep away from, insects / animals cleaning surfaces / AW ; treat, waste / sewage ; AVP ; e.g. do not swim in, rivers / lakes / sea 3(d) any one from: 1 mucus ; nose hairs ; cilia / ciliated cells ; 3(e) A cell wall ; 3 B cytoplasm ; C plasmid ;
Q4 · The boxes on the left contain some functions of blood components
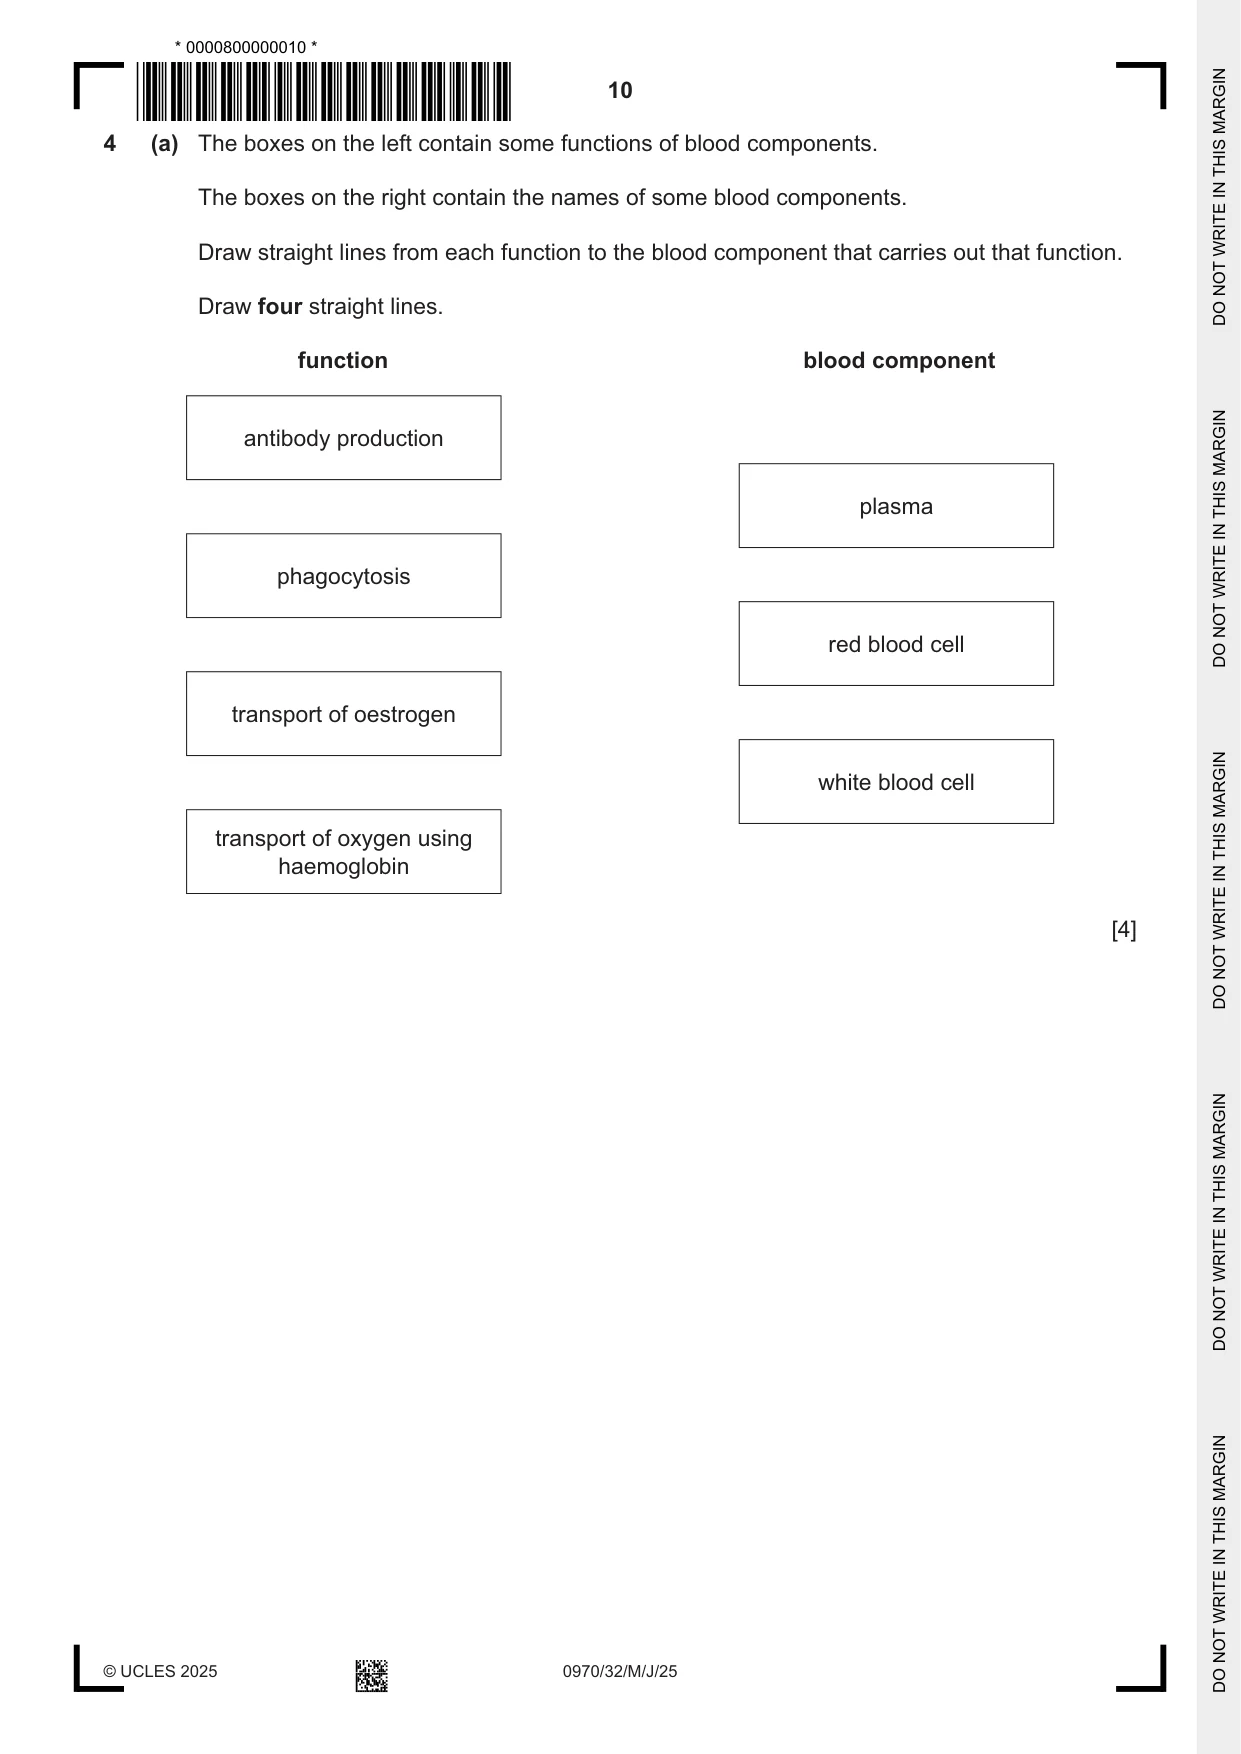
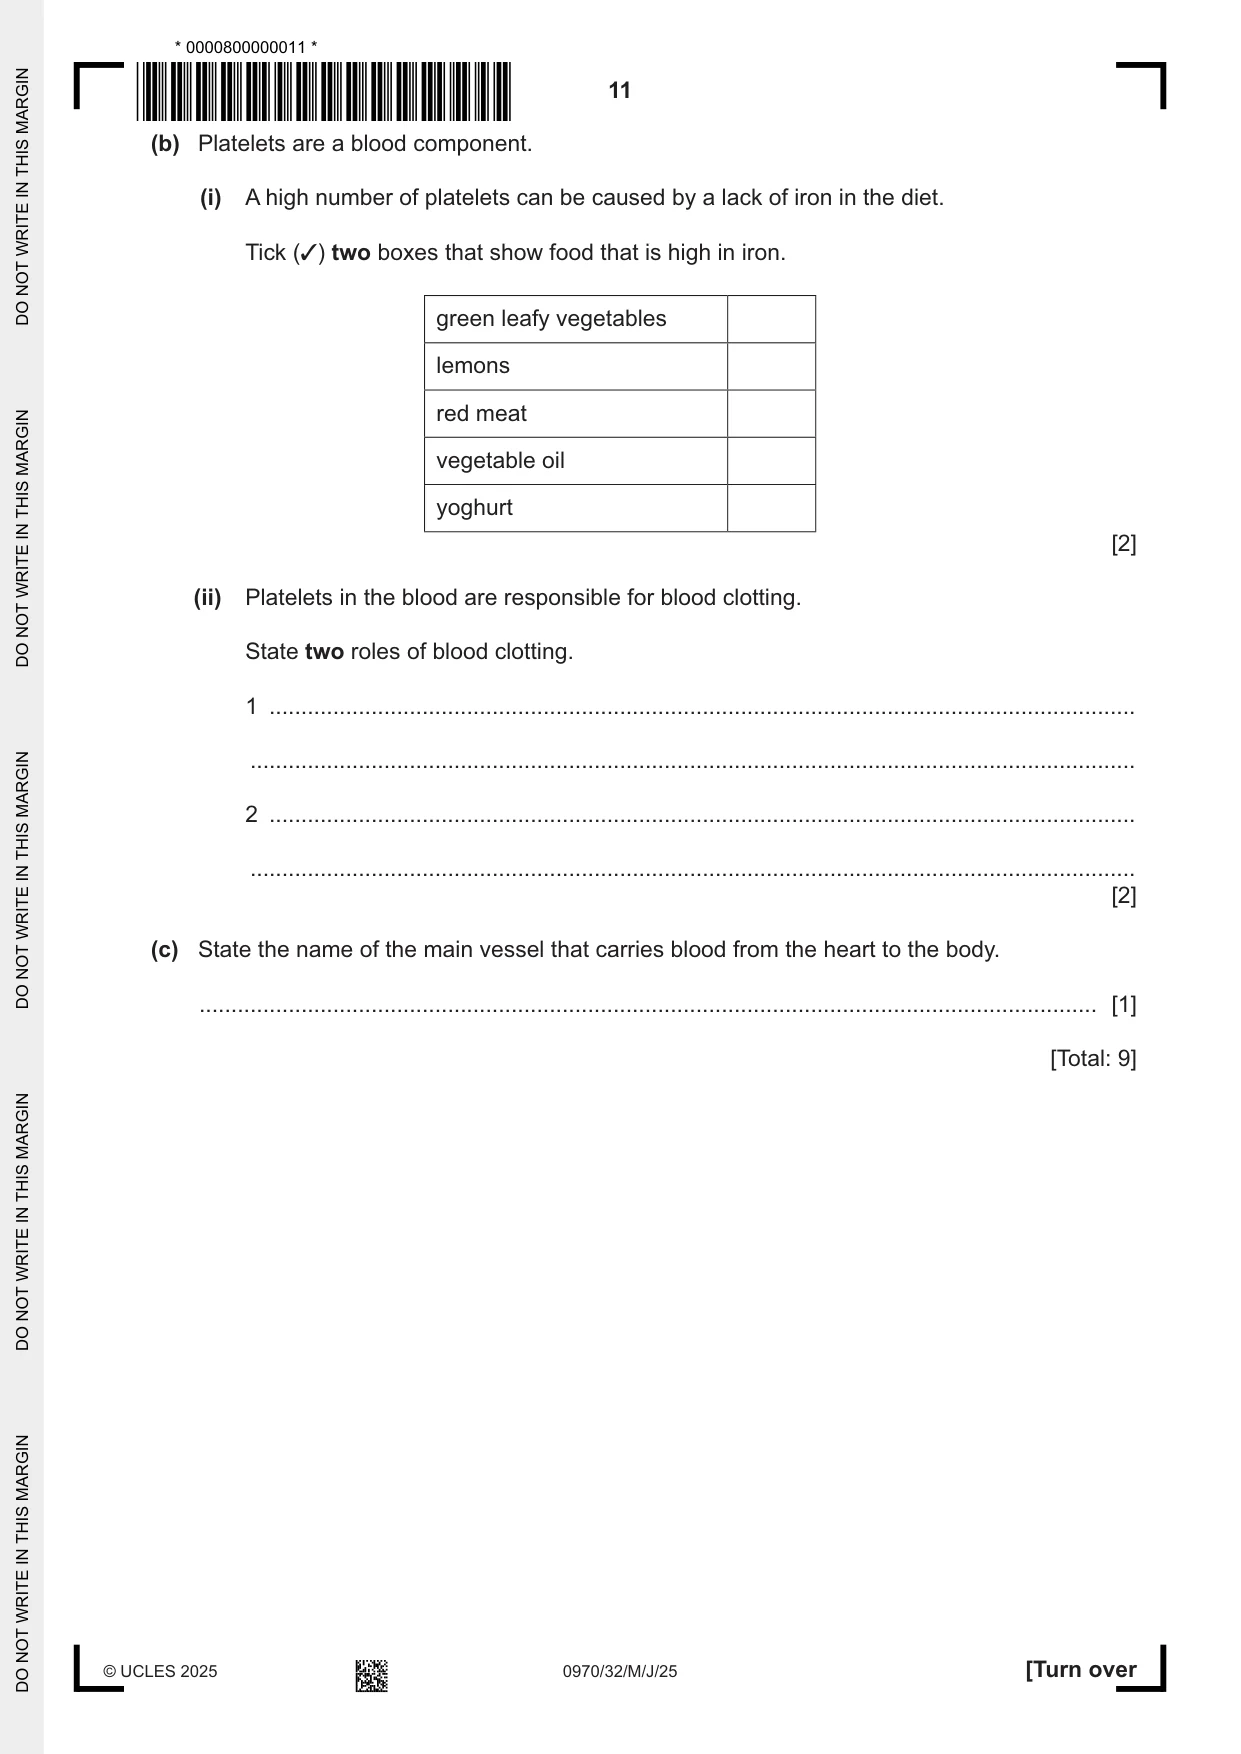
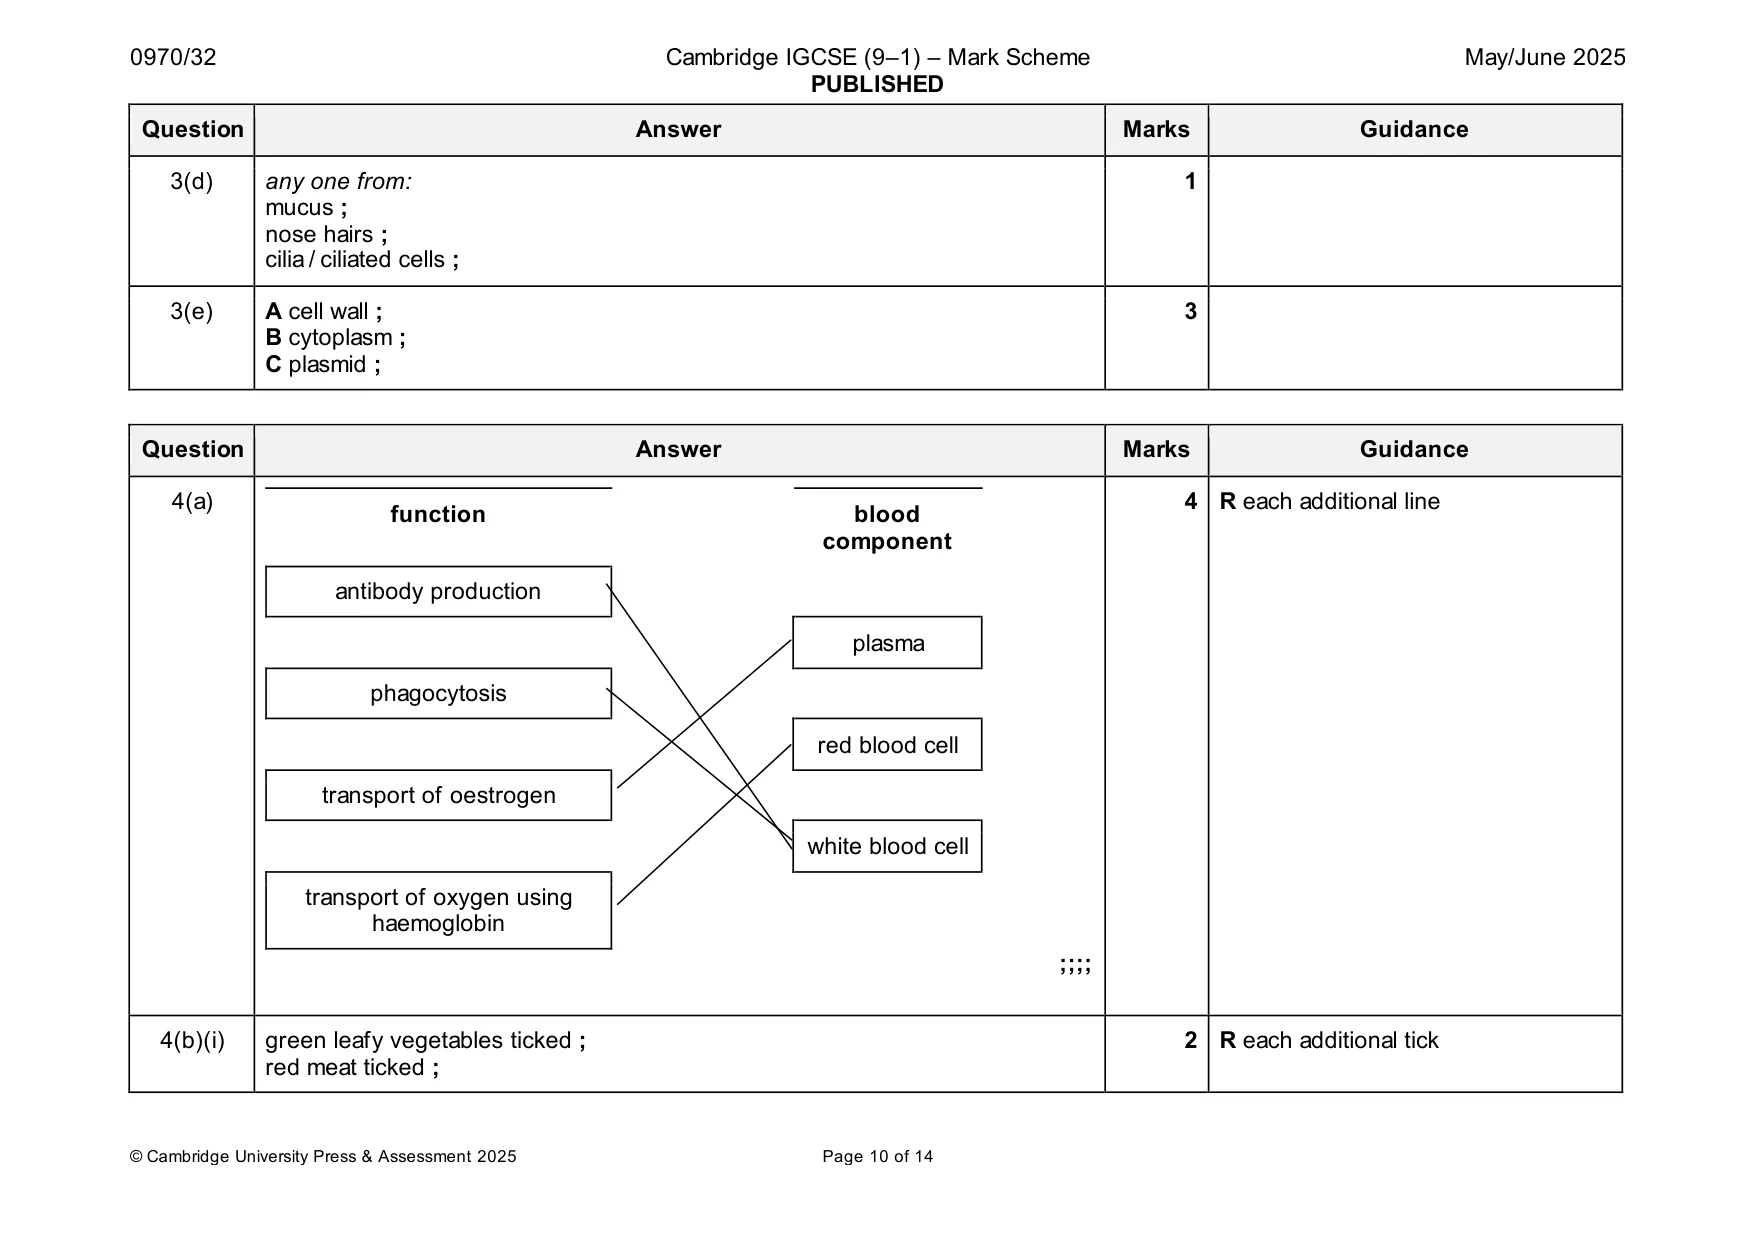
4 (a) The boxes on the left contain some functions of blood components. The boxes on the right contain the names of some blood components. Draw straight lines from each function to the blood component that carries out that function. Draw four straight lines. function blood component antibody production plasma phagocytosis red blood cell transport of oestrogen white blood cell transport of oxygen using haemoglobin [4] (b) Platelets are a blood component. (i) A high number of platelets can be caused by a lack of iron in the diet. Tick (3) two boxes that show food that is high in iron. green leafy vegetables lemons red meat vegetable oil yoghurt [2] (ii) Platelets in the blood are responsible for blood clotting. State two roles of blood clotting. 1 ........................................................................................................................................ ........................................................................................................................................... 2 ........................................................................................................................................ ........................................................................................................................................... [2] (c) State the name of the main vessel that carries blood from the heart to the body. ............................................................................................................................................. [1] [Total: 9]
Mark scheme: 4(a) 4 R each additional line function blood component antibody production plasma phagocytosis red blood cell transport of oestrogen white blood cell transport of oxygen using haemoglobin ;;;; 4(b)(i) green leafy vegetables ticked ; 2 R each additional tick red meat ticked ; 4(b)(ii) prevent / reduce, blood loss ; 2 prevent entry of pathogens / AW ; 4(c) aorta ; 1
Q5 · A diagram of some of the muscles and bones found in the human gas exchange system
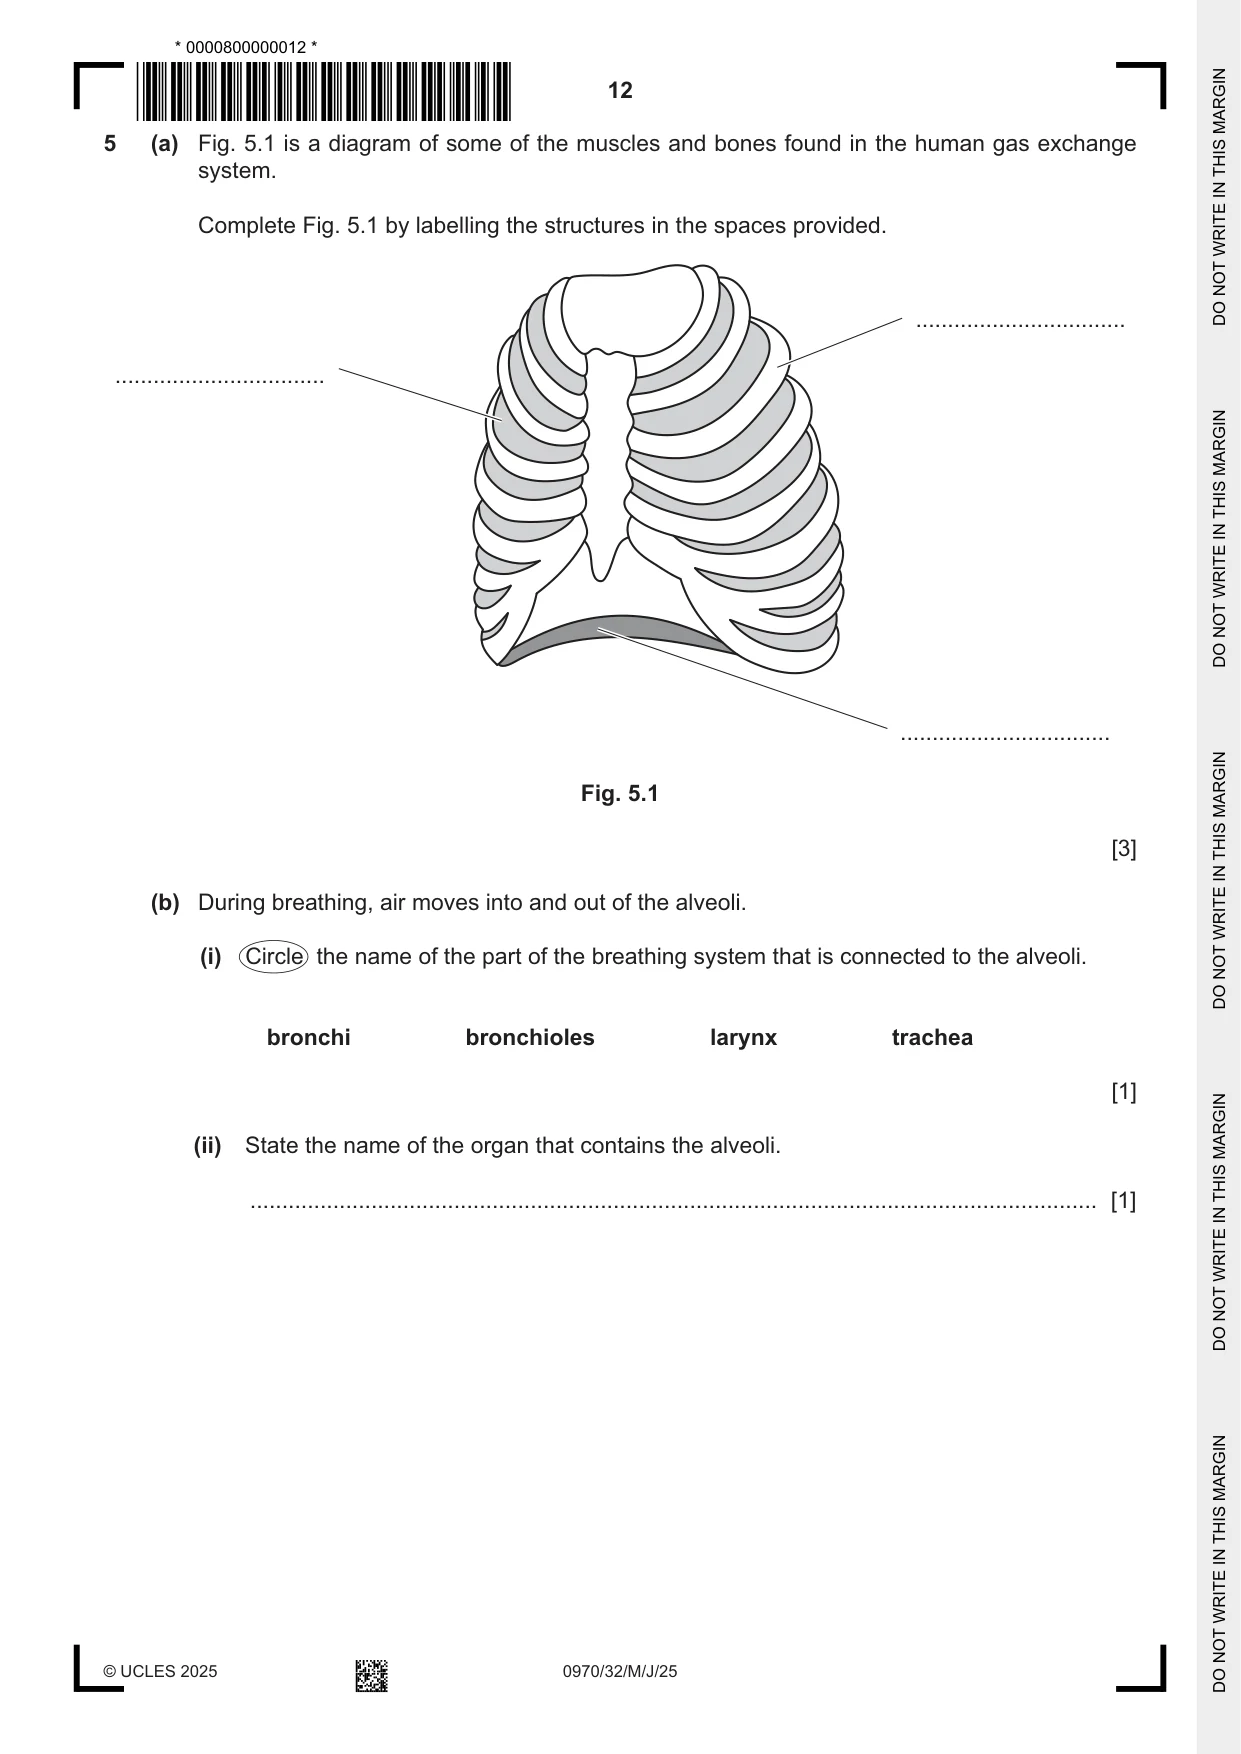
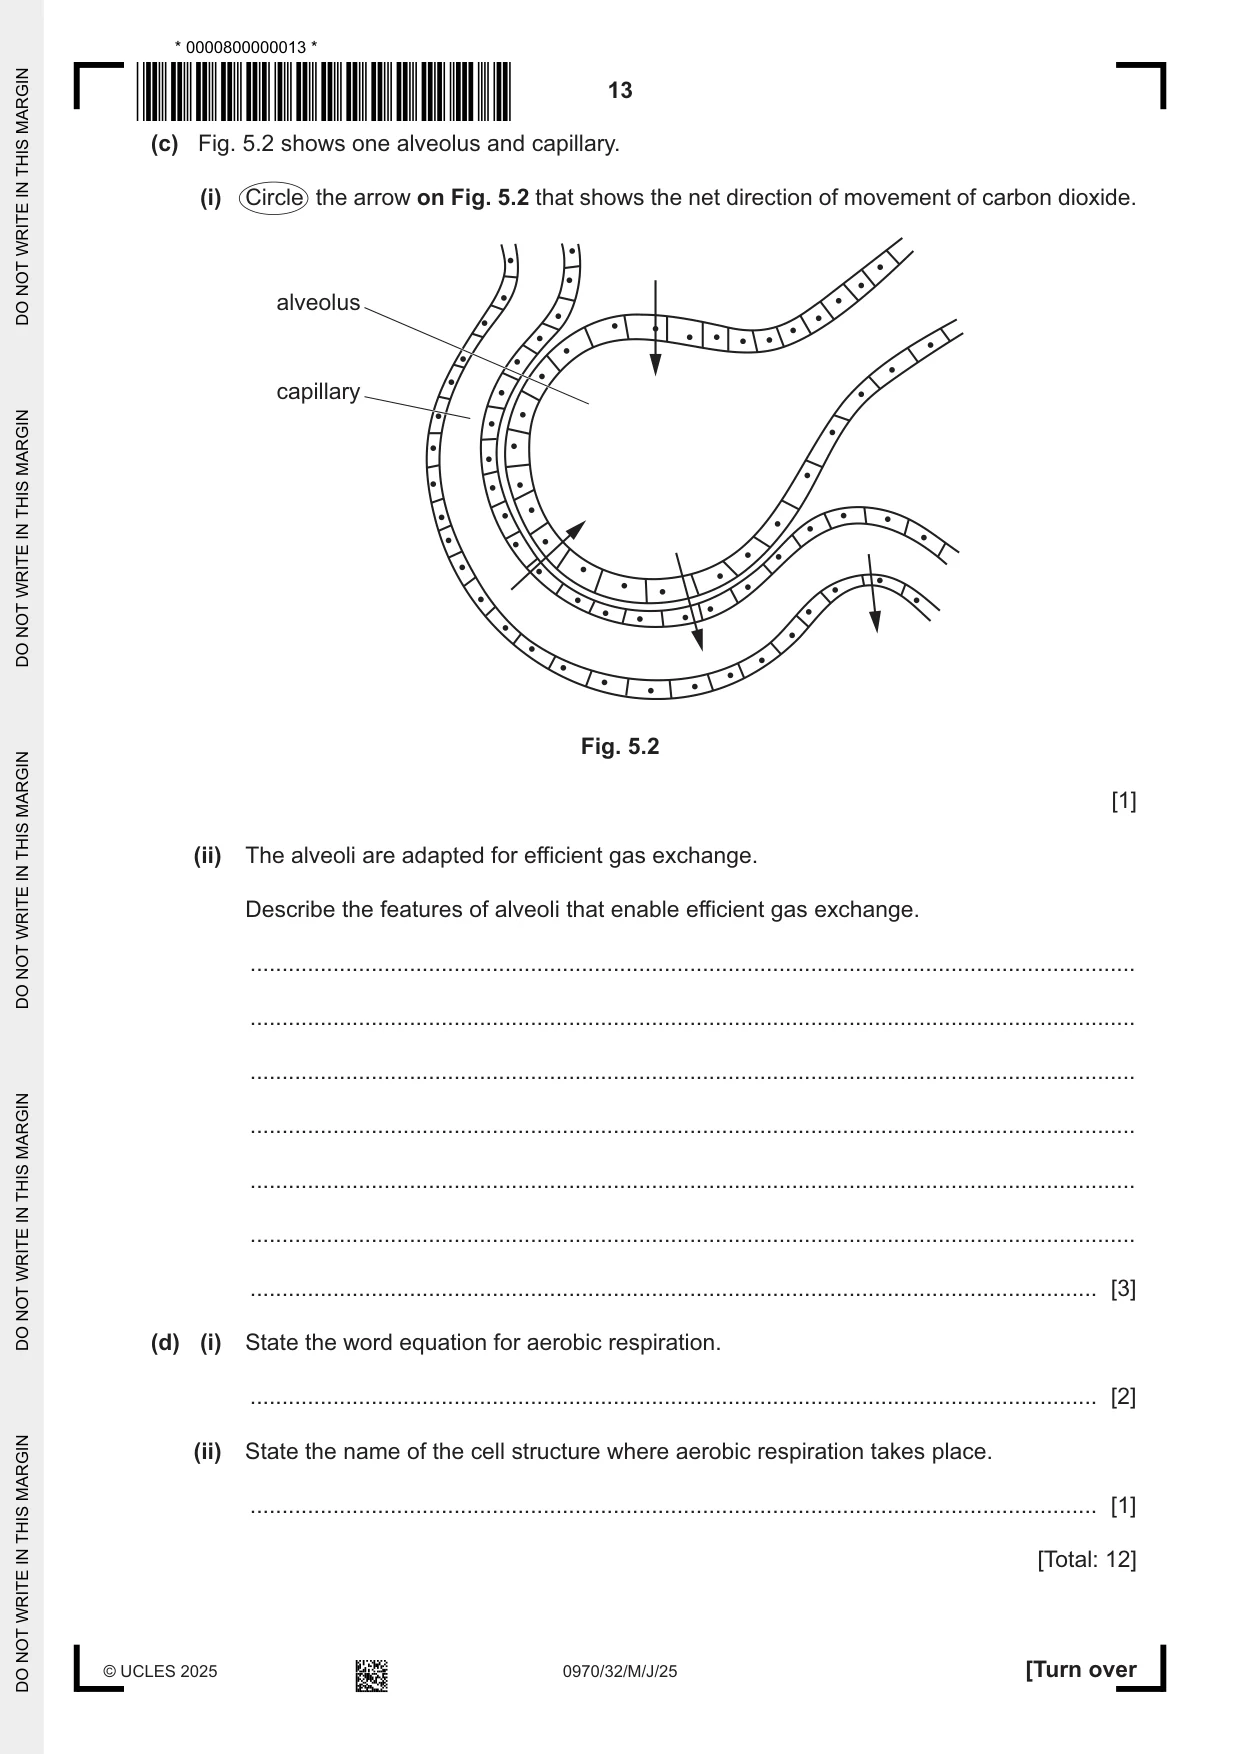
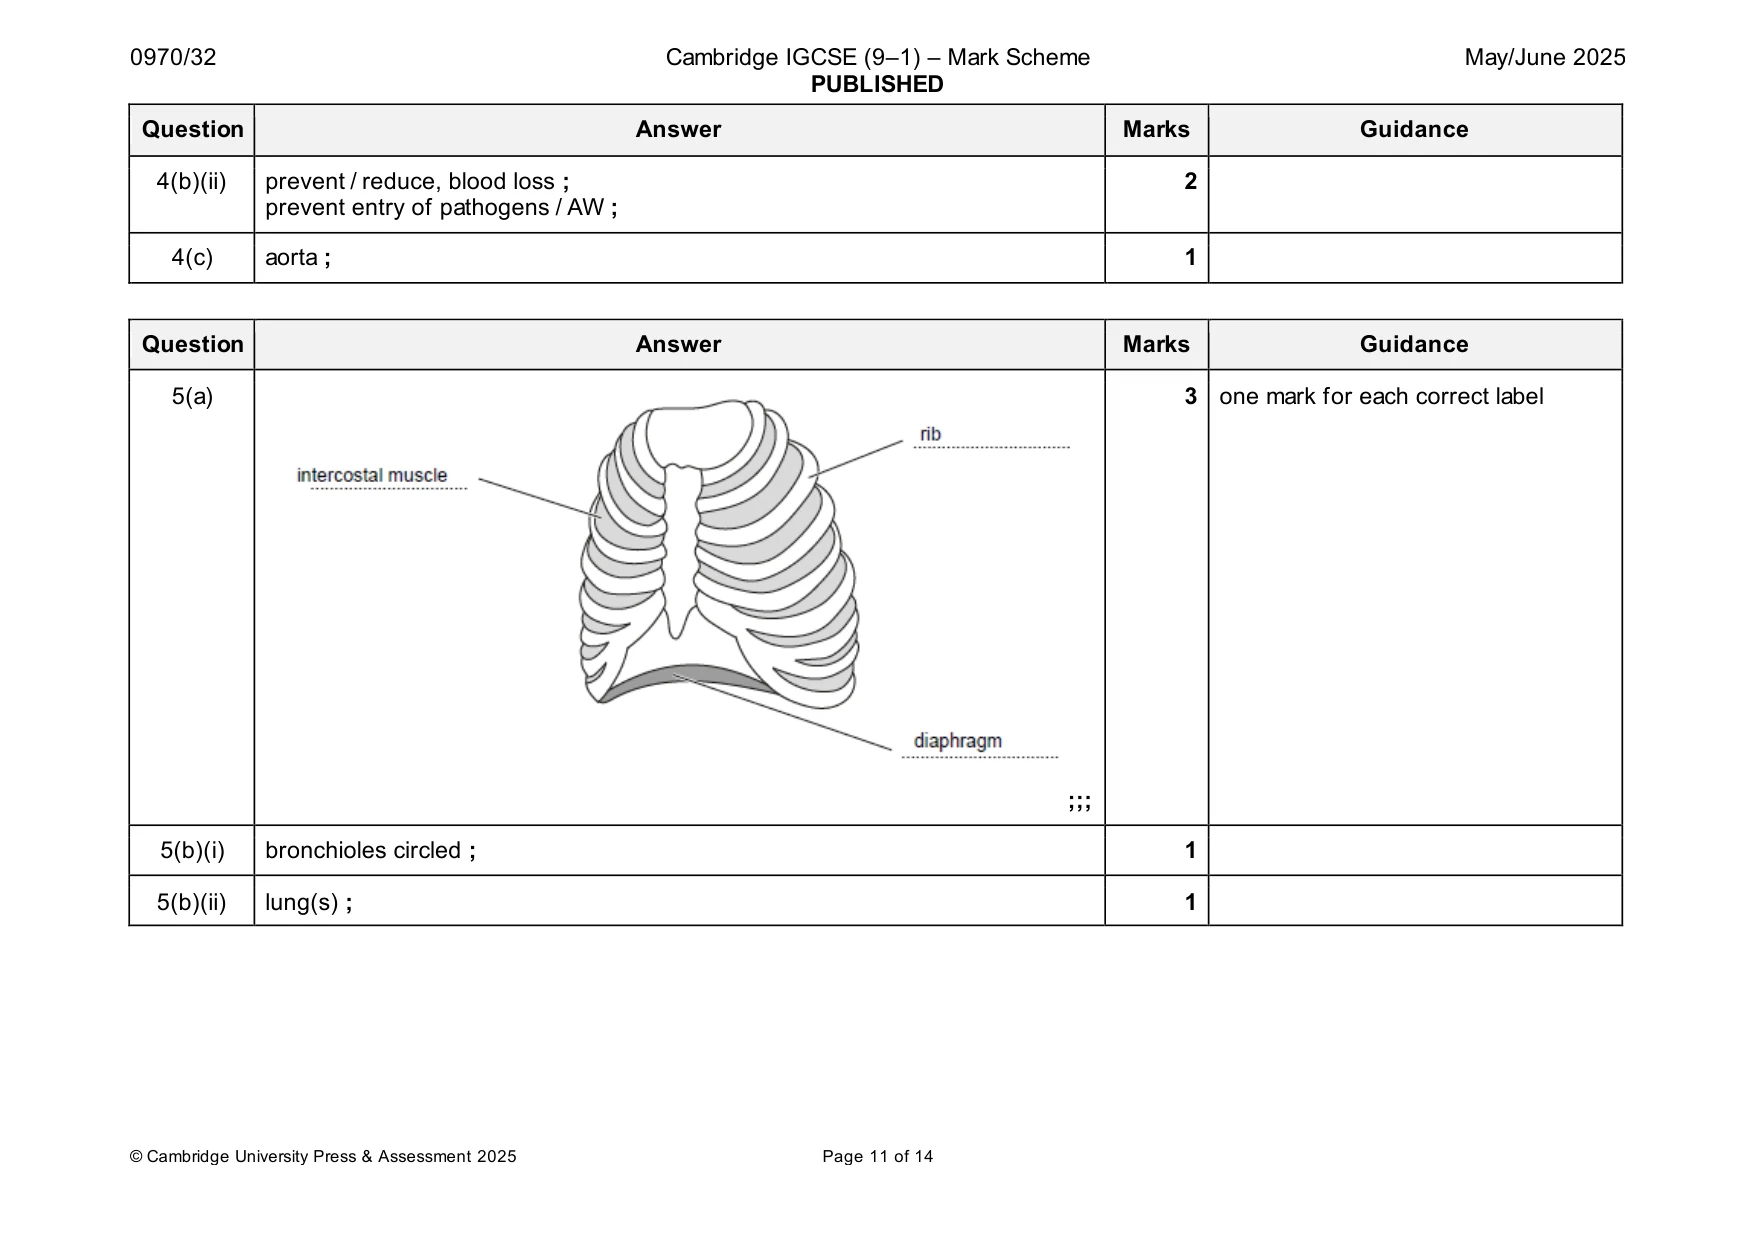
5 (a) Fig. 5.1 is a diagram of some of the muscles and bones found in the human gas exchange system. Complete Fig. 5.1 by labelling the structures in the spaces provided. ................................. ................................. ................................. Fig. 5.1 [3] (b) During breathing, air moves into and out of the alveoli. (i) Circle the name of the part of the breathing system that is connected to the alveoli. bronchi bronchioles larynx trachea [1] (ii) State the name of the organ that contains the alveoli. ..................................................................................................................................... [1] (c) Fig. 5.2 shows one alveolus and capillary. (i) Circle the arrow on Fig. 5.2 that shows the net direction of movement of carbon dioxide. alveolus capillary Fig. 5.2 [1] (ii) The alveoli are adapted for efficient gas exchange. Describe the features of alveoli that enable efficient gas exchange. ........................................................................................................................................... ........................................................................................................................................... ........................................................................................................................................... ........................................................................................................................................... ........................................................................................................................................... ........................................................................................................................................... ..................................................................................................................................... [3] (d) (i) State the word equation for aerobic respiration. ..................................................................................................................................... [2] (ii) State the name of the cell structure where aerobic respiration takes place. ..................................................................................................................................... [1] [Total: 12]
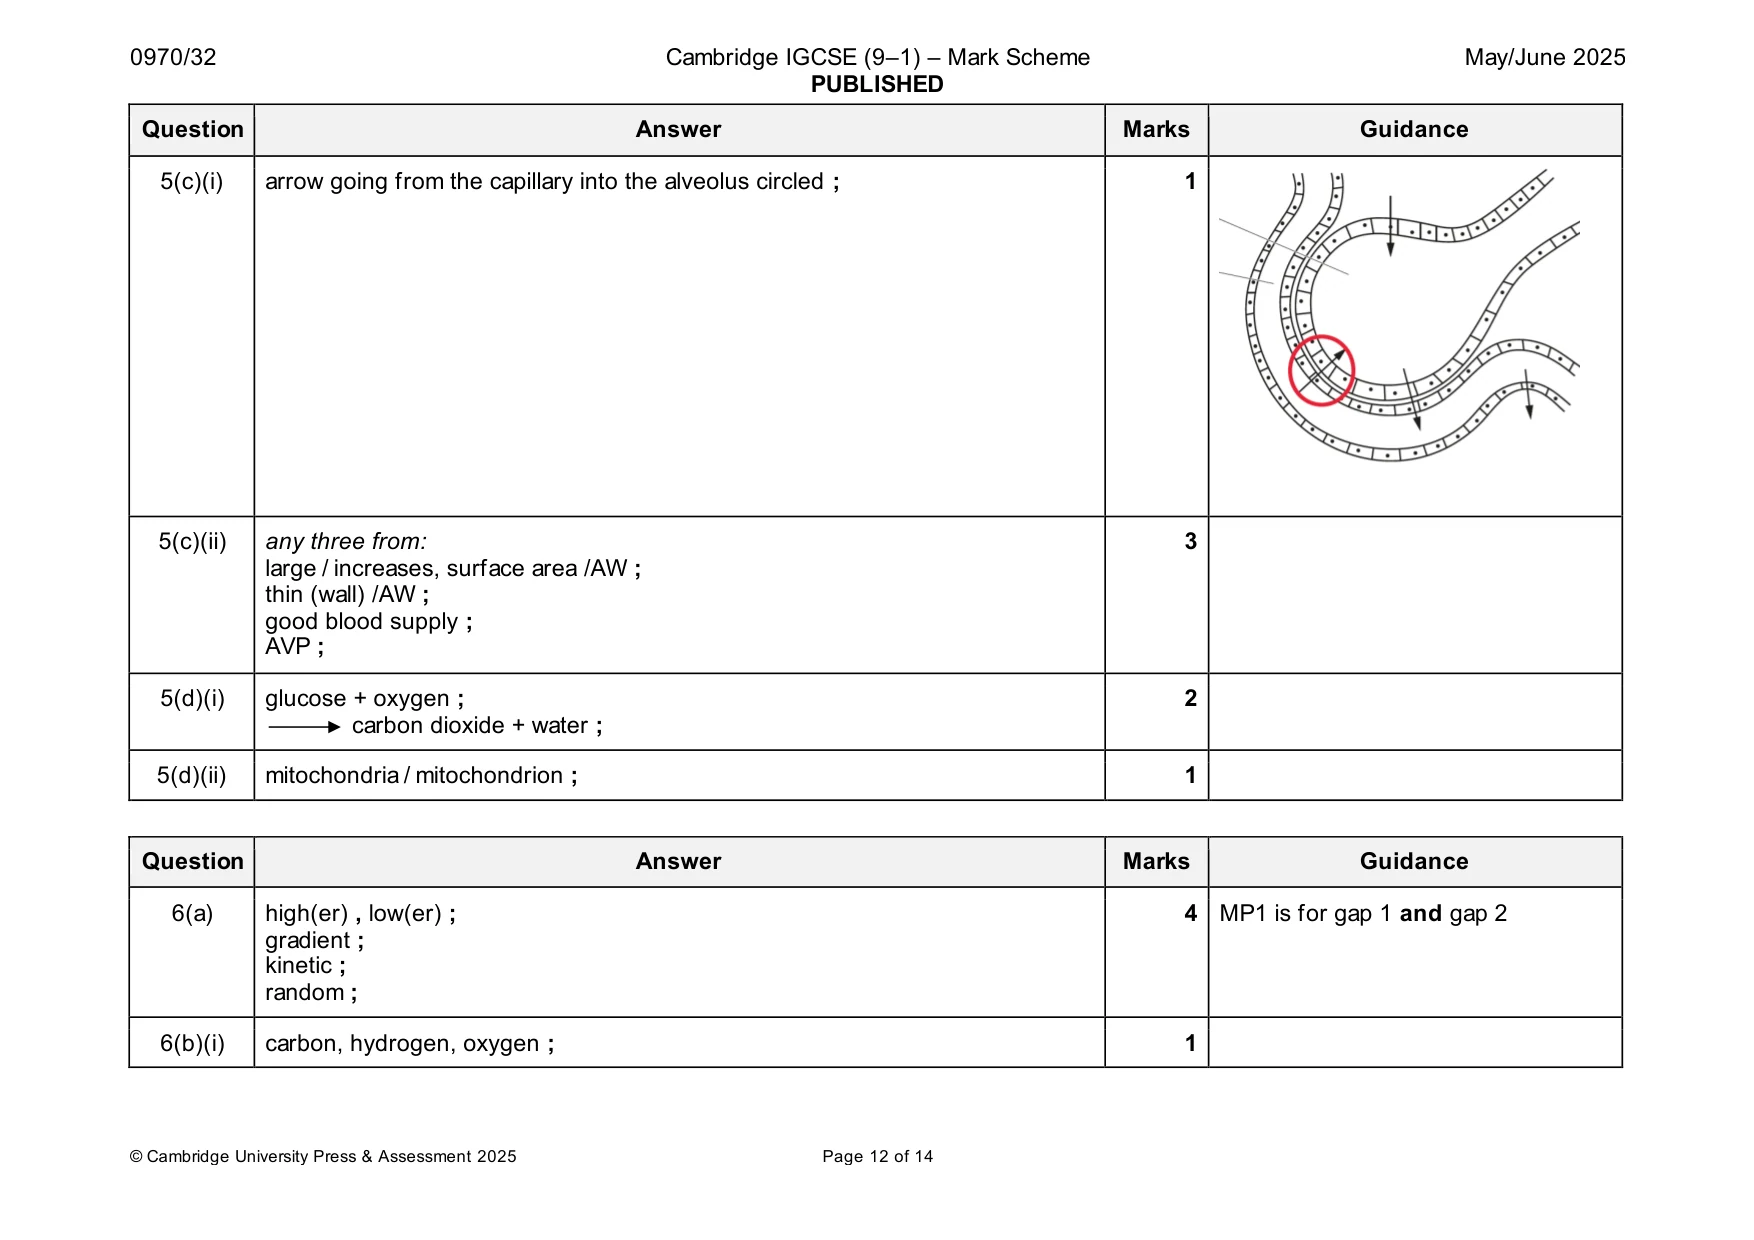
Mark scheme: 5(a) 3 one mark for each correct label ;;; 5(b)(i) bronchioles circled ; 1 5(b)(ii) lung(s) ; 1 5(c)(i) arrow going from the capillary into the alveolus circled ; 1 5(c)(ii) any three from: 3 large / increases, surface area /AW ; thin (wall) /AW ; good blood supply ; AVP ; 5(d)(i) glucose + oxygen ; 2 carbon dioxide + water ; 5(d)(ii) mitochondria / mitochondrion ; 1
Q6 · Complete the sentences about diffusion
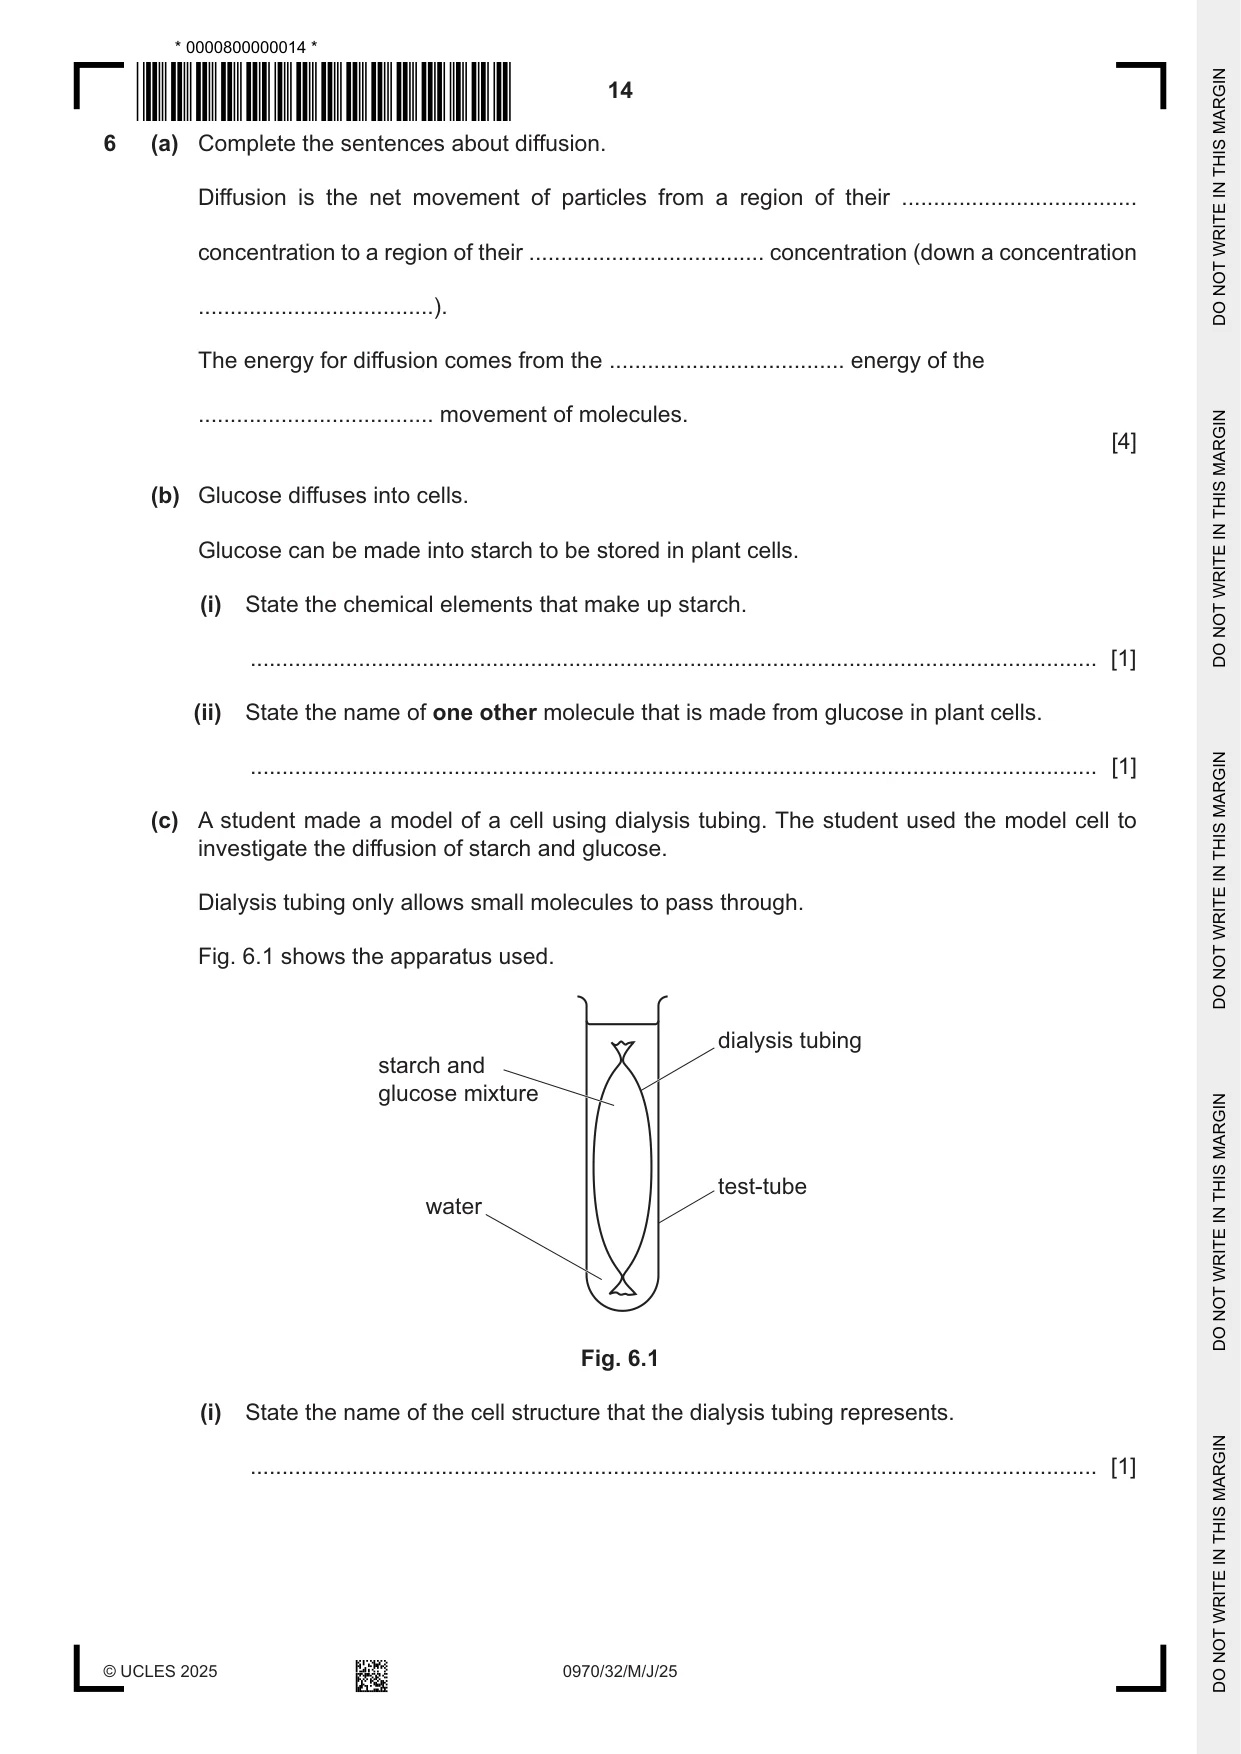
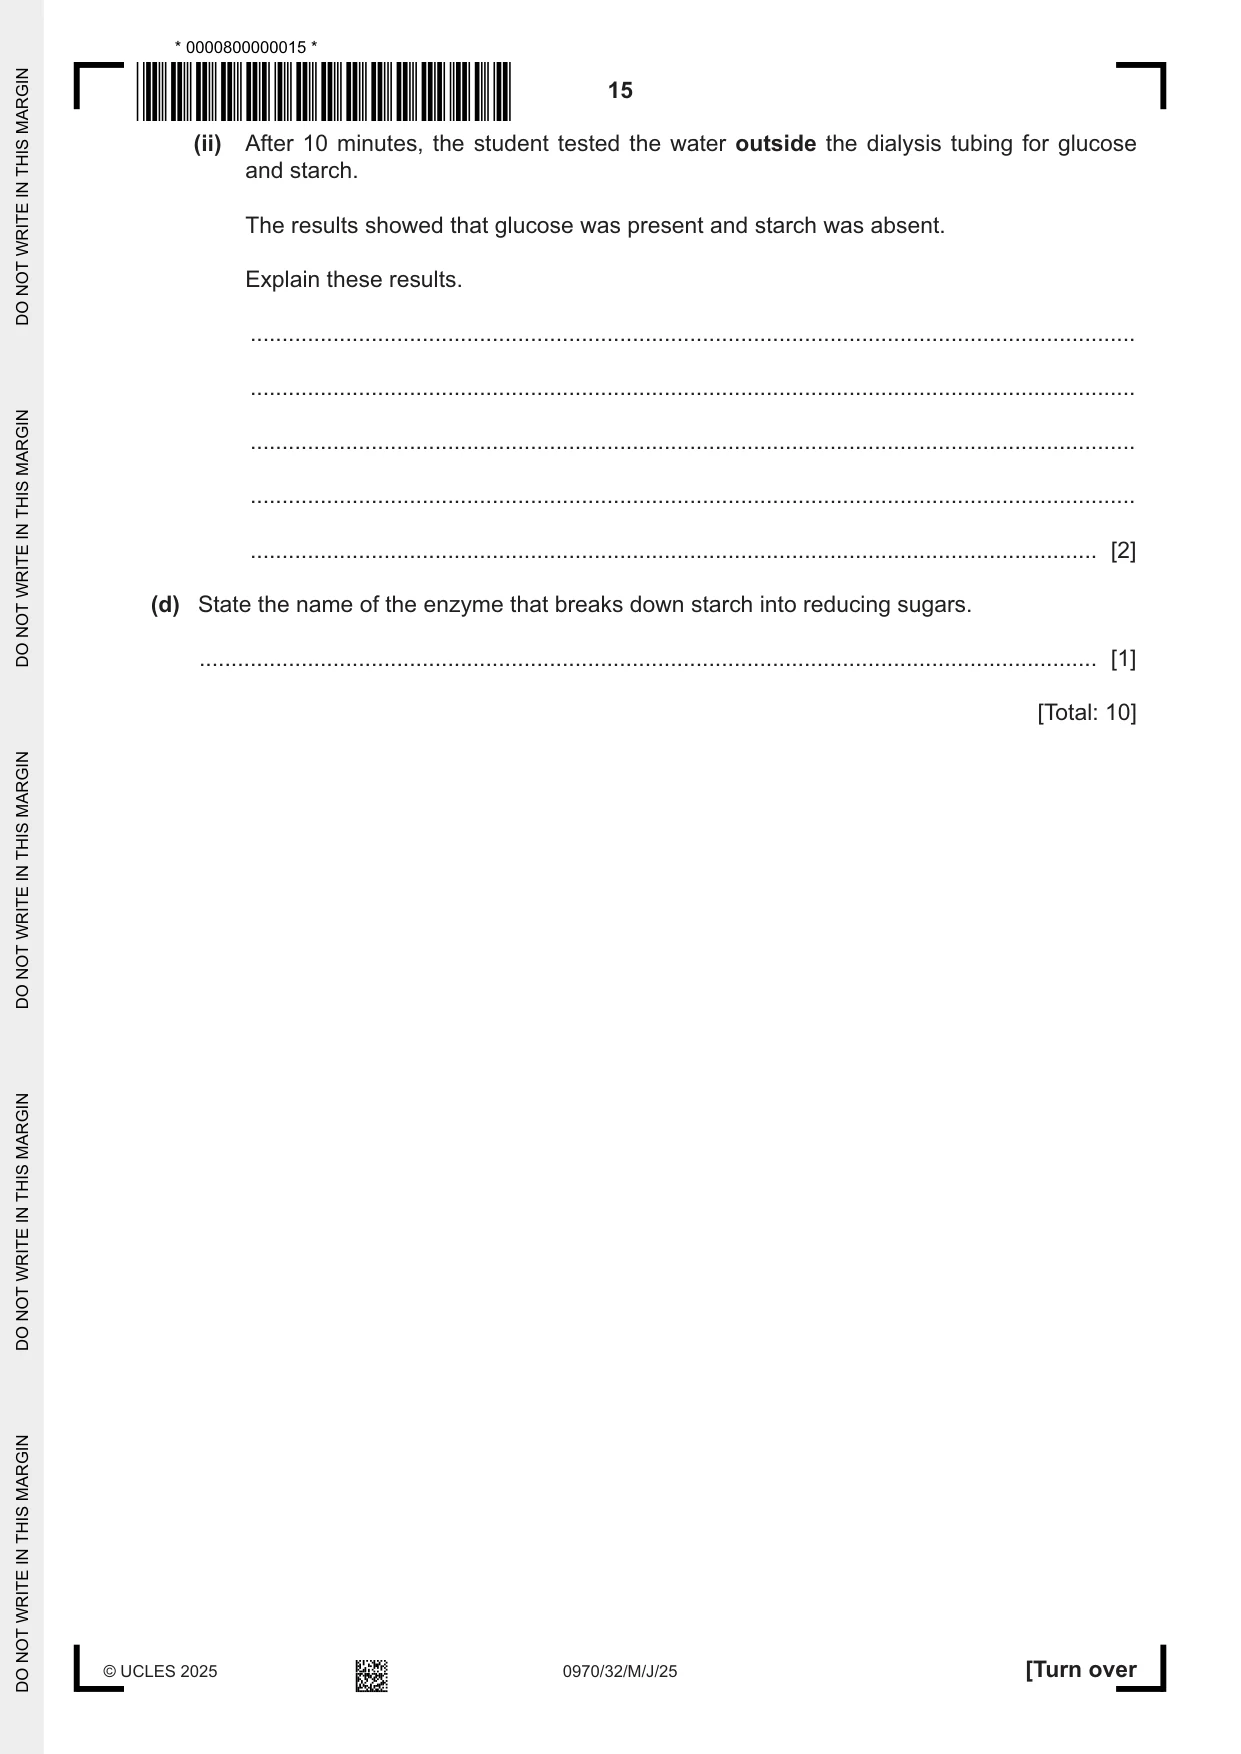
6 (a) Complete the sentences about diffusion. Diffusion is the net movement of particles from a region of their ..................................... concentration to a region of their ..................................... concentration (down a concentration .....................................). The energy for diffusion comes from the ..................................... energy of the ..................................... movement of molecules. [4] (b) Glucose diffuses into cells. Glucose can be made into starch to be stored in plant cells. (i) State the chemical elements that make up starch. ..................................................................................................................................... [1] (ii) State the name of one other molecule that is made from glucose in plant cells. ..................................................................................................................................... [1] (c) A student made a model of a cell using dialysis tubing. The student used the model cell to investigate the diffusion of starch and glucose. Dialysis tubing only allows small molecules to pass through. Fig. 6.1 shows the apparatus used. dialysis tubing starch and glucose mixture test-tube water Fig. 6.1 (i) State the name of the cell structure that the dialysis tubing represents. ..................................................................................................................................... [1] (ii) After 10 minutes, the student tested the water outside the dialysis tubing for glucose and starch. The results showed that glucose was present and starch was absent. Explain these results. ........................................................................................................................................... ........................................................................................................................................... ........................................................................................................................................... ........................................................................................................................................... ..................................................................................................................................... [2] (d) State the name of the enzyme that breaks down starch into reducing sugars. ............................................................................................................................................. [1] [Total: 10]
Mark scheme: 6(a) high(er) , low(er) ; 4 MP1 is for gap 1 and gap 2 gradient ; kinetic ; random ; 6(b)(i) carbon, hydrogen, oxygen ; 1 6(b)(ii) any one from: 1 cellulose ; sucrose ; AVP ; 6(c)(i) (cell) membrane ; 1 6(c)(ii) glucose can / starch cannot, move out (of the dialysis tubing) ; 2 (because) glucose is a small molecule / starch is a large molecule ; 6(d) amylase ; 1
Q7 · A photograph of an Asian elephant, Elephas maximus
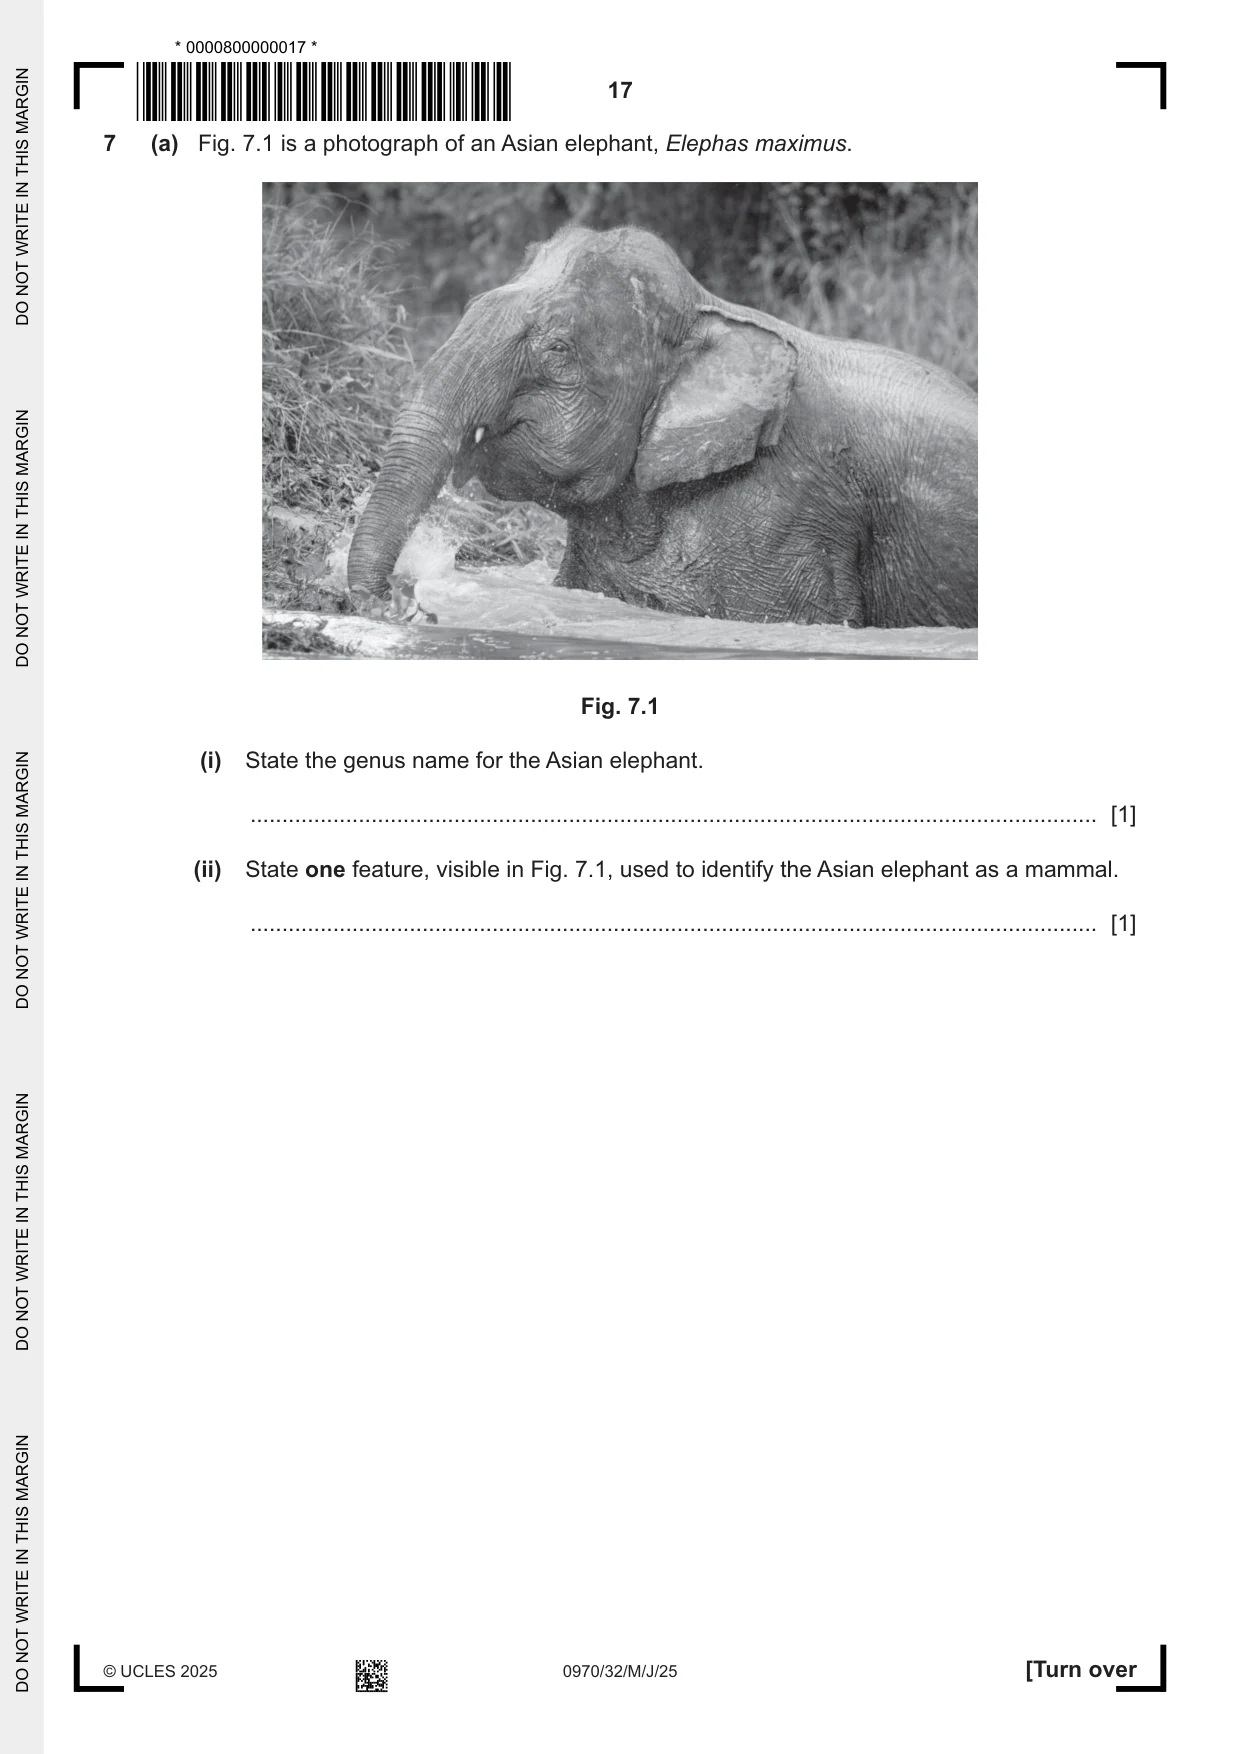
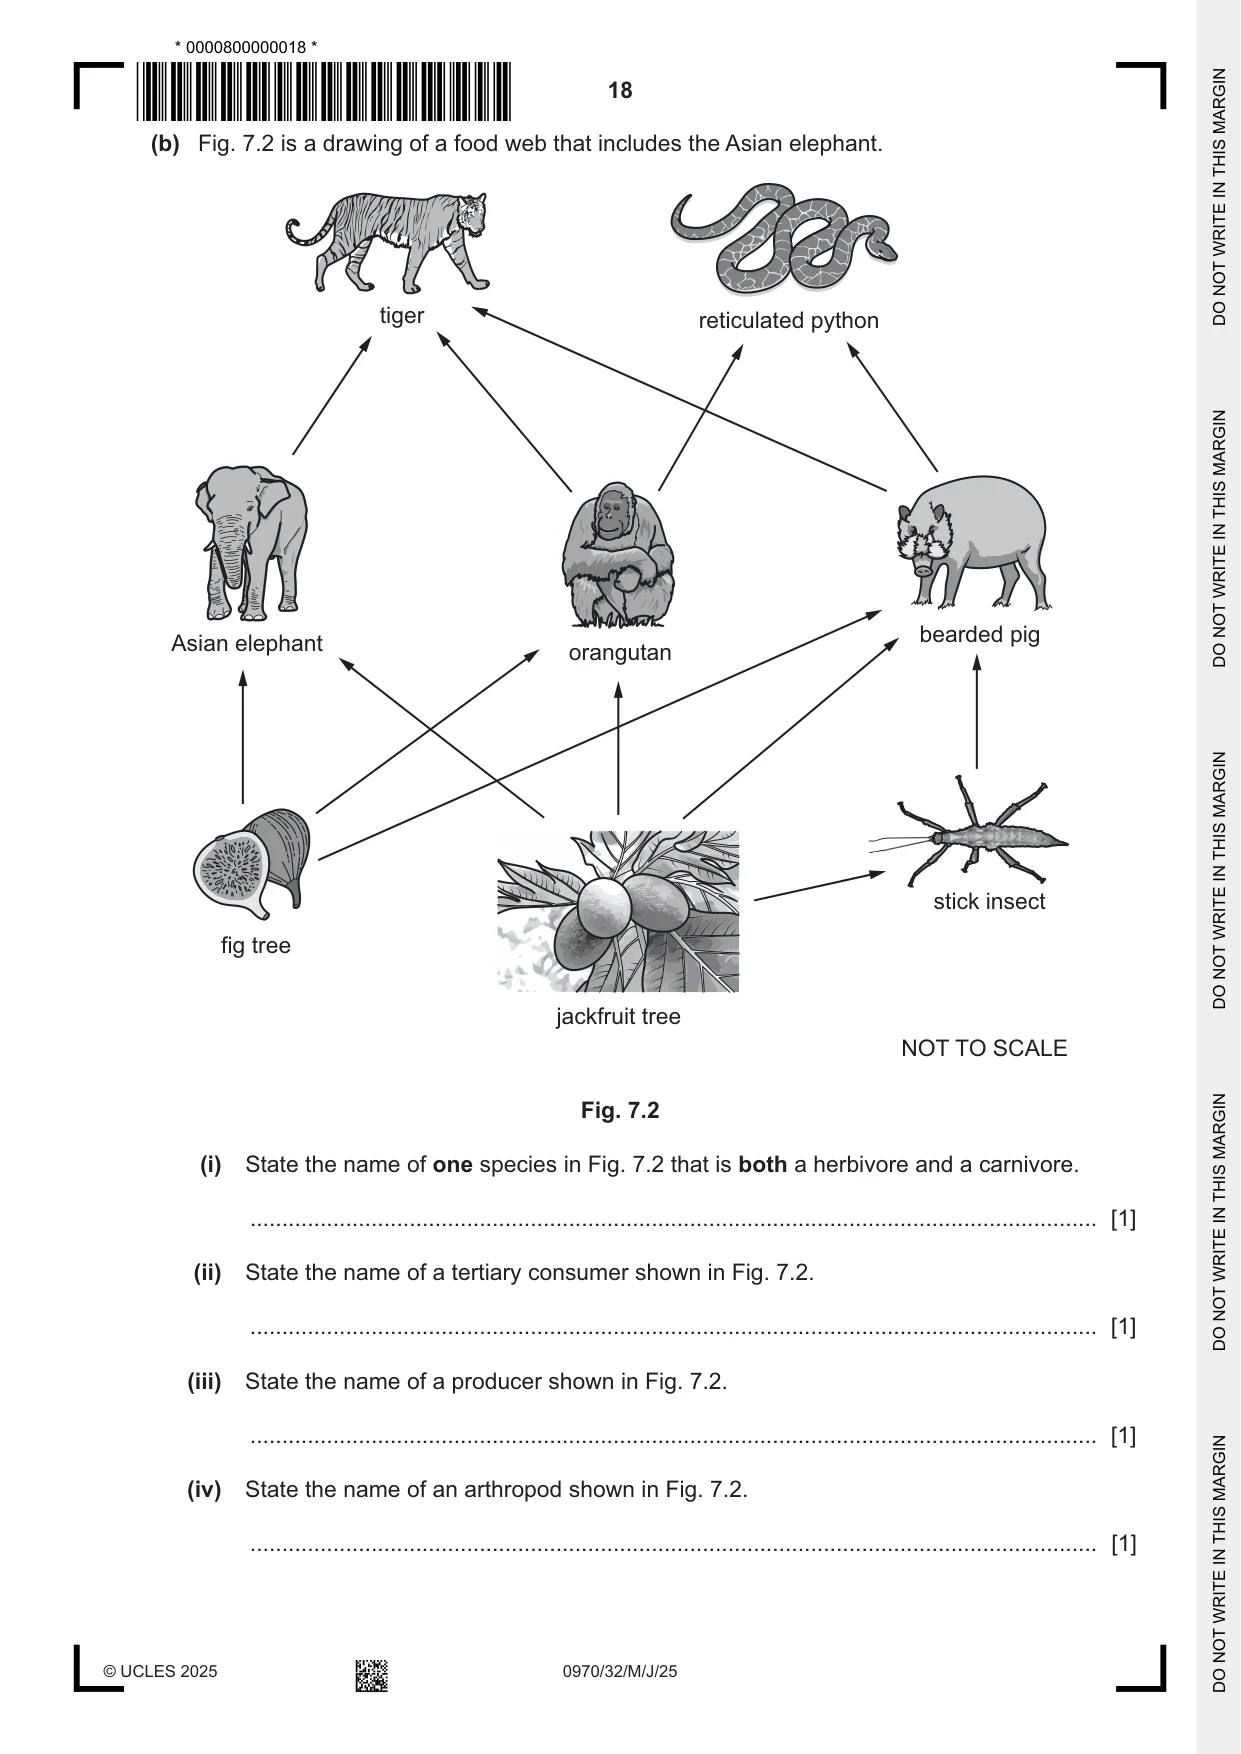
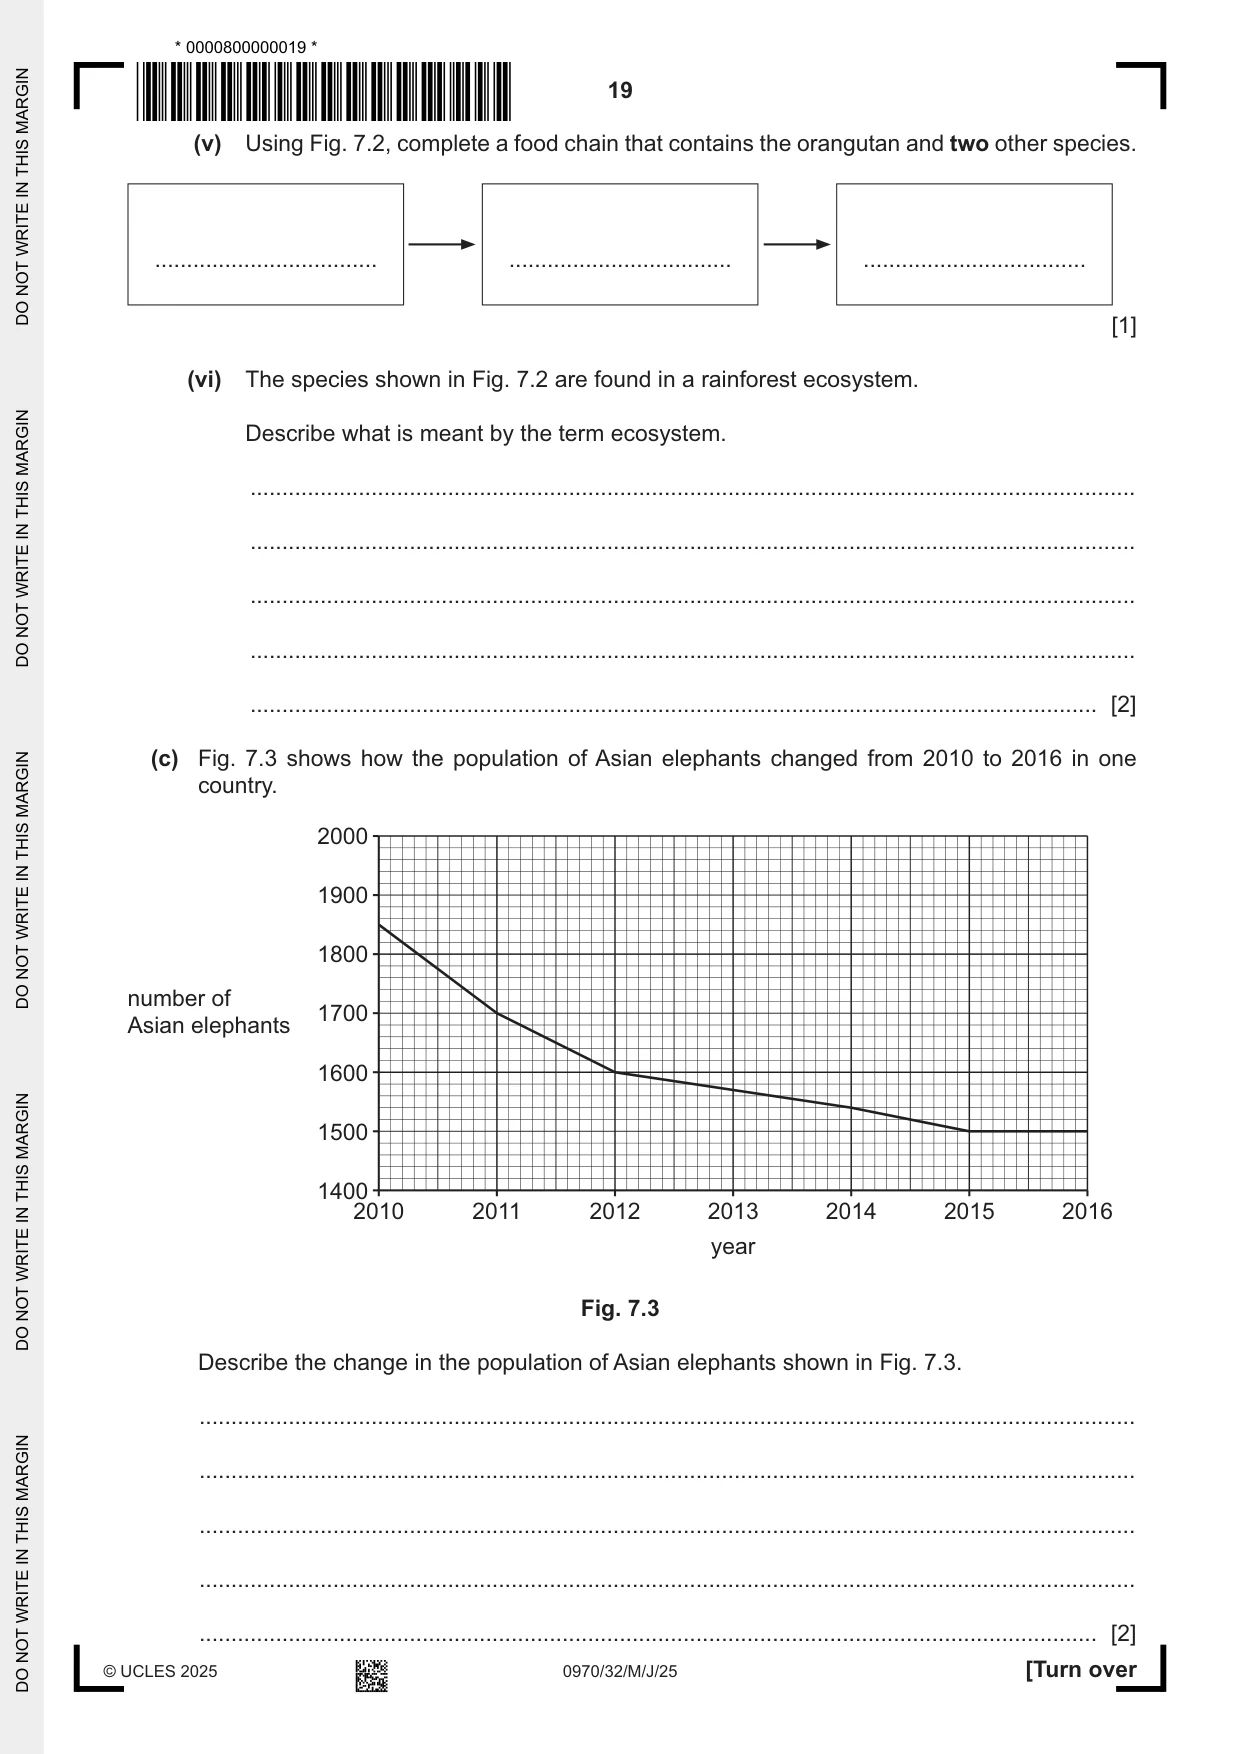
7 (a) Fig. 7.1 is a photograph of an Asian elephant, Elephas maximus. Fig. 7.1 (i) State the genus name for the Asian elephant. ..................................................................................................................................... [1] (ii) State one feature, visible in Fig. 7.1, used to identify the Asian elephant as a mammal. ..................................................................................................................................... [1] (b) Fig. 7.2 is a drawing of a food web that includes the Asian elephant. tiger reticulated python bearded pig Asian elephant orangutan stick insect fig tree jackfruit tree NOT TO SCALE Fig. 7.2 (i) State the name of one species in Fig. 7.2 that is both a herbivore and a carnivore. ..................................................................................................................................... [1] (ii) State the name of a tertiary consumer shown in Fig. 7.2. ..................................................................................................................................... [1] (iii) State the name of a producer shown in Fig. 7.2. ..................................................................................................................................... [1] (iv) State the name of an arthropod shown in Fig. 7.2. ..................................................................................................................................... [1] (v) Using Fig. 7.2, complete a food chain that contains the orangutan and two other species. ................................... ................................... ................................... [1] (vi) The species shown in Fig. 7.2 are found in a rainforest ecosystem. Describe what is meant by the term ecosystem. ........................................................................................................................................... ........................................................................................................................................... ........................................................................................................................................... ........................................................................................................................................... ..................................................................................................................................... [2] (c) Fig. 7.3 shows how the population of Asian elephants changed from 2010 to 2016 in one country. 2000 1900 1800 number of 1700 Asian elephants 1600 1500 1400 2010 2011 2012 2013 2014 2015 2016 year Fig. 7.3 Describe the change in the population of Asian elephants shown in Fig. 7.3. ................................................................................................................................................... ................................................................................................................................................... ................................................................................................................................................... ...................................................................................................................................................
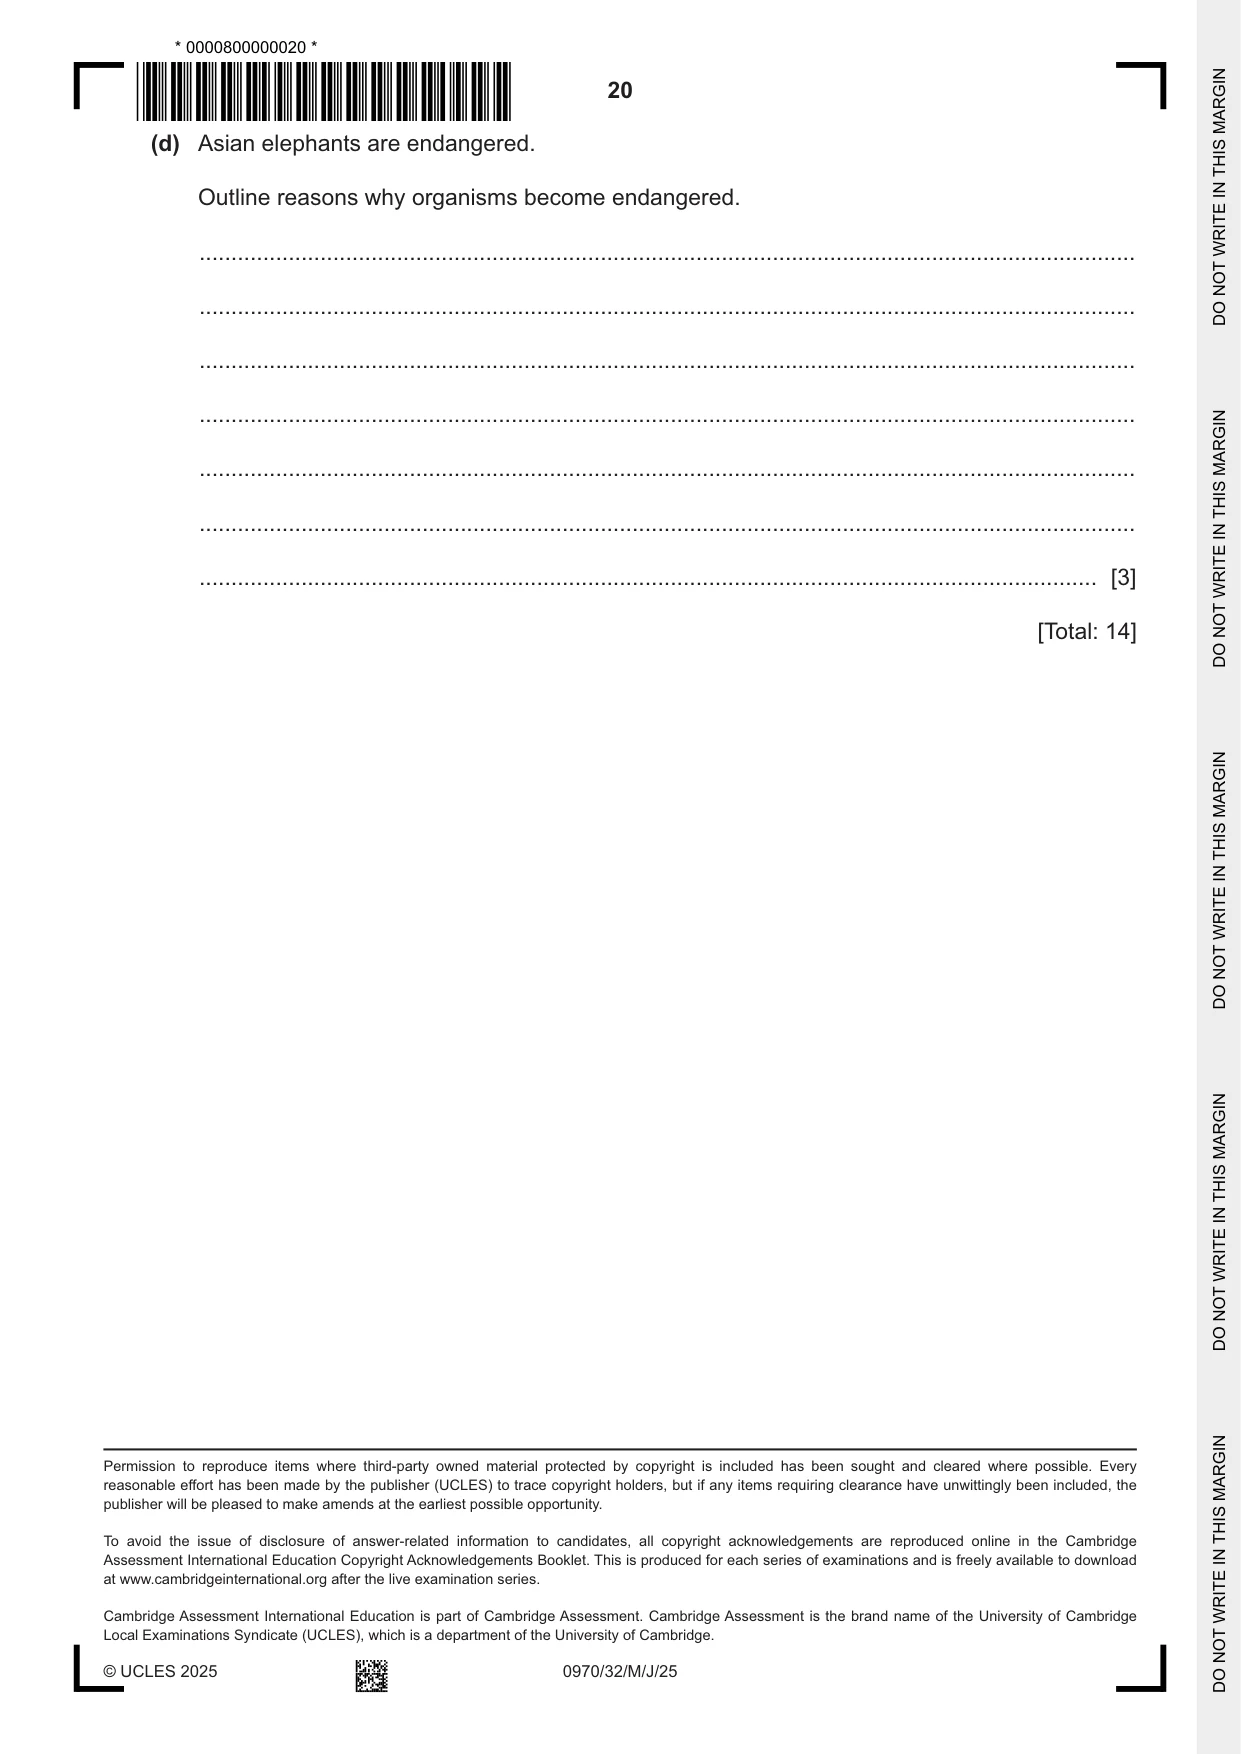
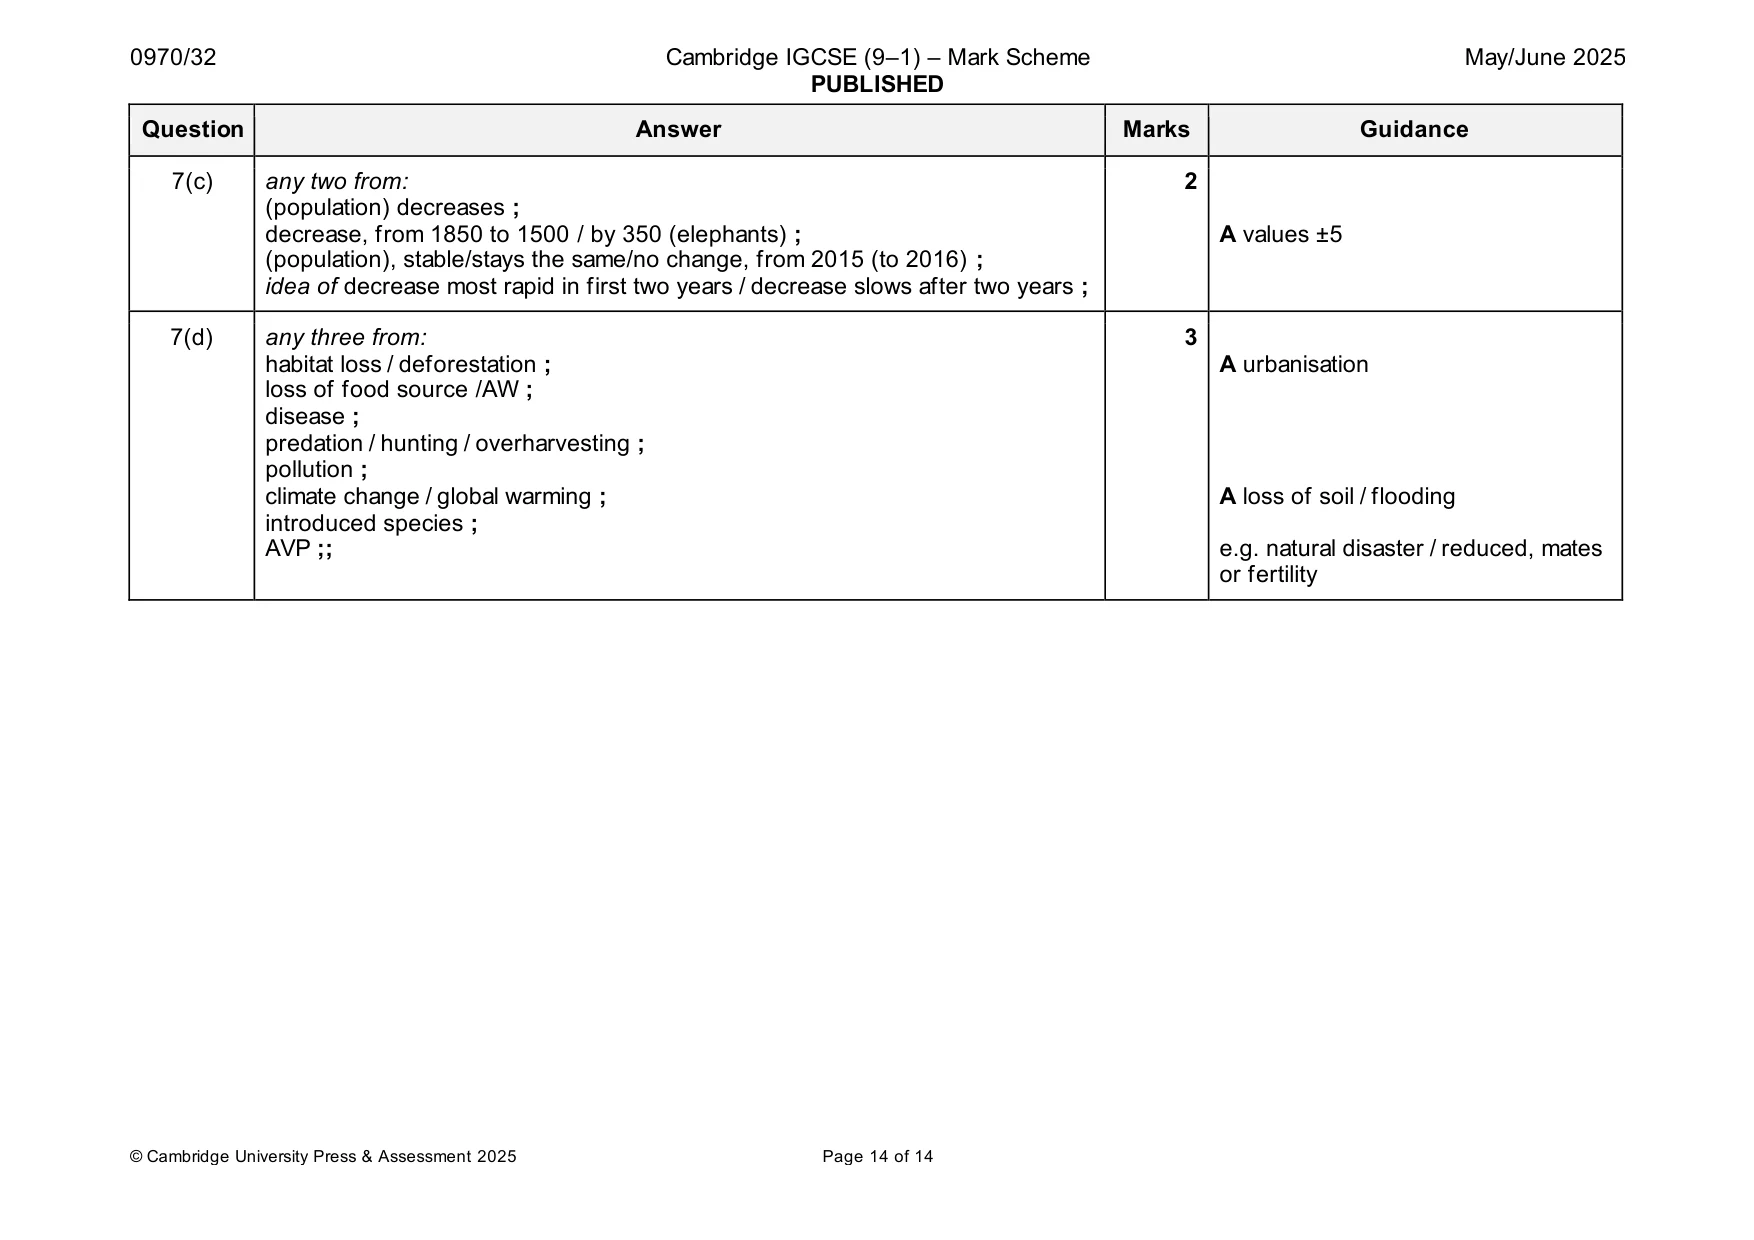
Mark scheme: 7(a)(i) Elephas ; 1 7(a)(ii) hair / external ear / pinna ; 1 7(b)(i) (bearded) pig ; 1 7(b)(ii) (reticulated) python / tiger ; 1 7(b)(iii) fig (tree) / jackfruit (tree) ; 1 7(b)(iv) stick insect ; 1 7(b)(v) fig (tree) / jackfruit (tree) orangutan tiger / (reticulated) python ; 1 7(b)(vi) (a unit containing) the community of organisms ; 2 and their environment (interacting together) ; 7(c) any two from: 2 (population) decreases ; decrease, from 1850 to 1500 / by 350 (elephants) ; A values ±5 (population), stable/stays the same/no change, from 2015 (to 2016) ; idea of decrease most rapid in first two years / decrease slows after two years ; 7(d) any three from: 3 habitat loss / deforestation ; A urbanisation loss of food source /AW ; disease ; predation / hunting / overharvesting ; pollution ; climate change / global warming ; A loss of soil / flooding introduced species ; AVP ;; e.g. natural disaster / reduced, mates or fertility
What was in this paper
The subtopics covered by these 7 questions, and how many questions each got. Open one in a new tab to see every Cambridge question on it.
What you needed in this session
Cambridge’s own grade thresholds for 2025 May/June, Paper 3 · Variant 2. A higher threshold means an easier paper — the bar moves with how the cohort did.