Cambridge IGCSE Biology (9-1) 0970 — 2023 Oct/Nov Paper 3 · Variant 2
0970/32/O/N/23 · 8 questions · 80 marks · ≈90 min
The question paper and its mark scheme, free to read here and free to download. This is Cambridge’s own paper, exactly as it was sat.
Question paper20 pages

Mark scheme13 pages
Answers below. Sit the paper first if you are practising.
Questions as text
Q1 · A diagram of the digestive system
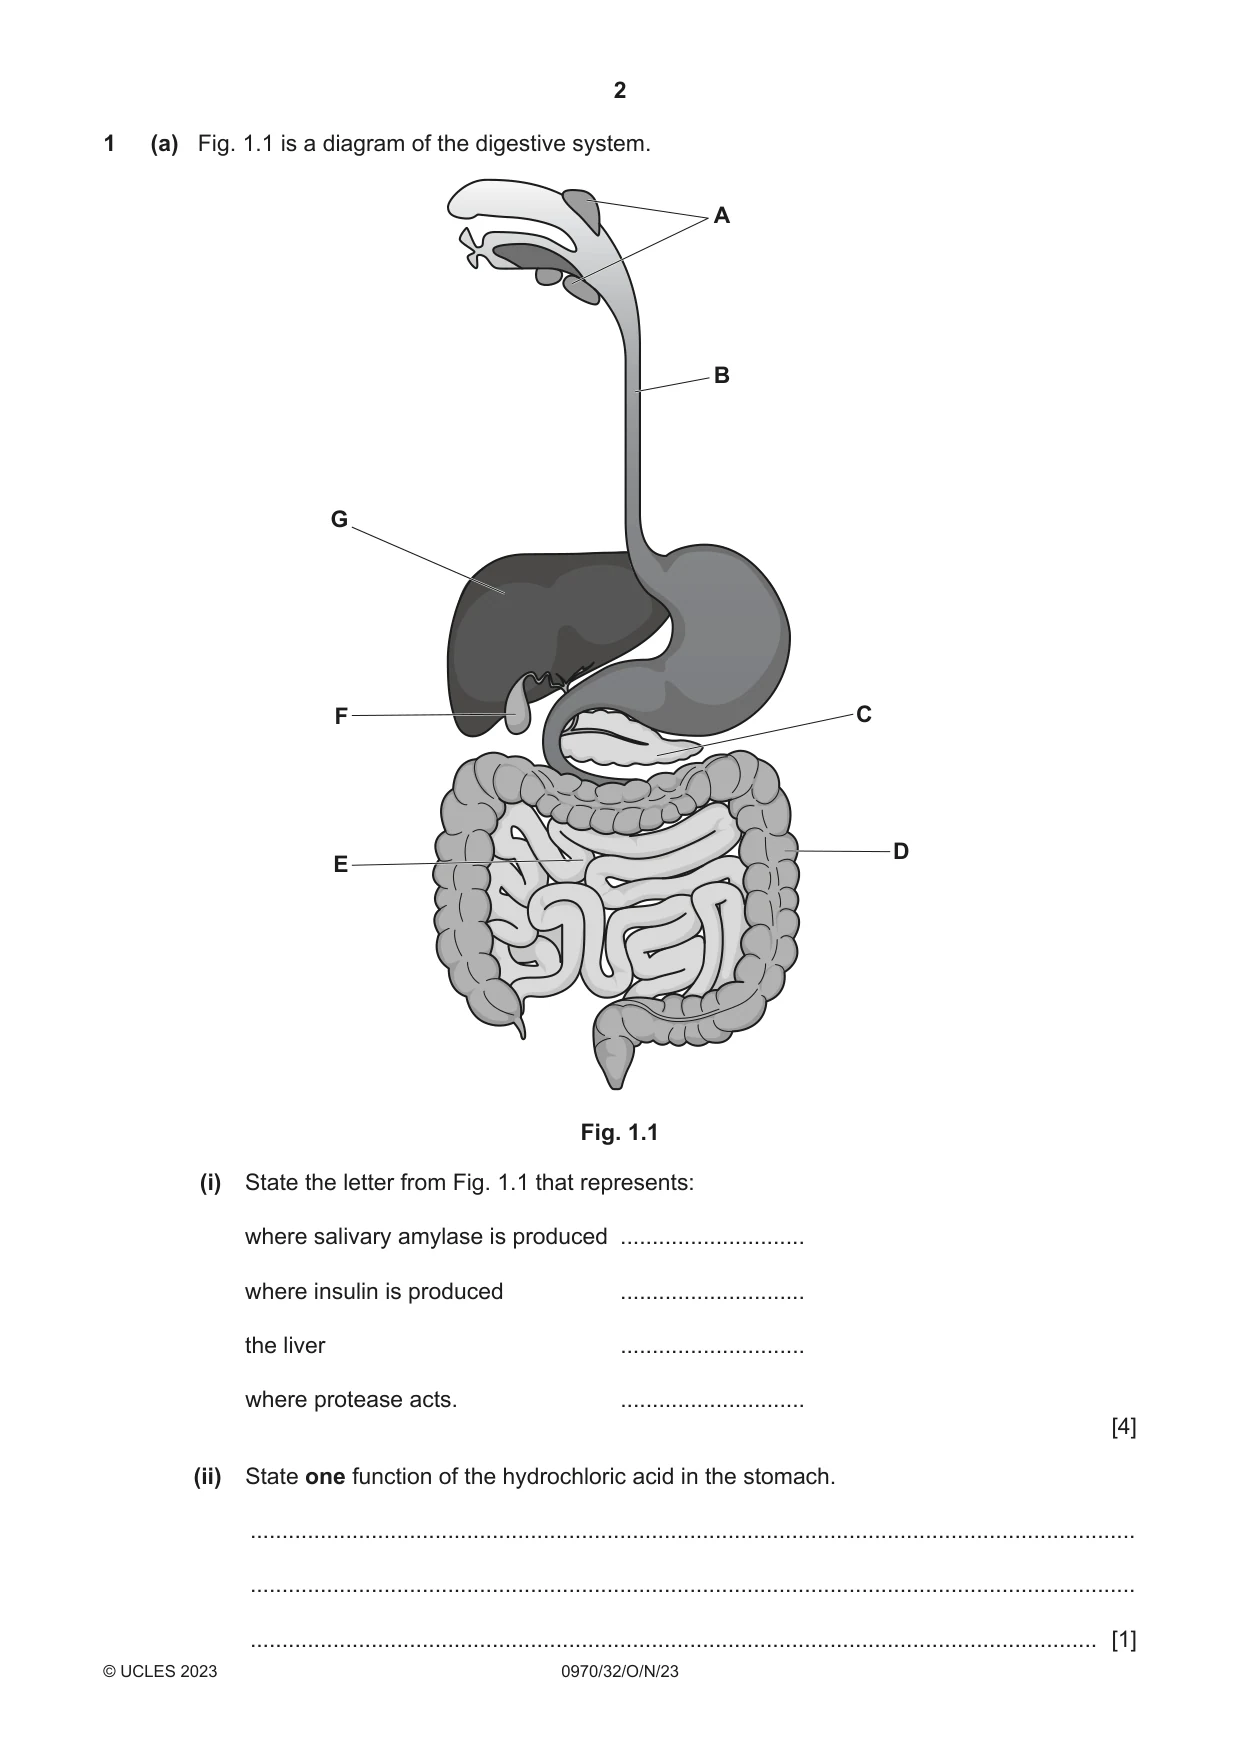
1 (a) Fig. 1.1 is a diagram of the digestive system. A B G F C D E Fig. 1.1 (i) State the letter from Fig. 1.1 that represents: where salivary amylase is produced ............................. where insulin is produced ............................. the liver ............................. where protease acts. ............................. [4] (ii) State one function of the hydrochloric acid in the stomach. ........................................................................................................................................... ........................................................................................................................................... ..................................................................................................................................... [1] (b) Amylase is an enzyme. (i) Describe the function of amylase. ........................................................................................................................................... ........................................................................................................................................... ..................................................................................................................................... [2] (ii) Define the term enzyme. ........................................................................................................................................... ........................................................................................................................................... ..................................................................................................................................... [2] [Total: 9]
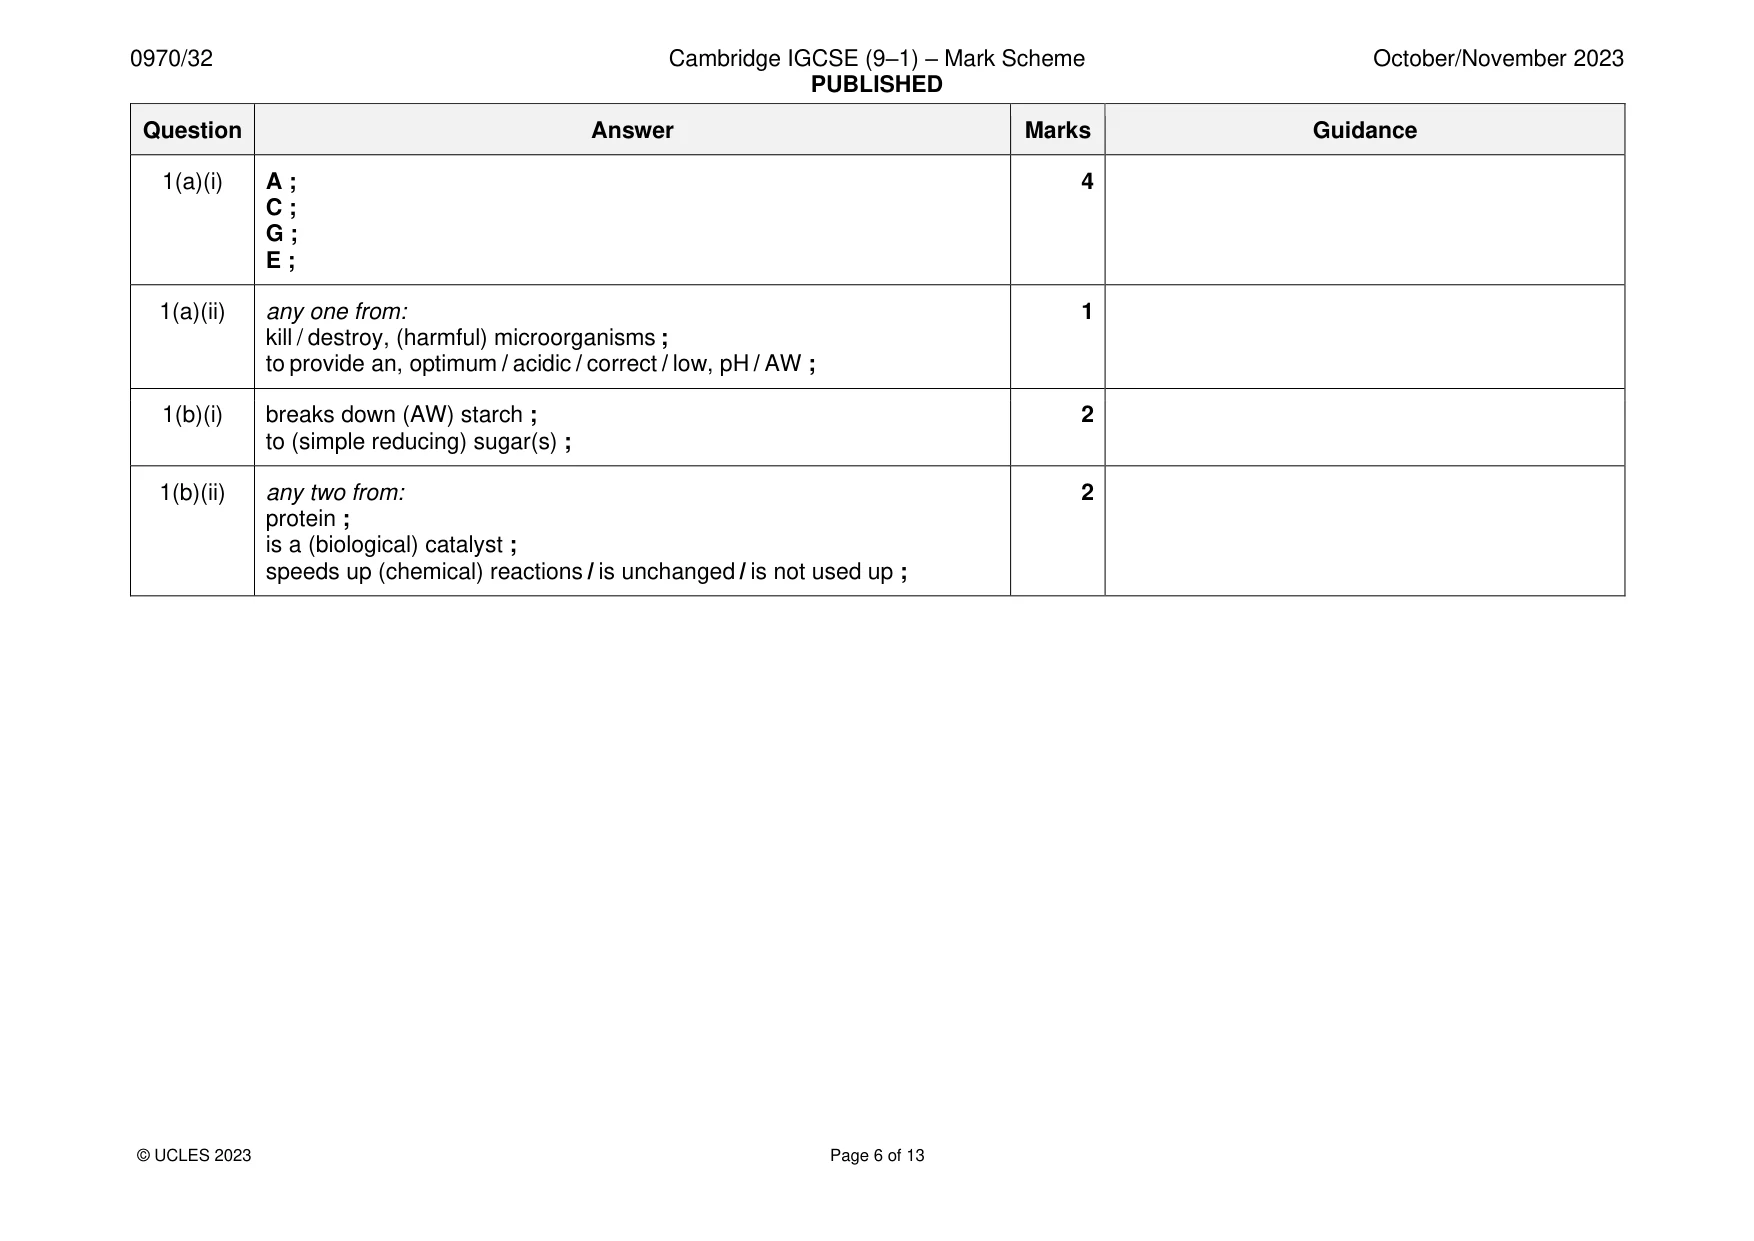
Mark scheme: Question Answer Marks Guidance 1(a)(i) A ; 4 C ; G ; E ; 1(a)(ii) any one from: 1 kill / destroy, (harmful) microorganisms ; to provide an, optimum / acidic / correct / low, pH / AW ; 1(b)(i) breaks down (AW) starch ; 2 to (simple reducing) sugar(s) ; 1(b)(ii) any two from: 2 protein ; is a (biological) catalyst ; speeds up (chemical) reactions / is unchanged / is not used up ;
Q2 · A student investigated photosynthesis in a variegated leaf
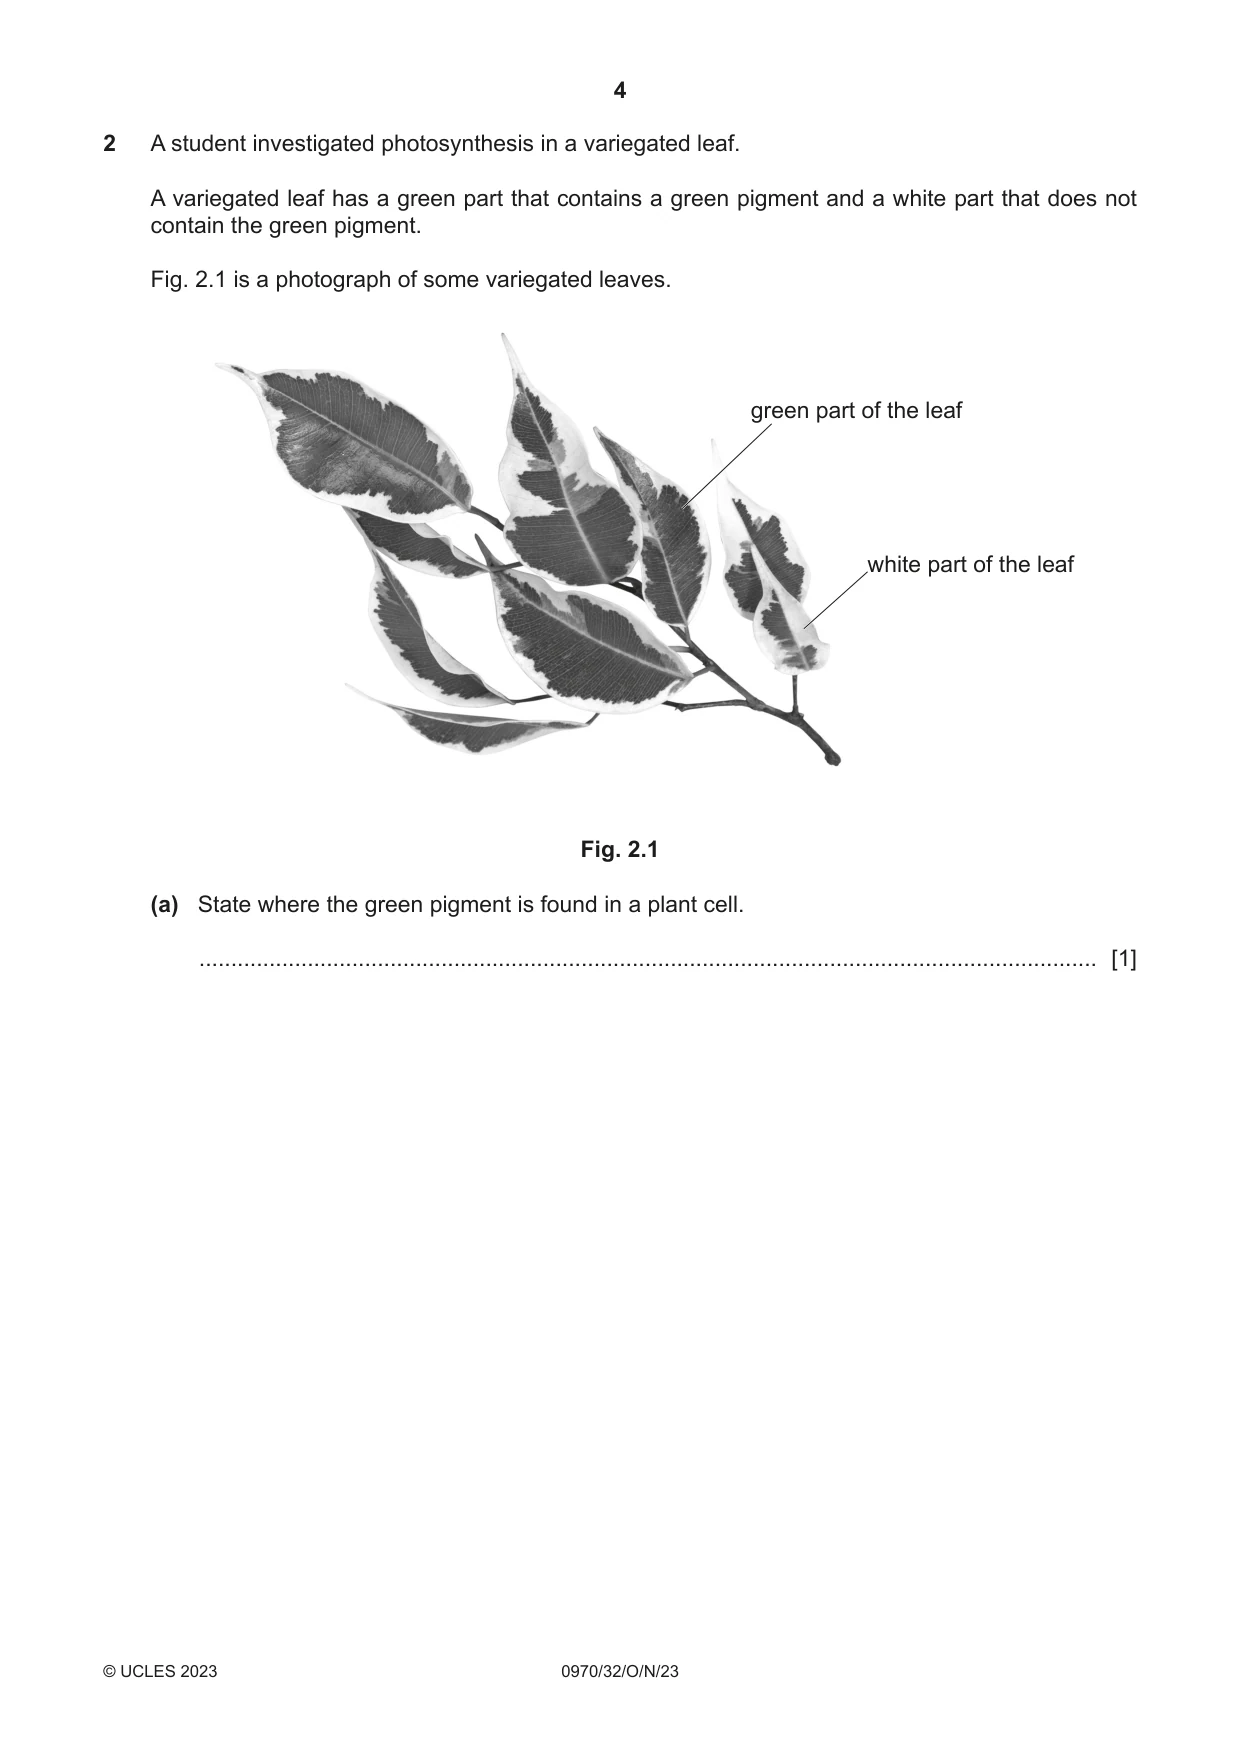
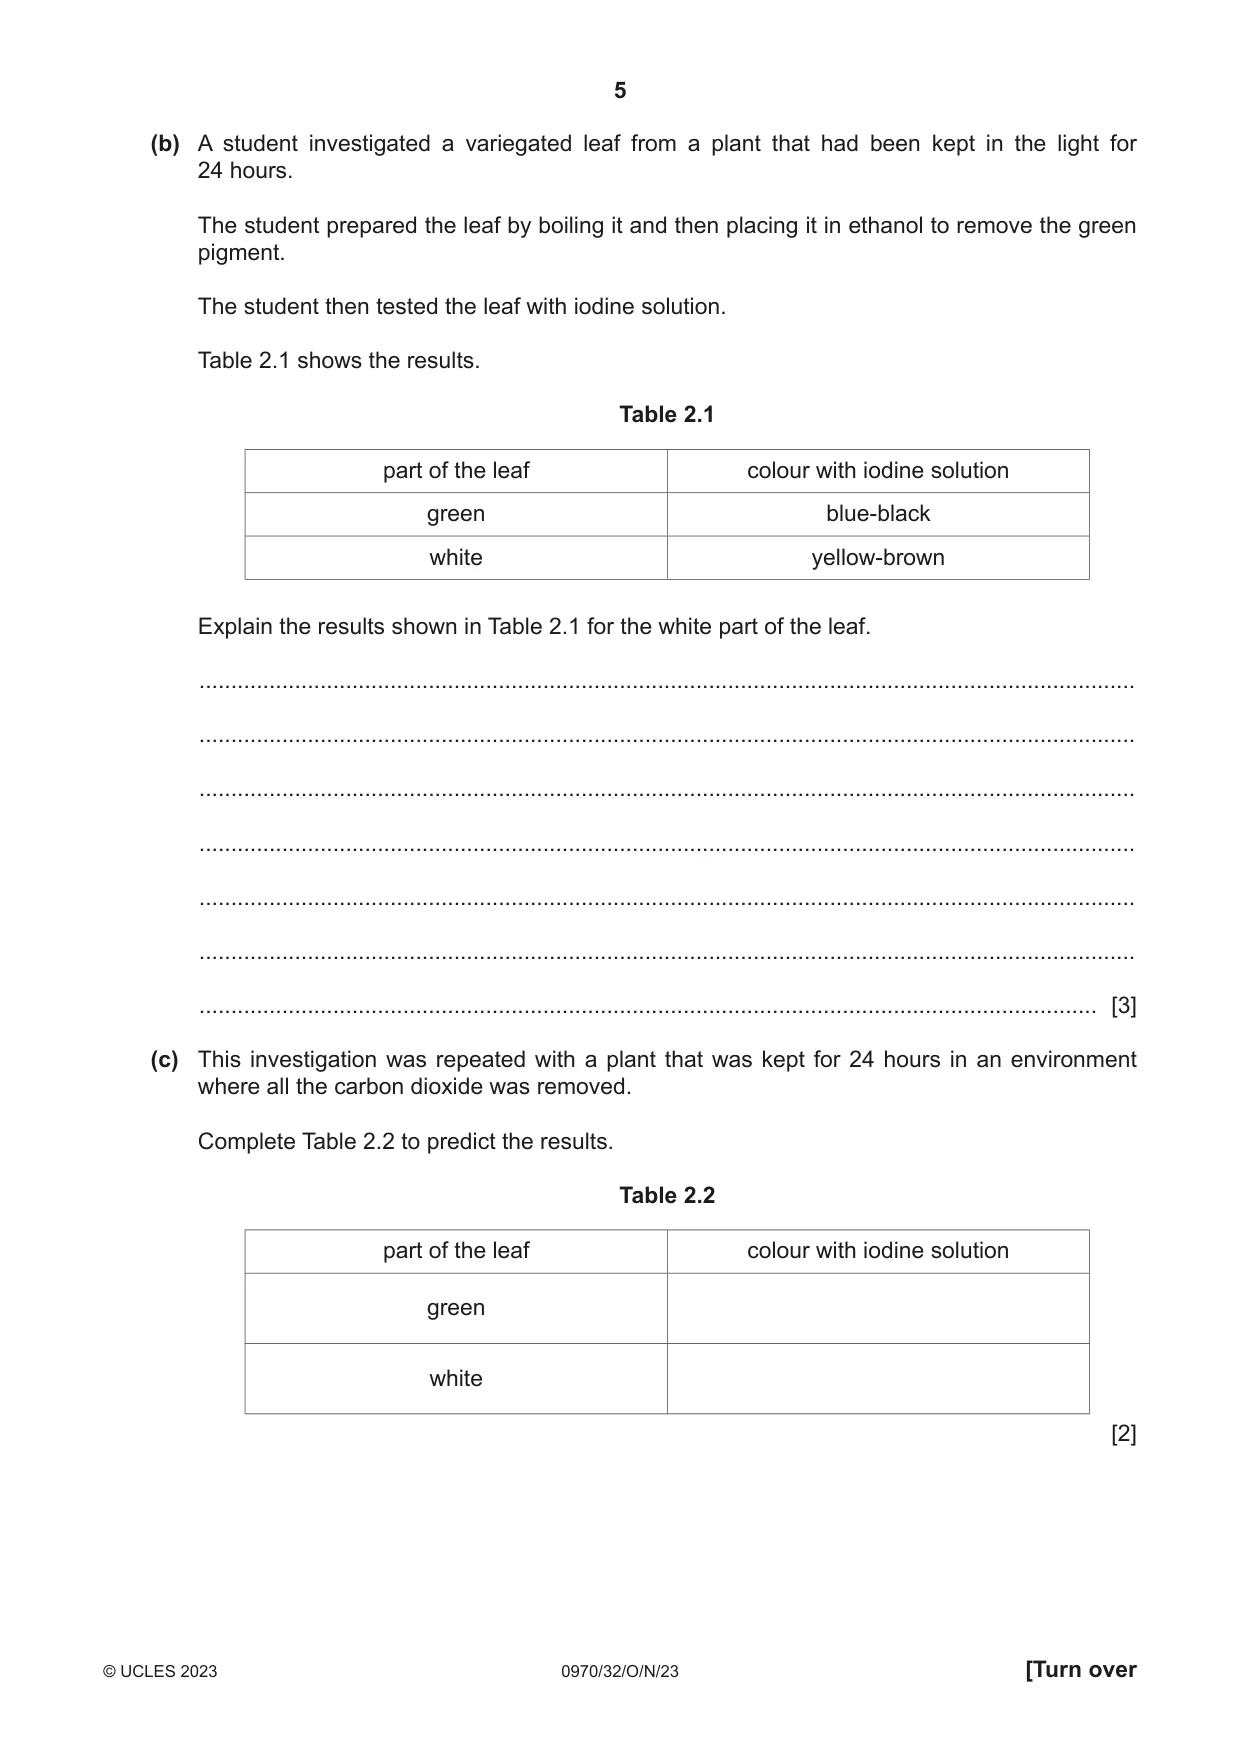
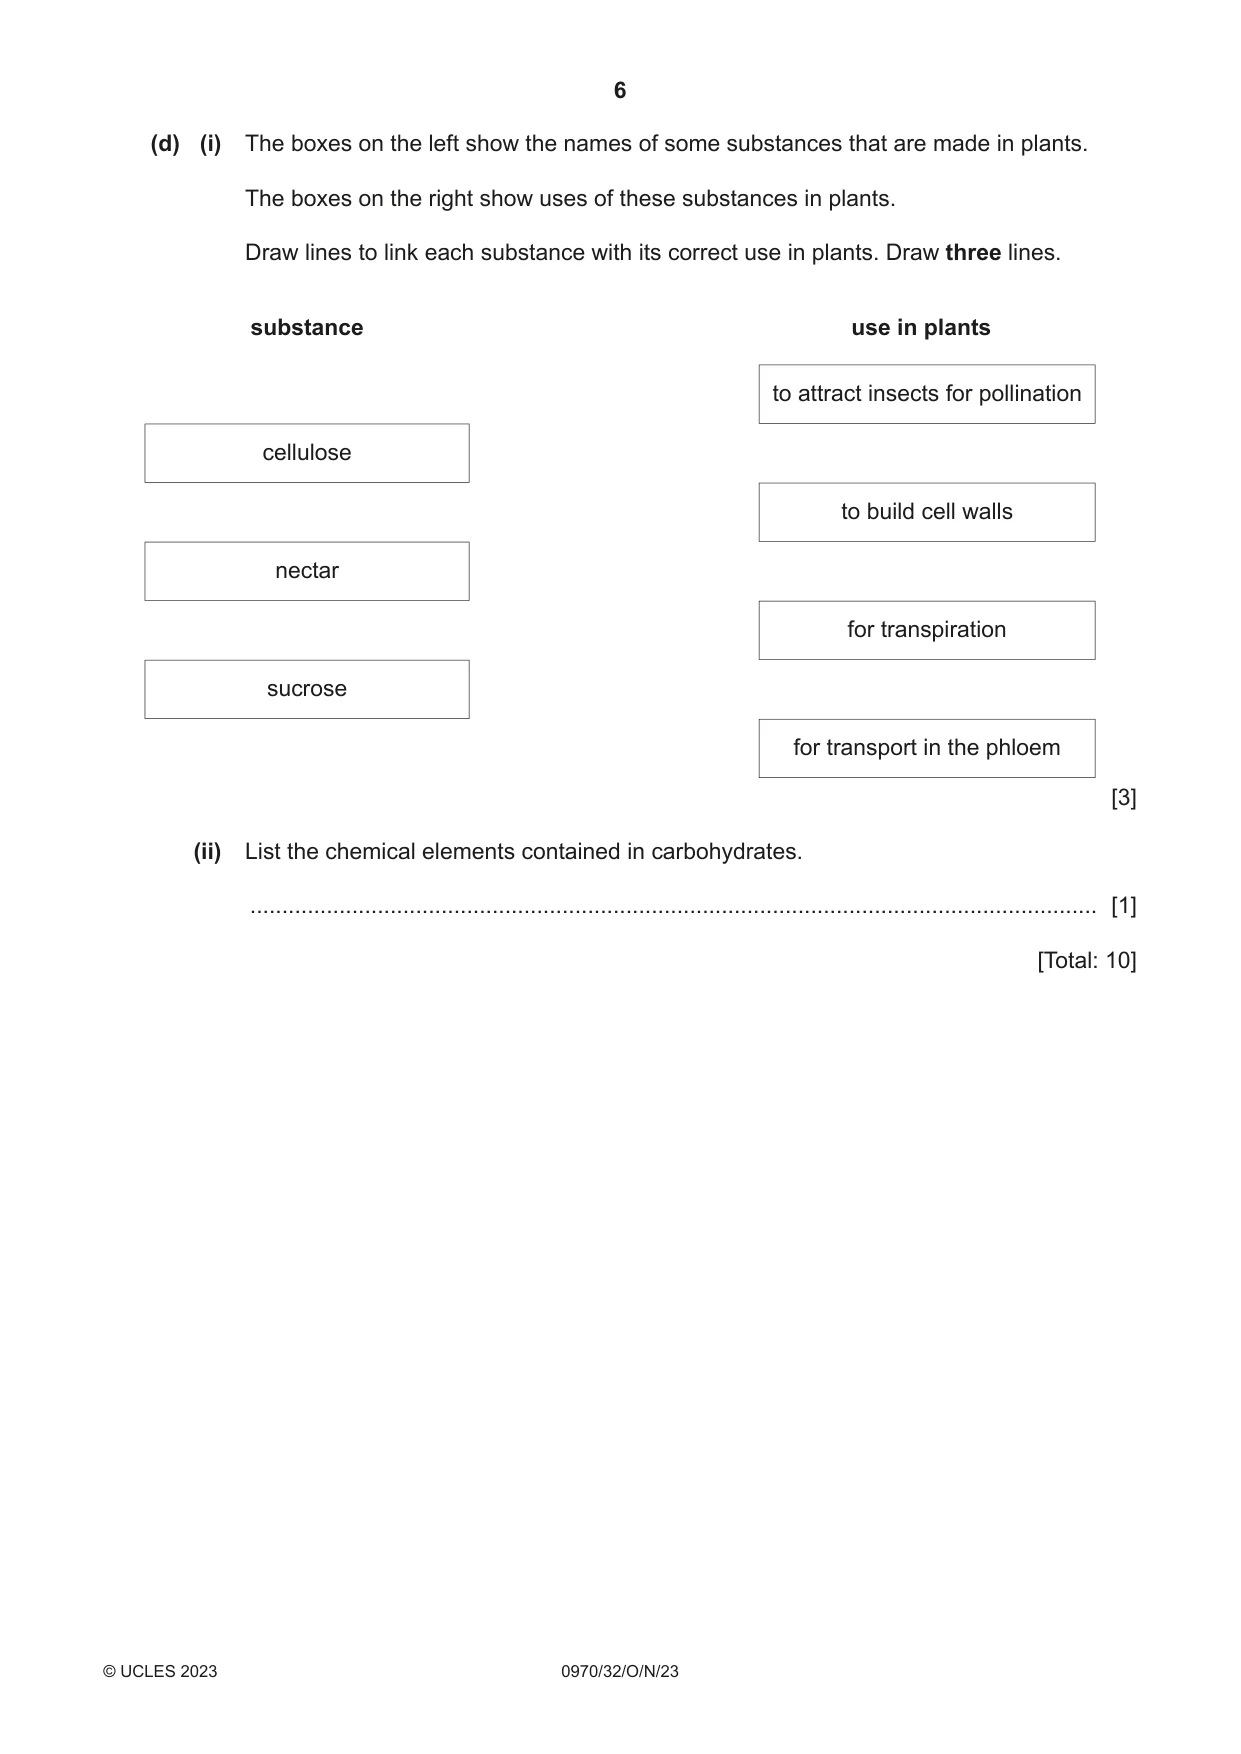
2 A student investigated photosynthesis in a variegated leaf. A variegated leaf has a green part that contains a green pigment and a white part that does not contain the green pigment. Fig. 2.1 is a photograph of some variegated leaves. green part of the leaf white part of the leaf Fig. 2.1 (a) State where the green pigment is found in a plant cell. ............................................................................................................................................. [1] (b) A student investigated a variegated leaf from a plant that had been kept in the light for 24 hours. The student prepared the leaf by boiling it and then placing it in ethanol to remove the green pigment. The student then tested the leaf with iodine solution. Table 2.1 shows the results. Table 2.1 part of the leaf colour with iodine solution green blue‑black white yellow‑brown Explain the results shown in Table 2.1 for the white part of the leaf. ................................................................................................................................................... ................................................................................................................................................... ................................................................................................................................................... ................................................................................................................................................... ................................................................................................................................................... ................................................................................................................................................... ............................................................................................................................................. [3] (c) This investigation was repeated with a plant that was kept for 24 hours in an environment where all the carbon dioxide was removed. Complete Table 2.2 to predict the results. Table 2.2 part of the leaf colour with iodine solution green white [2] (d) (i) The boxes on the left show the names of some substances that are made in plants. The boxes on the right show uses of these substances in plants. Draw lines to link each substance with its correct use in plants. Draw three lines. substance use in plants to attract insects for pollination cellulose to build cell walls nectar for transpiration sucrose for transport in the phloem [3] (ii) List the chemical elements contained in carbohydrates. ..................................................................................................................................... [1] [Total: 10]
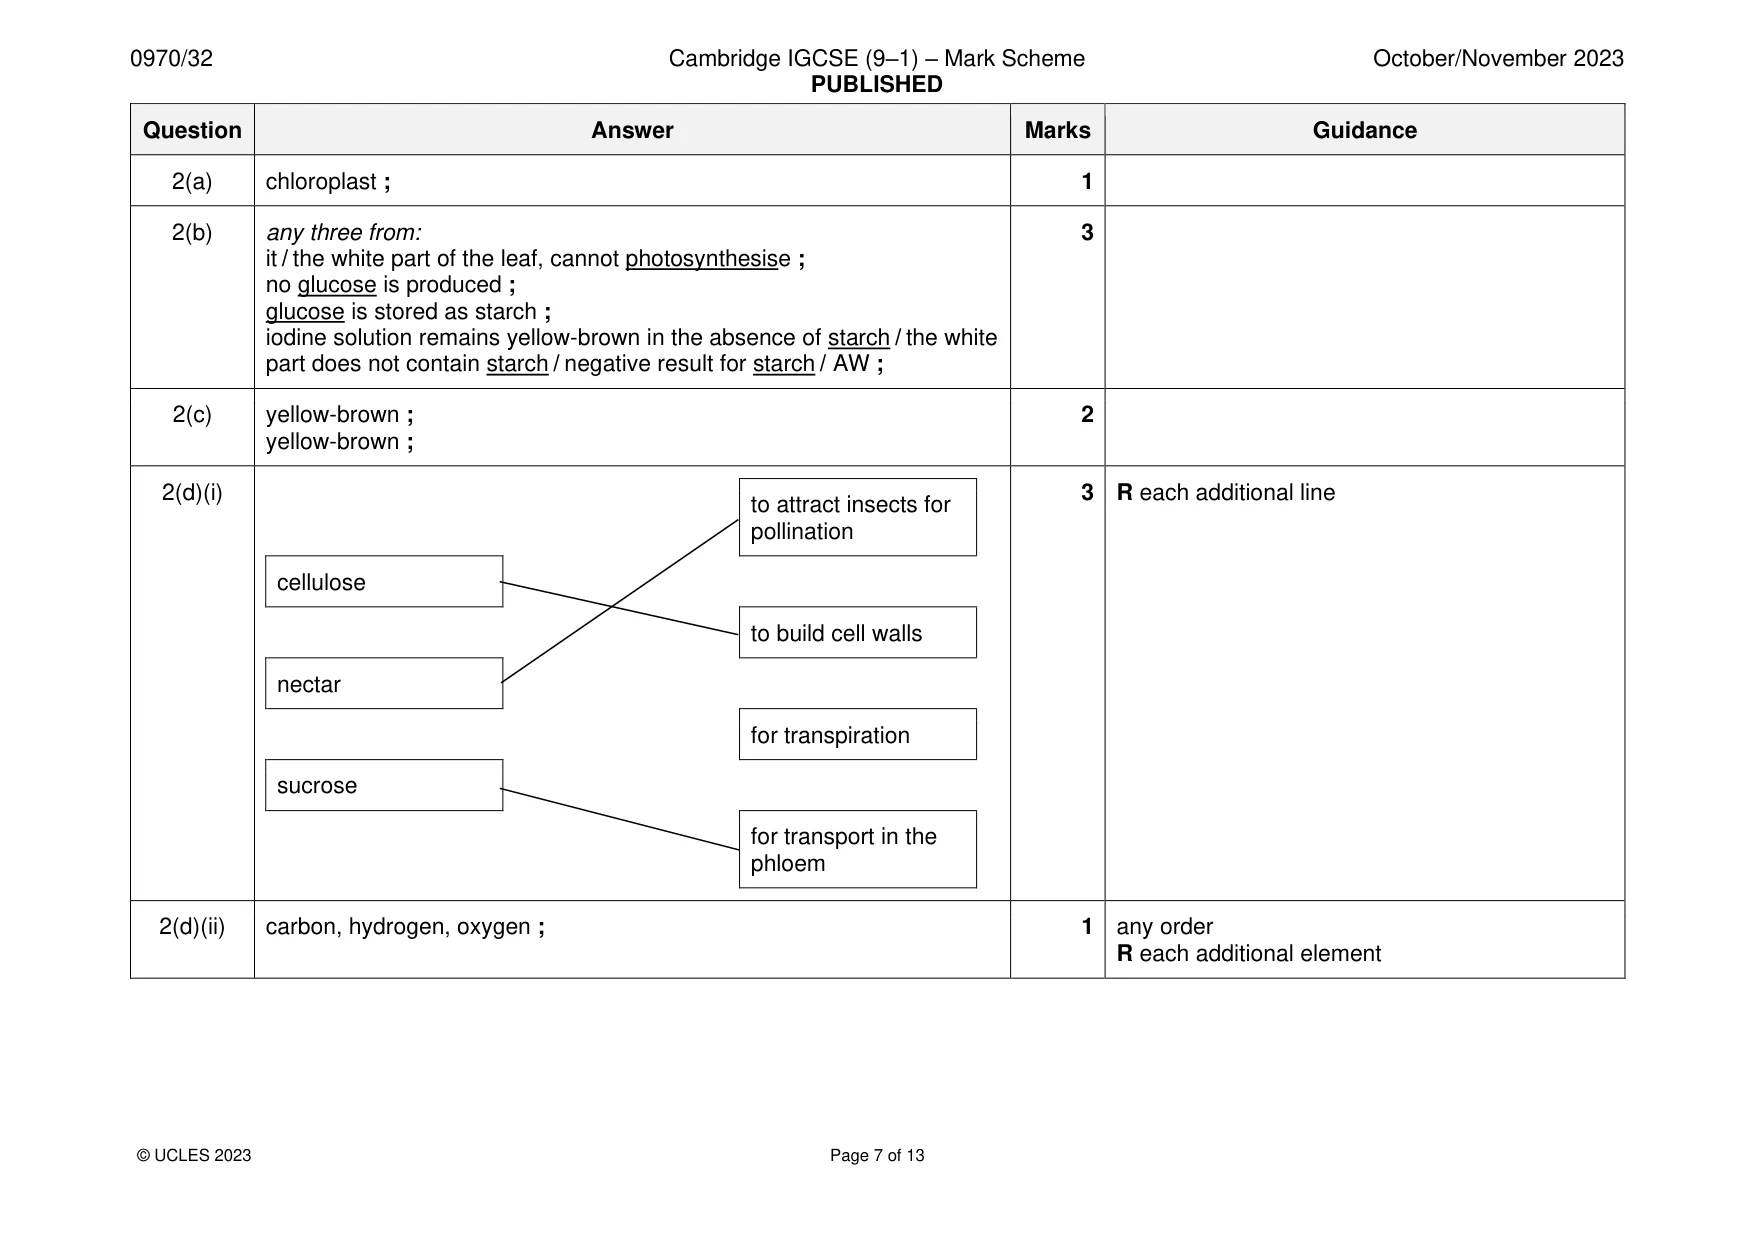
Mark scheme: 2(a) chloroplast ; 1 2(b) any three from: 3 it / the white part of the leaf, cannot photosynthesise ; no glucose is produced ; glucose is stored as starch ; iodine solution remains yellow-brown in the absence of starch / the white part does not contain starch / negative result for starch / AW ; 2(c) yellow-brown ; 2 yellow-brown ; 2(d)(i) 3 R each additional line to attract insects for pollination cellulose to build cell walls nectar for transpiration sucrose for transport in the phloem 2(d)(ii) carbon, hydrogen, oxygen ; 1 any order R each additional element
Q3 · A diagram of a cross‑section of a human heart
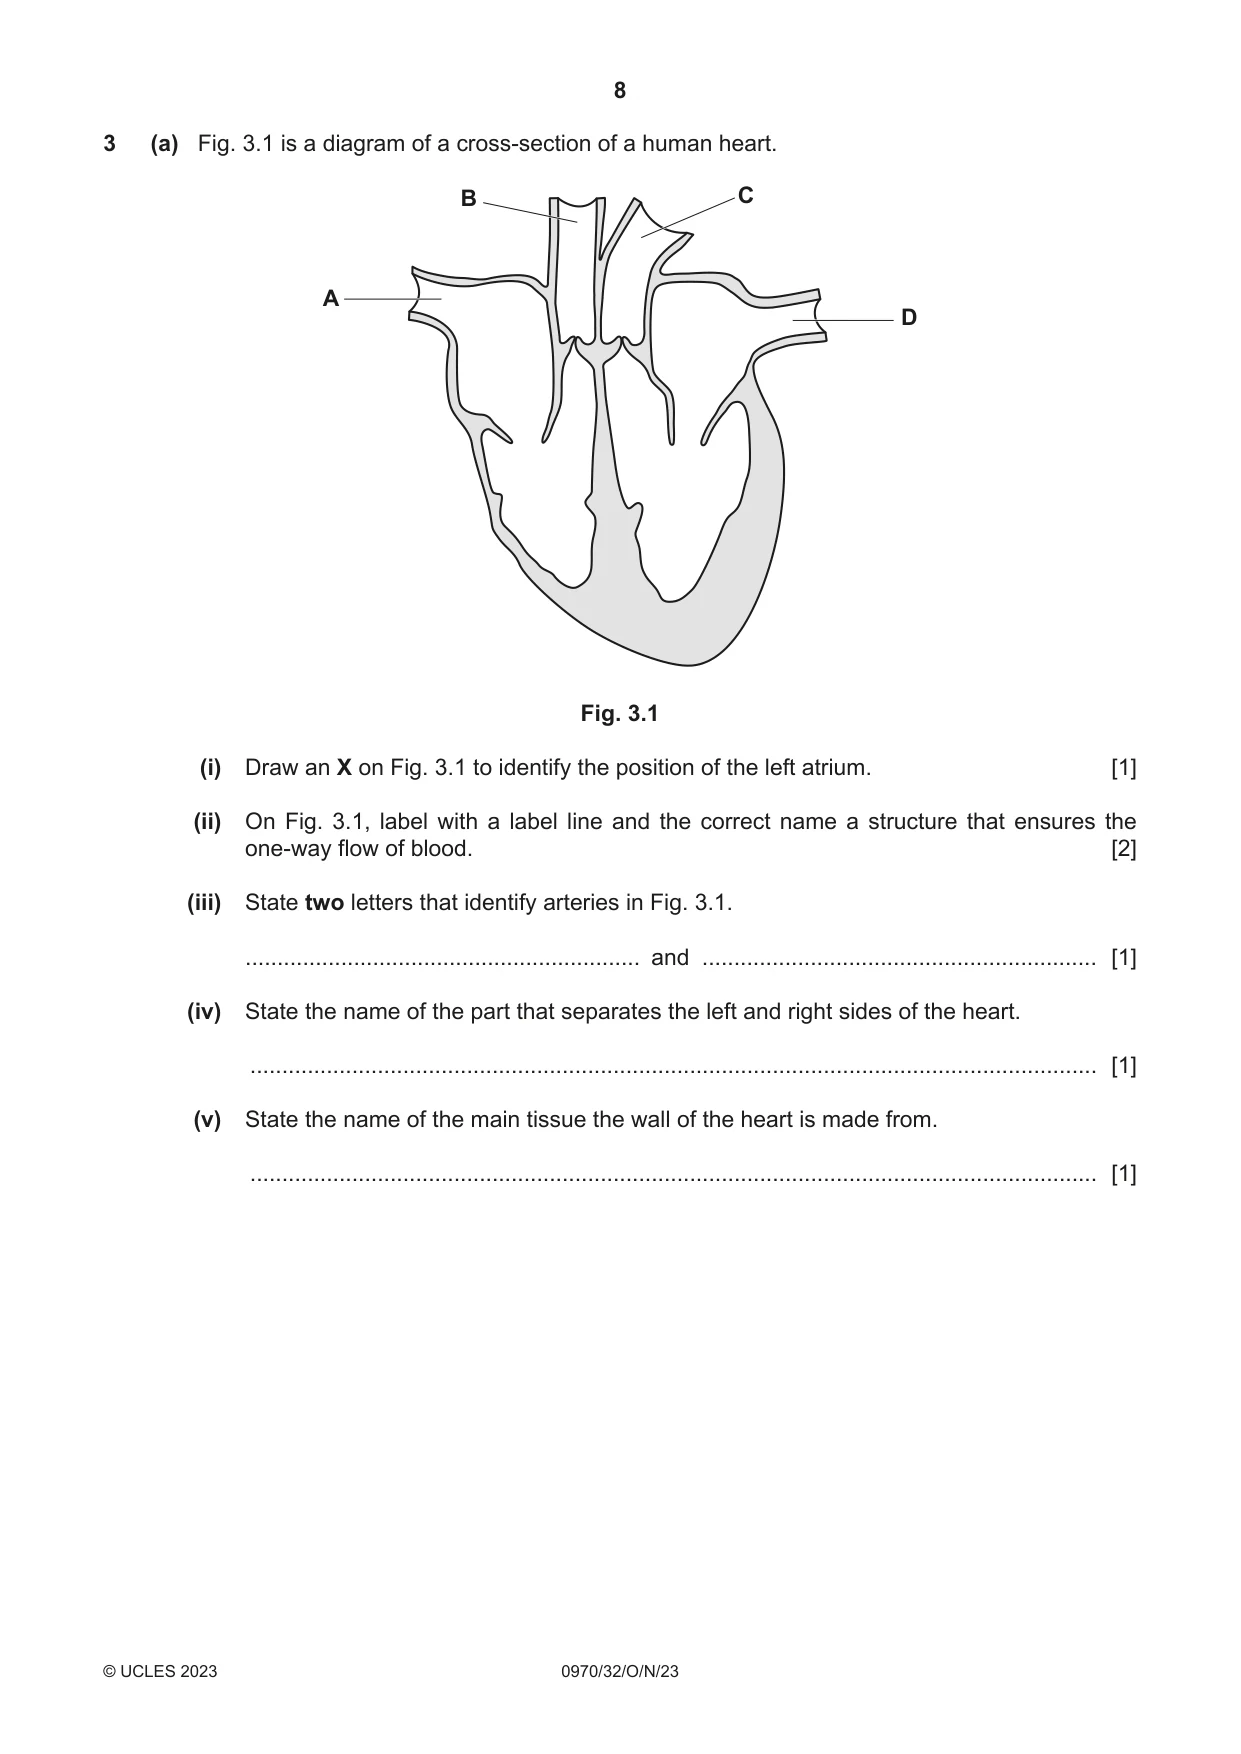
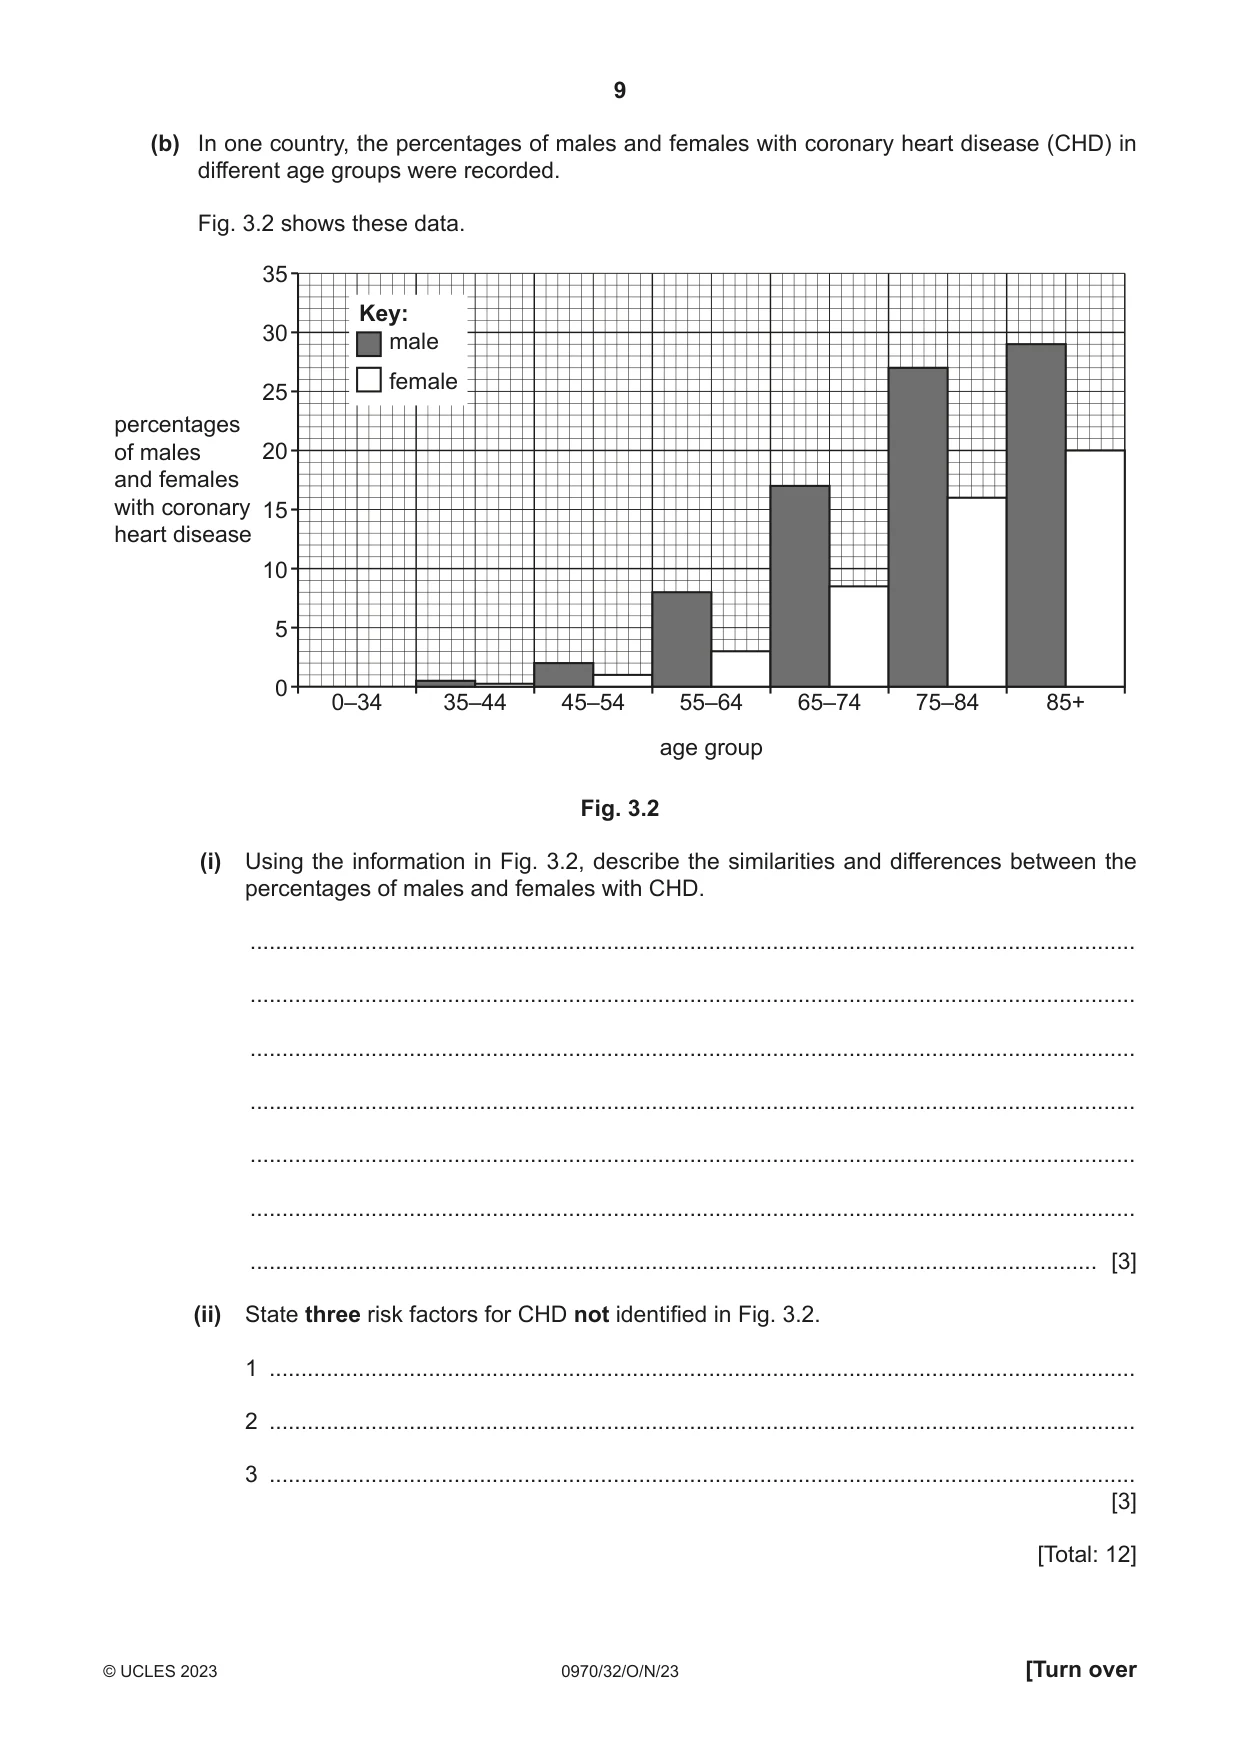
3 (a) Fig. 3.1 is a diagram of a cross‑section of a human heart. B C A D Fig. 3.1 (i) Draw an X on Fig. 3.1 to identify the position of the left atrium. [1] (ii) On Fig. 3.1, label with a label line and the correct name a structure that ensures the one‑way flow of blood. [2] (iii) State two letters that identify arteries in Fig. 3.1. .............................................................. and .............................................................. [1] (iv) State the name of the part that separates the left and right sides of the heart. ..................................................................................................................................... [1] (v) State the name of the main tissue the wall of the heart is made from. ..................................................................................................................................... [1] (b) In one country, the percentages of males and females with coronary heart disease (CHD) in different age groups were recorded. Fig. 3.2 shows these data. 35 Key: 30 male female 25 percentages of males 20 and females with coronary 15 heart disease 10 5 0 0–34 35–44 45–54 55–64 65–74 75–84 85+ age group Fig. 3.2 (i) Using the information in Fig. 3.2, describe the similarities and differences between the percentages of males and females with CHD. ........................................................................................................................................... ........................................................................................................................................... ........................................................................................................................................... ........................................................................................................................................... ........................................................................................................................................... ........................................................................................................................................... ..................................................................................................................................... [3] (ii) State three risk factors for CHD not identified in Fig. 3.2. 1 ........................................................................................................................................ 2 ........................................................................................................................................ 3 ........................................................................................................................................ [3] [Total: 12]
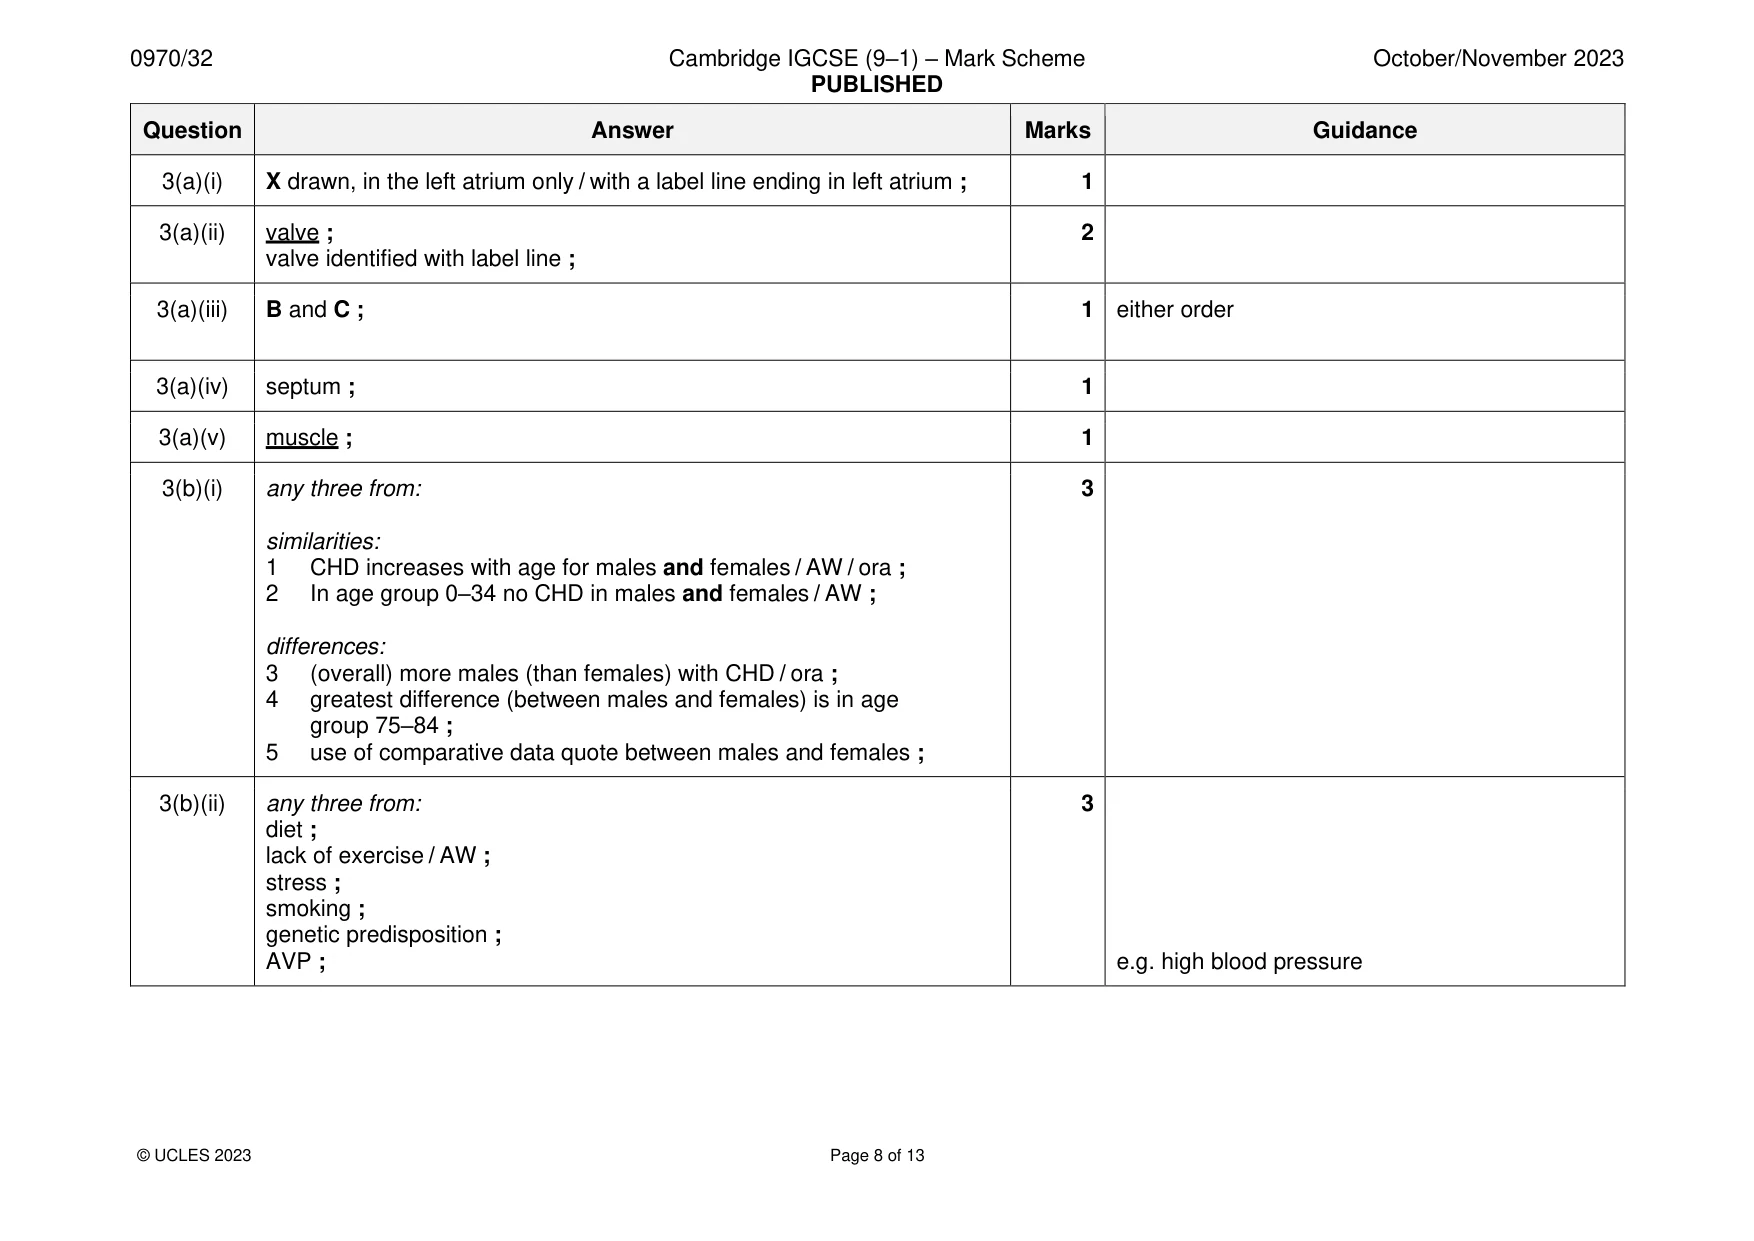
Mark scheme: 3(a)(i) X drawn, in the left atrium only / with a label line ending in left atrium ; 1 3(a)(ii) valve ; 2 valve identified with label line ; 3(a)(iii) B and C ; 1 either order 3(a)(iv) septum ; 1 3(a)(v) muscle ; 1 3(b)(i) any three from: 3 similarities: 1 CHD increases with age for males and females / AW / ora ; 2 In age group 0–34 no CHD in males and females / AW ; differences: 3 (overall) more males (than females) with CHD / ora ; 4 greatest difference (between males and females) is in age group 75–84 ; 5 use of comparative data quote between males and females ; 3(b)(ii) any three from: 3 diet ; lack of exercise / AW ; stress ; smoking ; genetic predisposition ; AVP ; e.g. high blood pressure
Q4 · A marine food web
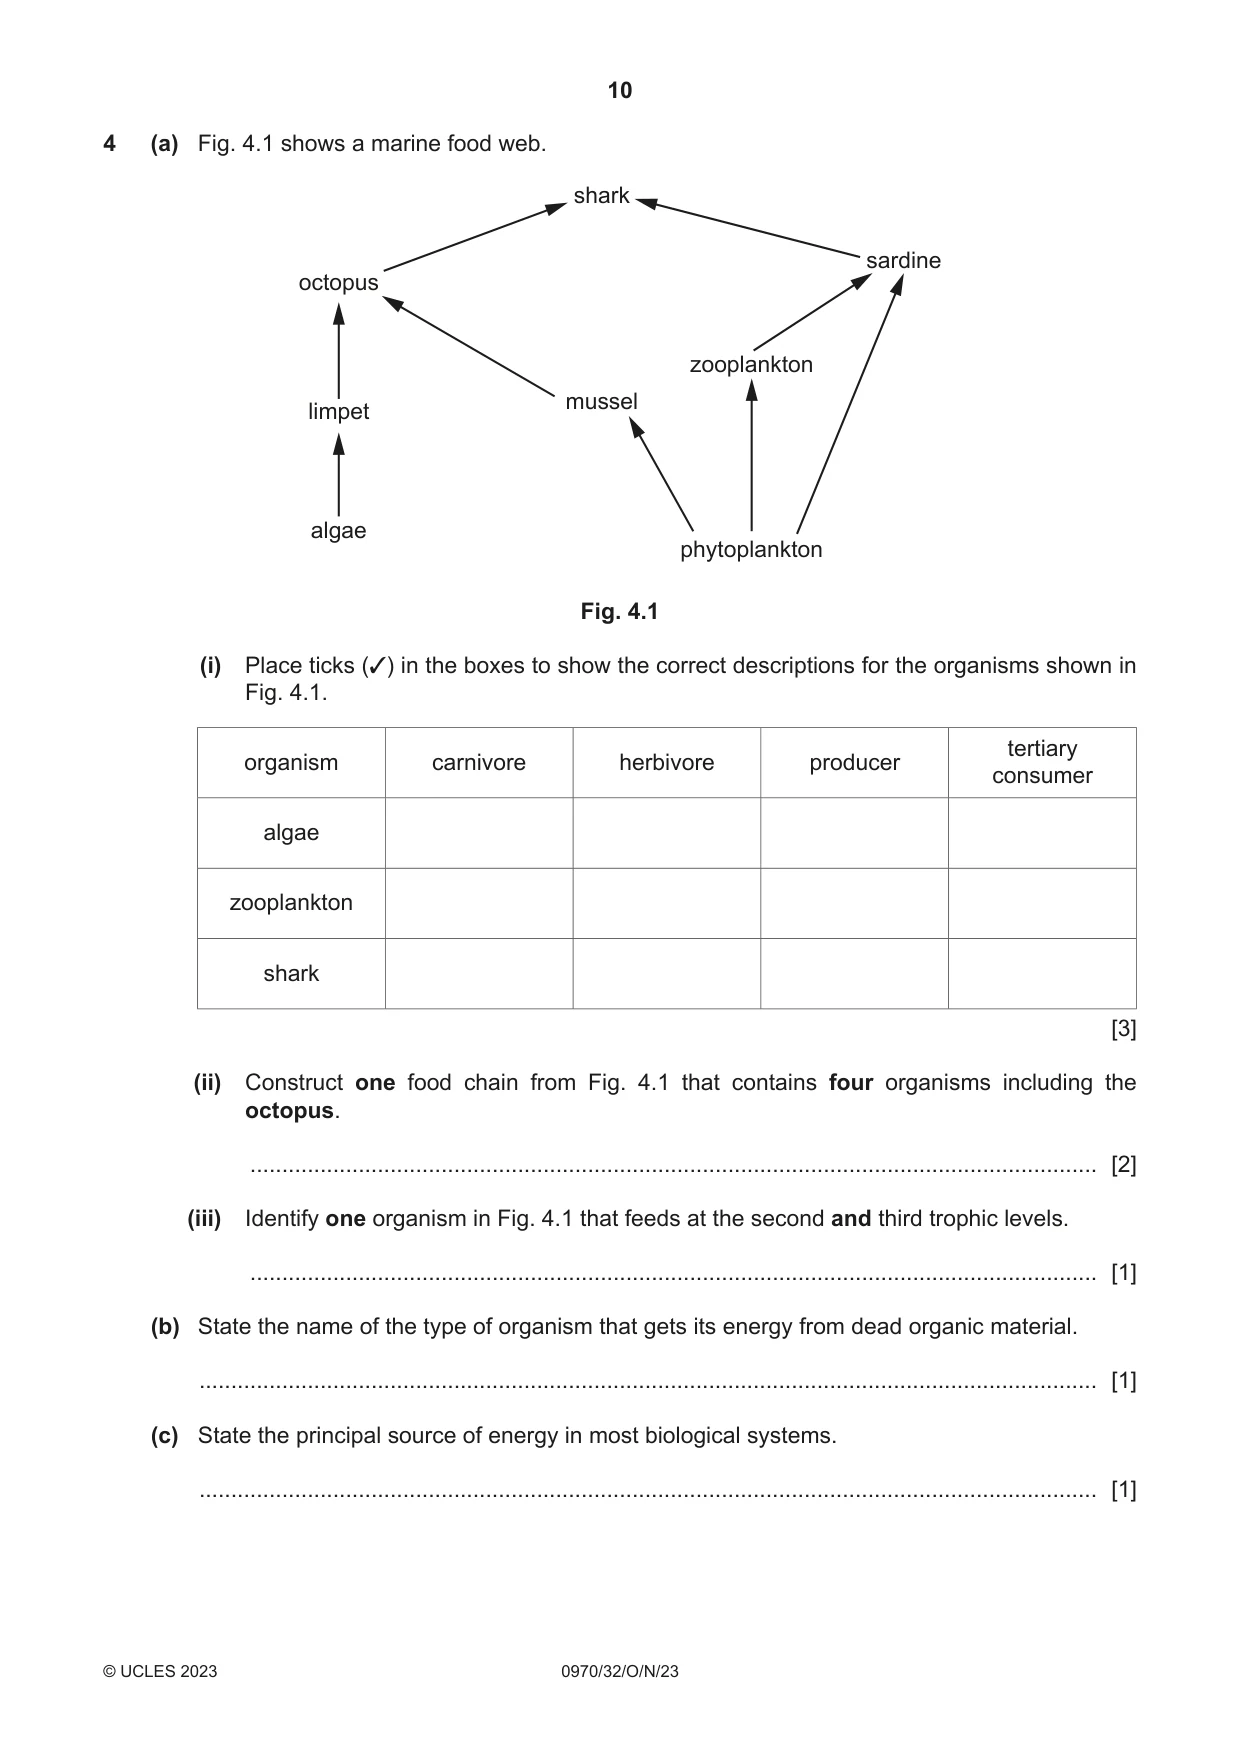
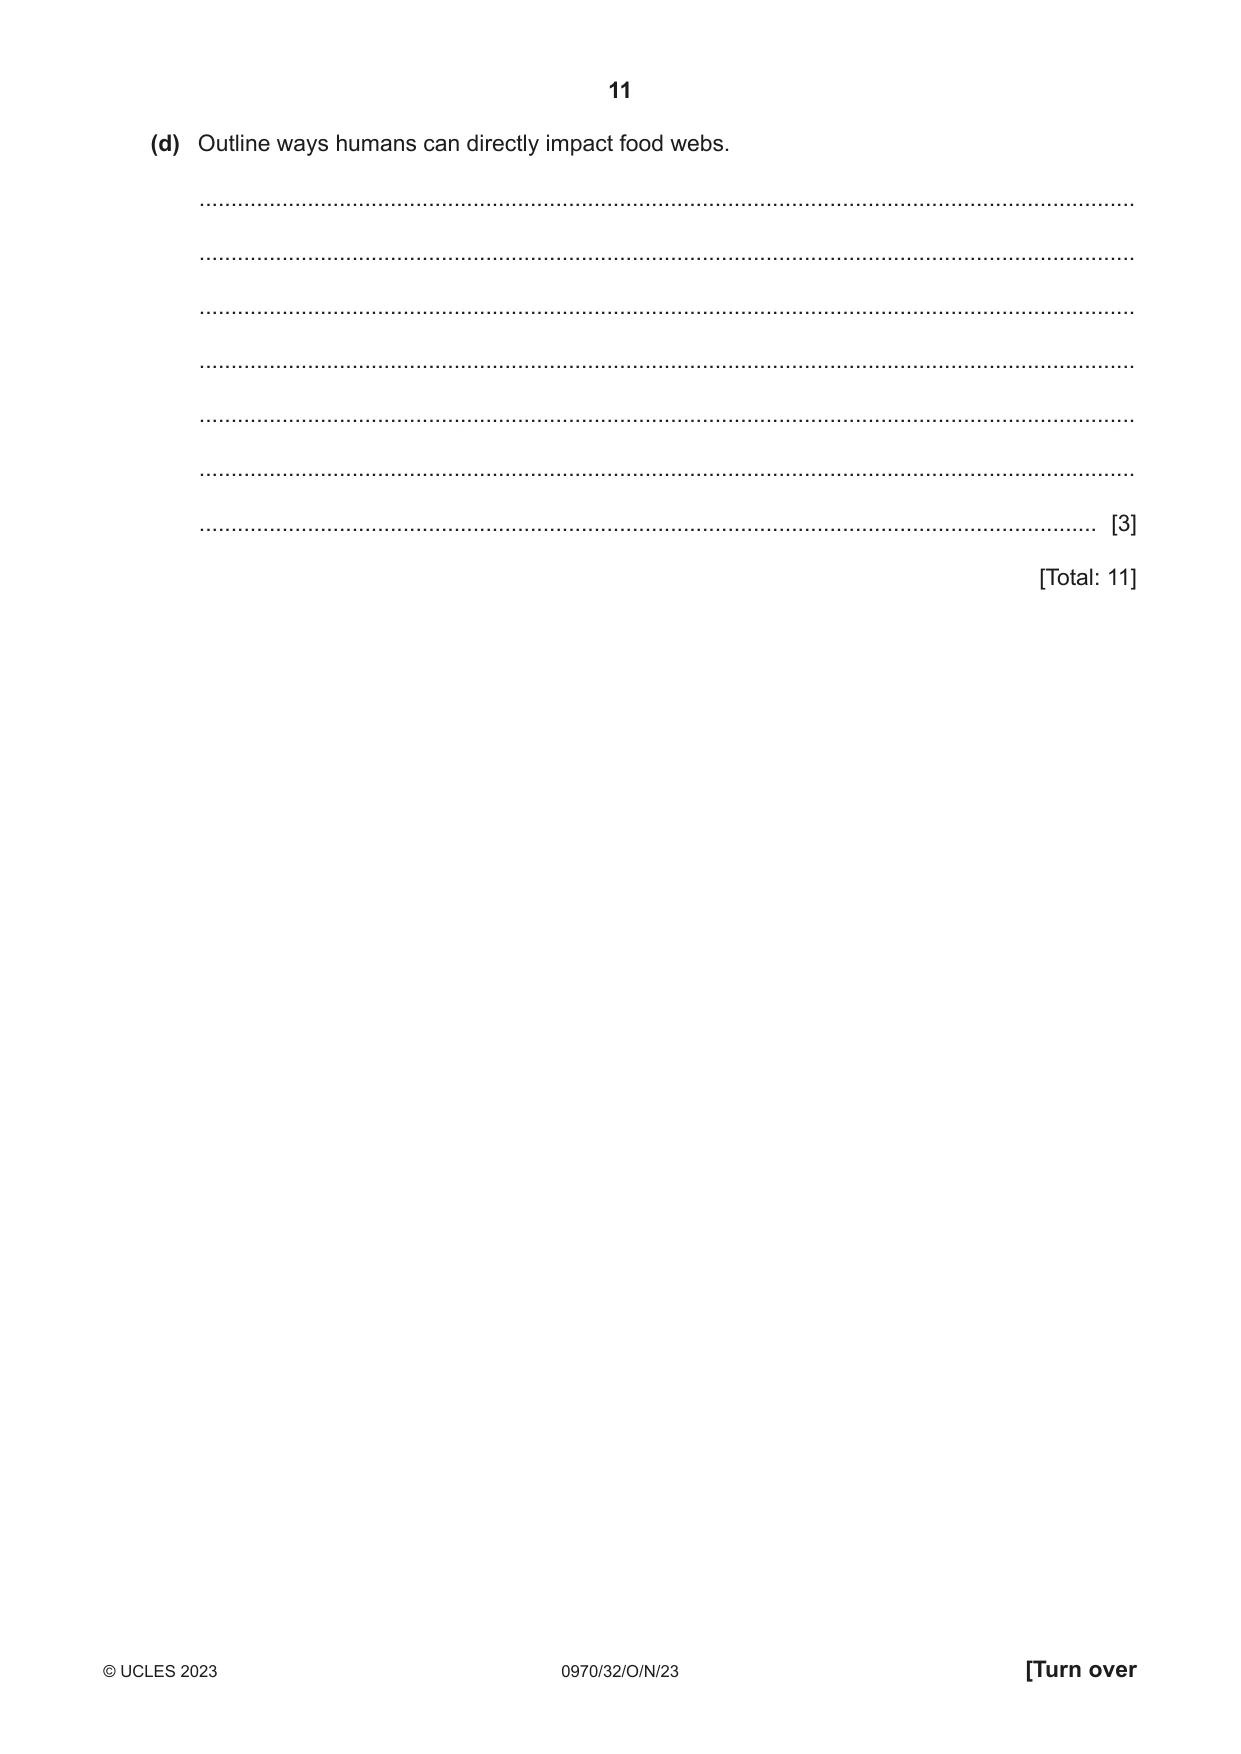
4 (a) Fig. 4.1 shows a marine food web. shark sardine octopus zooplankton mussel limpet algae phytoplankton Fig. 4.1 (i) Place ticks (✓) in the boxes to show the correct descriptions for the organisms shown in Fig. 4.1. tertiary organism carnivore herbivore producer consumer algae zooplankton shark [3] (ii) Construct one food chain from Fig. 4.1 that contains four organisms including the octopus. ..................................................................................................................................... [2] (iii) Identify one organism in Fig. 4.1 that feeds at the second and third trophic levels. ..................................................................................................................................... [1] (b) State the name of the type of organism that gets its energy from dead organic material. ............................................................................................................................................. [1] (c) State the principal source of energy in most biological systems. ............................................................................................................................................. [1] (d) Outline ways humans can directly impact food webs. ................................................................................................................................................... ................................................................................................................................................... ................................................................................................................................................... ................................................................................................................................................... ................................................................................................................................................... ................................................................................................................................................... ............................................................................................................................................. [3] [Total: 11]
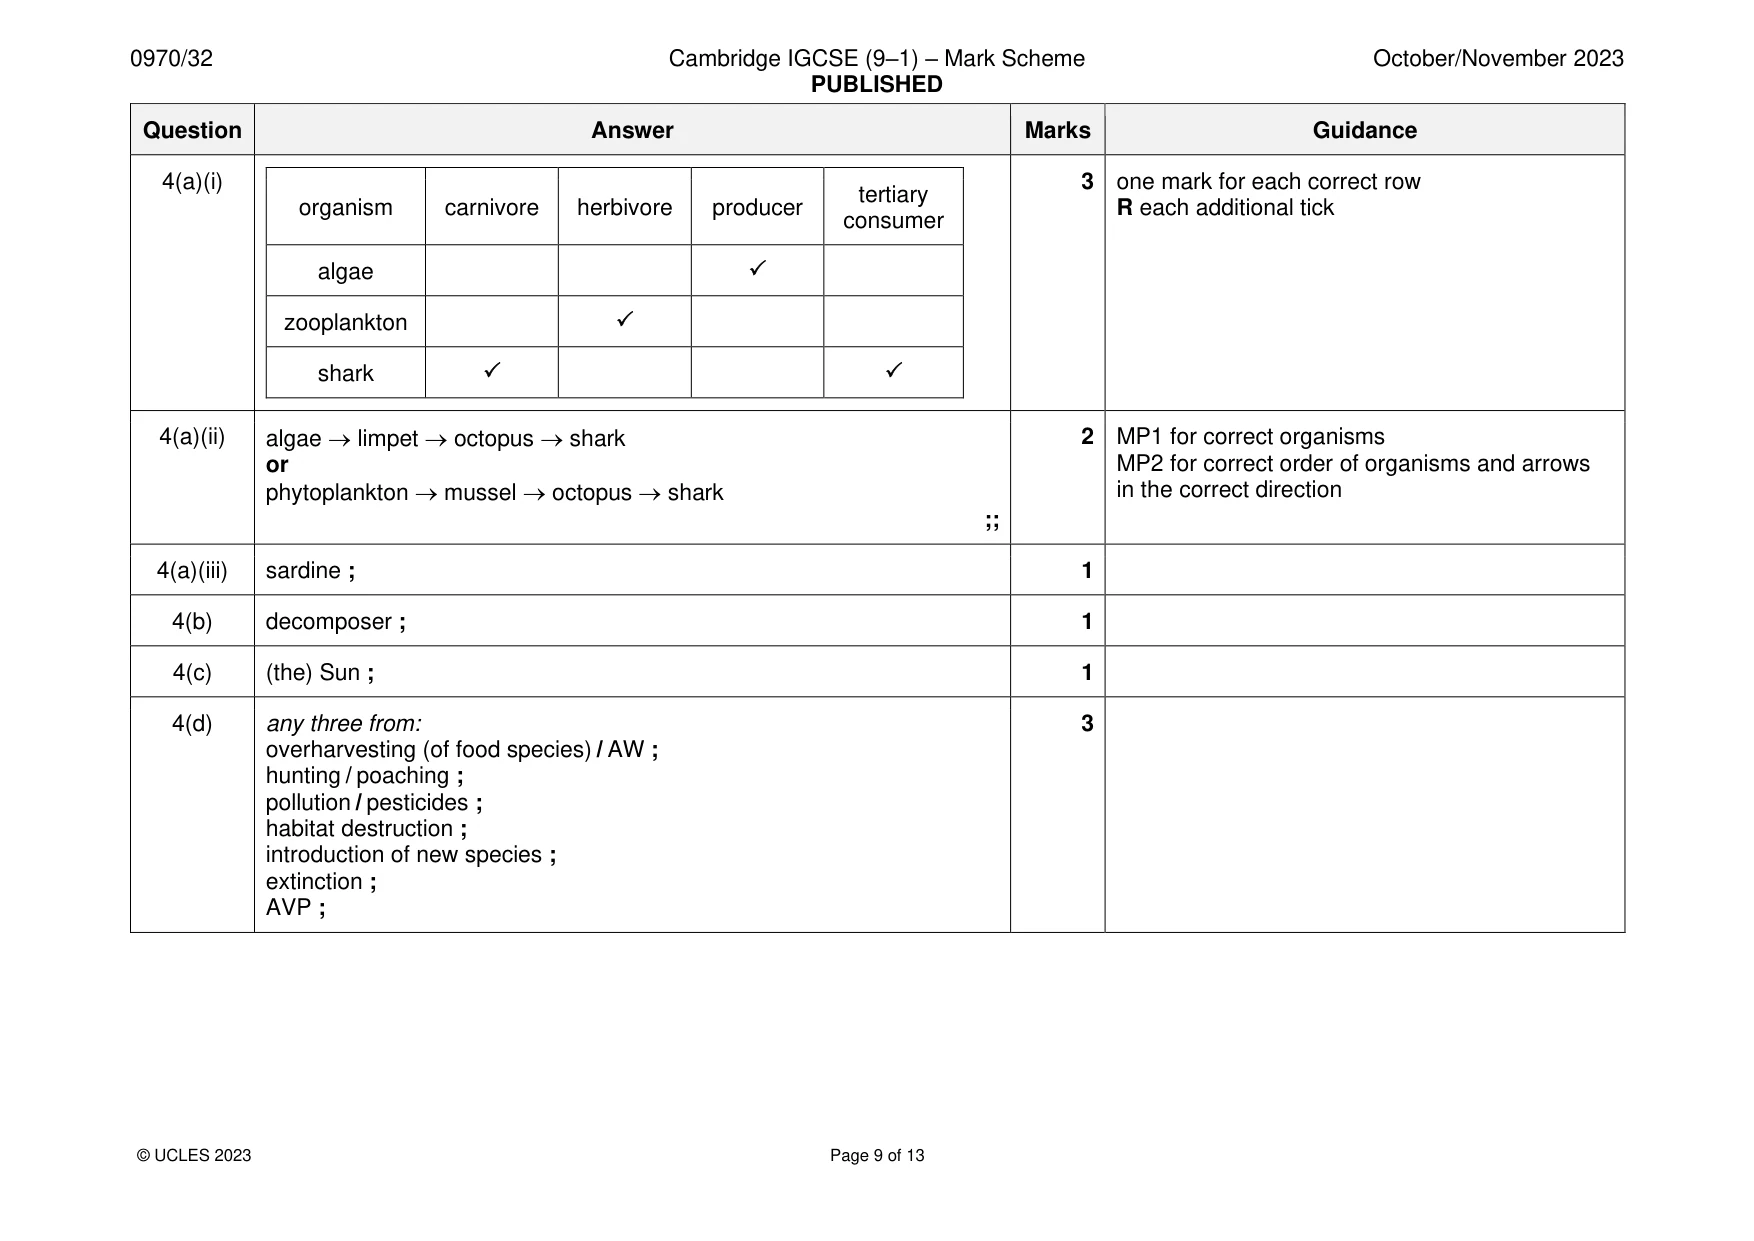
Mark scheme: 4(a)(i) 3 one mark for each correct row tertiary organism carnivore herbivore producer R each additional tick consumer algae zooplankton shark 4(a)(ii) algae → limpet → octopus → shark 2 MP1 for correct organisms or MP2 for correct order of organisms and arrows phytoplankton → mussel → octopus → shark in the correct direction ;; 4(a)(iii) sardine ; 1 4(b) decomposer ; 1 4(c) (the) Sun ; 1 4(d) any three from: 3 overharvesting (of food species) / AW ; hunting / poaching ; pollution / pesticides ; habitat destruction ; introduction of new species ; extinction ; AVP ;
Q5 · Antibiotics are a type of drug
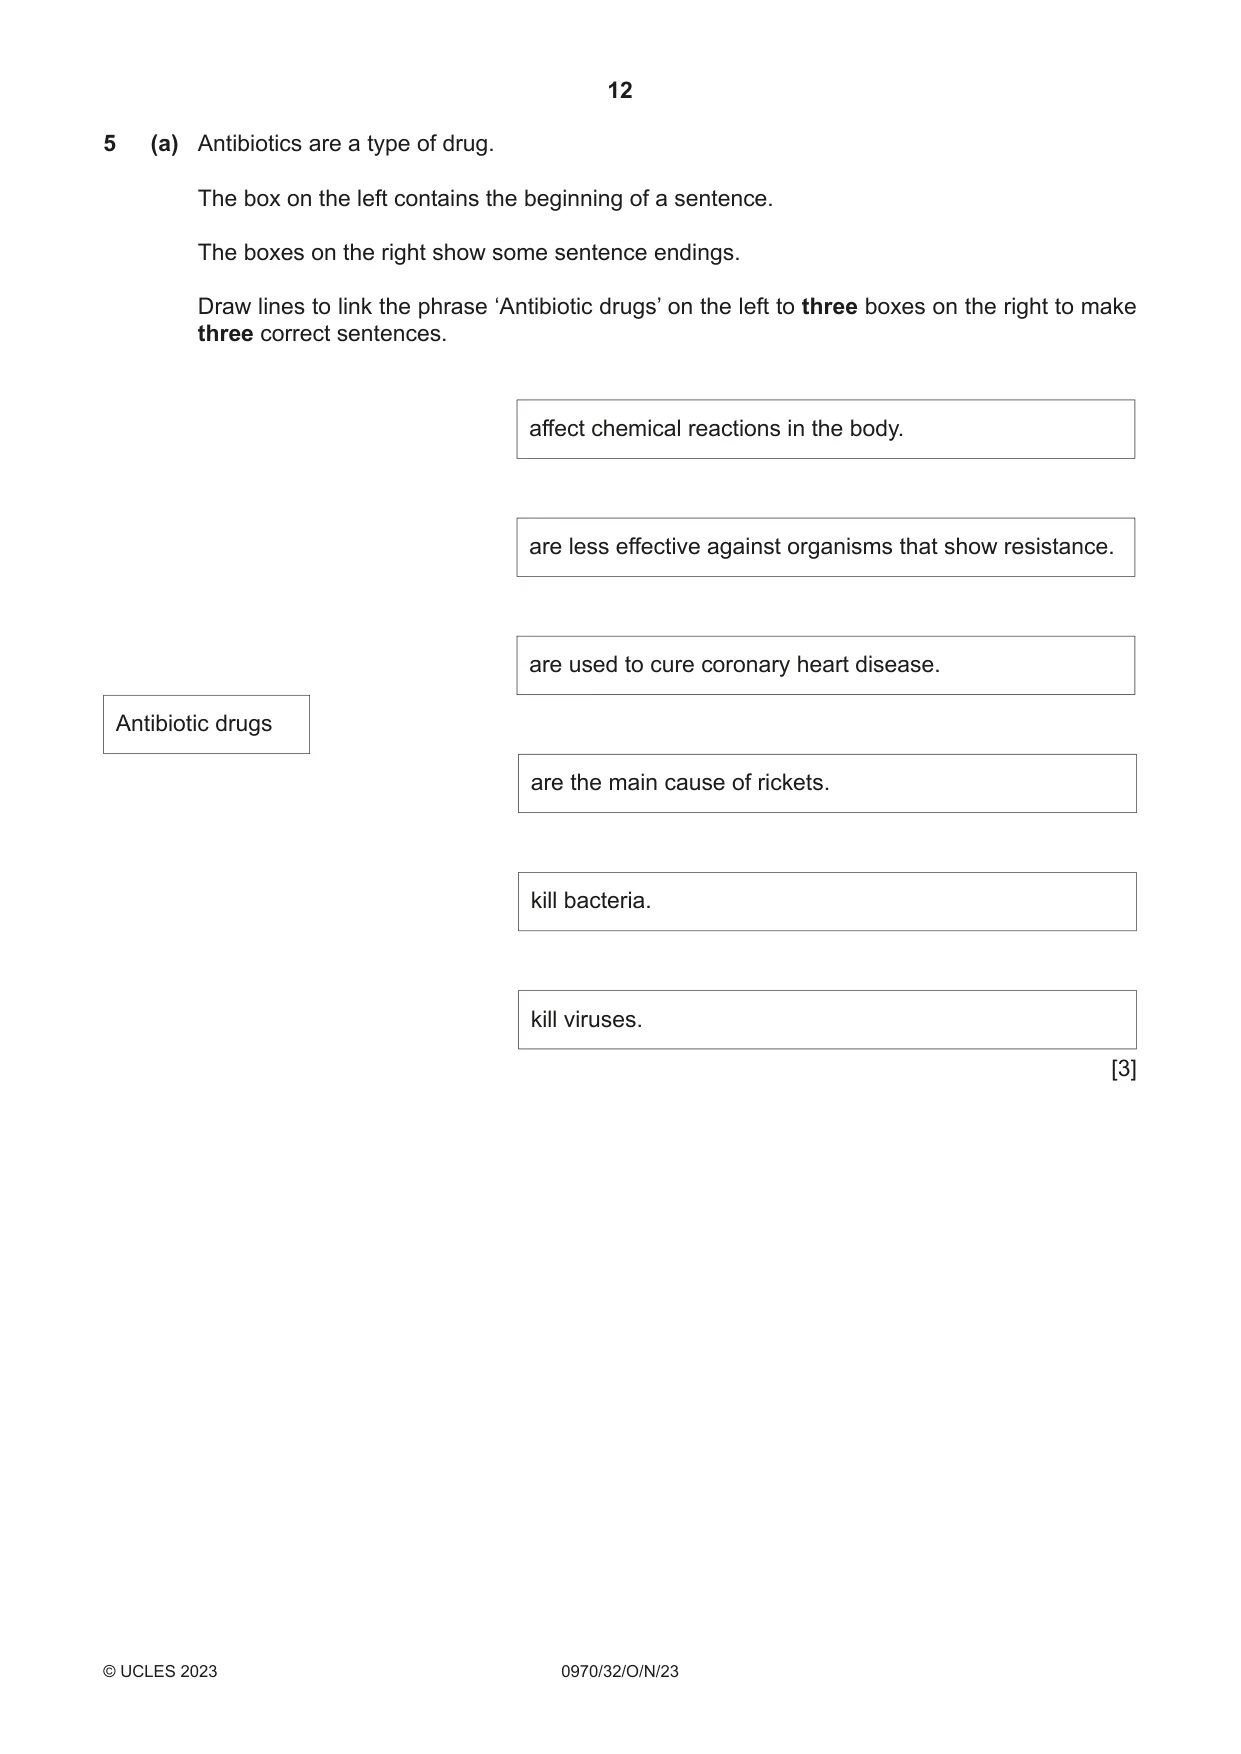
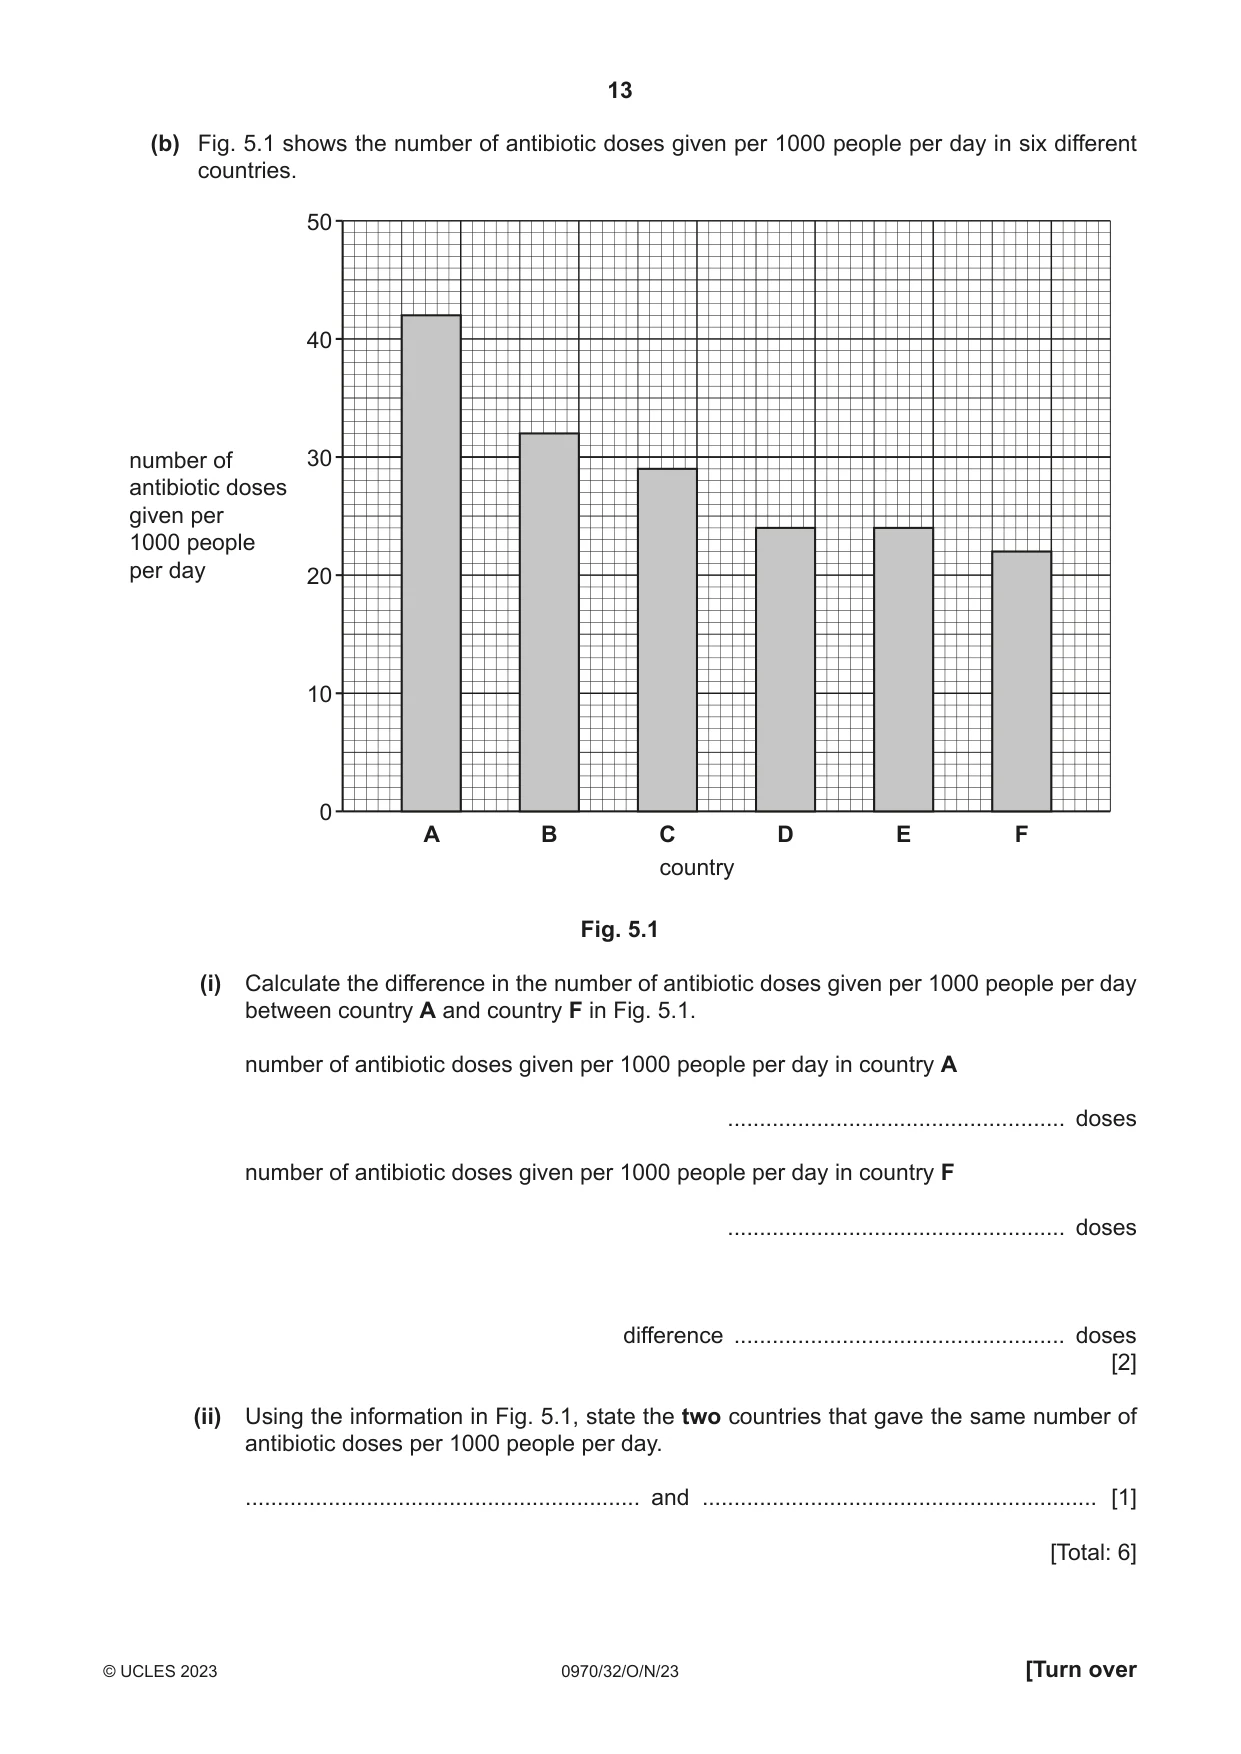
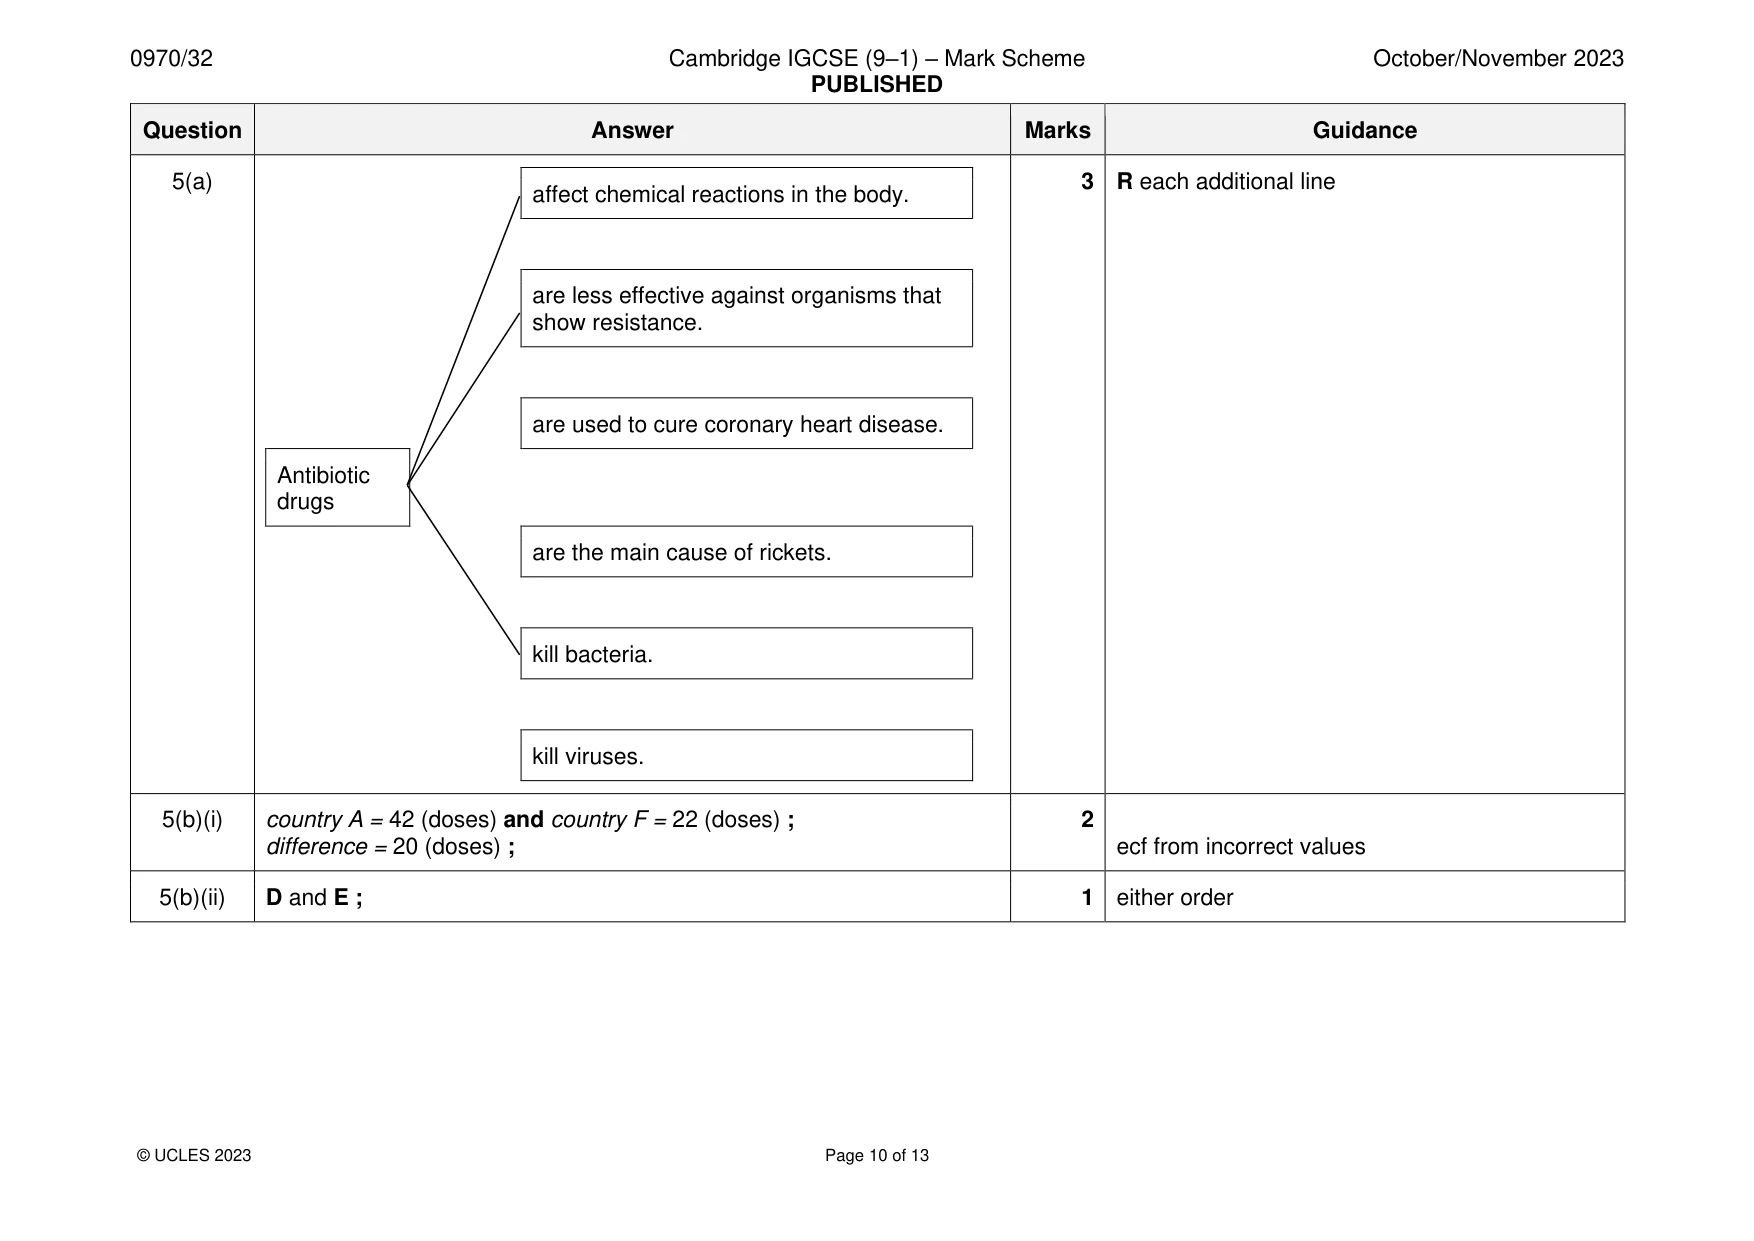
5 (a) Antibiotics are a type of drug. The box on the left contains the beginning of a sentence. The boxes on the right show some sentence endings. Draw lines to link the phrase ‘Antibiotic drugs’ on the left to three boxes on the right to make three correct sentences. affect chemical reactions in the body. are less effective against organisms that show resistance. are used to cure coronary heart disease. Antibiotic drugs are the main cause of rickets. kill bacteria. kill viruses. [3] (b) Fig. 5.1 shows the number of antibiotic doses given per 1000 people per day in six different countries. 50 40 number of 30 antibiotic doses given per 1000 people per day 20 10 0 A B C D E F country Fig. 5.1 (i) Calculate the difference in the number of antibiotic doses given per 1000 people per day between country A and country F in Fig. 5.1. number of antibiotic doses given per 1000 people per day in country A ..................................................... doses number of antibiotic doses given per 1000 people per day in country F ..................................................... doses difference .................................................... doses [2] (ii) Using the information in Fig. 5.1, state the two countries that gave the same number of antibiotic doses per 1000 people per day. .............................................................. and .............................................................. [1] [Total: 6]
Mark scheme: 5(a) 3 R each additional line affect chemical reactions in the body. are less effective against organisms that show resistance. are used to cure coronary heart disease. Antibiotic drugs are the main cause of rickets. kill bacteria. kill viruses. 5(b)(i) country A = 42 (doses) and country F = 22 (doses) ; 2 difference = 20 (doses) ; ecf from incorrect values 5(b)(ii) D and E ; 1 either order
Q6 · A diagram showing the pathway of water into a plant
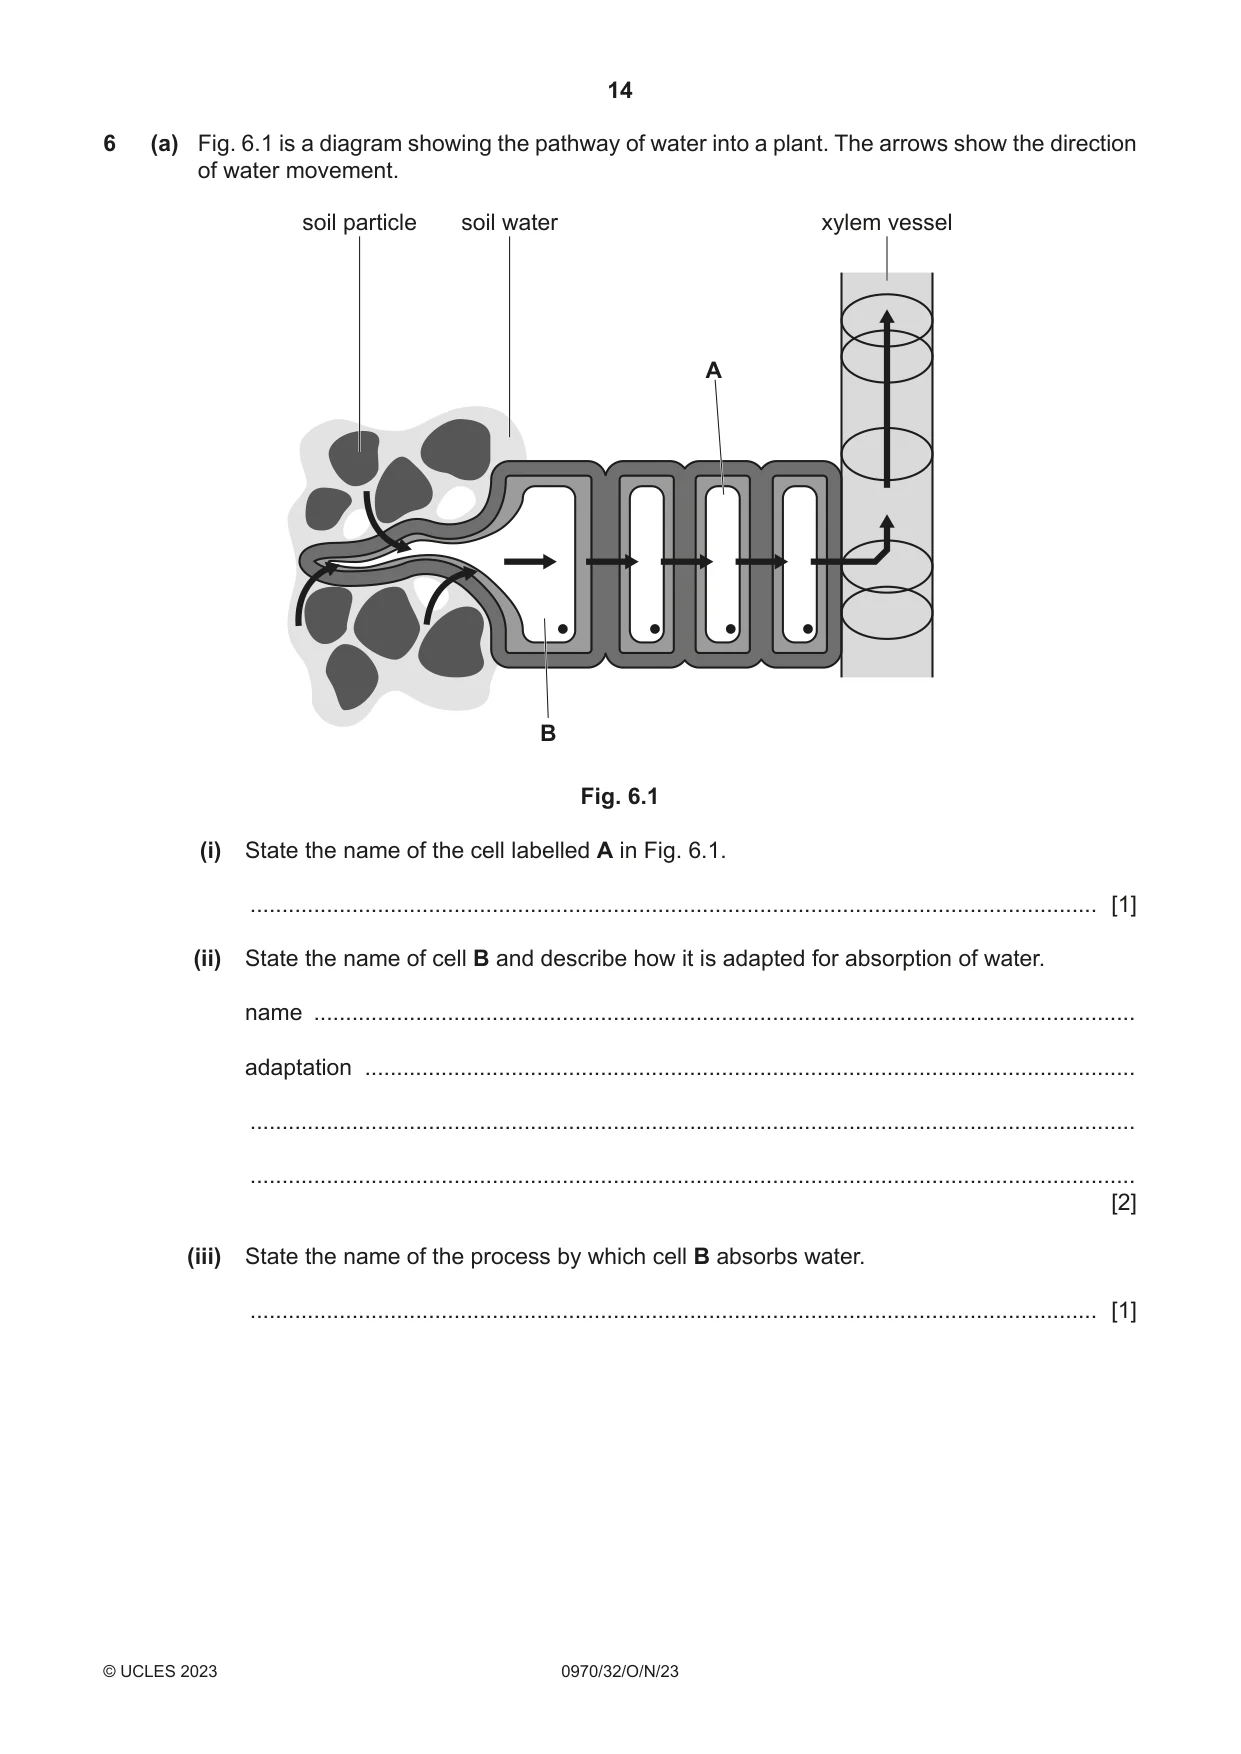
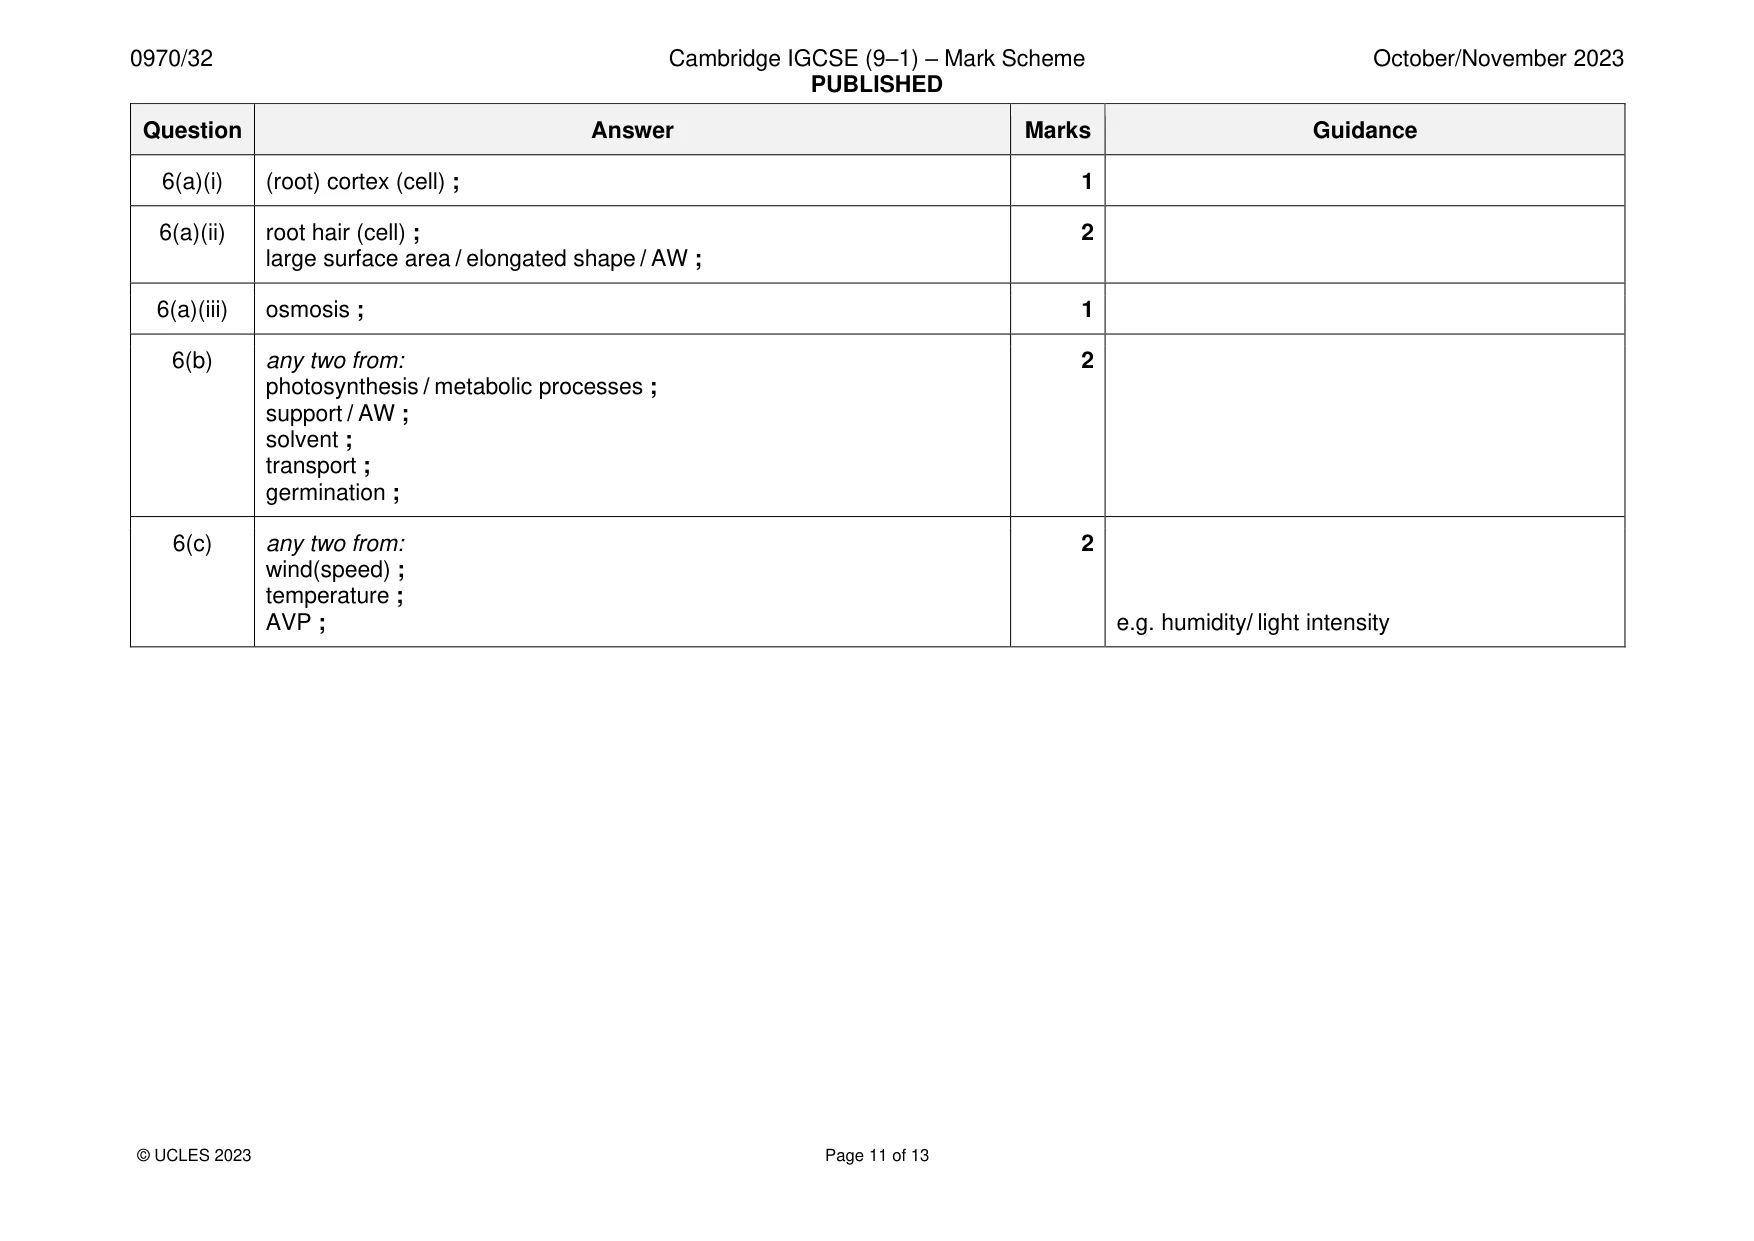
6 (a) Fig. 6.1 is a diagram showing the pathway of water into a plant. The arrows show the direction of water movement. soil particle soil water xylem vessel A B Fig. 6.1 (i) State the name of the cell labelled A in Fig. 6.1. ..................................................................................................................................... [1] (ii) State the name of cell B and describe how it is adapted for absorption of water. name ................................................................................................................................. adaptation ......................................................................................................................... ........................................................................................................................................... ........................................................................................................................................... [2] (iii) State the name of the process by which cell B absorbs water. ..................................................................................................................................... [1] (b) State two uses of water in plants. 1 ................................................................................................................................................ 2 ................................................................................................................................................ [2] (c) State two environmental factors that will affect the rate of water loss from a plant. 1 ................................................................................................................................................ 2 ................................................................................................................................................ [2] [Total: 8]
Mark scheme: 6(a)(i) (root) cortex (cell) ; 1 6(a)(ii) root hair (cell) ; 2 large surface area / elongated shape / AW ; 6(a)(iii) osmosis ; 1 6(b) any two from: 2 photosynthesis / metabolic processes ; support / AW ; solvent ; transport ; germination ; 6(c) any two from: 2 wind(speed) ; temperature ; AVP ; e.g. humidity/ light intensity
Q7 · A diagram of the female reproductive system in humans
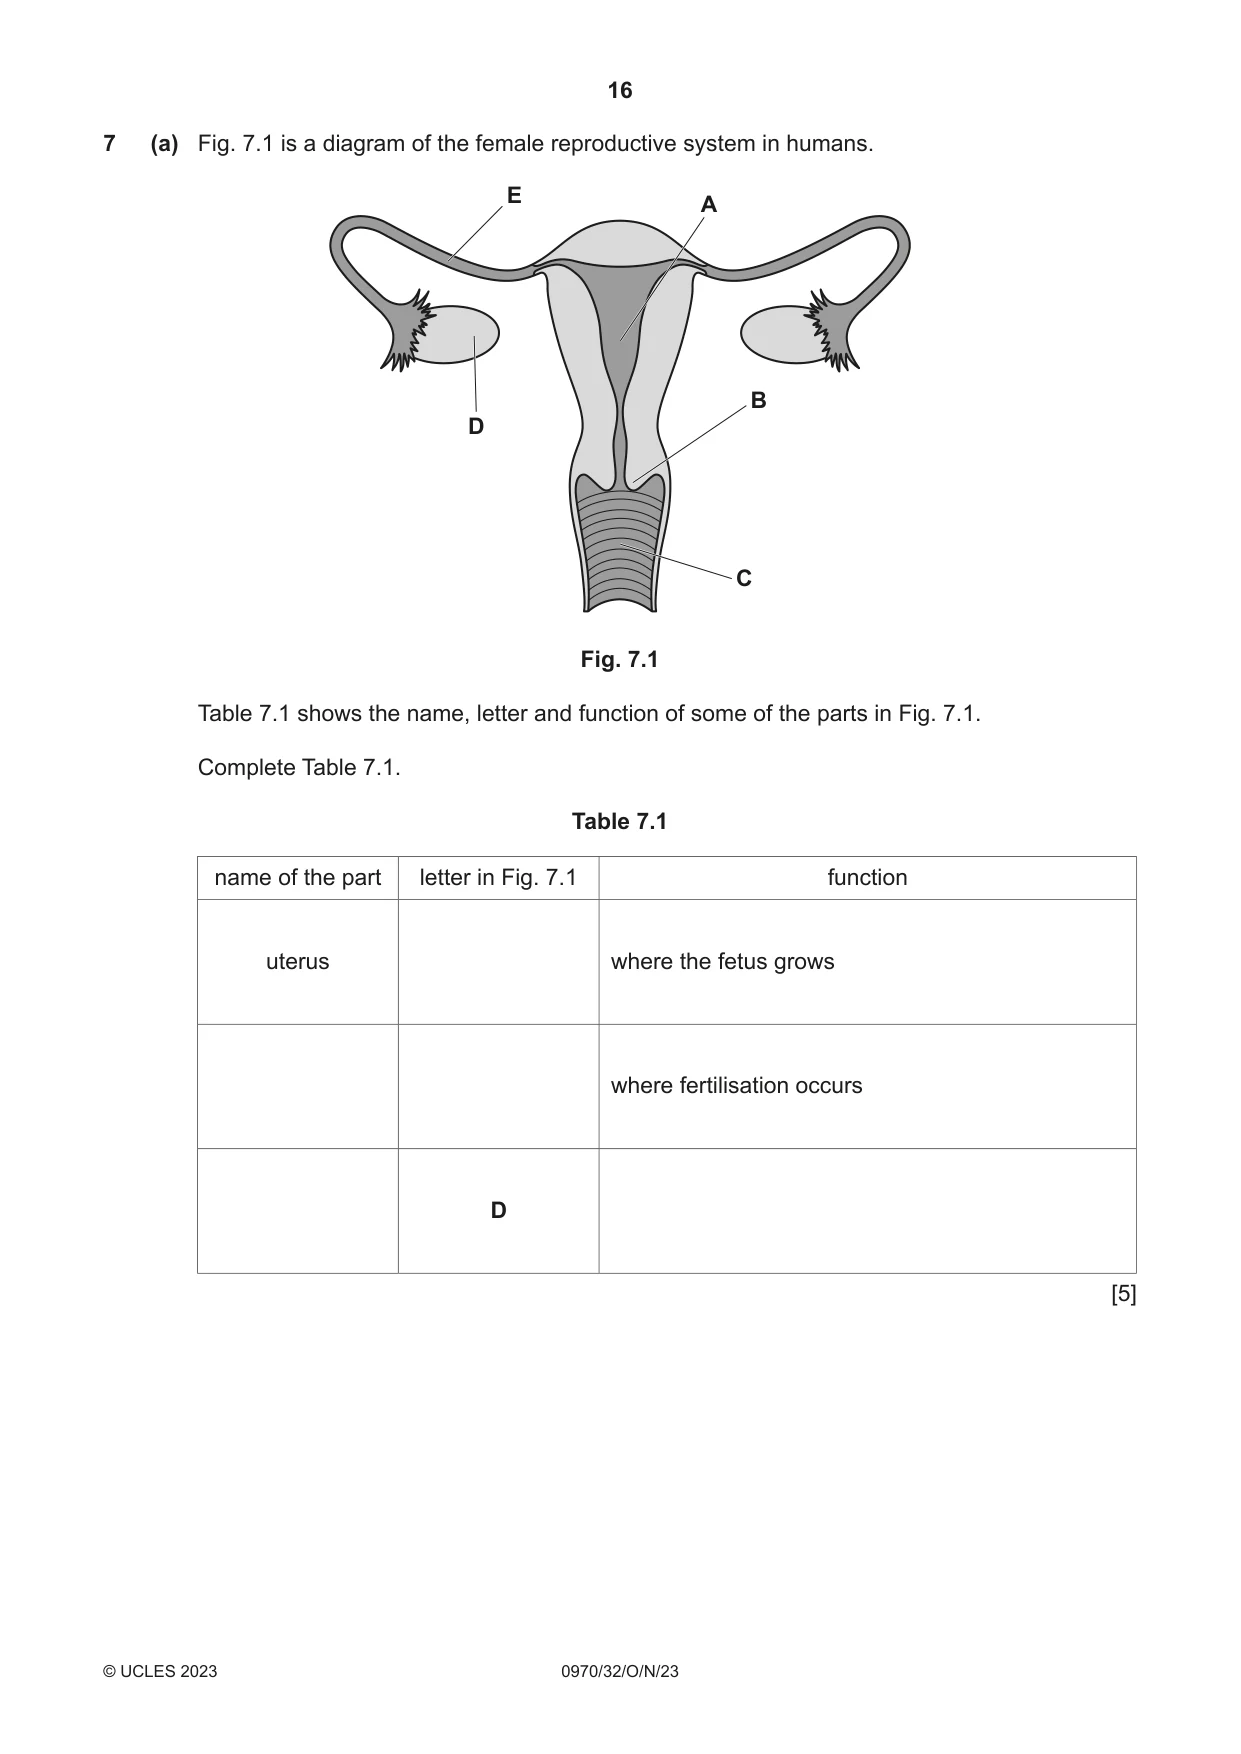
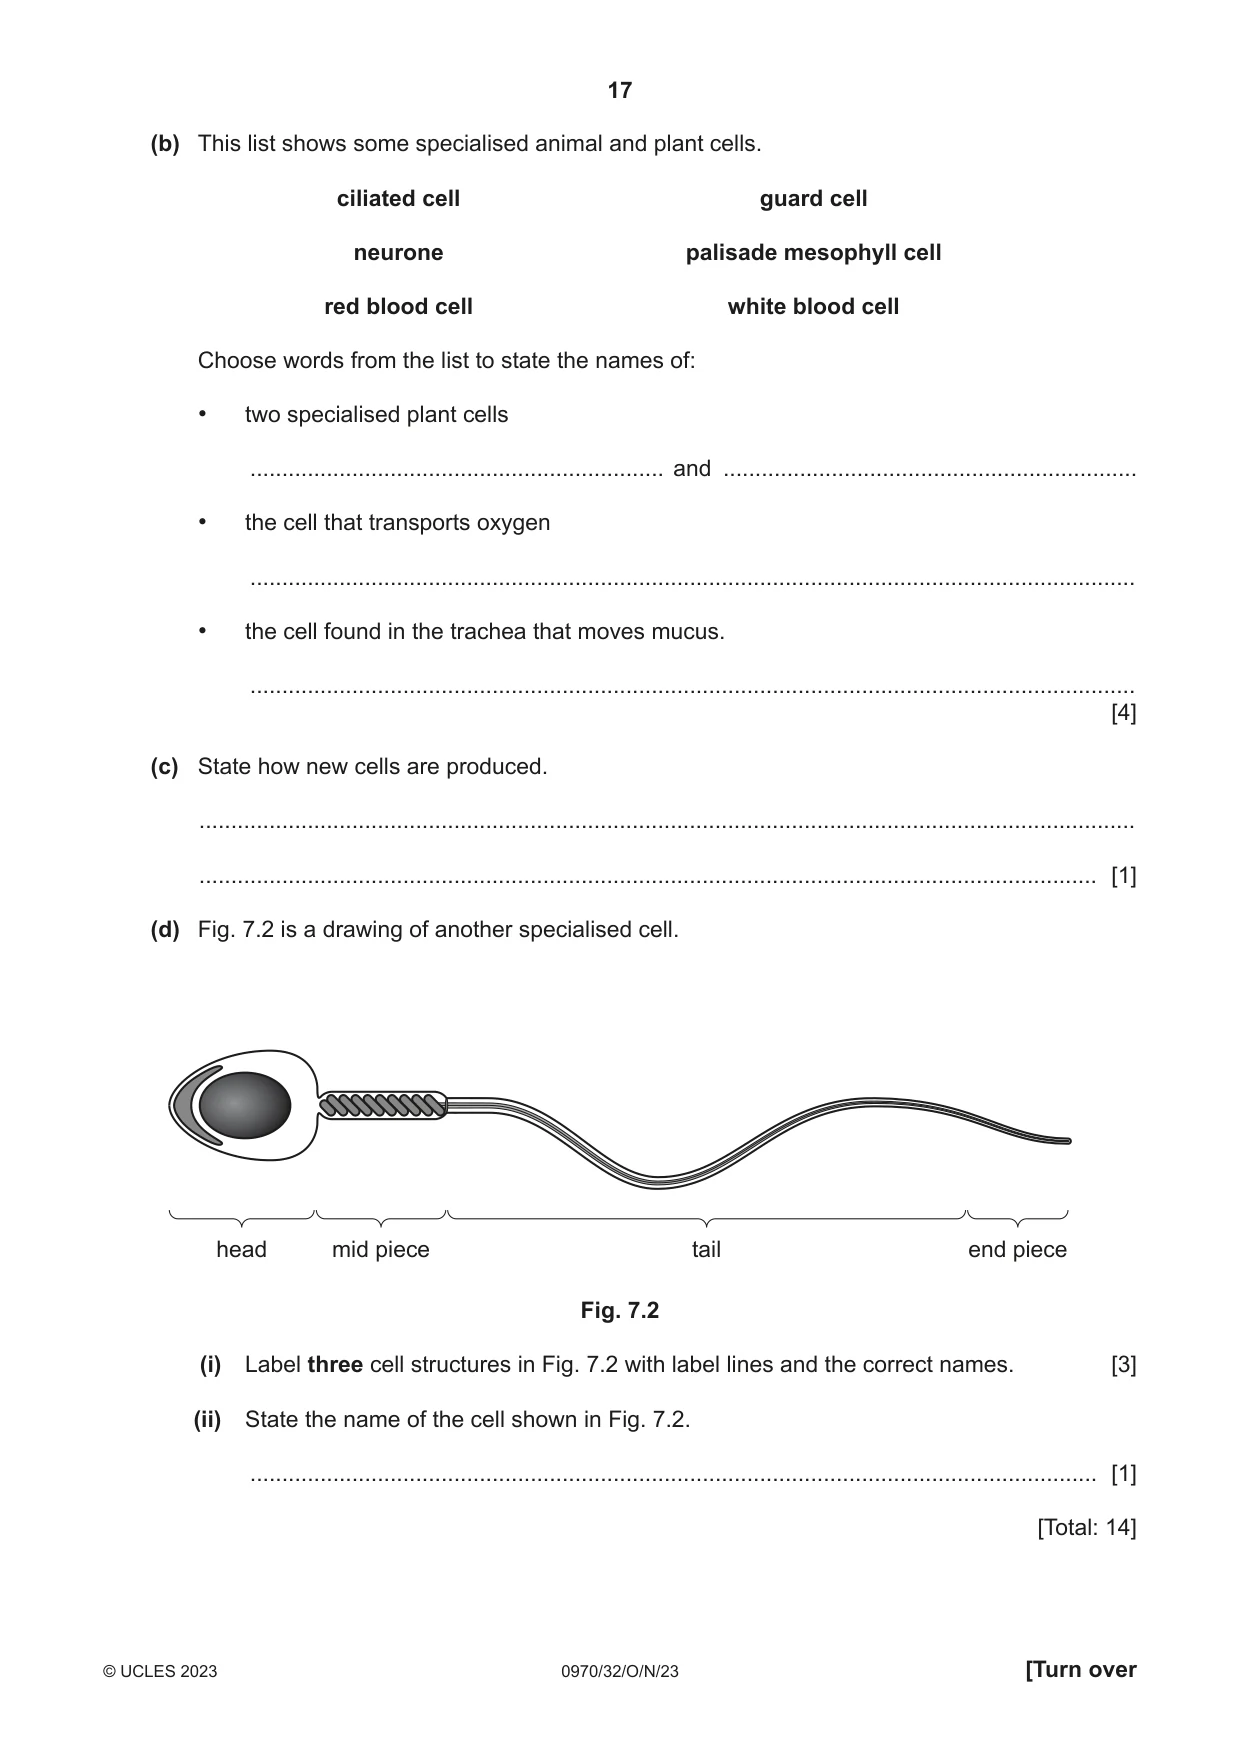
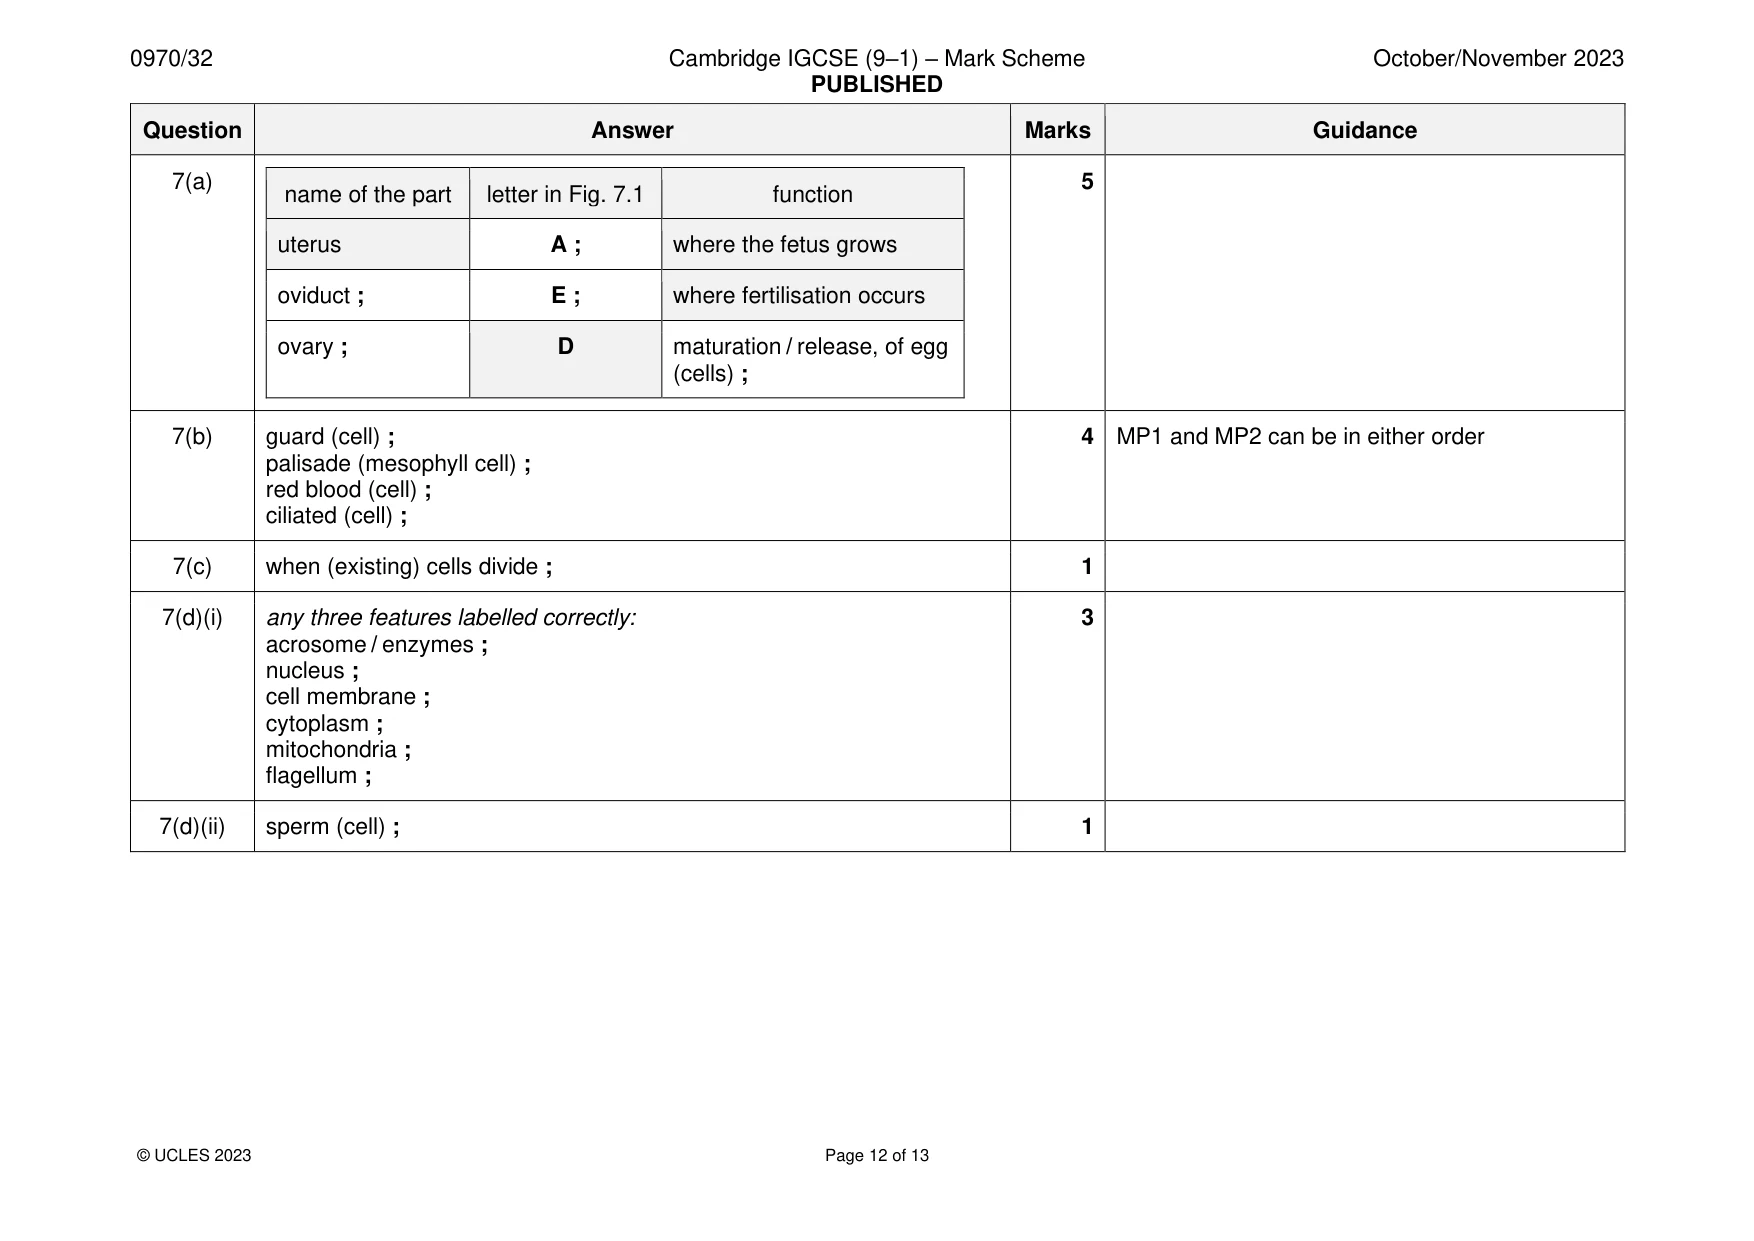
7 (a) Fig. 7.1 is a diagram of the female reproductive system in humans. E A B D C Fig. 7.1 Table 7.1 shows the name, letter and function of some of the parts in Fig. 7.1. Complete Table 7.1. Table 7.1 name of the part letter in Fig. 7.1 function uterus where the fetus grows where fertilisation occurs D [5] (b) This list shows some specialised animal and plant cells. ciliated cell guard cell neurone palisade mesophyll cell red blood cell white blood cell Choose words from the list to state the names of: • two specialised plant cells ................................................................. and ................................................................. • the cell that transports oxygen ........................................................................................................................................... • the cell found in the trachea that moves mucus. ........................................................................................................................................... [4] (c) State how new cells are produced. ................................................................................................................................................... ............................................................................................................................................. [1] (d) Fig. 7.2 is a drawing of another specialised cell. head mid piece tail end piece Fig. 7.2 (i) Label three cell structures in Fig. 7.2 with label lines and the correct names. [3] (ii) State the name of the cell shown in Fig. 7.2. ..................................................................................................................................... [1] [Total: 14]
Mark scheme: 7(a) 5 name of the part letter in Fig. 7.1 function uterus A ; where the fetus grows oviduct ; E ; where fertilisation occurs ovary ; D maturation / release, of egg (cells) ; 7(b) guard (cell) ; 4 MP1 and MP2 can be in either order palisade (mesophyll cell) ; red blood (cell) ; ciliated (cell) ; 7(c) when (existing) cells divide ; 1 7(d)(i) any three features labelled correctly: 3 acrosome / enzymes ; nucleus ; cell membrane ; cytoplasm ; mitochondria ; flagellum ; 7(d)(ii) sperm (cell) ; 1
Q8 · All living organisms can be classified into groups by the features they share
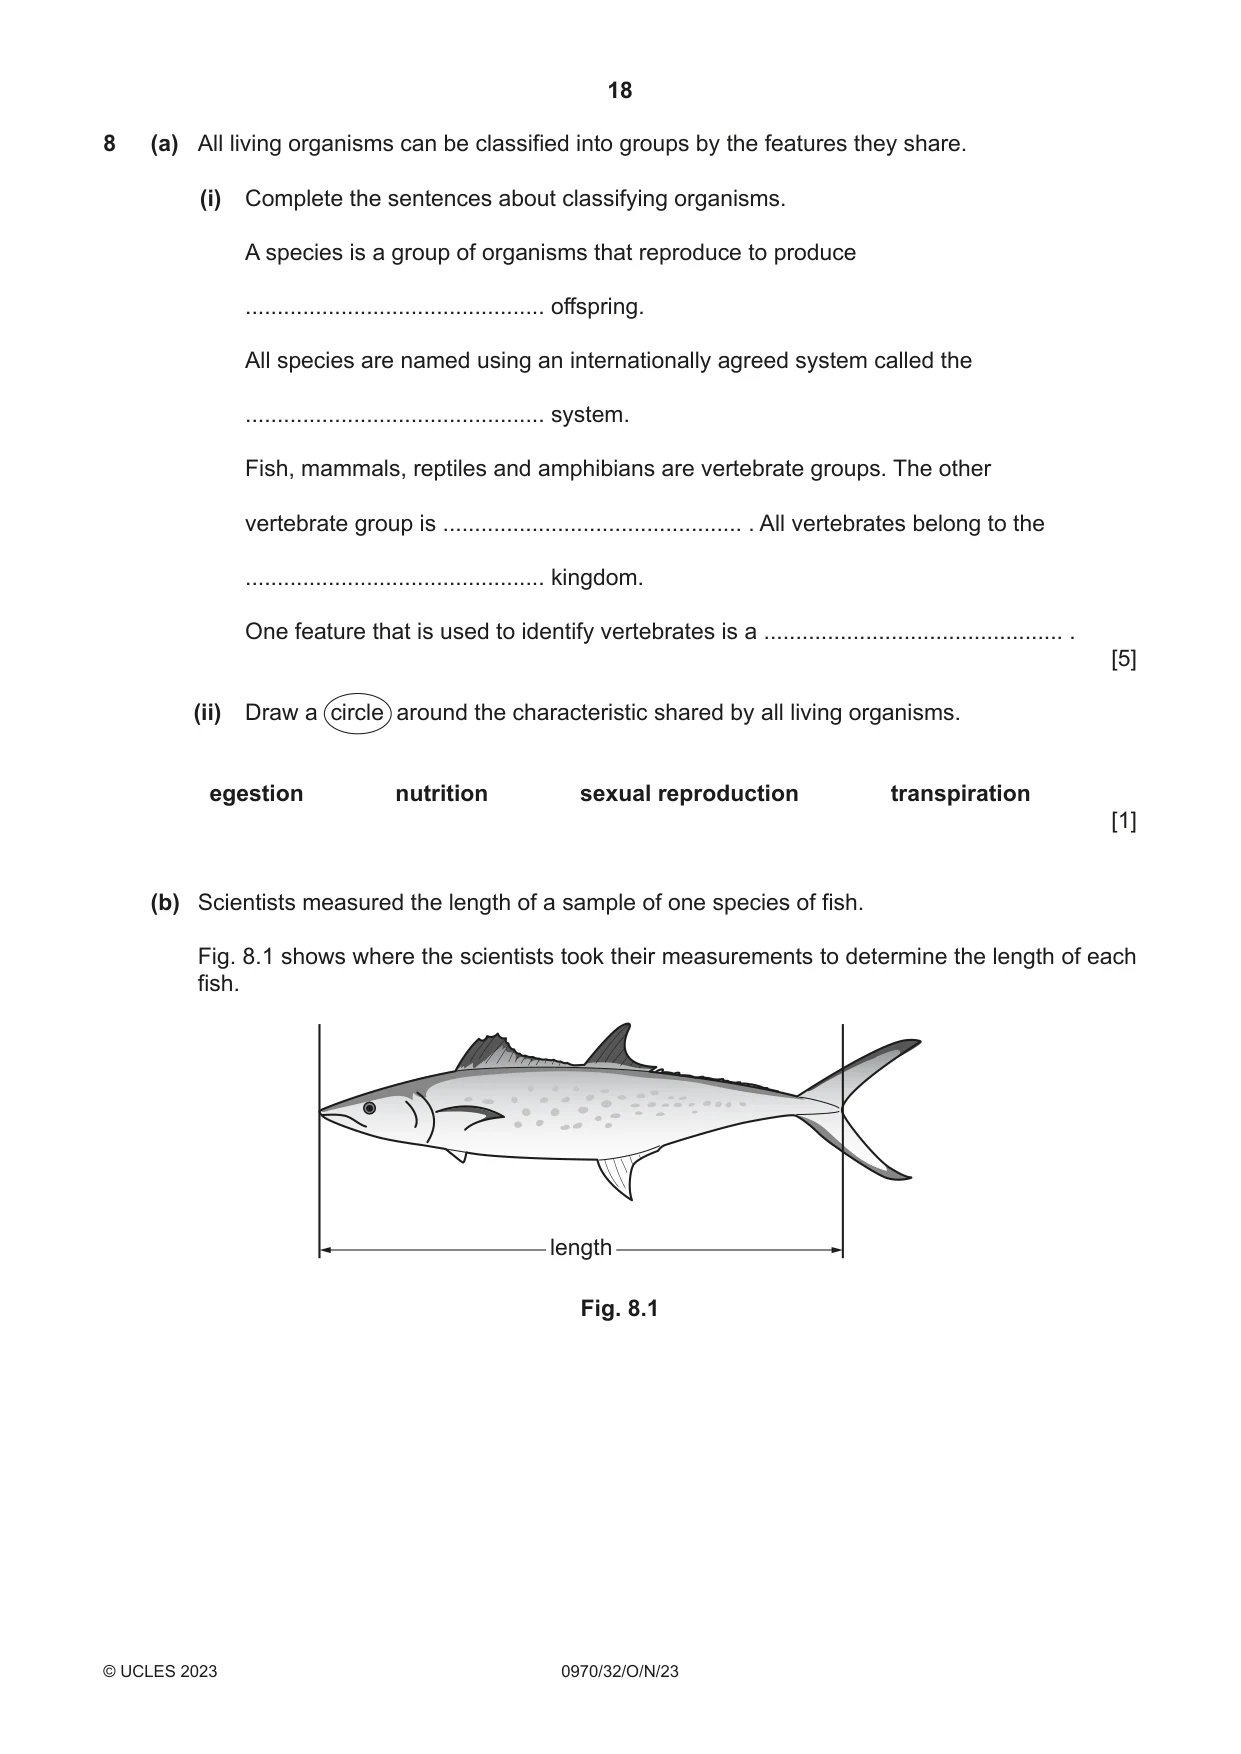
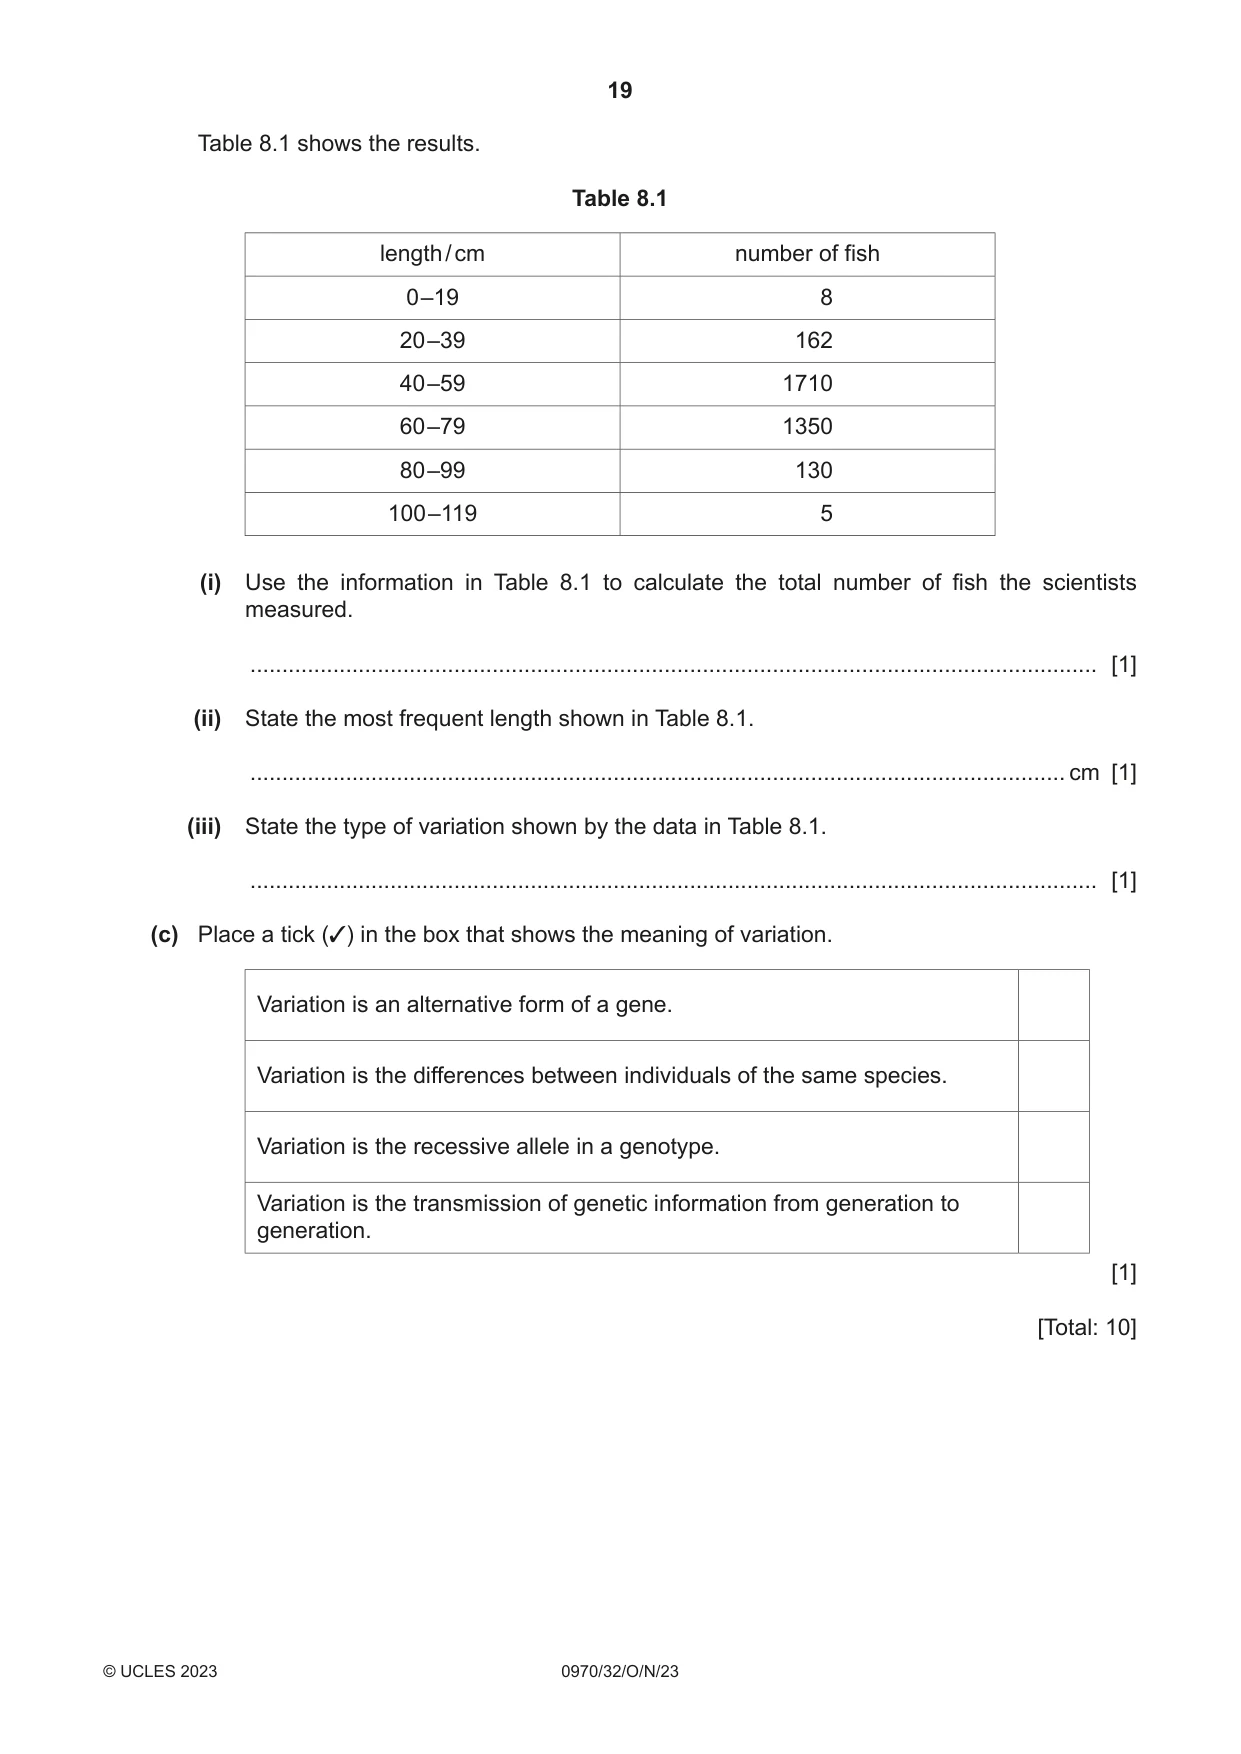
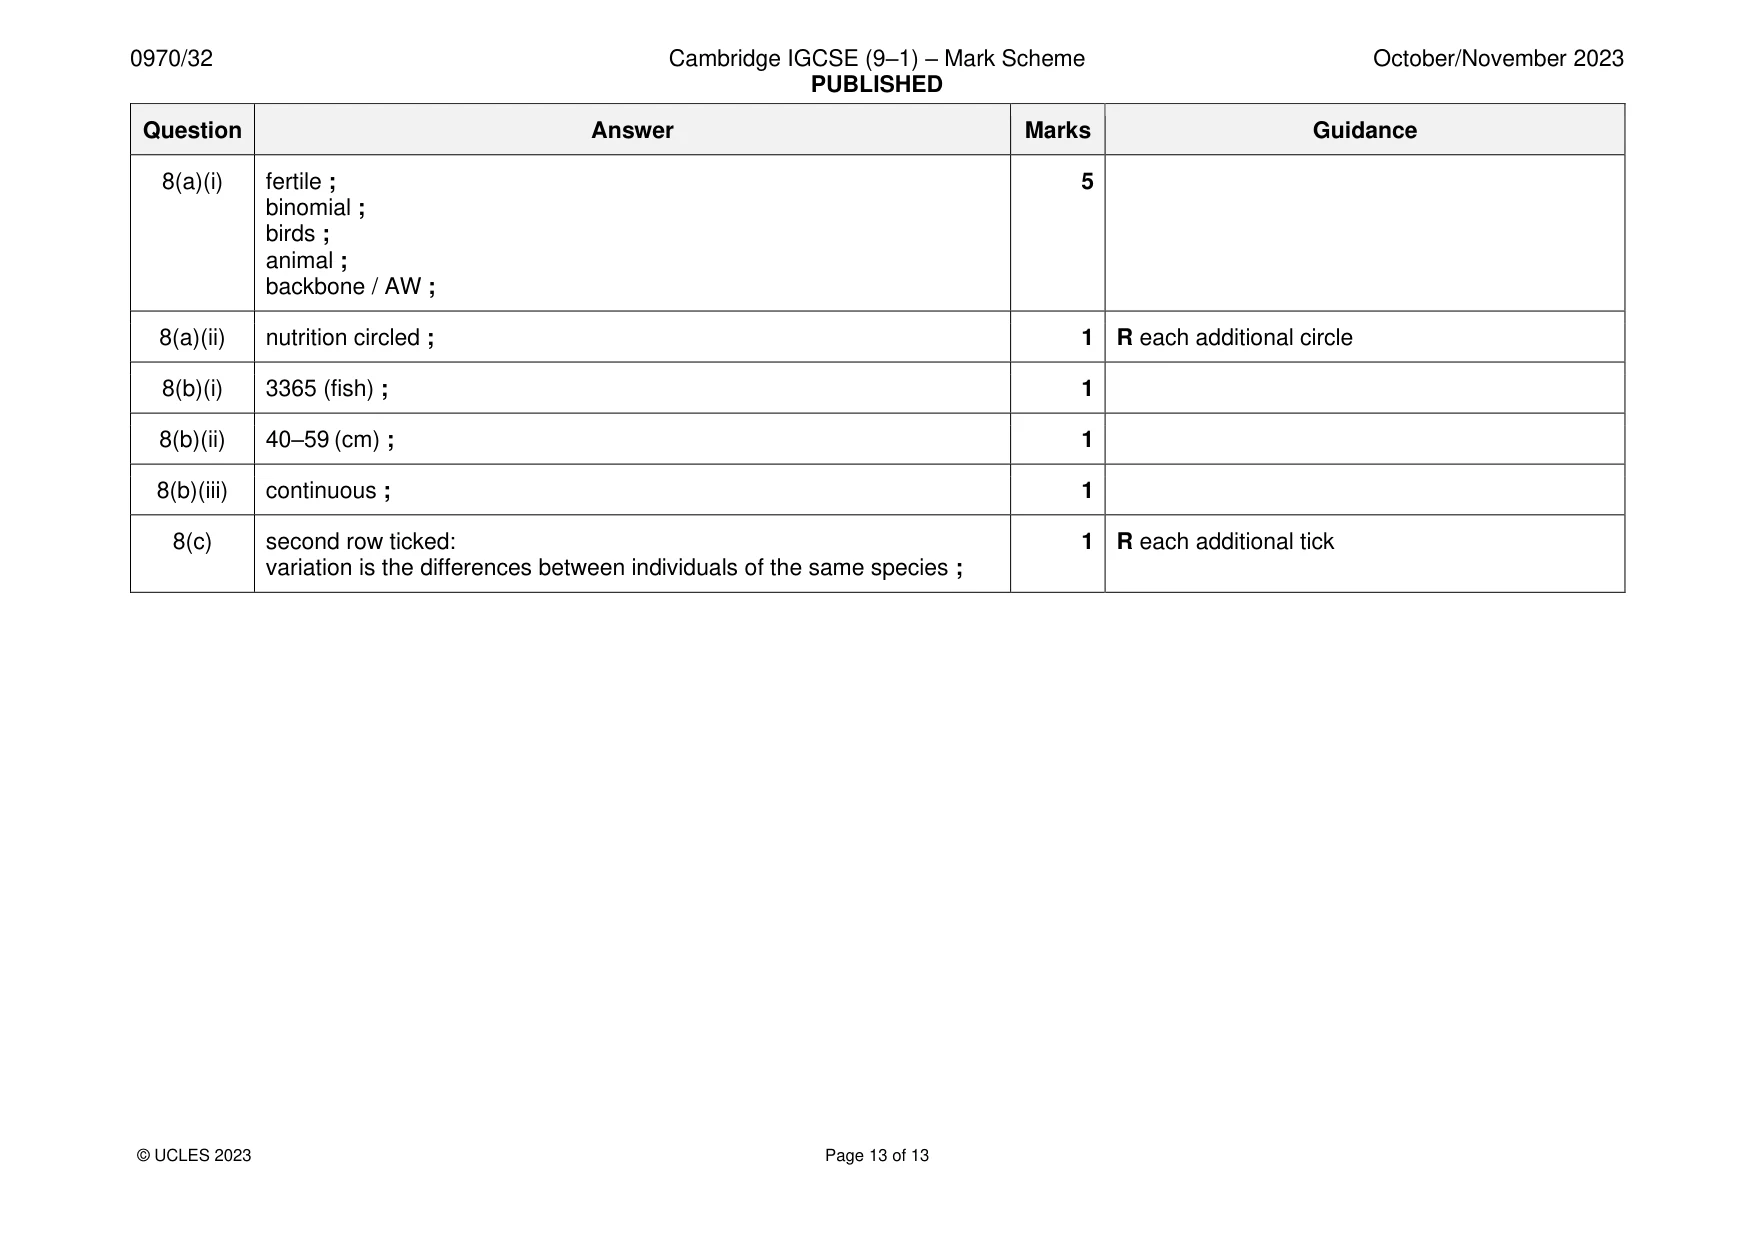
8 (a) All living organisms can be classified into groups by the features they share. (i) Complete the sentences about classifying organisms. A species is a group of organisms that reproduce to produce ............................................... offspring. All species are named using an internationally agreed system called the ............................................... system. Fish, mammals, reptiles and amphibians are vertebrate groups. The other vertebrate group is ............................................... . All vertebrates belong to the ............................................... kingdom. One feature that is used to identify vertebrates is a ............................................... . [5] (ii) Draw a circle around the characteristic shared by all living organisms. egestion nutrition sexual reproduction transpiration [1] (b) Scientists measured the length of a sample of one species of fish. Fig. 8.1 shows where the scientists took their measurements to determine the length of each fish. length Fig. 8.1 Table 8.1 shows the results. Table 8.1 length / cm number of fish 0 –19 8 20 –39 162 40 –59 1710 60 –79 1350 80 –99 130 100 –119 5 (i) Use the information in Table 8.1 to calculate the total number of fish the scientists measured. ..................................................................................................................................... [1] (ii) State the most frequent length shown in Table 8.1. ................................................................................................................................ cm [1] (iii) State the type of variation shown by the data in Table 8.1. ..................................................................................................................................... [1] (c) Place a tick (✓) in the box that shows the meaning of variation. Variation is an alternative form of a gene. Variation is the differences between individuals of the same species. Variation is the recessive allele in a genotype. Variation is the transmission of genetic information from generation to generation. [1] [Total: 10]
Mark scheme: 8(a)(i) fertile ; 5 binomial ; birds ; animal ; backbone / AW ; 8(a)(ii) nutrition circled ; 1 R each additional circle 8(b)(i) 3365 (fish) ; 1 8(b)(ii) 40–59 (cm) ; 1 8(b)(iii) continuous ; 1 8(c) second row ticked: 1 R each additional tick variation is the differences between individuals of the same species ;
More questions on Concept and uses of classification systems
What was in this paper
The subtopics covered by these 8 questions, and how many questions each got. Open one in a new tab to see every Cambridge question on it.
What you needed in this session
Cambridge’s own grade thresholds for 2023 Oct/Nov, Paper 3 · Variant 2. A higher threshold means an easier paper — the bar moves with how the cohort did.