Questions as text
Q1 · A student is investigating how the peak alternating current I0 varies with frequency f in… 9702/52 May/June 2013
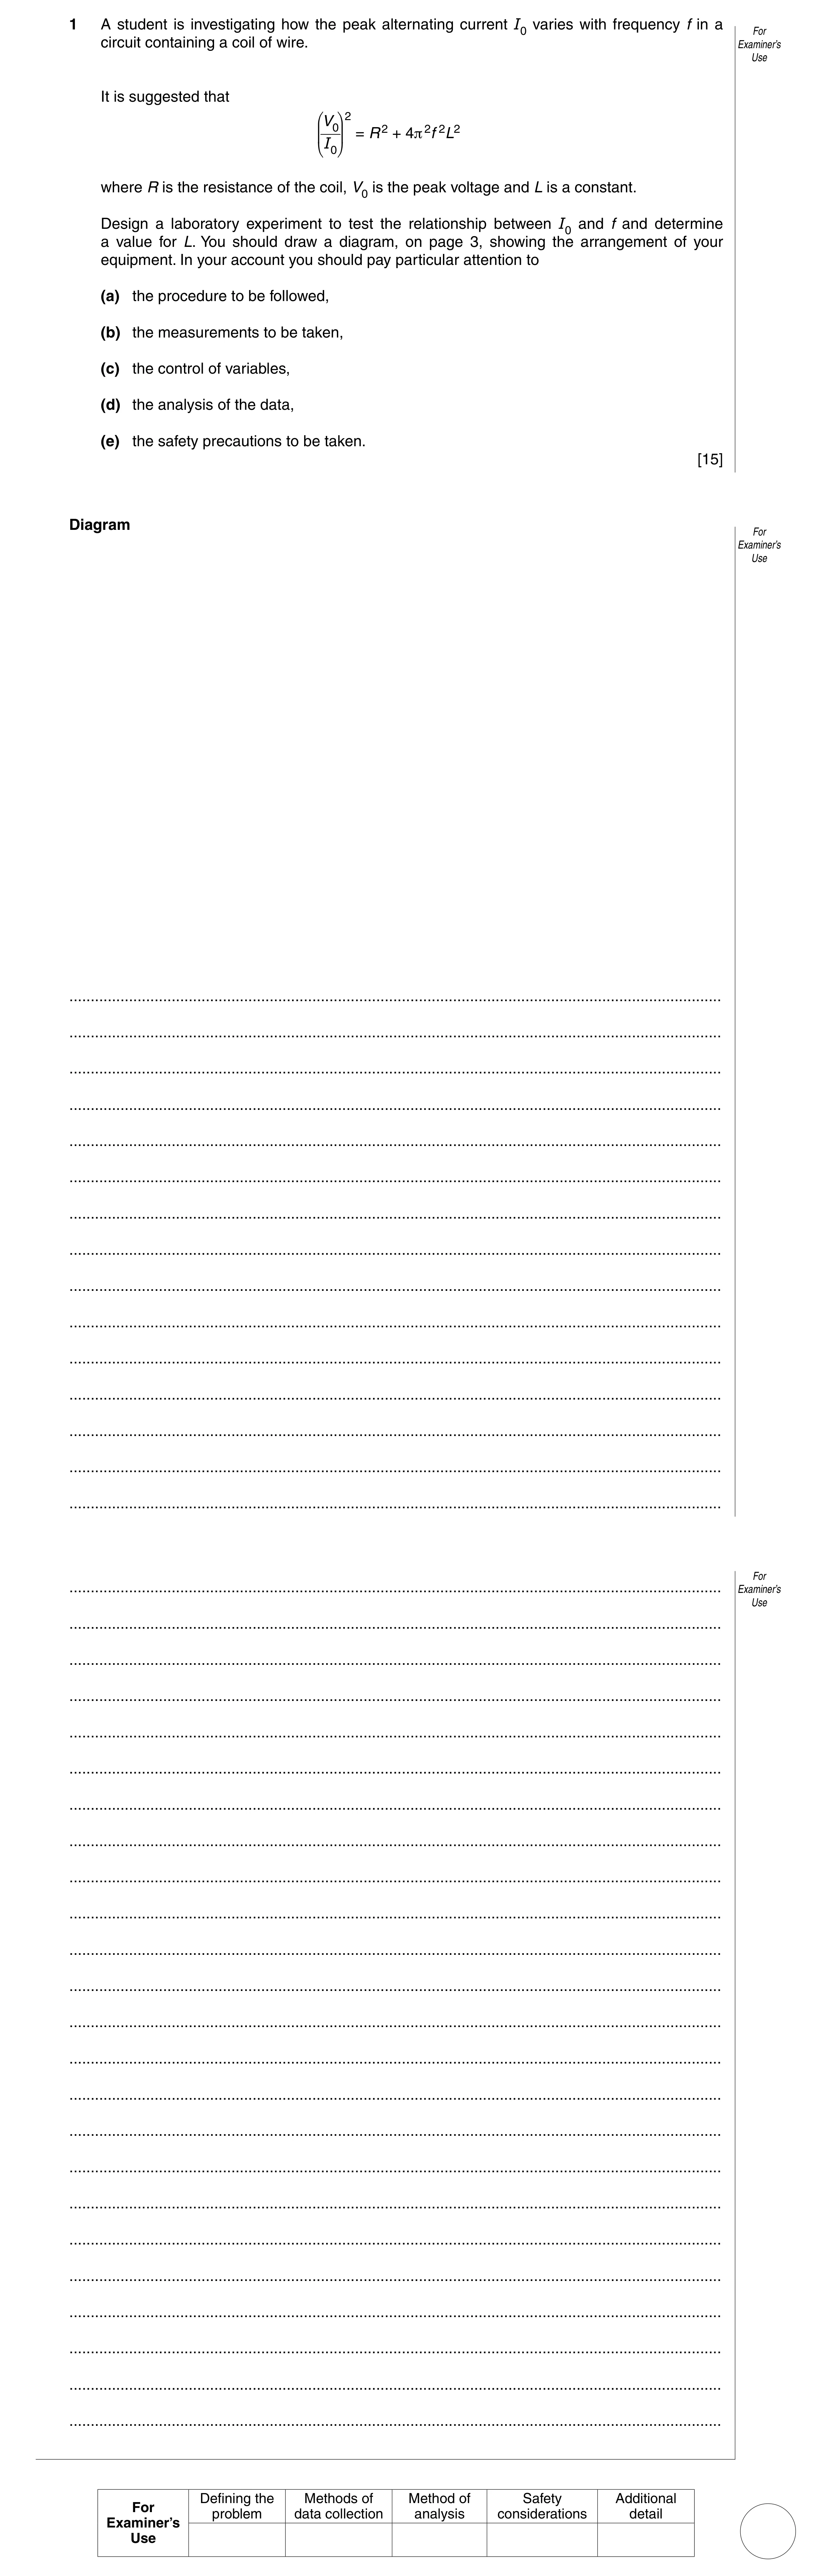
1 A student is investigating how the peak alternating current I0 varies with frequency f in a For circuit containing a coil of wire. Examiner’s Use It is suggested that V0 2 2 = R + 4π 2f 2L2 I0 where R is the resistance of the coil, V0 is the peak voltage and L is a constant. Design a laboratory experiment to test the relationship between I0 and f and determine a value for L. You should draw a diagram, on page 3, showing the arrangement of your equipment. In your account you should pay particular attention to (a) the procedure to be followed, (b) the measurements to be taken, (c) the control of variables, (d) the analysis of the data, (e) the safety precautions to be taken. [15] Diagram For Examiner’s Use … … … … … … … … … … … … … … … For … Examiner’s Use … … … … … … … … … … … … … … … … … … … … … … … Defining the Methods of Method of Safety Additional For problem data collection analysis considerations detail Examiner’s Use
15 marks
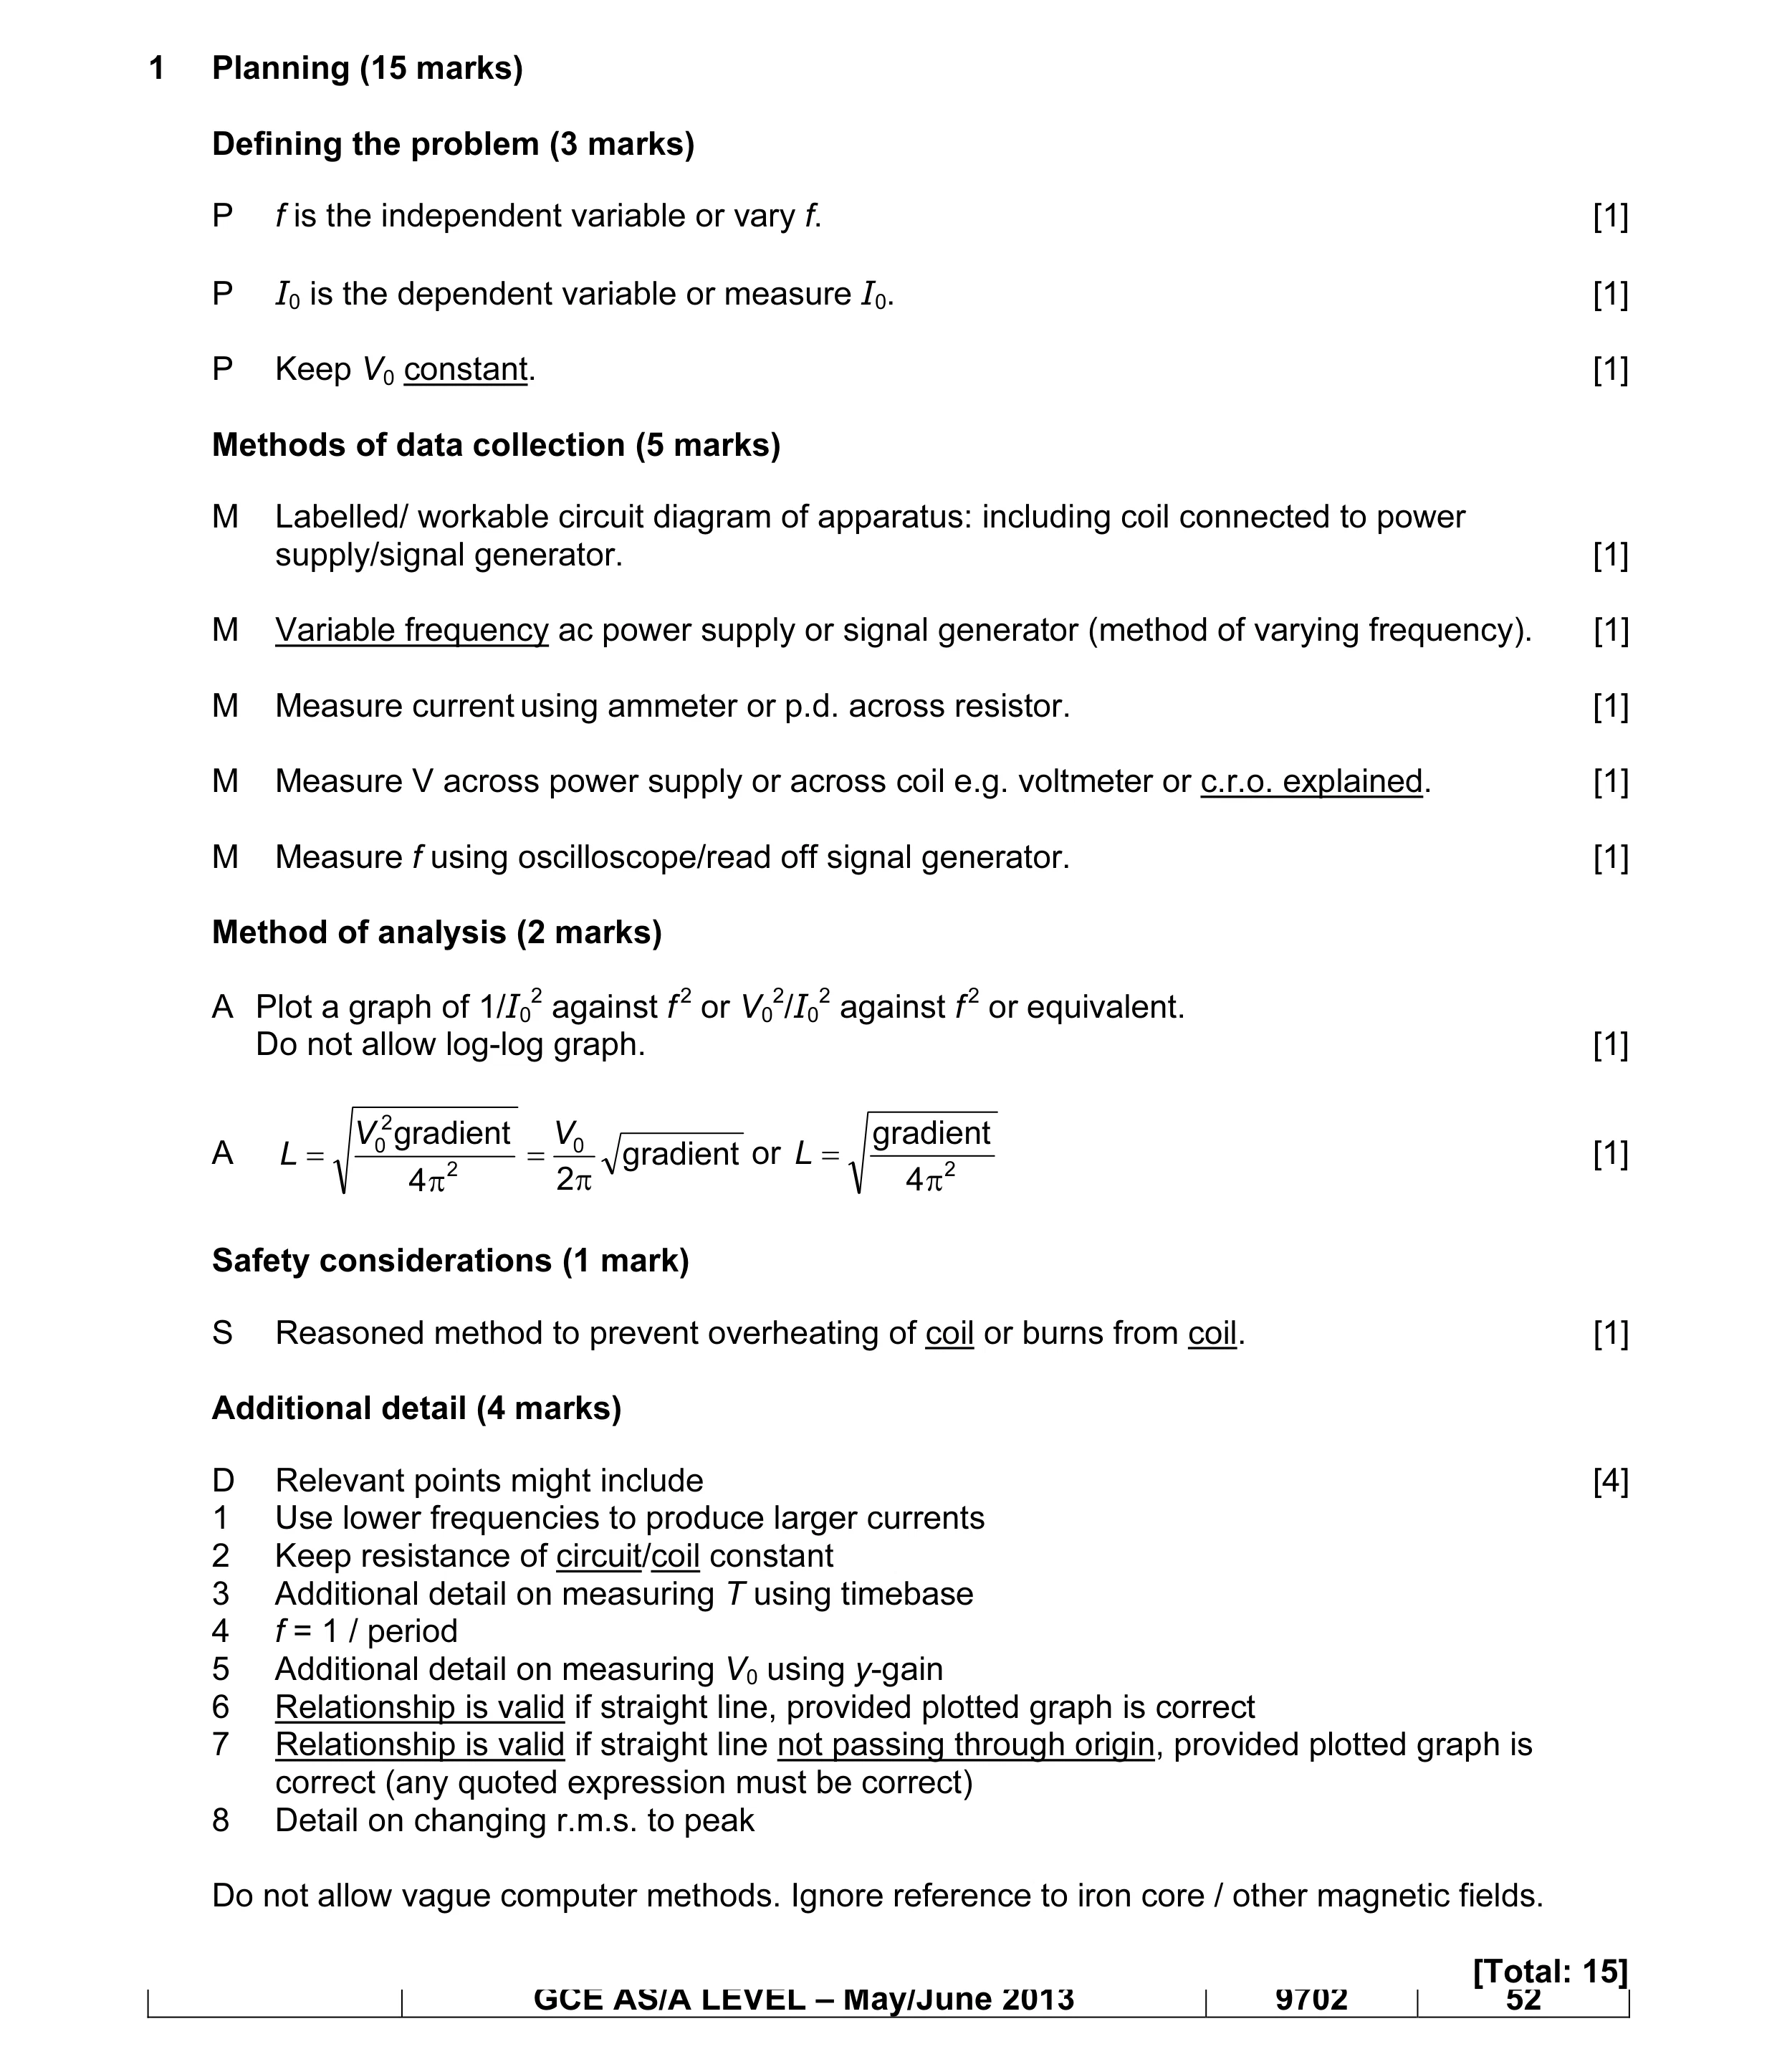
Mark scheme: 1 Planning (15 marks) Defining the problem (3 marks) P f is the independent variable or vary f. [1] P I0 is the dependent variable or measure I0. [1] P Keep V0 constant. [1] Methods of data collection (5 marks) M Labelled/ workable circuit diagram of apparatus: including coil connected to power supply/signal generator. [1] M Variable frequency ac power supply or signal generator (method of varying frequency). [1] M Measure current using ammeter or p.d. across resistor. [1] M Measure V across power supply or across coil e.g. voltmeter or c.r.o. explained. [1] M Measure f using oscilloscope/read off signal generator. [1] Method of analysis (2 marks) A Plot a graph of 1/I02 against f 2 or V02/I02 against f 2 or equivalent. Do not allow log-log graph. [1] V02 gradient V0 gradient A L = = gradient or L = 2 [1] 2 4 π 2 π 4 π Safety considerations (1 mark) S Reasoned method to prevent overheating of coil or burns from coil. [1] Additional detail (4 marks) D Relevant points might include [4] 1 Use lower frequencies to produce larger currents 2 Keep resistance of circuit/coil constant 3 Additional detail on measuring T using timebase 4 f = 1 / period 5 Additional detail on measuring V0 using y-gain 6 Relationship is valid if straight line, provided plotted graph is correct 7 Relationship is valid if straight line not passing through origin, provided plotted graph is correct (any quoted expression must be correct) 8 Detail on changing r.m.s. to peak Do not allow vague computer methods. Ignore reference to iron core / other magnetic fields. [Total: 15] GCE AS/A LEVEL – May/June 2013 9702 52
This question in 9702/52 May/June 2013
Q2 · A thin card is inserted between two separate iron cores 9702/53 Oct/Nov 2014
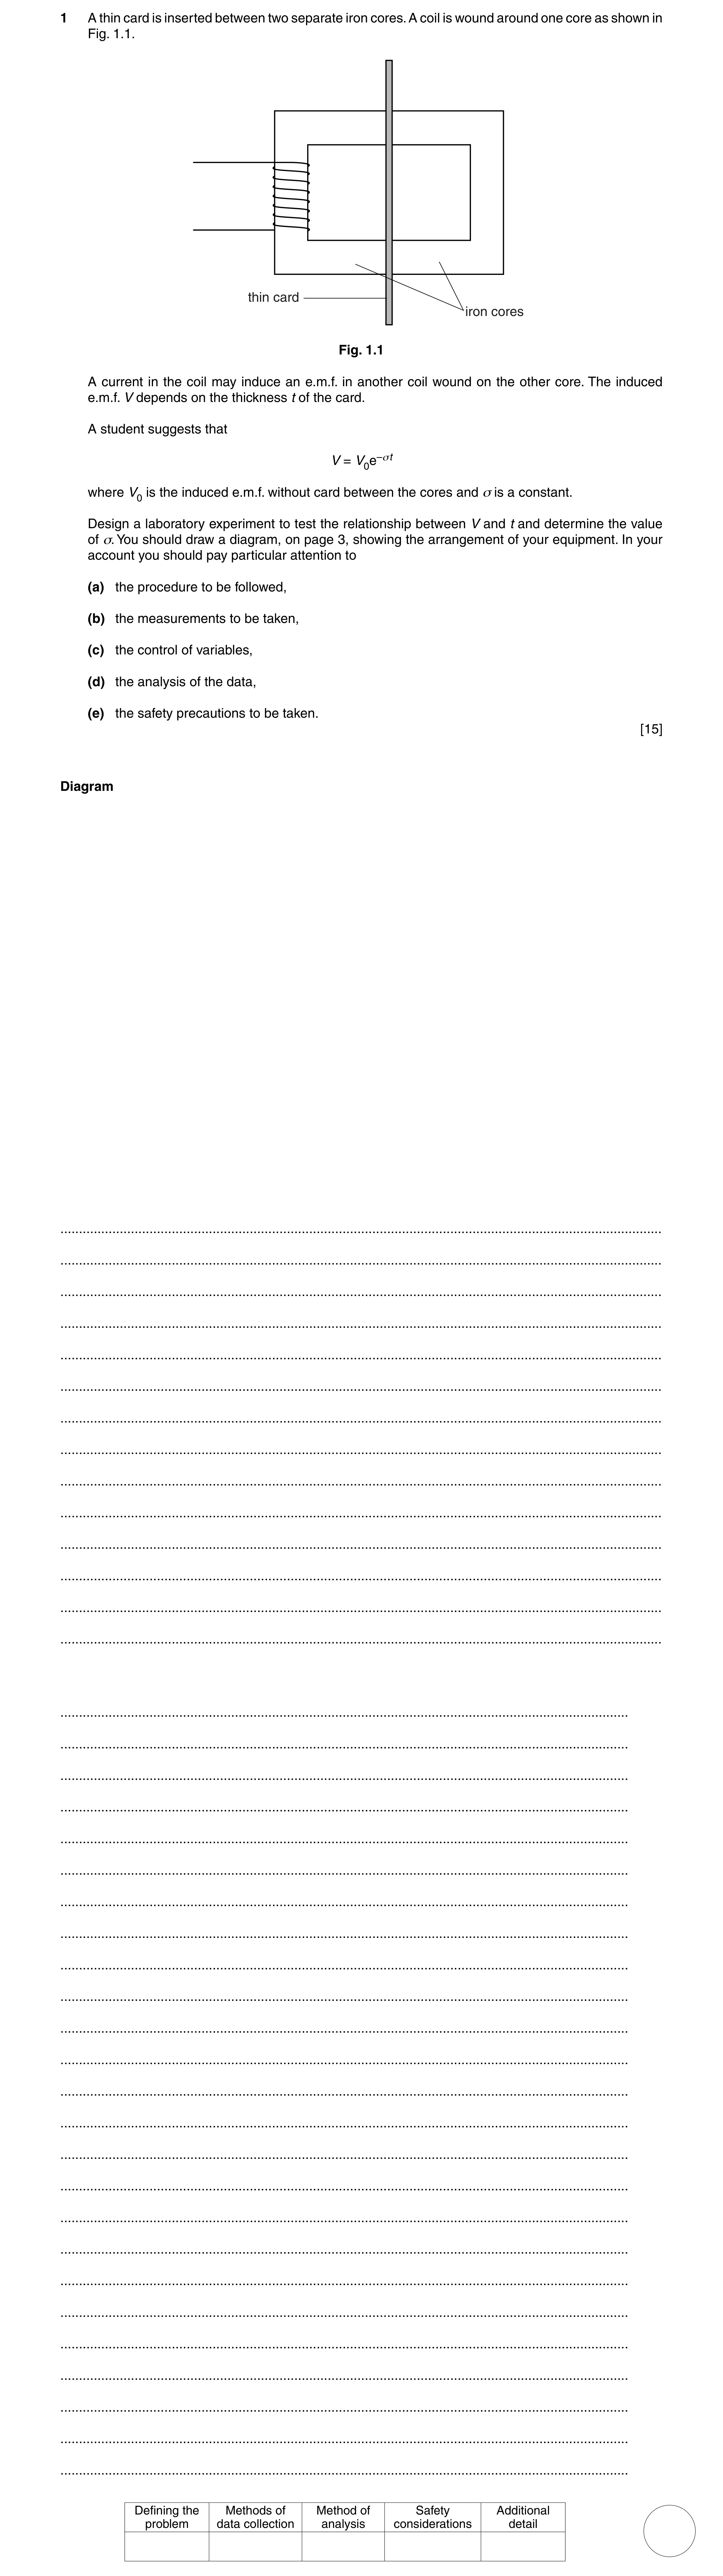
1 A thin card is inserted between two separate iron cores. A coil is wound around one core as shown in Fig. 1.1. thin card iron cores Fig. 1.1 A current in the coil may induce an e.m.f. in another coil wound on the other core. The induced e.m.f. V depends on the thickness t of the card. A student suggests that V = V0e–σt where V0 is the induced e.m.f. without card between the cores and σ is a constant. Design a laboratory experiment to test the relationship between V and t and determine the value of σ. You should draw a diagram, on page 3, showing the arrangement of your equipment. In your account you should pay particular attention to (a) the procedure to be followed, (b) the measurements to be taken, (c) the control of variables, (d) the analysis of the data, (e) the safety precautions to be taken. [15] Diagram … … … … … … … … … … … … … … … … … … … … … … … … … … … … … … … … … … … … … … … Defining the Methods of Method of Safety Additional problem data collection analysis considerations detail
15 marks
Mark scheme: 1 Planning (15 marks) Defining the problem (3 marks) P t is the independent variable or vary t. [1] P V is the dependent variable or measure V. [1] P Keep the current (in the primary coil) constant. [1] Methods of data collection (5 marks) M Diagram showing two independent labelled coils wound on iron cores. [1] M AC power supply / signal generator connected to one coil. [1] M Voltmeter / oscilloscope connected to other coil in a workable circuit. [1] M Measure thickness of card using micrometer / vernier calipers / digital calipers. [1] M Method to keep current constant – rheostat (or variable power supply) and ammeter correctly positioned in primary circuit and explained. Diagram and text required. [1] Method of analysis (2 marks) M Plot a graph of ln V against t (allow lg V against t) or ln V / V0 against t [1] M σ = – gradient [1] Safety considerations (1 mark) S Precaution linked to hot coil(s) e.g. switch off when not in use / do not touch / wear gloves. [1] Additional detail (4 marks) D Relevant points might include [4] 1 Use large current (in primary coil)/large number of turns on the secondary to achieve measurable V (allow more turns on secondary than primary). 2 Keep frequency of power supply constant or keep the number of turns on each coil constant. 3 Use laminated cores or use insulated wire for turns. 4 Repeat measurements of t and average. 5 Measurement of V0 stating that no card is present. 6 Logarithmic equation: ln V = ln V0 – σt 7 Relationship is valid if the graph is a straight line with y–intercept = ln V0 8 Discussion of compression of card / measure t when secured. Do not allow vague computer methods. [Total: 15]
This question in 9702/53 Oct/Nov 2014
Q3 · A student is investigating the current in a circuit 9702/52 May/June 2017
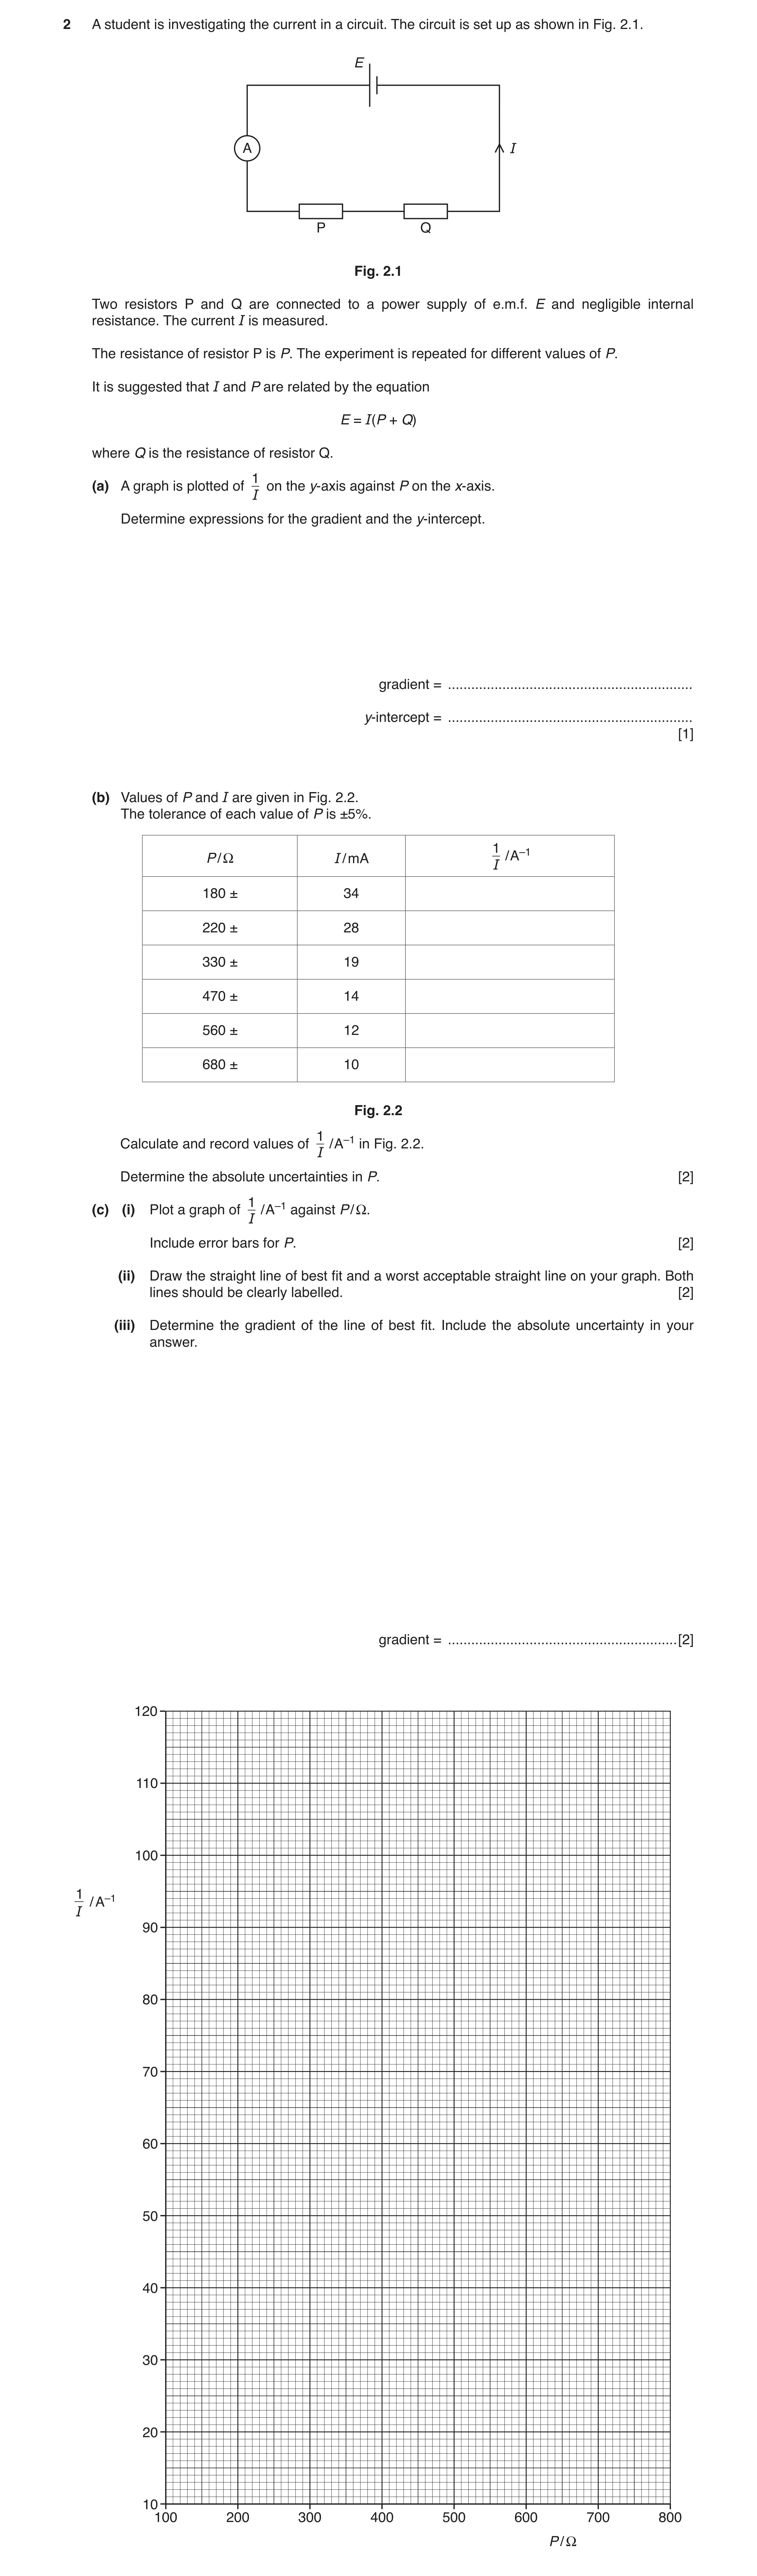
2 A student is investigating the current in a circuit. The circuit is set up as shown in Fig. 2.1. E A I P Q Fig. 2.1 Two resistors P and Q are connected to a power supply of e.m.f. E and negligible internal resistance. The current I is measured. The resistance of resistor P is P. The experiment is repeated for different values of P. It is suggested that I and P are related by the equation E = I(P + Q) where Q is the resistance of resistor Q. 1 (a) A graph is plotted of on the y-axis against P on the x-axis. I Determine expressions for the gradient and the y-intercept. gradient = … y-intercept = … [1] (b) Values of P and I are given in Fig. 2.2. The tolerance of each value of P is ±5%. 1 P / Ω I / mA / A–1 I 180 ± 34 220 ± 28 330 ± 19 470 ± 14 560 ± 12 680 ± 10 Fig. 2.2 1 Calculate and record values of / A–1 in Fig. 2.2. I Determine the absolute uncertainties in P. [2] 1(c) (i) Plot a graph of / A–1 against P / Ω. I Include error bars for P. [2] (ii) Draw the straight line of best fit and a worst acceptable straight line on your graph. Both lines should be clearly labelled. [2] (iii) Determine the gradient of the line of best fit. Include the absolute uncertainty in your answer. gradient = … [2]
9 marks
Mark scheme: 2(a) gradient = 1 E y-intercept = Q E 1 2(b) P / Ω 1 I / A–1 ± 9 29 or 29.4 ± 11 36 or 35.7 ± 16.5 53 or 52.6 ± 23.5 71 or 71.4 ± 28 83 or 83.3 ± 34 100 First mark for uncertainties correct. Allow 1 s.f. e.g. 10, 10, 20, 20, 30, 30. Second mark for all second column correct. Allow a mixture of significant figures. 2 2(c)(i) Six points plotted correctly. Must be accurate to less than half a small square. No “blobs”. Diameter of points must be less than half a small square. 1 Error bars in P plotted correctly. All error bars to be plotted. Length of bar must be accurate to less than half a small square and symmetrical. 1 Question Answer Marks 2(c)(ii) Line of best fit drawn. If points are plotted correctly then lower end of line should pass between (200, 32) and (200, 34) and upper end of line should pass between (600, 88) and (600, 91). 1 Worst acceptable line drawn (steepest or shallowest possible line). All error bars must be plotted. 1 2(c)(iii) Gradient determined with a triangle that is at least half the length of the drawn line. 1 uncertainty = gradient of line of best fit – gradient of worst acceptable line or uncertainty = ½ (steepest worst line gradient – shallowest worst line gradient) 1 2(c)(iv) y-intercept determined by substitution of correct point into y = mx + c. 1 uncertainty = y-intercept of line of best fit – y-intercept of worst acceptable line or uncertainty = ½ (steepest worst line y-intercept – shallowest worst line y-intercept) 1 Question Answer Marks 2(d)(i) E determined using gradient and units for E and Q with correct power of ten. = = 1 1 gradient 2(c)(iii) E 1 Q determined using y-intercept and E and Q given to 2 or 3 significant figures. Correct substitution of numbers must be seen. = × = × = = -intercept 2(c)(iv) -intercept 2(c)(iv) gradient 2(c)(iii) y Q E y E 1 2(d)(ii) % uncertainty in E = % uncertainty in gradient 1 % uncertainty in Q = % uncertainty in E + % uncertainty in y-intercept or % uncertainty in Q = % uncertainty in gradient + % uncertainty in y-intercept. Correct substitution of numbers must be seen. Maximum/minimum methods: = × max -intercept Max max -intercept max or mingradient y Q y E = × min -intercept Min min -intercept min or max gradient y Q y E 1
This question in 9702/52 May/June 2017
Q4 · A student is investigating the current in a circuit 9702/52 Oct/Nov 2018
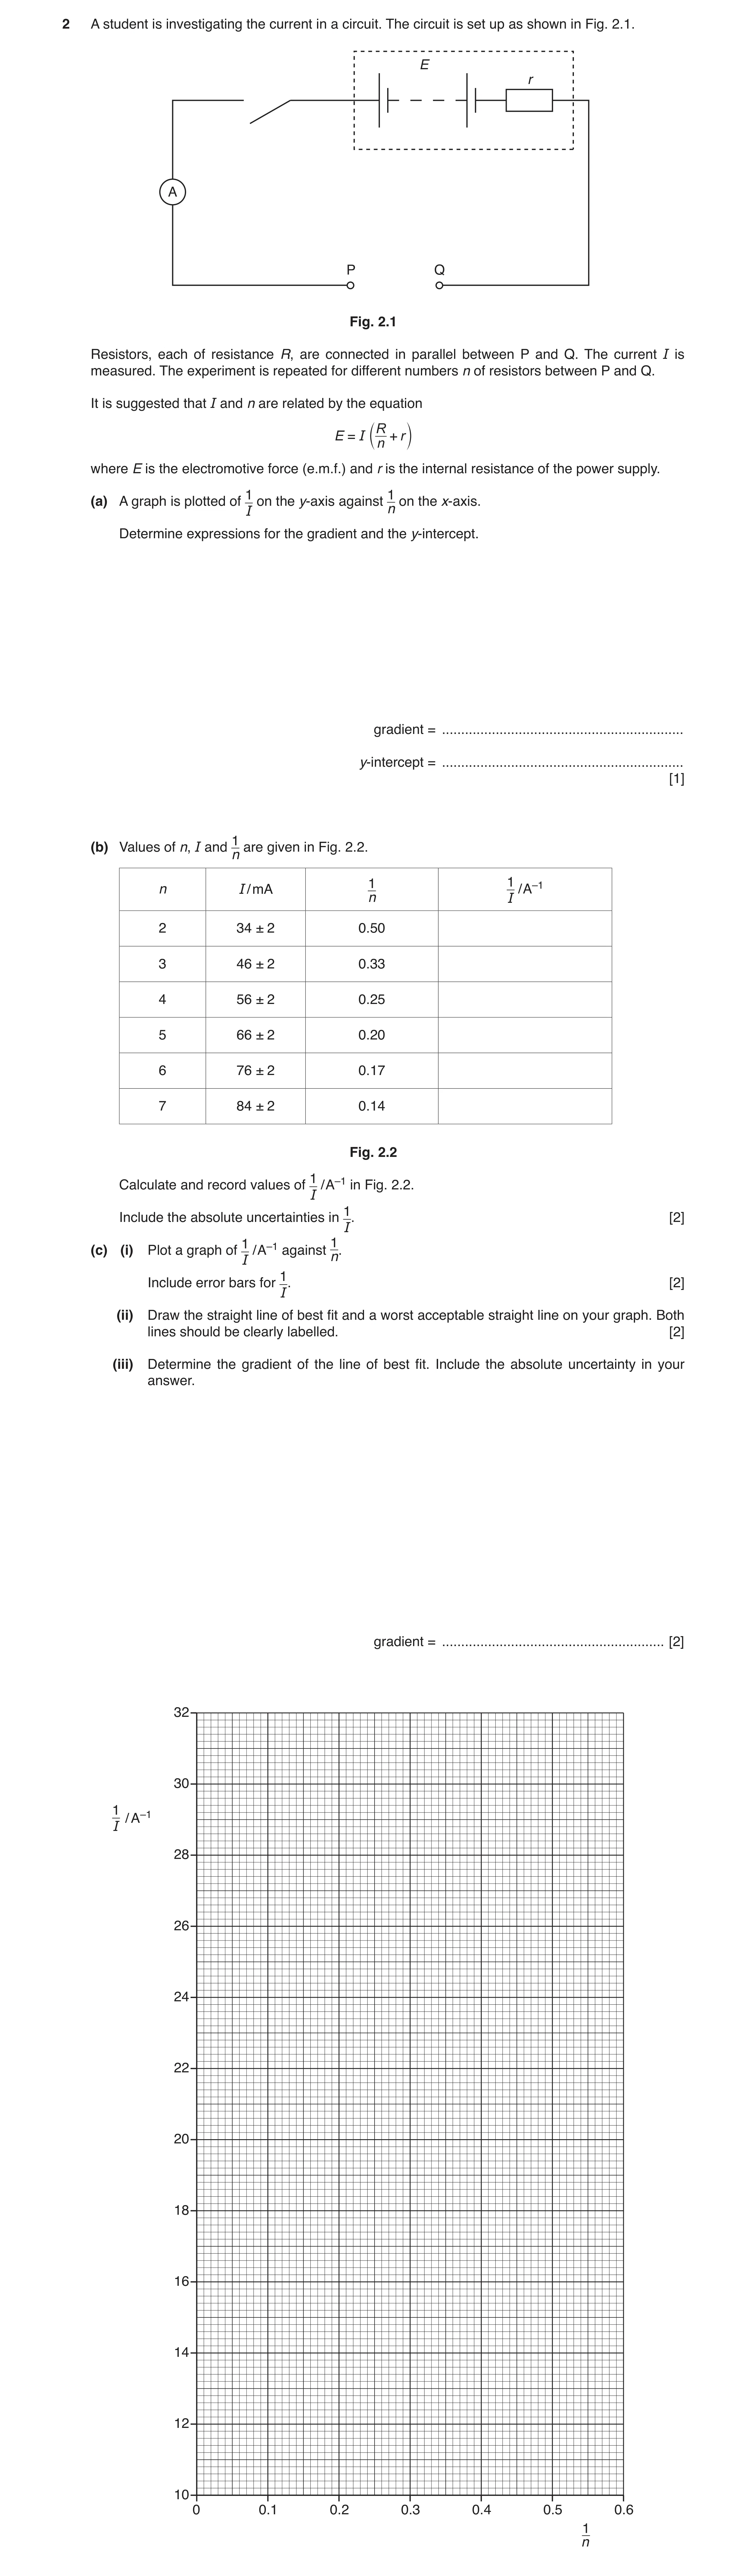
2 A student is investigating the current in a circuit. The circuit is set up as shown in Fig. 2.1. E r A P Q Fig. 2.1 Resistors, each of resistance R, are connected in parallel between P and Q. The current I is measured. The experiment is repeated for different numbers n of resistors between P and Q. It is suggested that I and n are related by the equation R E = I + r c n m where E is the electromotive force (e.m.f.) and r is the internal resistance of the power supply. 1 1 (a) A graph is plotted of on the y-axis against on the x-axis. I n Determine expressions for the gradient and the y-intercept. gradient = … y-intercept = … [1] 1(b) Values of n, I and are given in Fig. 2.2. n 1 1 / A–1 n I / mA n I 2 34 ± 2 0.50 3 46 ± 2 0.33 4 56 ± 2 0.25 5 66 ± 2 0.20 6 76 ± 2 0.17 7 84 ± 2 0.14 Fig. 2.2 1 Calculate and record values of / A–1 in Fig. 2.2. I 1 Include the absolute uncertainties in I. [2] 1 1(c) (i) Plot a graph of / A–1 against n. I 1 Include error bars for I. [2] (ii) Draw the straight line of best fit and a worst acceptable straight line on your graph. Both lines should be clearly labelled. [2] (iii) Determine the gradient of the line of best fit. Include the absolute uncertainty in your answer. gradient = … [2]
9 marks
Mark scheme: 2(a) gradient = R E y-intercept = r E 1 2(b) 29 or 29.4 22 or 21.7 18 or 17.9 15 or 15.2 13 or 13.2 12 or 11.9 1 absolute uncertainties in 1 / I from ±2 (or ±1) to ±0.2, ±0.3 or ±0.4. Allow a mixture of significant figures. 1 2(c)(i) Six points plotted correctly. Must be within half a small square. Diameter of points must be less than half a small square. 1 Error bars in 1 / I plotted correctly. All error bars to be plotted. Length of bar must be accurate to less than half a small square and symmetrical. 1 2(c)(ii) Line of best fit drawn. Points must be balanced. Line should pass to the left of (0.50, 29.6) and line should pass between (0.210, 16) and (0.225, 16). 1 Worst acceptable line drawn (steepest or shallowest possible line that passes through all the error bars). All error bars must be plotted. 1 Question Answer Marks 2(c)(iii) Gradient determined with clear substitution of points from line of best fit into ∆y / ∆x. Distance between points must be at least half the length of the drawn line. 1 uncertainty = gradient of line of best fit – gradient of worst acceptable line or uncertainty = ½ (steepest worst line gradient – shallowest worst line gradient) 1 2(c)(iv) y-intercept determined by substitution into y = mx + c. 1 y-intercept of worst acceptable line determined by substitution into y = mx + c. uncertainty = y-intercept of line of best fit – y-intercept of worst acceptable line or uncertainty = ½ (steepest worst line y-intercept – shallowest worst line y-intercept) Do not allow if false origin used. 1 2(d)(i) E calculated using gradient. Correct substitution of numbers required. 470 470 gradient E = = (c)(iii) 1 r calculated using y-intercept. Correct substitution of numbers required. -intercept r E y = × 1 E and r determined using correct method with: • Unit of E with correct power of ten – e.g. V, A Ω • Unit of r with correct power of ten – e.g. Ω, V A–1 • E and r given to 2 or 3 significant figures. 1 Question Answer Marks 2(d)(ii) Percentage uncertainty in r determined. Correct substitution of numbers required. %uncertainty in gradient + %uncertainty in R (1.06%) + %uncertainty in y-intercept or %uncertainty in E + %uncertainty in y-intercept Maximum/minimum methods: max max -intercept max r y E = × ( ) max 475 max max -intercept mingradient R r y = × min min -intercept min r y E = × ( ) min 465 min min -intercept max gradient R r y = × 1
This question in 9702/52 Oct/Nov 2018
Q5 · A student investigates the current in a coil and a resistor connected in series, as shown… 9702/51 May/June 2021
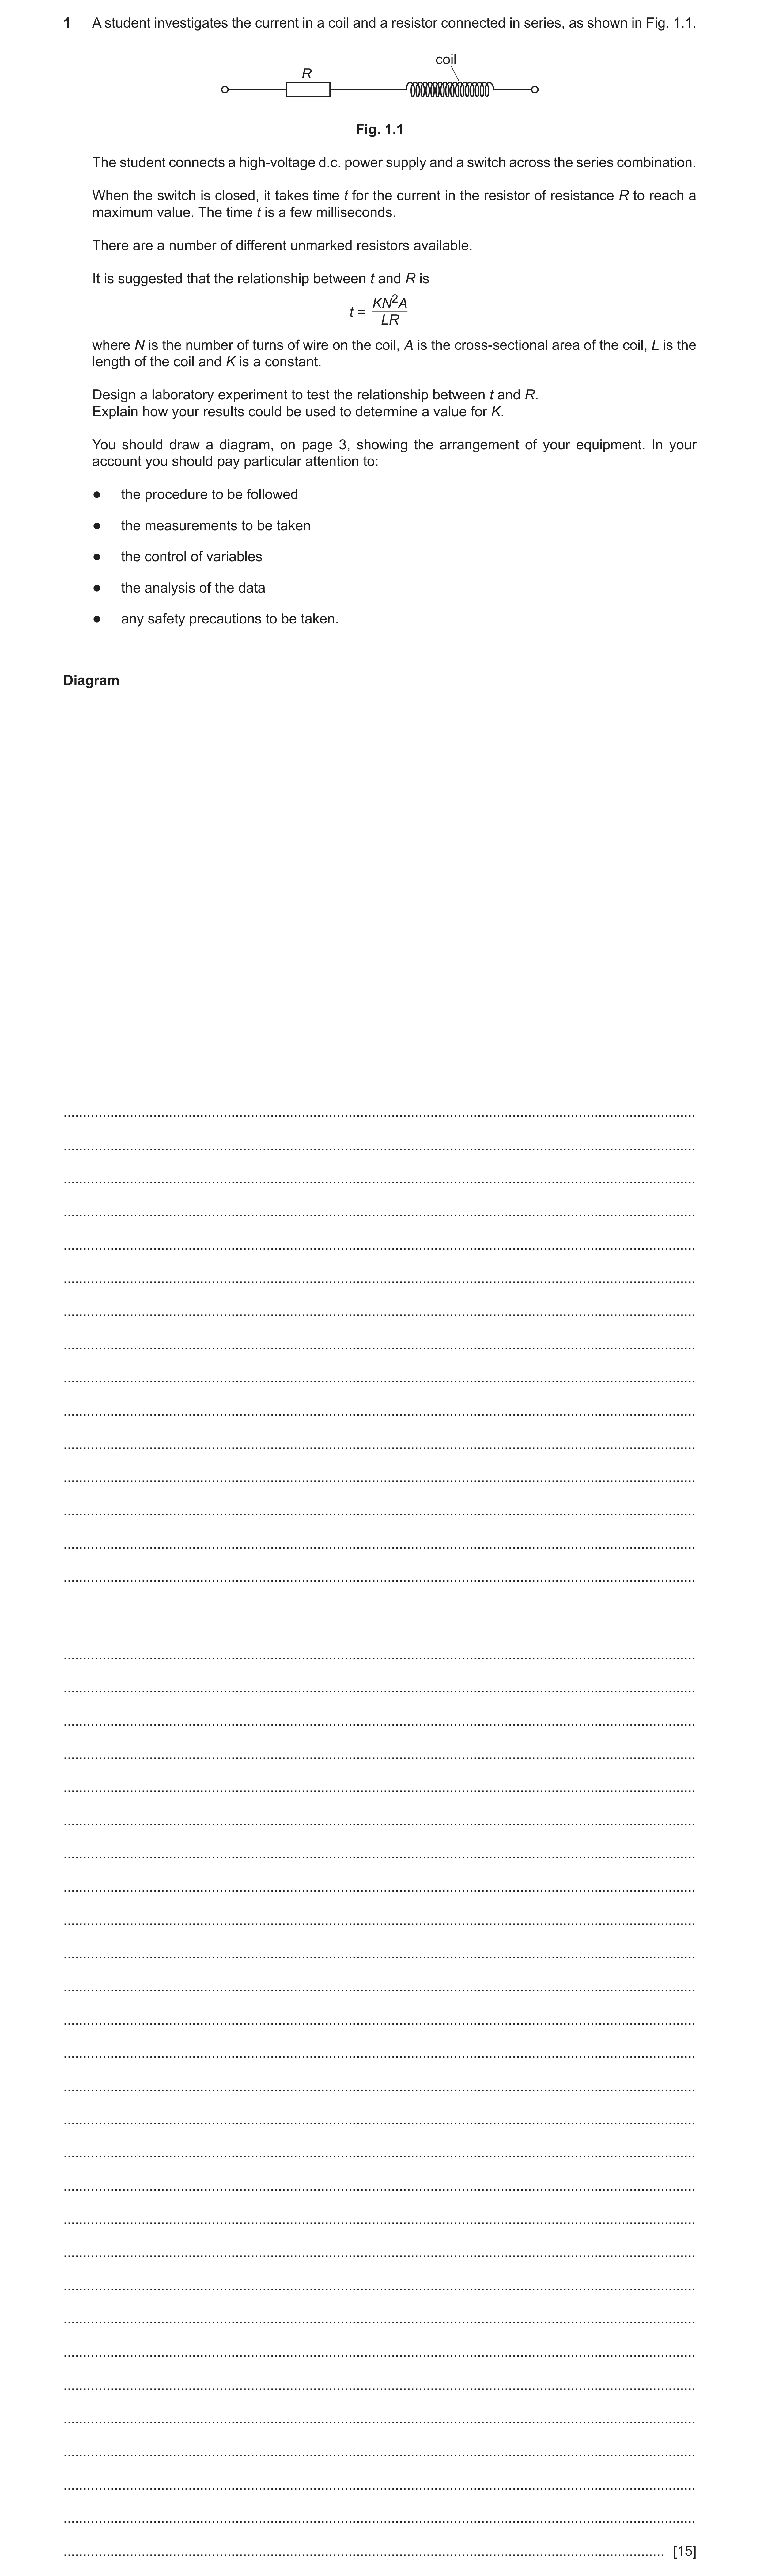
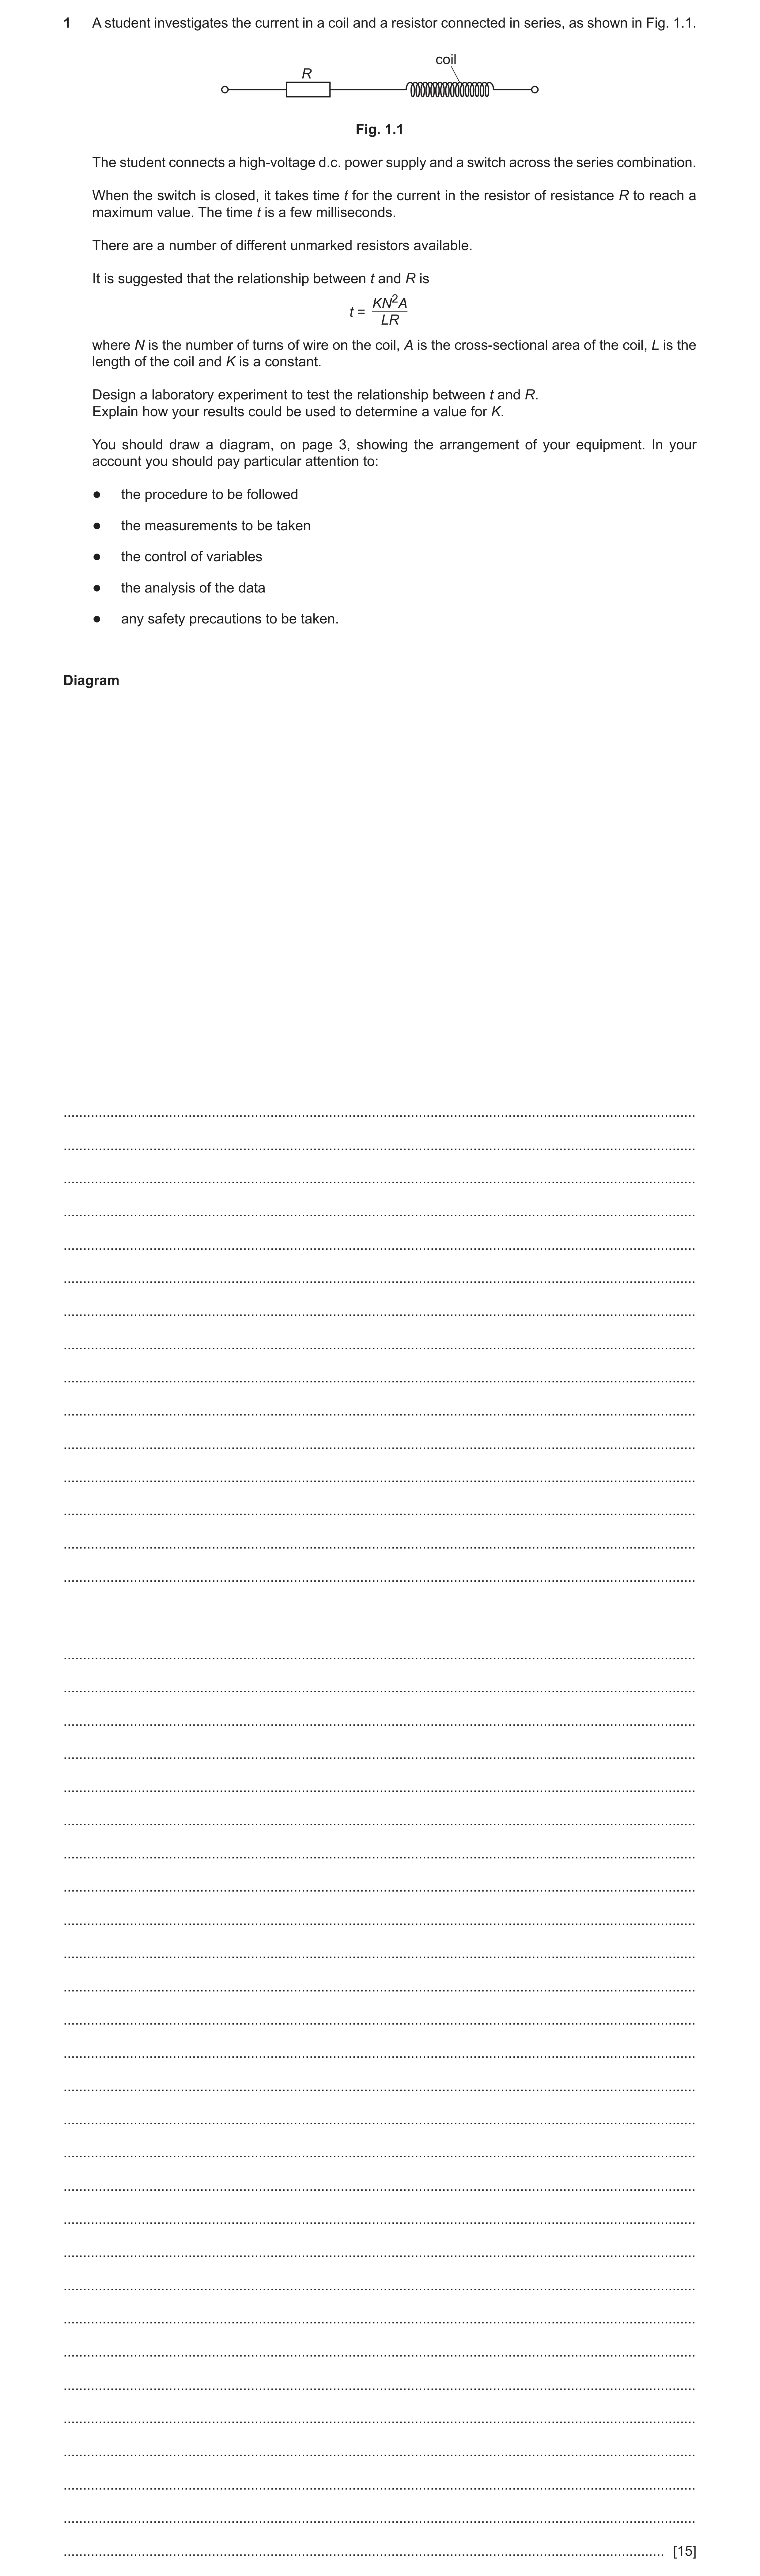
1 A student investigates the current in a coil and a resistor connected in series, as shown in Fig. 1.1. coil R Fig. 1.1 The student connects a high-voltage d.c. power supply and a switch across the series combination. When the switch is closed, it takes time t for the current in the resistor of resistance R to reach a maximum value. The time t is a few milliseconds. There are a number of different unmarked resistors available. It is suggested that the relationship between t and R is KN2A t = LR where N is the number of turns of wire on the coil, A is the cross-sectional area of the coil, L is the length of the coil and K is a constant. Design a laboratory experiment to test the relationship between t and R. Explain how your results could be used to determine a value for K. You should draw a diagram, on page 3, showing the arrangement of your equipment. In your account you should pay particular attention to: ● the procedure to be followed ● the measurements to be taken ● the control of variables ● the analysis of the data ● any safety precautions to be taken. Diagram … … … … … … … … … … … … … … … … … … … … … … … … … … … … … … … … … … … … … … … … … … … [15]
15 marks
Mark scheme: 1 Defining the problem R is the independent variable and t is the dependent variable or vary R and measure t 1 keep the number of turns on the coil/N constant 1 Methods of data collection labelled diagram or correct symbols including: • labelled (d.c.) power supply • switch in series with power supply, resistor and coil • complete workable circuit 1 circuit diagram to measure R, e.g. ammeter and voltmeter correctly positioned or R connected to ohmmeter with no other connections (not ohmmeter in main circuit) 1 method to determine t (of a few milliseconds) e.g. use (storage) oscilloscope or current/voltage sensor connected to datalogger/computer 1 method to determine A, e.g. micrometer/calipers to determine diameter of coil and A = πd2 / 4 1 Method of analysis plot a graph of t against 1 / R (allow log t against log R) 1 relationship valid if a straight line passing through the origin is produced (allow gradient = –1 for graph of log t against log R) 1 2 gradient . L K AN × = 1 Question Answer Marks 1 Additional detail including safety considerations 6 D1 open switch/switch off (high voltage) circuit before changing the resistor/touching components or ensure no bare wires/use shrouded connectors D2 wear (insulating) gloves to prevent electric shock/electrocution D3 keep A and L constant D4 use ruler/calipers to measure L D5 repeat measurements of diameter in different directions/at points along the coil and average D6 method to determine R e.g. R = V / I linked to correct circuit diagram for ammeter/voltmeter method or measure resistance using ohmmeter D7 repeat experiment for each value of R and average t D8 method to determine t: use of time-base from oscilloscope explained or use of time axis of output from data logger/computer explained D9 use smaller values of R to increase I D10 reduce L or increase N or increase A to increase t
This question in 9702/51 May/June 2021
Q6 · A student investigates the current in a circuit containing a cell, as shown in Fig 9702/52 May/June 2021
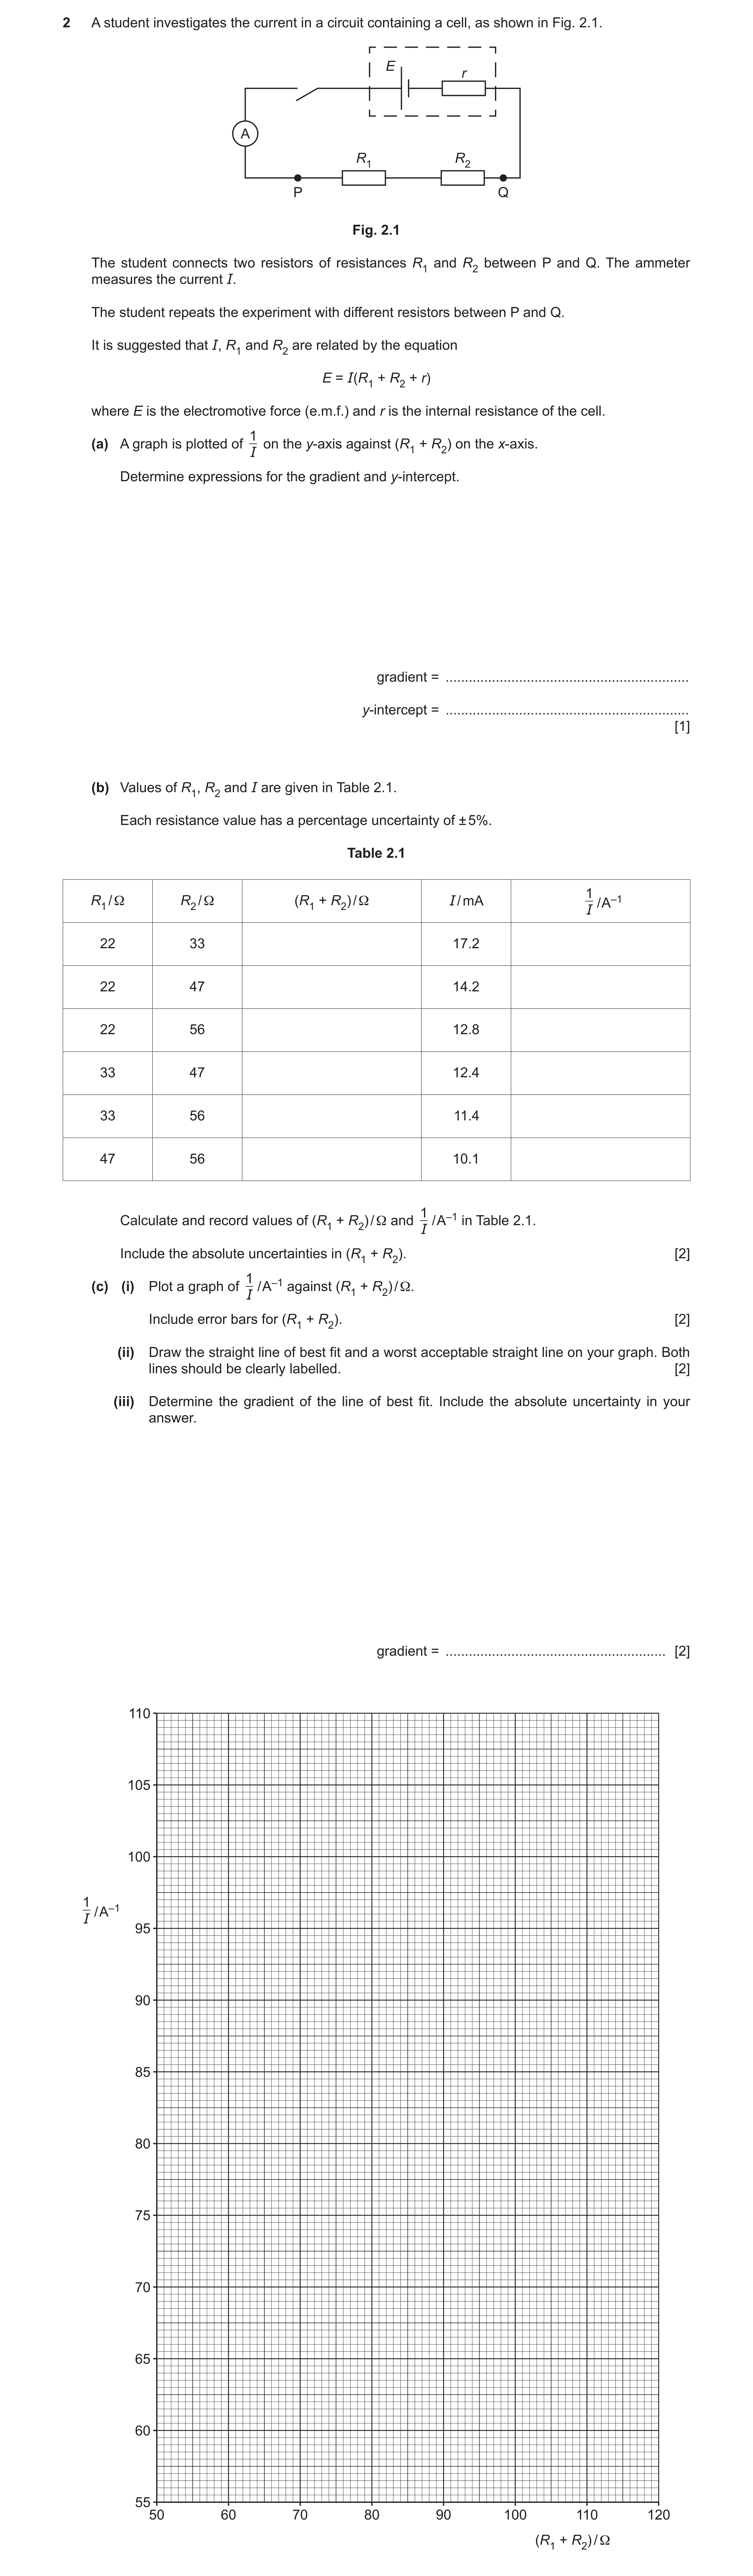
2 A student investigates the current in a circuit containing a cell, as shown in Fig. 2.1. E r A R1 R2 P Q Fig. 2.1 The student connects two resistors of resistances R1 and R2 between P and Q. The ammeter measures the current I. The student repeats the experiment with different resistors between P and Q. It is suggested that I, R1 and R2 are related by the equation E = I(R1 + R2 + r) where E is the electromotive force (e.m.f.) and r is the internal resistance of the cell. 1 (a) A graph is plotted of on the y‑axis against (R1 + R2) on the x‑axis. I Determine expressions for the gradient and y‑intercept. gradient = … y‑intercept = … [1] (b) Values of R1, R2 and I are given in Table 2.1. Each resistance value has a percentage uncertainty of ± 5%. Table 2.1 1R1 / Ω R2 / Ω (R1 + R2) / Ω I / mA / A–1 I 22 33 17.2 22 47 14.2 22 56 12.8 33 47 12.4 33 56 11.4 47 56 10.1 1 Calculate and record values of (R1 + R2) / Ω and / A–1 in Table 2.1. I Include the absolute uncertainties in (R1 + R2). [2] 1(c) (i) Plot a graph of / A–1 against (R1 + R2) / Ω. I Include error bars for (R1 + R2). [2] (ii) Draw the straight line of best fit and a worst acceptable straight line on your graph. Both lines should be clearly labelled. [2] (iii) Determine the gradient of the line of best fit. Include the absolute uncertainty in your answer. gradient = … [2]
9 marks
Mark scheme: 2(a) gradient = 1 E y-intercept = r E 1 2(b) (R1 + R2) / Ω 1 I / A–1 55 58.1 or 58.14 69 70.4 or 70.42 78 78.1 or 78.13 80 80.6 or 80.65 89 87.7 or 87.72 103 99.0 or 99.01 Values of (R1 + R2) and 1 I as shown above. 1 Absolute uncertainties in (R1 + R2) from ± (2.75 or 2.8 or 3) to ± (5.15 or 5.2 or 5). 1 2(c)(i) Six points plotted correctly. Must be accurate to the nearest half a small square. Diameter of points must be less than half a small square. 1 Error bars in (R1 + R2) plotted correctly. All error bars must be plotted. Total length of bar must be accurate to less than half a small square and symmetrical. 1 Question Answer Marks 2(c)(ii) Line of best fit drawn covers all points. Points must be balanced. Do not allow line from top point to bottom point. Line must pass between (61.0, 65.0) and (63.5, 65.0) and between (96.5, 95.0) and (98.5, 95.0). 1 Worst acceptable line drawn (steepest or shallowest possible line that passes through all error bars). All error bars must be plotted. 1 2(c)(iii) Gradient determined with clear substitution of data points into Δy / Δx. Distance between data points must be at least half the length of the drawn line. 1 Gradient of worst acceptable line determined. uncertainty = (gradient of line of best fit – gradient of worst acceptable line) or uncertainty = ½ (steepest worst line gradient – shallowest worst line gradient) 1 2(c)(iv) y-intercept determined by substitution of correct point into y = mx + c. 1 y-intercept of worst acceptable line determined by substitution into y = mx + c. uncertainty = (y-intercept of line of best fit – y-intercept of worst acceptable line) or uncertainty = ½ (steepest worst line y-intercept – shallowest worst line y-intercept) Do not allow ECF from false origin method. 1 2(d)(i) E determined using gradient and E and r given to two or three significant figures. 1 gradient E = 1 r determined using y-intercept with correct substitution and units with correct power of ten for E and r. r = y-intercept / gradient or r = E × y-intercept 1 Question Answer Marks 2(d)(ii) Absolute uncertainty in E determined with method shown e.g. gradient gradient E E Δ Δ = × or correct substitution for max/min methods e.g. 1 min gradient E E Δ = − 1 max gradient E E Δ = − 1 2(e) Value of R2 determined from (d)(i) or (c)(iii) and (c)(iv), with correct substitution and correct power of ten. ( ) 2 22 0.0075 E R r = − + or ( ) 2 1 22 0.0075 gradient R r = − + × 1
This question in 9702/52 May/June 2021
Q7 · A student investigates the current in a coil and a resistor connected in series, as shown… 9702/53 May/June 2021
1 A student investigates the current in a coil and a resistor connected in series, as shown in Fig. 1.1. coil R Fig. 1.1 The student connects a high-voltage d.c. power supply and a switch across the series combination. When the switch is closed, it takes time t for the current in the resistor of resistance R to reach a maximum value. The time t is a few milliseconds. There are a number of different unmarked resistors available. It is suggested that the relationship between t and R is KN2A t = LR where N is the number of turns of wire on the coil, A is the cross-sectional area of the coil, L is the length of the coil and K is a constant. Design a laboratory experiment to test the relationship between t and R. Explain how your results could be used to determine a value for K. You should draw a diagram, on page 3, showing the arrangement of your equipment. In your account you should pay particular attention to: ● the procedure to be followed ● the measurements to be taken ● the control of variables ● the analysis of the data ● any safety precautions to be taken. Diagram … … … … … … … … … … … … … … … … … … … … … … … … … … … … … … … … … … … … … … … … … … … [15]
15 marks
Mark scheme: 1 Defining the problem R is the independent variable and t is the dependent variable or vary R and measure t 1 keep the number of turns on the coil/N constant 1 Methods of data collection labelled diagram or correct symbols including: • labelled (d.c.) power supply • switch in series with power supply, resistor and coil • complete workable circuit 1 circuit diagram to measure R, e.g. ammeter and voltmeter correctly positioned or R connected to ohmmeter with no other connections (not ohmmeter in main circuit) 1 method to determine t (of a few milliseconds) e.g. use (storage) oscilloscope or current/voltage sensor connected to datalogger/computer 1 method to determine A, e.g. micrometer/calipers to determine diameter of coil and A = πd2 / 4 1 Method of analysis plot a graph of t against 1 / R (allow log t against log R) 1 relationship valid if a straight line passing through the origin is produced (allow gradient = –1 for graph of log t against log R) 1 2 gradient . L K AN × = 1 Question Answer Marks 1 Additional detail including safety considerations 6 D1 open switch/switch off (high voltage) circuit before changing the resistor/touching components or ensure no bare wires/use shrouded connectors D2 wear (insulating) gloves to prevent electric shock/electrocution D3 keep A and L constant D4 use ruler/calipers to measure L D5 repeat measurements of diameter in different directions/at points along the coil and average D6 method to determine R e.g. R = V / I linked to correct circuit diagram for ammeter/voltmeter method or measure resistance using ohmmeter D7 repeat experiment for each value of R and average t D8 method to determine t: use of time-base from oscilloscope explained or use of time axis of output from data logger/computer explained D9 use smaller values of R to increase I D10 reduce L or increase N or increase A to increase t
This question in 9702/53 May/June 2021
Q8 · A student investigates a circuit containing a capacitor and a resistor as shown in Fig 9702/52 Feb/March 2022
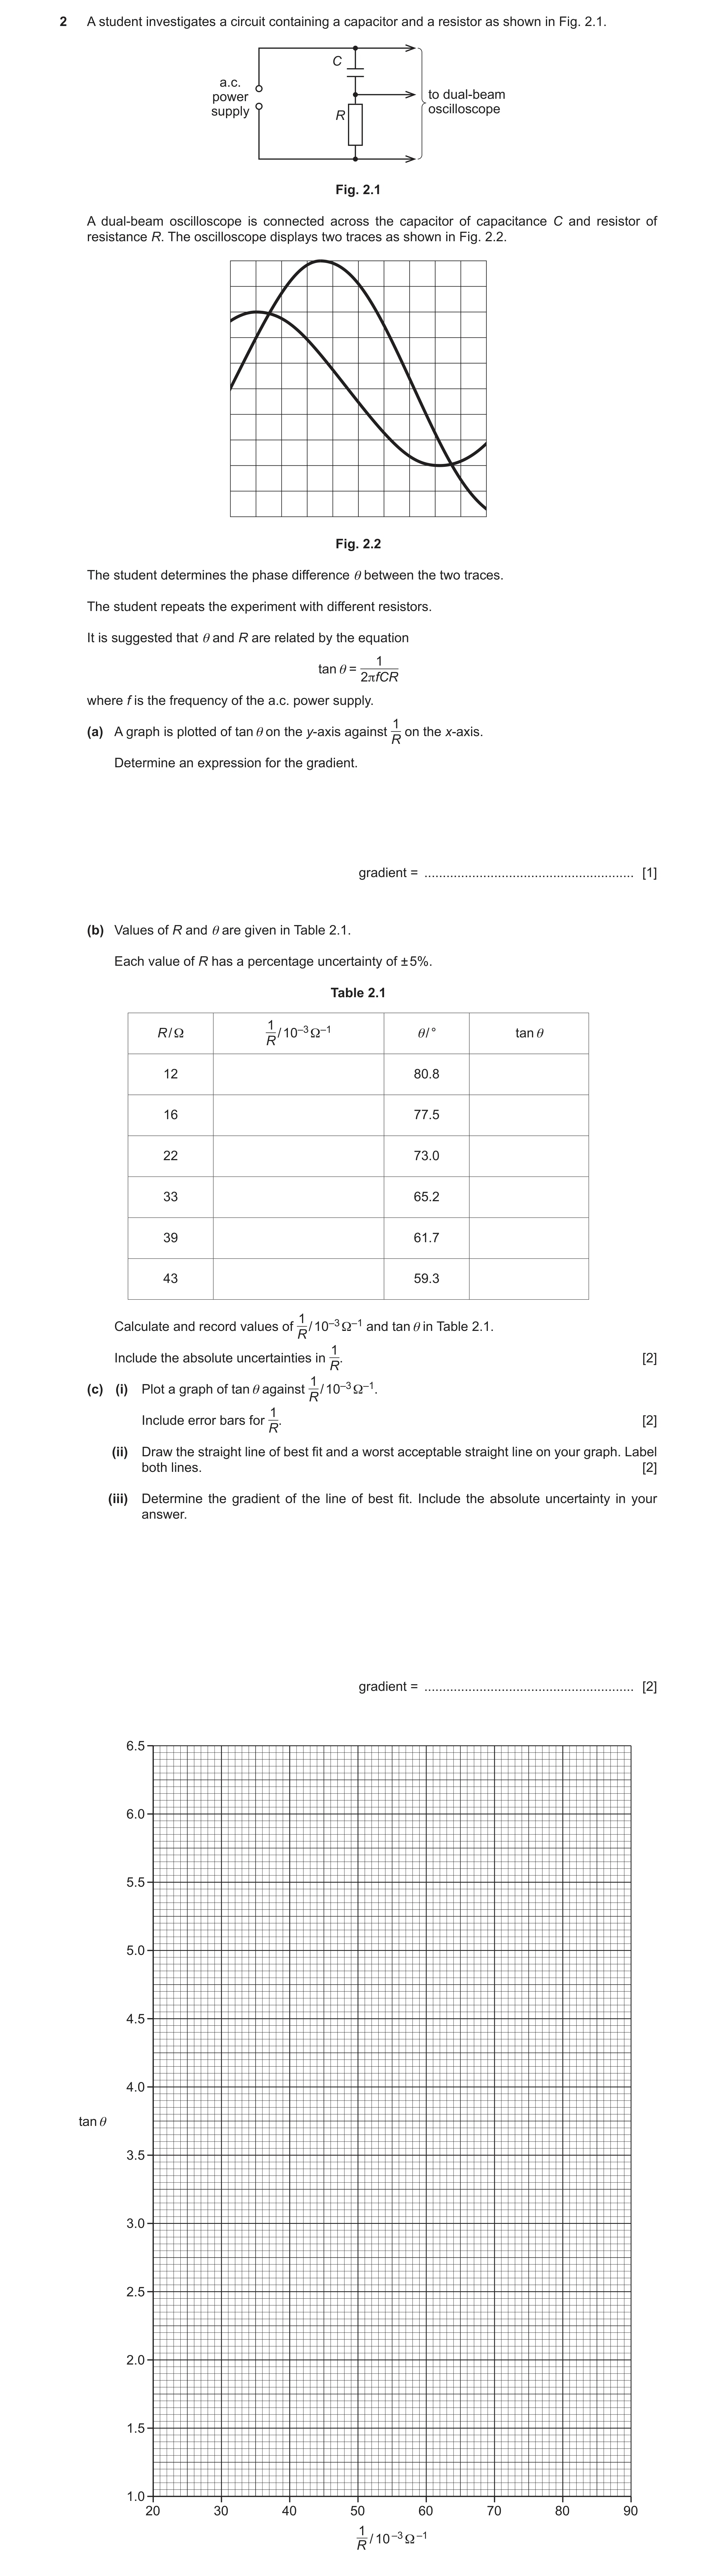
2 A student investigates a circuit containing a capacitor and a resistor as shown in Fig. 2.1. C a.c. power to dual-beam supply oscilloscope R Fig. 2.1 A dual‑beam oscilloscope is connected across the capacitor of capacitance C and resistor of resistance R. The oscilloscope displays two traces as shown in Fig. 2.2. Fig. 2.2 The student determines the phase difference θ between the two traces. The student repeats the experiment with different resistors. It is suggested that θ and R are related by the equation 1 tan θ = 2πfCR where f is the frequency of the a.c. power supply. 1 (a) A graph is plotted of tan θ on the y‑axis against on the x‑axis. R Determine an expression for the gradient. gradient = … [1] (b) Values of R and θ are given in Table 2.1. Each value of R has a percentage uncertainty of ± 5%. Table 2.1 1 R / Ω / 10–3 Ω–1 θ/ ° tan θ R 12 80.8 16 77.5 22 73.0 33 65.2 39 61.7 43 59.3 1 Calculate and record values of / 10–3 Ω–1 and tan θ in Table 2.1. R 1 Include the absolute uncertainties in R. [2] 1(c) (i) Plot a graph of tan θ against / 10–3 Ω–1. R 1 Include error bars for R. [2] (ii) Draw the straight line of best fit and a worst acceptable straight line on your graph. Label both lines. [2] (iii) Determine the gradient of the line of best fit. Include the absolute uncertainty in your answer. gradient = … [2]
9 marks
Mark scheme: 2(a) Gradient = 1 2 fC π 1 2(b) 1 R / 10–3 Ω–1 tan θ 83 or 83.3 6.17 or 6.174 63 or 62.5 4.51 or 4.511 45 or 45.5 3.27 or 3.271 30 or 30.3 2.16 or 2.164 26 or 25.6 1.86 or 1.857 23 or 23.3 1.68 or 1.684 1 Absolute uncertainties in 1 R from ± 4 to ± 1 1 Question Answer Marks 2(c)(i) Six points from (b) plotted correctly. Must be within half a small square. Diameter of points must be less than half a small square. 1 Error bars in 1 R plotted correctly. All error bars to be plotted. Total length of bar must be accurate to less than half a small square and symmetrical. 1 2(c)(ii) Straight line of best fit drawn. Points must be balanced. Do not accept line from top plot to bottom plot. Line must pass between (33.5, 2.5) and (35.0, 2.5) and (74.0, 5.5) and (76.0, 5.5) 1 Worst acceptable line drawn. Steepest or shallowest possible line that passes through all the error bars. All error bars must be plotted. 1 2(c)(iii) Gradient determined with clear substitution of data points into Δy/Δx; distance between data points must be greater than half the length of the drawn line. 1 Gradient determined of WAL with clear substitution of data points into Δy/Δx; uncertainty = (gradient of line of best fit – gradient of worst acceptable line) or uncertainty = ½ (steepest worst line gradient – shallowest worst line gradient) 1 2(d) 99 ± 2 (Hz) 1 2(e)(i) C determined using gradient and C given to two or three significant figures. 1 1 2 gradient 2 C f = = π × π× × (d) (c)(iii) 1 C determined using gradient with correct SI unit and power of ten for C: F or s Ω–1 1 Question Answer Marks 2(e)(ii) Percentage uncertainty in C determined with method shown. gradient %uncertainty 100 gradient f f Δ Δ = + × OR Correct substitution for max/min methods 1 max 2 min mingradient C f = π × × 1 min 2 max maxgradient C f = π× × 1 2(f) R determined to at least two significant figures with appropriate power of ten from (c)(iii) OR (d) and (e)(i) with correct substitution seen. gradient tan 0.839 R θ = = (c)(iii) OR 1 1 2 tan 2 0.839 R fC θ = = π π× × × (d) (e)(i) 1 Absolute uncertainty in R determined. Method must be consistent with determination of R and correct substitution must be seen. For R determined by using the gradient: gradient gradient R R Δ Δ = × OR For R determined by using (d) and (e)(i): f C R R f C Δ Δ Δ = + × OR ΔR determined by max / min methods. 1
This question in 9702/52 Feb/March 2022
Q9 · A student investigates an electrical circuit 9702/51 May/June 2025
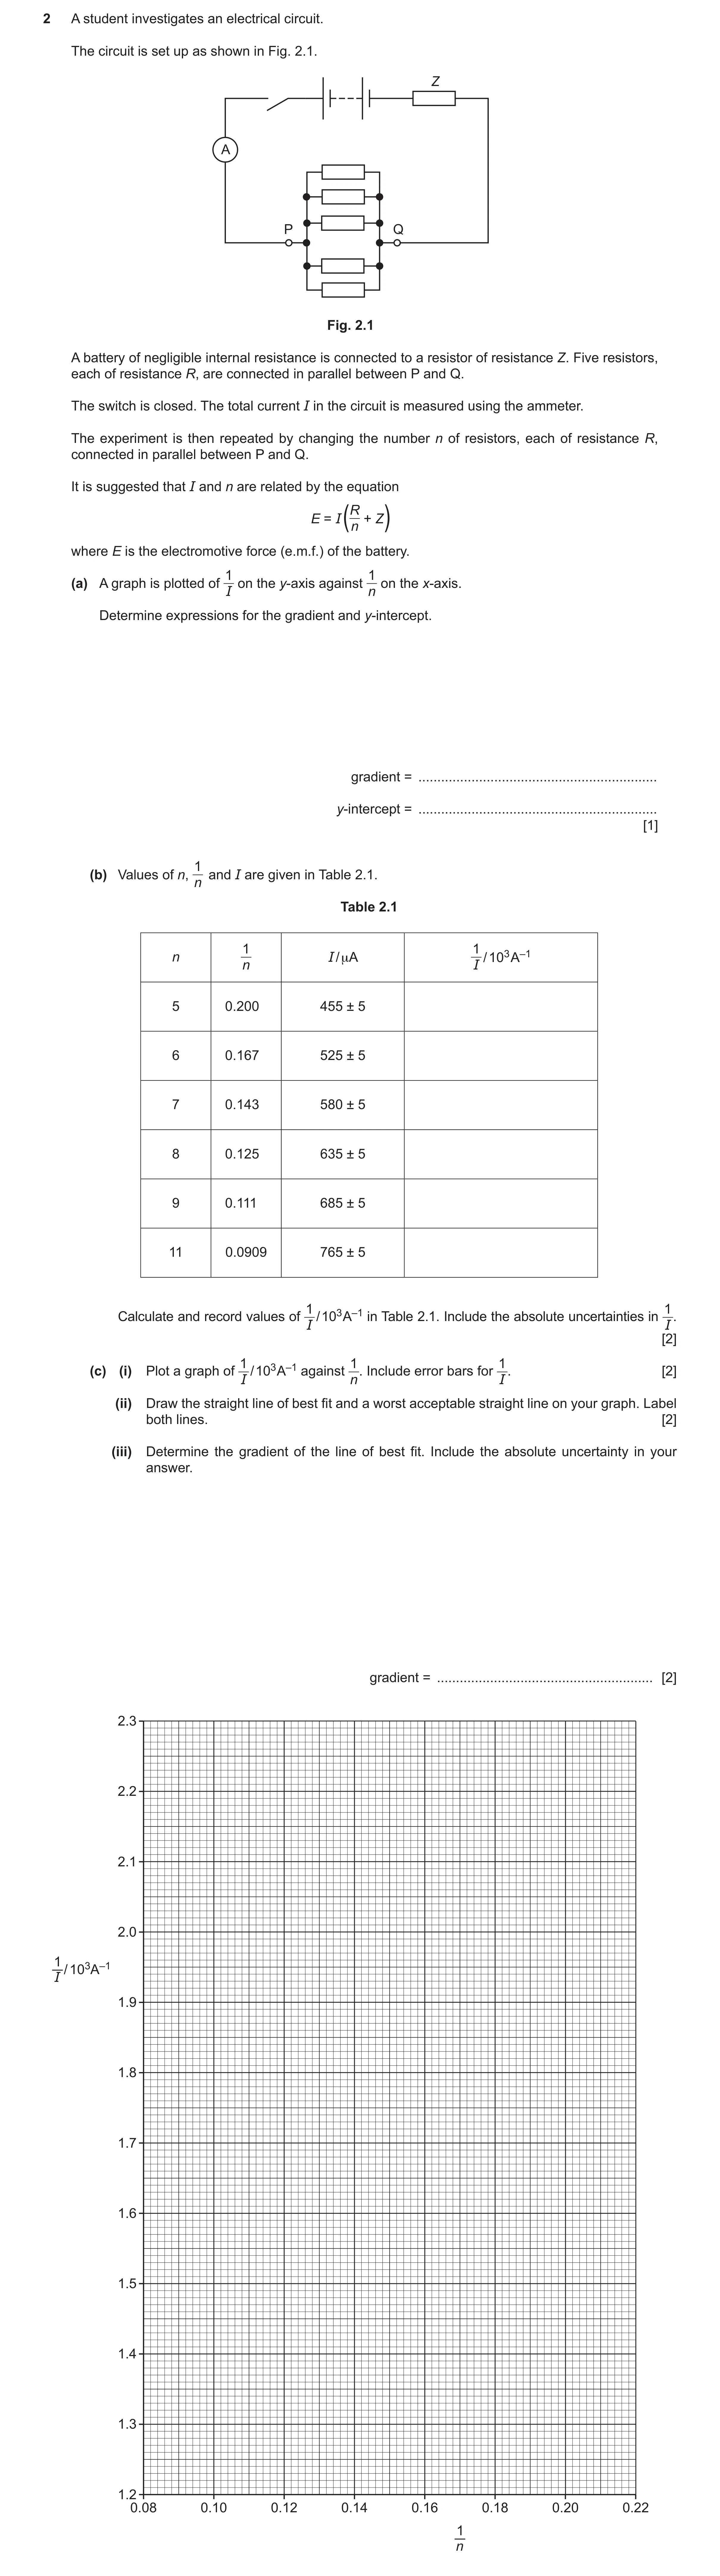
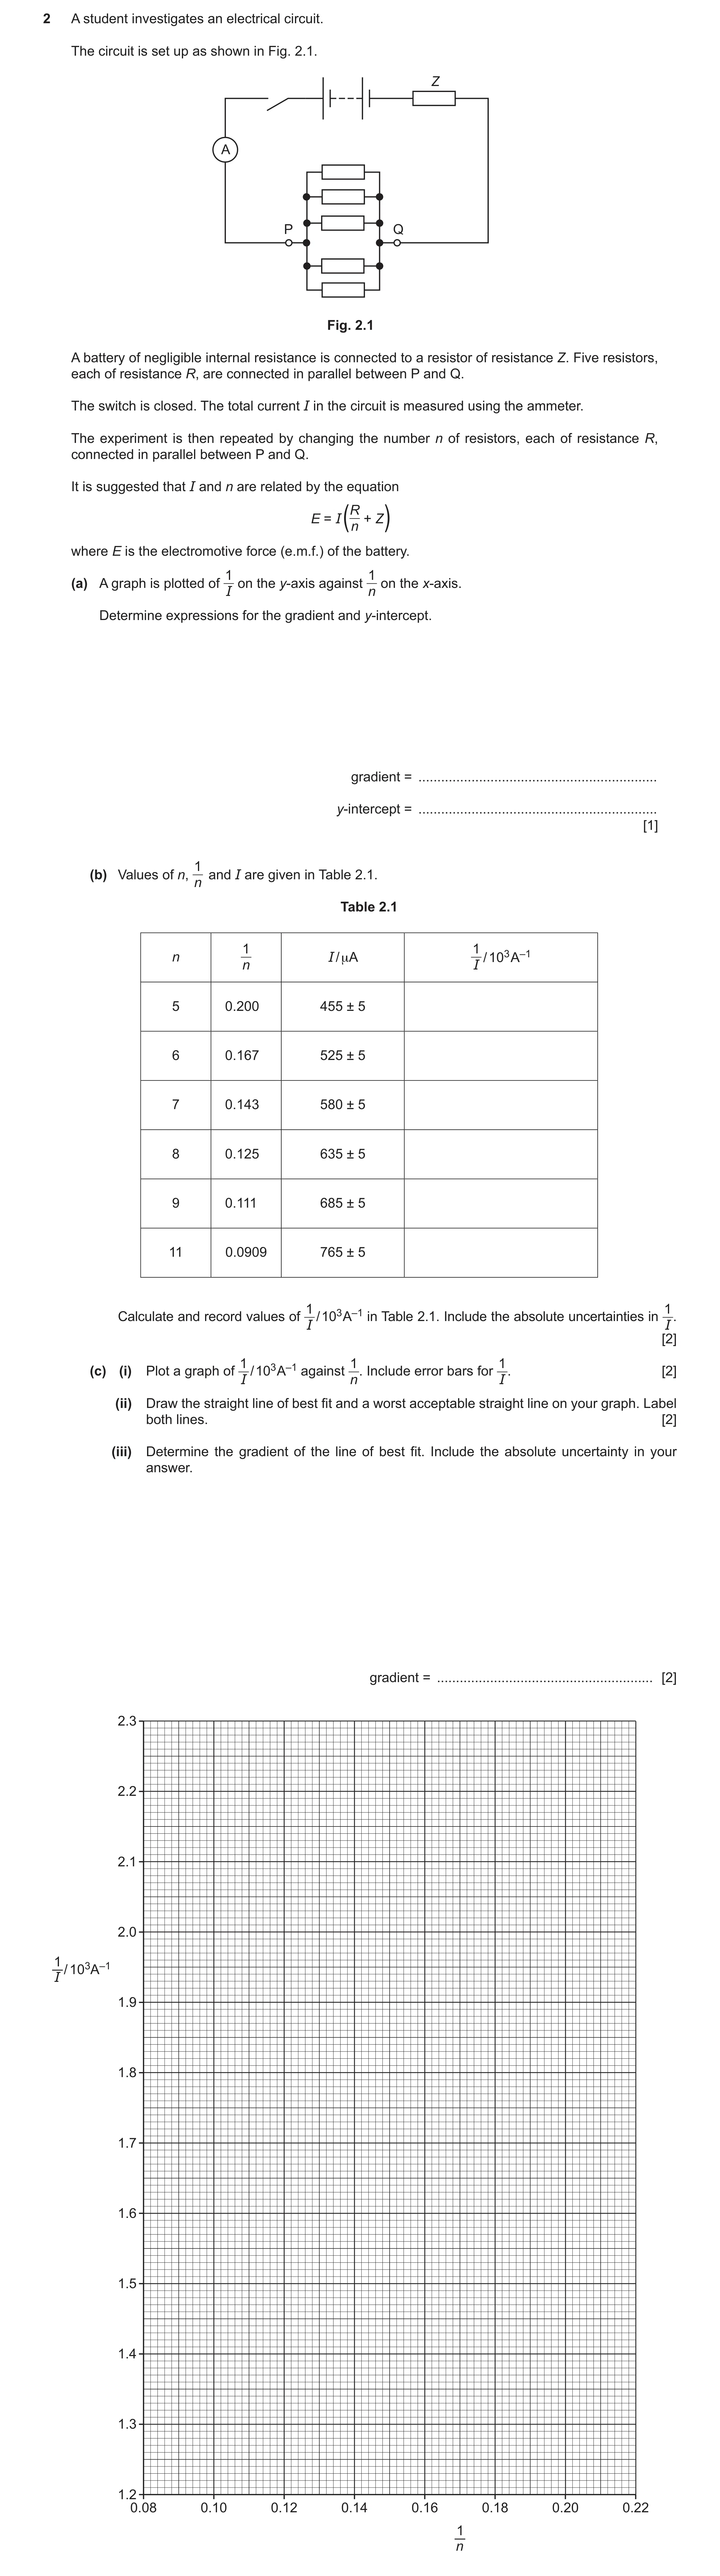
2 A student investigates an electrical circuit. The circuit is set up as shown in Fig. 2.1. Z A P Q Fig. 2.1 A battery of negligible internal resistance is connected to a resistor of resistance Z. Five resistors, each of resistance R, are connected in parallel between P and Q. The switch is closed. The total current I in the circuit is measured using the ammeter. The experiment is then repeated by changing the number n of resistors, each of resistance R, connected in parallel between P and Q. It is suggested that I and n are related by the equation R E = I + ( n Z) where E is the electromotive force (e.m.f.) of the battery. 1 1 (a) A graph is plotted of on the y-axis against on the x-axis. I n Determine expressions for the gradient and y-intercept. gradient = … y-intercept = … [1] 1 (b) Values of n, and I are given in Table 2.1. n Table 2.1 1 1 n I / μA / 103 A–1 n I 5 0.200 455 ± 5 6 0.167 525 ± 5 7 0.143 580 ± 5 8 0.125 635 ± 5 9 0.111 685 ± 5 11 0.0909 765 ± 5 1 1 Calculate and record values of / 103 A–1 in Table 2.1. Include the absolute uncertainties in . I I [2] 1 1 1(c) (i) Plot a graph of / 103 A–1 against Include error bars for . [2] I n. I (ii) Draw the straight line of best fit and a worst acceptable straight line on your graph. Label both lines. [2] (iii) Determine the gradient of the line of best fit. Include the absolute uncertainty in your answer. gradient = … [2]
9 marks
Mark scheme: 2(a) R 1 gradient = E Z y-intercept = E 2(b) 1 1 / 103 A–1 I 2.20 or 2.198 1.90 or 1.905 1.72 or 1.724 1.57 or 1.575 1.46 or 1.460 1.31 or 1.307 1 Values of / 103 A–1 correct as shown above. I 2(b) 1 1 Uncertainties in / 103 A–1 from 0.02 or 0.03 decreasing to 0.01. I 2(c)(i) Six points from (b) plotted correctly. 1 Must be within half a small square. Diameter of points must be less than half a small square. 1 1 Error bars in plotted correctly. I All error bars to be plotted. Total length of bar must be accurate to less than half a small square and symmetrical. 2(c)(ii) Straight line of best fit drawn. 1 Thickness of the line must be less than half a small square. Do not accept line from top point to bottom point. Line must pass between (0.101, 1.40) and (0.104, 1.40) and between (0.189, 2.10) and (0.194, 2.10) Worst acceptable straight line drawn (steepest or shallowest possible line that passes through all the error bars). 1 Thickness of the line must be less than half a small square. All error bars must be plotted. 2(c)(iii) Gradient determined with clear substitution of data points into y / x. 1 Distance between data points must be greater than half the length of the drawn line. Gradient determined of worst acceptable line with clear substitution of data points into y / x. 1 uncertainty = (gradient of line of best fit – gradient of worst acceptable line) or uncertainty = ½ (steepest worst line gradient – shallowest worst line gradient) 2(c)(iv) y-intercept determined by substitution of correct point with consistent power of ten in m and y into y = mx + c. 1 y-intercept of worst acceptable line determined by substitution into y = mx + c. 1 uncertainty = y-intercept of line of best fit – y-intercept of worst acceptable line or uncertainty = ½ (steepest worst line y-intercept – shallowest worst line y-intercept) Do not accept ECF from false origin method. 2(d)(i) R determined using gradient and R and Z given to 2 or 3 significant figures. 1 R = gradient 5.8 Z determined using y-intercept and R and Z given with units with appropriate powers of ten. 1 Z = y-intercept 5.8 unit of R: or V A–1 unit of Z: or V A–1 2(d)(ii) Percentage uncertainty determined using E = 0.2 (V) with method shown. 1 E gradient R % = + 100 E gradient or 0.2 gradient R % = + 100 5.8 gradient 2(e) I determined to a minimum of 2 significant figures from (c)(iii) and (c)(iv) or (d)(i) with correct substitution. 1 1 I = gradient +y -intercept 20 or E I = R +Z 20
This question in 9702/51 May/June 2025
Q10 · A student investigates an electrical circuit 9702/53 May/June 2025
2 A student investigates an electrical circuit. The circuit is set up as shown in Fig. 2.1. Z A P Q Fig. 2.1 A battery of negligible internal resistance is connected to a resistor of resistance Z. Five resistors, each of resistance R, are connected in parallel between P and Q. The switch is closed. The total current I in the circuit is measured using the ammeter. The experiment is then repeated by changing the number n of resistors, each of resistance R, connected in parallel between P and Q. It is suggested that I and n are related by the equation R E = I + ( n Z) where E is the electromotive force (e.m.f.) of the battery. 1 1 (a) A graph is plotted of on the y-axis against on the x-axis. I n Determine expressions for the gradient and y-intercept. gradient = … y-intercept = … [1] 1 (b) Values of n, and I are given in Table 2.1. n Table 2.1 1 1 n I / μA / 103 A–1 n I 5 0.200 455 ± 5 6 0.167 525 ± 5 7 0.143 580 ± 5 8 0.125 635 ± 5 9 0.111 685 ± 5 11 0.0909 765 ± 5 1 1 Calculate and record values of / 103 A–1 in Table 2.1. Include the absolute uncertainties in . I I [2] 1 1 1(c) (i) Plot a graph of / 103 A–1 against Include error bars for . [2] I n. I (ii) Draw the straight line of best fit and a worst acceptable straight line on your graph. Label both lines. [2] (iii) Determine the gradient of the line of best fit. Include the absolute uncertainty in your answer. gradient = … [2]
9 marks
Mark scheme: 2(a) R 1 gradient = E Z y-intercept = E 2(b) 1 1 / 103 A–1 I 2.20 or 2.198 1.90 or 1.905 1.72 or 1.724 1.57 or 1.575 1.46 or 1.460 1.31 or 1.307 1 Values of / 103 A–1 correct as shown above. I 2(b) 1 1 Uncertainties in / 103 A–1 from 0.02 or 0.03 decreasing to 0.01. I 2(c)(i) Six points from (b) plotted correctly. 1 Must be within half a small square. Diameter of points must be less than half a small square. 1 1 Error bars in plotted correctly. I All error bars to be plotted. Total length of bar must be accurate to less than half a small square and symmetrical. 2(c)(ii) Straight line of best fit drawn. 1 Thickness of the line must be less than half a small square. Do not accept line from top point to bottom point. Line must pass between (0.101, 1.40) and (0.104, 1.40) and between (0.189, 2.10) and (0.194, 2.10) Worst acceptable straight line drawn (steepest or shallowest possible line that passes through all the error bars). 1 Thickness of the line must be less than half a small square. All error bars must be plotted. 2(c)(iii) Gradient determined with clear substitution of data points into y / x. 1 Distance between data points must be greater than half the length of the drawn line. Gradient determined of worst acceptable line with clear substitution of data points into y / x. 1 uncertainty = (gradient of line of best fit – gradient of worst acceptable line) or uncertainty = ½ (steepest worst line gradient – shallowest worst line gradient) 2(c)(iv) y-intercept determined by substitution of correct point with consistent power of ten in m and y into y = mx + c. 1 y-intercept of worst acceptable line determined by substitution into y = mx + c. 1 uncertainty = y-intercept of line of best fit – y-intercept of worst acceptable line or uncertainty = ½ (steepest worst line y-intercept – shallowest worst line y-intercept) Do not accept ECF from false origin method. 2(d)(i) R determined using gradient and R and Z given to 2 or 3 significant figures. 1 R = gradient 5.8 Z determined using y-intercept and R and Z given with units with appropriate powers of ten. 1 Z = y-intercept 5.8 unit of R: or V A–1 unit of Z: or V A–1 2(d)(ii) Percentage uncertainty determined using E = 0.2 (V) with method shown. 1 E gradient R % = + 100 E gradient or 0.2 gradient R % = + 100 5.8 gradient 2(e) I determined to a minimum of 2 significant figures from (c)(iii) and (c)(iv) or (d)(i) with correct substitution. 1 1 I = gradient +y -intercept 20 or E I = R +Z 20
This question in 9702/53 May/June 2025
 15
15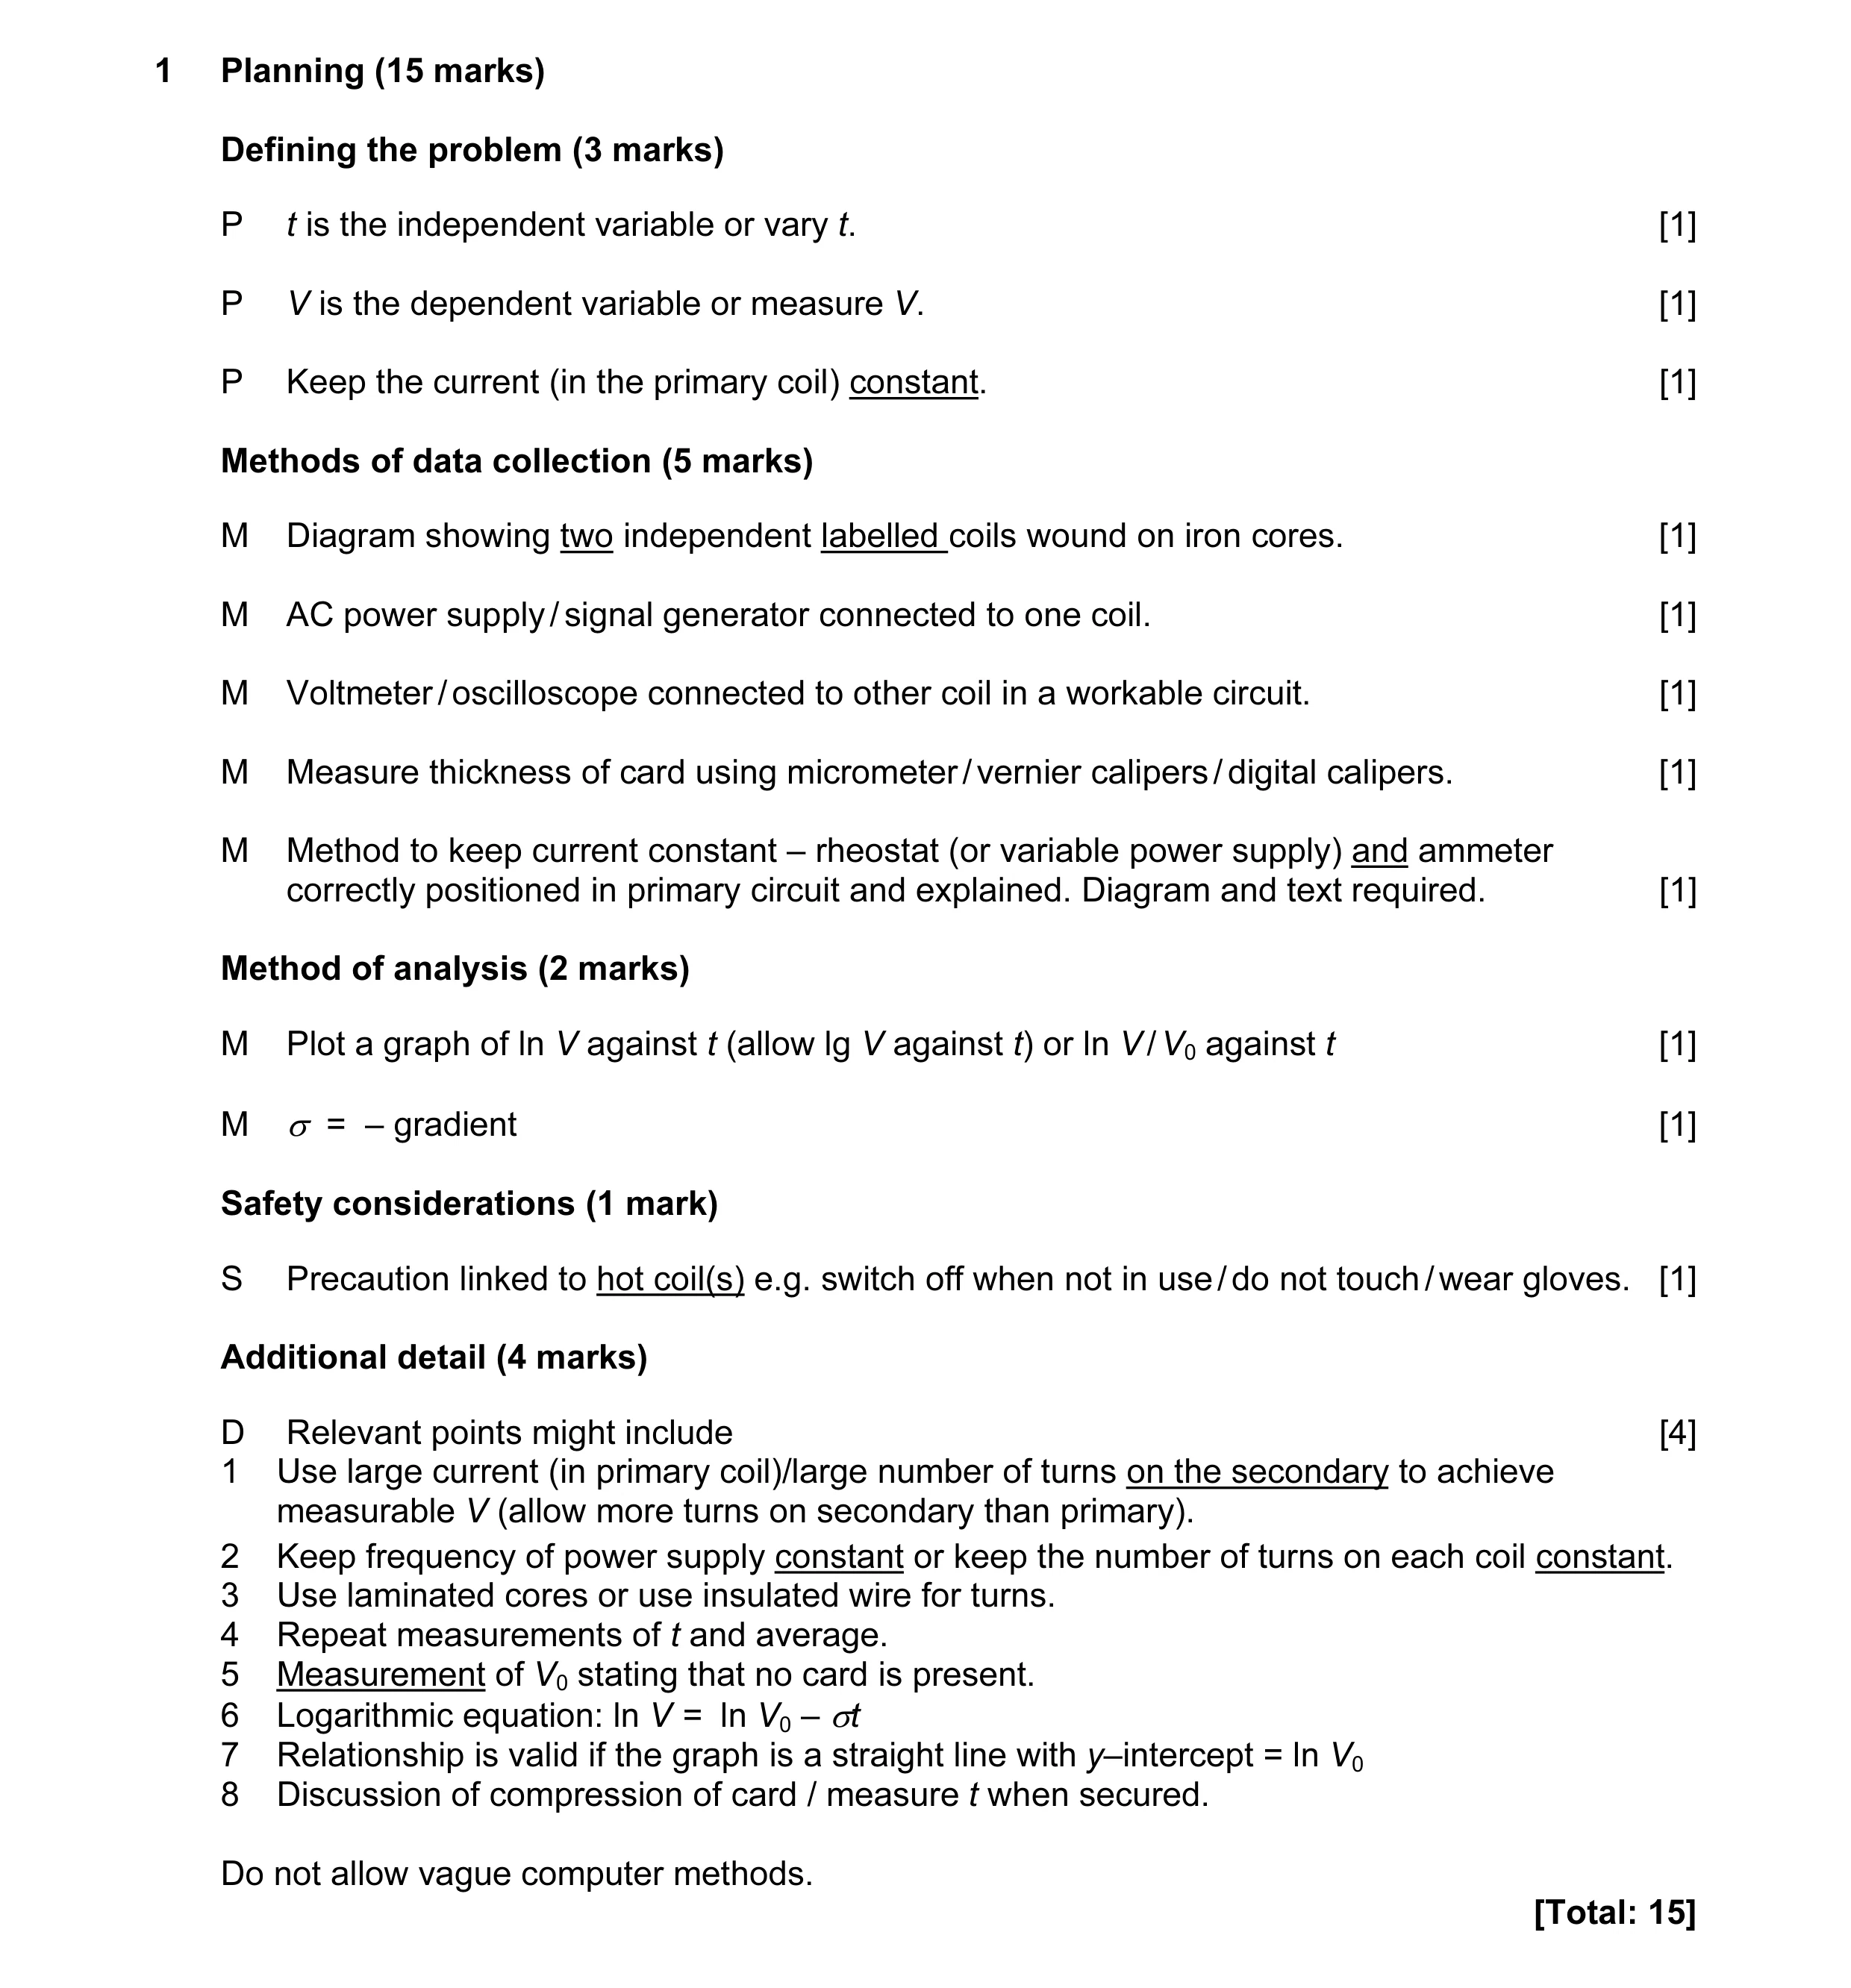 15
15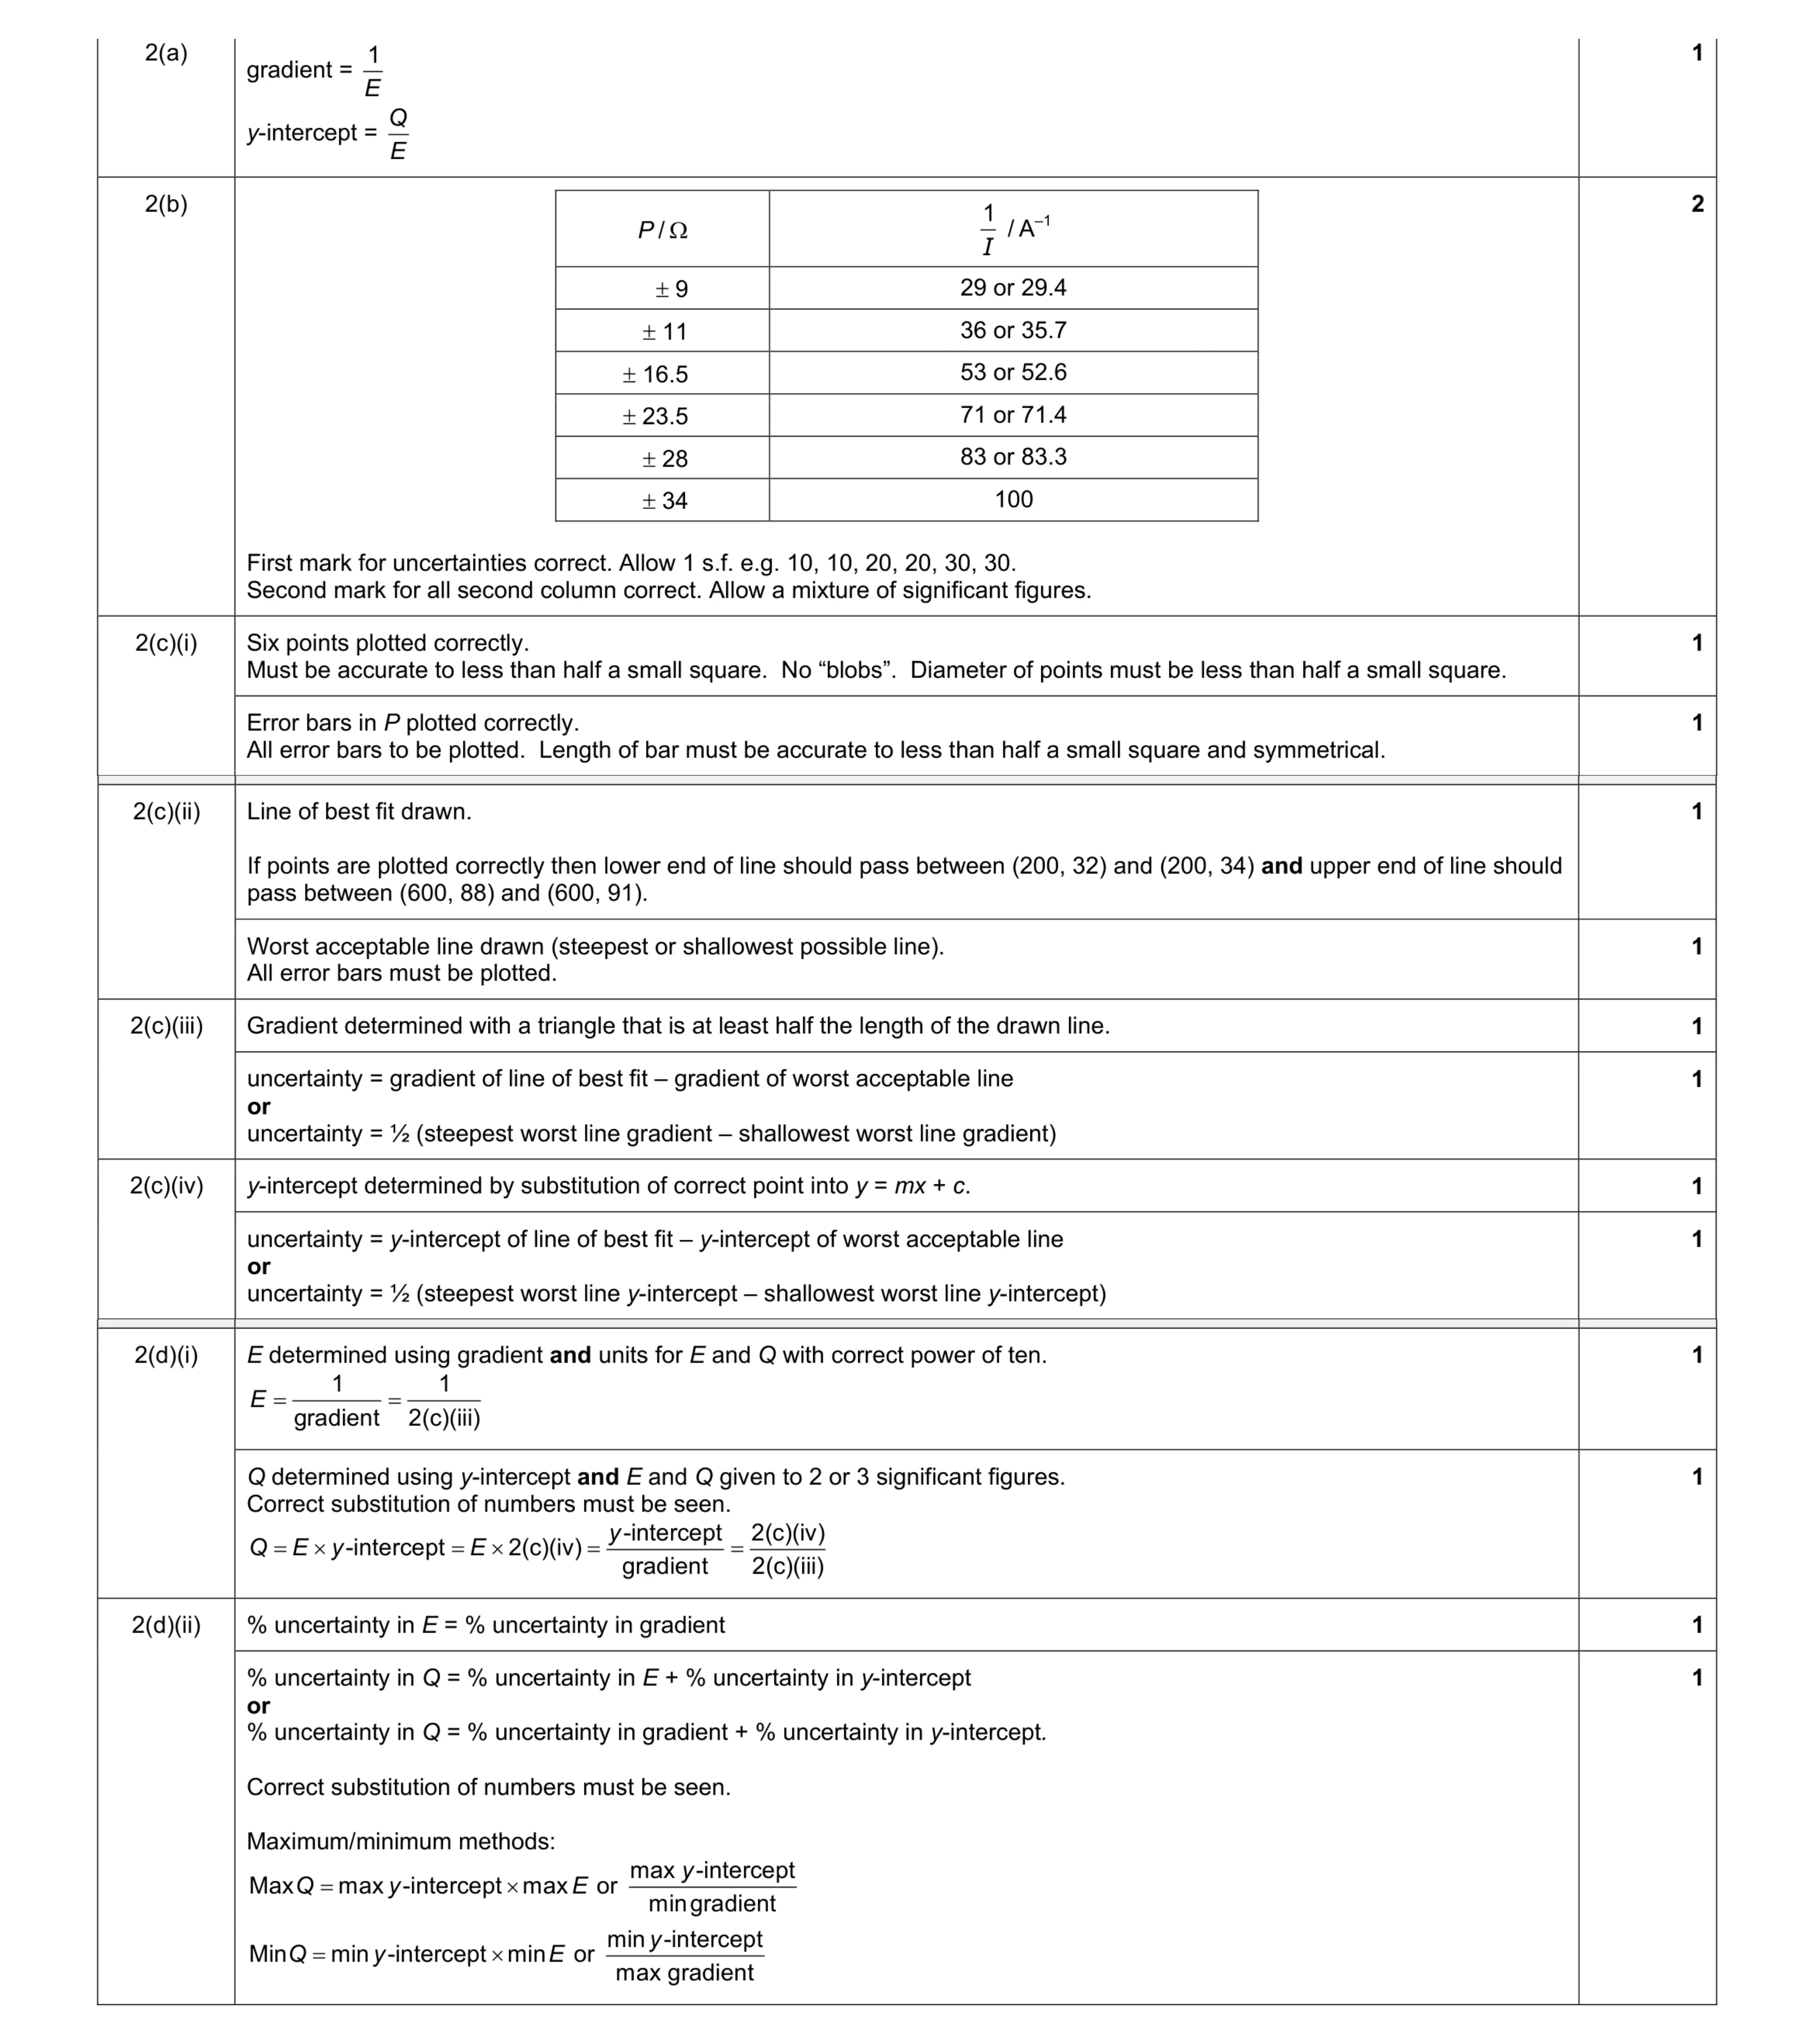 9
9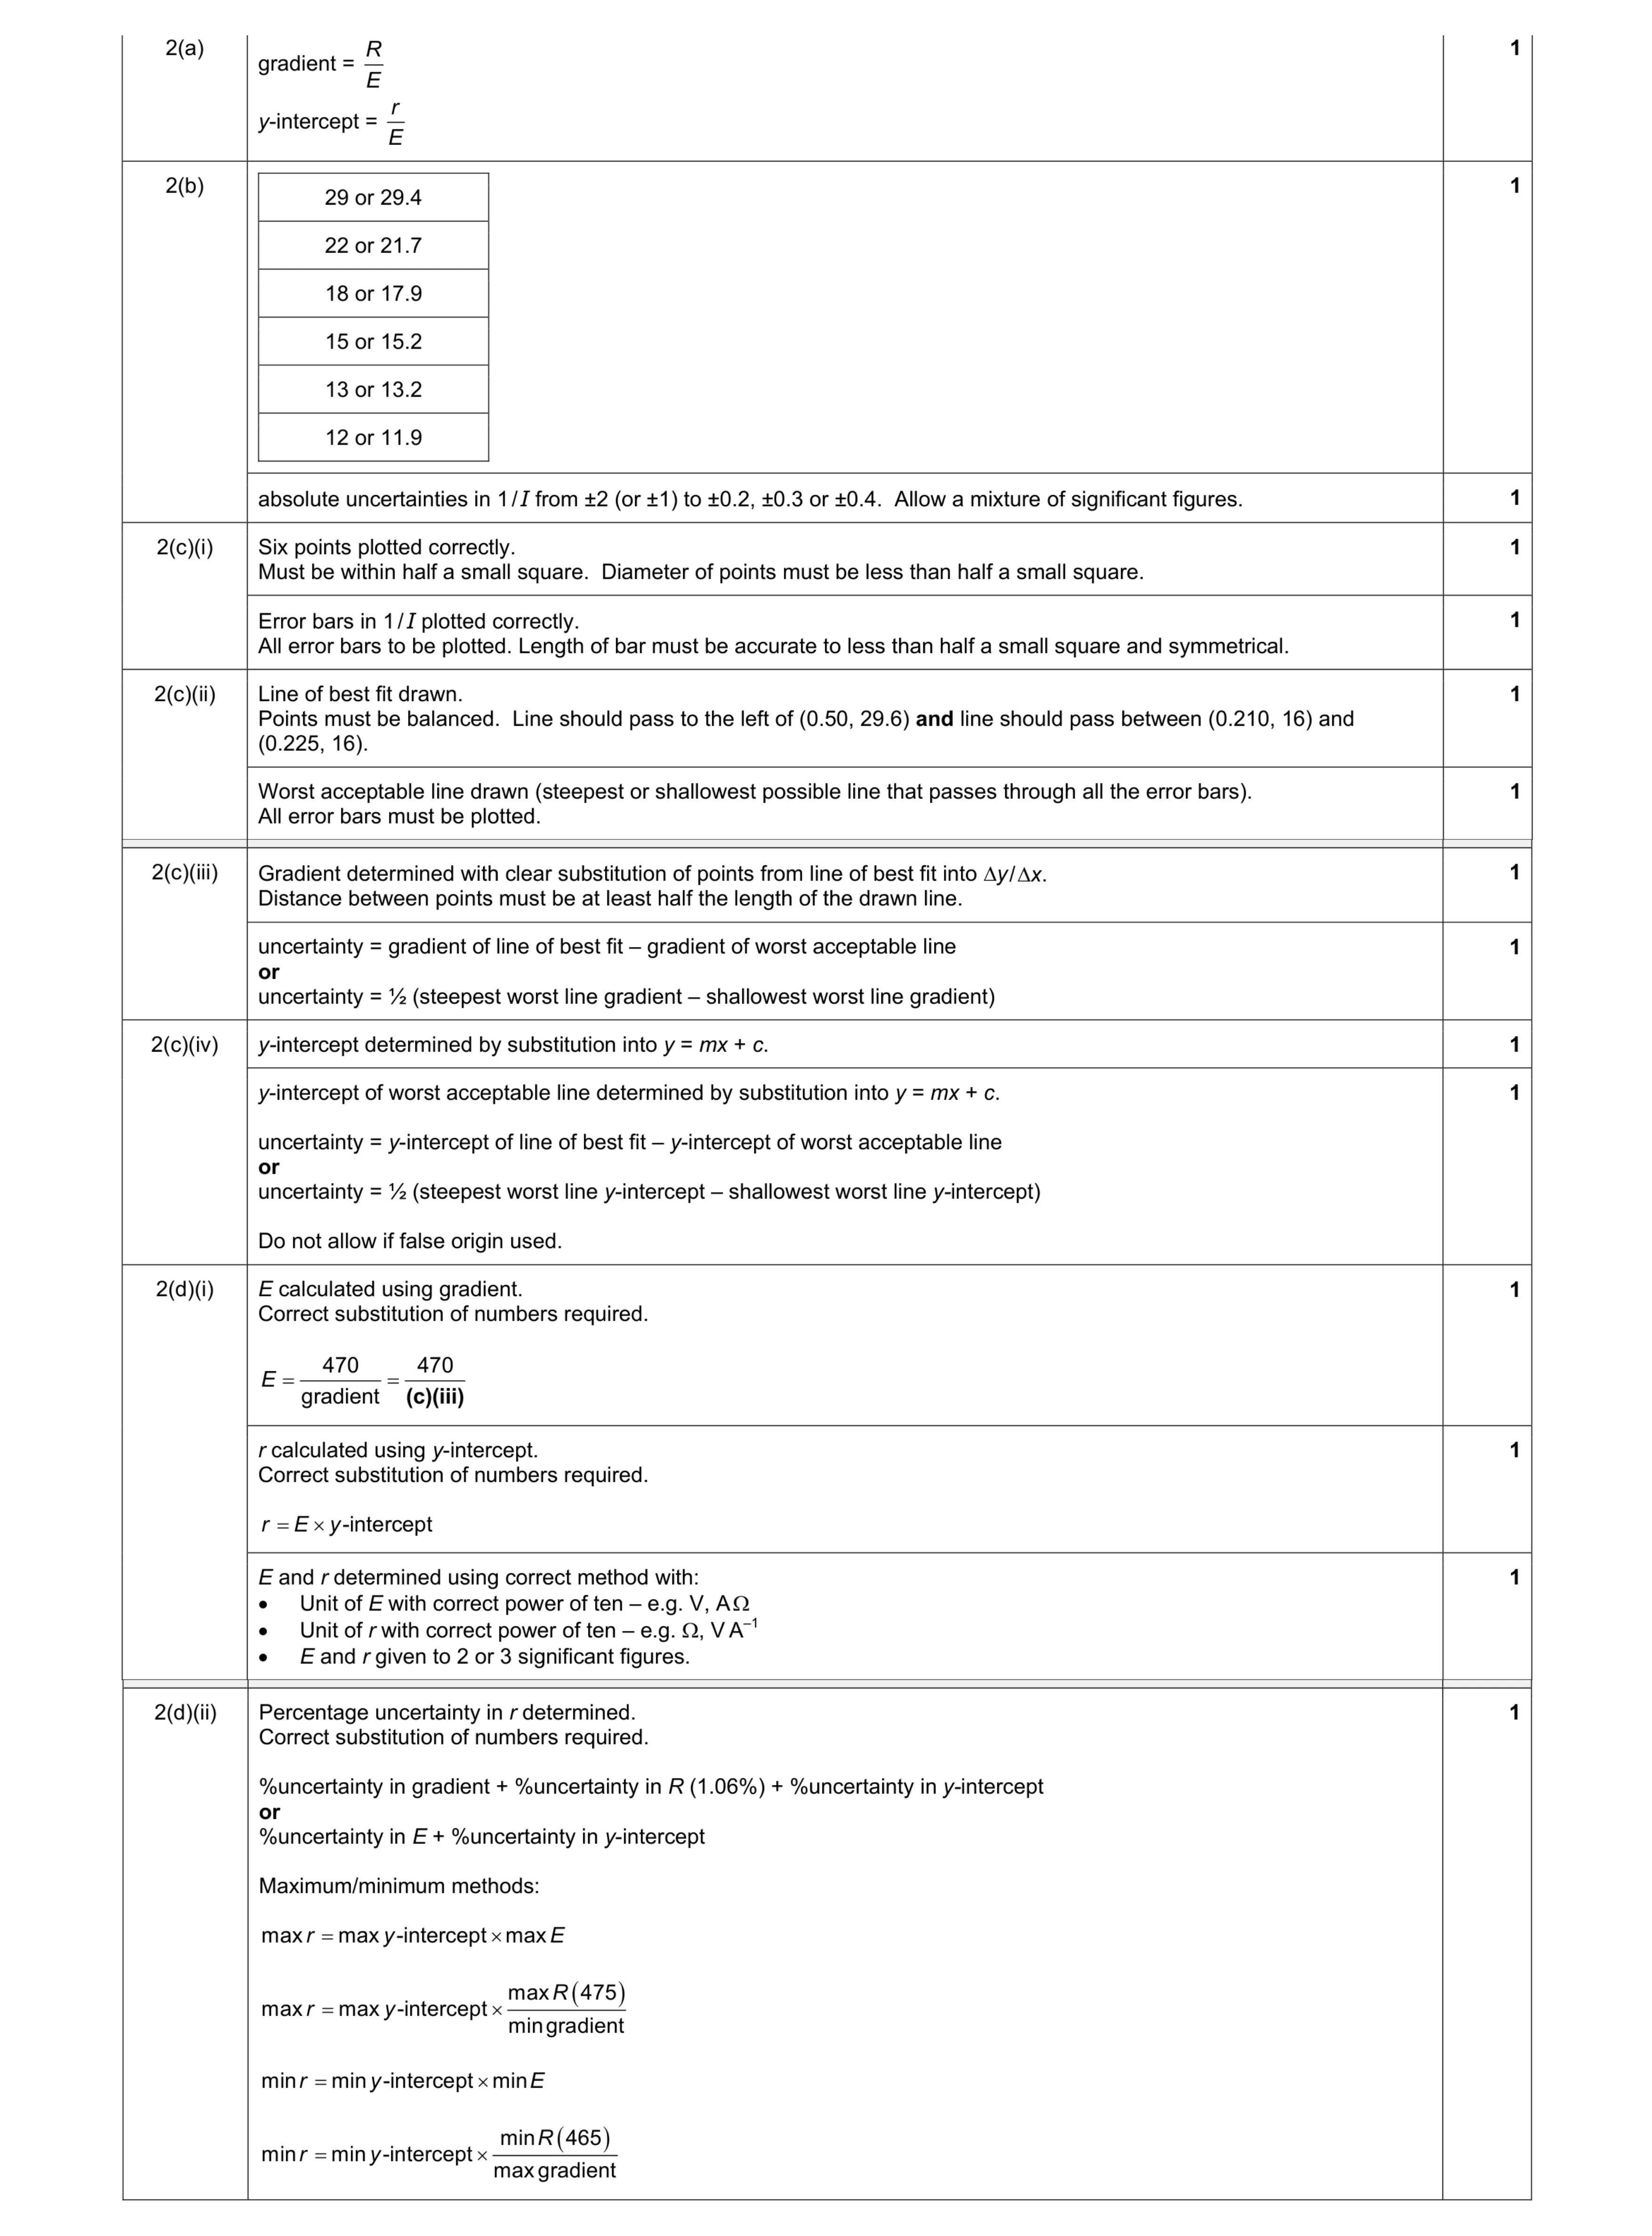 9
9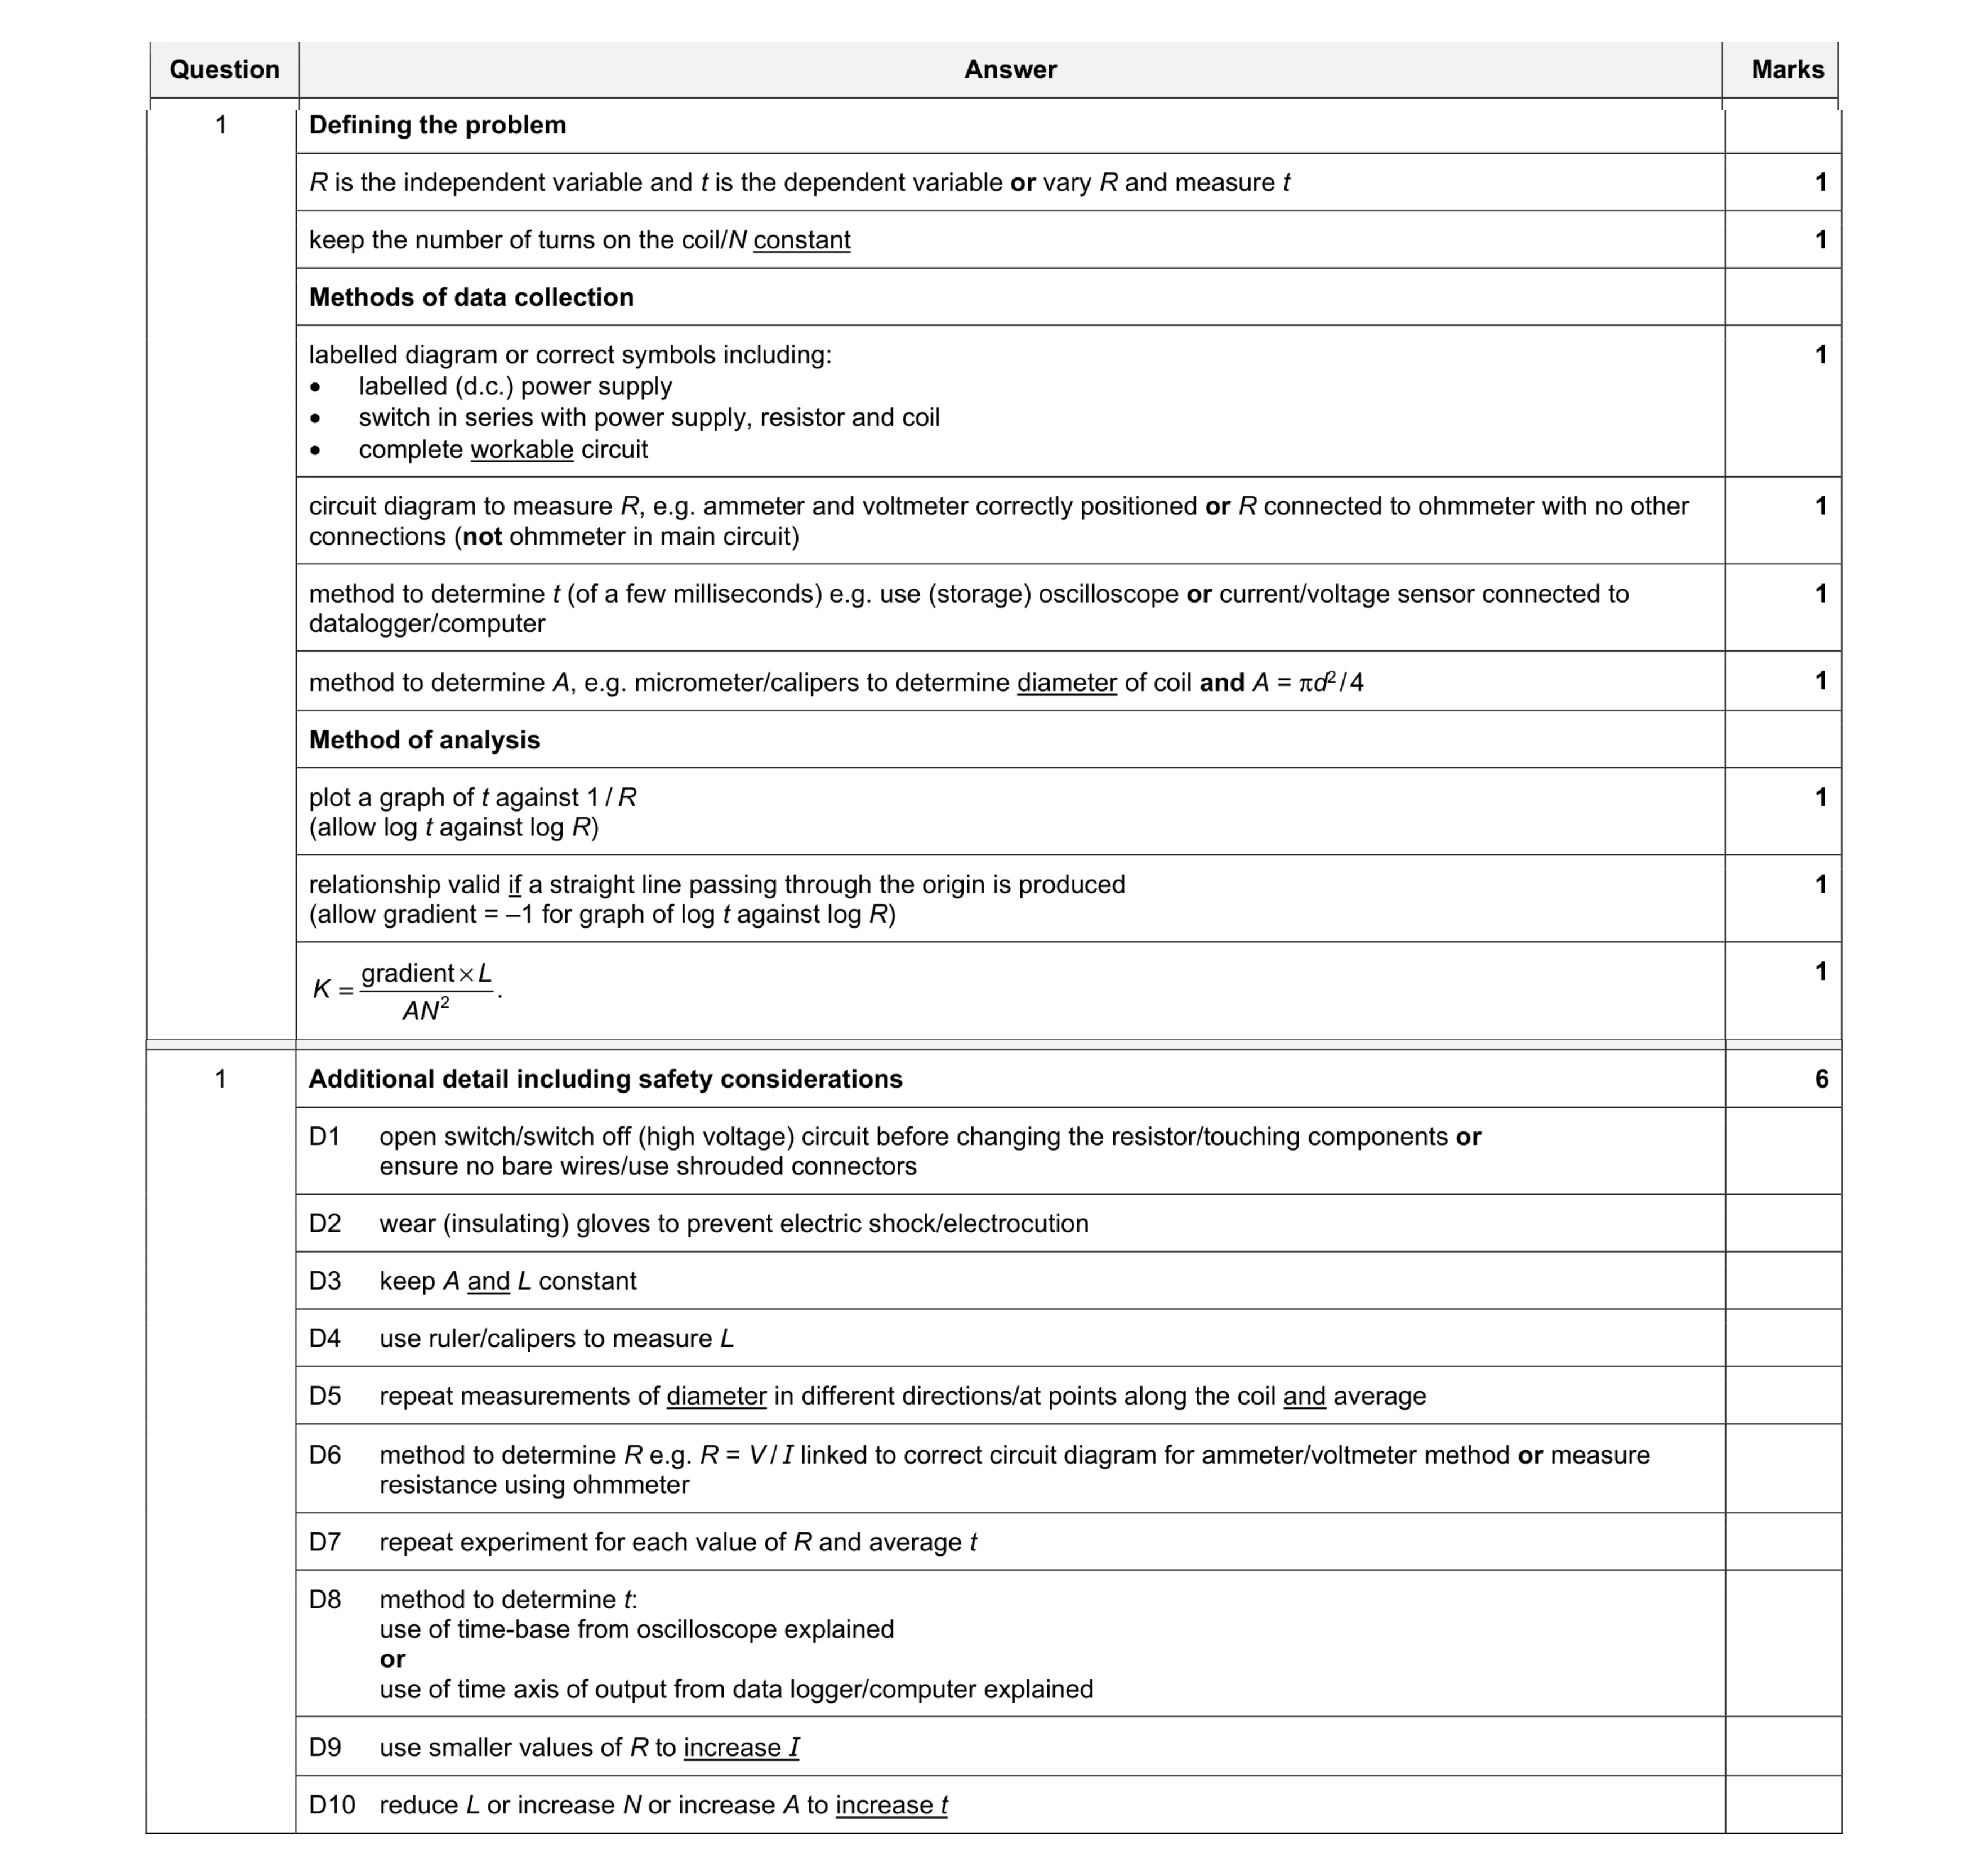 15
15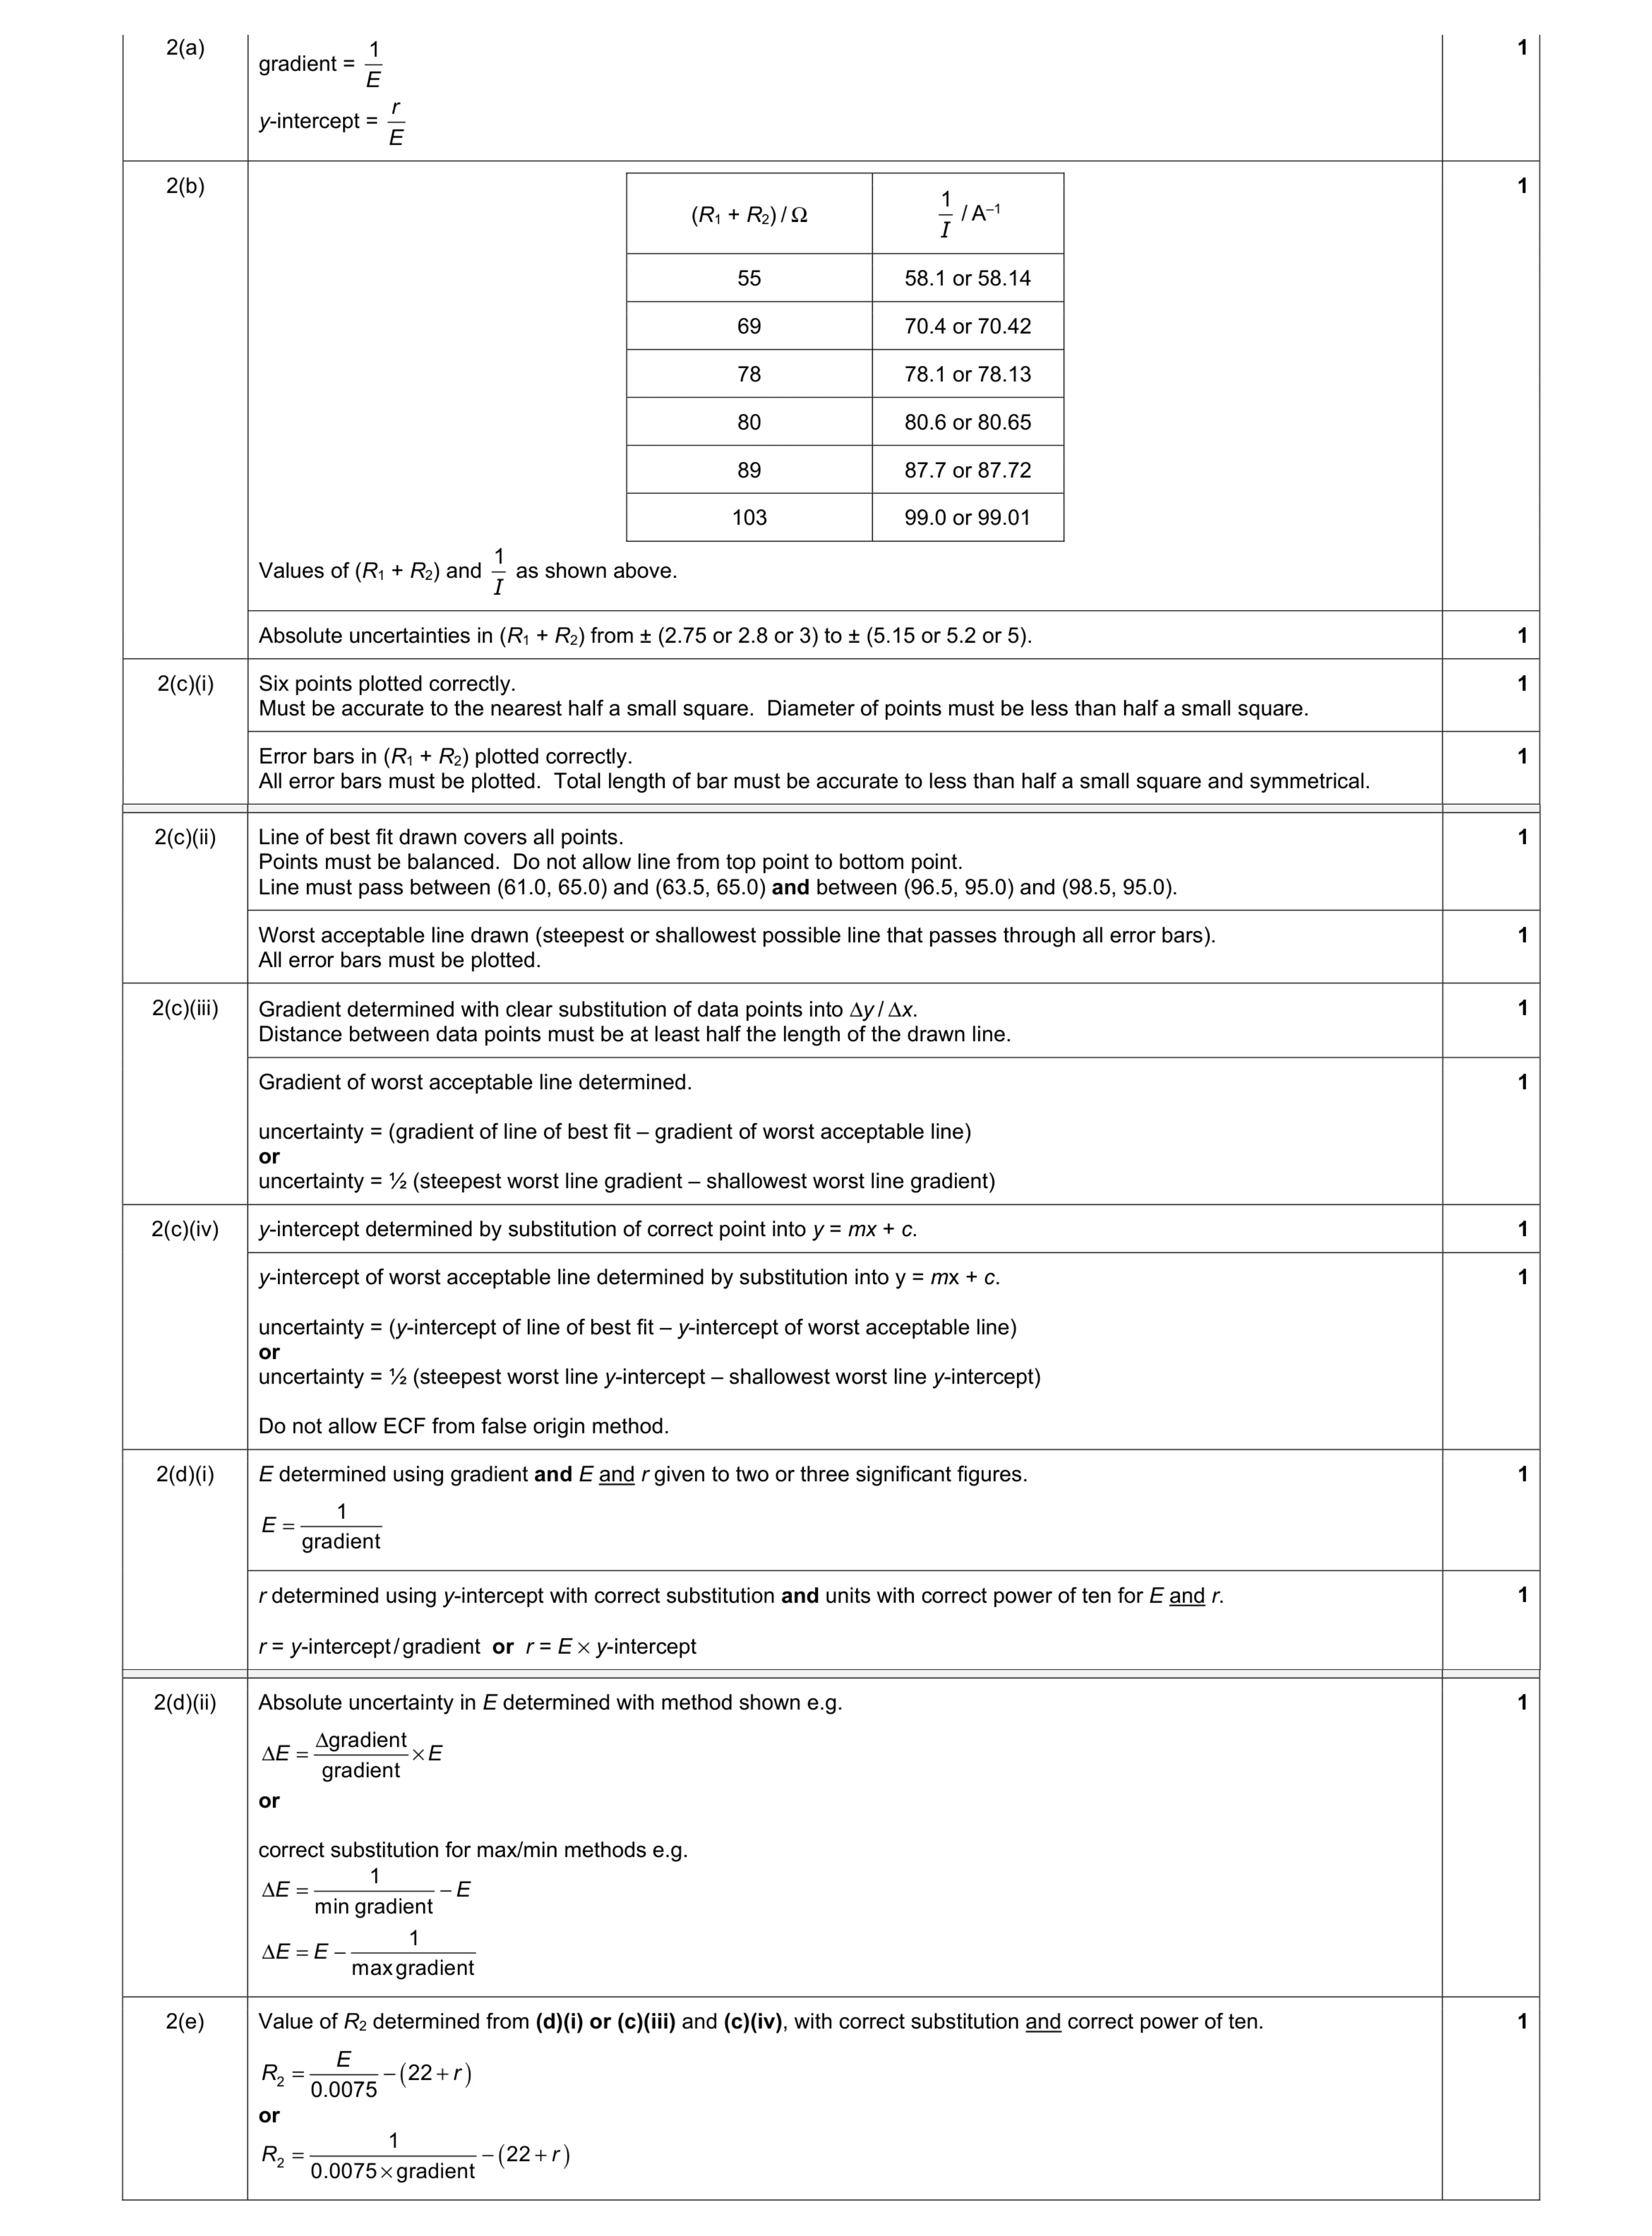 9
9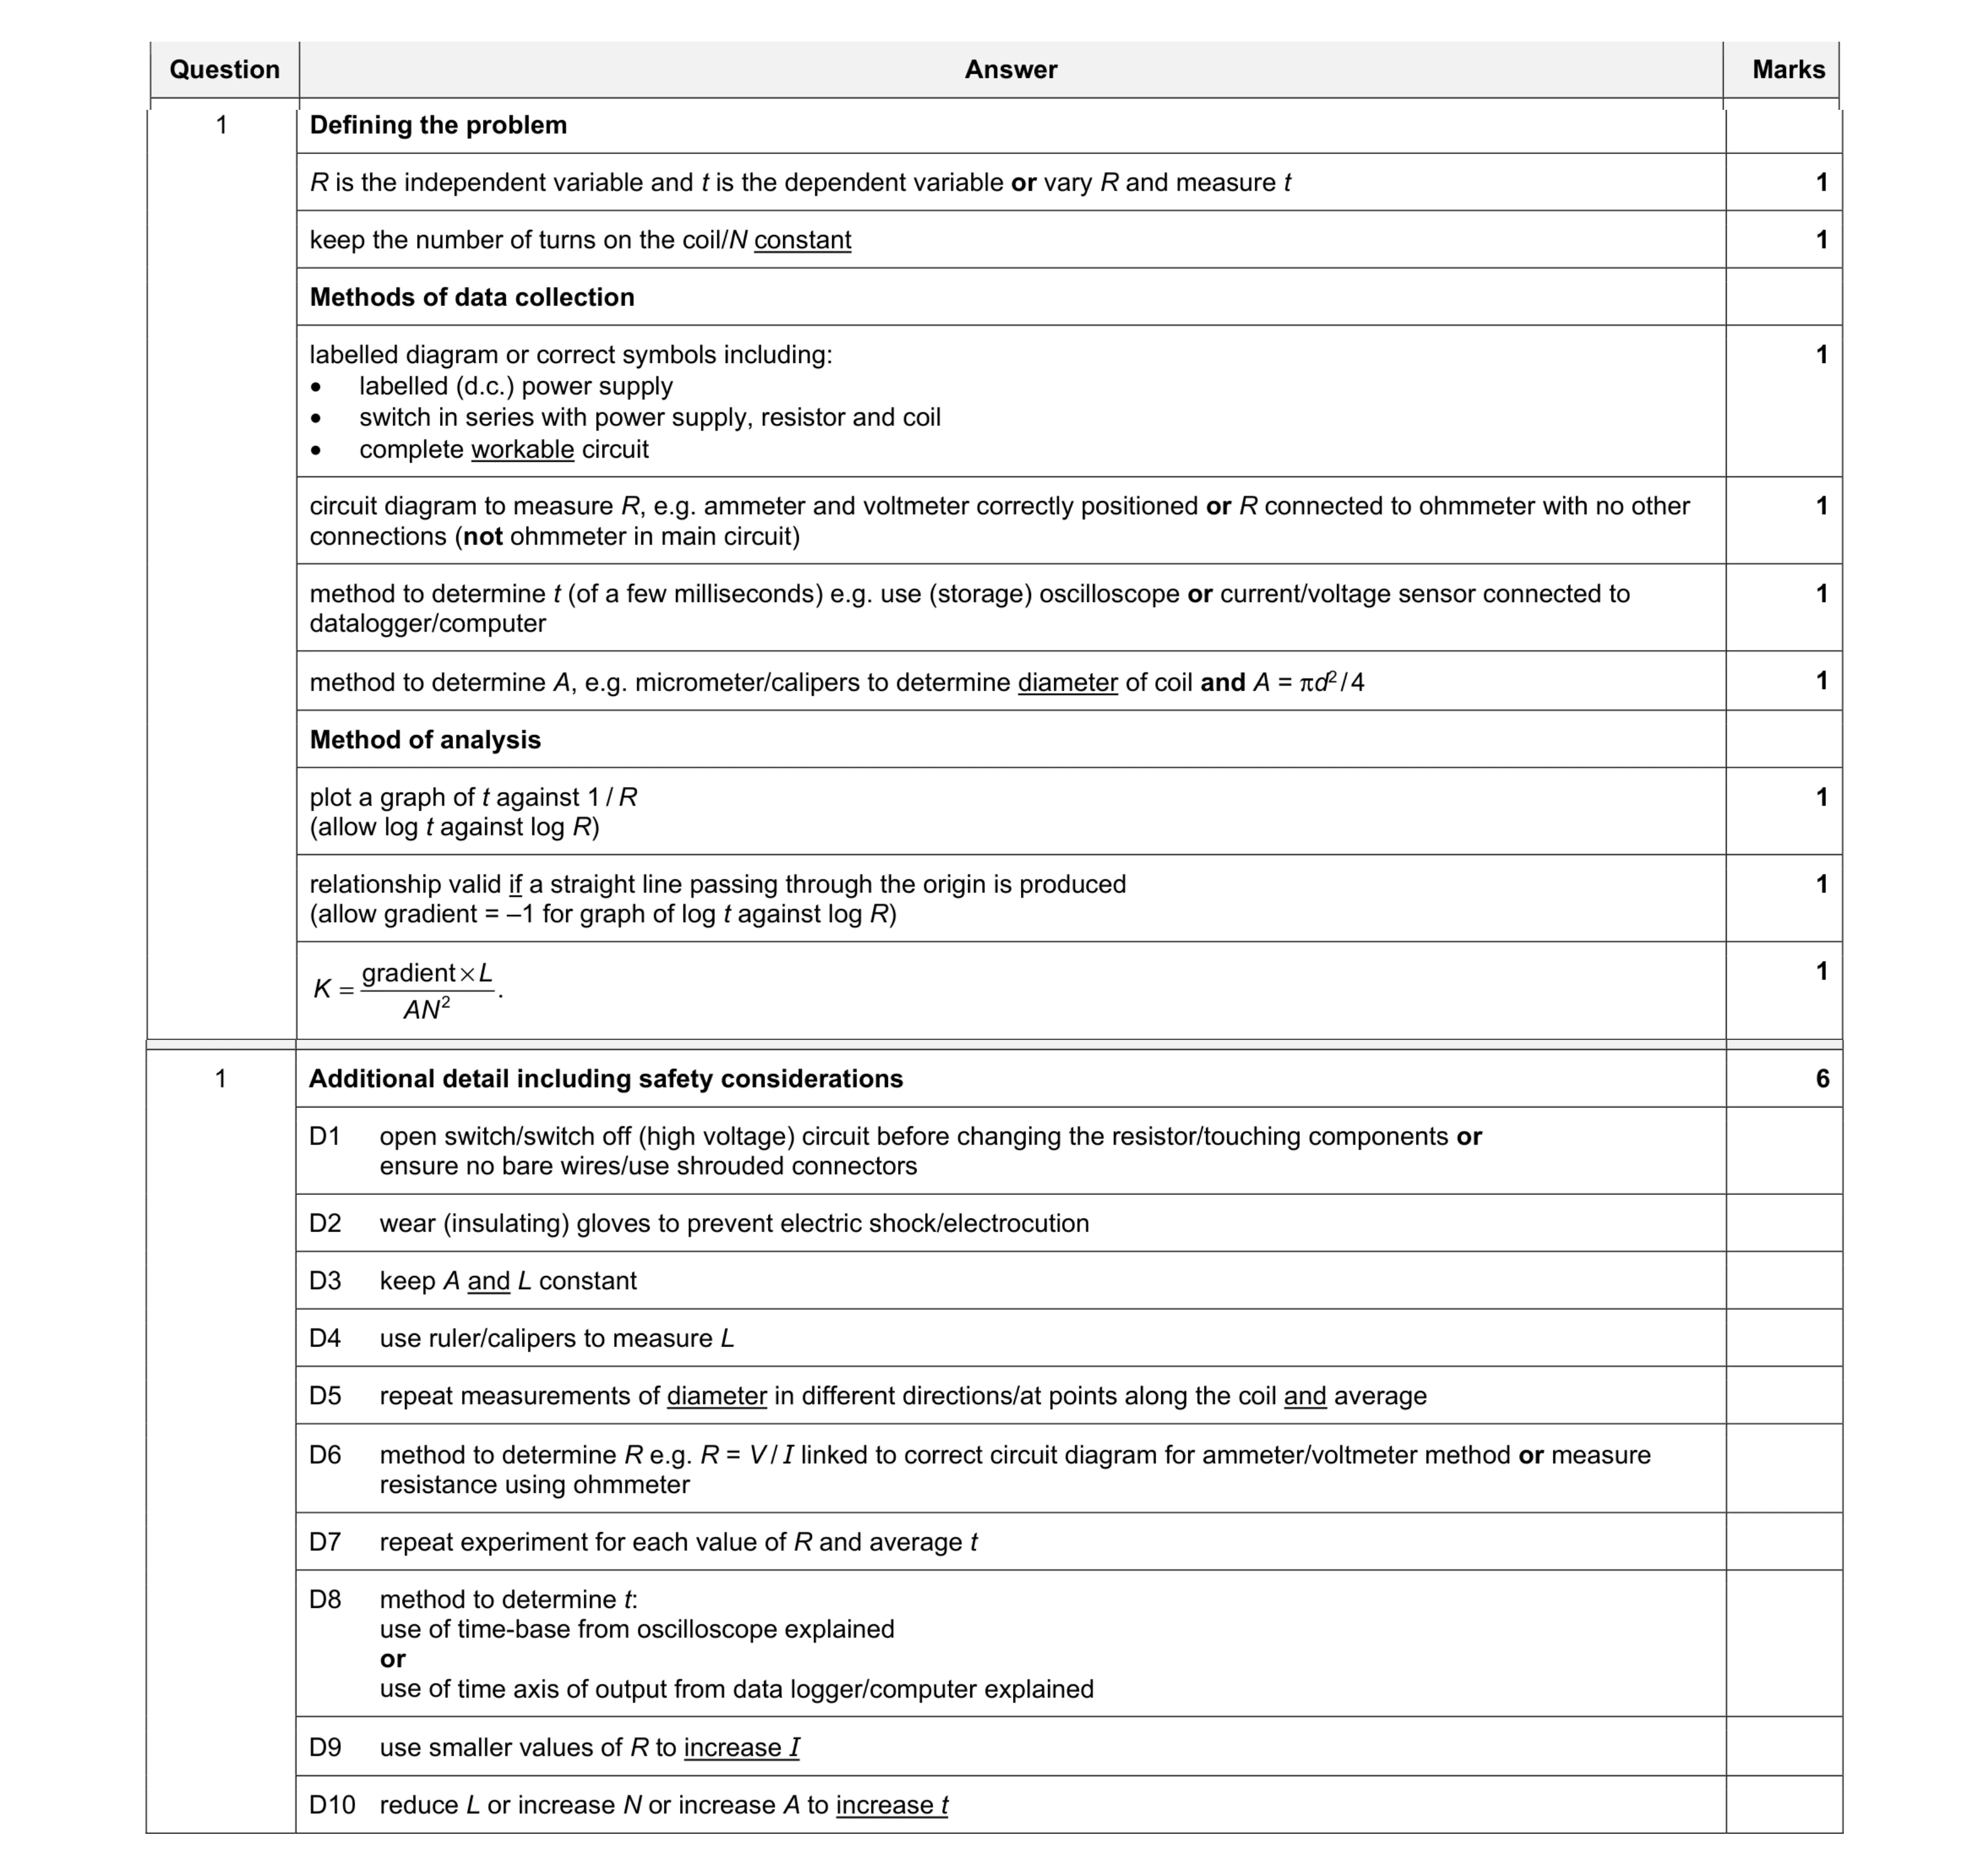 15
15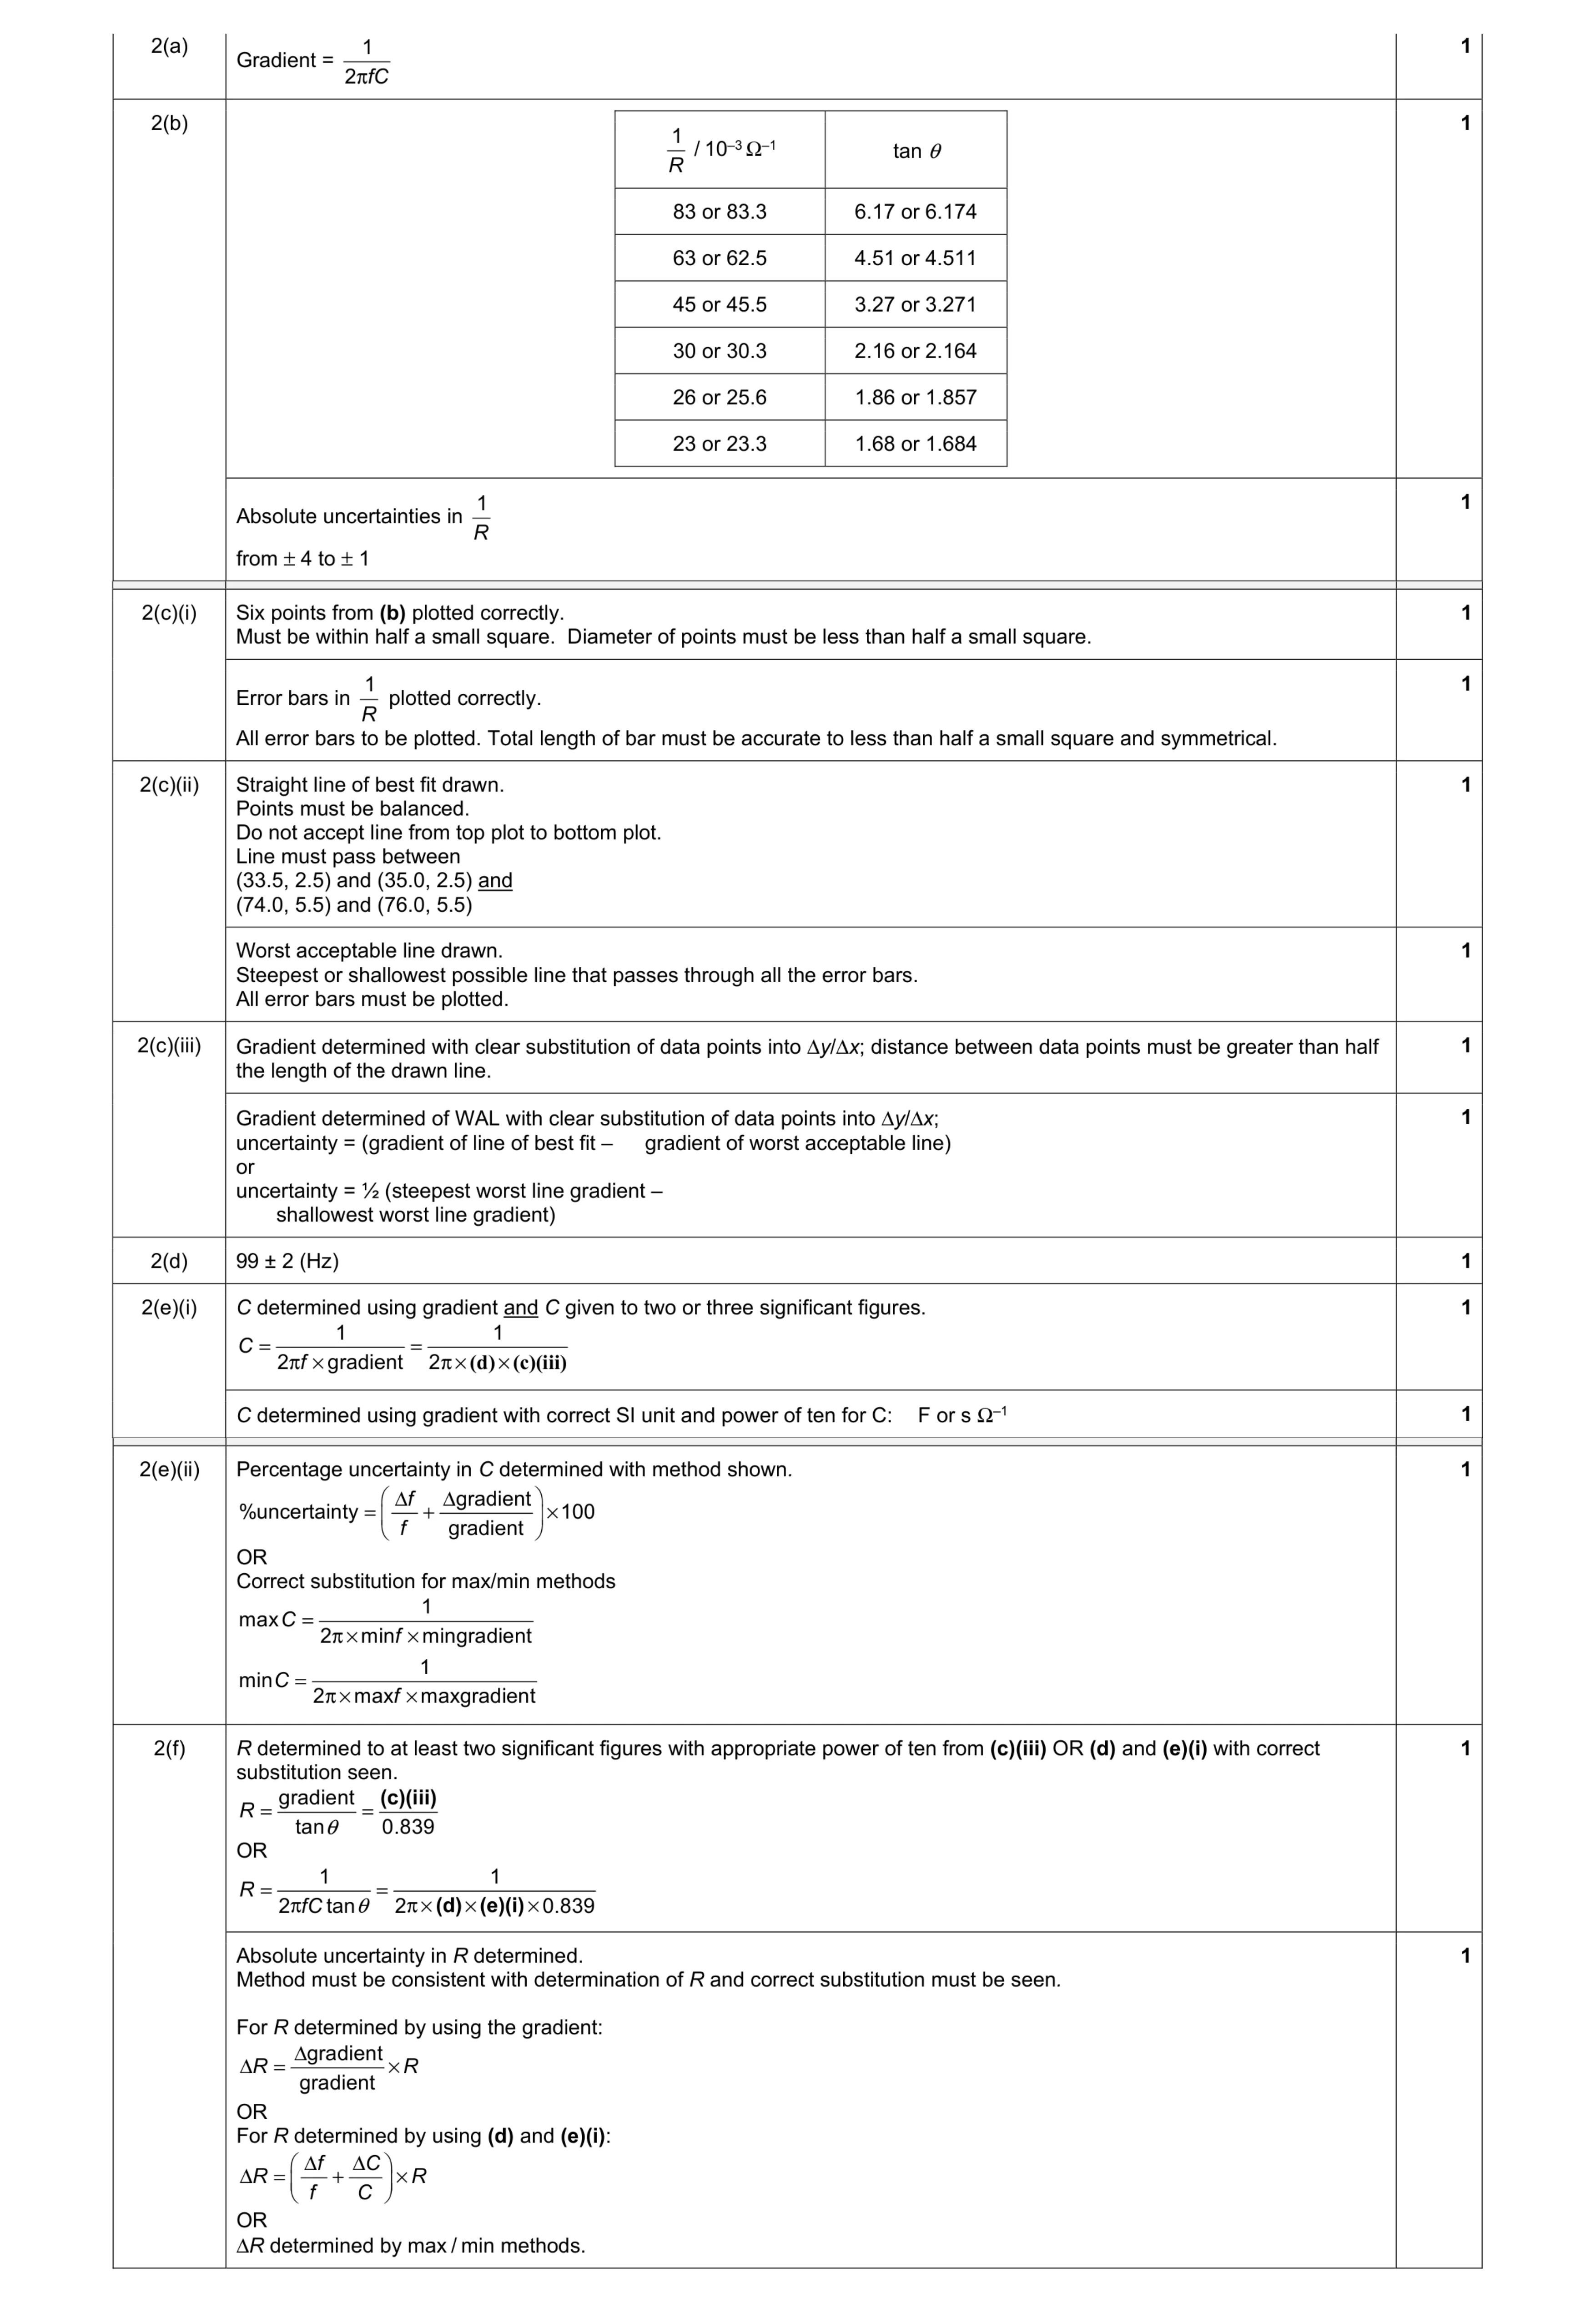 9
9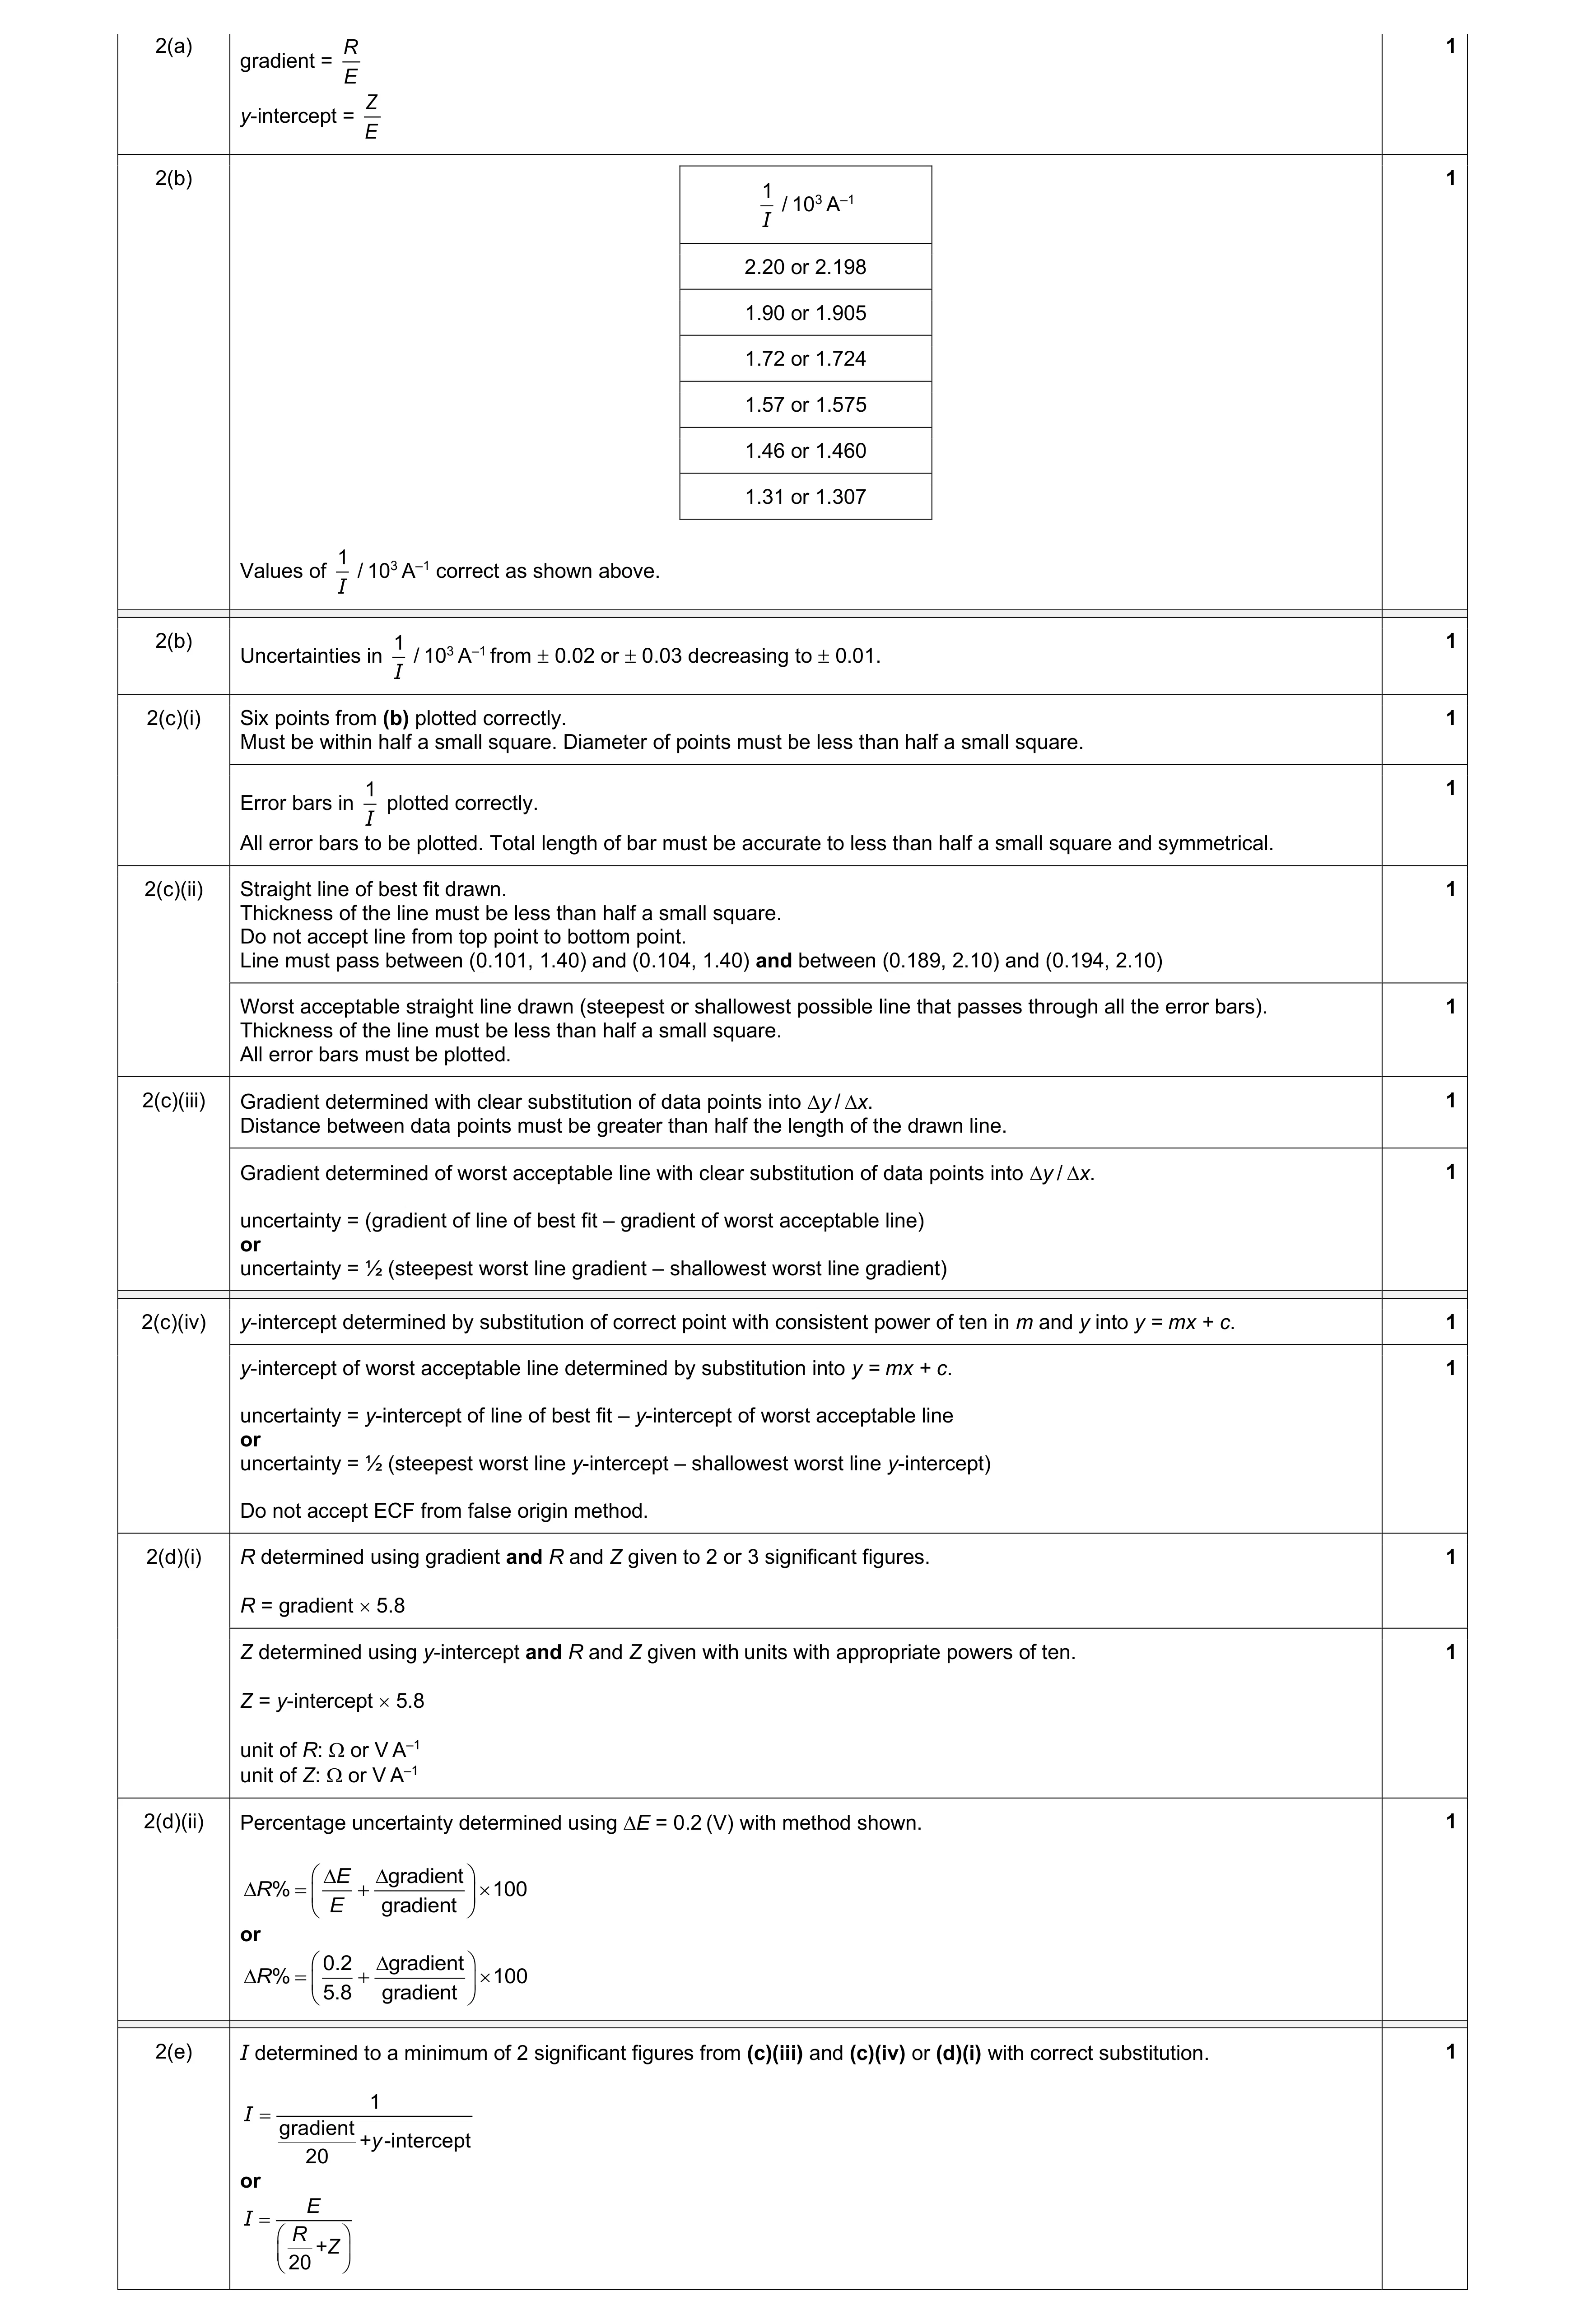 9
9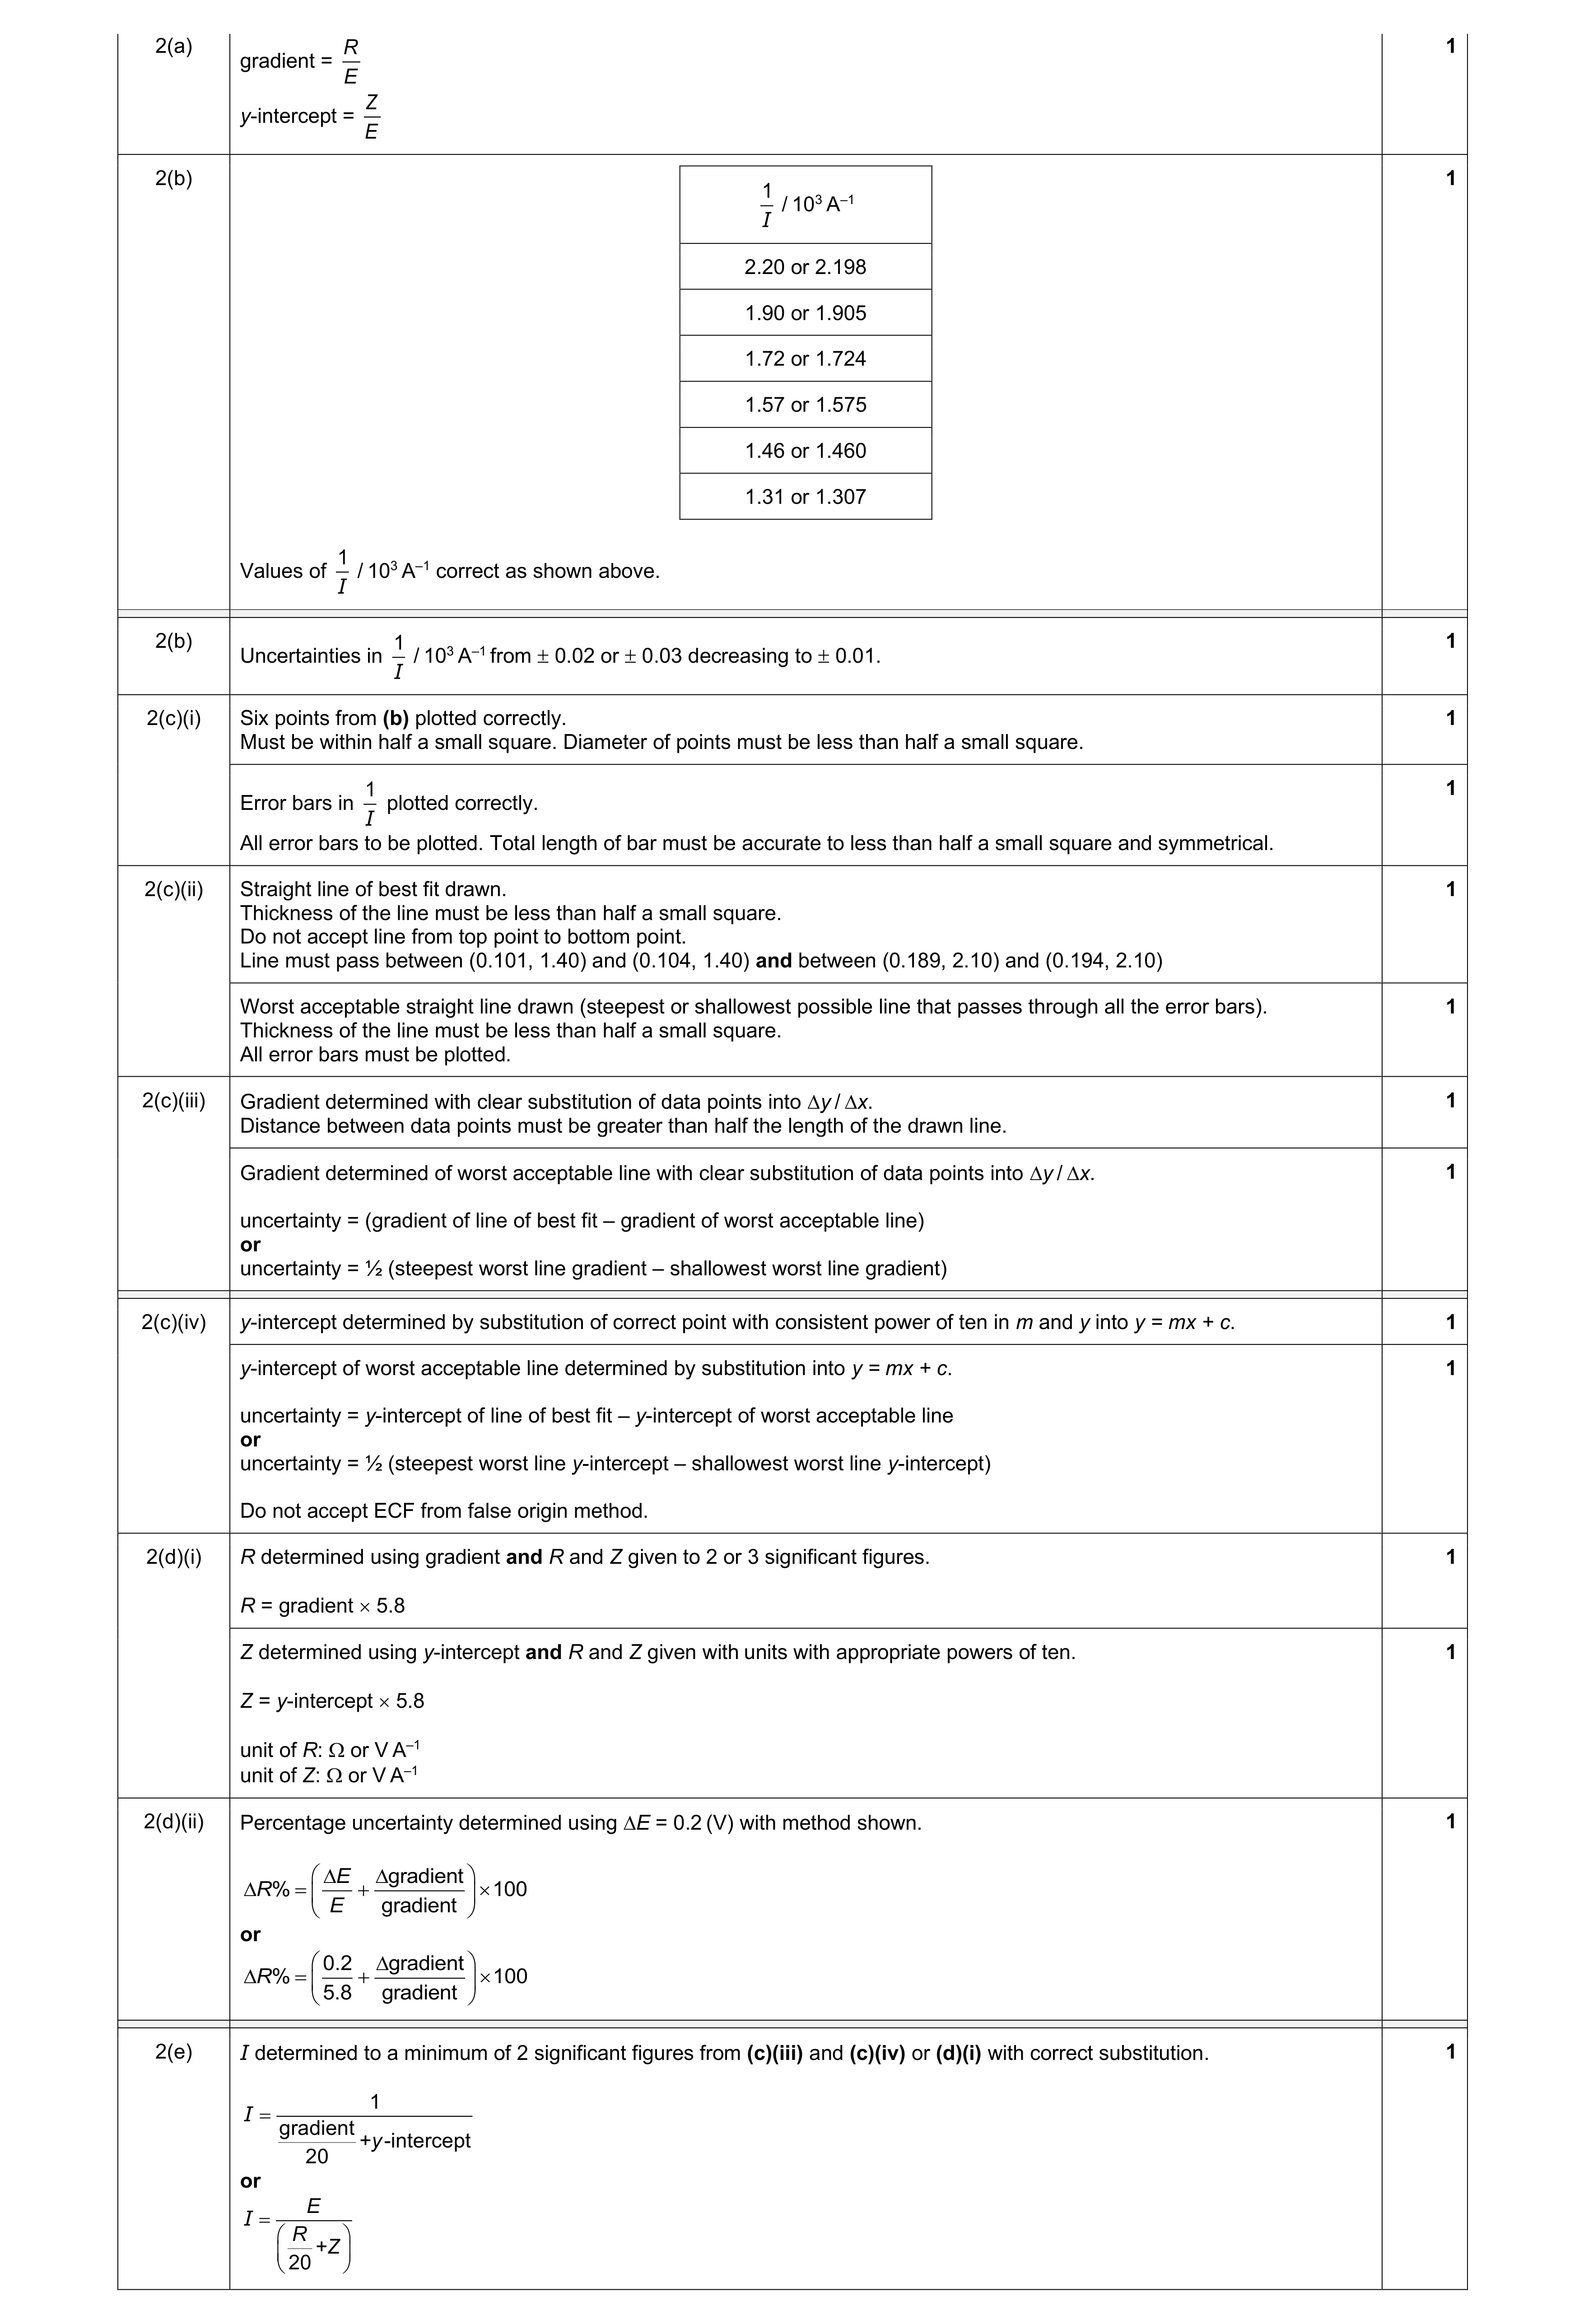 9
9