Questions as text
Q1 · A species of brown macroalga (seaweed) from a rocky shore 9693/22 May/June 2022
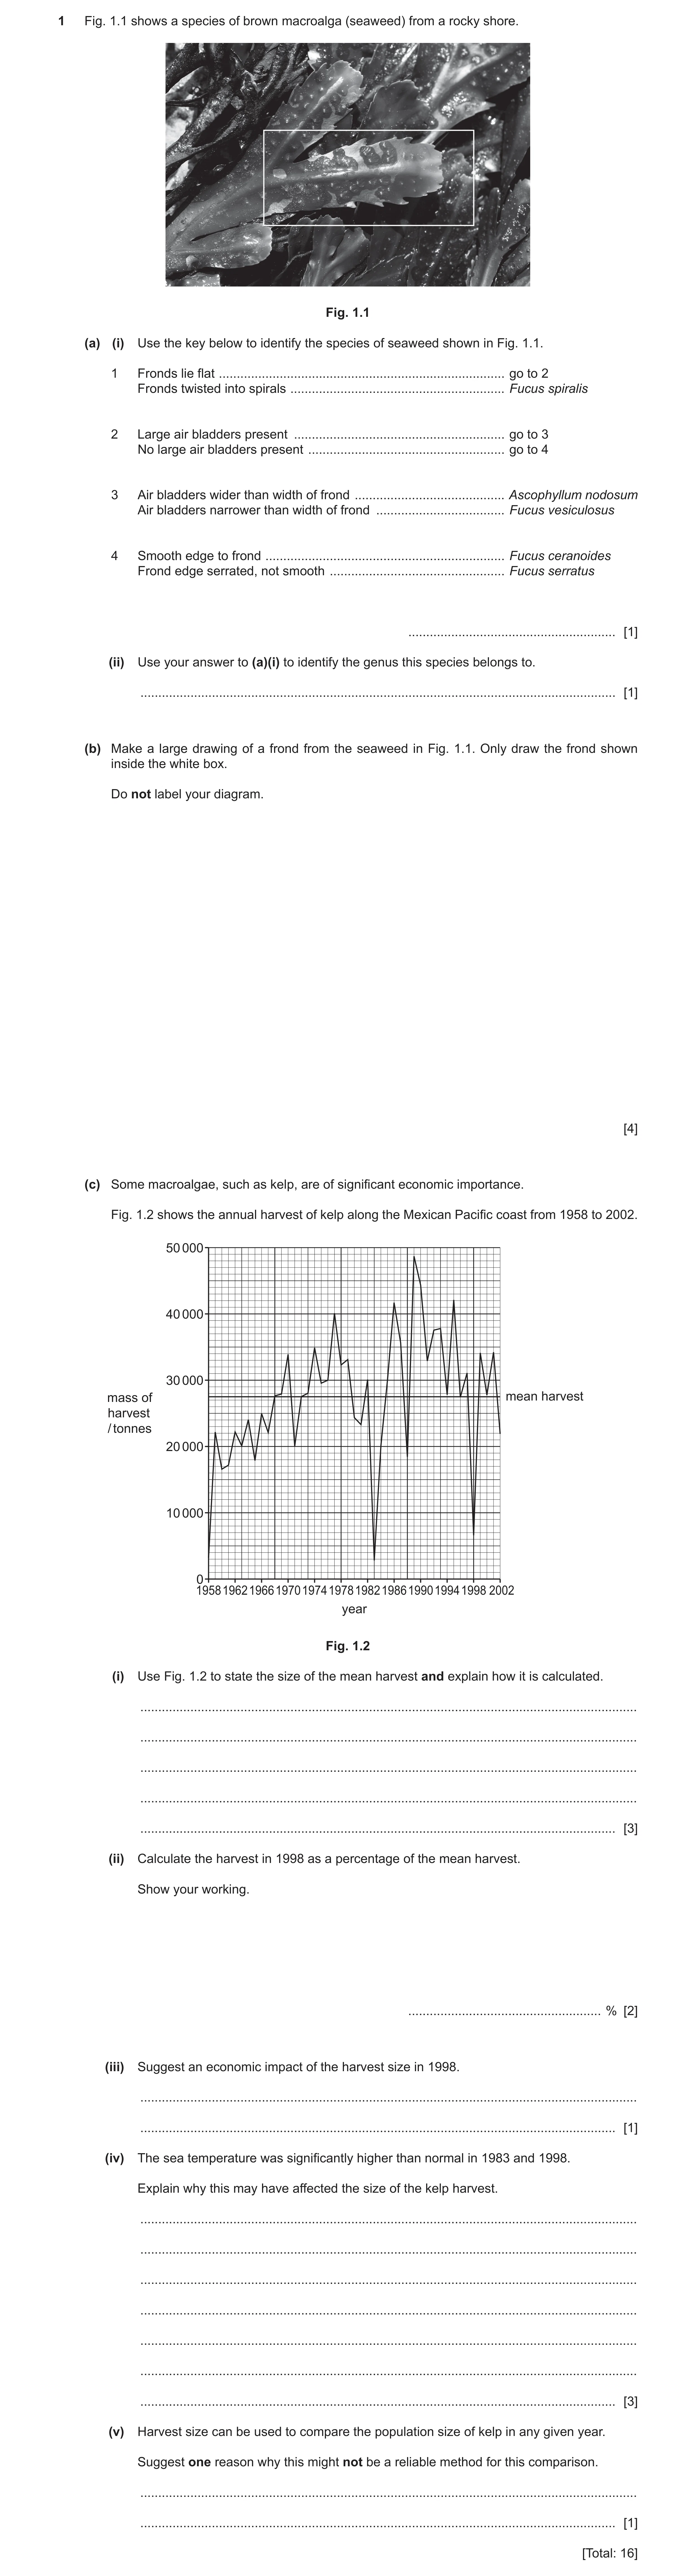
1 Fig. 1.1 shows a species of brown macroalga (seaweed) from a rocky shore. Fig. 1.1 (a) (i) Use the key below to identify the species of seaweed shown in Fig. 1.1. 1 Fronds lie flat … go to 2 Fronds twisted into spirals … Fucus spiralis 2 Large air bladders present … go to 3 No large air bladders present … go to 4 3 Air bladders wider than width of frond … Ascophyllum nodosum Air bladders narrower than width of frond … Fucus vesiculosus 4 Smooth edge to frond … Fucus ceranoides Frond edge serrated, not smooth … Fucus serratus … [1] (ii) Use your answer to (a)(i) to identify the genus this species belongs to. … [1] (b) Make a large drawing of a frond from the seaweed in Fig. 1.1. Only draw the frond shown inside the white box. Do not label your diagram. [4] (c) Some macroalgae, such as kelp, are of significant economic importance. Fig. 1.2 shows the annual harvest of kelp along the Mexican Pacific coast from 1958 to 2002. 50 000 40 000 30 000 mass of mean harvest harvest / tonnes 20 000 10 000 0 19581962 1966 1970 19741978 19821986199019941998 2002 year Fig. 1.2 (i) Use Fig. 1.2 to state the size of the mean harvest and explain how it is calculated. … … … … … [3] (ii) Calculate the harvest in 1998 as a percentage of the mean harvest. Show your working. … % [2] (iii) Suggest an economic impact of the harvest size in 1998. … … [1] (iv) The sea temperature was significantly higher than normal in 1983 and 1998. Explain why this may have affected the size of the kelp harvest. … … … … … … … [3] (v) Harvest size can be used to compare the population size of kelp in any given year. Suggest one reason why this might not be a reliable method for this comparison. … … [1] [Total: 16]
16 marks
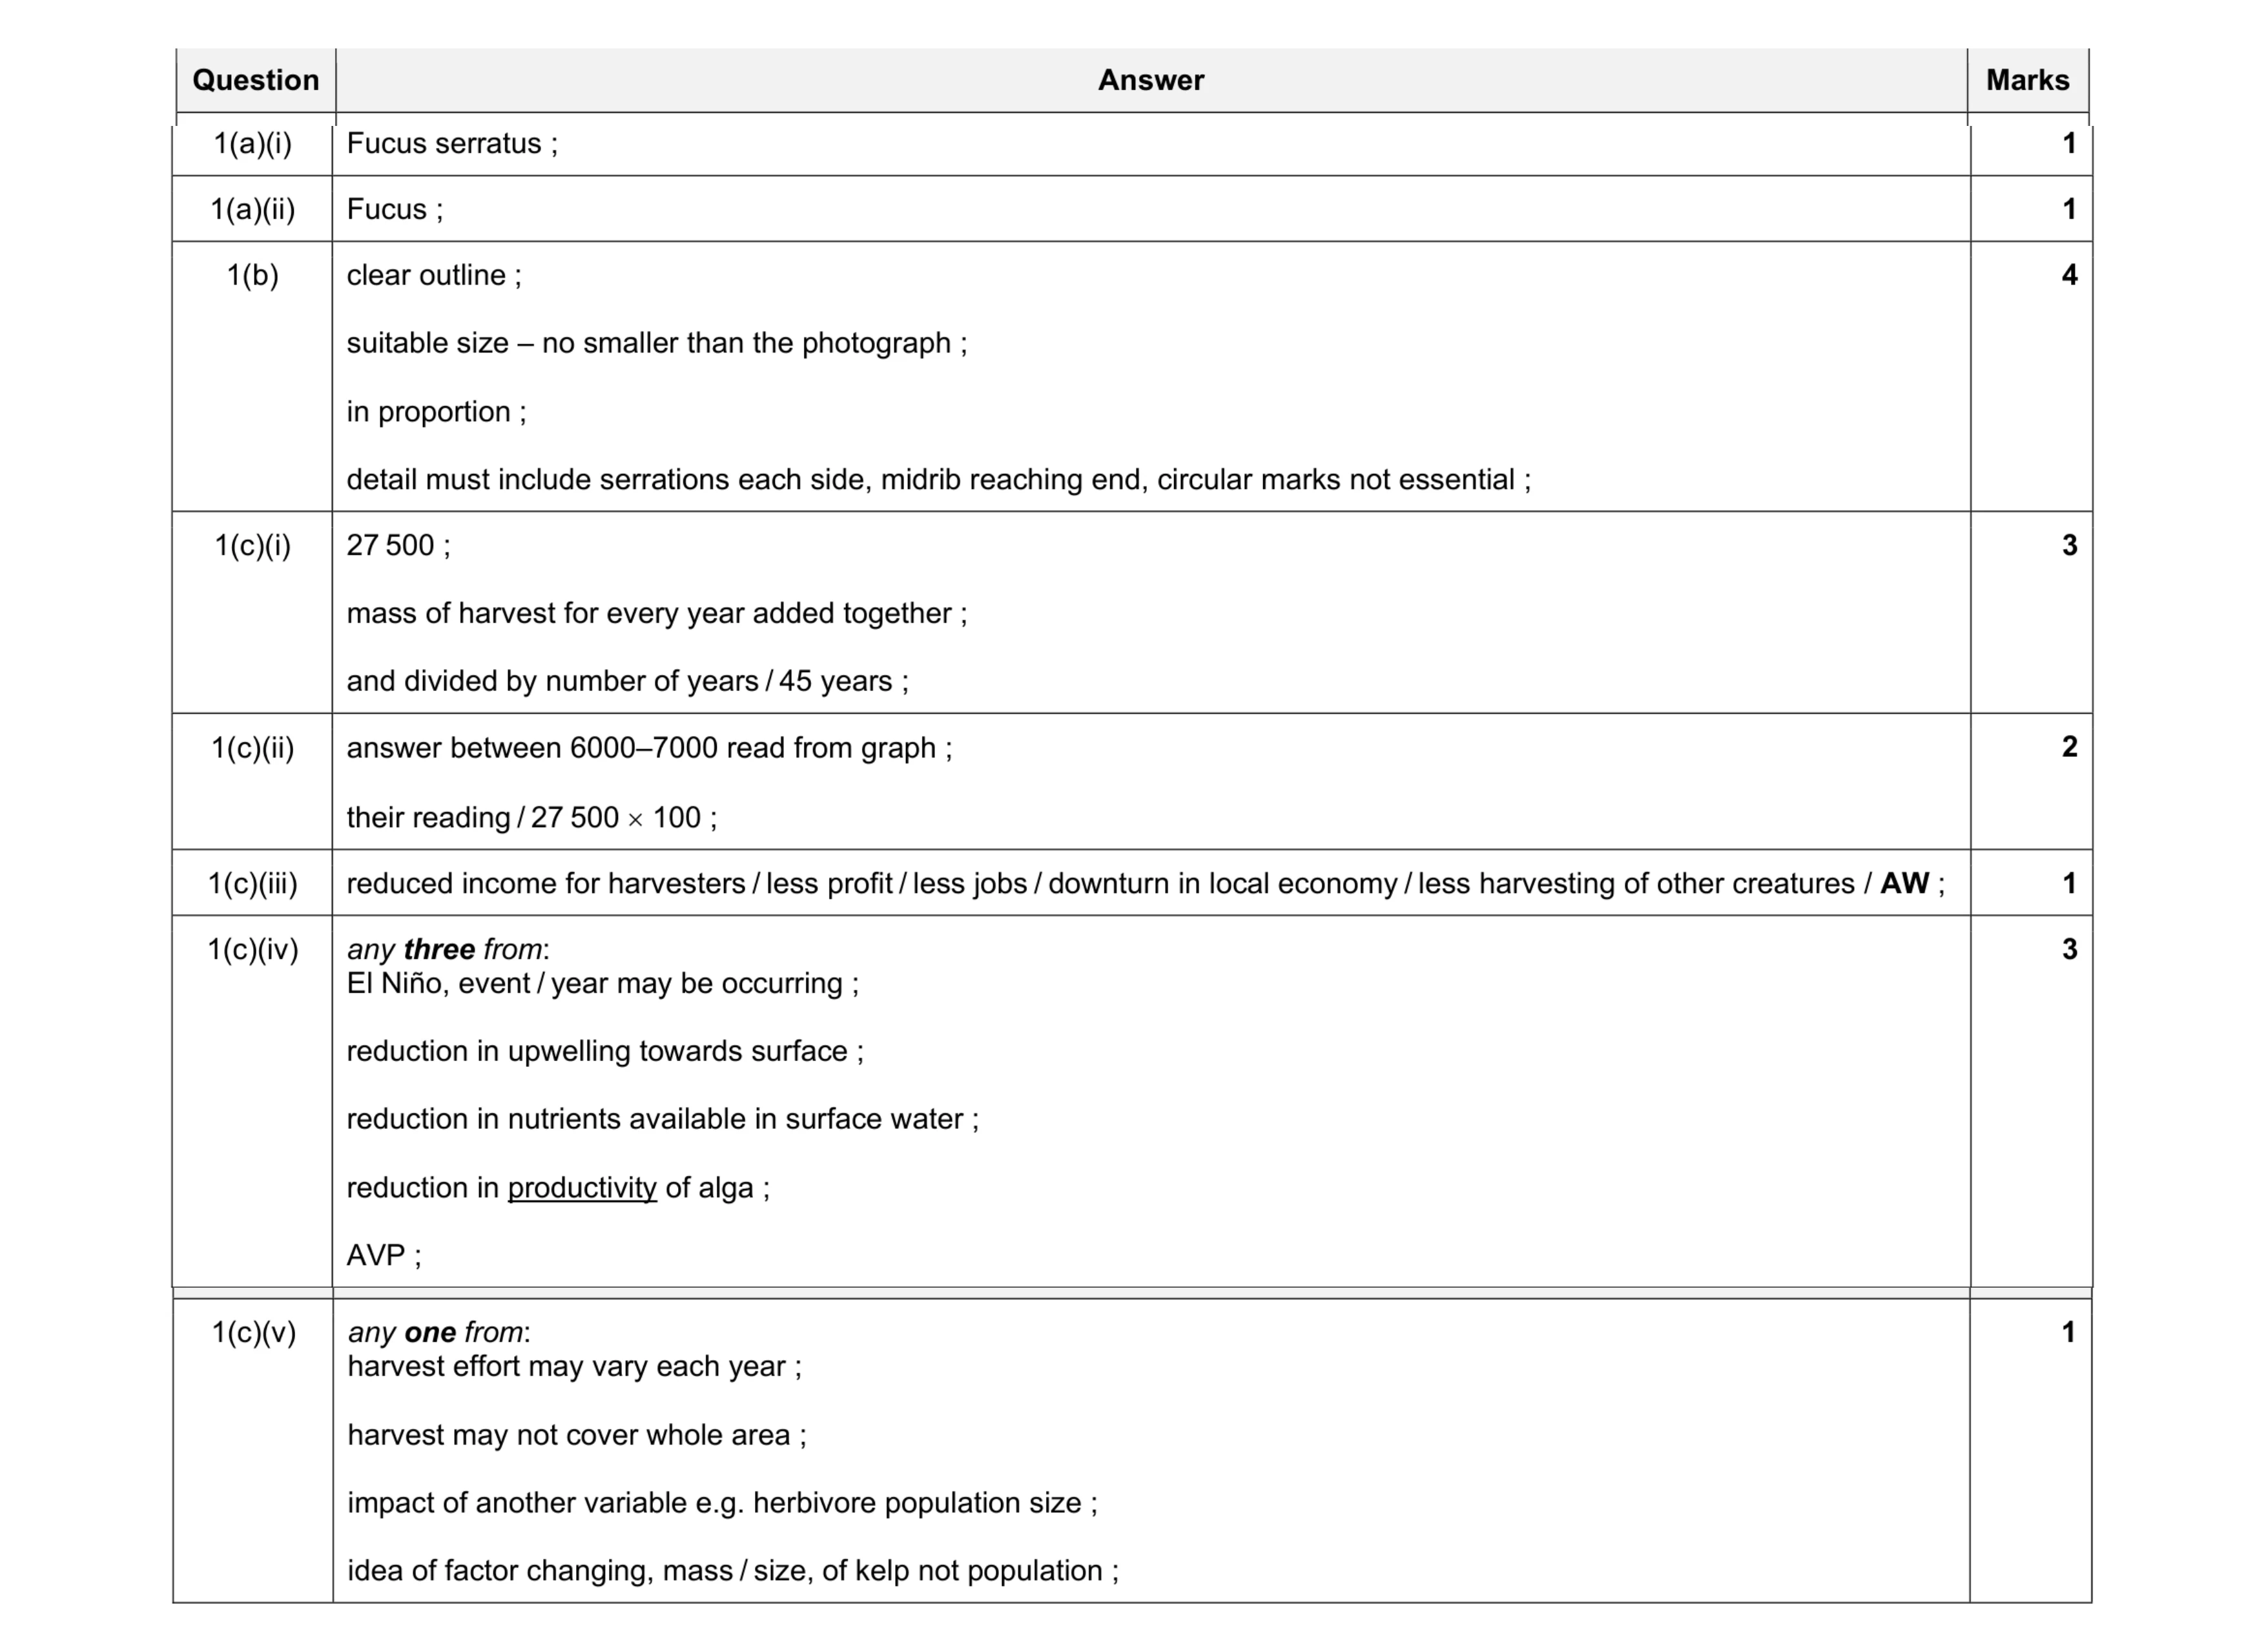
Mark scheme: 1(a)(i) Fucus serratus ; 1 1(a)(ii) Fucus ; 1 1(b) clear outline ; suitable size – no smaller than the photograph ; in proportion ; detail must include serrations each side, midrib reaching end, circular marks not essential ; 4 1(c)(i) 27 500 ; mass of harvest for every year added together ; and divided by number of years / 45 years ; 3 1(c)(ii) answer between 6000–7000 read from graph ; their reading / 27 500 100 ; 2 1(c)(iii) reduced income for harvesters / less profit / less jobs / downturn in local economy / less harvesting of other creatures / AW ; 1 1(c)(iv) any three from: El Niño, event / year may be occurring ; reduction in upwelling towards surface ; reduction in nutrients available in surface water ; reduction in productivity of alga ; AVP ; 3 Question Answer Marks 1(c)(v) any one from: harvest effort may vary each year ; harvest may not cover whole area ; impact of another variable e.g. herbivore population size ; idea of factor changing, mass / size, of kelp not population ; 1
This question in 9693/22 May/June 2022
Q2 · A species of brown macroalga (seaweed) from a rocky shore 9693/23 May/June 2022
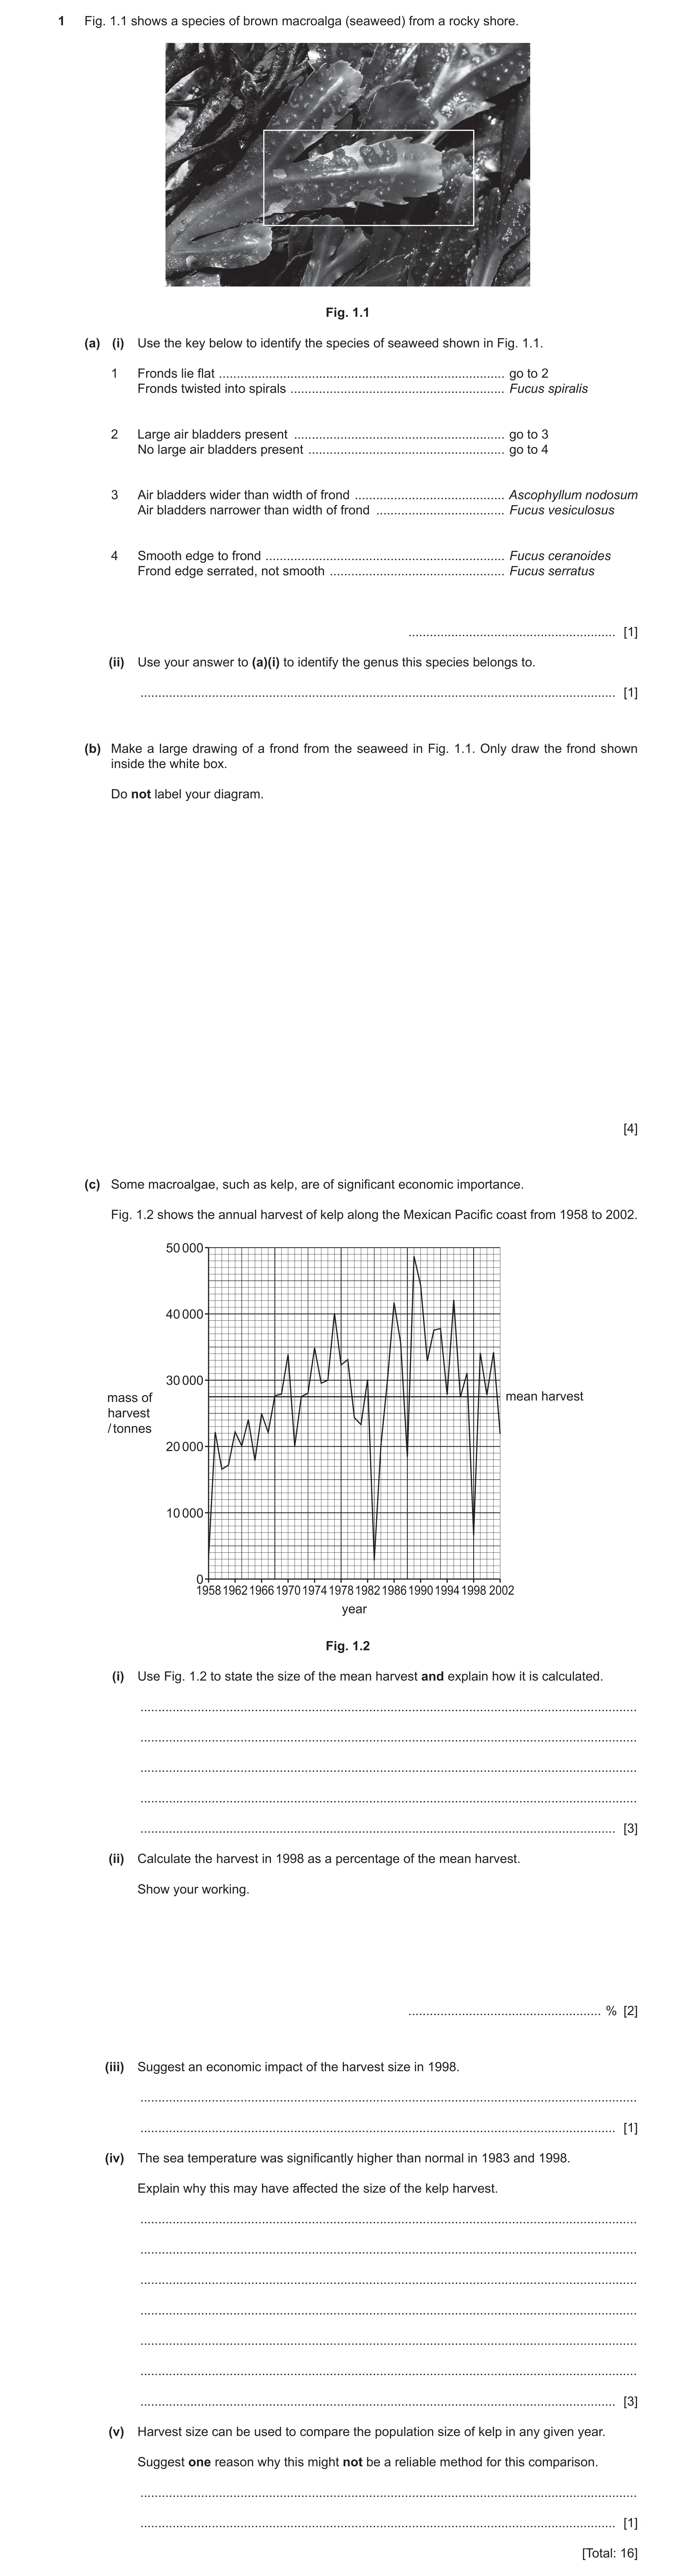
1 Fig. 1.1 shows a species of brown macroalga (seaweed) from a rocky shore. Fig. 1.1 (a) (i) Use the key below to identify the species of seaweed shown in Fig. 1.1. 1 Fronds lie flat … go to 2 Fronds twisted into spirals … Fucus spiralis 2 Large air bladders present … go to 3 No large air bladders present … go to 4 3 Air bladders wider than width of frond … Ascophyllum nodosum Air bladders narrower than width of frond … Fucus vesiculosus 4 Smooth edge to frond … Fucus ceranoides Frond edge serrated, not smooth … Fucus serratus … [1] (ii) Use your answer to (a)(i) to identify the genus this species belongs to. … [1] (b) Make a large drawing of a frond from the seaweed in Fig. 1.1. Only draw the frond shown inside the white box. Do not label your diagram. [4] (c) Some macroalgae, such as kelp, are of significant economic importance. Fig. 1.2 shows the annual harvest of kelp along the Mexican Pacific coast from 1958 to 2002. 50 000 40 000 30 000 mass of mean harvest harvest / tonnes 20 000 10 000 0 19581962 1966 1970 19741978 19821986199019941998 2002 year Fig. 1.2 (i) Use Fig. 1.2 to state the size of the mean harvest and explain how it is calculated. … … … … … [3] (ii) Calculate the harvest in 1998 as a percentage of the mean harvest. Show your working. … % [2] (iii) Suggest an economic impact of the harvest size in 1998. … … [1] (iv) The sea temperature was significantly higher than normal in 1983 and 1998. Explain why this may have affected the size of the kelp harvest. … … … … … … … [3] (v) Harvest size can be used to compare the population size of kelp in any given year. Suggest one reason why this might not be a reliable method for this comparison. … … [1] [Total: 16]
16 marks
Mark scheme: 1(a)(i) Fucus serratus ; 1 1(a)(ii) Fucus ; 1 1(b) clear outline ; suitable size – no smaller than the photograph ; in proportion ; detail must include serrations each side, midrib reaching end, circular marks not essential ; 4 1(c)(i) 27 500 ; mass of harvest for every year added together ; and divided by number of years / 45 years ; 3 1(c)(ii) answer between 6000–7000 read from graph ; their reading / 27 500 100 ; 2 1(c)(iii) reduced income for harvesters / less profit / less jobs / downturn in local economy / less harvesting of other creatures / AW ; 1 1(c)(iv) any 3 from: El Niño, event / year may be occurring ; reduction in upwelling towards surface ; reduction in nutrients available in surface water ; reduction in productivity of alga ; AVP ; 3 Question Answer Marks 1(c)(v) any 1 from: harvest effort may vary each year ; harvest may not cover whole area ; impact of another variable e.g. herbivore population size ; idea of factor changing, mass / size, of kelp not population ; 1
This question in 9693/23 May/June 2022
Q3 · A plaice, Pleuronectes platessa 9693/22 May/June 2024
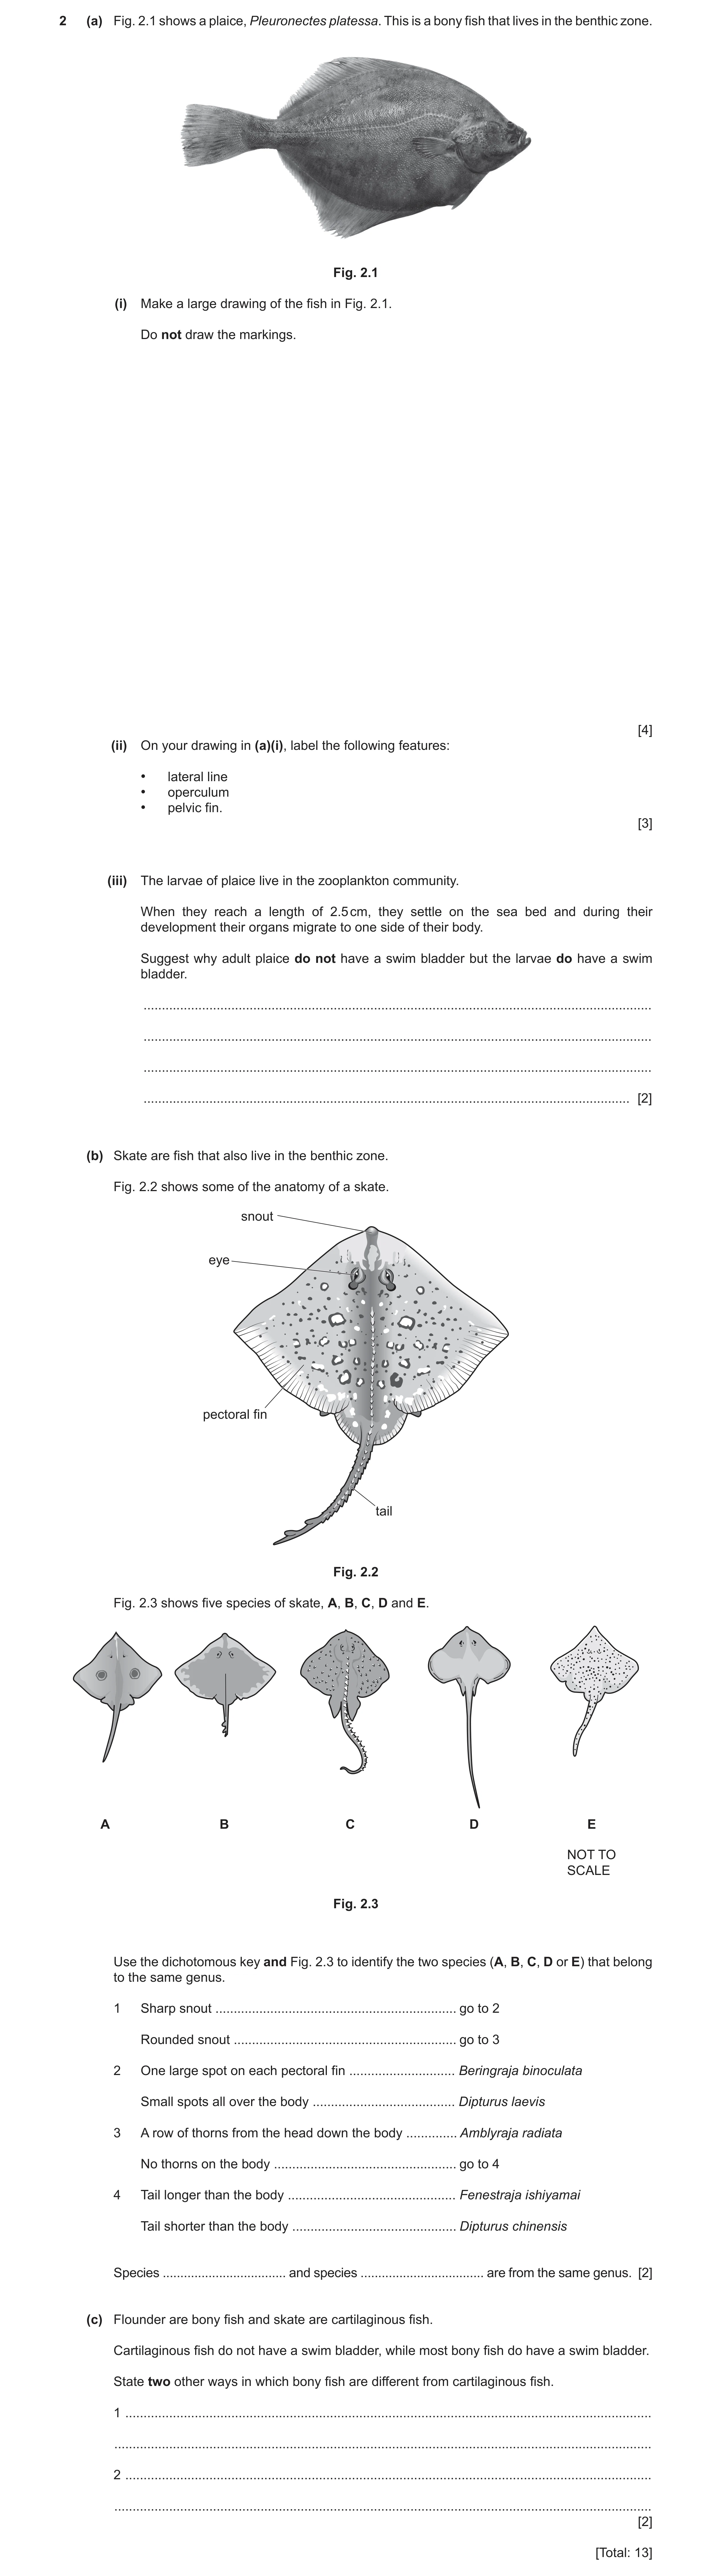
2 (a) Fig. 2.1 shows a plaice, Pleuronectes platessa. This is a bony fish that lives in the benthic zone. Fig. 2.1 (i) Make a large drawing of the fish in Fig. 2.1. Do not draw the markings. [4] (ii) On your drawing in (a)(i), label the following features: • lateral line • operculum • pelvic fin. [3] (iii) The larvae of plaice live in the zooplankton community. When they reach a length of 2.5 cm, they settle on the sea bed and during their development their organs migrate to one side of their body. Suggest why adult plaice do not have a swim bladder but the larvae do have a swim bladder. … … … … [2] (b) Skate are fish that also live in the benthic zone. Fig. 2.2 shows some of the anatomy of a skate. snout eye pectoral fin tail Fig. 2.2 Fig. 2.3 shows five species of skate, A, B, C, D and E. A B C D E NOT TO SCALE Fig. 2.3 Use the dichotomous key and Fig. 2.3 to identify the two species (A, B, C, D or E) that belong to the same genus. 1 Sharp snout … go to 2 Rounded snout … go to 3 2 One large spot on each pectoral fin … Beringraja binoculata Small spots all over the body … Dipturus laevis 3 A row of thorns from the head down the body … Amblyraja radiata No thorns on the body … go to 4 4 Tail longer than the body … Fenestraja ishiyamai Tail shorter than the body … Dipturus chinensis Species … and species … are from the same genus. [2] (c) Flounder are bony fish and skate are cartilaginous fish. Cartilaginous fish do not have a swim bladder, while most bony fish do have a swim bladder. State two other ways in which bony fish are different from cartilaginous fish. 1 … … 2 … … [2] [Total: 13]
13 marks
Mark scheme: 2(a)(i) clear outline with thin lines with no shading, no gaps ; suitable size ; proportion distinct ‘snout’ / caudal fin less than half, more than 1/3 body length, correct body shape ; detail (both eyes shown, delineation between body, and dorsal and anal fins) ; 4 2(a)(ii) straight line drawn (no arrowhead) touching each part ;;; 3 2(a)(iii) any 2 from: juveniles have to float to be in the zooplankton / larvae are free swimming (in the water column) ; (because) they cannot swim against a current / being buoyant reduces the energy demand for, swimming / maintaining position / keeps them closer to their, food / phytoplankton ; adults (remain on sea bed, so) do not need buoyancy ; 2 2(b) E ; B ; 2 2(c) any 2 from: (bony fish have) ossified or calcified, skeleton / (cartilaginous fish have) non-ossified / non-calcified ; (bony fish have) operculum / (cartilaginous fish have) gill slits ; (bony fish have) lack denticles OR scales (cover the body) / (cartilaginous fish have) denticles (cover the body) OR no scales ; (bony fish have) visible lateral line / (cartilaginous fish have) lateral line not visible ; 2
This question in 9693/22 May/June 2024
Q4 · A brittle star which belongs to the echinoderm phylum 9693/21 Oct/Nov 2024
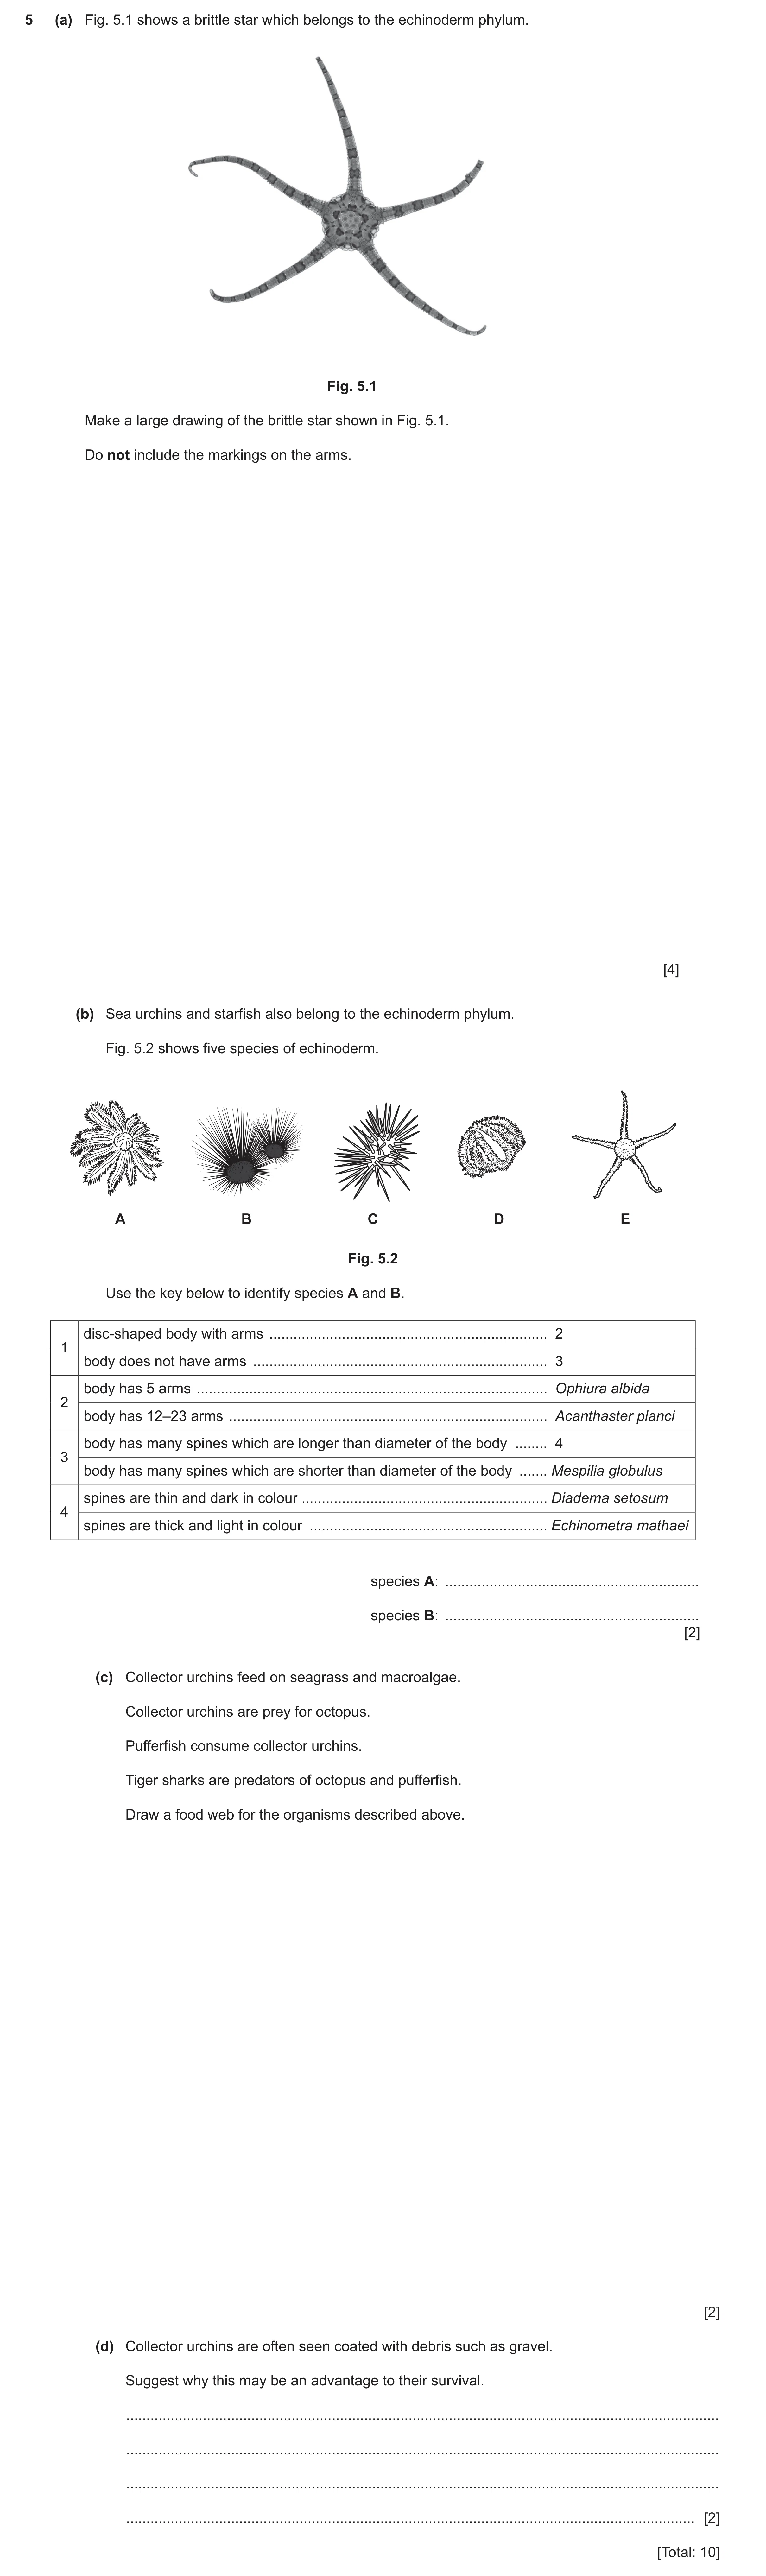
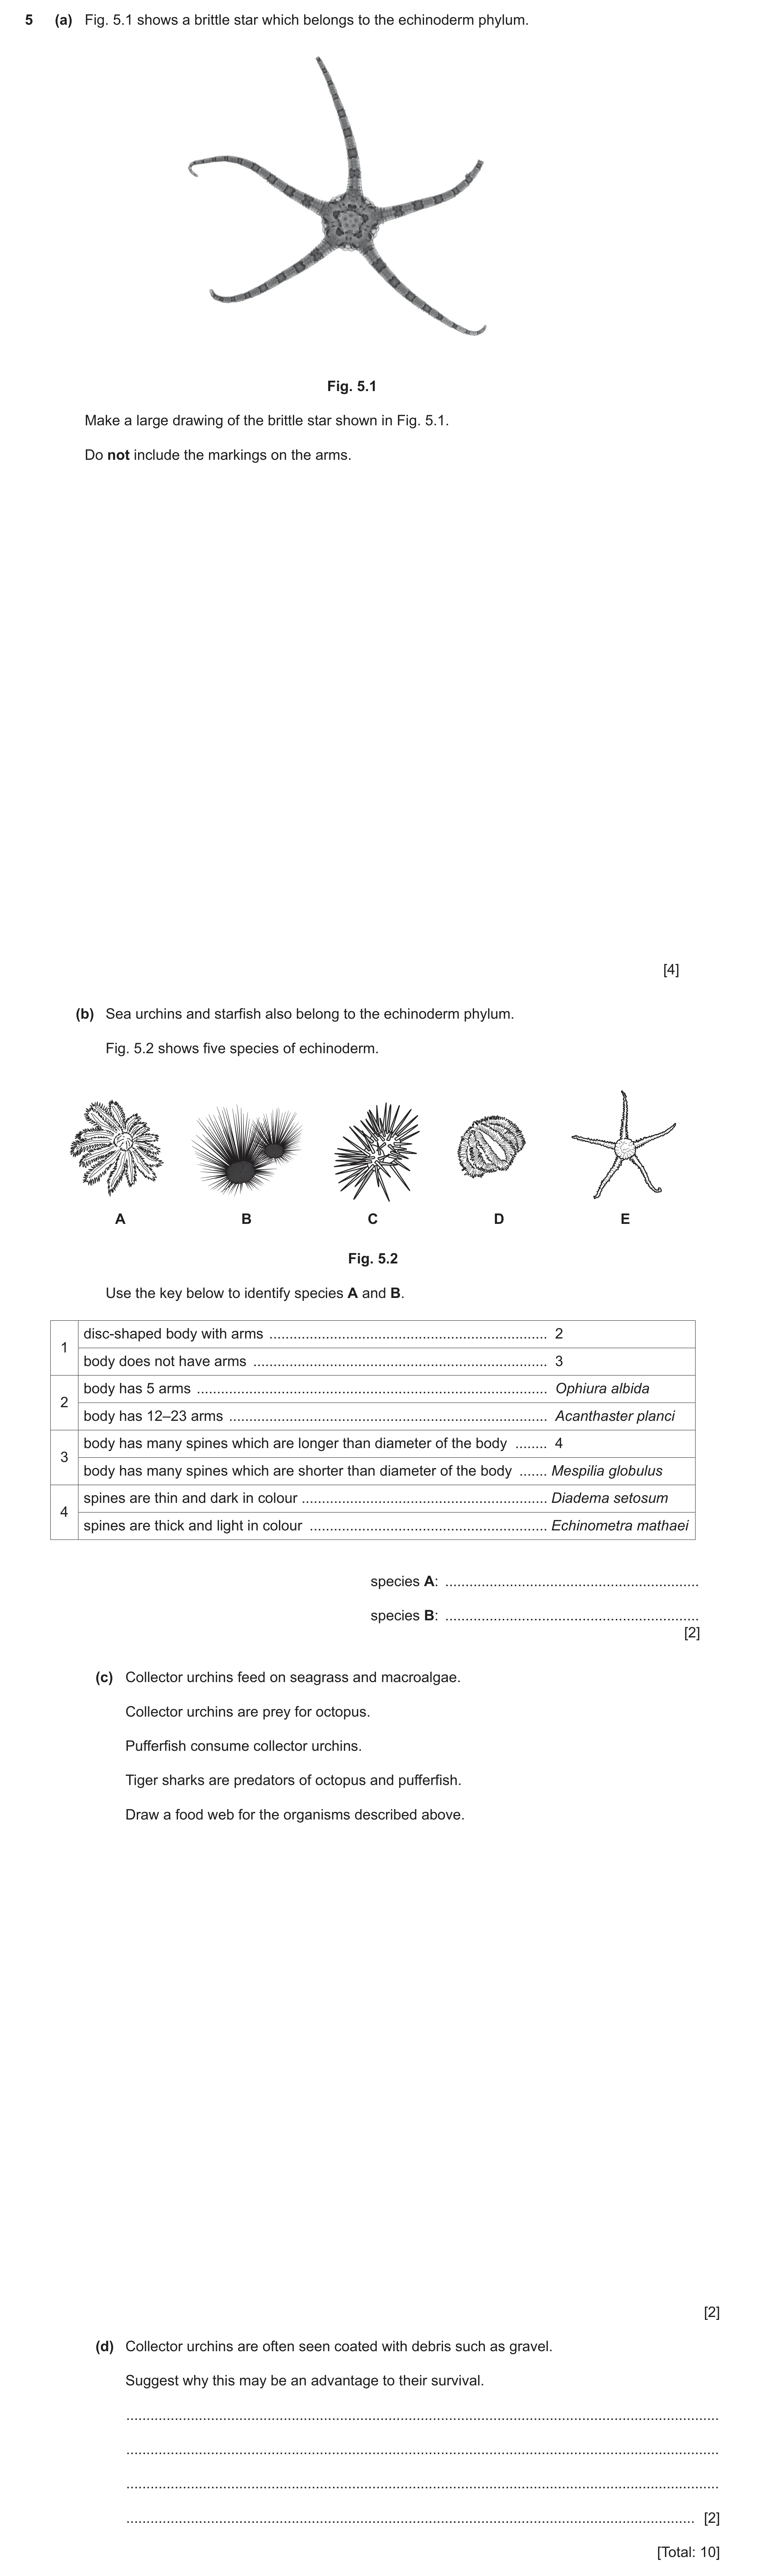
5 (a) Fig. 5.1 shows a brittle star which belongs to the echinoderm phylum. Fig. 5.1 Make a large drawing of the brittle star shown in Fig. 5.1. Do not include the markings on the arms. [4] (b) Sea urchins and starfish also belong to the echinoderm phylum. Fig. 5.2 shows five species of echinoderm. A B C D E Fig. 5.2 Use the key below to identify species A and B. disc-shaped body with arms … 2 1 body does not have arms … 3 body has 5 arms … Ophiura albida 2 body has 12–23 arms … Acanthaster planci body has many spines which are longer than diameter of the body … 4 3 body has many spines which are shorter than diameter of the body … Mespilia globulus spines are thin and dark in colour … Diadema setosum 4 spines are thick and light in colour … Echinometra mathaei species A: … species B: … [2] (c) Collector urchins feed on seagrass and macroalgae. Collector urchins are prey for octopus. Pufferfish consume collector urchins. Tiger sharks are predators of octopus and pufferfish. Draw a food web for the organisms described above. [2] (d) Collector urchins are often seen coated with debris such as gravel. Suggest why this may be an advantage to their survival. … … … … [2] [Total: 10]
10 marks
Mark scheme: 5(a) quality of outline (thin and continuous) in pencil ; 4 suitable size (at least as large as the photo) ; proportion (angles, length of arms, centre diameter) ; detail (minimum 2 out of the 3 curls on end of 3 arms circled) ; 5(b) Species A: Acanthaster planci ; 2 Species B: Diadema setosum ; 5(c) either: 2 for all six organisms correctly linked with 6 arrows in right direction ;; OR: food web of six organisms correct organisms with 6 lines / incorrect direction of arrows ; OR: food web of five correct organisms with correct direction of arrows ; OR: food web of six organisms correct organisms with correct direction of five arrows ; 5(d) idea of camouflage from / less likely to be seen ; 2 (so less likely to be seen / eaten) by predators / octopus / puffer fish ;
This question in 9693/21 Oct/Nov 2024
Q5 · A survey was carried out to estimate the total population of the shark Carcharias taurus… 9693/21 Oct/Nov 2024
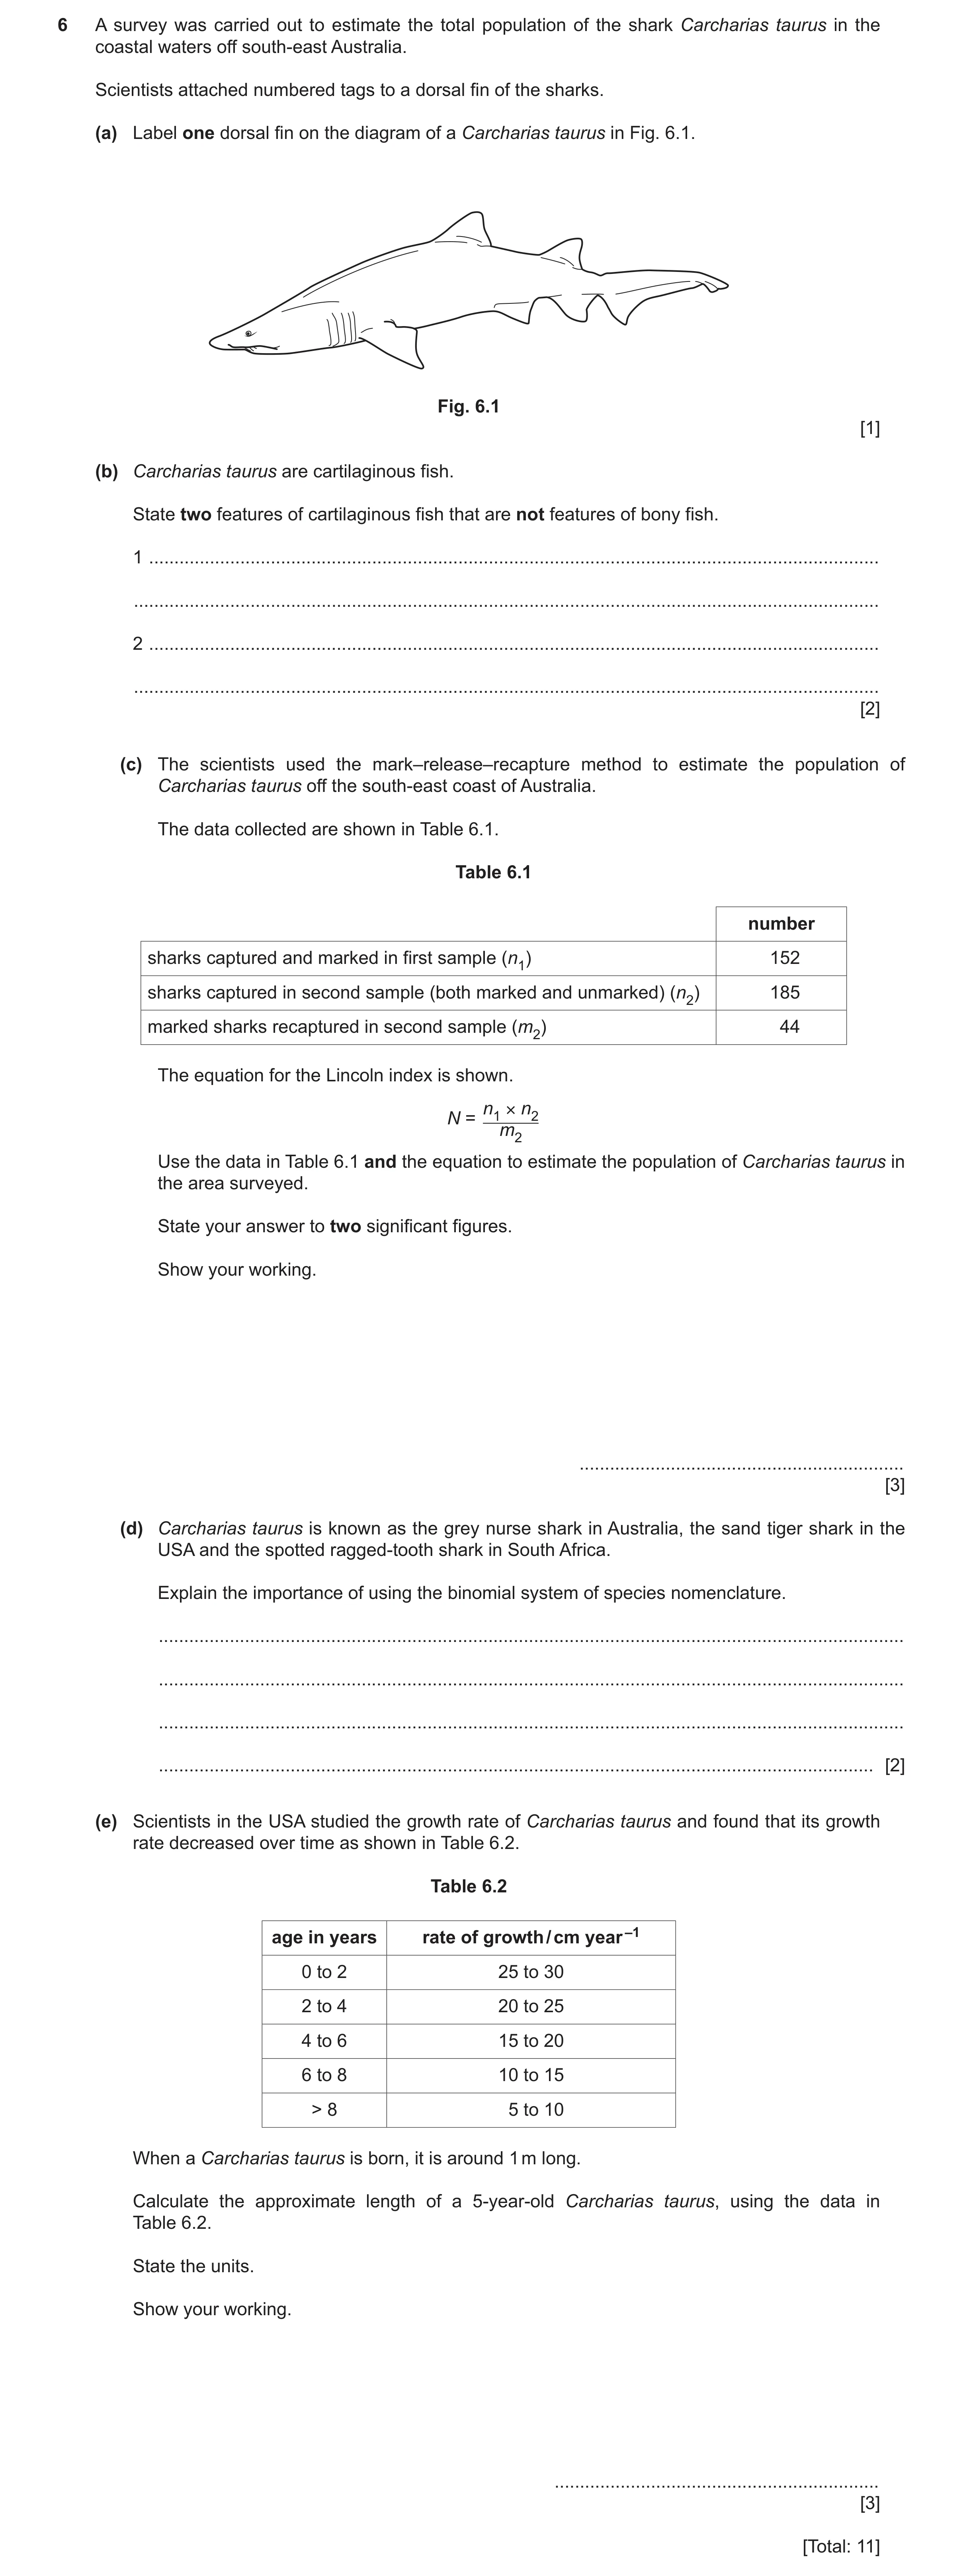
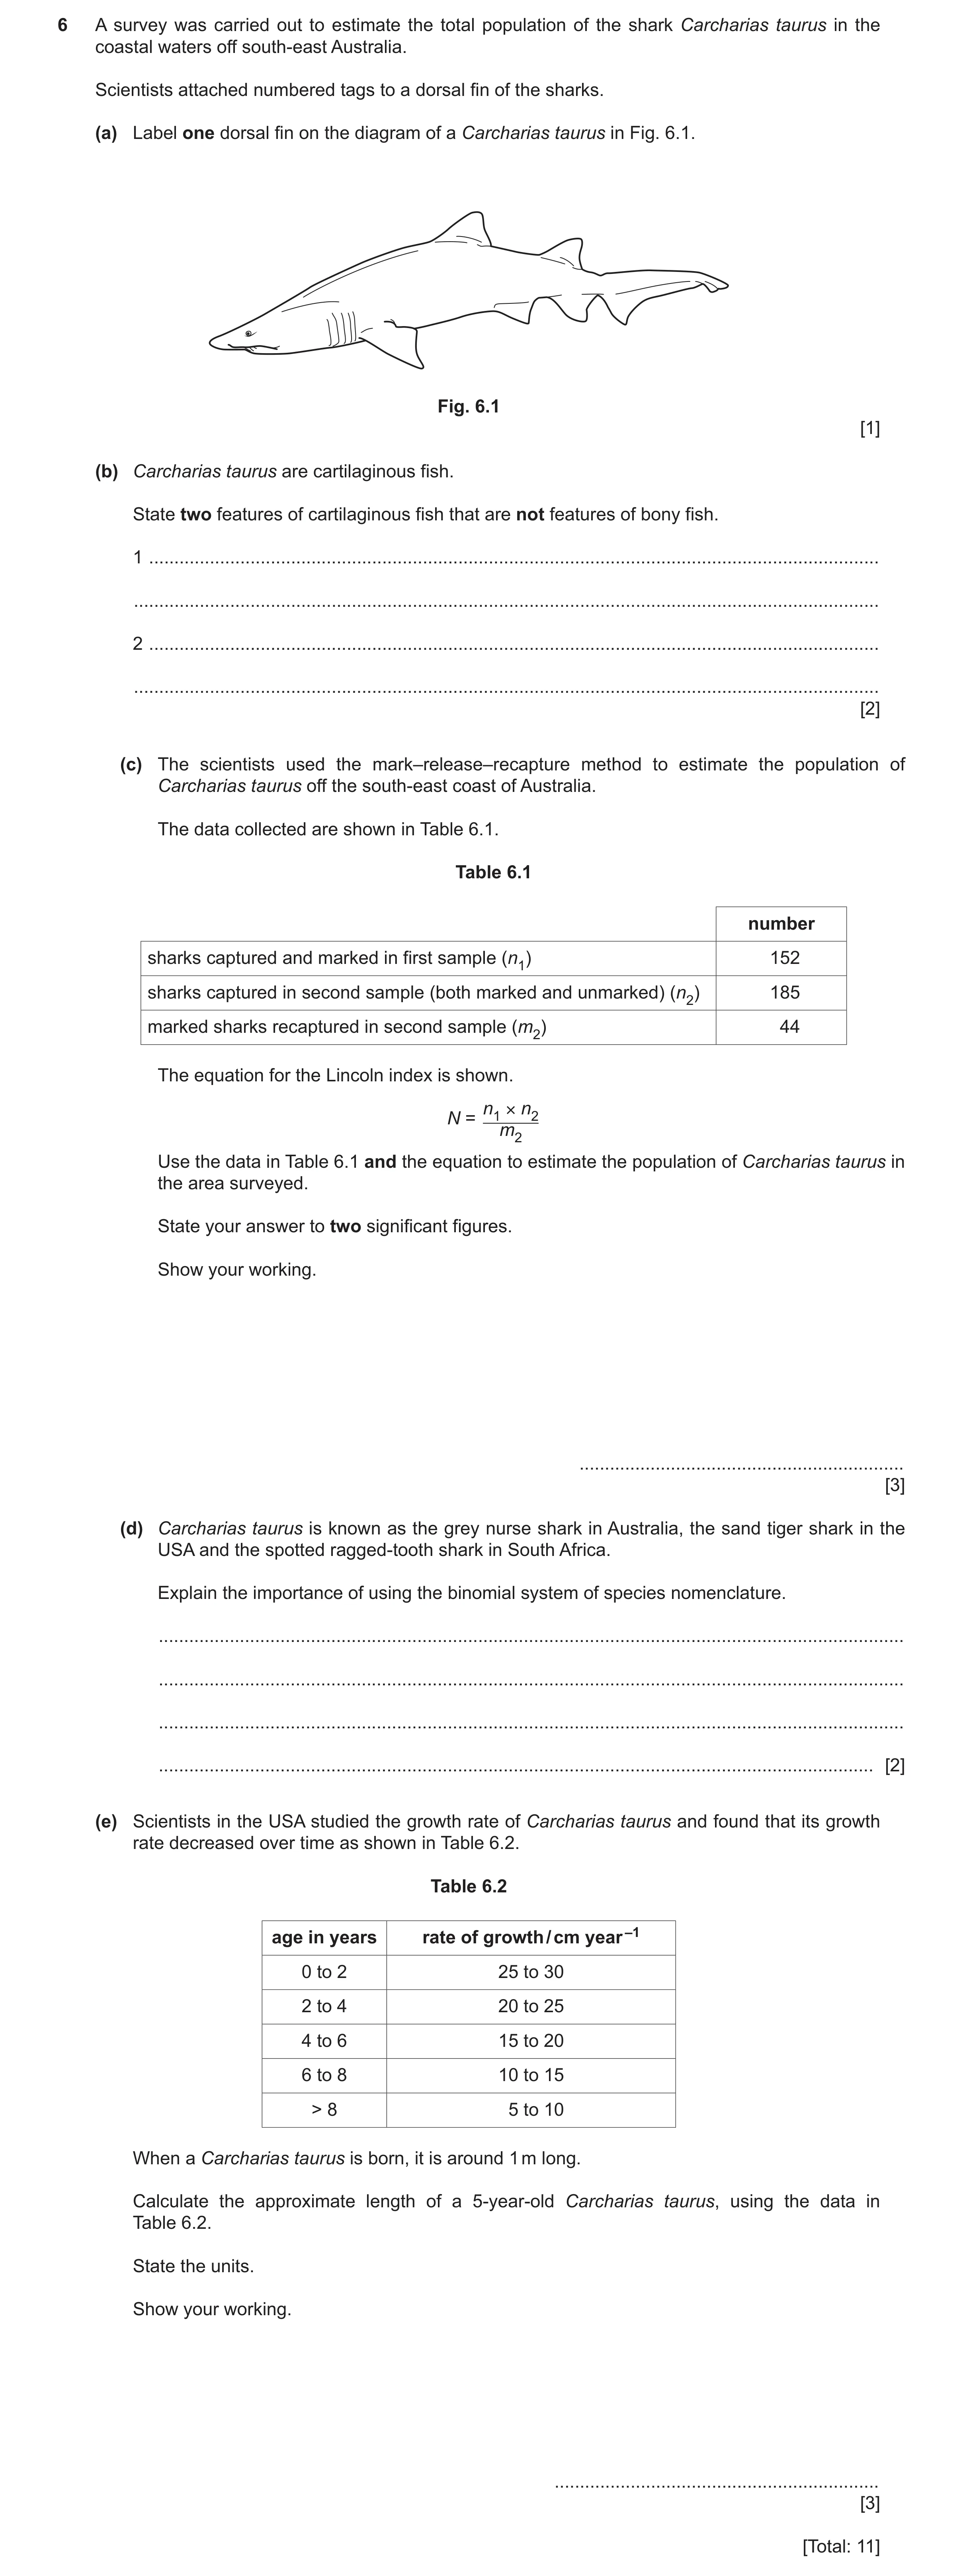
6 A survey was carried out to estimate the total population of the shark Carcharias taurus in the coastal waters off south-east Australia. Scientists attached numbered tags to a dorsal fin of the sharks. (a) Label one dorsal fin on the diagram of a Carcharias taurus in Fig. 6.1. Fig. 6.1 [1] (b) Carcharias taurus are cartilaginous fish. State two features of cartilaginous fish that are not features of bony fish. 1 … … 2 … … [2] (c) The scientists used the mark–release–recapture method to estimate the population of Carcharias taurus off the south-east coast of Australia. The data collected are shown in Table 6.1. Table 6.1 number sharks captured and marked in first sample (n1) 152 sharks captured in second sample (both marked and unmarked) (n2) 185 marked sharks recaptured in second sample (m2) 44 The equation for the Lincoln index is shown. N = n1 × n2 m2 Use the data in Table 6.1 and the equation to estimate the population of Carcharias taurus in the area surveyed. State your answer to two significant figures. Show your working. … [3] (d) Carcharias taurus is known as the grey nurse shark in Australia, the sand tiger shark in the USA and the spotted ragged-tooth shark in South Africa. Explain the importance of using the binomial system of species nomenclature. … … … … [2] (e) Scientists in the USA studied the growth rate of Carcharias taurus and found that its growth rate decreased over time as shown in Table 6.2. Table 6.2 age in years rate of growth / cm year –1 0 to 2 25 to 30 2 to 4 20 to 25 4 to 6 15 to 20 6 to 8 10 to 15 > 8 5 to 10 When a Carcharias taurus is born, it is around 1 m long. Calculate the approximate length of a 5-year-old Carcharias taurus, using the data in Table 6.2. State the units. Show your working. … [3] [Total: 11]
11 marks
Mark scheme: 6(a) correct label on one of two dorsal fins shown 1 6(b) any 2 from: 2 cartilaginous skeleton ; gill slits ; no swim bladder ; denticles ; 6(c) N = (152 185) / 44 ; 3 N = 639.090909 ; N = 640 ; 6(d) idea of consistent name used in all countries / languages ; 2 plus any 1 from: useful for comparing / sharing, scientific research ; idea it avoids confusion / problems / misunderstandings caused by using different names ; idea of useful for showing, classification / evolutionary relationships, with other organisms ; 6(e) working showing (100 cm +) appropriate gains in length ; 3 answer in range 205–230 (cm) / 2.050–2.30 (m) ; correct units for answer given ;
This question in 9693/21 Oct/Nov 2024
Q6 · A brittle star which belongs to the echinoderm phylum 9693/22 Oct/Nov 2024
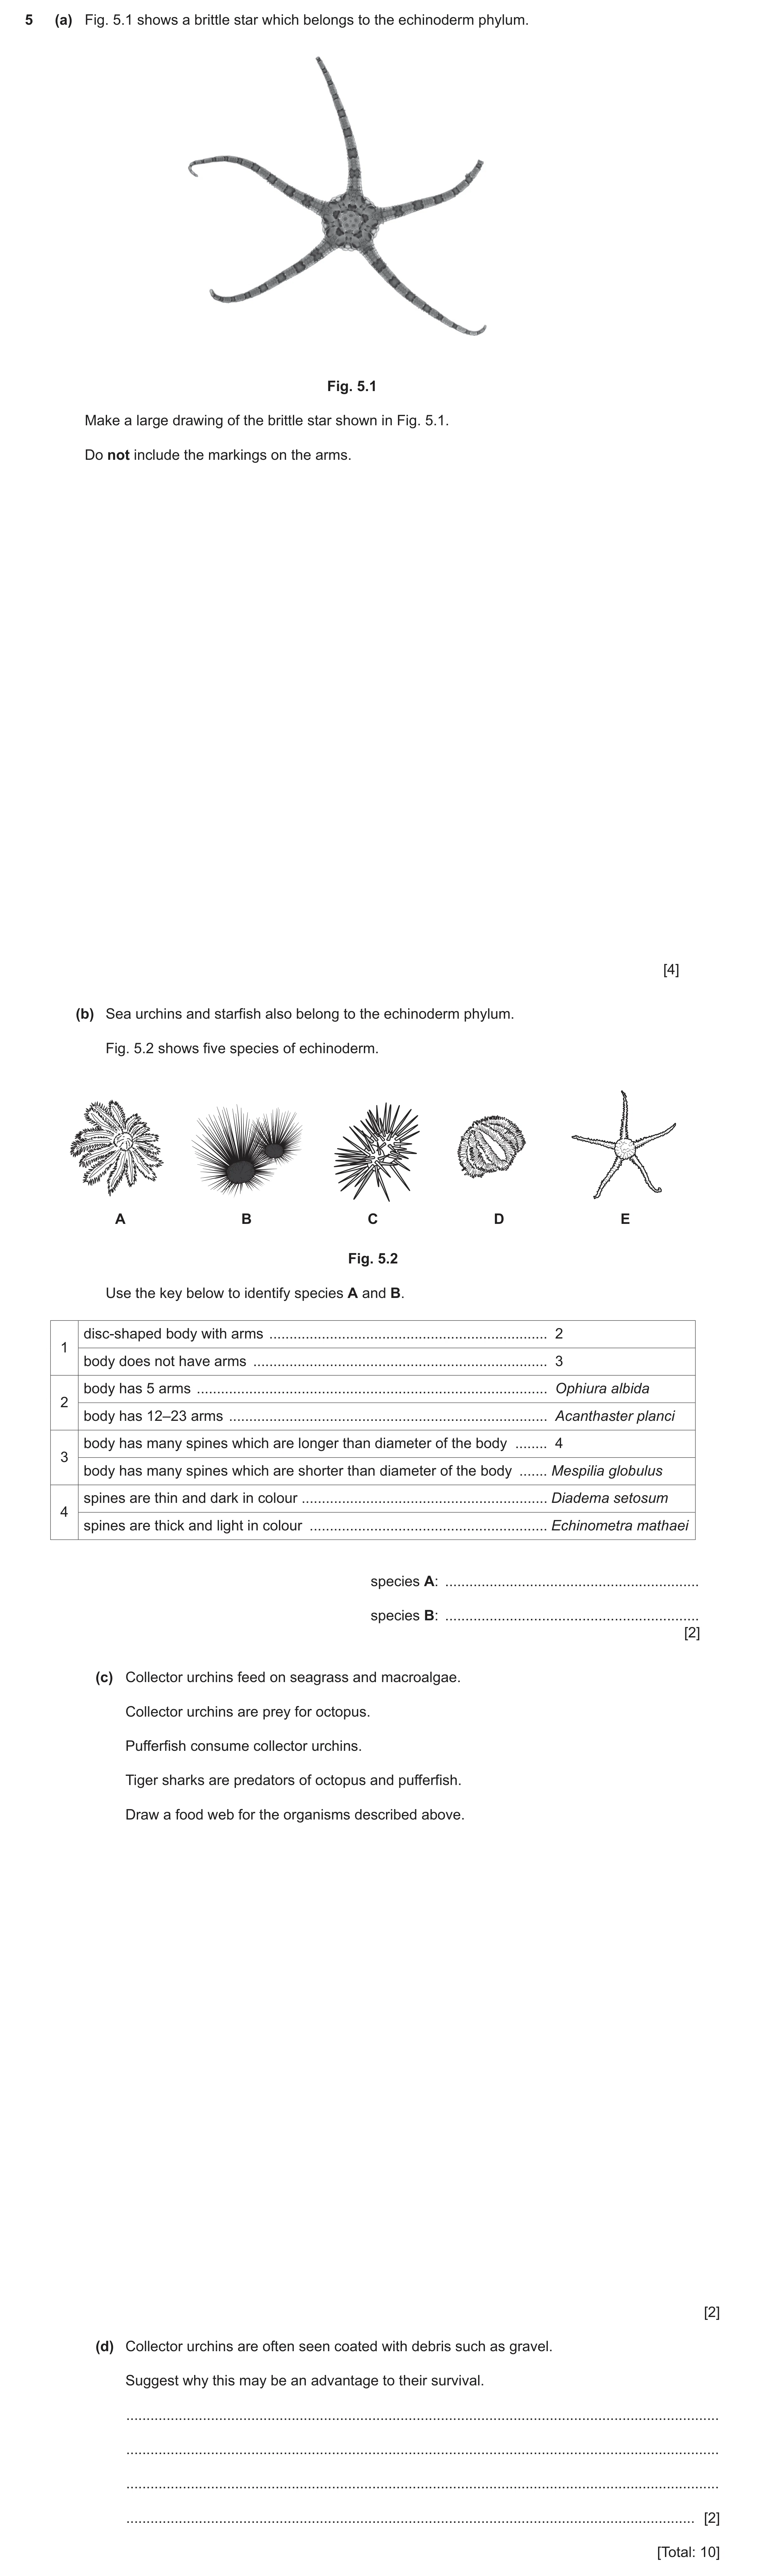
5 (a) Fig. 5.1 shows a brittle star which belongs to the echinoderm phylum. Fig. 5.1 Make a large drawing of the brittle star shown in Fig. 5.1. Do not include the markings on the arms. [4] (b) Sea urchins and starfish also belong to the echinoderm phylum. Fig. 5.2 shows five species of echinoderm. A B C D E Fig. 5.2 Use the key below to identify species A and B. disc-shaped body with arms … 2 1 body does not have arms … 3 body has 5 arms … Ophiura albida 2 body has 12–23 arms … Acanthaster planci body has many spines which are longer than diameter of the body … 4 3 body has many spines which are shorter than diameter of the body … Mespilia globulus spines are thin and dark in colour … Diadema setosum 4 spines are thick and light in colour … Echinometra mathaei species A: … species B: … [2] (c) Collector urchins feed on seagrass and macroalgae. Collector urchins are prey for octopus. Pufferfish consume collector urchins. Tiger sharks are predators of octopus and pufferfish. Draw a food web for the organisms described above. [2] (d) Collector urchins are often seen coated with debris such as gravel. Suggest why this may be an advantage to their survival. … … … … [2] [Total: 10]
10 marks
Mark scheme: 5(a) quality of outline (thin and continuous) in pencil ; 4 suitable size (at least as large as the photo) ; proportion (angles, length of arms, centre diameter) ; detail (minimum 2 out of the 3 curls on end of 3 arms circled) ; 5(b) Species A: Acanthaster planci ; 2 Species B: Diadema setosum ; 5(c) either: 2 for all six organisms correctly linked with 6 arrows in right direction ;; OR: food web of six organisms correct organisms with 6 lines / incorrect direction of arrows ; OR: food web of five correct organisms with correct direction of arrows ; OR: food web of six organisms correct organisms with correct direction of five arrows ; 5(d) idea of camouflage from / less likely to be seen ; 2 (so less likely to be seen / eaten) by predators / octopus / puffer fish ;
This question in 9693/22 Oct/Nov 2024
Q7 · A survey was carried out to estimate the total population of the shark Carcharias taurus… 9693/22 Oct/Nov 2024
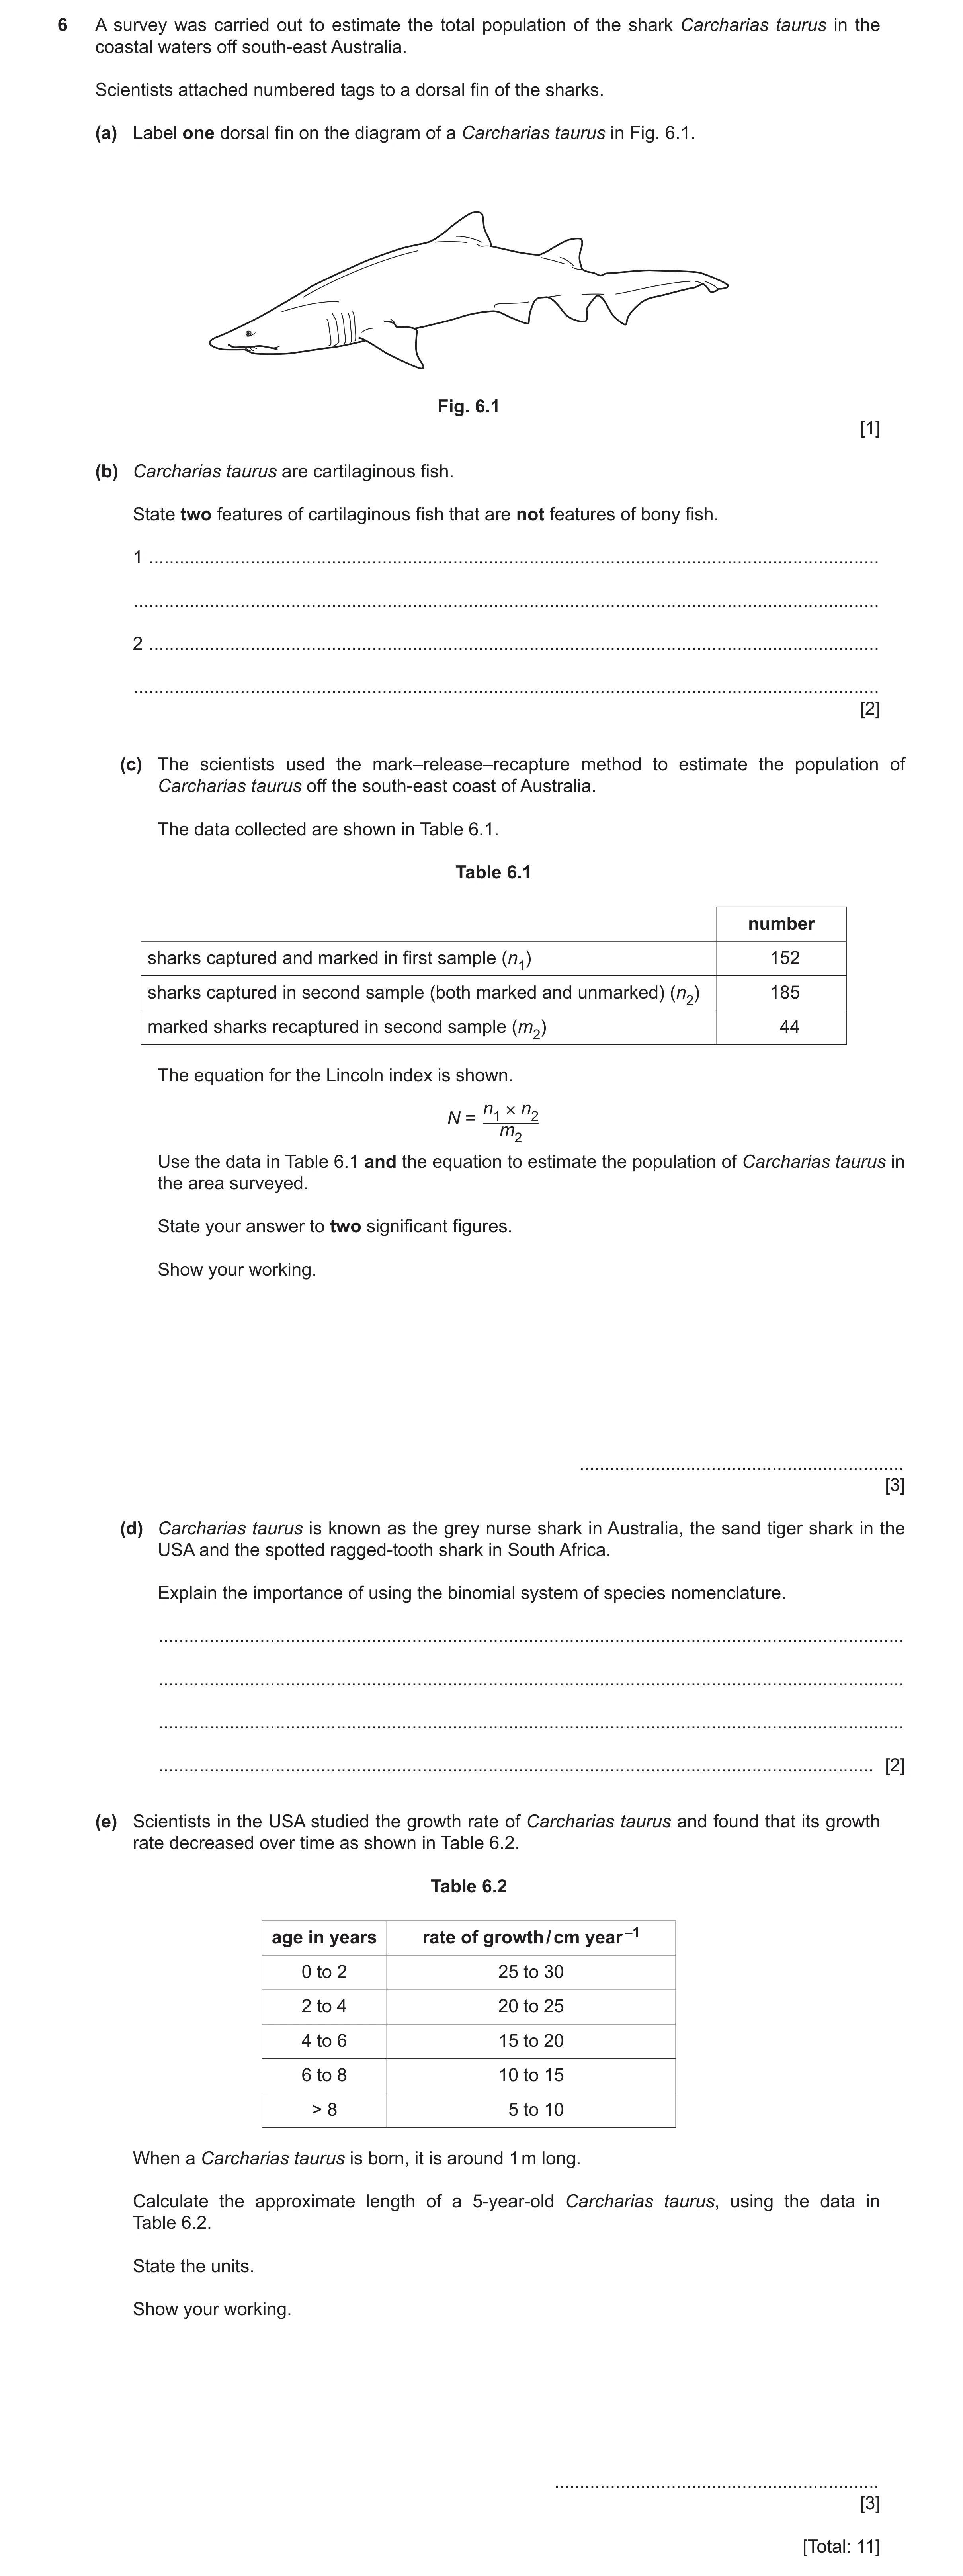
6 A survey was carried out to estimate the total population of the shark Carcharias taurus in the coastal waters off south-east Australia. Scientists attached numbered tags to a dorsal fin of the sharks. (a) Label one dorsal fin on the diagram of a Carcharias taurus in Fig. 6.1. Fig. 6.1 [1] (b) Carcharias taurus are cartilaginous fish. State two features of cartilaginous fish that are not features of bony fish. 1 … … 2 … … [2] (c) The scientists used the mark–release–recapture method to estimate the population of Carcharias taurus off the south-east coast of Australia. The data collected are shown in Table 6.1. Table 6.1 number sharks captured and marked in first sample (n1) 152 sharks captured in second sample (both marked and unmarked) (n2) 185 marked sharks recaptured in second sample (m2) 44 The equation for the Lincoln index is shown. N = n1 × n2 m2 Use the data in Table 6.1 and the equation to estimate the population of Carcharias taurus in the area surveyed. State your answer to two significant figures. Show your working. … [3] (d) Carcharias taurus is known as the grey nurse shark in Australia, the sand tiger shark in the USA and the spotted ragged-tooth shark in South Africa. Explain the importance of using the binomial system of species nomenclature. … … … … [2] (e) Scientists in the USA studied the growth rate of Carcharias taurus and found that its growth rate decreased over time as shown in Table 6.2. Table 6.2 age in years rate of growth / cm year –1 0 to 2 25 to 30 2 to 4 20 to 25 4 to 6 15 to 20 6 to 8 10 to 15 > 8 5 to 10 When a Carcharias taurus is born, it is around 1 m long. Calculate the approximate length of a 5-year-old Carcharias taurus, using the data in Table 6.2. State the units. Show your working. … [3] [Total: 11]
11 marks
Mark scheme: 6(a) correct label on one of two dorsal fins shown 1 6(b) any 2 from: 2 cartilaginous skeleton ; gill slits ; no swim bladder ; denticles ; 6(c) N = (152 185) / 44 ; 3 N = 639.090909 ; N = 640 ; 6(d) idea of consistent name used in all countries / languages ; 2 plus any 1 from: useful for comparing / sharing, scientific research ; idea it avoids confusion / problems / misunderstandings caused by using different names ; idea of useful for showing, classification / evolutionary relationships, with other organisms ; 6(e) working showing (100 cm +) appropriate gains in length ; 3 answer in range 205–230 (cm) / 2.050–2.30 (m) ; correct units for answer given ;
This question in 9693/22 Oct/Nov 2024
Q8 · A brittle star which belongs to the echinoderm phylum 9693/23 Oct/Nov 2024
5 (a) Fig. 5.1 shows a brittle star which belongs to the echinoderm phylum. Fig. 5.1 Make a large drawing of the brittle star shown in Fig. 5.1. Do not include the markings on the arms. [4] (b) Sea urchins and starfish also belong to the echinoderm phylum. Fig. 5.2 shows five species of echinoderm. A B C D E Fig. 5.2 Use the key below to identify species A and B. disc-shaped body with arms … 2 1 body does not have arms … 3 body has 5 arms … Ophiura albida 2 body has 12–23 arms … Acanthaster planci body has many spines which are longer than diameter of the body … 4 3 body has many spines which are shorter than diameter of the body … Mespilia globulus spines are thin and dark in colour … Diadema setosum 4 spines are thick and light in colour … Echinometra mathaei species A: … species B: … [2] (c) Collector urchins feed on seagrass and macroalgae. Collector urchins are prey for octopus. Pufferfish consume collector urchins. Tiger sharks are predators of octopus and pufferfish. Draw a food web for the organisms described above. [2] (d) Collector urchins are often seen coated with debris such as gravel. Suggest why this may be an advantage to their survival. … … … … [2] [Total: 10]
10 marks
Mark scheme: 5(a) quality of outline (thin and continuous) in pencil ; 4 suitable size (at least as large as the photo) ; proportion (angles, length of arms, centre diameter) ; detail (minimum 2 out of the 3 curls on end of 3 arms circled) ; 5(b) Species A: Acanthaster planci ; 2 Species B: Diadema setosum ; 5(c) either: 2 for all six organisms correctly linked with 6 arrows in right direction ;; OR: food web of six organisms correct organisms with 6 lines / incorrect direction of arrows ; OR: food web of five correct organisms with correct direction of arrows ; OR: food web of six organisms correct organisms with correct direction of five arrows ; 5(d) idea of camouflage from / less likely to be seen ; 2 (so less likely to be seen / eaten) by predators / octopus / puffer fish ;
This question in 9693/23 Oct/Nov 2024
Q9 · A survey was carried out to estimate the total population of the shark Carcharias taurus… 9693/23 Oct/Nov 2024
6 A survey was carried out to estimate the total population of the shark Carcharias taurus in the coastal waters off south-east Australia. Scientists attached numbered tags to a dorsal fin of the sharks. (a) Label one dorsal fin on the diagram of a Carcharias taurus in Fig. 6.1. Fig. 6.1 [1] (b) Carcharias taurus are cartilaginous fish. State two features of cartilaginous fish that are not features of bony fish. 1 … … 2 … … [2] (c) The scientists used the mark–release–recapture method to estimate the population of Carcharias taurus off the south-east coast of Australia. The data collected are shown in Table 6.1. Table 6.1 number sharks captured and marked in first sample (n1) 152 sharks captured in second sample (both marked and unmarked) (n2) 185 marked sharks recaptured in second sample (m2) 44 The equation for the Lincoln index is shown. N = n1 × n2 m2 Use the data in Table 6.1 and the equation to estimate the population of Carcharias taurus in the area surveyed. State your answer to two significant figures. Show your working. … [3] (d) Carcharias taurus is known as the grey nurse shark in Australia, the sand tiger shark in the USA and the spotted ragged-tooth shark in South Africa. Explain the importance of using the binomial system of species nomenclature. … … … … [2] (e) Scientists in the USA studied the growth rate of Carcharias taurus and found that its growth rate decreased over time as shown in Table 6.2. Table 6.2 age in years rate of growth / cm year –1 0 to 2 25 to 30 2 to 4 20 to 25 4 to 6 15 to 20 6 to 8 10 to 15 > 8 5 to 10 When a Carcharias taurus is born, it is around 1 m long. Calculate the approximate length of a 5-year-old Carcharias taurus, using the data in Table 6.2. State the units. Show your working. … [3] [Total: 11]
11 marks
Mark scheme: 6(a) correct label on one of two dorsal fins shown 1 6(b) any 2 from: 2 cartilaginous skeleton ; gill slits ; no swim bladder ; denticles ; 6(c) N = (152 185) / 44 ; 3 N = 639.090909 ; N = 640 ; 6(d) idea of consistent name used in all countries / languages ; 2 plus any 1 from: useful for comparing / sharing, scientific research ; idea it avoids confusion / problems / misunderstandings caused by using different names ; idea of useful for showing, classification / evolutionary relationships, with other organisms ; 6(e) working showing (100 cm +) appropriate gains in length ; 3 answer in range 205–230 (cm) / 2.050–2.30 (m) ; correct units for answer given ;
This question in 9693/23 Oct/Nov 2024
Q10 · Some copepods are parasites of marine fish 9693/21 May/June 2025
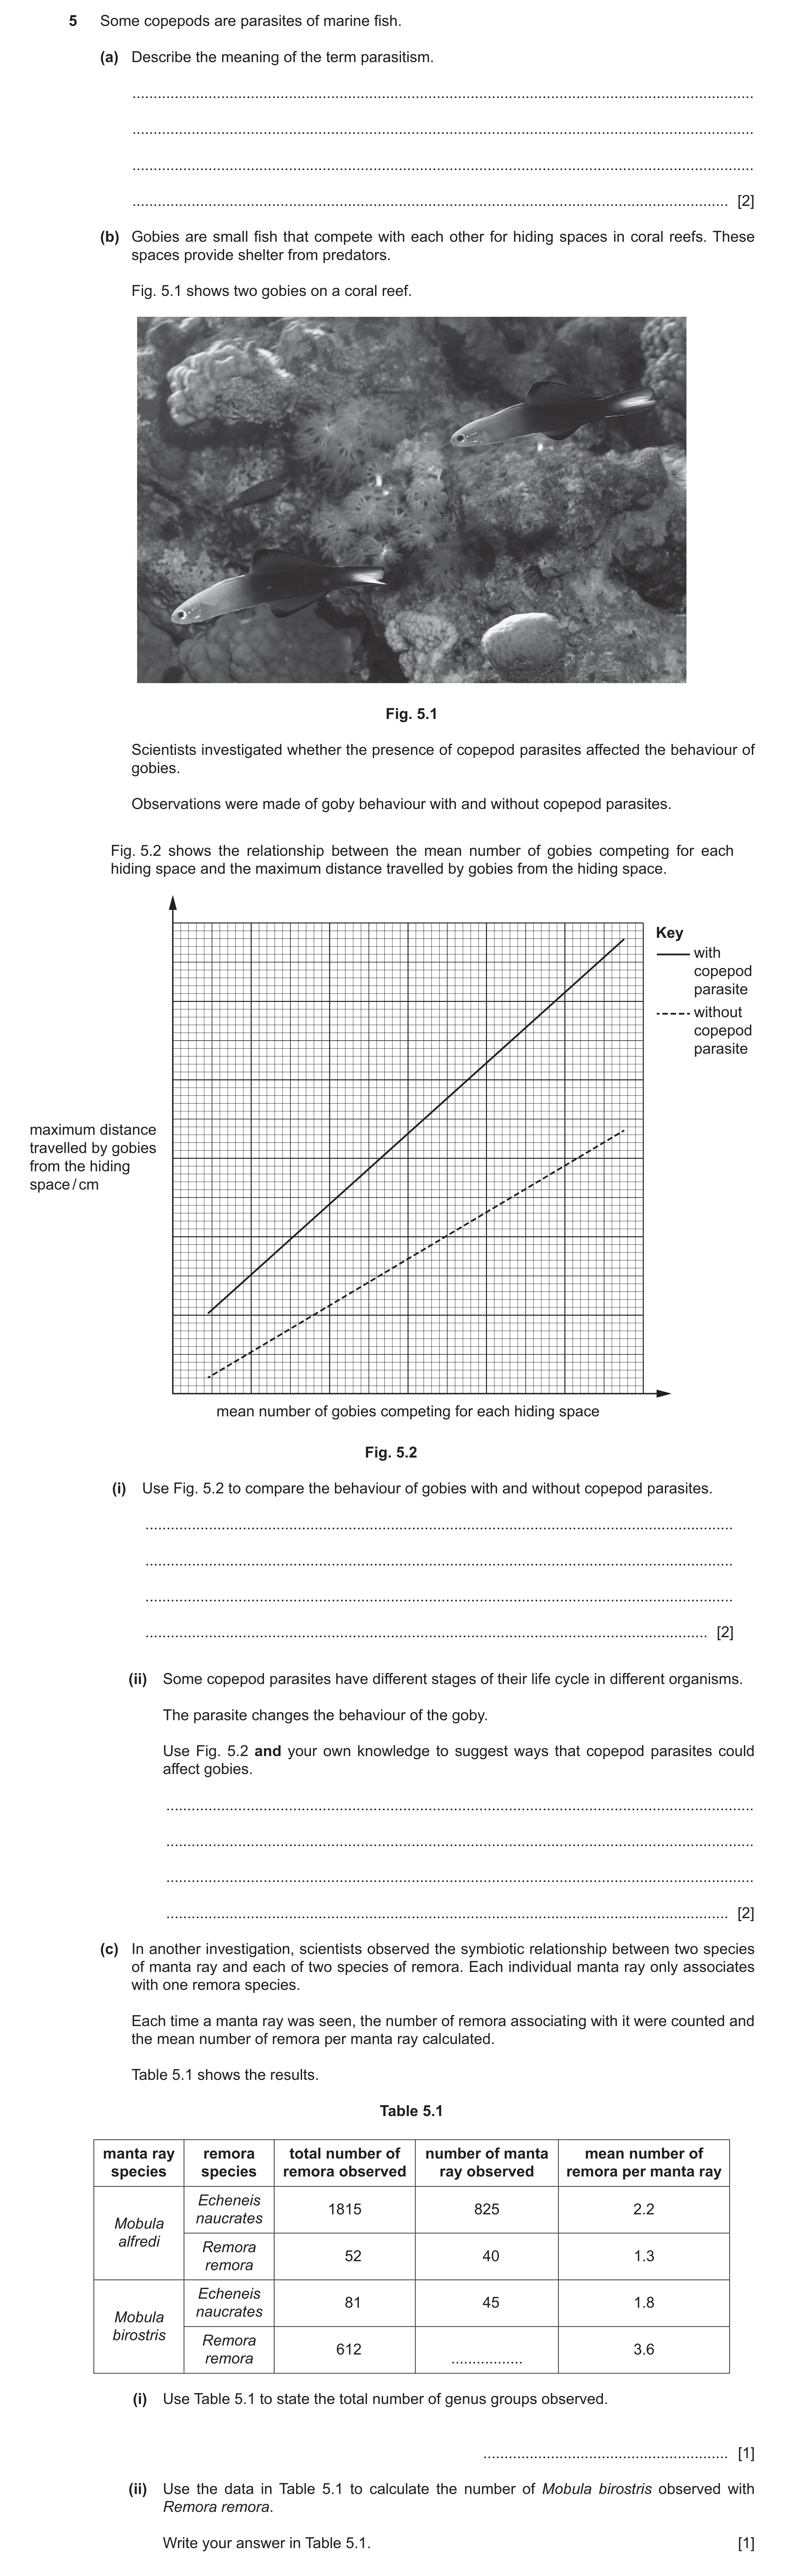
5 Some copepods are parasites of marine fish. (a) Describe the meaning of the term parasitism. … … … … [2] (b) Gobies are small fish that compete with each other for hiding spaces in coral reefs. These spaces provide shelter from predators. Fig. 5.1 shows two gobies on a coral reef. Fig. 5.1 Scientists investigated whether the presence of copepod parasites affected the behaviour of gobies. Observations were made of goby behaviour with and without copepod parasites. Fig. 5.2 shows the relationship between the mean number of gobies competing for each hiding space and the maximum distance travelled by gobies from the hiding space. Key with copepod parasite without copepod parasite maximum distance travelled by gobies from the hiding space / cm mean number of gobies competing for each hiding space Fig. 5.2 (i) Use Fig. 5.2 to compare the behaviour of gobies with and without copepod parasites. … … … … [2] (ii) Some copepod parasites have different stages of their life cycle in different organisms. The parasite changes the behaviour of the goby. Use Fig. 5.2 and your own knowledge to suggest ways that copepod parasites could affect gobies. … … … … [2] (c) In another investigation, scientists observed the symbiotic relationship between two species of manta ray and each of two species of remora. Each individual manta ray only associates with one remora species. Each time a manta ray was seen, the number of remora associating with it were counted and the mean number of remora per manta ray calculated. Table 5.1 shows the results. Table 5.1 manta ray remora total number of number of manta mean number of species species remora observed ray observed remora per manta ray Echeneis 1815 825 2.2 naucrates Mobula alfredi Remora 52 40 1.3 remora Echeneis 81 45 1.8 naucrates Mobula birostris Remora 612 3.6 remora … (i) Use Table 5.1 to state the total number of genus groups observed. … [1] (ii) Use the data in Table 5.1 to calculate the number of Mobula birostris observed with Remora remora. Write your answer in Table 5.1. [1]
8 marks
Mark scheme: 5(a) one organism lives, in / on, another organism ; 2 (parasite) gains benefit AND (host) organism is, harmed / disadvantaged ; 5(b)(i) any two from: 2 idea that gobies with parasites travelled further ORA ; idea that as (mean no of) gobies competing for each hiding space increases the distance travelled increases (both with and without parasites) ORA ; idea that difference in maximum distance travelled by gobies (with parasite) increases with increasing mean number competing per hiding place ORA ; 5(b)(ii) any two from: 2 1 reduces energy available, for growth / reproduction / disrupts physiological processes ; 2 (behaviour changes) to travel further to find, an (alternative) hiding space / food / need to eat more / to reach more favourable conditions for the copepod ; 3 resulting in smaller gobies ; 4 increases chance of (goby) predation ; 5(c)(i) 3 ; 1 5(c)(ii) (612 / 3.6) = 170 ; 1 5(c)(iii) correct manipulation of data ;; 4 plus MAX three from: Echeneis naucrates (EN) associated more with Mobula alfredi (MA) OR Mobula alfredi (MA) associated more with Echeneis naucrates (EN) ; Remora remora (RR) associated more with Mobula birostris (MB) OR Mobula birostris (MB) associated more with Remora remora (RR) ; Mobula birostris (MB) has more remora (in total) compared to Mobula alfredi (MA) ; sample sizes vary considerably ;
This question in 9693/21 May/June 2025
Q11 · Organisms are classified in a taxonomic hierarchy 9693/21 Oct/Nov 2025
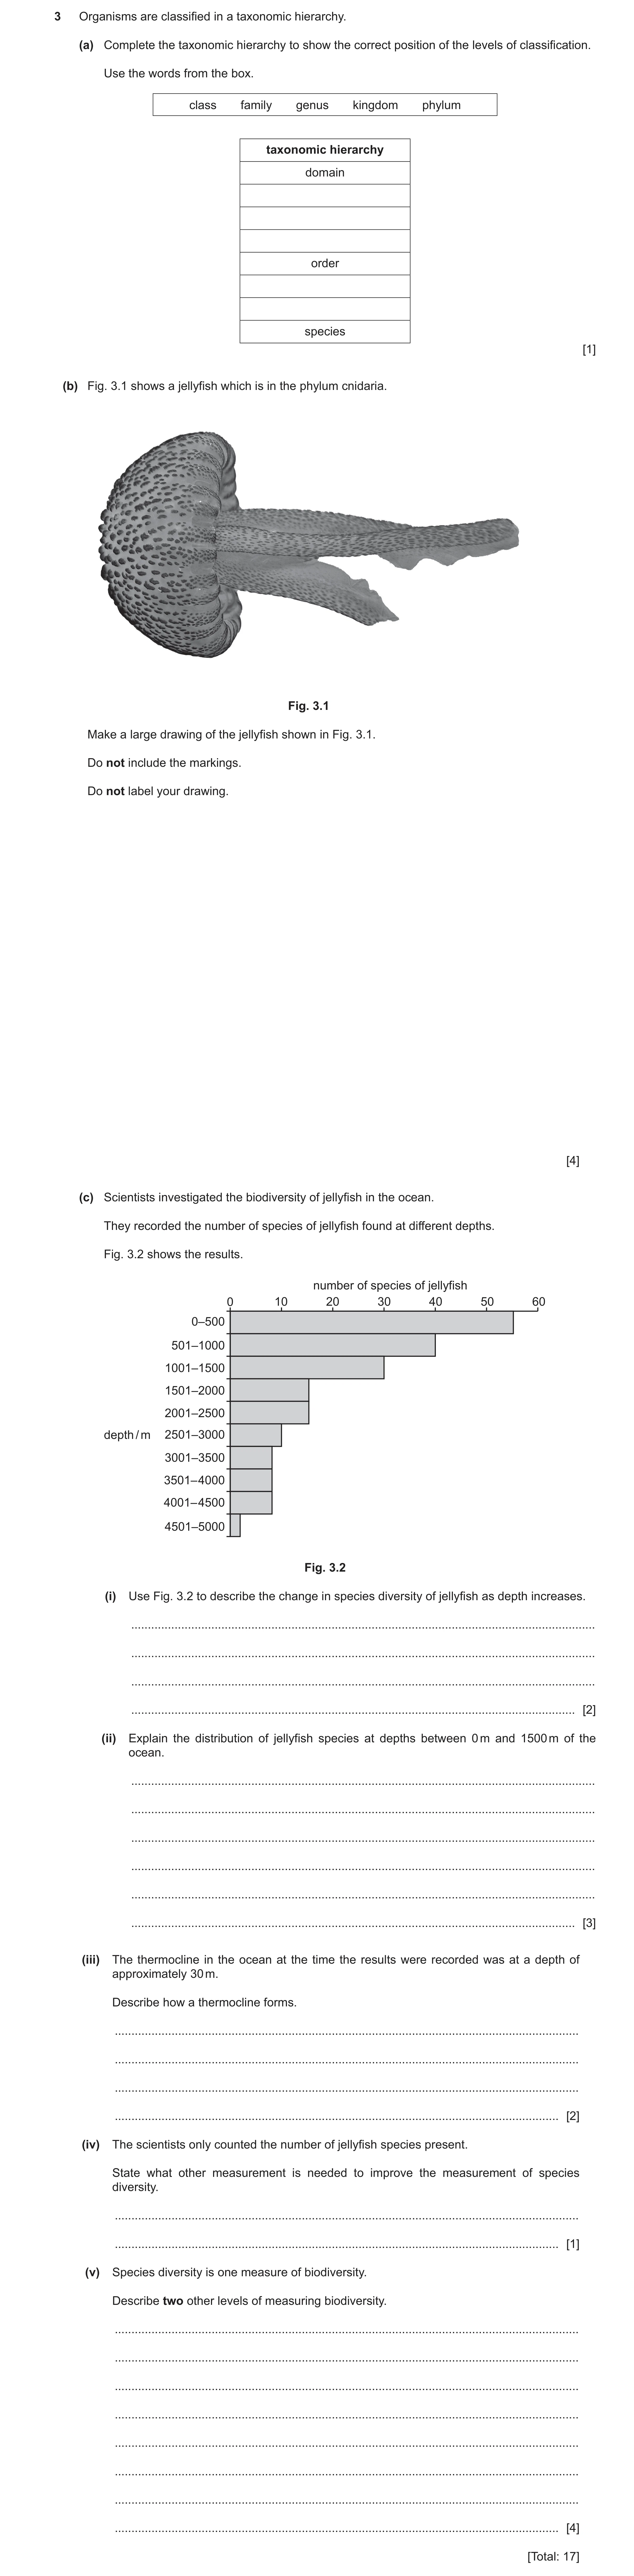
3 Organisms are classified in a taxonomic hierarchy. (a) Complete the taxonomic hierarchy to show the correct position of the levels of classification. Use the words from the box. class family genus kingdom phylum taxonomic hierarchy domain order species [1] (b) Fig. 3.1 shows a jellyfish which is in the phylum cnidaria. Fig. 3.1 Make a large drawing of the jellyfish shown in Fig. 3.1. Do not include the markings. Do not label your drawing. [4] (c) Scientists investigated the biodiversity of jellyfish in the ocean. They recorded the number of species of jellyfish found at different depths. Fig. 3.2 shows the results. number of species of jellyfish 0 10 20 30 40 50 60 0–500 501–1000 1001–1500 1501–2000 2001–2500 depth / m 2501–3000 3001–3500 3501– 4000 4001– 4500 4501–5000 Fig. 3.2 (i) Use Fig. 3.2 to describe the change in species diversity of jellyfish as depth increases. … … … … [2] (ii) Explain the distribution of jellyfish species at depths between 0 m and 1500 m of the ocean. … … … … … … [3] (iii) The thermocline in the ocean at the time the results were recorded was at a depth of approximately 30 m. Describe how a thermocline forms. … … … … [2] (iv) The scientists only counted the number of jellyfish species present. State what other measurement is needed to improve the measurement of species diversity. … … [1] (v) Species diversity is one measure of biodiversity. Describe two other levels of measuring biodiversity. … … … … … … … … [4] [Total: 17]
17 marks
Mark scheme: 3(a) 1 taxonomic hierarchy domain kingdom phylum class order family genus species 3(b) outline: unbroken lines in pencil and no shading ; 4 size: most of the space provided and at least as big as original picture ; in proportion ; detail – 3 (or 4) tentacles with the upper tentacles overlapping and tentacles going into the bell ; 3(c)(i) (as depth increases) species richness / number of species, decreases ; 2 plus any one from: (species richness) declines fastest in the first 1500 m / levels off below 1500 m ; correct manipulation of data ; 3(c)(ii) any three from: 3 1 food chains begin with phytoplankton found in surface layer ; 2 phytoplankton need light for photosynthesis ; 3 jellyfish, are consumers / eat animals, (that feed on phytoplankton) ; 4 limited motility / drift in currents so can’t move great distances to obtain food ; 5 vertical migrations / found below 500 m , to reduce being predated in light ; 6 ref. to decrease in temperature with increasing depth ; 7 AVP ; 3(c)(iii) any two from: 2 water at the surface heated (by energy form the sun) ; decreases the density of surface water ; reduced mixing with cooler, denser water below ; 3(c)(iv) idea of population (of each species) ; 1 3(c)(v) genetic diversity ; 4 (genetic diversity) variation in the genes of a species ; ecological diversity ; (ecological diversity) variation in ecosystems (on a regional and global level) ;
This question in 9693/21 Oct/Nov 2025
 16
16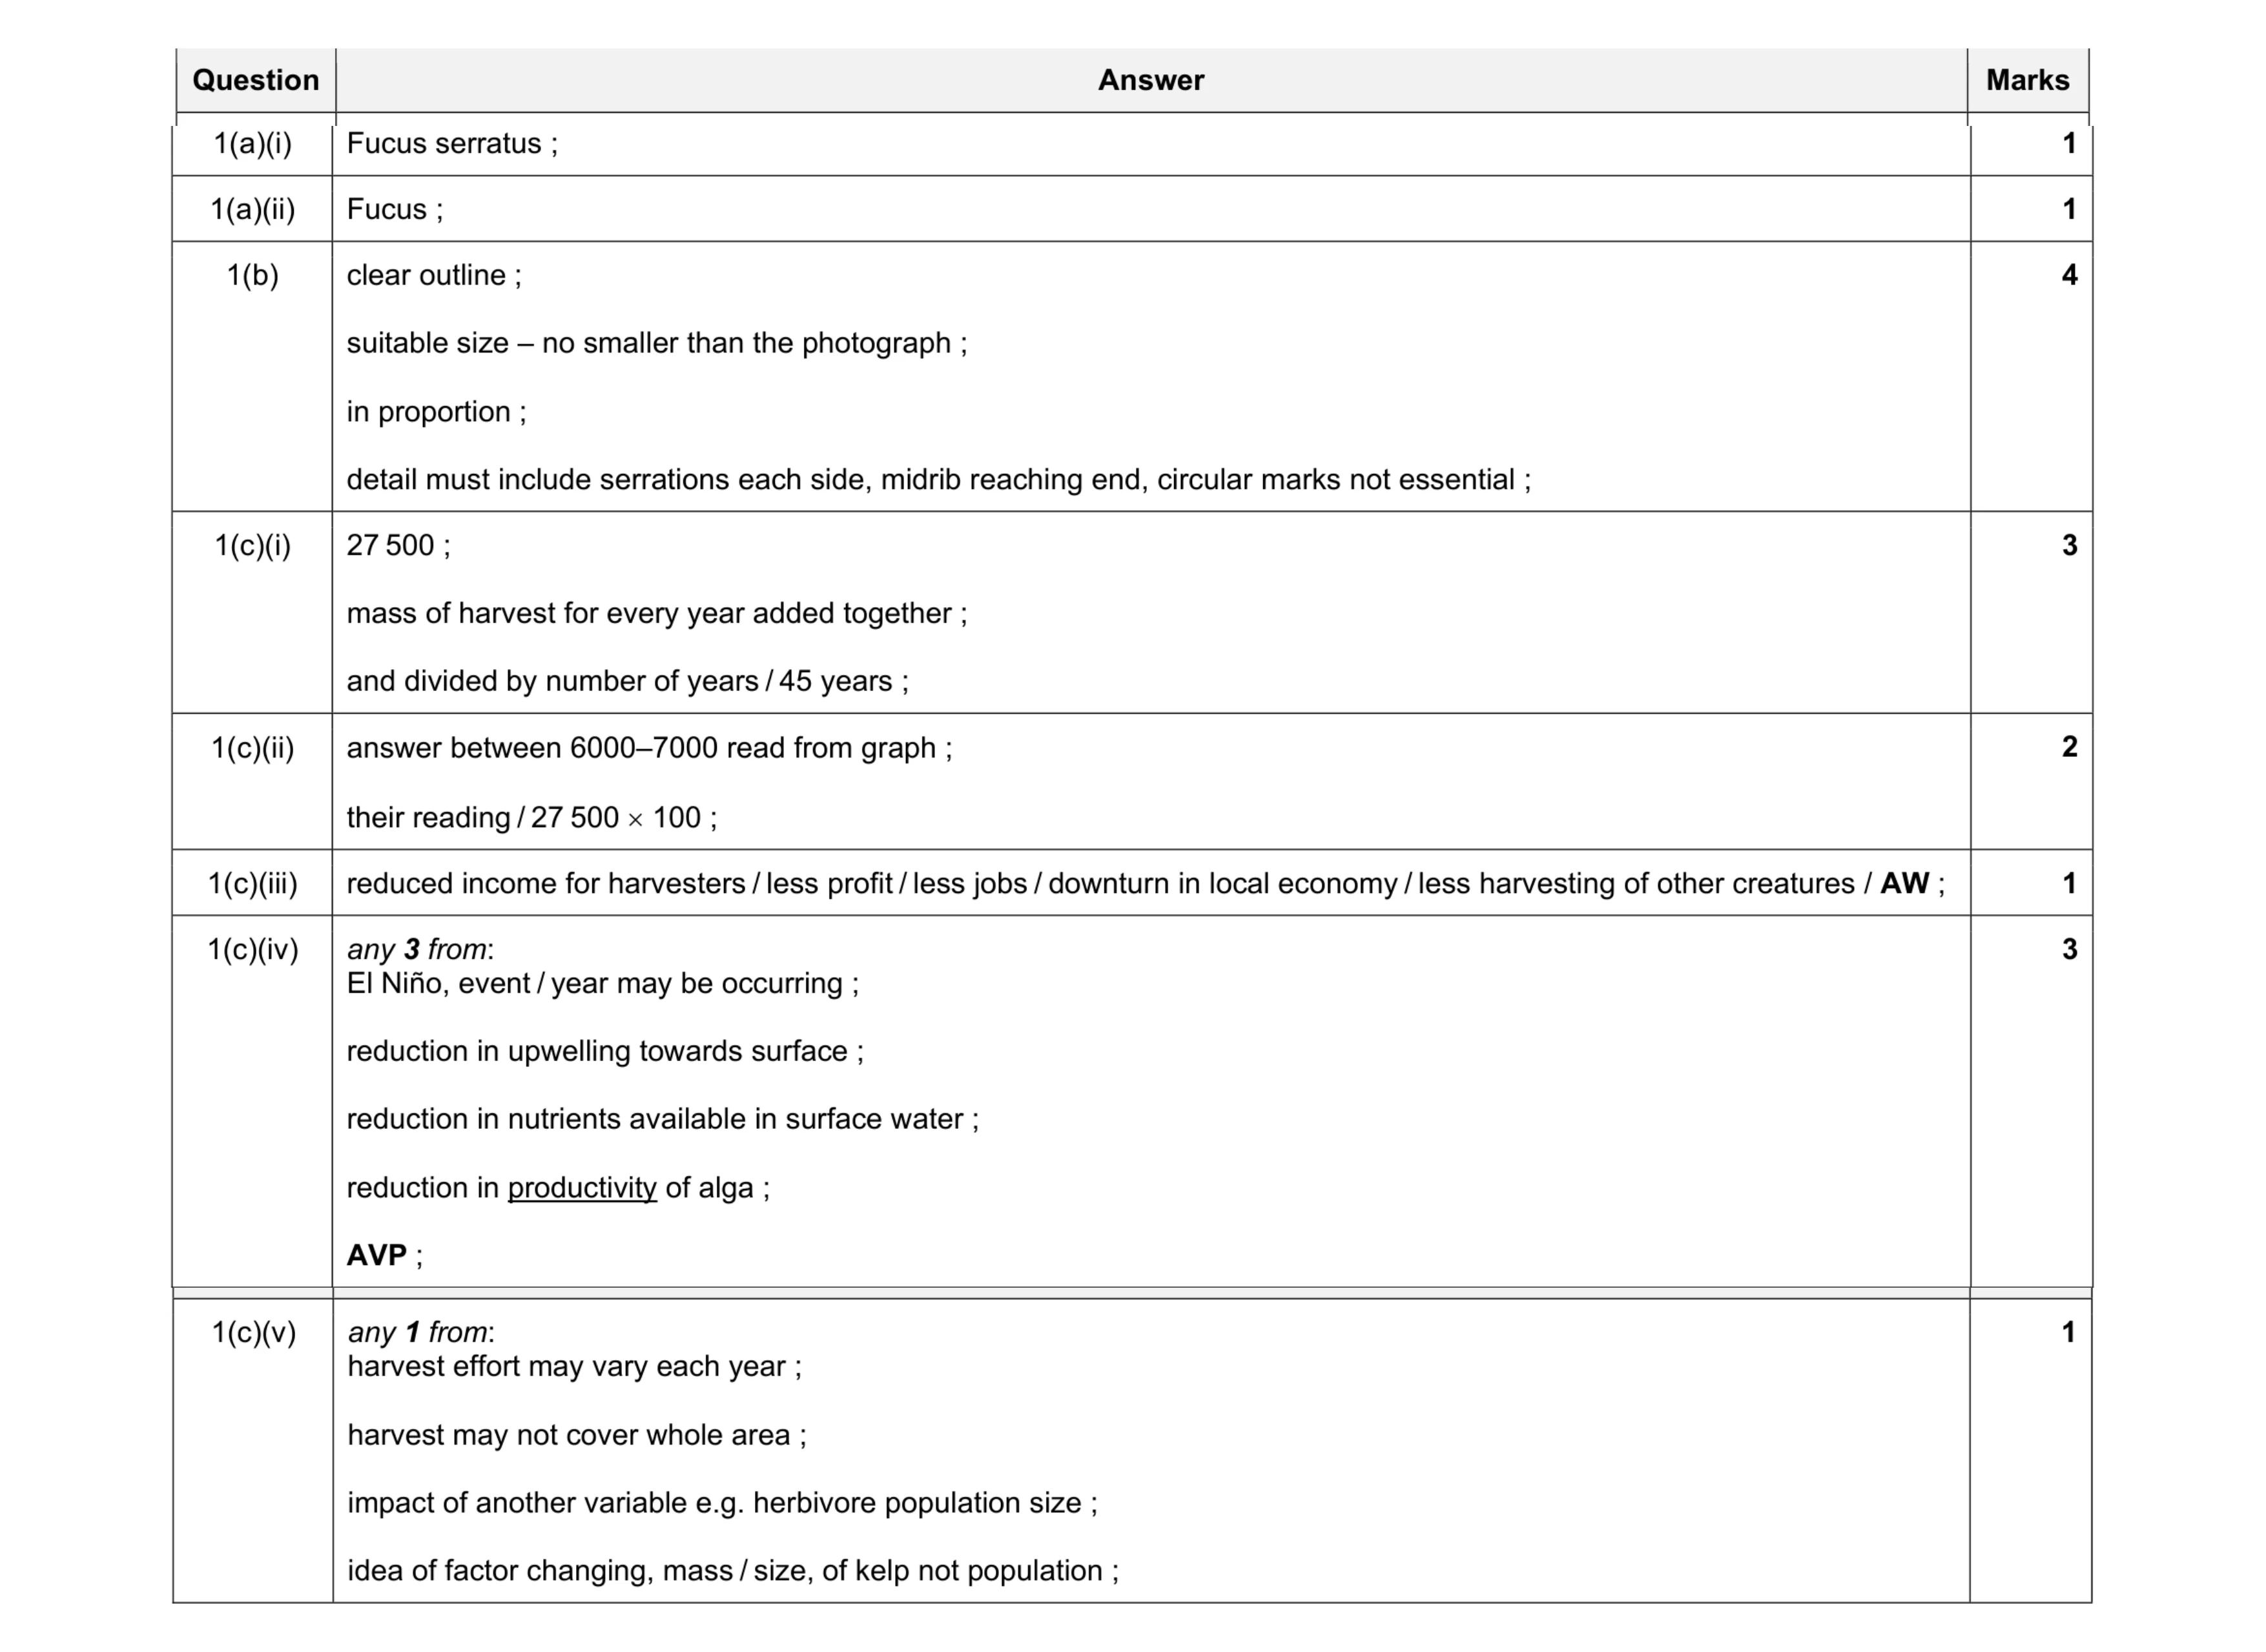 16
16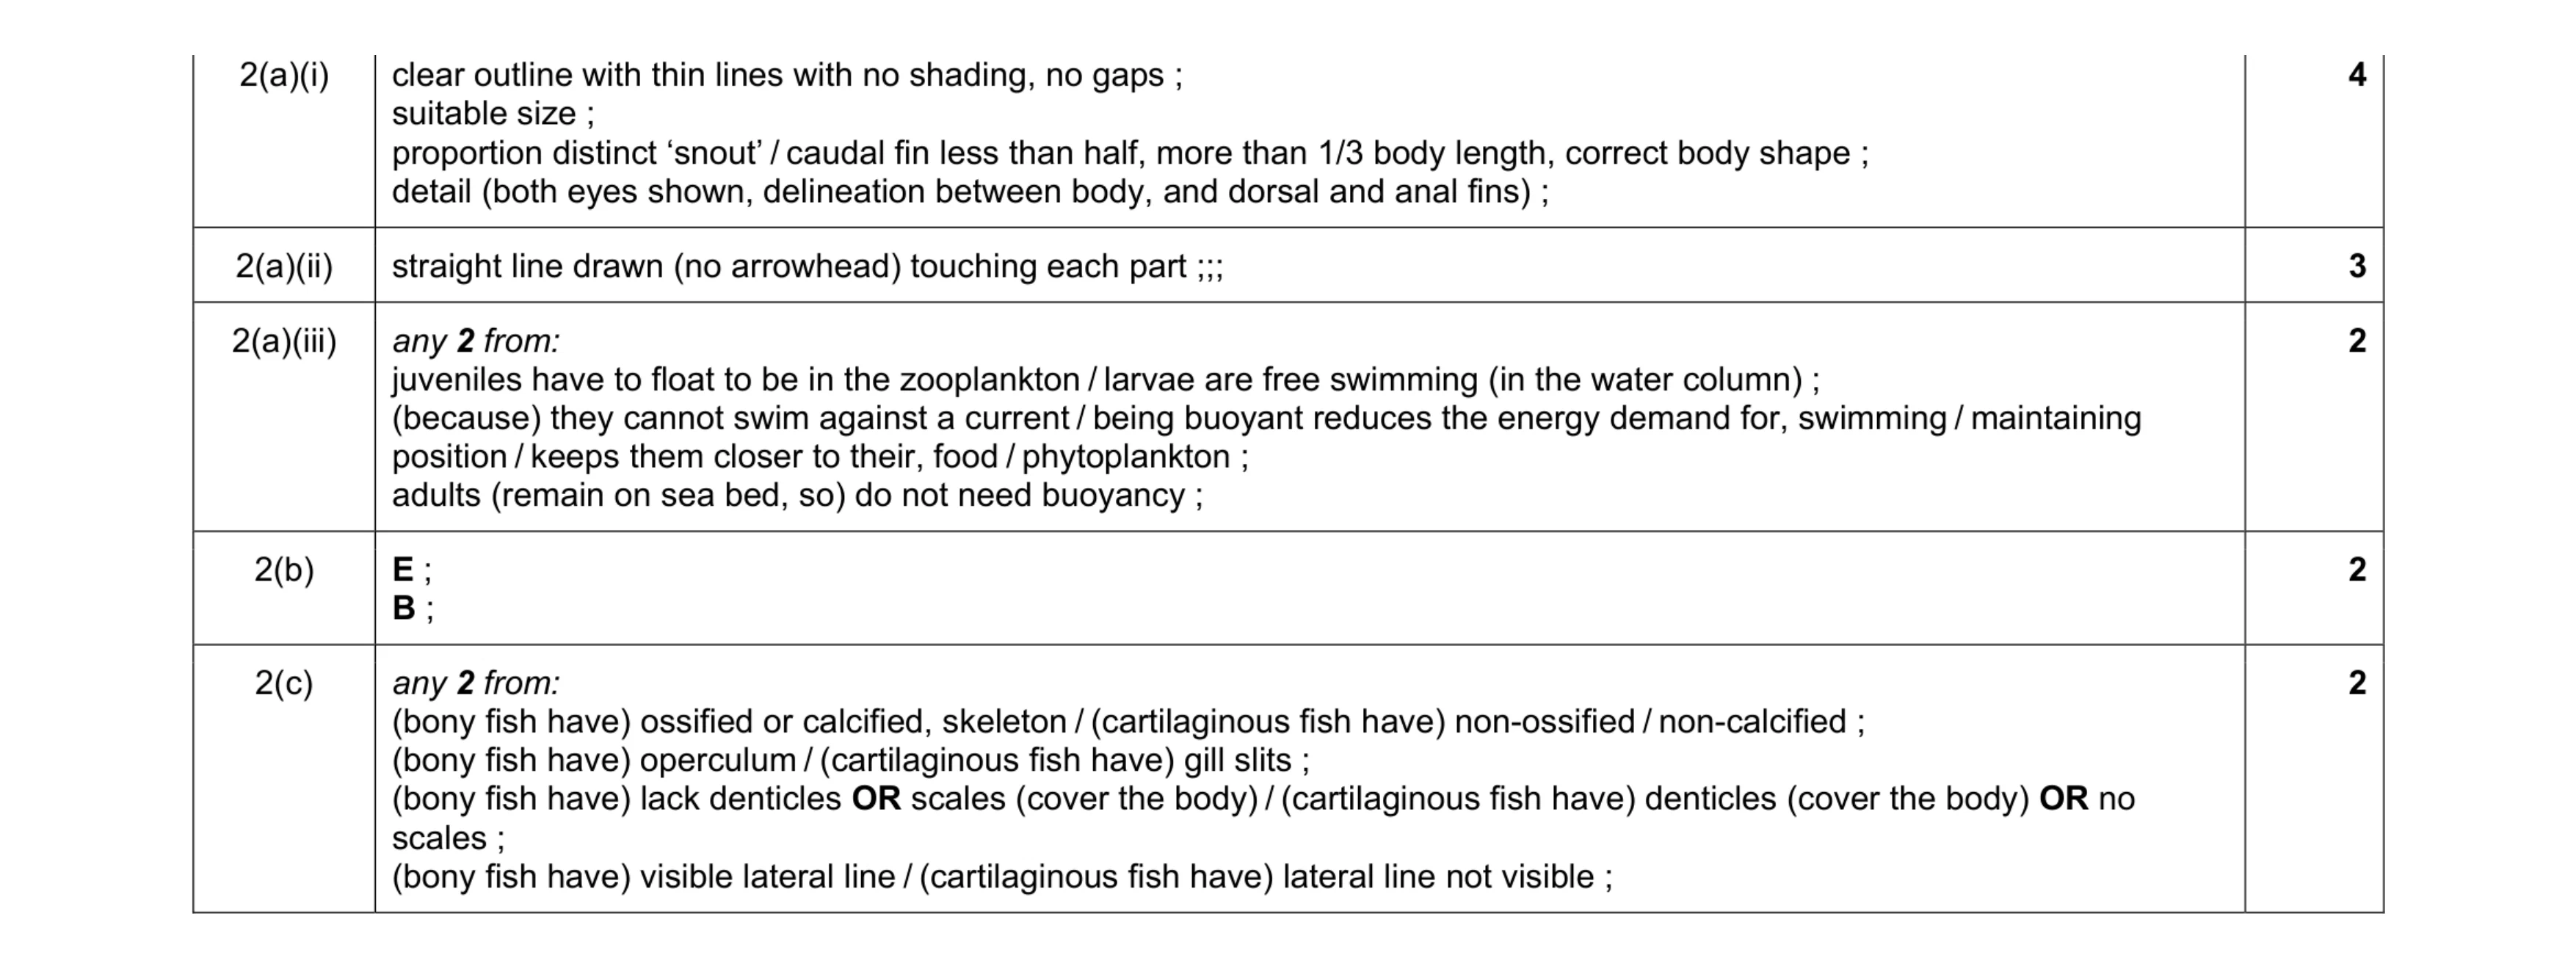 13
13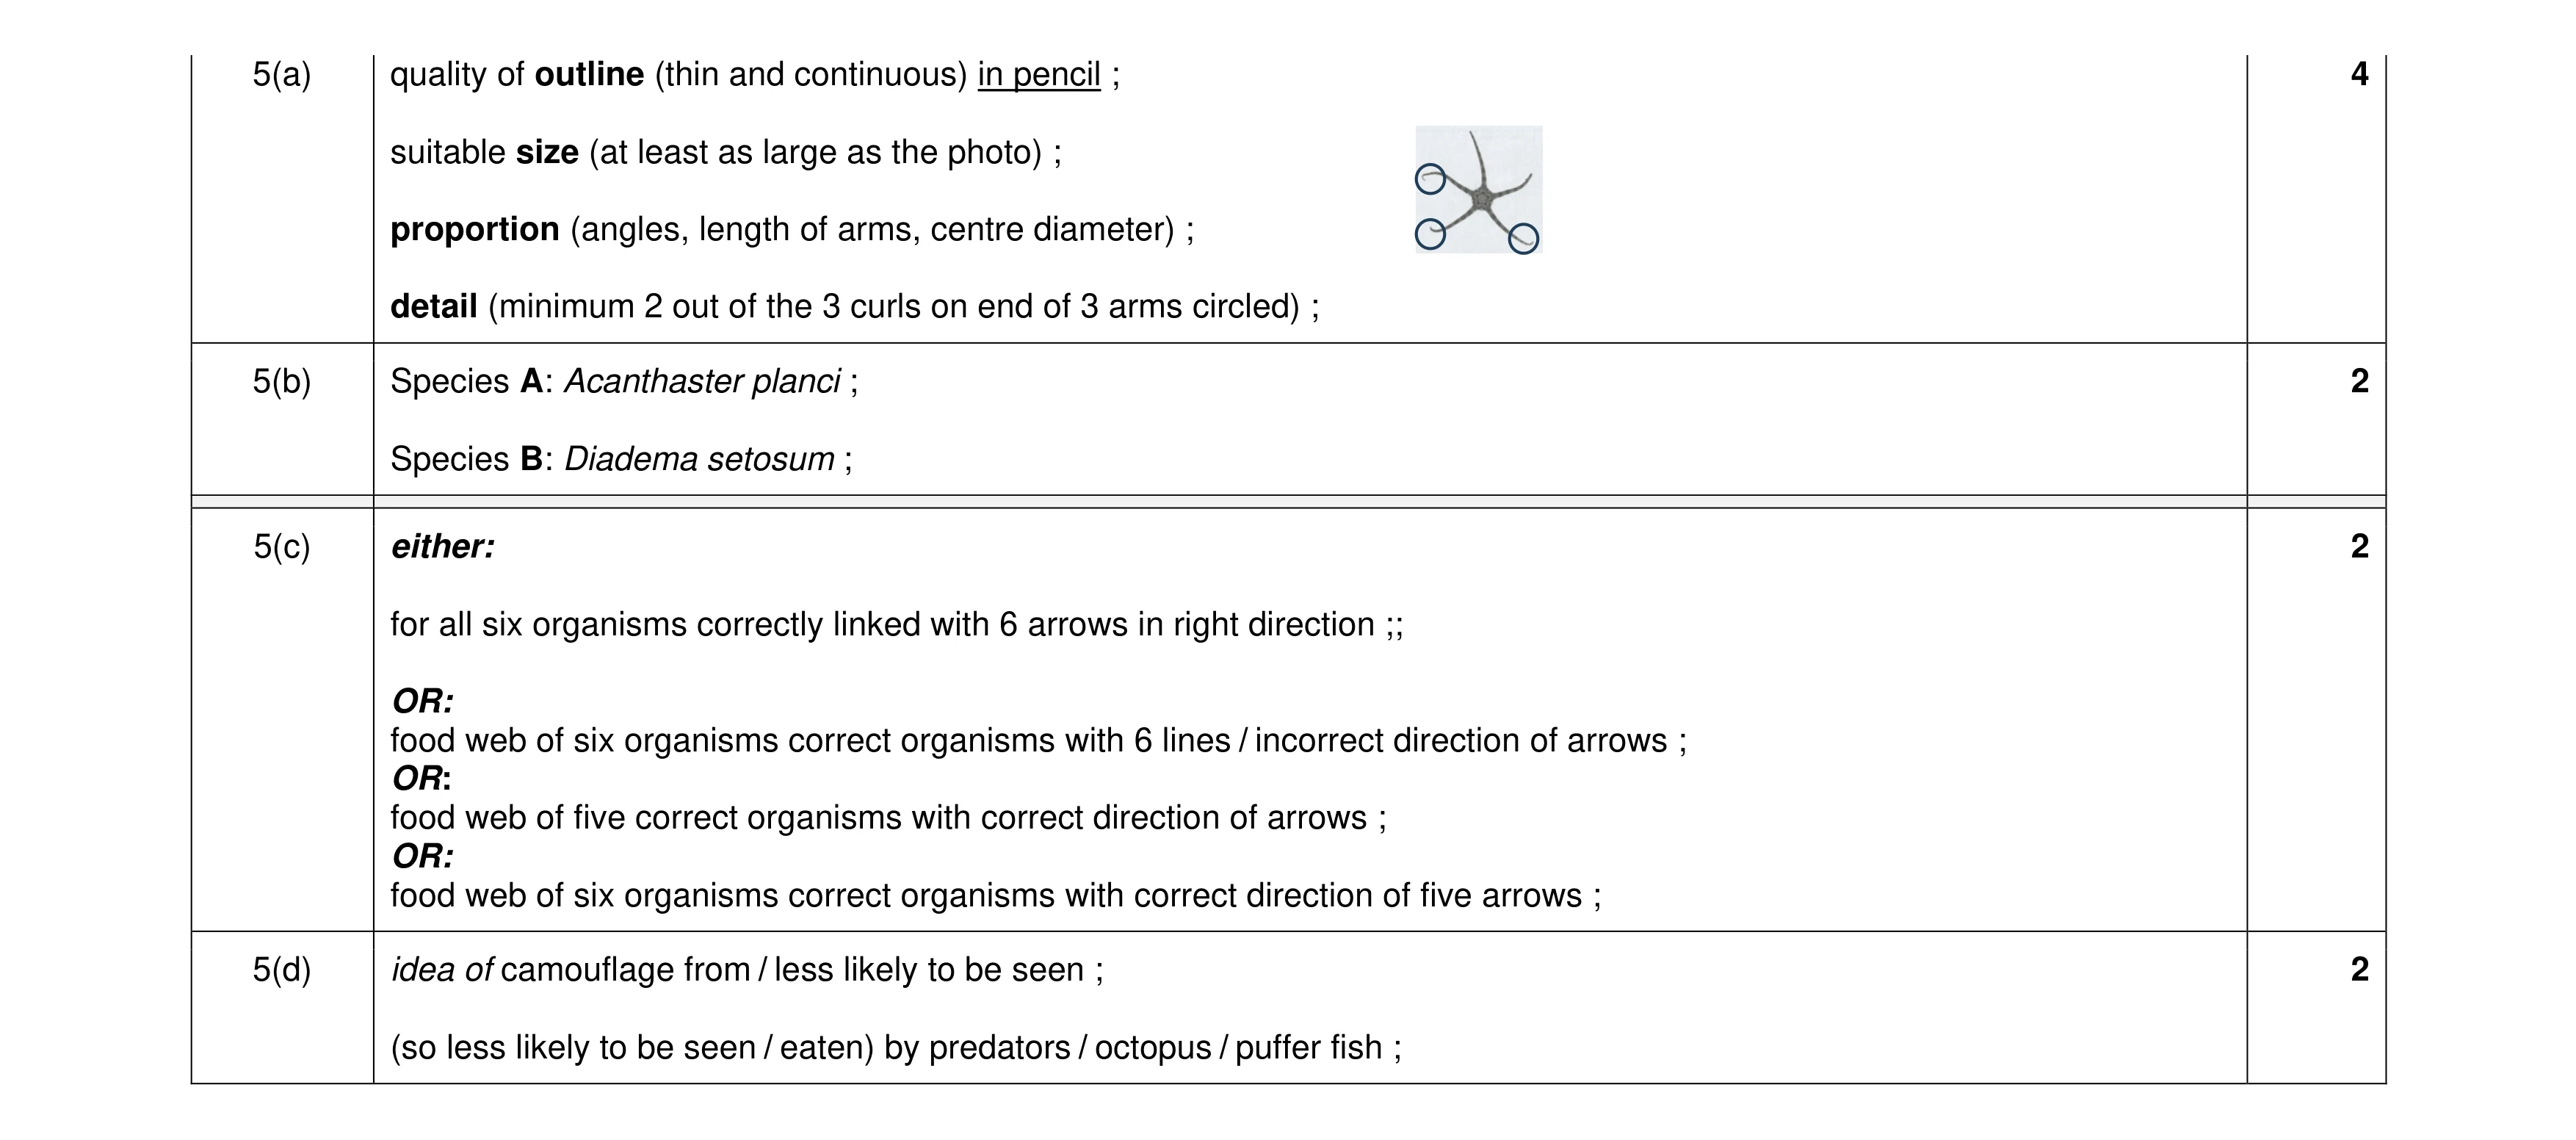 10
10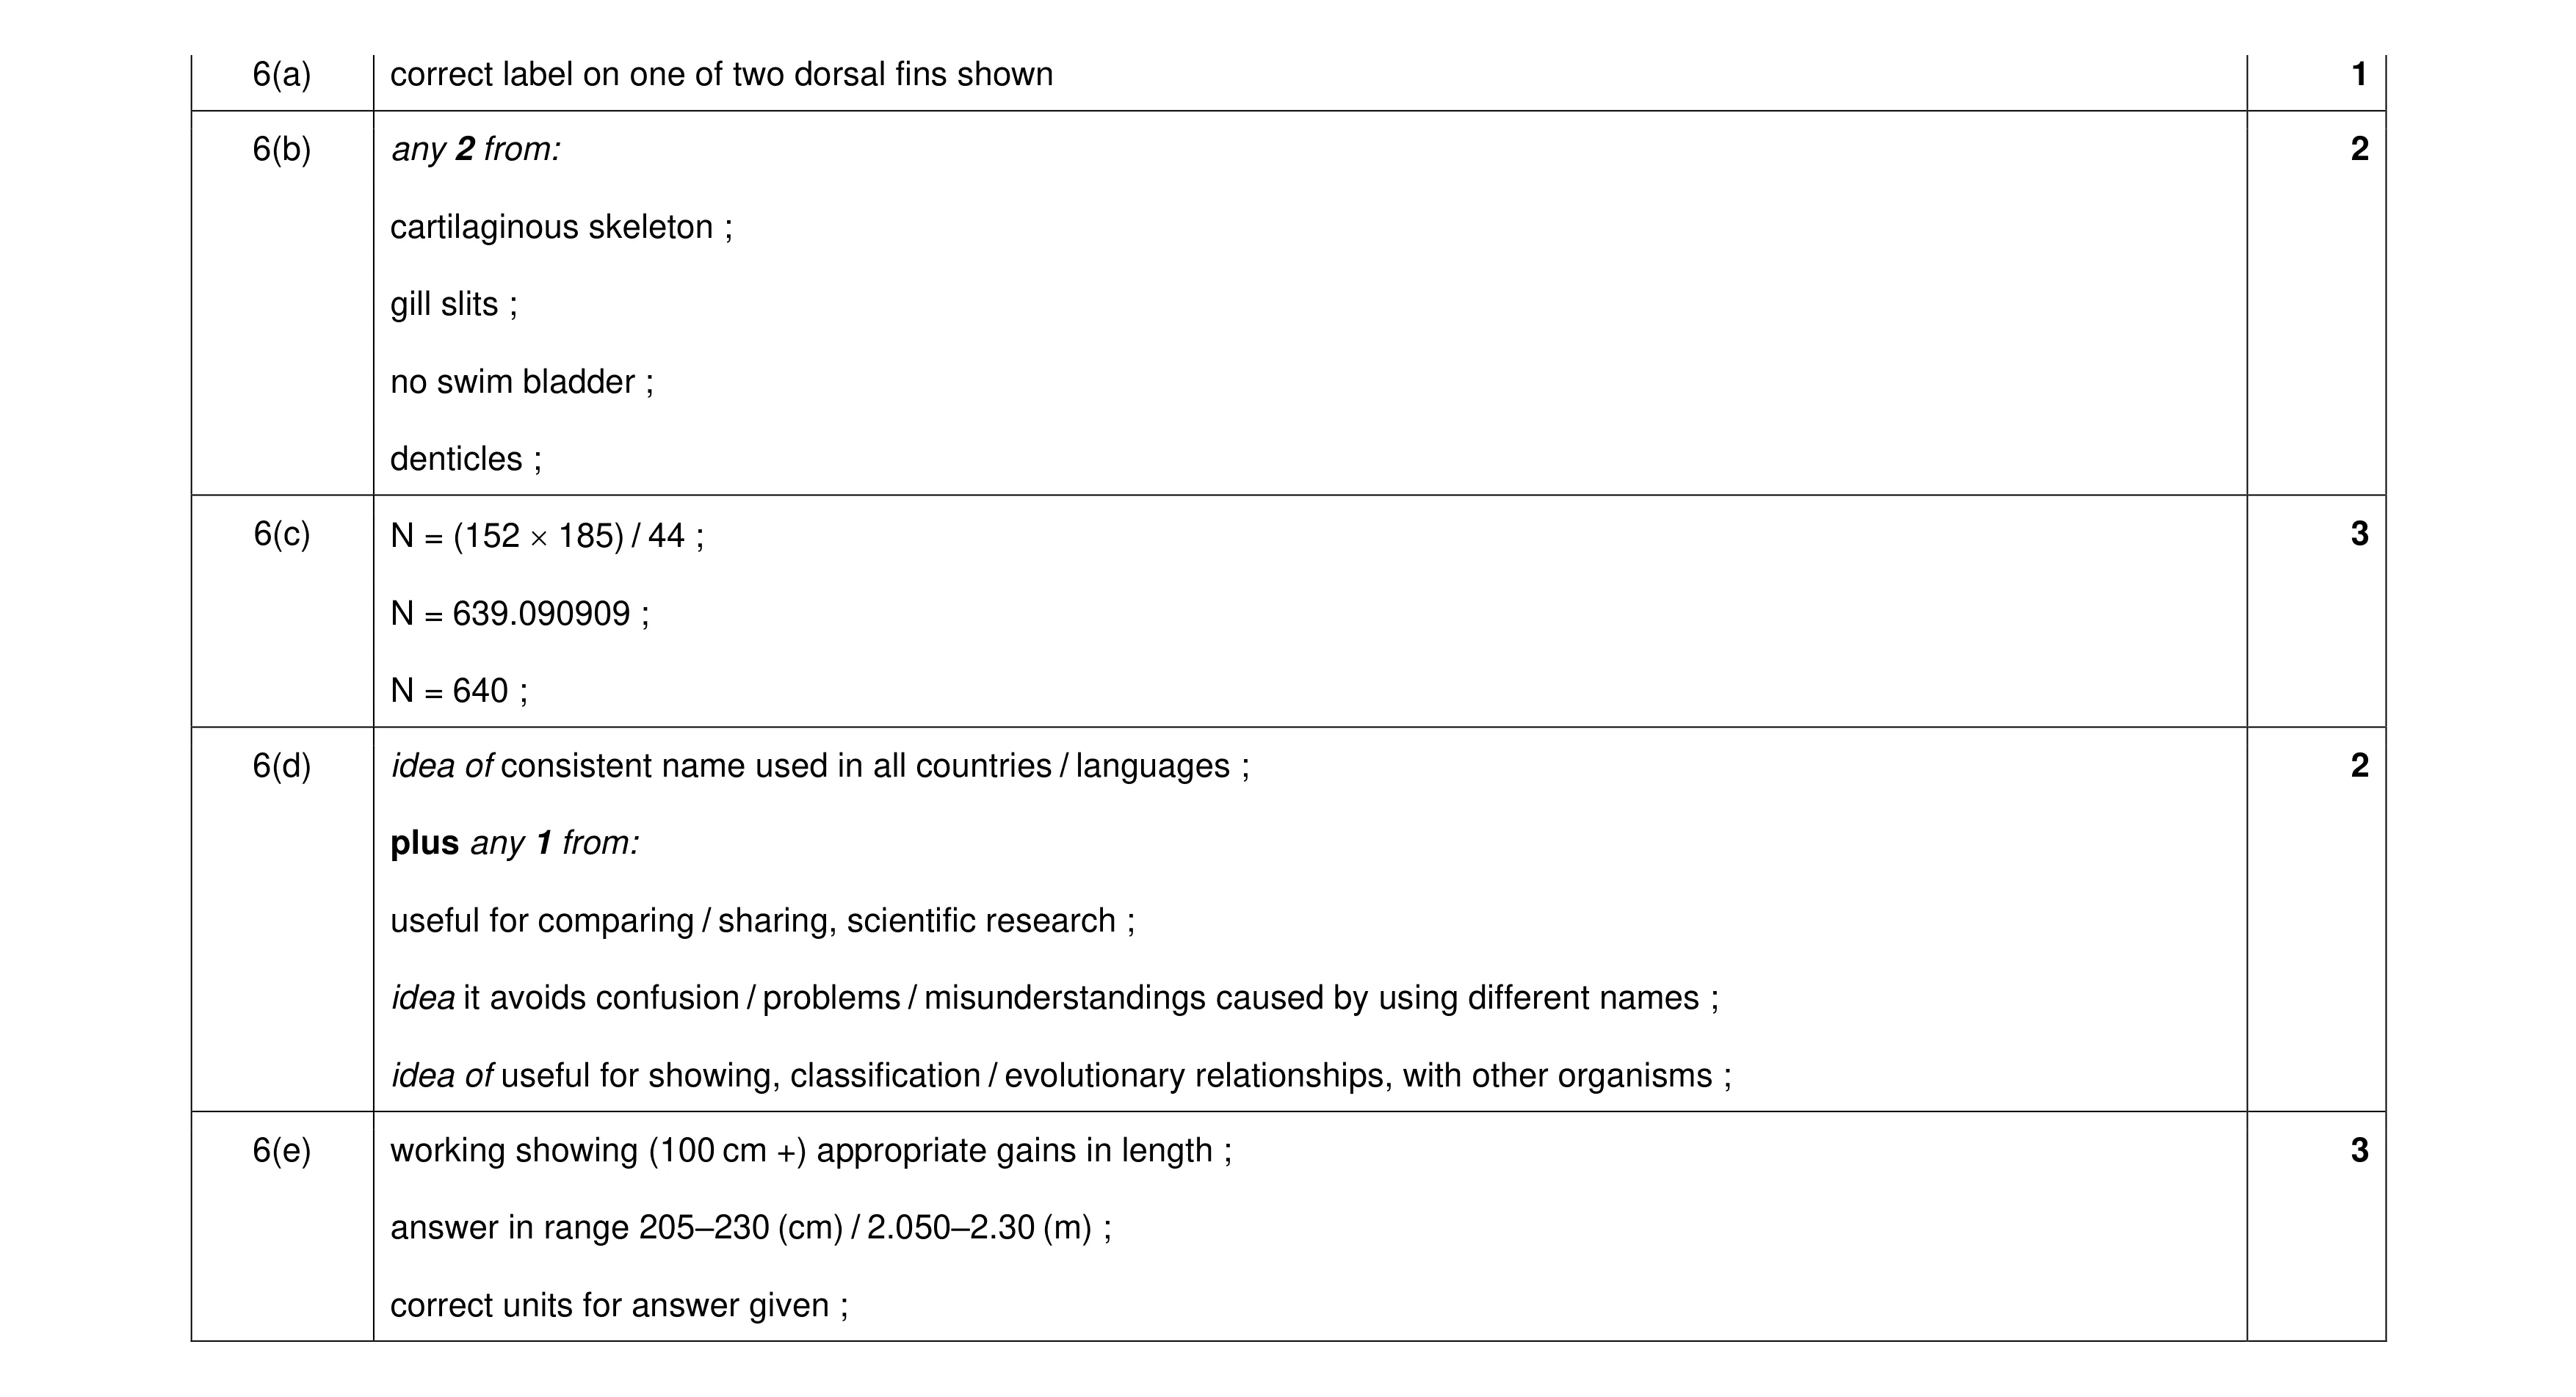 11
11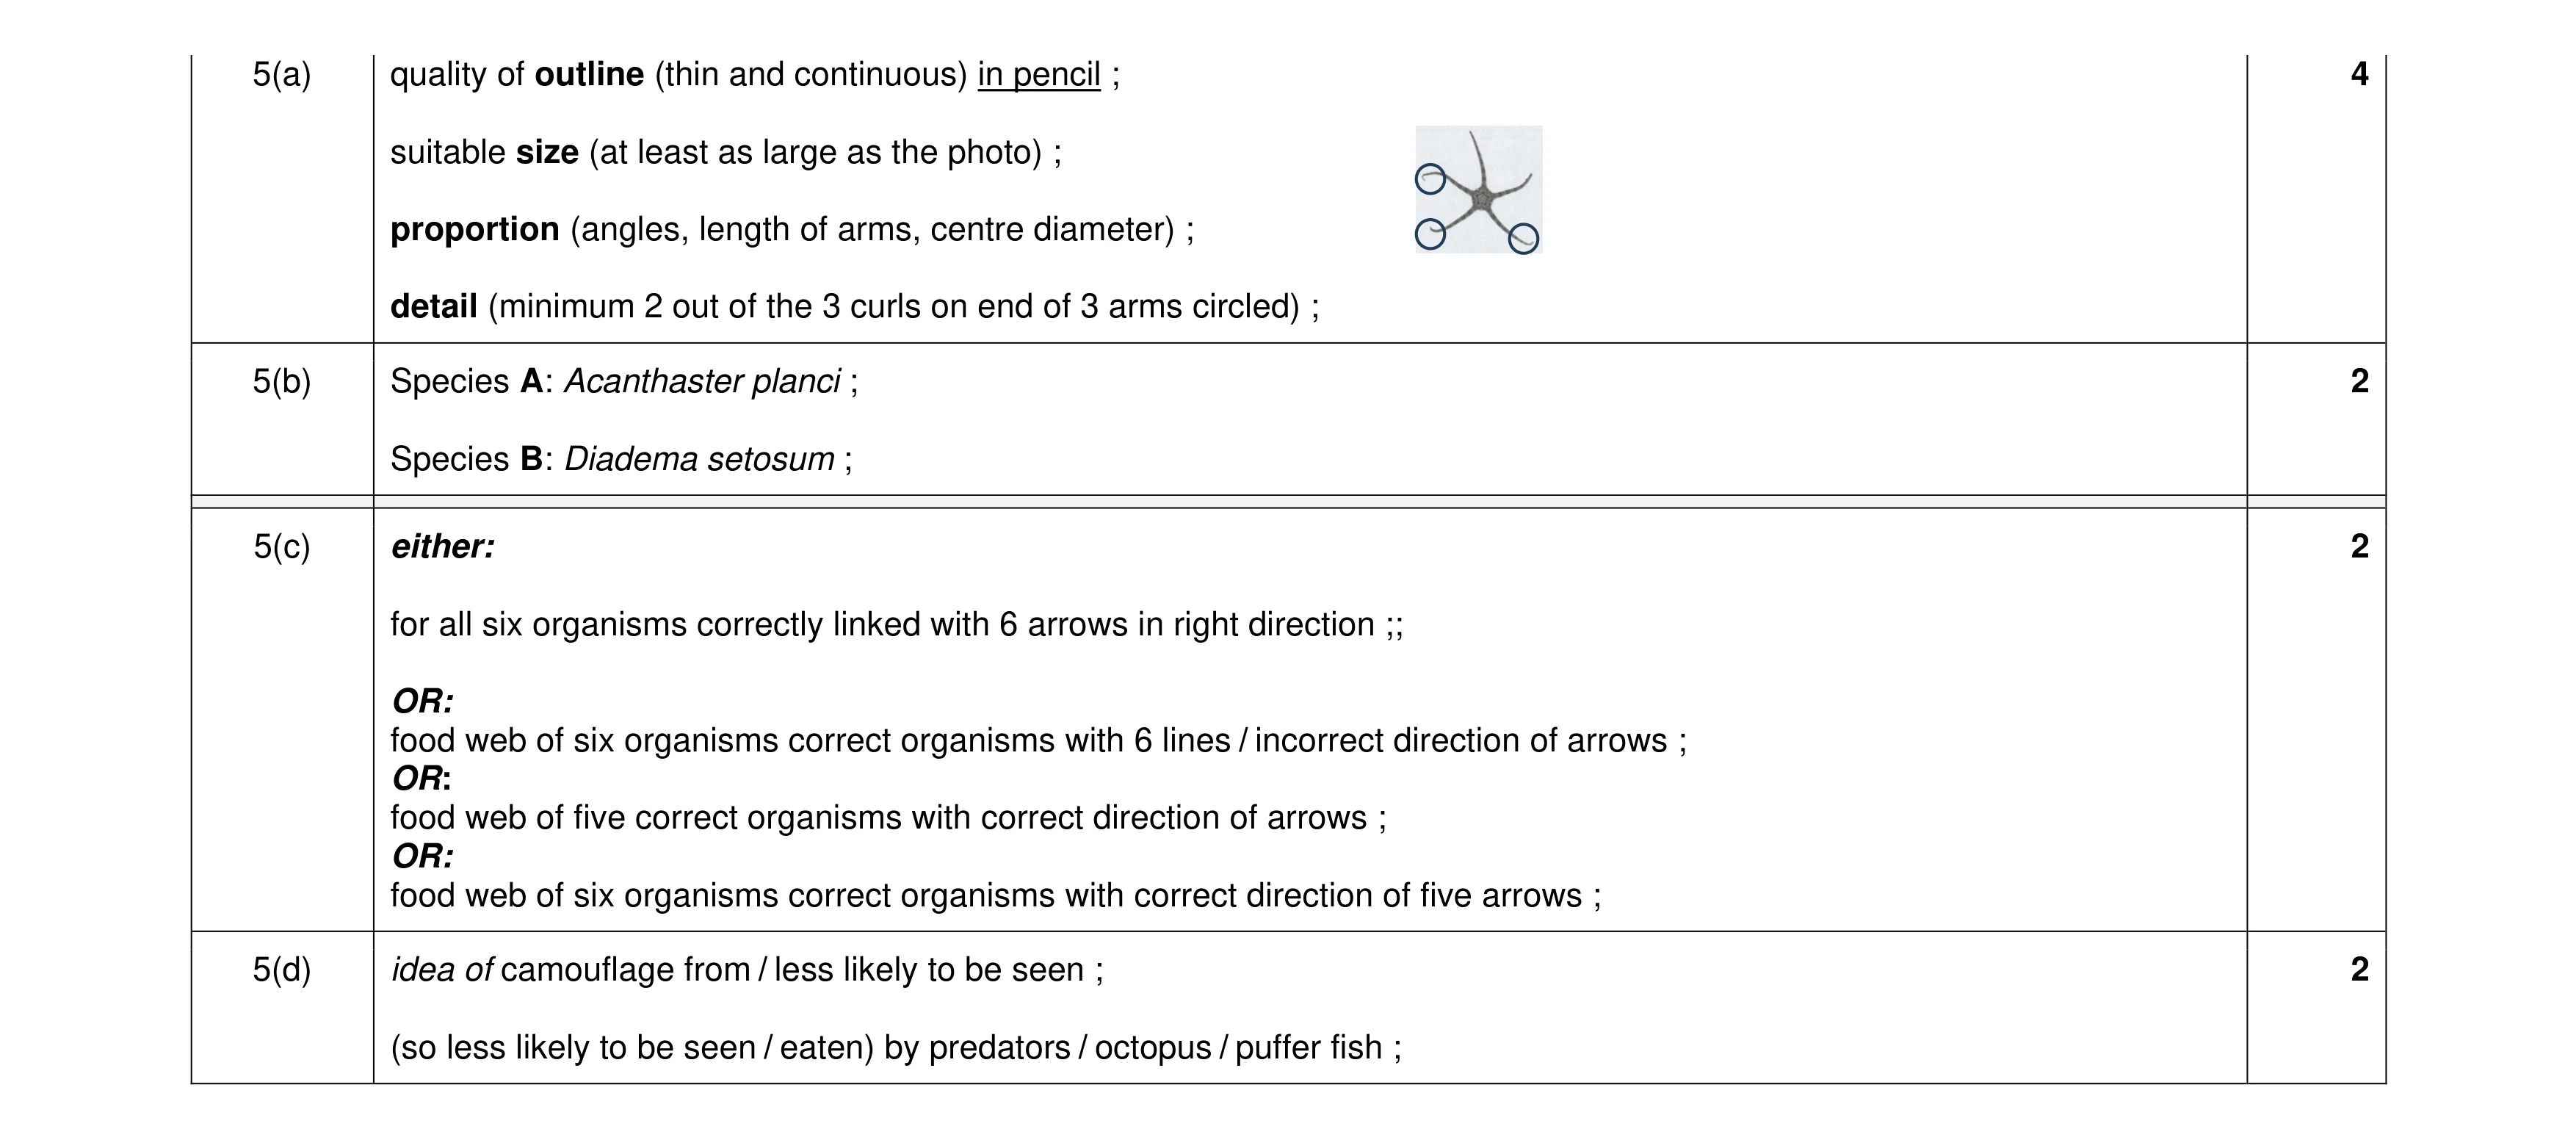 10
10 11
11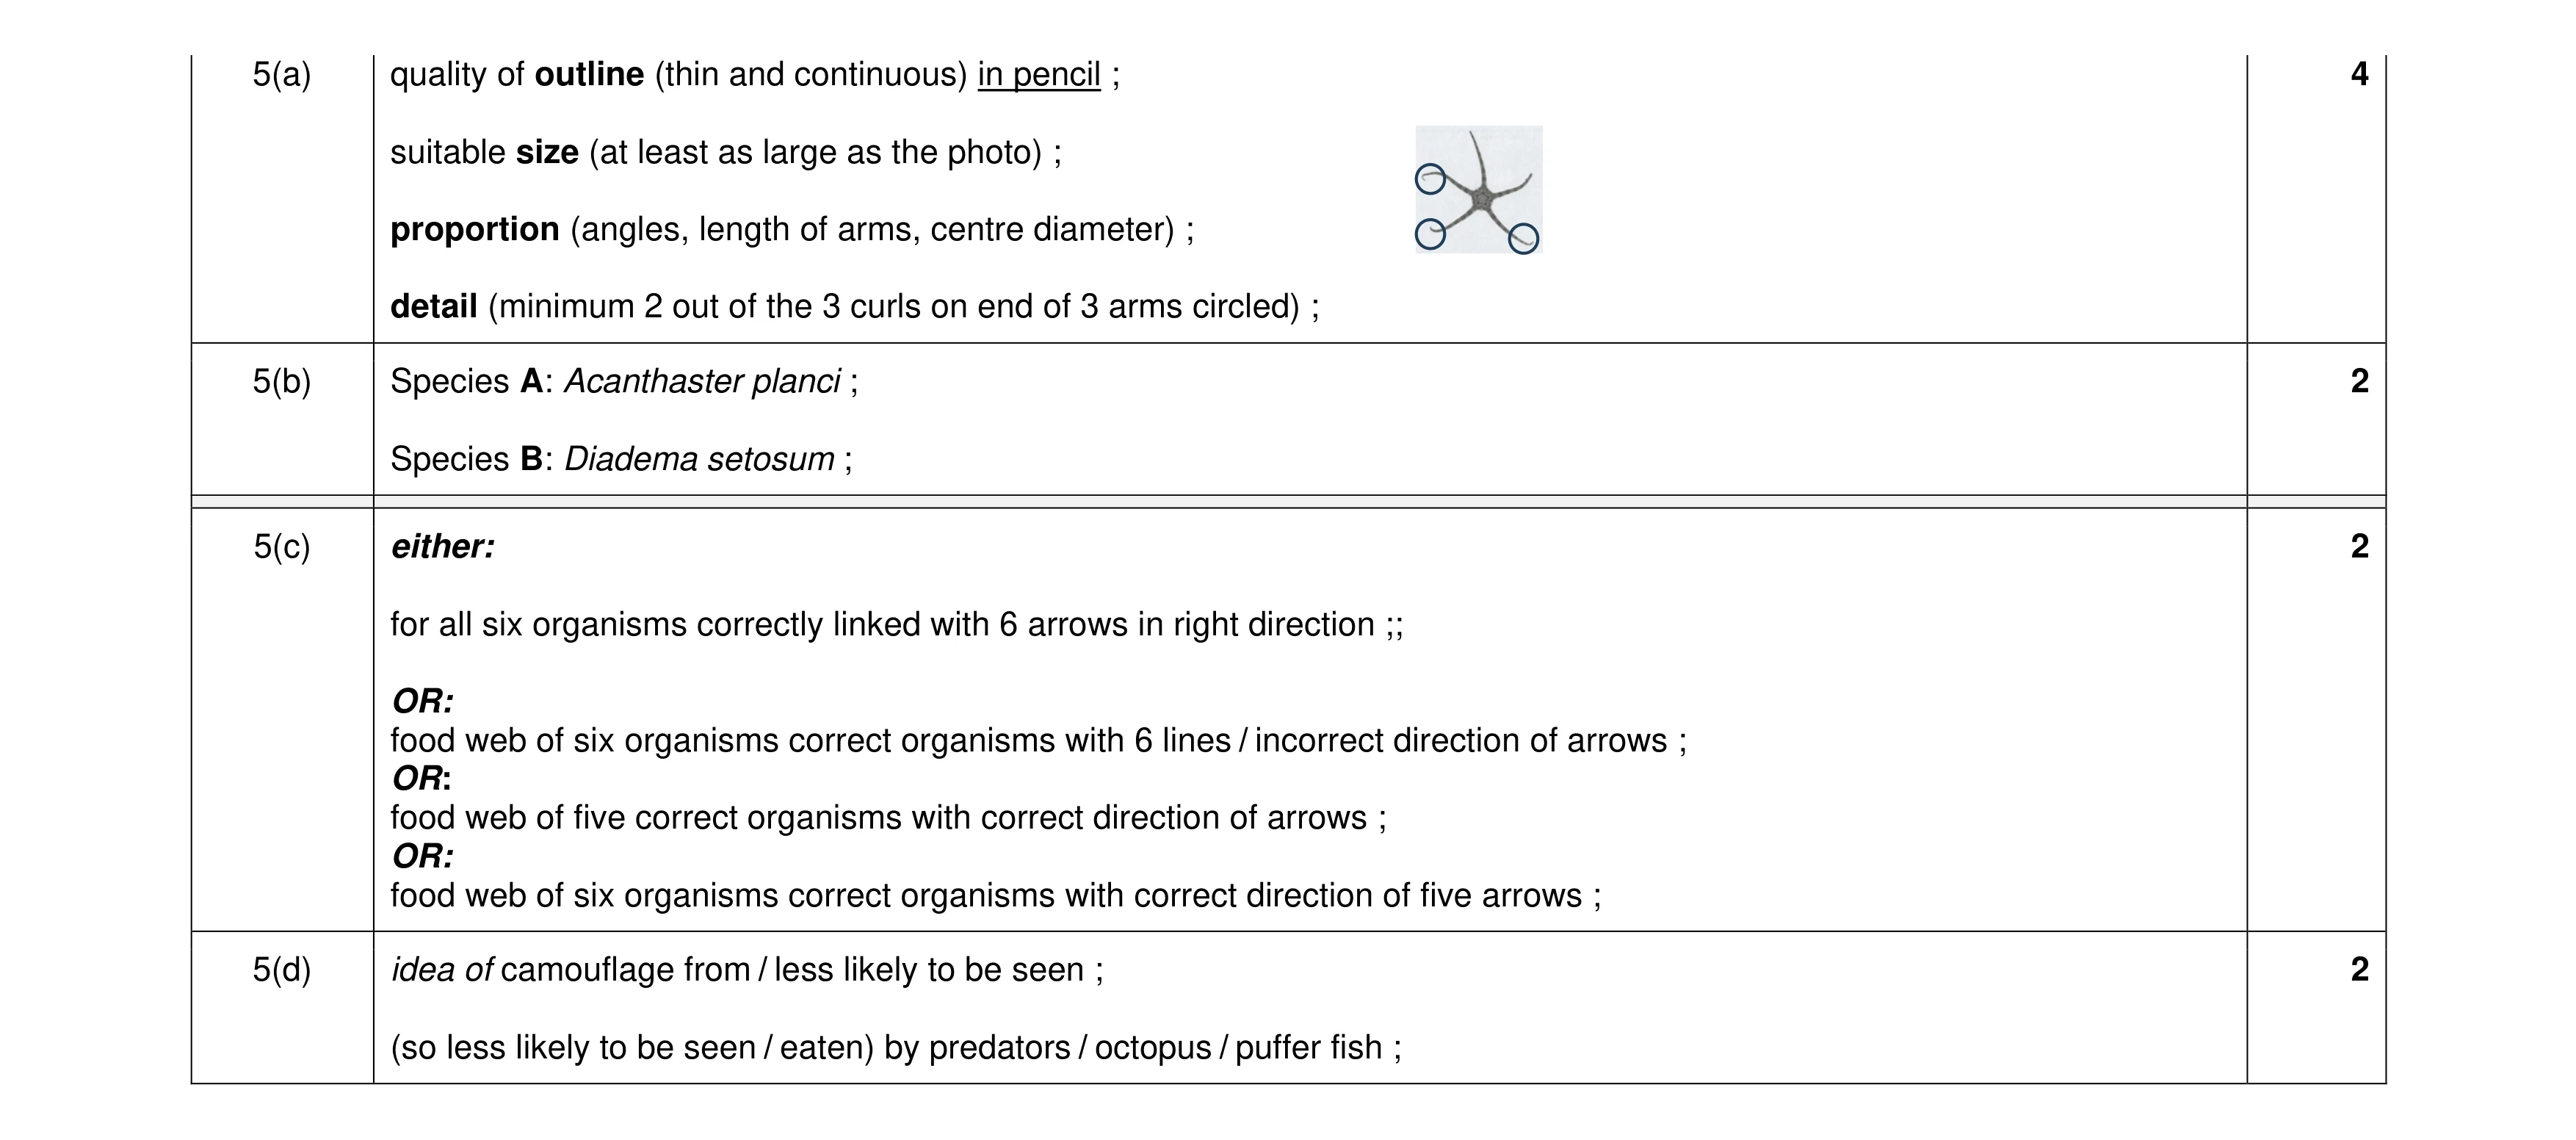 10
10 11
11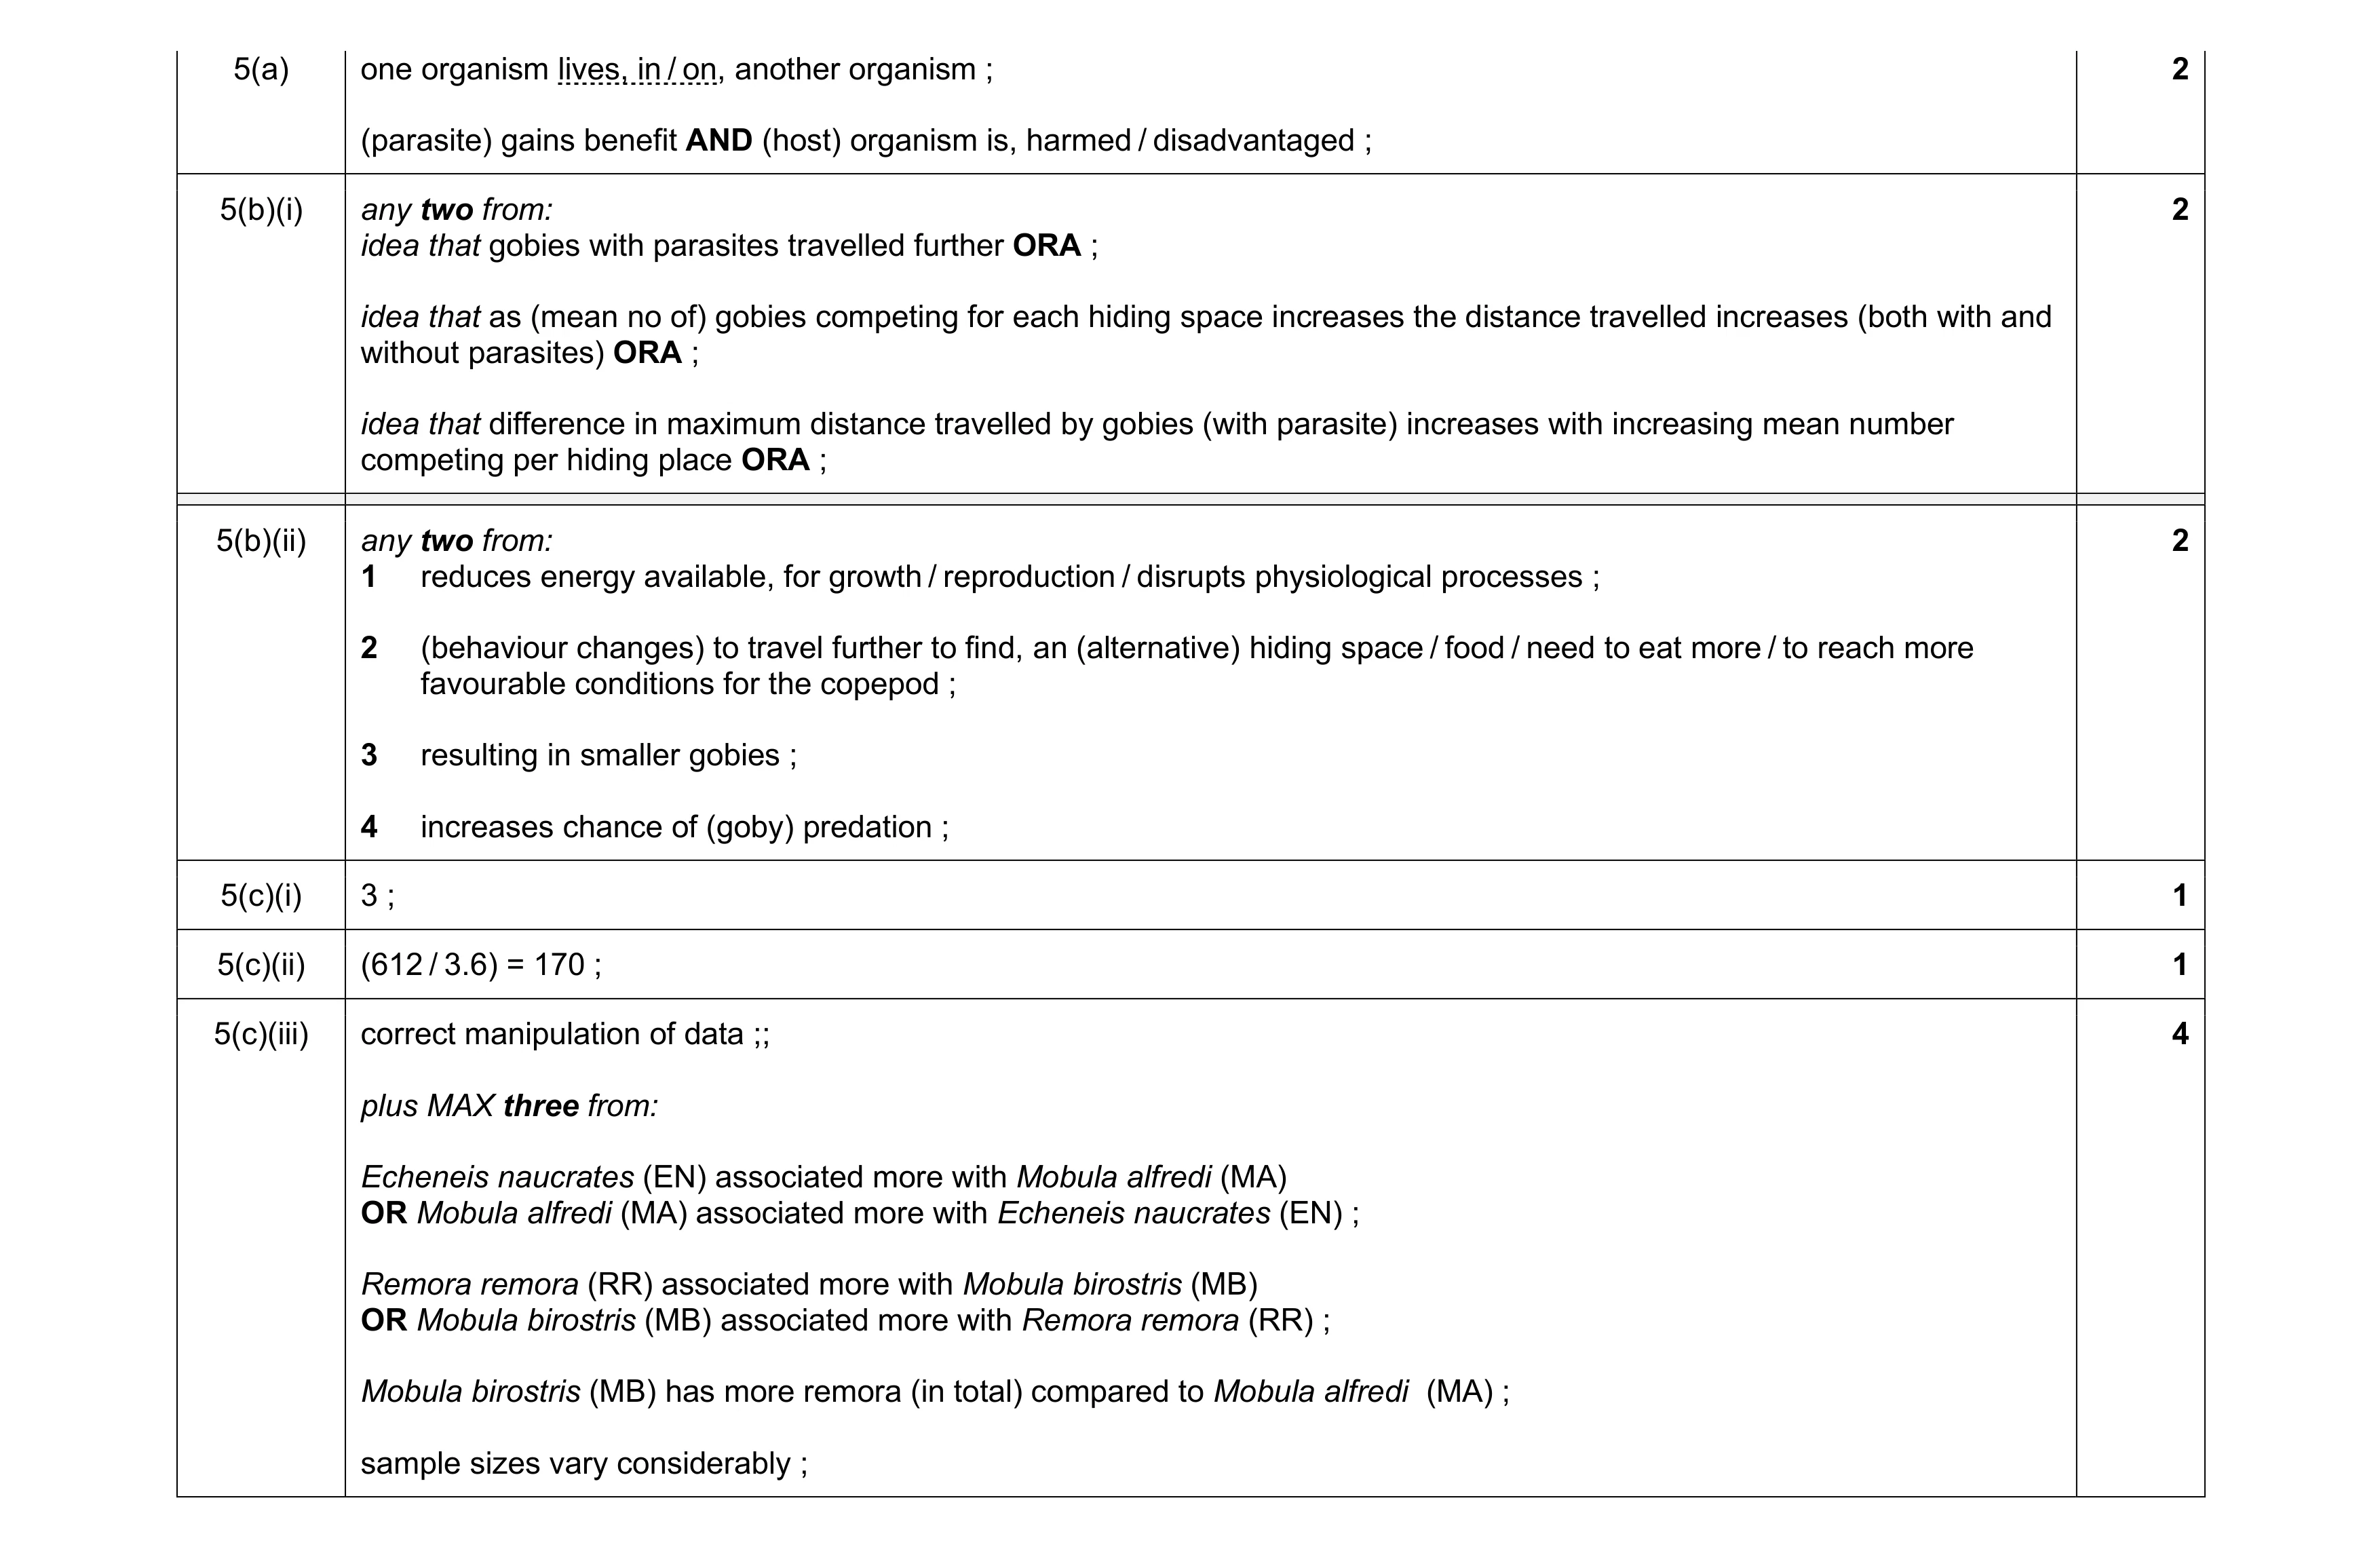 8
8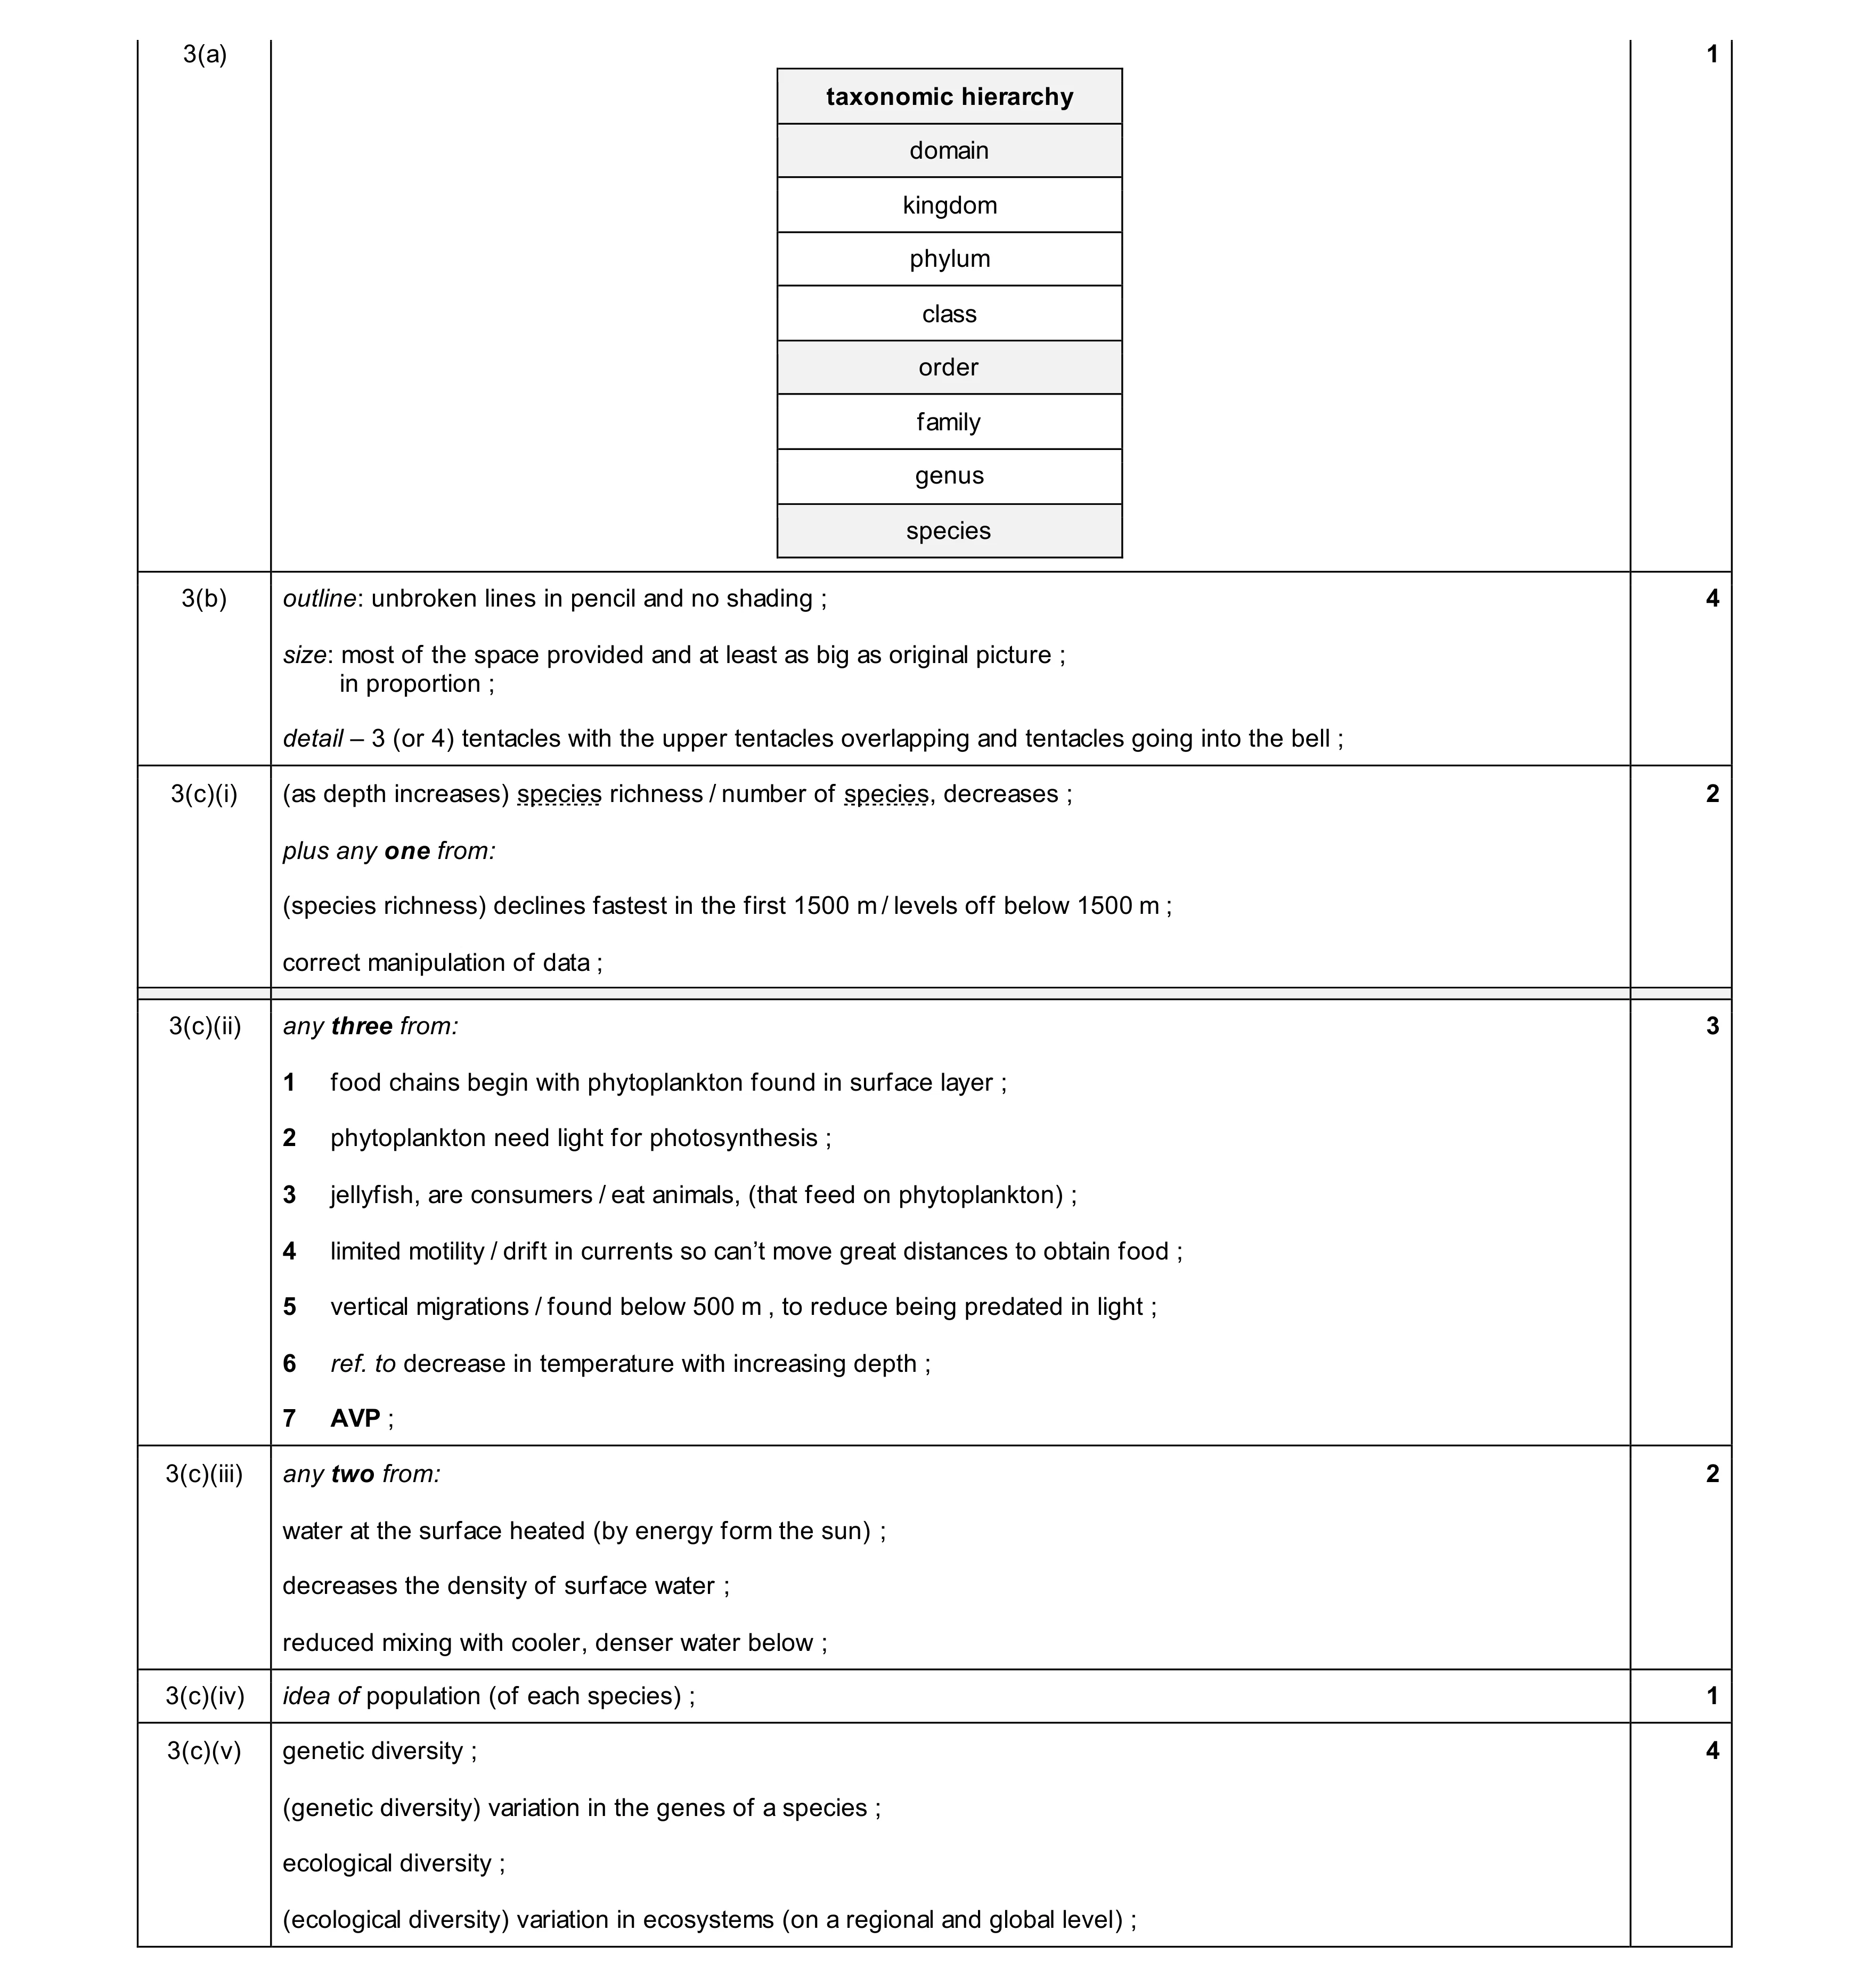 17
17