Cambridge A Level Marine Science 9693 — 2024 Oct/Nov Paper 2 · Variant 2
9693/22/O/N/24 · 7 questions · 75 marks · ≈84 min
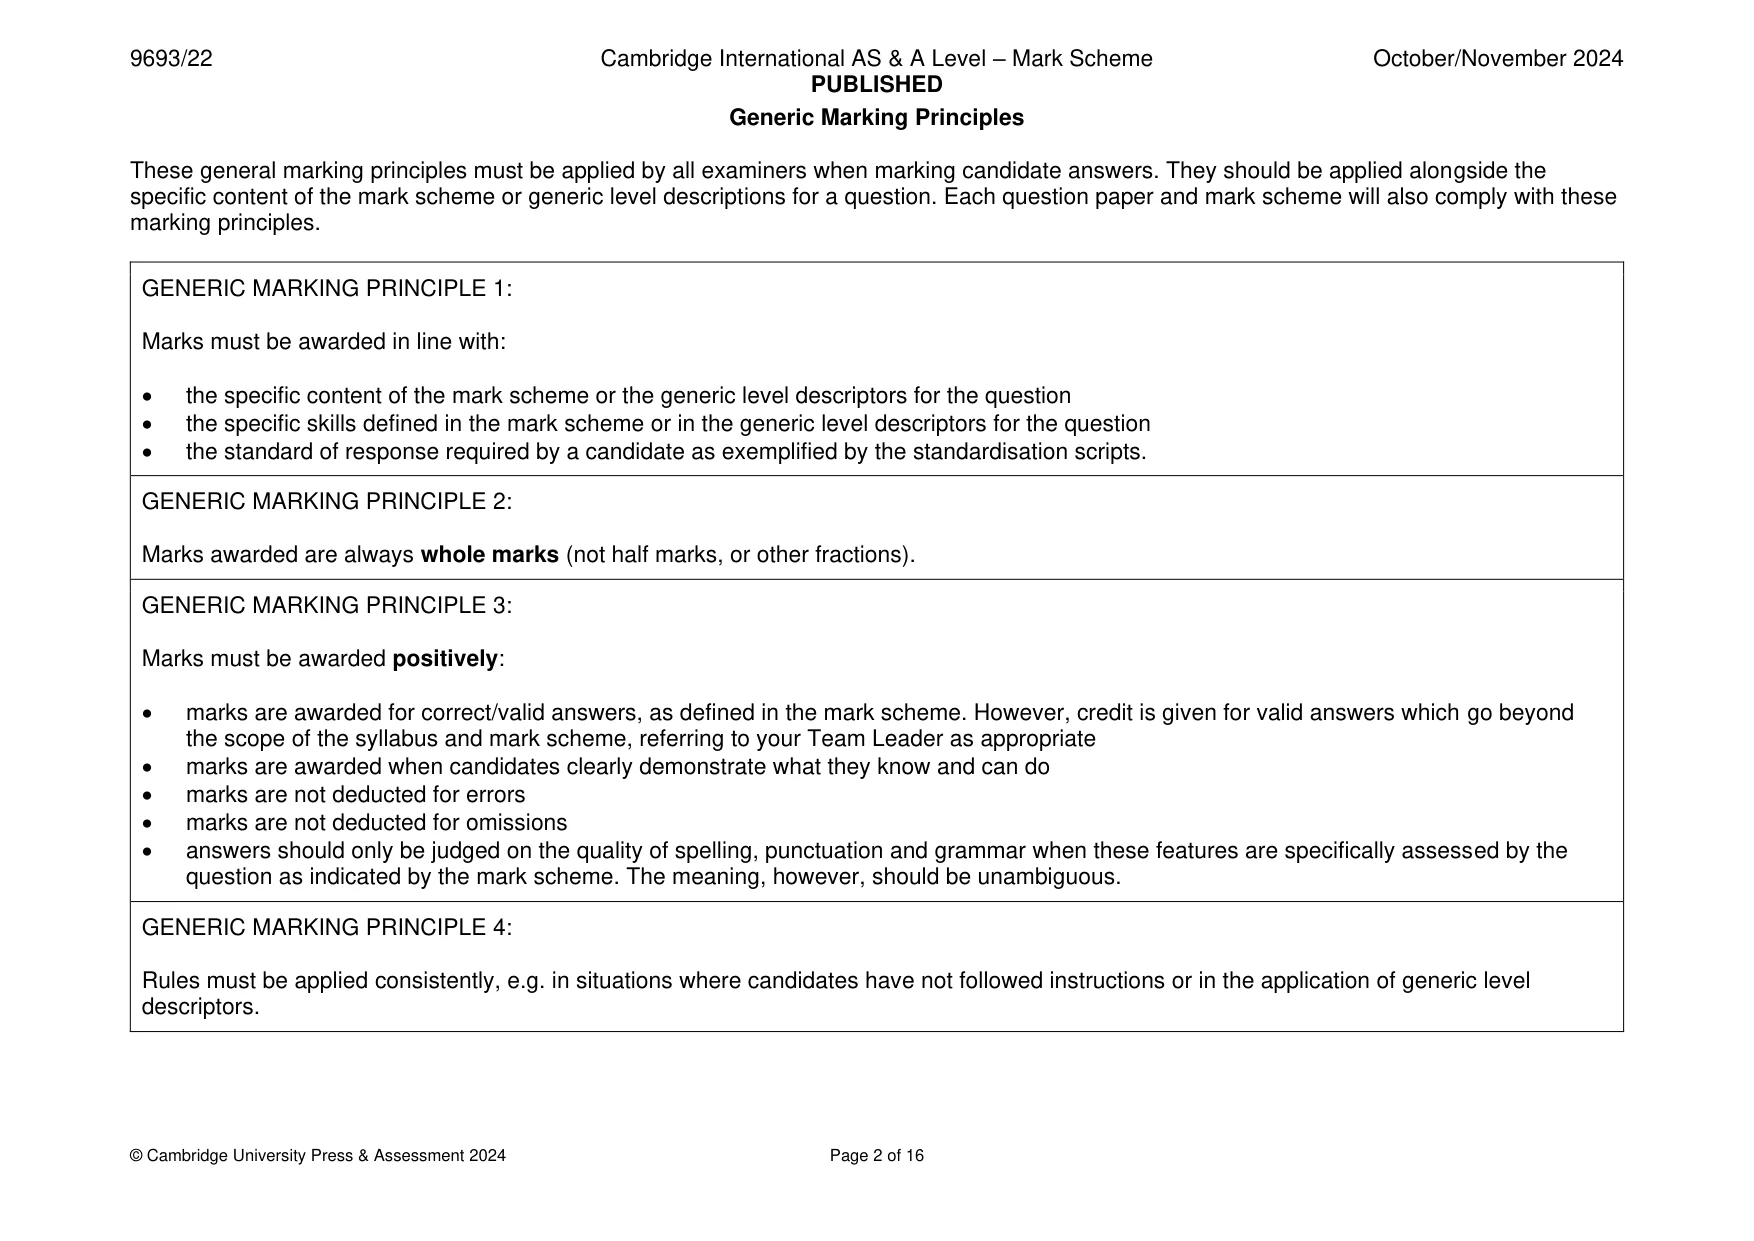
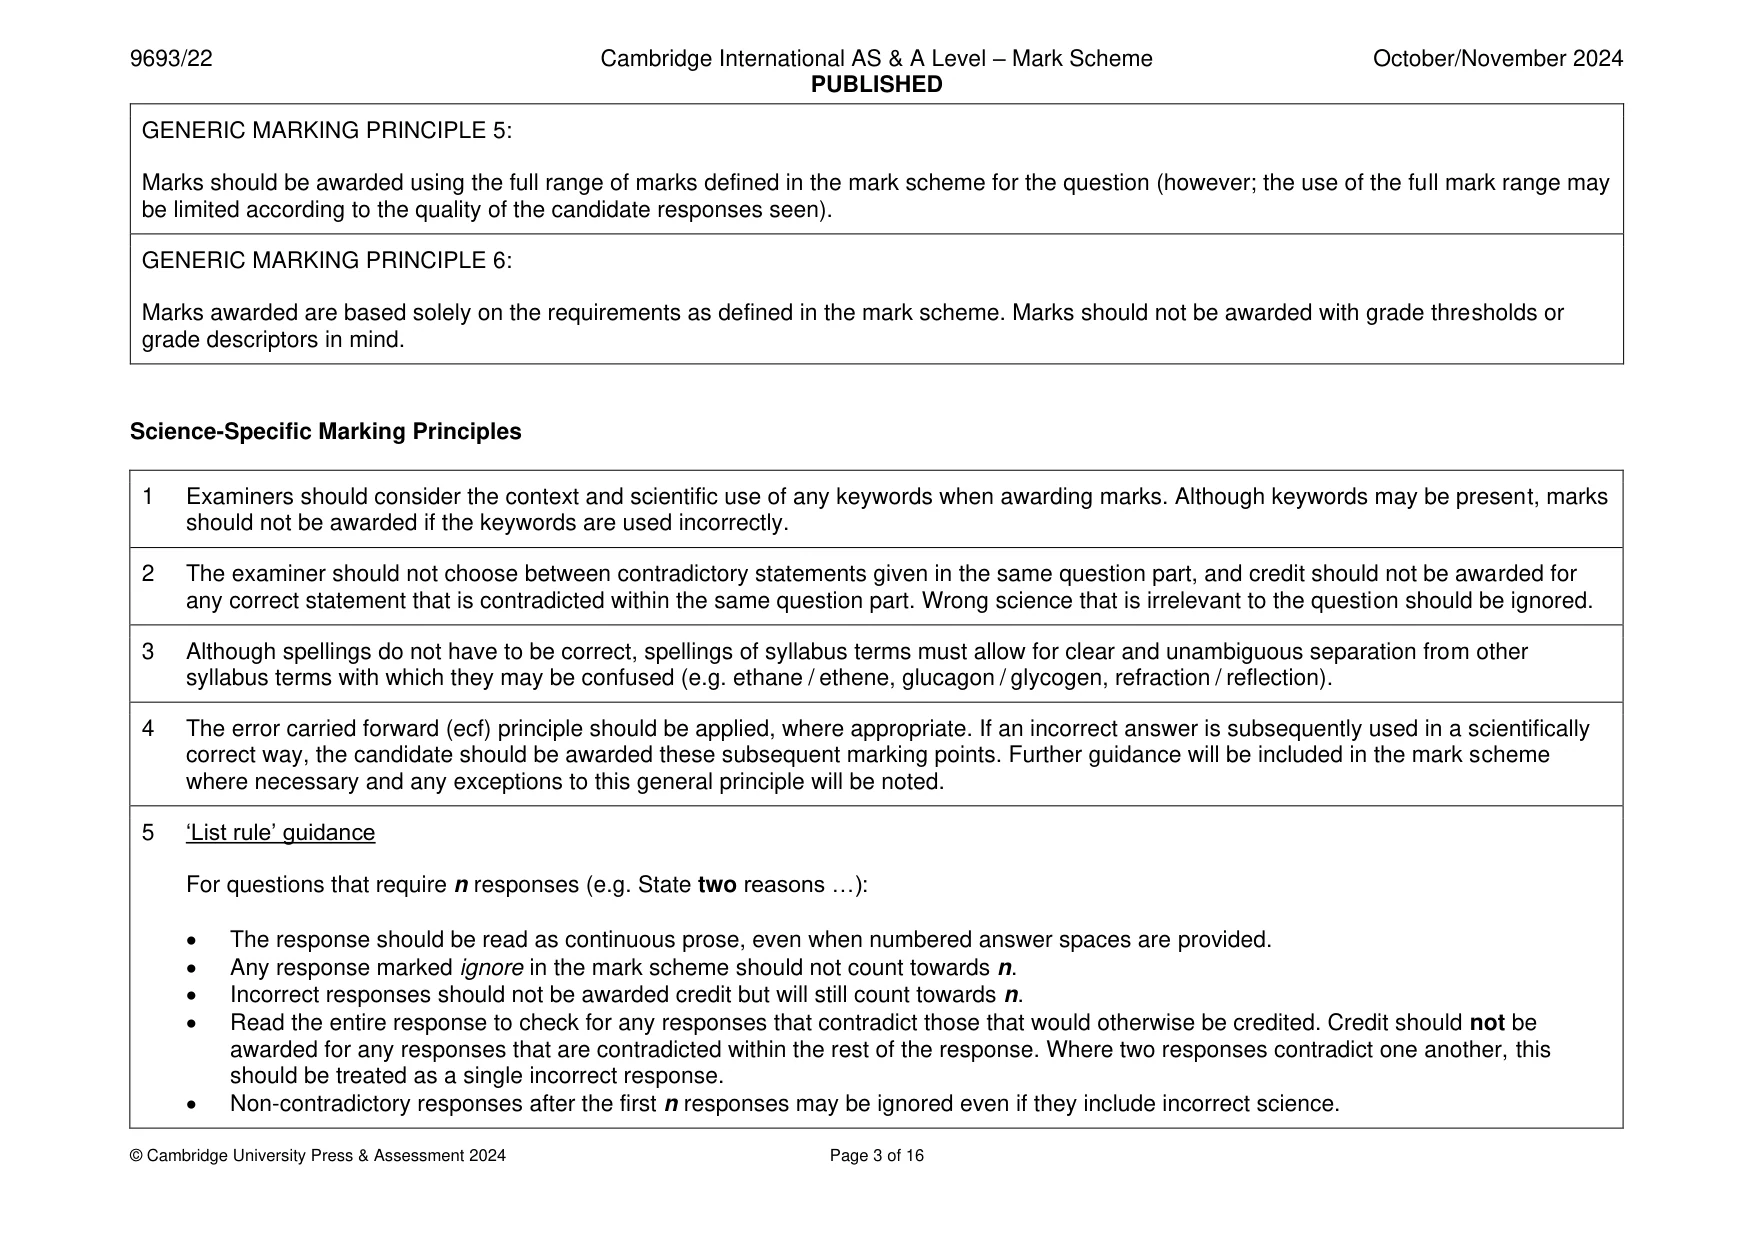
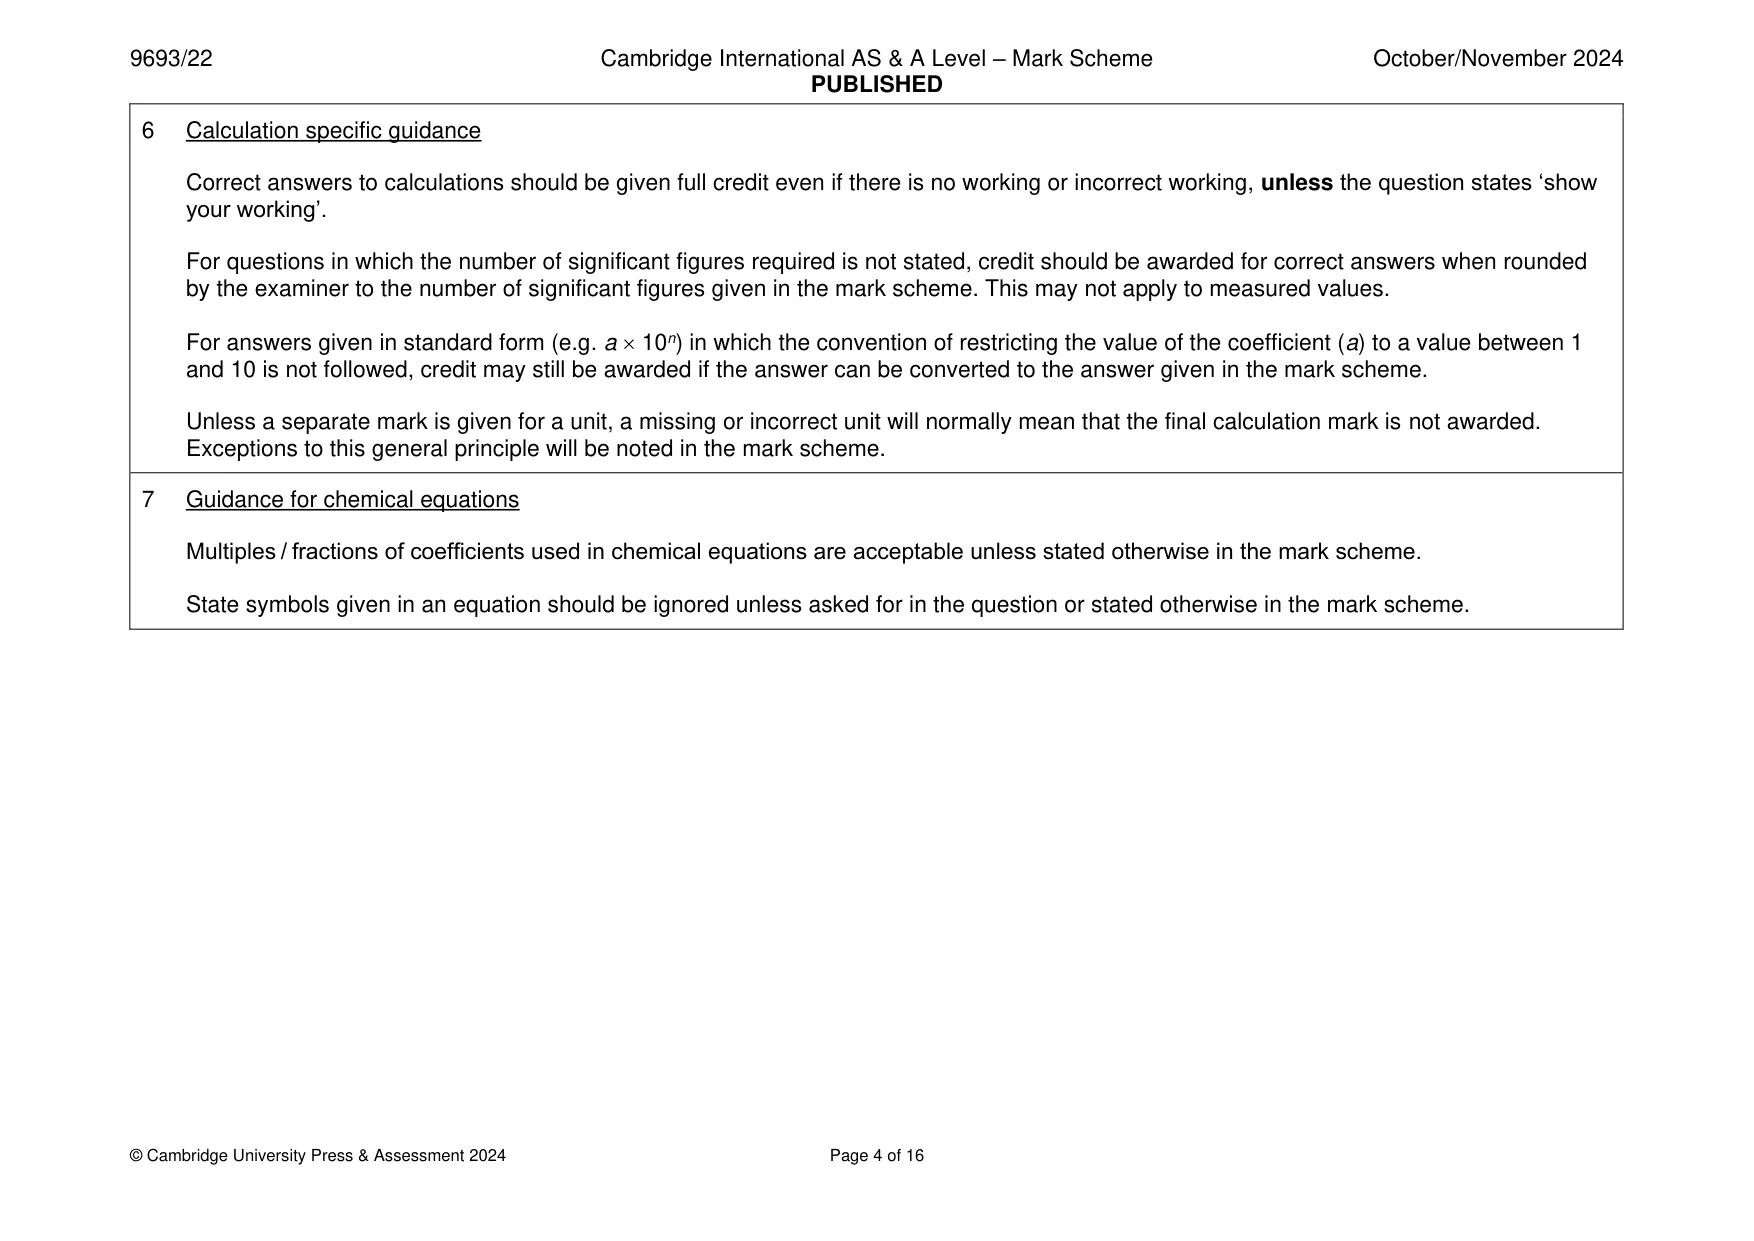
The question paper and its mark scheme, free to read here and free to download. This is Cambridge’s own paper, exactly as it was sat.
Question paper24 pages





Mark scheme16 pages
Answers below. Sit the paper first if you are practising.
Questions as text
Q1 · Photosynthesis by organisms in the epipelagic zone of the oceans produces…
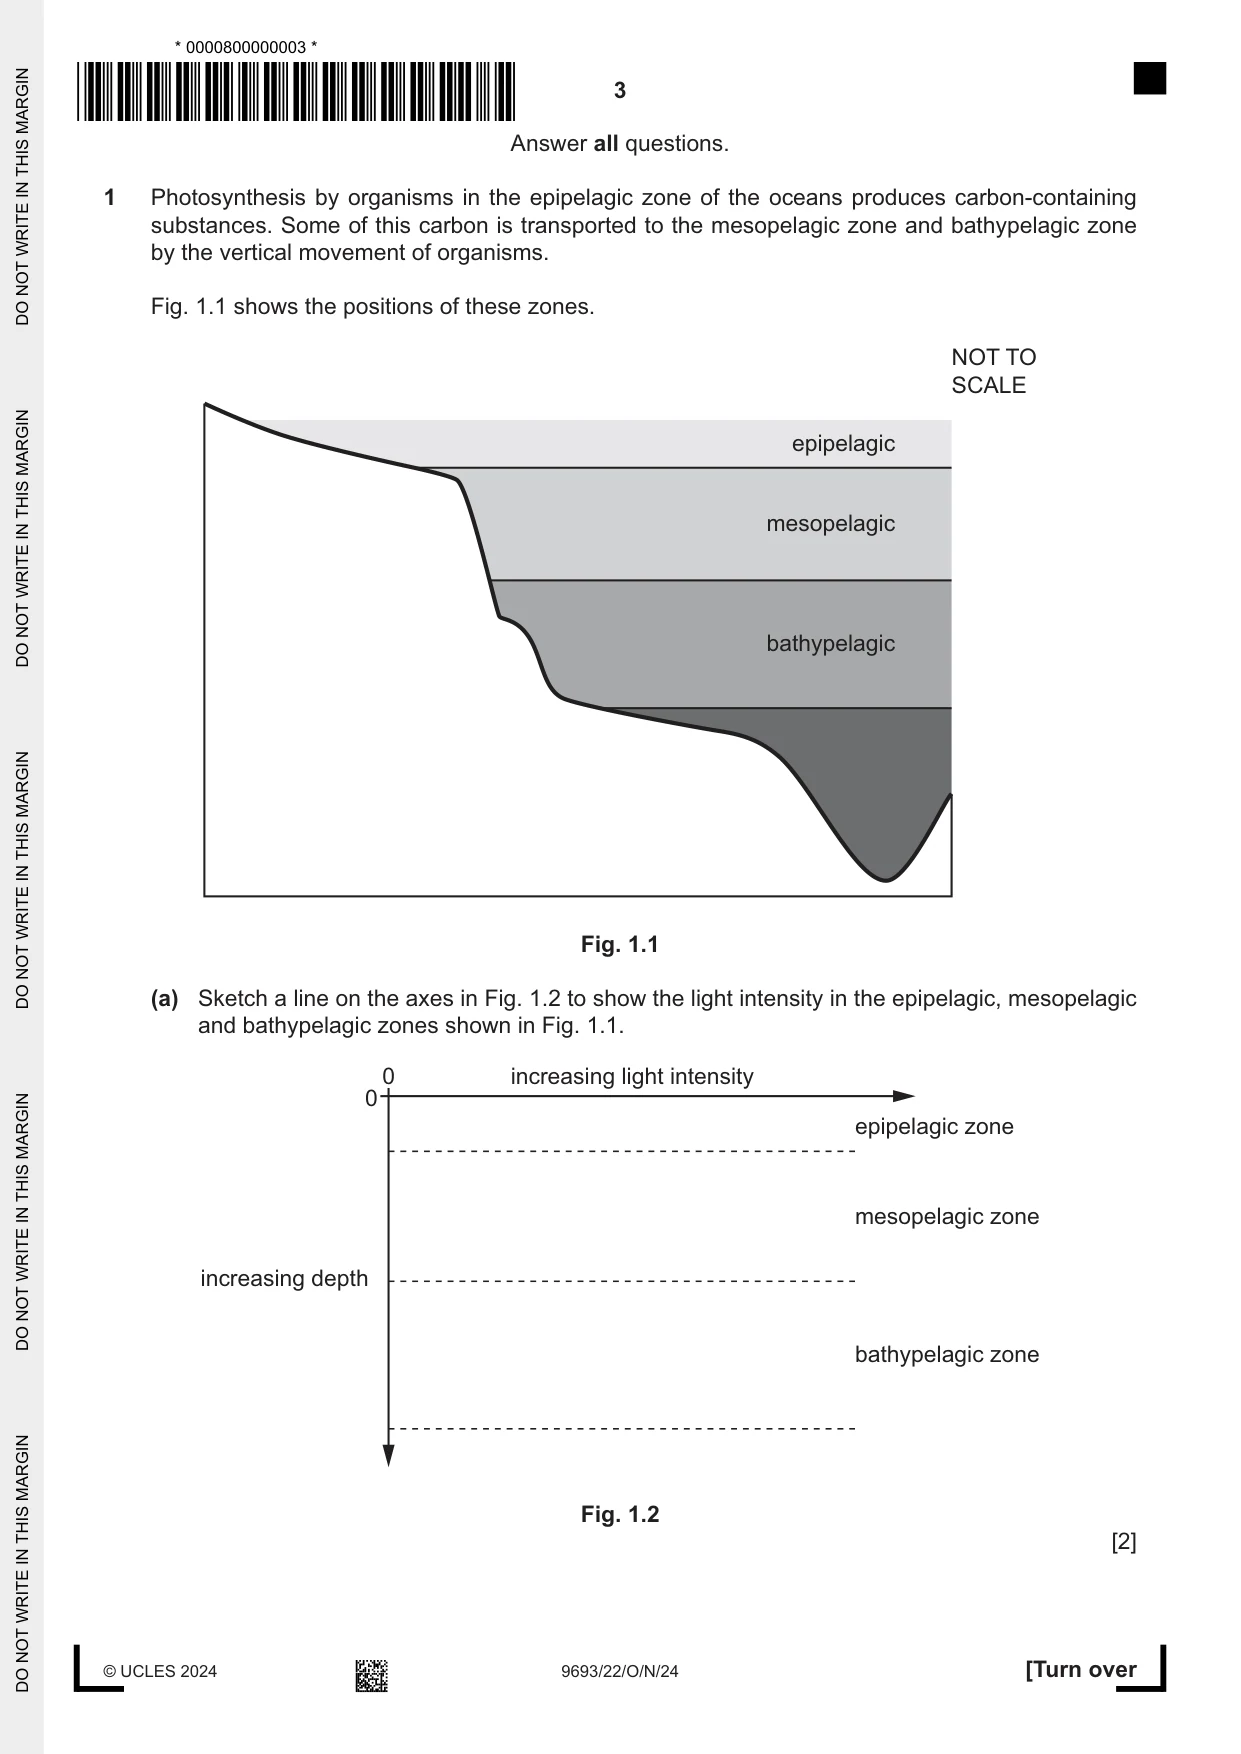
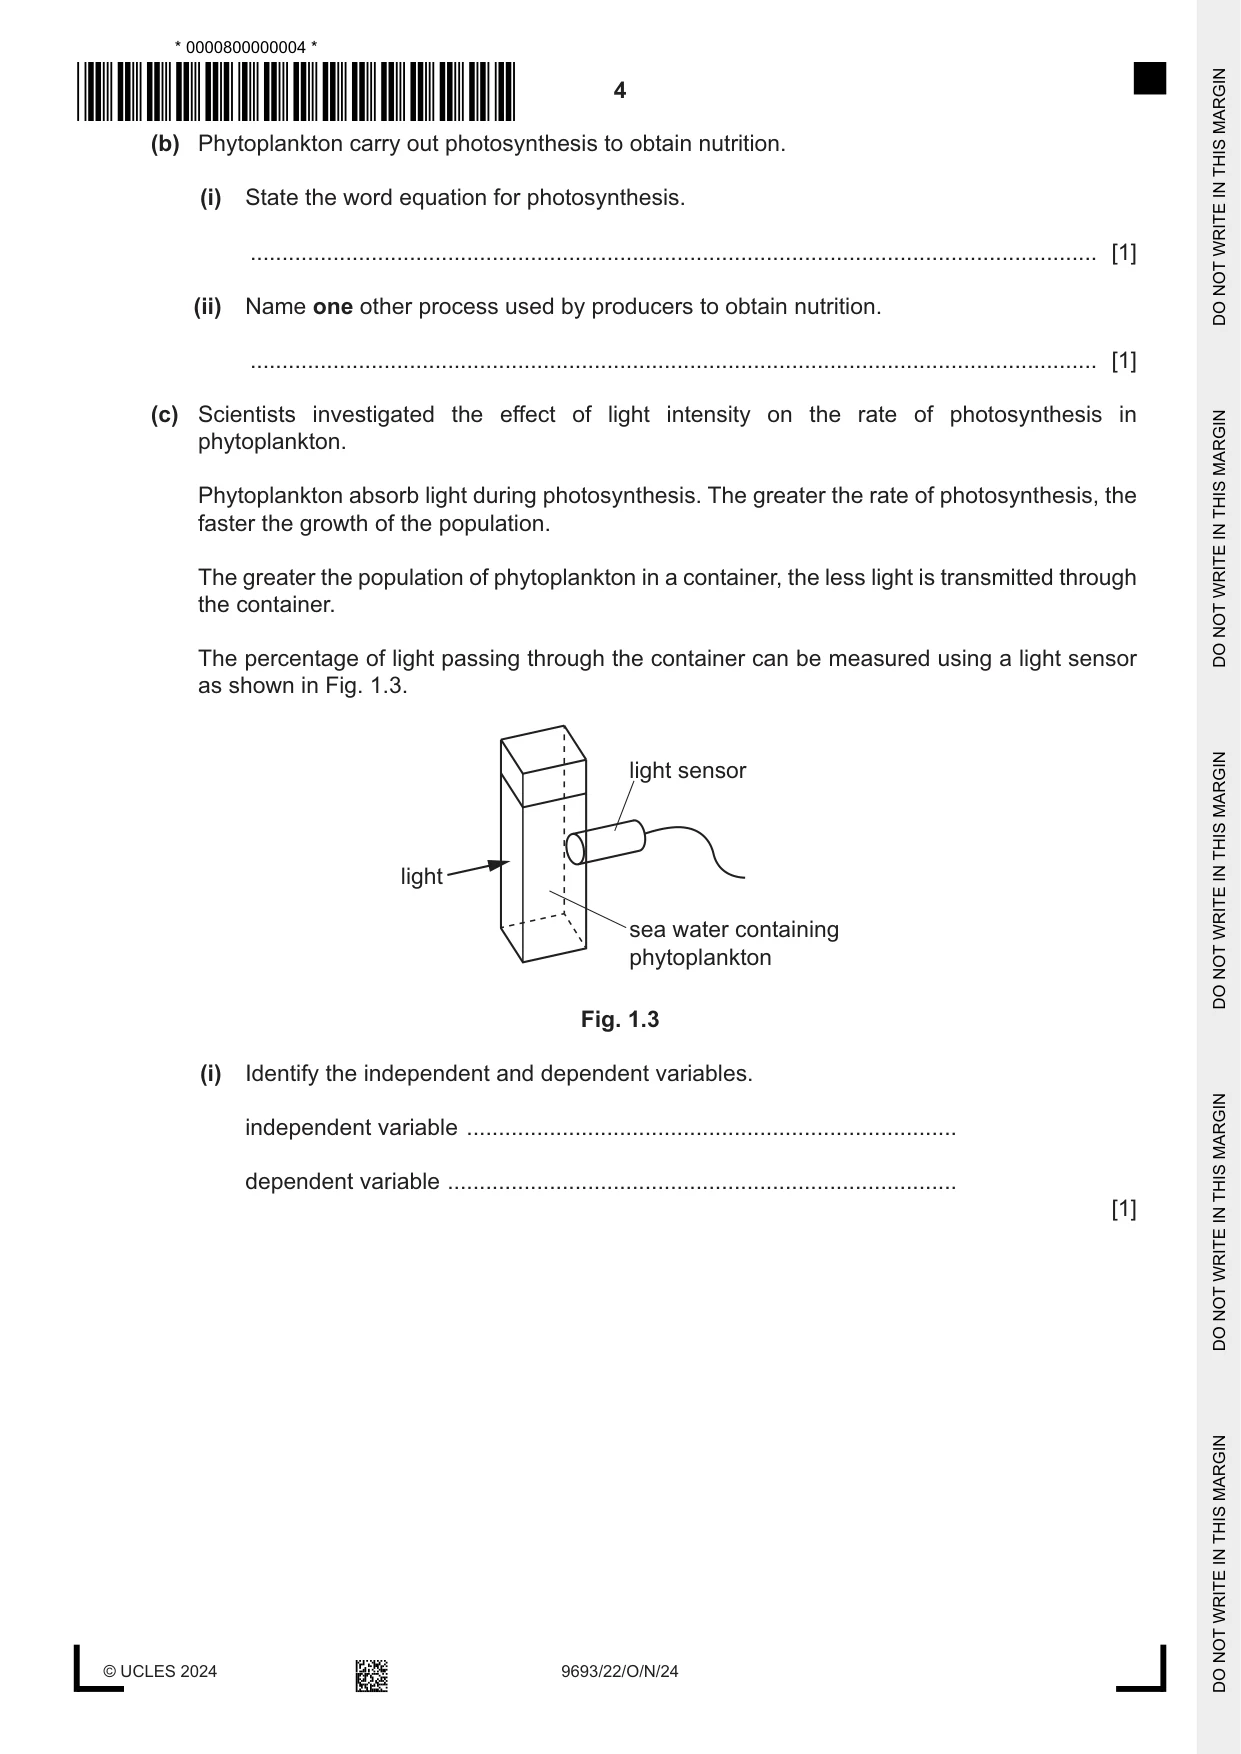
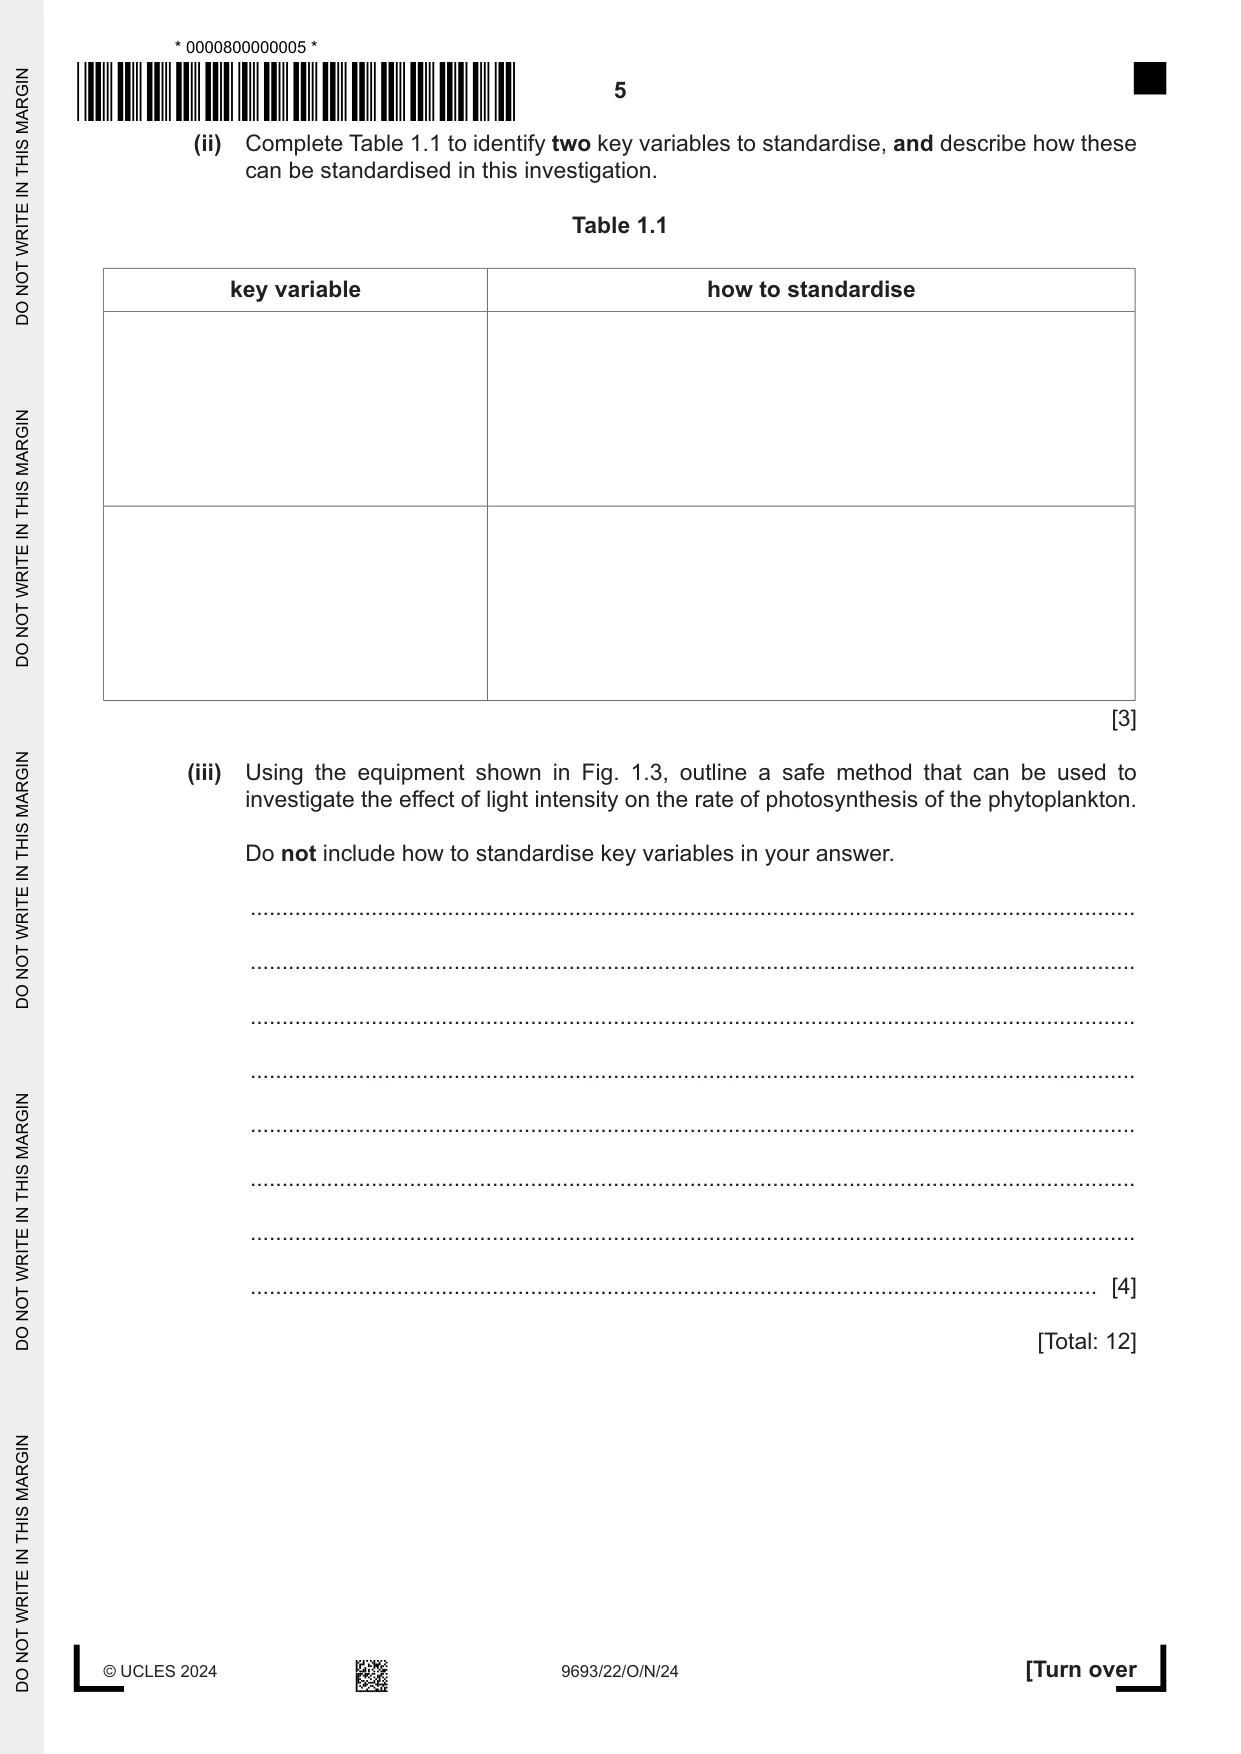
1 Photosynthesis by organisms in the epipelagic zone of the oceans produces carbon-containing substances. Some of this carbon is transported to the mesopelagic zone and bathypelagic zone by the vertical movement of organisms. Fig. 1.1 shows the positions of these zones. NOT TO SCALE epipelagic mesopelagic bathypelagic Fig. 1.1 (a) Sketch a line on the axes in Fig. 1.2 to show the light intensity in the epipelagic, mesopelagic and bathypelagic zones shown in Fig. 1.1. 0 increasing light intensity 0 epipelagic zone mesopelagic zone increasing depth bathypelagic zone Fig. 1.2 [2] (b) Phytoplankton carry out photosynthesis to obtain nutrition. (i) State the word equation for photosynthesis. ..................................................................................................................................... [1] (ii) Name one other process used by producers to obtain nutrition. ..................................................................................................................................... [1] (c) Scientists investigated the effect of light intensity on the rate of photosynthesis in phytoplankton. Phytoplankton absorb light during photosynthesis. The greater the rate of photosynthesis, the faster the growth of the population. The greater the population of phytoplankton in a container, the less light is transmitted through the container. The percentage of light passing through the container can be measured using a light sensor as shown in Fig. 1.3. light sensor light sea water containing phytoplankton Fig. 1.3 (i) Identify the independent and dependent variables. independent variable ............................................................................. dependent variable ................................................................................ [1] (ii) Complete Table 1.1 to identify two key variables to standardise, and describe how these can be standardised in this investigation. Table 1.1 key variable how to standardise [3] (iii) Using the equipment shown in Fig. 1.3, outline a safe method that can be used to investigate the effect of light intensity on the rate of photosynthesis of the phytoplankton. Do not include how to standardise key variables in your answer. ........................................................................................................................................... ........................................................................................................................................... ........................................................................................................................................... ........................................................................................................................................... ........................................................................................................................................... ........................................................................................................................................... ........................................................................................................................................... ..................................................................................................................................... [4] [Total: 12]
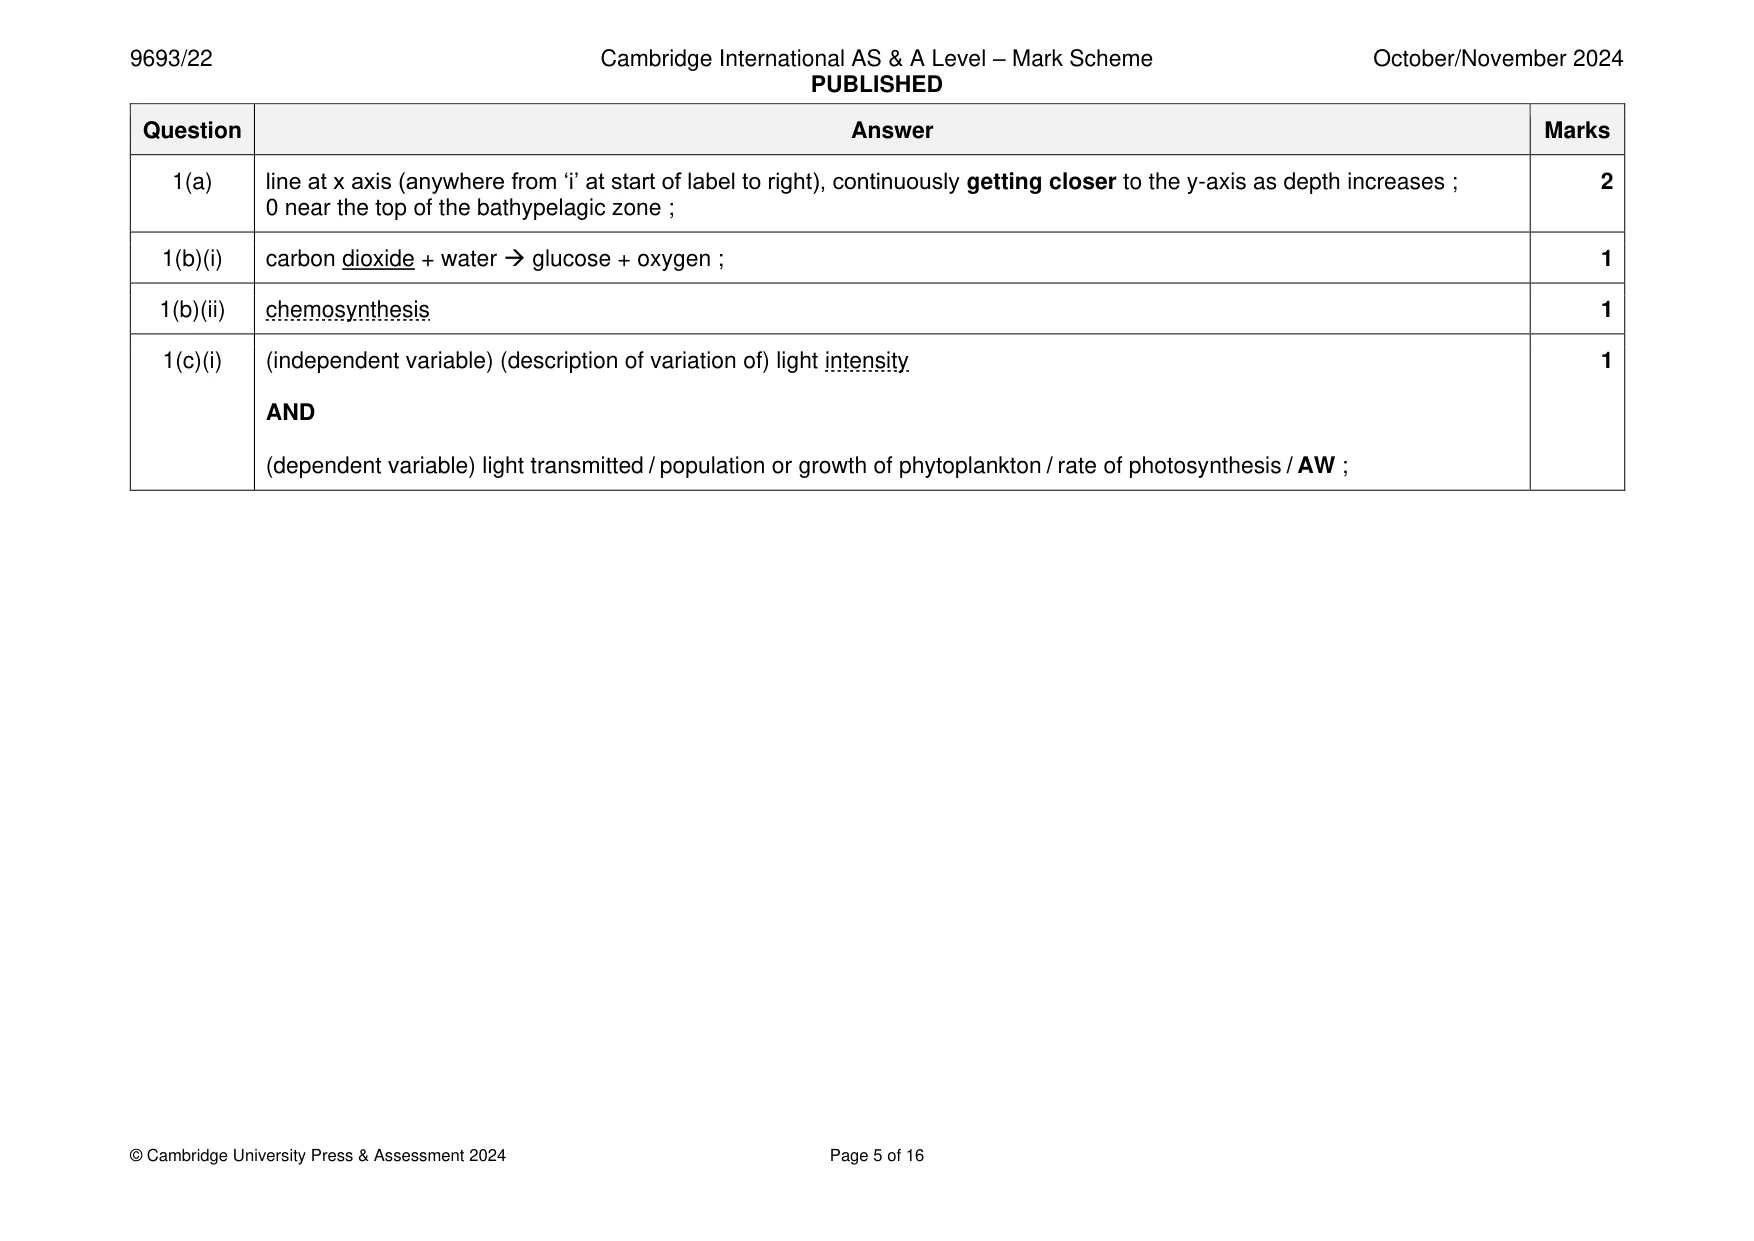
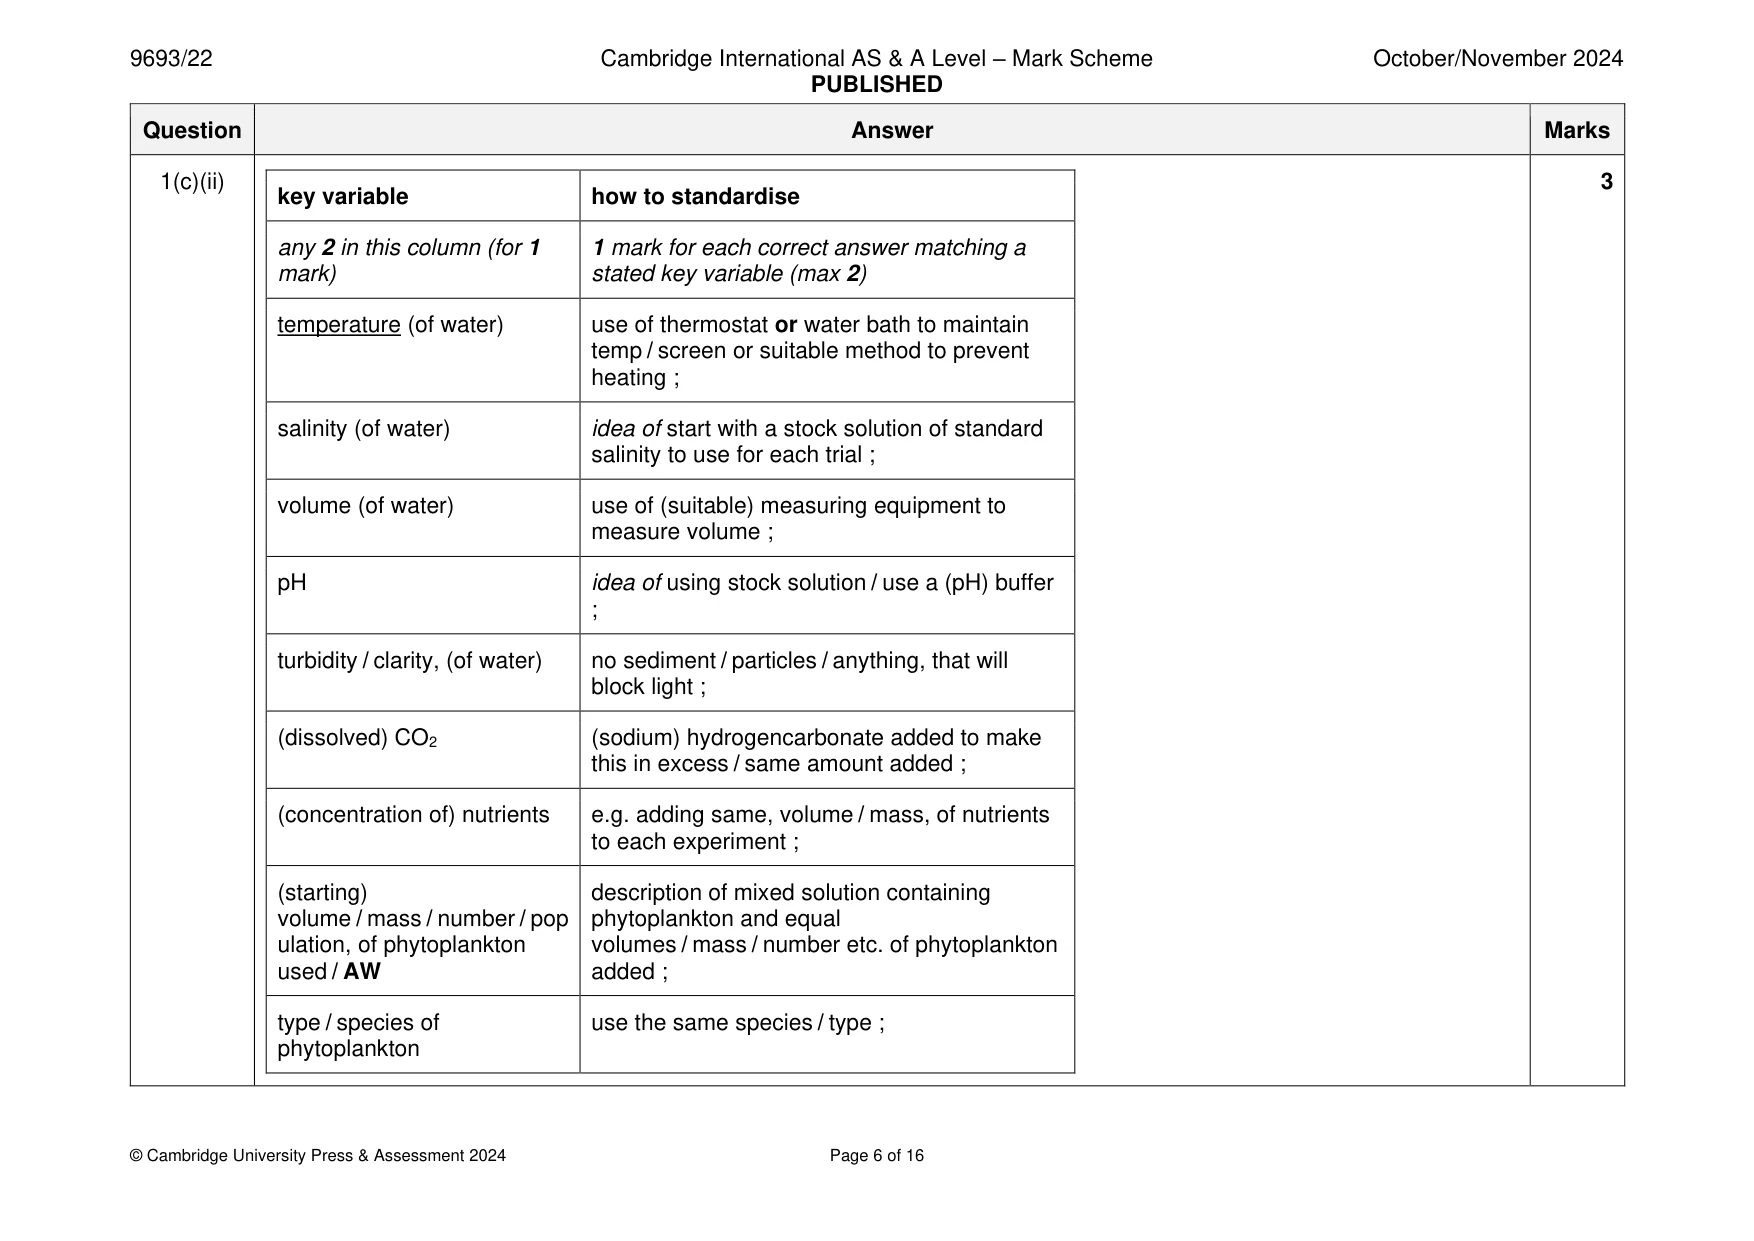
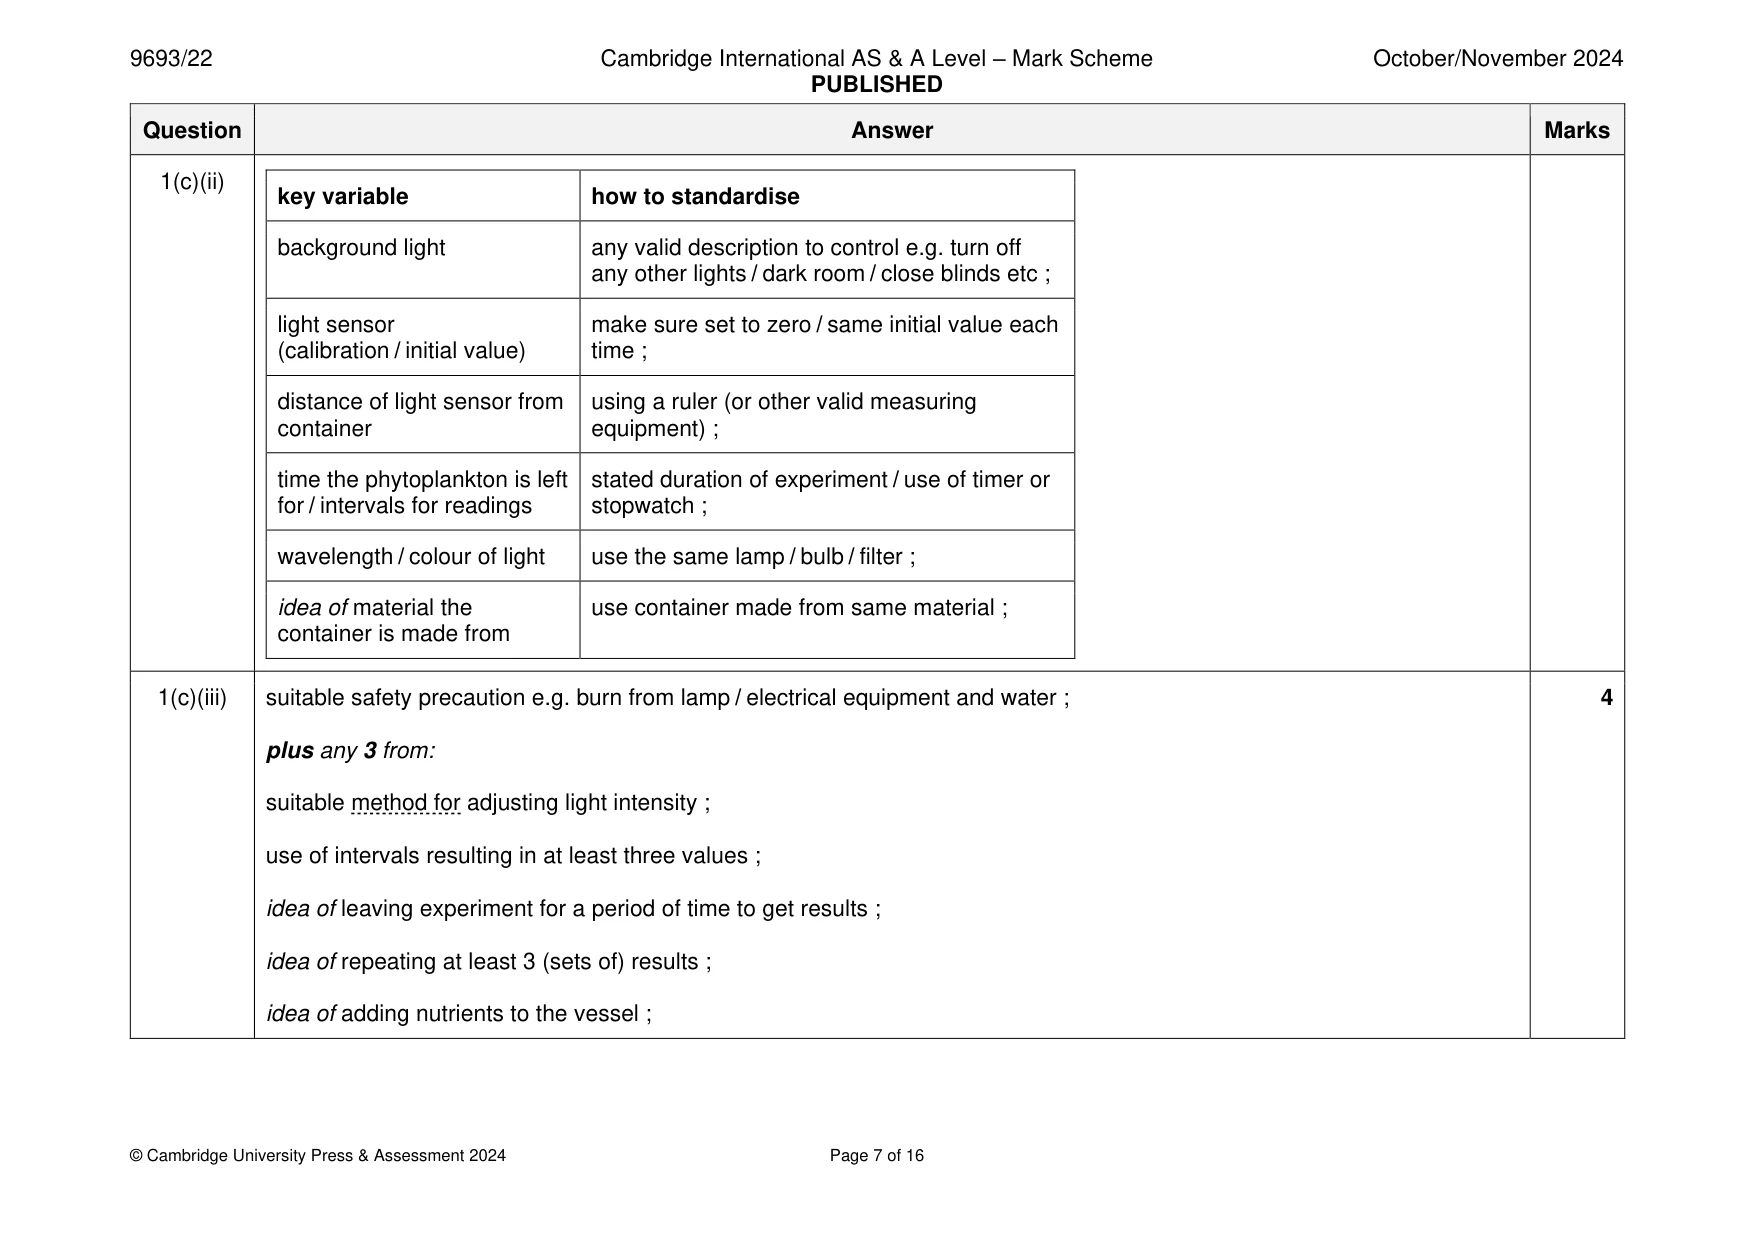
Mark scheme: Question Answer Marks 1(a) line at x axis (anywhere from ‘i’ at start of label to right), continuously getting closer to the y-axis as depth increases ; 2 0 near the top of the bathypelagic zone ; 1(b)(i) carbon dioxide + water → glucose + oxygen ; 1 1(b)(ii) chemosynthesis 1 1(c)(i) (independent variable) (description of variation of) light intensity 1 AND (dependent variable) light transmitted / population or growth of phytoplankton / rate of photosynthesis / AW ; 1(c)(ii) 3 key variable how to standardise any 2 in this column (for 1 1 mark for each correct answer matching a mark) stated key variable (max 2) temperature (of water) use of thermostat or water bath to maintain temp / screen or suitable method to prevent heating ; salinity (of water) idea of start with a stock solution of standard salinity to use for each trial ; volume (of water) use of (suitable) measuring equipment to measure volume ; pH idea of using stock solution / use a (pH) buffer ; turbidity / clarity, (of water) no sediment / particles / anything, that will block light ; (dissolved) CO2 (sodium) hydrogencarbonate added to make this in excess / same amount added ; (concentration of) nutrients e.g. adding same, volume / mass, of nutrients to each experiment ; (starting) description of mixed solution containing volume / mass / number / pop phytoplankton and equal ulation, of phytoplankton volumes / mass / number etc. of phytoplankton used / AW added ; type / species of use the same species / type ; phytoplankton 1(c)(ii) key variable how to standardise background light any valid description to control e.g. turn off any other lights / dark room / close blinds etc ; light sensor make sure set to zero / same initial value each (calibration / initial value) time ; distance of light sensor from using a ruler (or other valid measuring container equipment) ; time the phytoplankton is left stated duration of experiment / use of timer or for / intervals for readings stopwatch ; wavelength / colour of light use the same lamp / bulb / filter ; idea of material the use container made from same material ; container is made from 1(c)(iii) suitable safety precaution e.g. burn from lamp / electrical equipment and water ; 4 plus any 3 from: suitable method for adjusting light intensity ; use of intervals resulting in at least three values ; idea of leaving experiment for a period of time to get results ; idea of repeating at least 3 (sets of) results ; idea of adding nutrients to the vessel ;
Q2 · Scientists investigated food webs in the open ocean
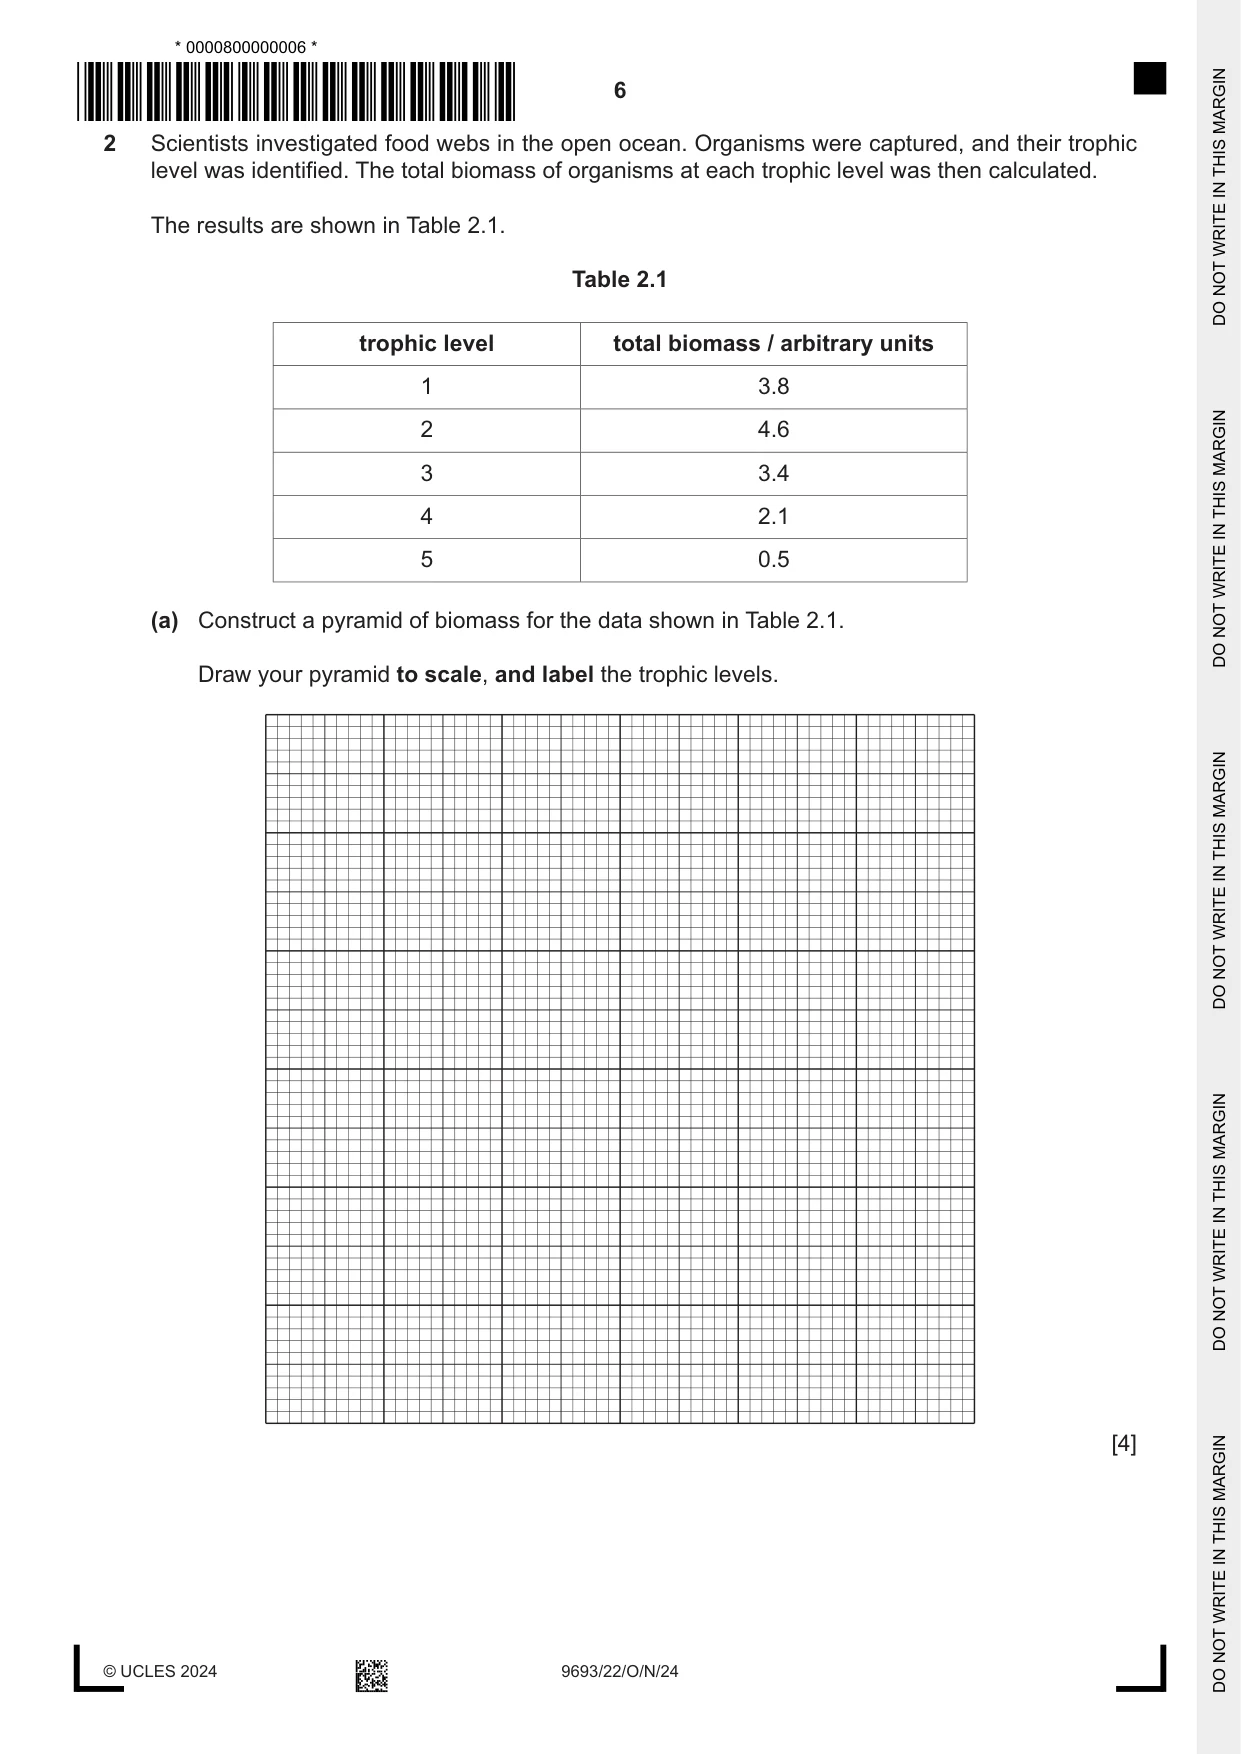
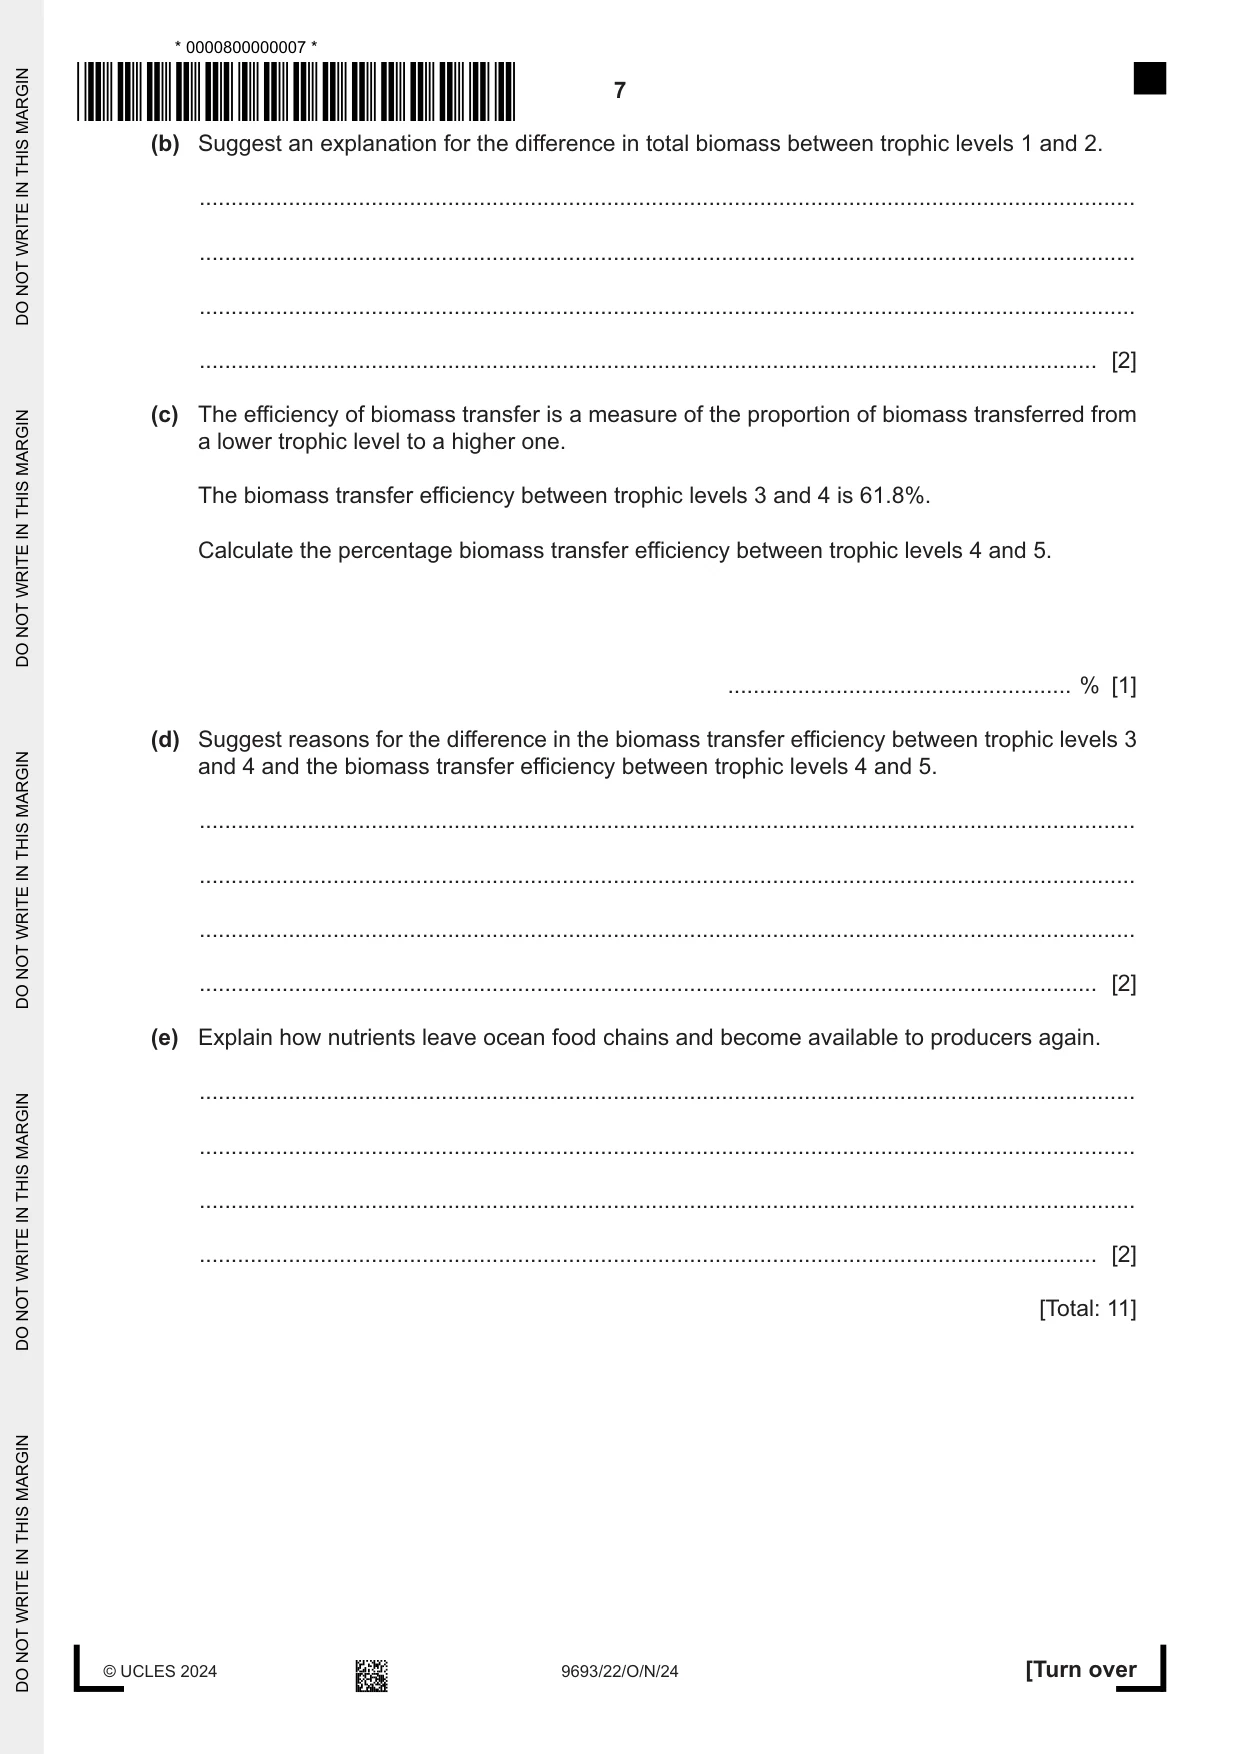
2 Scientists investigated food webs in the open ocean. Organisms were captured, and their trophic level was identified. The total biomass of organisms at each trophic level was then calculated. The results are shown in Table 2.1. Table 2.1 trophic level total biomass / arbitrary units 1 3.8 2 4.6 3 3.4 4 2.1 5 0.5 (a) Construct a pyramid of biomass for the data shown in Table 2.1. Draw your pyramid to scale, and label the trophic levels. [4] (b) Suggest an explanation for the difference in total biomass between trophic levels 1 and 2. ................................................................................................................................................... ................................................................................................................................................... ................................................................................................................................................... ............................................................................................................................................. [2] (c) The efficiency of biomass transfer is a measure of the proportion of biomass transferred from a lower trophic level to a higher one. The biomass transfer efficiency between trophic levels 3 and 4 is 61.8%. Calculate the percentage biomass transfer efficiency between trophic levels 4 and 5. ...................................................... % [1] (d) Suggest reasons for the difference in the biomass transfer efficiency between trophic levels 3 and 4 and the biomass transfer efficiency between trophic levels 4 and 5. ................................................................................................................................................... ................................................................................................................................................... ................................................................................................................................................... ............................................................................................................................................. [2] (e) Explain how nutrients leave ocean food chains and become available to producers again. ................................................................................................................................................... ................................................................................................................................................... ................................................................................................................................................... ............................................................................................................................................. [2] [Total: 11]
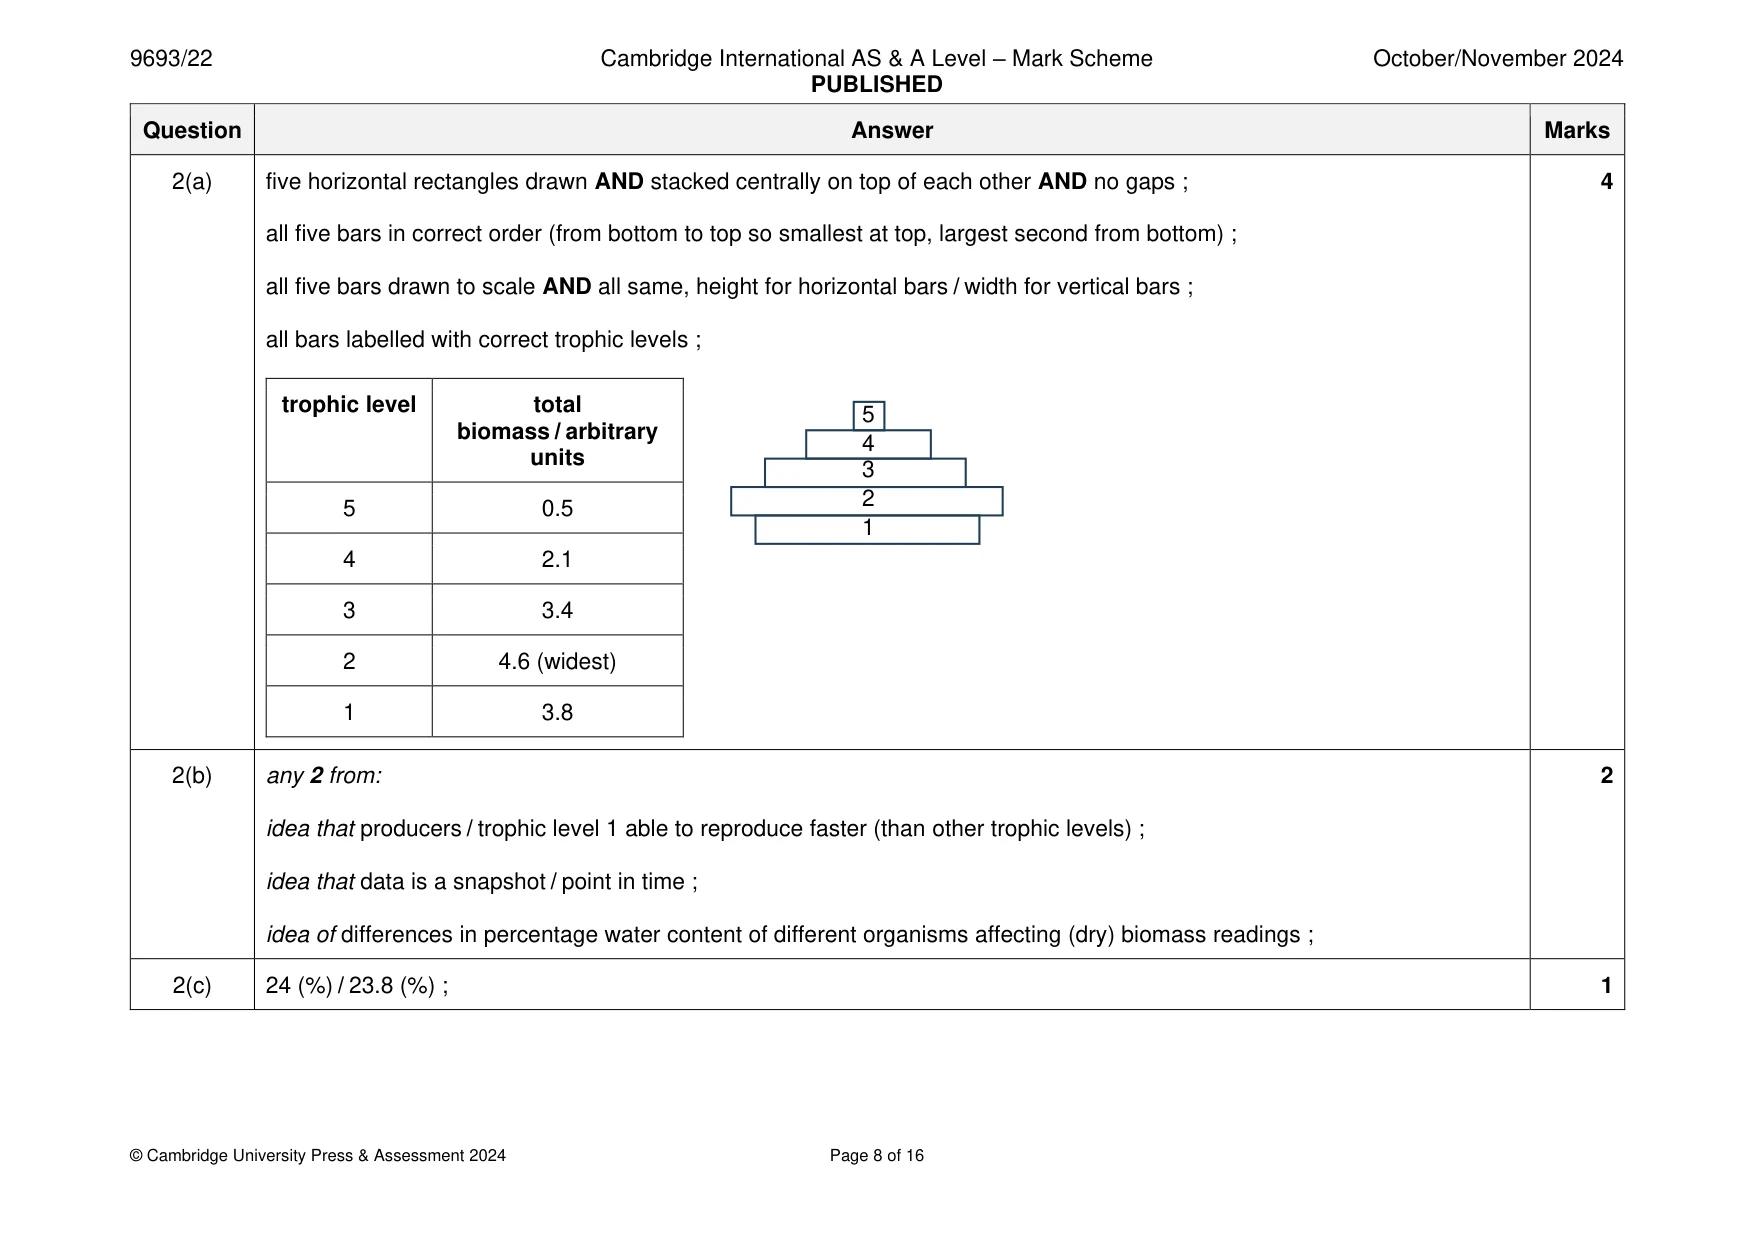
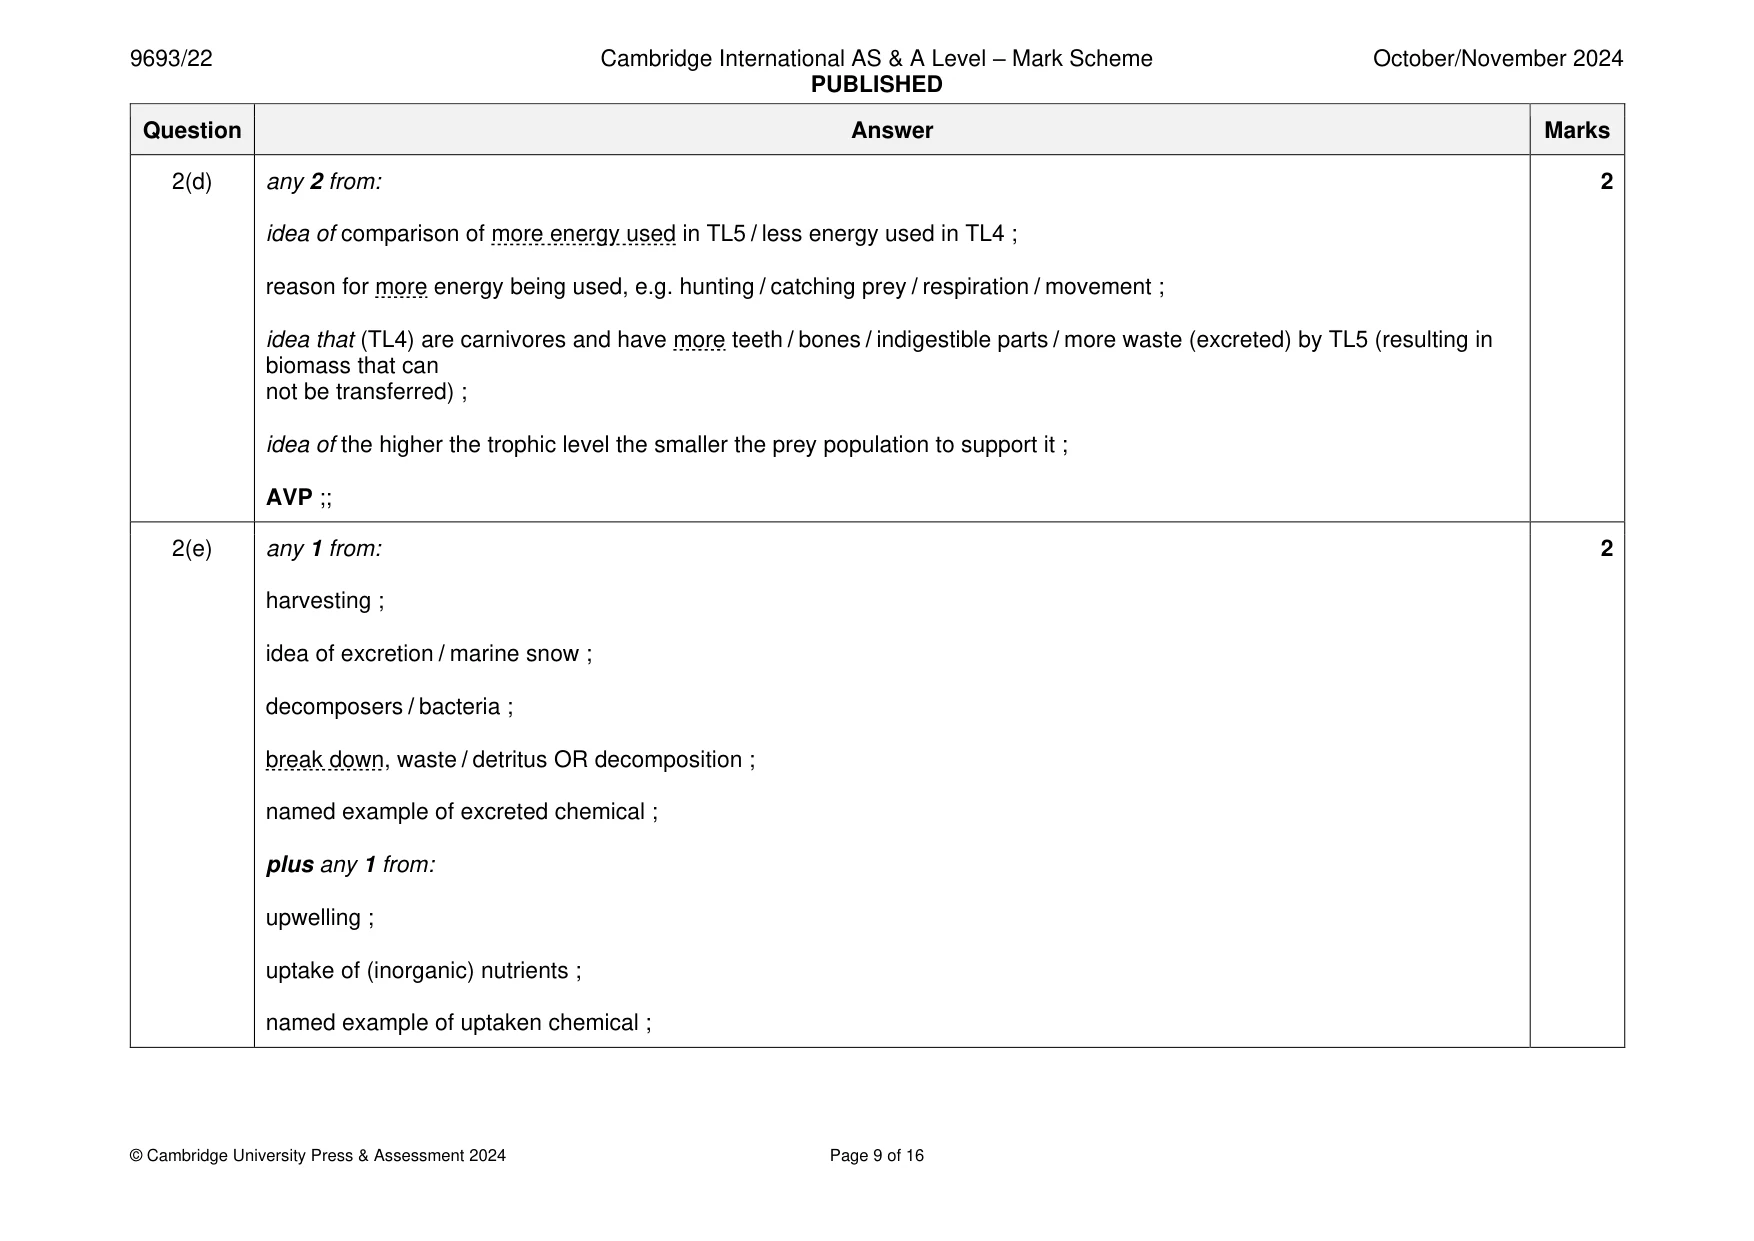
Mark scheme: 2(a) five horizontal rectangles drawn AND stacked centrally on top of each other AND no gaps ; 4 all five bars in correct order (from bottom to top so smallest at top, largest second from bottom) ; all five bars drawn to scale AND all same, height for horizontal bars / width for vertical bars ; all bars labelled with correct trophic levels ; trophic level total 5 biomass / arbitrary 4 units 3 2 5 0.5 1 4 2.1 3 3.4 2 4.6 (widest) 1 3.8 2(b) any 2 from: 2 idea that producers / trophic level 1 able to reproduce faster (than other trophic levels) ; idea that data is a snapshot / point in time ; idea of differences in percentage water content of different organisms affecting (dry) biomass readings ; 2(c) 24 (%) / 23.8 (%) ; 1 2(d) any 2 from: 2 idea of comparison of more energy used in TL5 / less energy used in TL4 ; reason for more energy being used, e.g. hunting / catching prey / respiration / movement ; idea that (TL4) are carnivores and have more teeth / bones / indigestible parts / more waste (excreted) by TL5 (resulting in biomass that can not be transferred) ; idea of the higher the trophic level the smaller the prey population to support it ; AVP ;; 2(e) any 1 from: 2 harvesting ; idea of excretion / marine snow ; decomposers / bacteria ; break down, waste / detritus OR decomposition ; named example of excreted chemical ; plus any 1 from: upwelling ; uptake of (inorganic) nutrients ; named example of uptaken chemical ;
Q3 · Scientists collected a series of measurements from a ship travelling across the Atlantic…
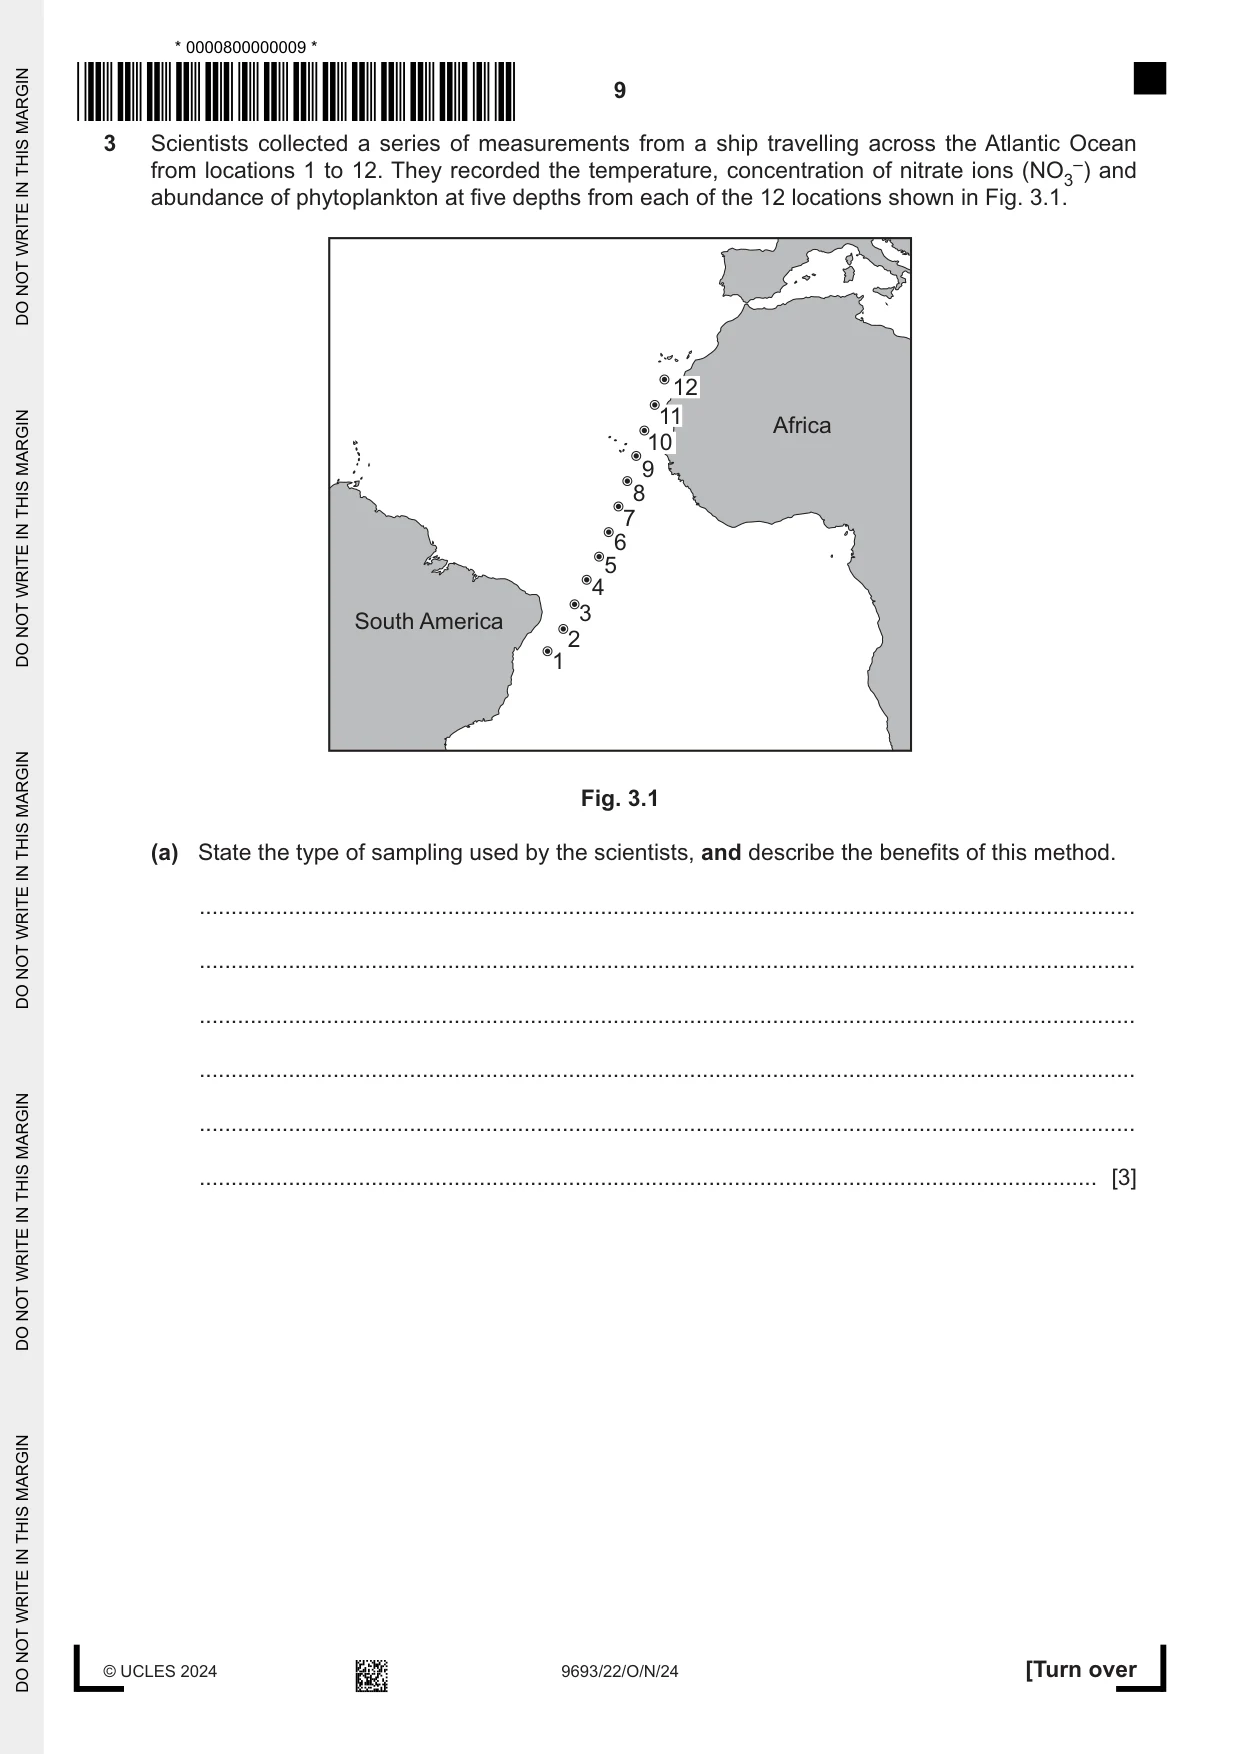
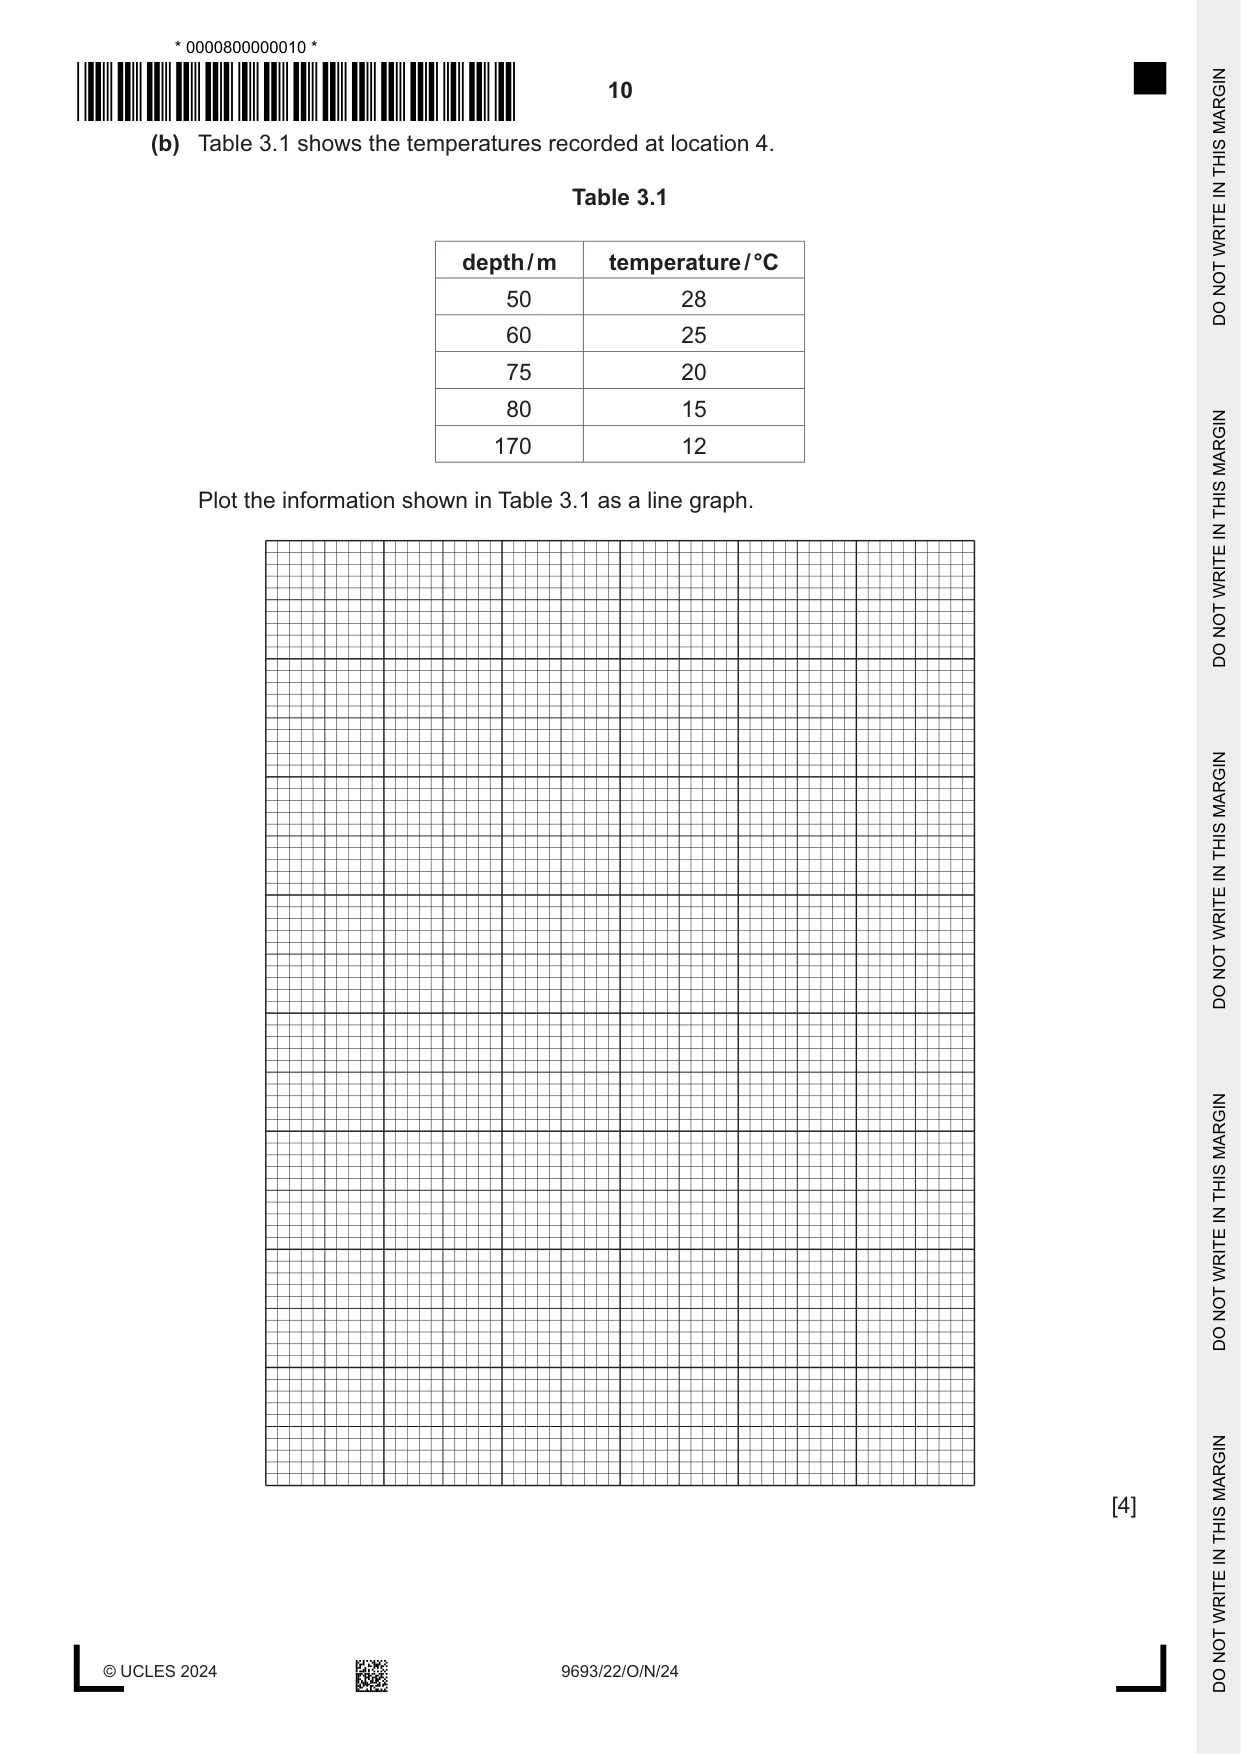
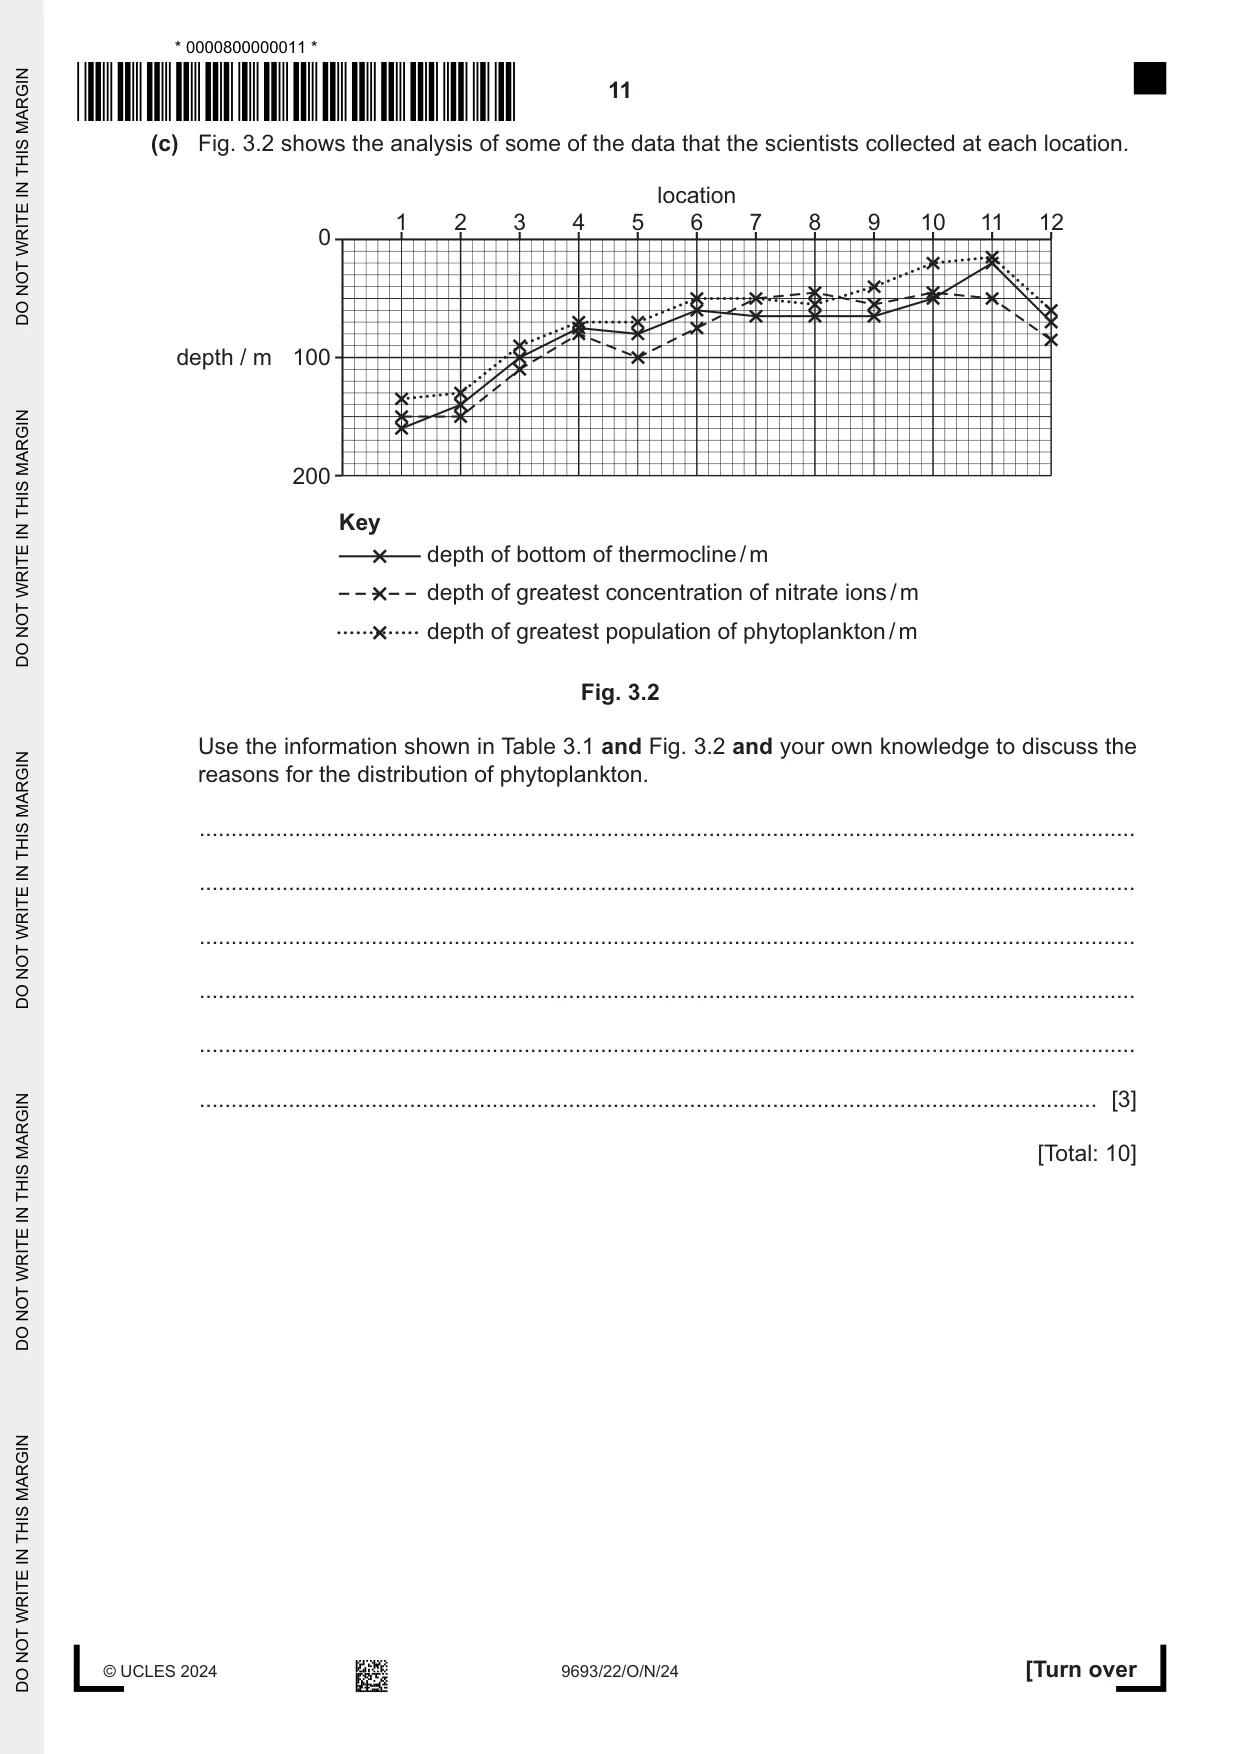
3 Scientists collected a series of measurements from a ship travelling across the Atlantic Ocean from locations 1 to 12. They recorded the temperature, concentration of nitrate ions (NO3–) and abundance of phytoplankton at five depths from each of the 12 locations shown in Fig. 3.1. 1212 1111 Africa 1010 9 8 7 6 5 4 3 South America 2 1 Fig. 3.1 (a) State the type of sampling used by the scientists, and describe the benefits of this method. ................................................................................................................................................... ................................................................................................................................................... ................................................................................................................................................... ................................................................................................................................................... ................................................................................................................................................... ............................................................................................................................................. [3] (b) Table 3.1 shows the temperatures recorded at location 4. Table 3.1 depth / m temperature / °C 50 28 60 25 75 20 80 15 170 12 Plot the information shown in Table 3.1 as a line graph. [4] (c) Fig. 3.2 shows the analysis of some of the data that the scientists collected at each location. location 1 2 3 4 5 6 7 8 9 10 11 12 0 depth / m 100 200 Key depth of bottom of thermocline / m depth of greatest concentration of nitrate ions / m depth of greatest population of phytoplankton / m Fig. 3.2 Use the information shown in Table 3.1 and Fig. 3.2 and your own knowledge to discuss the reasons for the distribution of phytoplankton. ................................................................................................................................................... ................................................................................................................................................... ................................................................................................................................................... ................................................................................................................................................... ................................................................................................................................................... ............................................................................................................................................. [3] [Total: 10]
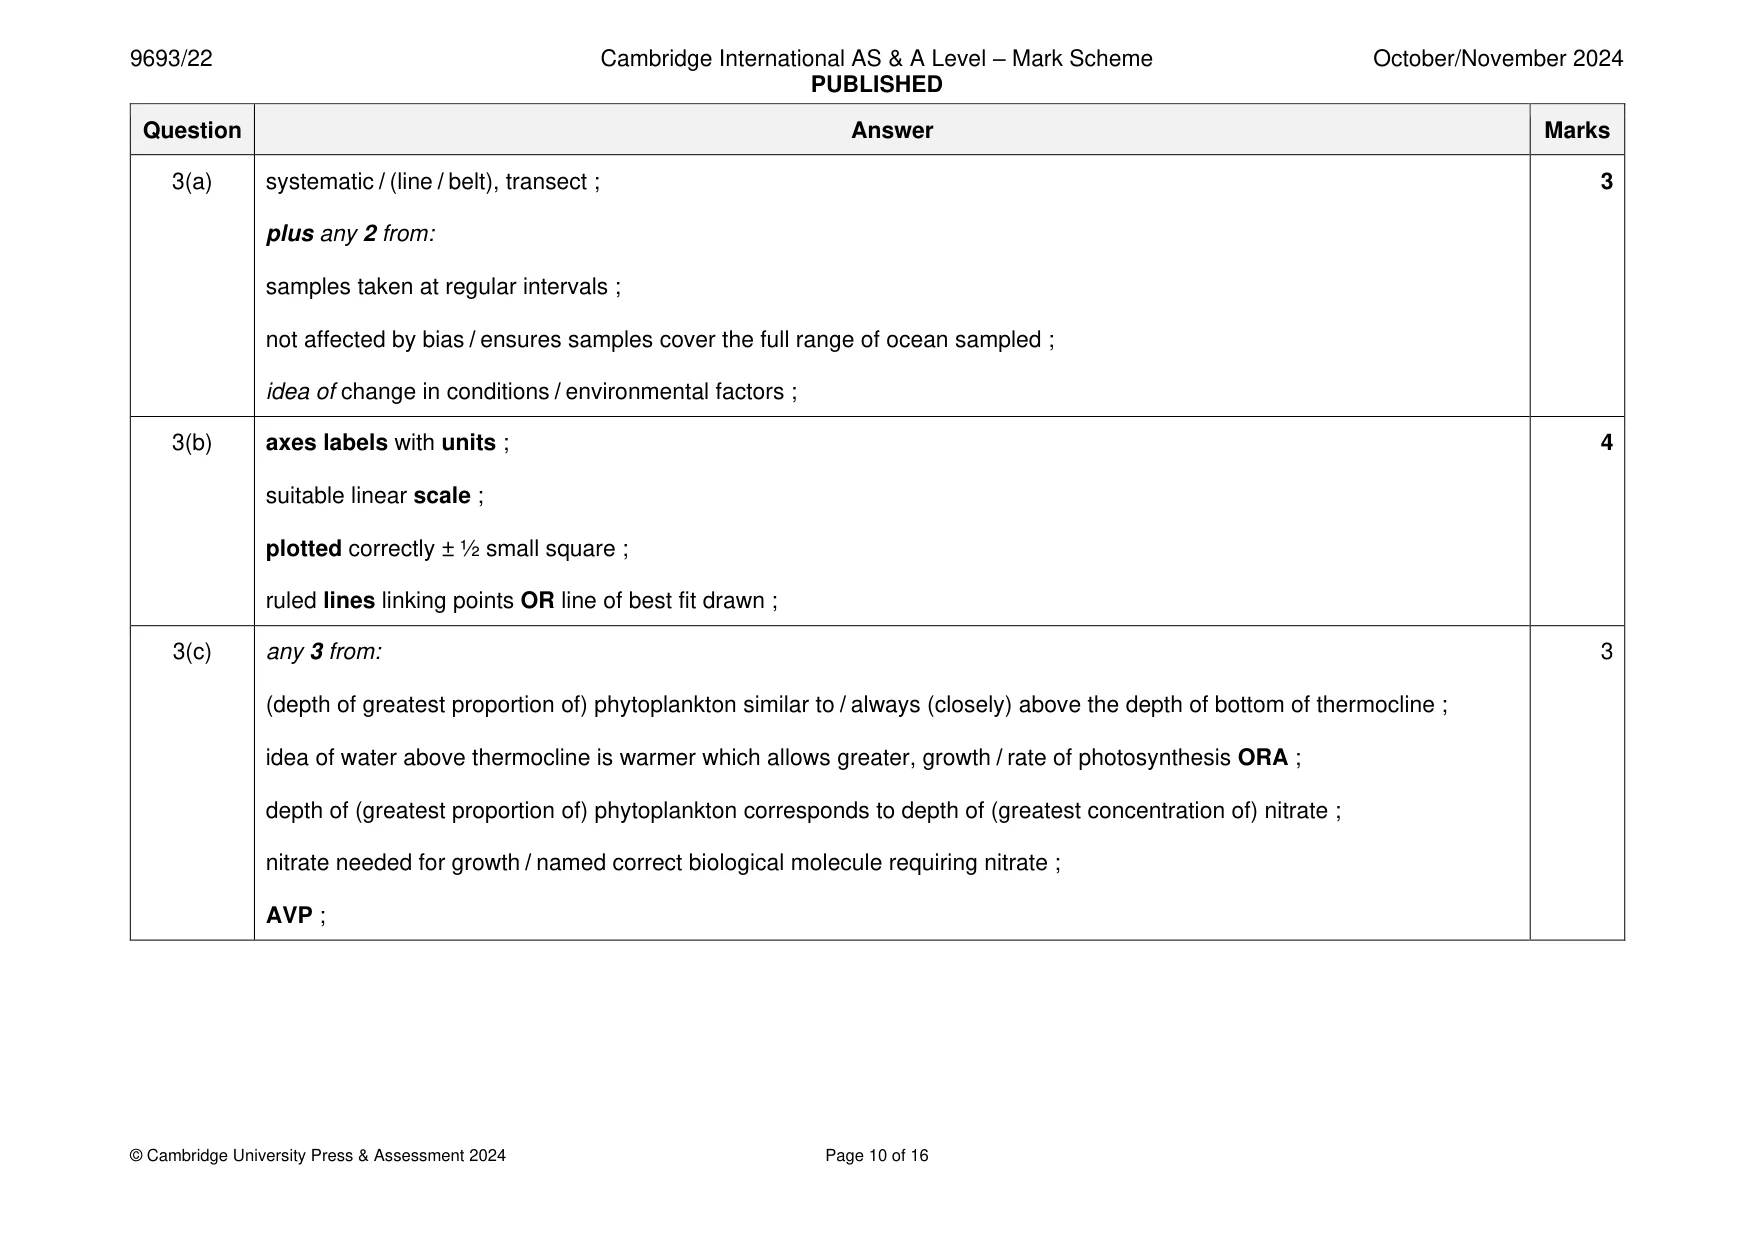
Mark scheme: 3(a) systematic / (line / belt), transect ; 3 plus any 2 from: samples taken at regular intervals ; not affected by bias / ensures samples cover the full range of ocean sampled ; idea of change in conditions / environmental factors ; 3(b) axes labels with units ; 4 suitable linear scale ; plotted correctly ± ½ small square ; ruled lines linking points OR line of best fit drawn ; 3(c) any 3 from: 3 (depth of greatest proportion of) phytoplankton similar to / always (closely) above the depth of bottom of thermocline ; idea of water above thermocline is warmer which allows greater, growth / rate of photosynthesis ORA ; depth of (greatest proportion of) phytoplankton corresponds to depth of (greatest concentration of) nitrate ; nitrate needed for growth / named correct biological molecule requiring nitrate ; AVP ;
Q4 · Scientists investigated the thickness of the shells of sea snails around two underwater…
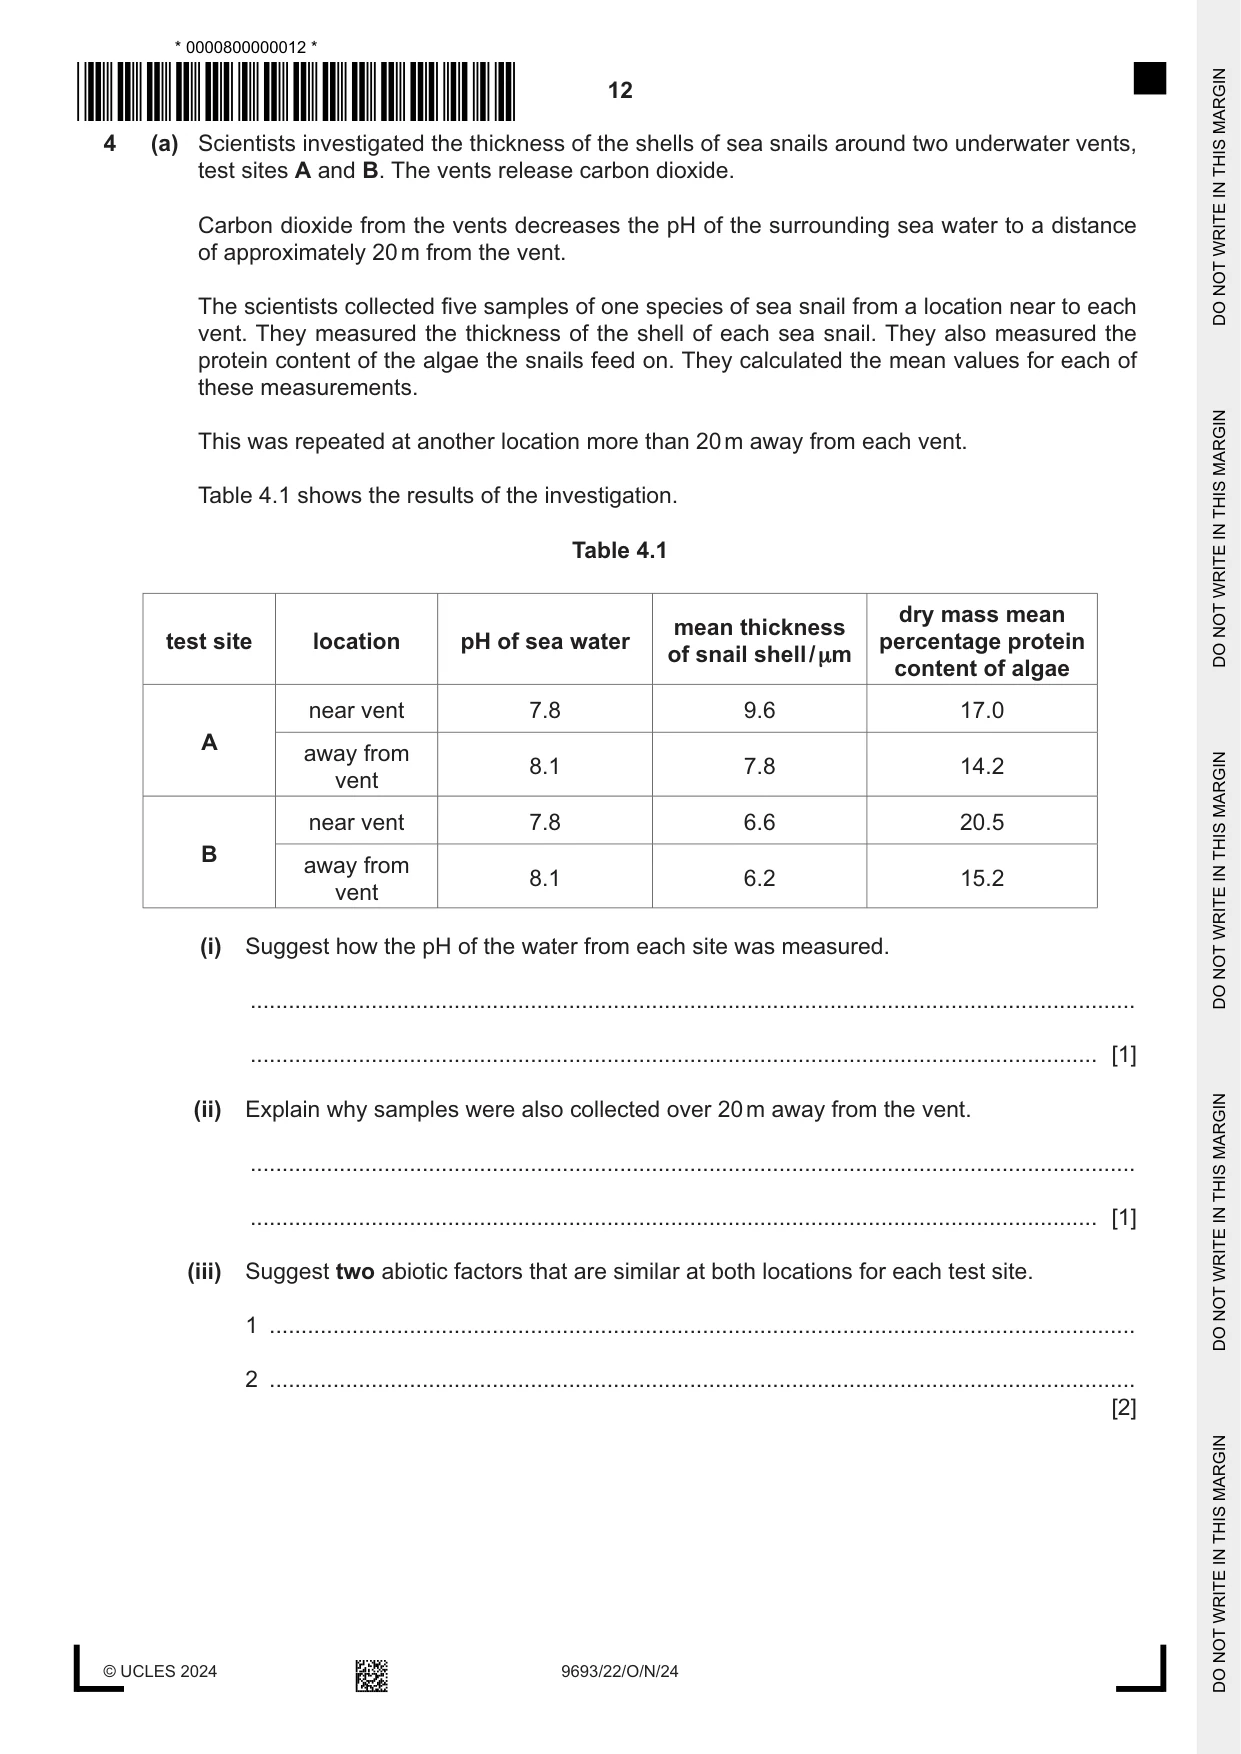
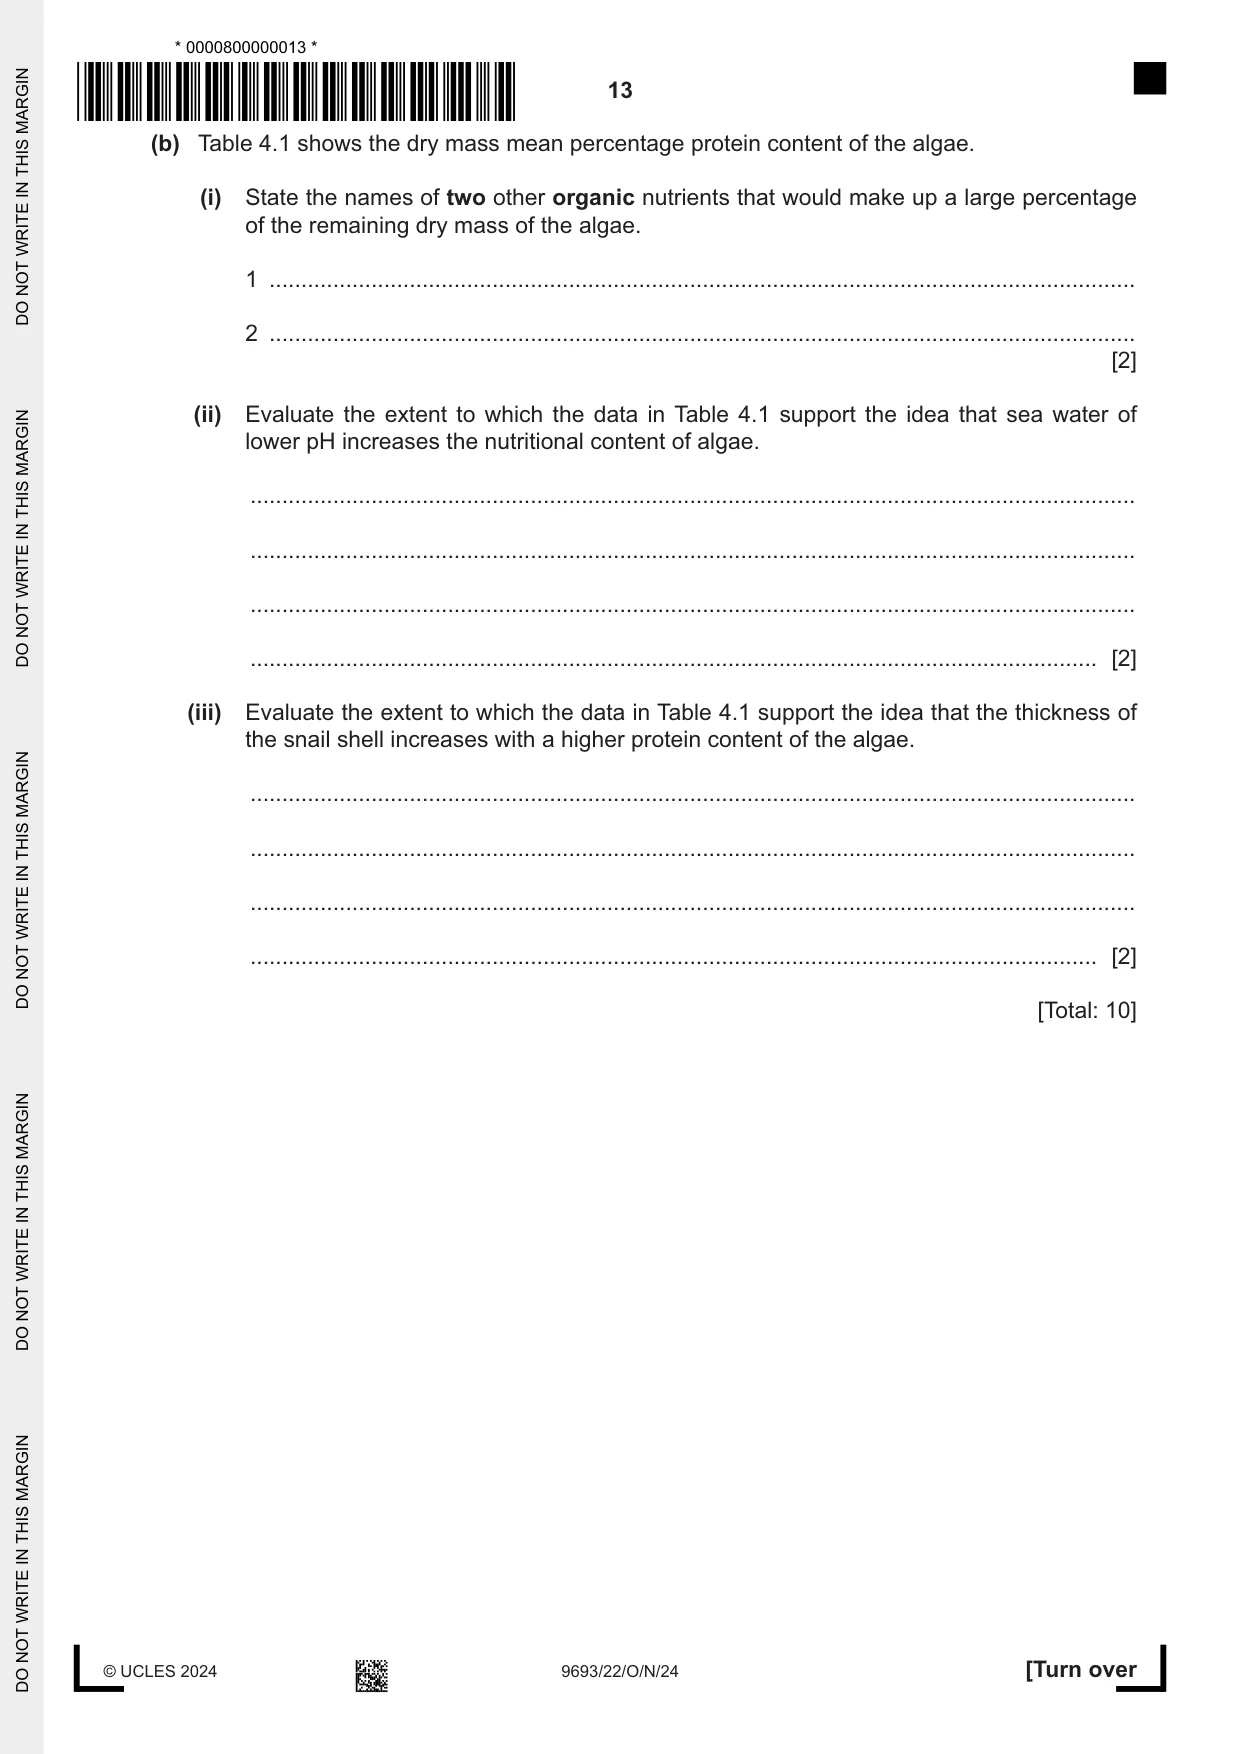
4 (a) Scientists investigated the thickness of the shells of sea snails around two underwater vents, test sites A and B. The vents release carbon dioxide. Carbon dioxide from the vents decreases the pH of the surrounding sea water to a distance of approximately 20 m from the vent. The scientists collected five samples of one species of sea snail from a location near to each vent. They measured the thickness of the shell of each sea snail. They also measured the protein content of the algae the snails feed on. They calculated the mean values for each of these measurements. This was repeated at another location more than 20 m away from each vent. Table 4.1 shows the results of the investigation. Table 4.1 dry mass mean mean thickness test site location pH of sea water percentage protein of snail shell / µm content of algae near vent 7.8 9.6 17.0 A away from 8.1 7.8 14.2 vent near vent 7.8 6.6 20.5 B away from 8.1 6.2 15.2 vent (i) Suggest how the pH of the water from each site was measured. ........................................................................................................................................... ..................................................................................................................................... [1] (ii) Explain why samples were also collected over 20 m away from the vent. ........................................................................................................................................... ..................................................................................................................................... [1] (iii) Suggest two abiotic factors that are similar at both locations for each test site. 1 ........................................................................................................................................ 2 ........................................................................................................................................ [2] (b) Table 4.1 shows the dry mass mean percentage protein content of the algae. (i) State the names of two other organic nutrients that would make up a large percentage of the remaining dry mass of the algae. 1 ........................................................................................................................................ 2 ........................................................................................................................................ [2] (ii) Evaluate the extent to which the data in Table 4.1 support the idea that sea water of lower pH increases the nutritional content of algae. ........................................................................................................................................... ........................................................................................................................................... ........................................................................................................................................... ..................................................................................................................................... [2] (iii) Evaluate the extent to which the data in Table 4.1 support the idea that the thickness of the snail shell increases with a higher protein content of the algae. ........................................................................................................................................... ........................................................................................................................................... ........................................................................................................................................... ..................................................................................................................................... [2] [Total: 10]
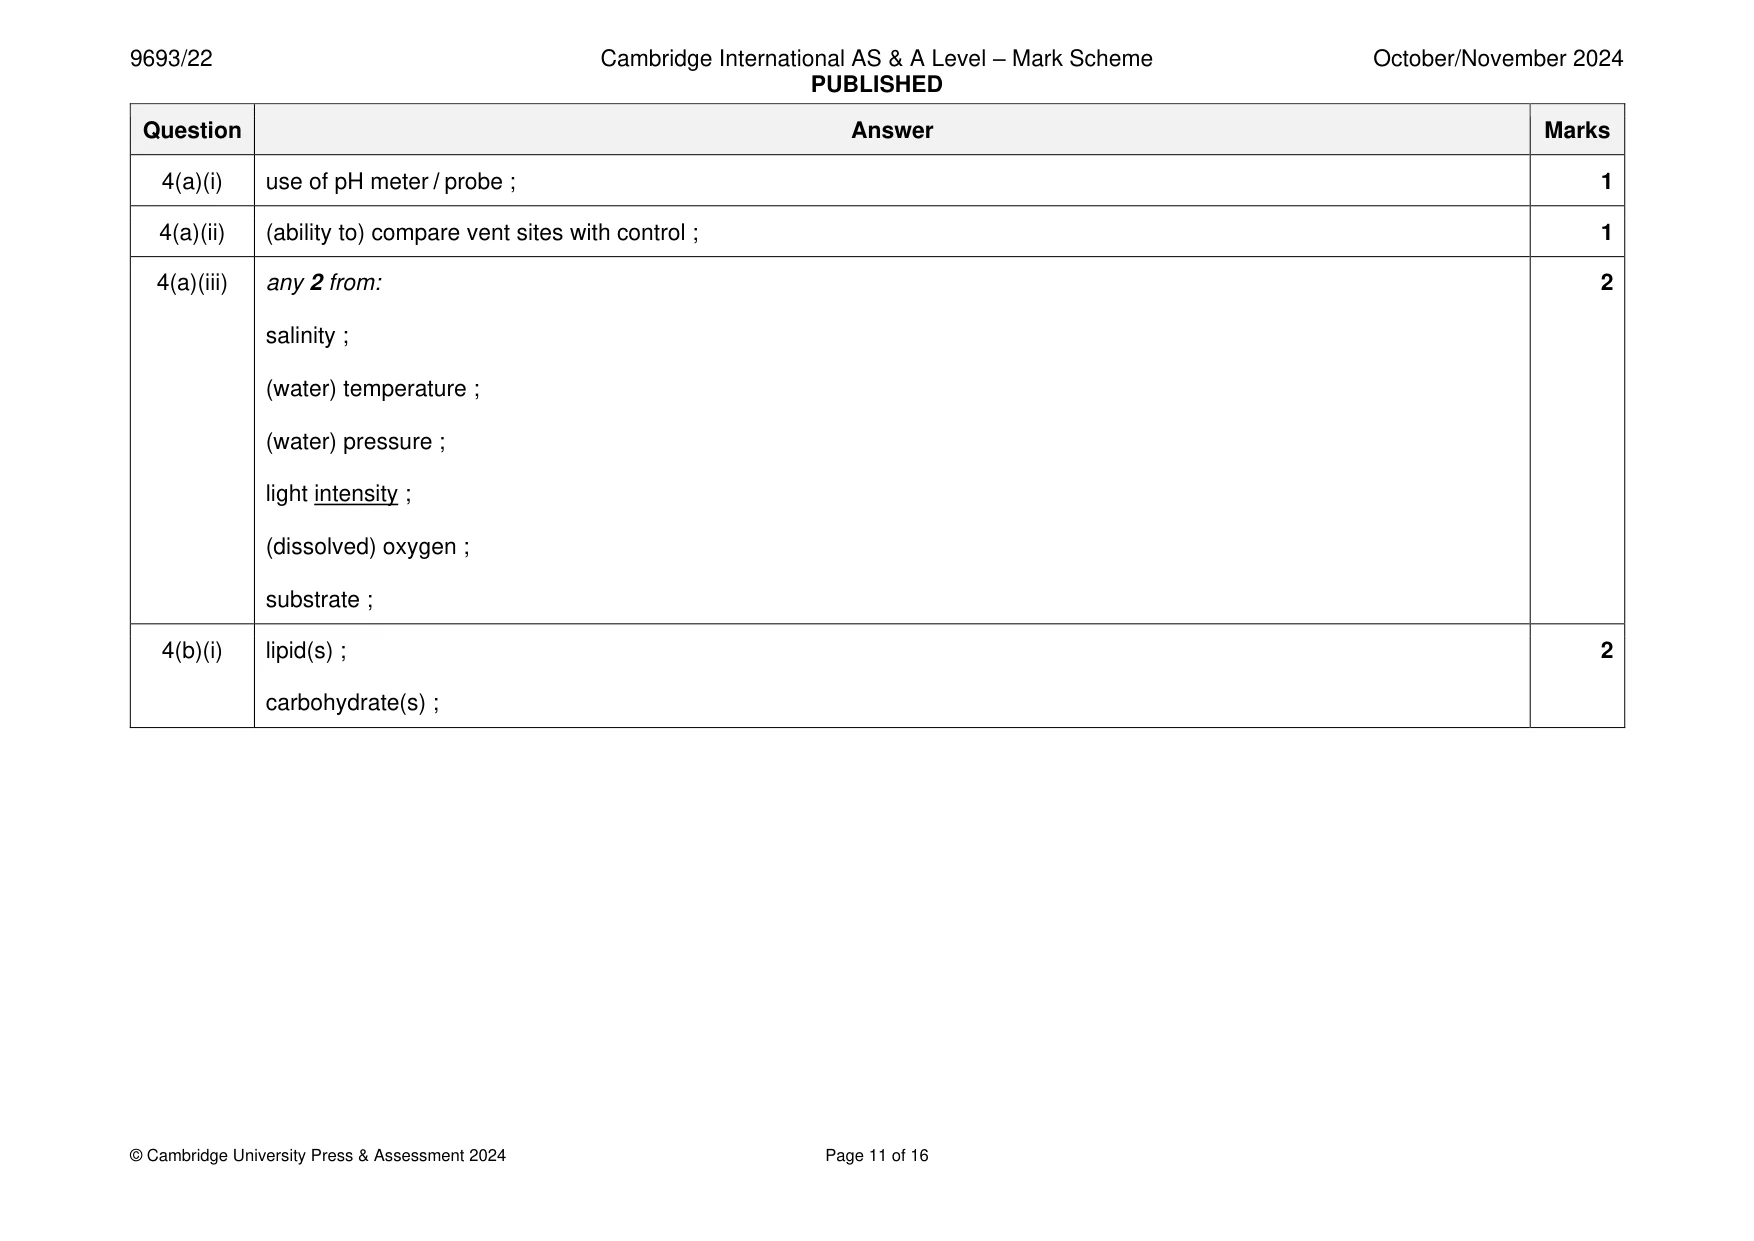
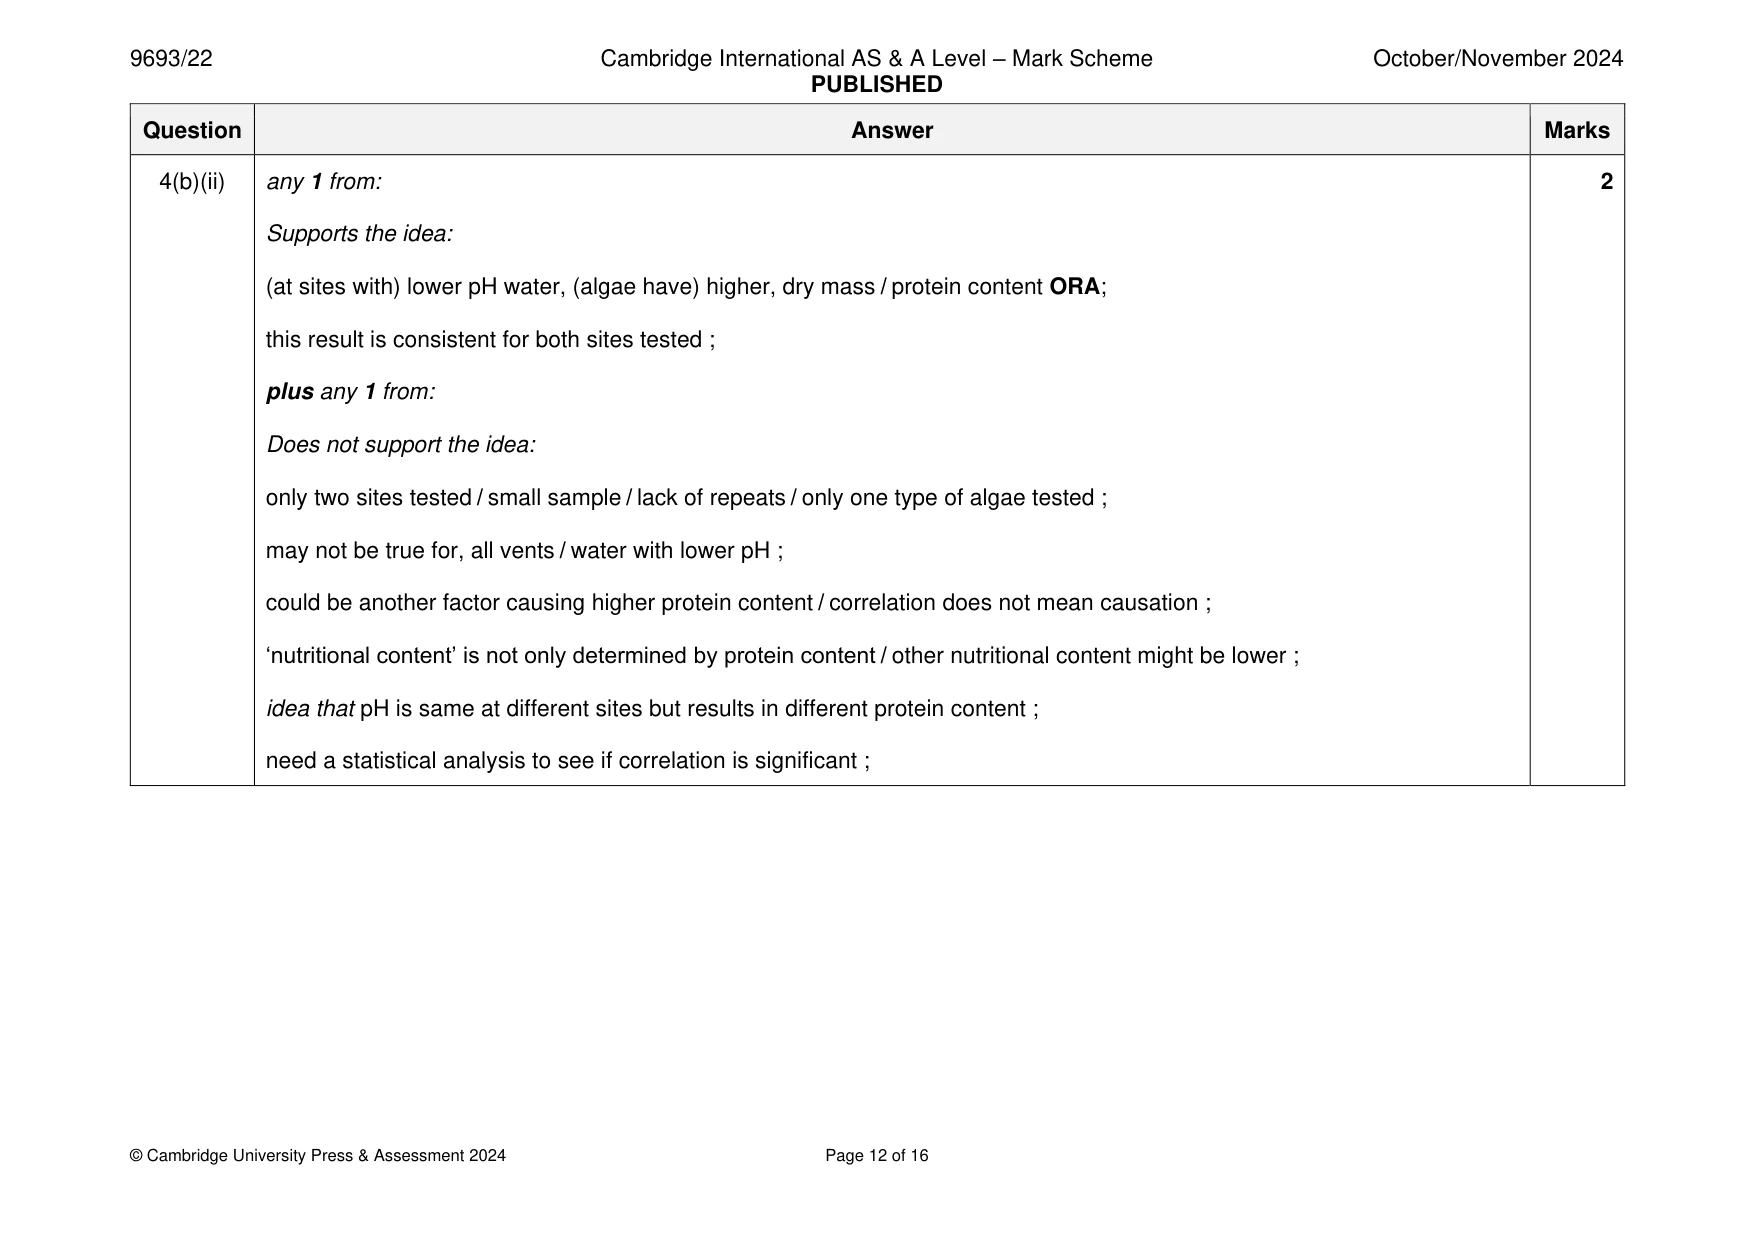
Mark scheme: 4(a)(i) use of pH meter / probe ; 1 4(a)(ii) (ability to) compare vent sites with control ; 1 4(a)(iii) any 2 from: 2 salinity ; (water) temperature ; (water) pressure ; light intensity ; (dissolved) oxygen ; substrate ; 4(b)(i) lipid(s) ; 2 carbohydrate(s) ; 4(b)(ii) any 1 from: 2 Supports the idea: (at sites with) lower pH water, (algae have) higher, dry mass / protein content ORA; this result is consistent for both sites tested ; plus any 1 from: Does not support the idea: only two sites tested / small sample / lack of repeats / only one type of algae tested ; may not be true for, all vents / water with lower pH ; could be another factor causing higher protein content / correlation does not mean causation ; ‘nutritional content’ is not only determined by protein content / other nutritional content might be lower ; idea that pH is same at different sites but results in different protein content ; need a statistical analysis to see if correlation is significant ; 4(b)(iii) any 2 from: 2 supports the idea: (near vent) at both test sites the mean protein content of algae and mean thickness of shell is greater (than away from vent) ; does not support the idea: only two sites tested / small sample / lack of repeats OR may not be true for, all vents / water with lower pH ; another factor causing thicker shells ; site B has a higher protein content even though the mean thickness of the snail shell is lower than site A ;
Q5 · A brittle star which belongs to the echinoderm phylum
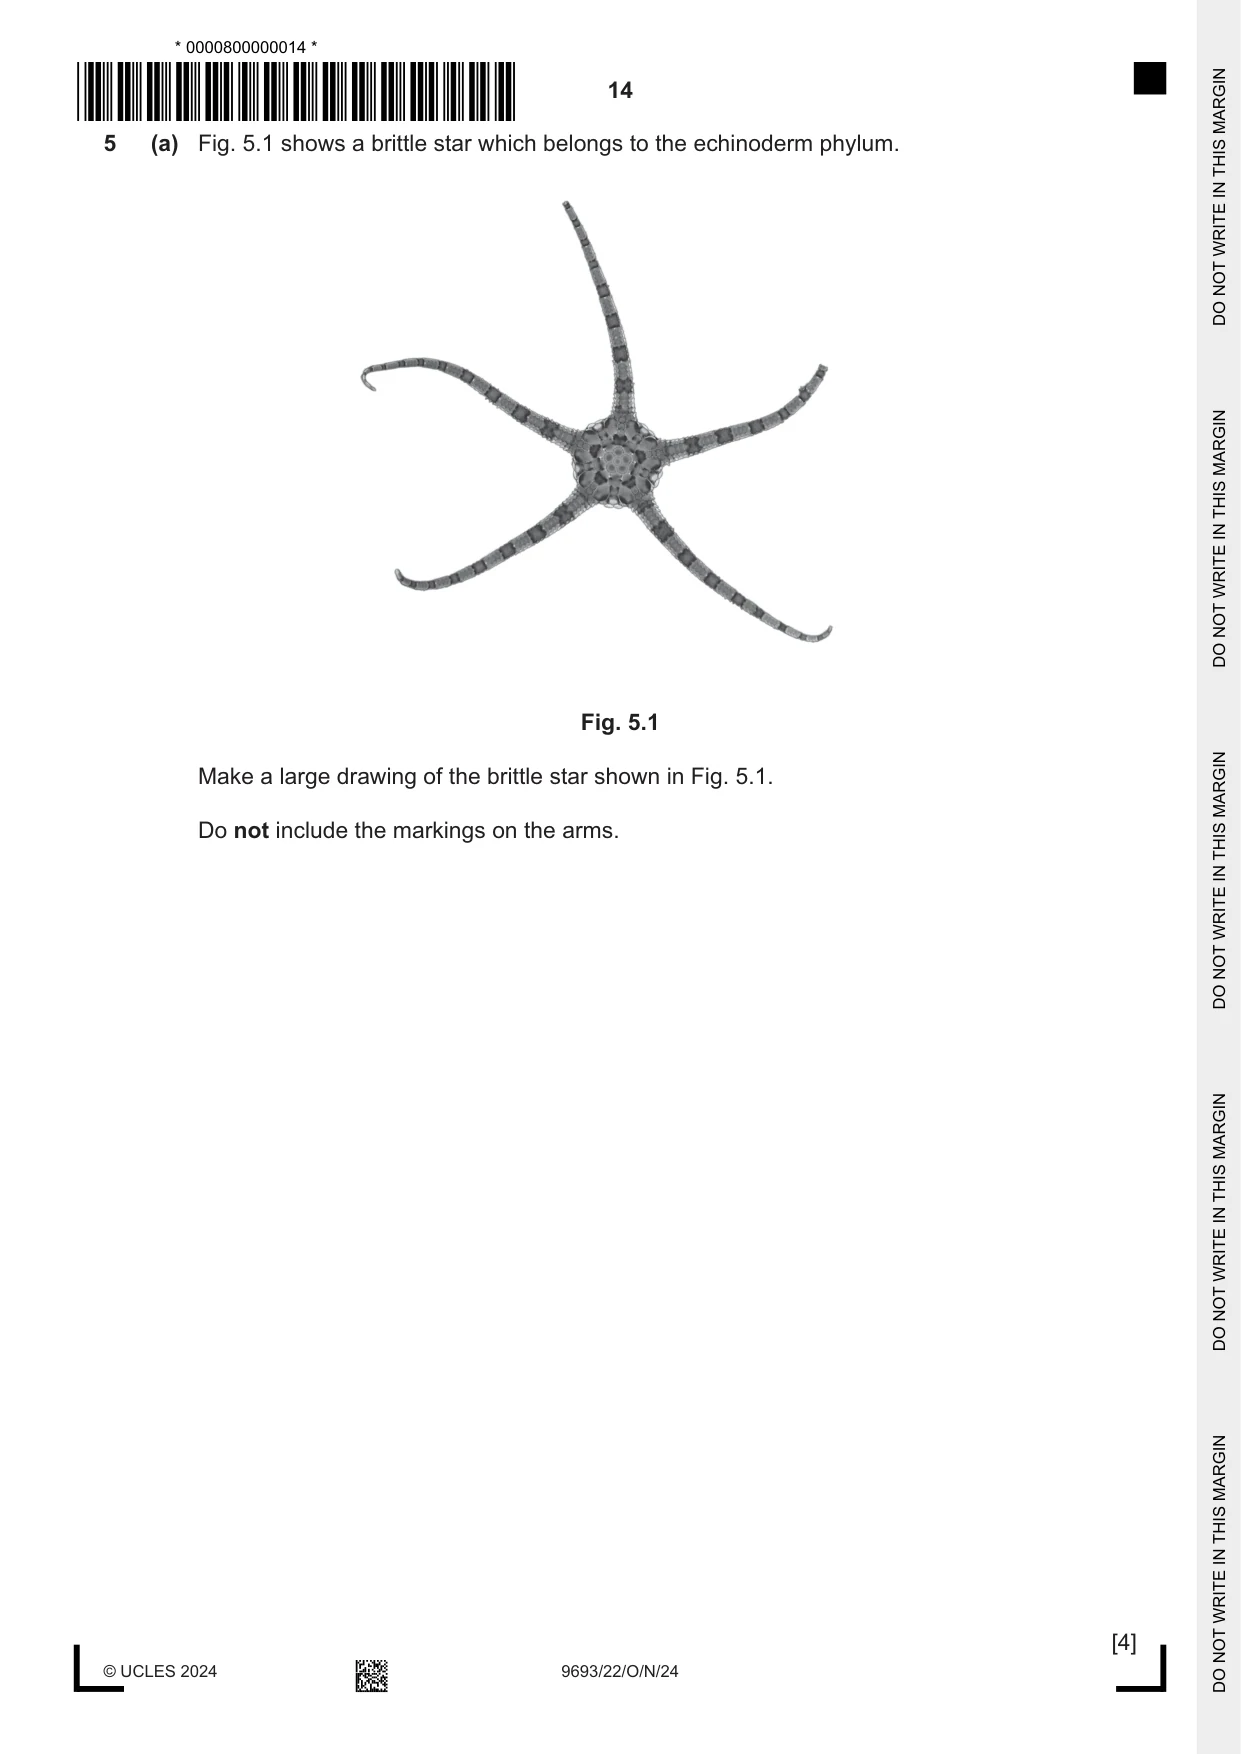
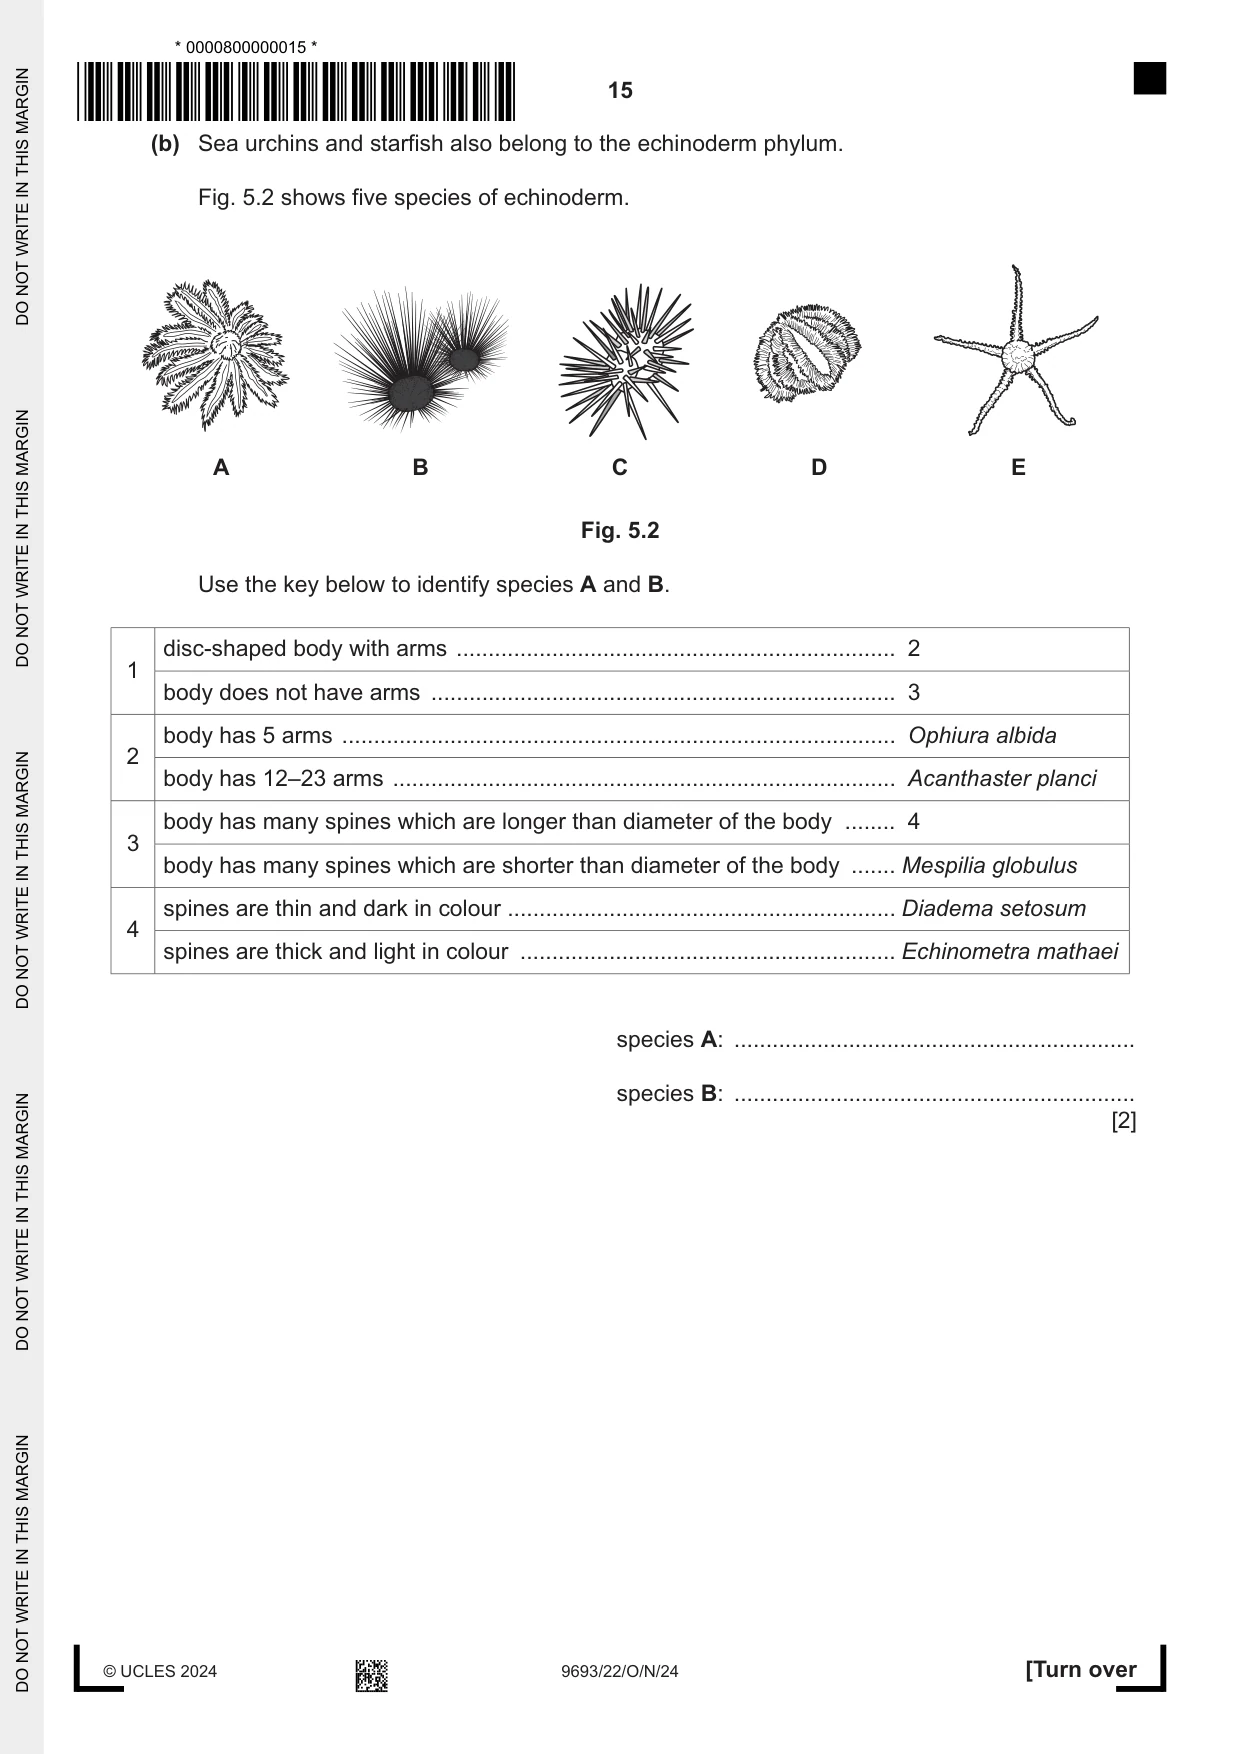
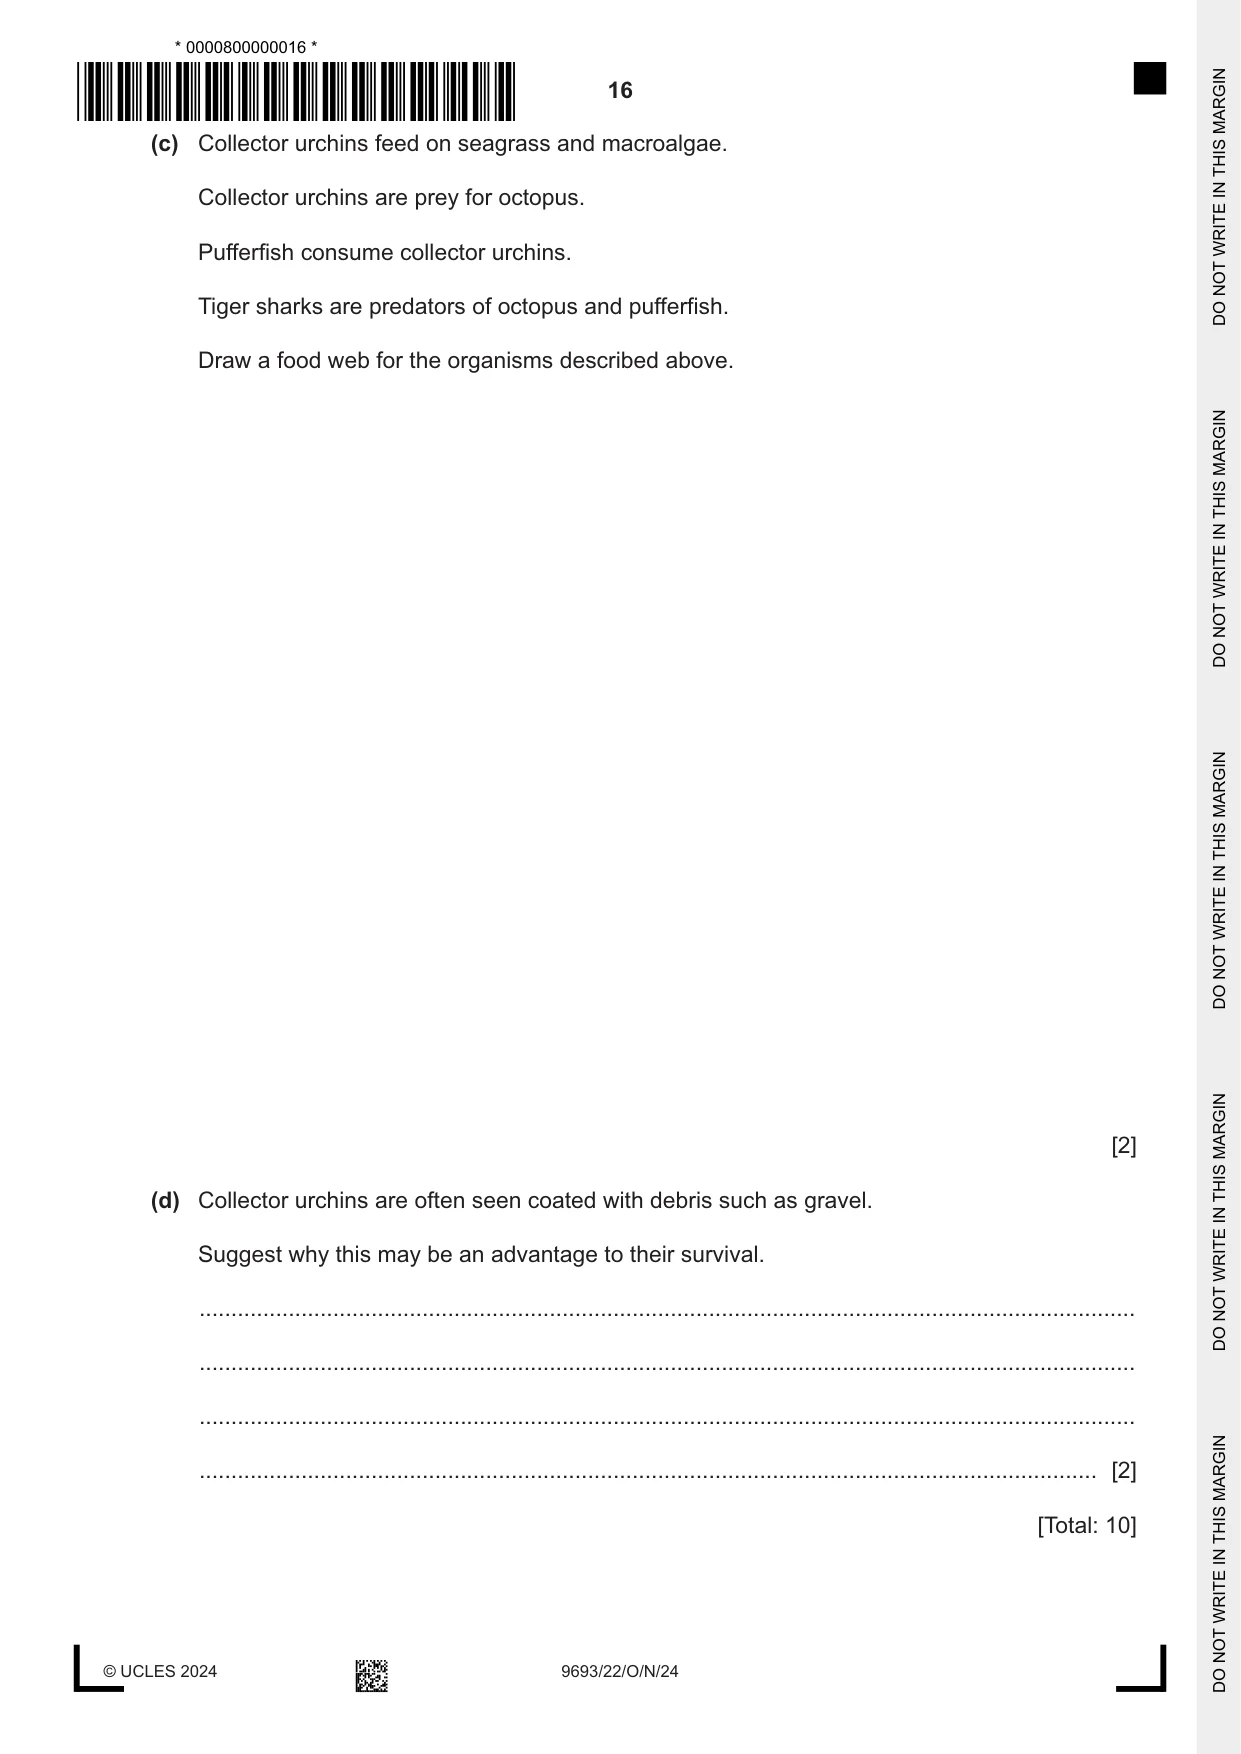
5 (a) Fig. 5.1 shows a brittle star which belongs to the echinoderm phylum. Fig. 5.1 Make a large drawing of the brittle star shown in Fig. 5.1. Do not include the markings on the arms. [4] (b) Sea urchins and starfish also belong to the echinoderm phylum. Fig. 5.2 shows five species of echinoderm. A B C D E Fig. 5.2 Use the key below to identify species A and B. disc-shaped body with arms ..................................................................... 2 1 body does not have arms ......................................................................... 3 body has 5 arms ....................................................................................... Ophiura albida 2 body has 12–23 arms ............................................................................... Acanthaster planci body has many spines which are longer than diameter of the body ........ 4 3 body has many spines which are shorter than diameter of the body ....... Mespilia globulus spines are thin and dark in colour ............................................................. Diadema setosum 4 spines are thick and light in colour ........................................................... Echinometra mathaei species A: ............................................................... species B: ............................................................... [2] (c) Collector urchins feed on seagrass and macroalgae. Collector urchins are prey for octopus. Pufferfish consume collector urchins. Tiger sharks are predators of octopus and pufferfish. Draw a food web for the organisms described above. [2] (d) Collector urchins are often seen coated with debris such as gravel. Suggest why this may be an advantage to their survival. ................................................................................................................................................... ................................................................................................................................................... ................................................................................................................................................... ............................................................................................................................................. [2] [Total: 10]
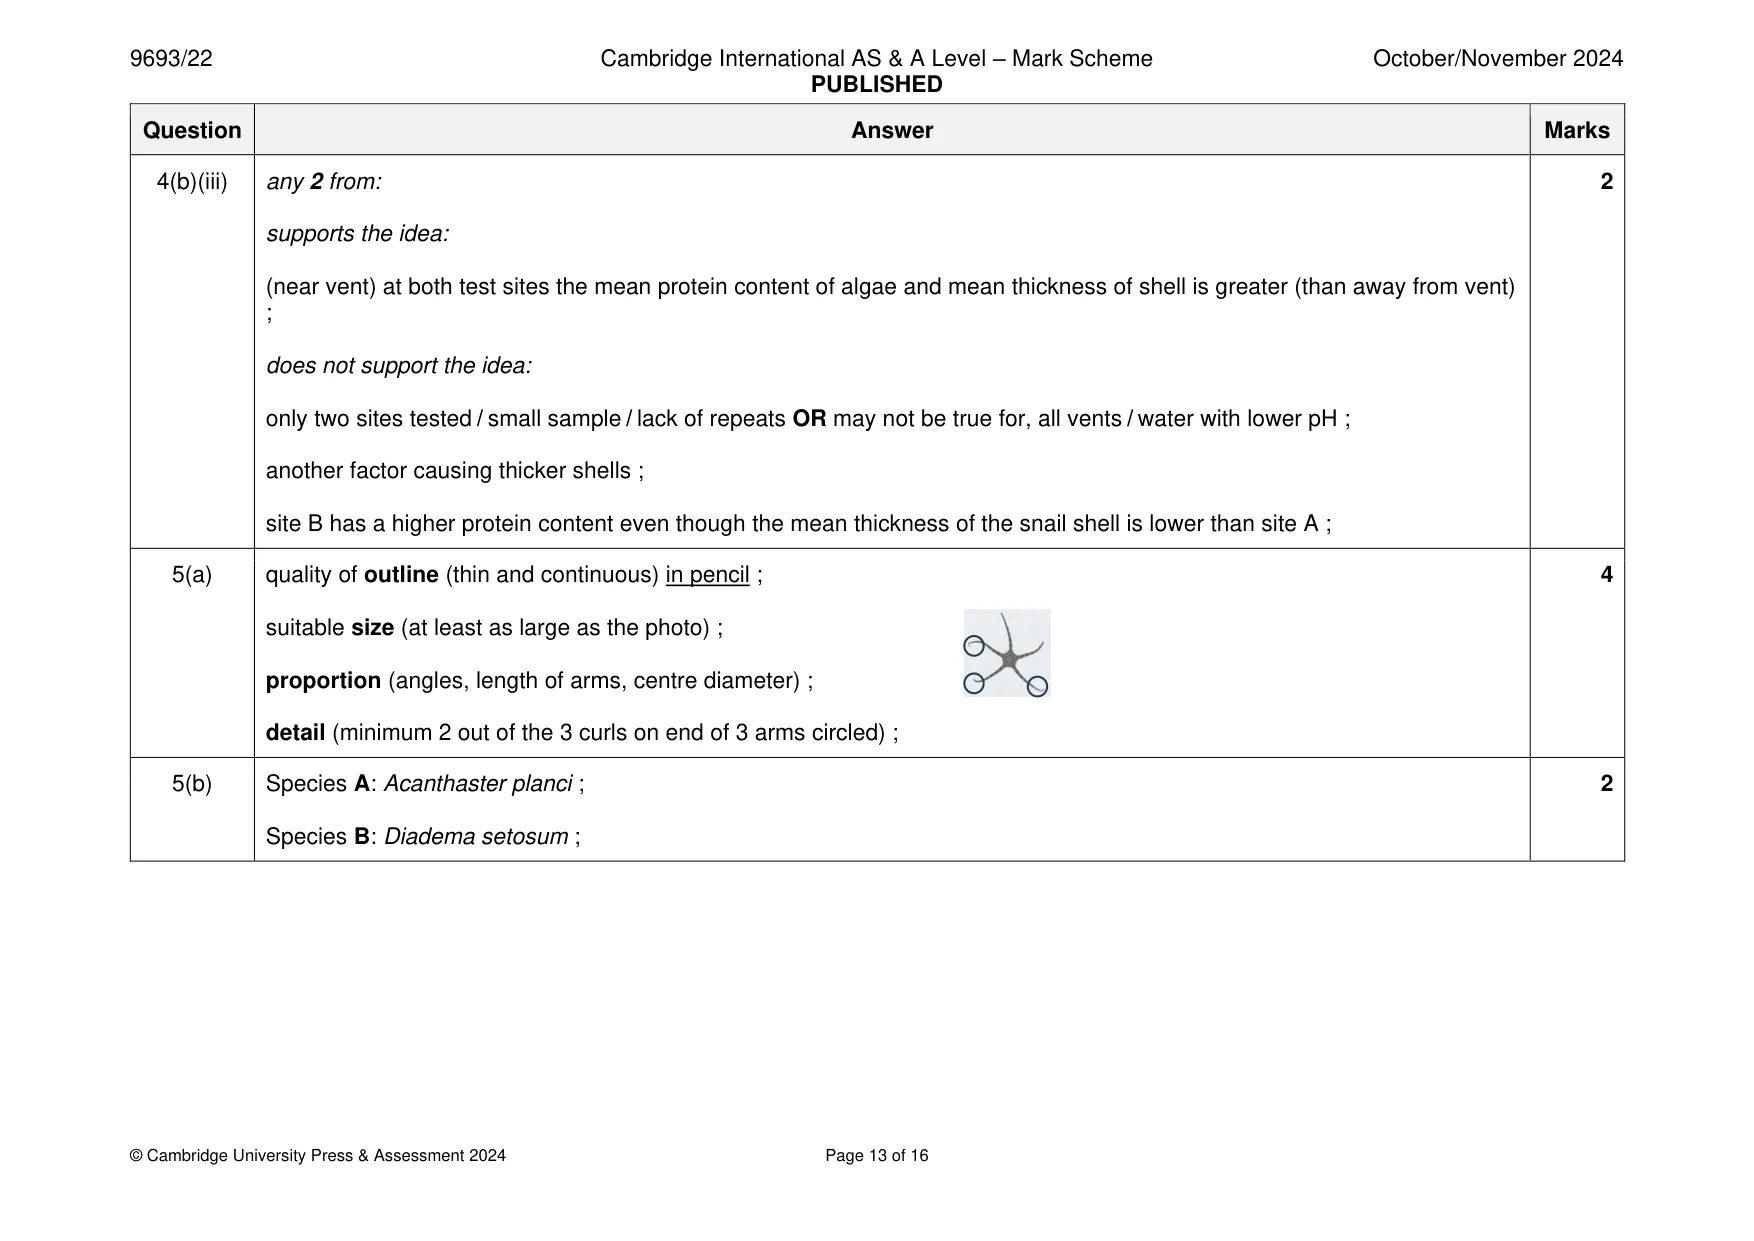
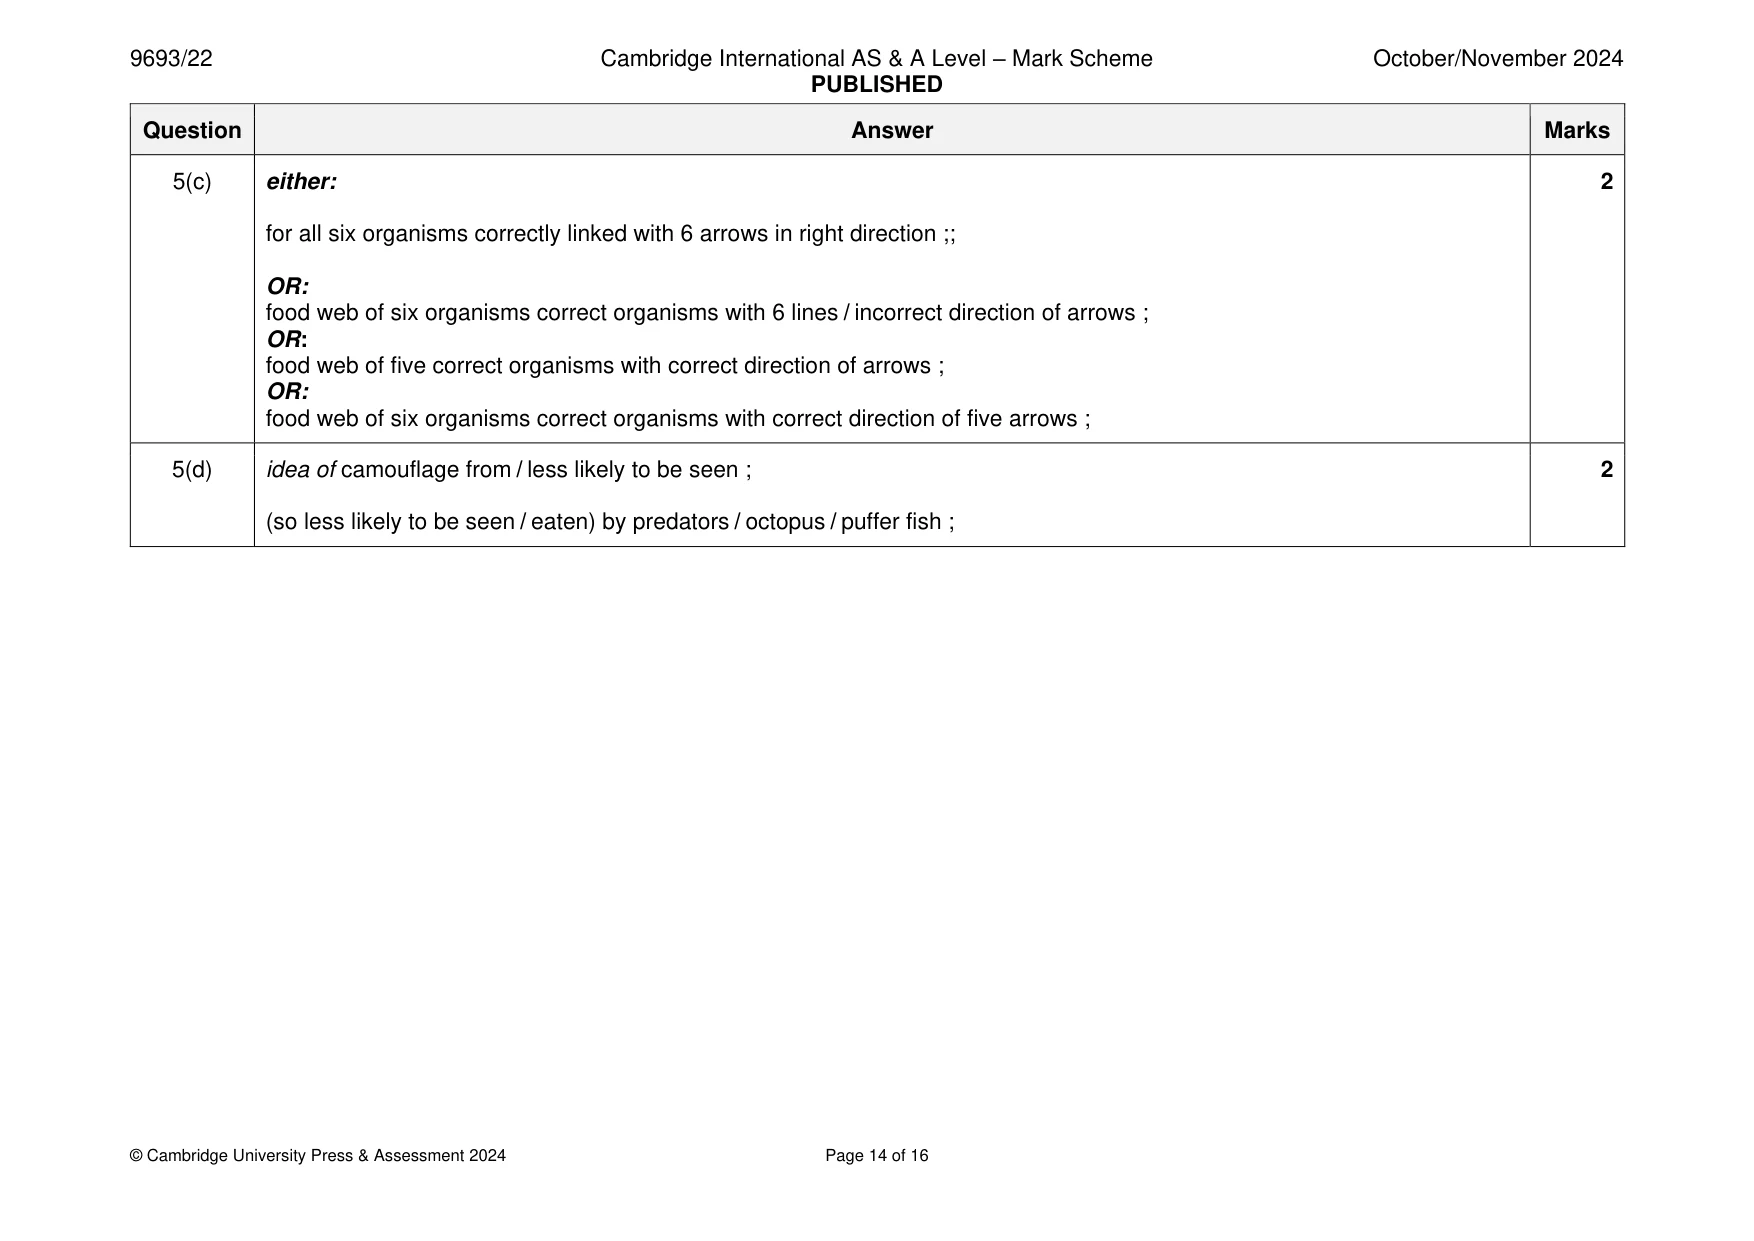
Mark scheme: 5(a) quality of outline (thin and continuous) in pencil ; 4 suitable size (at least as large as the photo) ; proportion (angles, length of arms, centre diameter) ; detail (minimum 2 out of the 3 curls on end of 3 arms circled) ; 5(b) Species A: Acanthaster planci ; 2 Species B: Diadema setosum ; 5(c) either: 2 for all six organisms correctly linked with 6 arrows in right direction ;; OR: food web of six organisms correct organisms with 6 lines / incorrect direction of arrows ; OR: food web of five correct organisms with correct direction of arrows ; OR: food web of six organisms correct organisms with correct direction of five arrows ; 5(d) idea of camouflage from / less likely to be seen ; 2 (so less likely to be seen / eaten) by predators / octopus / puffer fish ;
Q6 · A survey was carried out to estimate the total population of the shark Carcharias taurus…
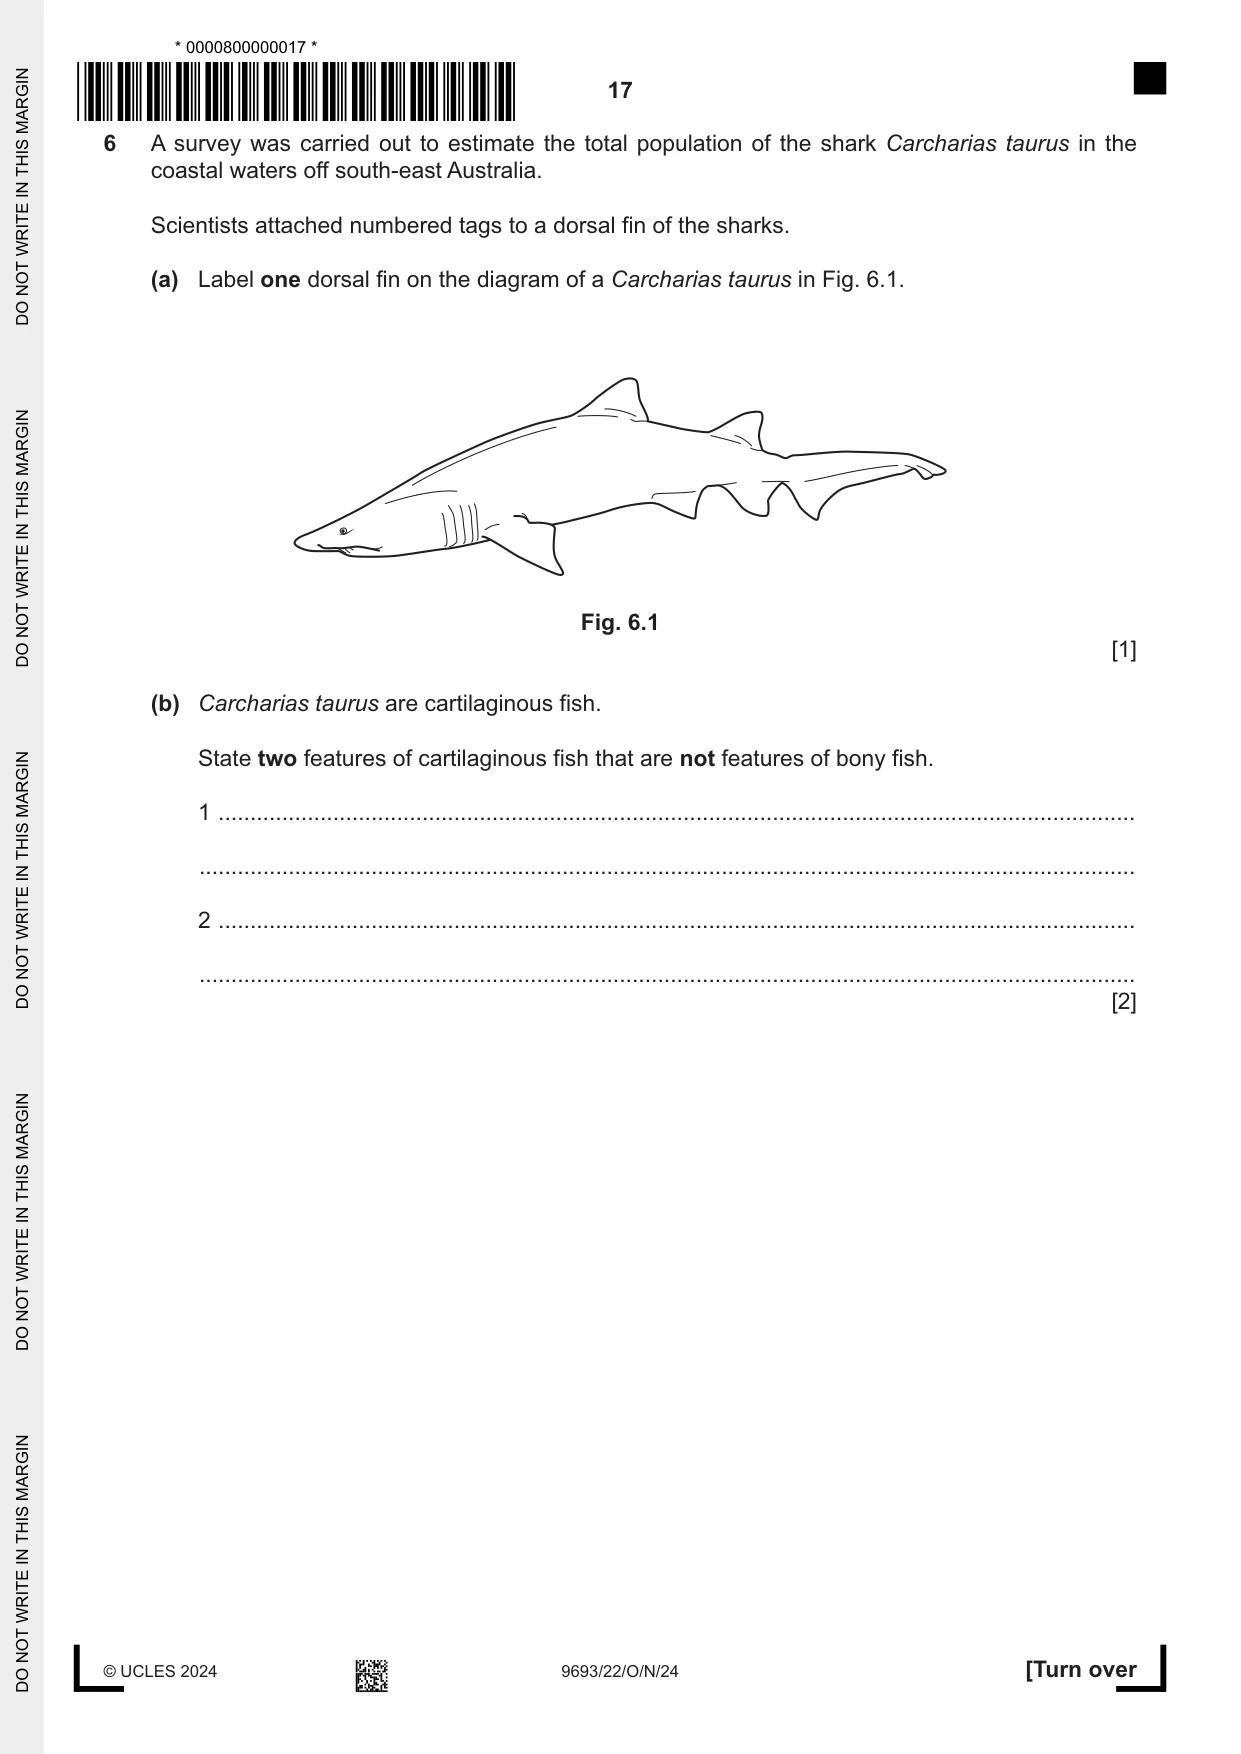
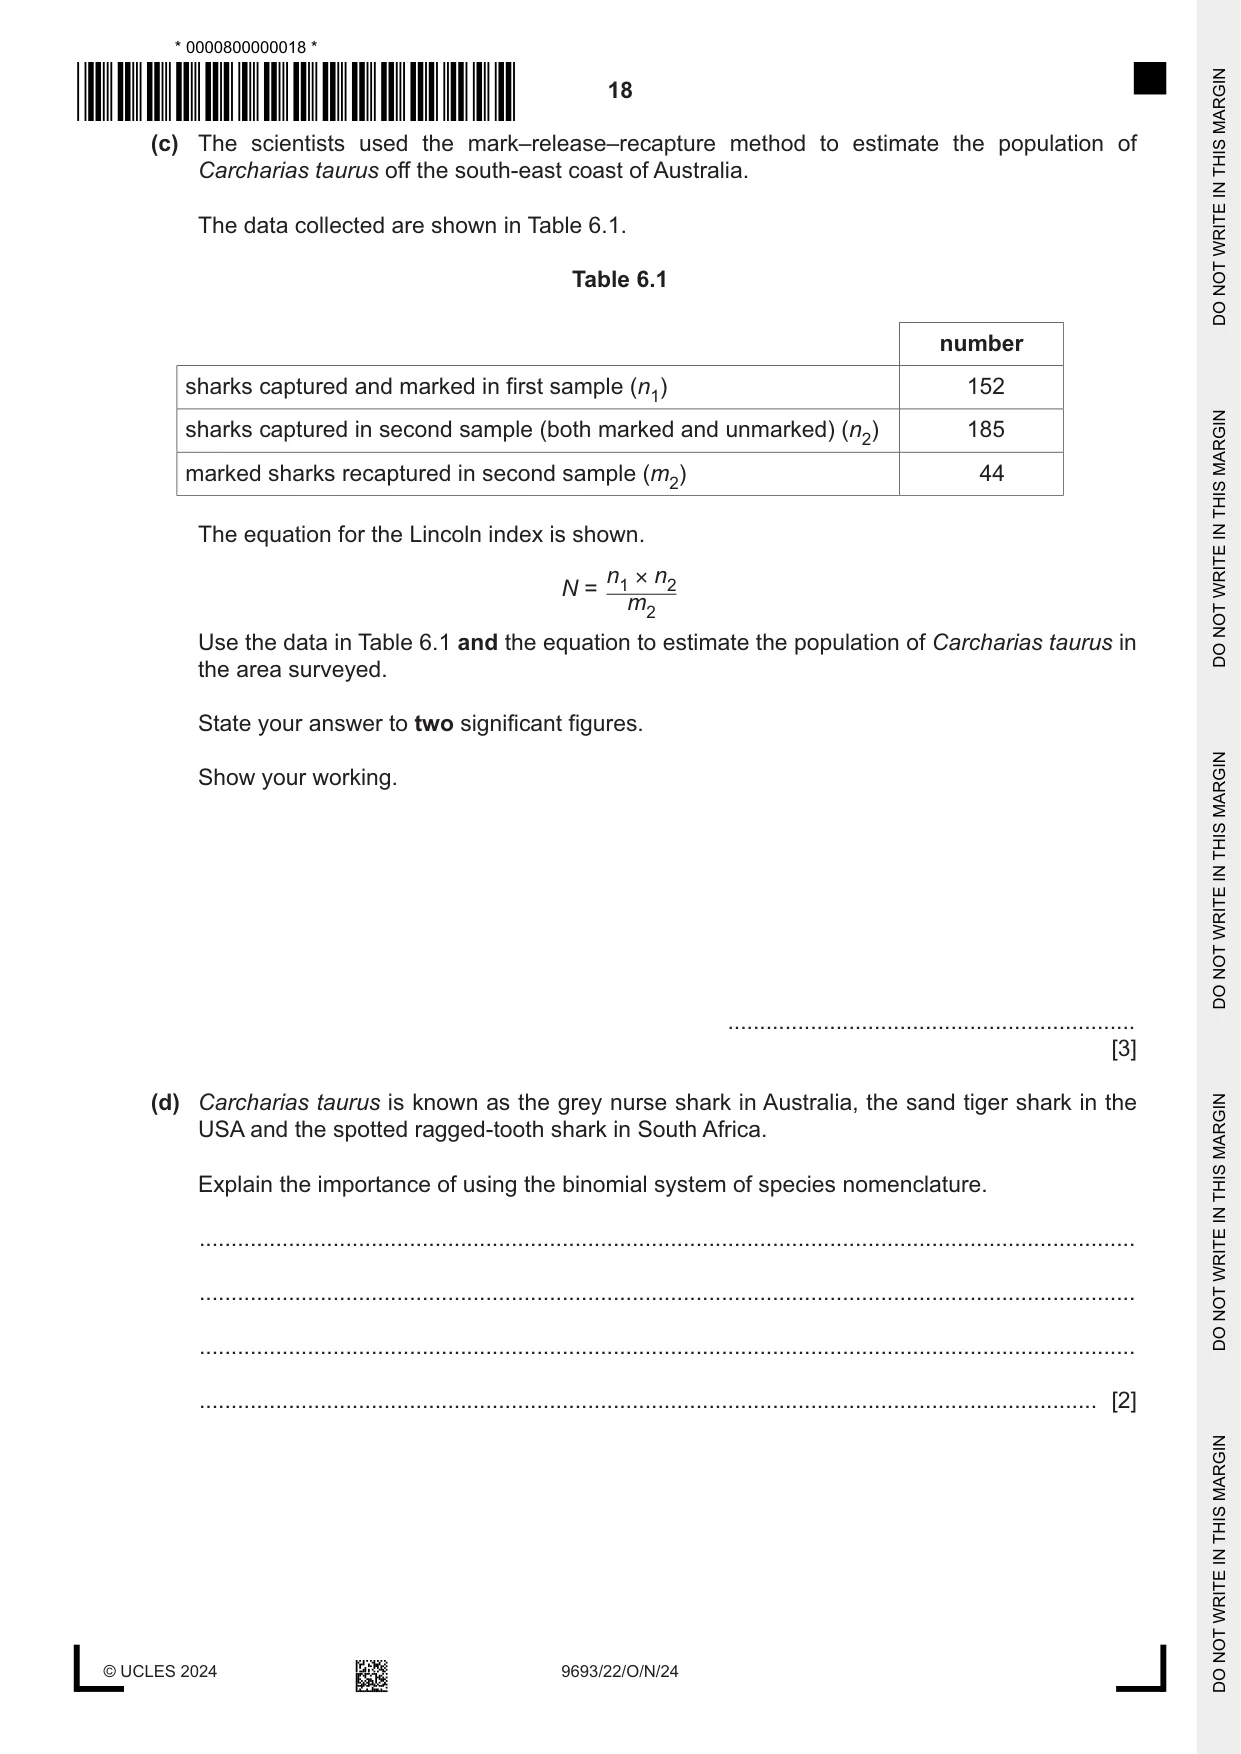
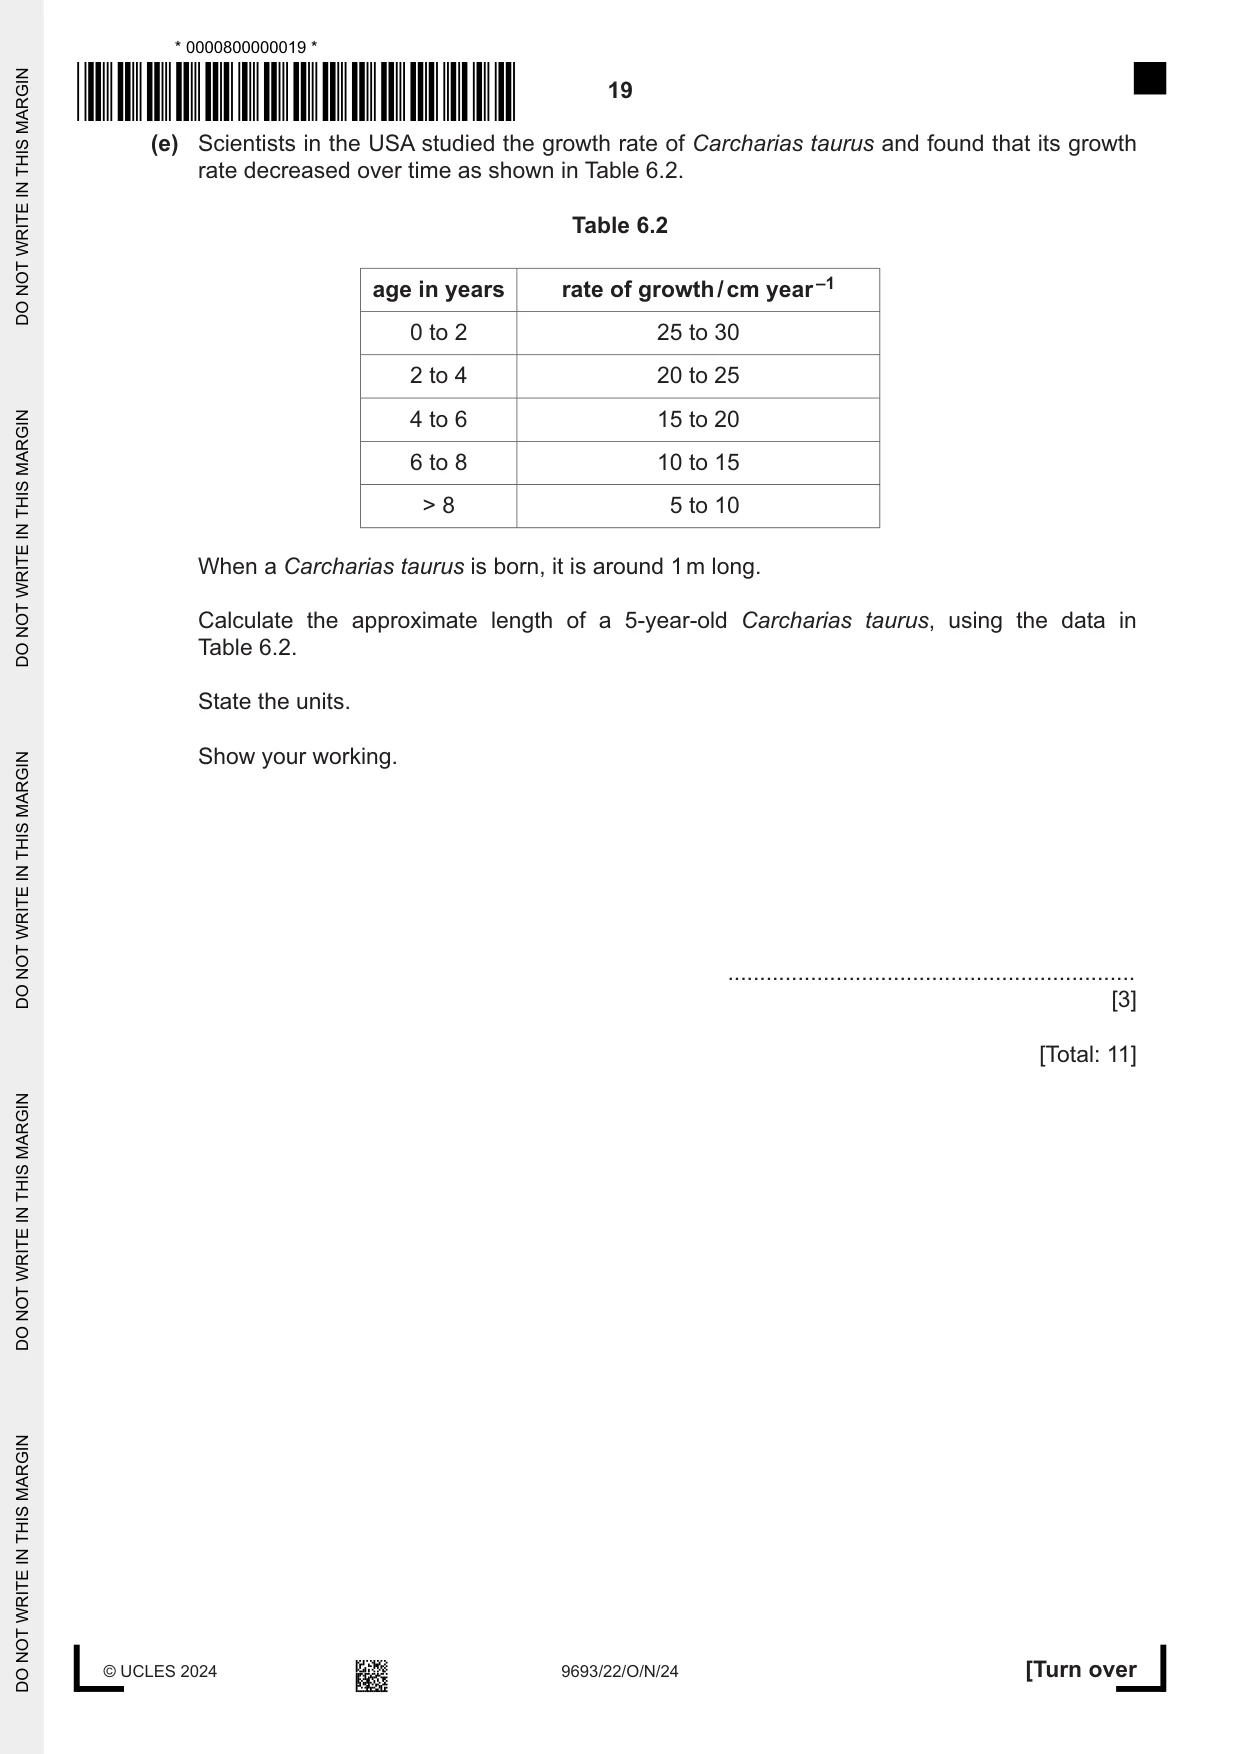
6 A survey was carried out to estimate the total population of the shark Carcharias taurus in the coastal waters off south-east Australia. Scientists attached numbered tags to a dorsal fin of the sharks. (a) Label one dorsal fin on the diagram of a Carcharias taurus in Fig. 6.1. Fig. 6.1 [1] (b) Carcharias taurus are cartilaginous fish. State two features of cartilaginous fish that are not features of bony fish. 1 ................................................................................................................................................ ................................................................................................................................................... 2 ................................................................................................................................................ ................................................................................................................................................... [2] (c) The scientists used the mark–release–recapture method to estimate the population of Carcharias taurus off the south-east coast of Australia. The data collected are shown in Table 6.1. Table 6.1 number sharks captured and marked in first sample (n1) 152 sharks captured in second sample (both marked and unmarked) (n2) 185 marked sharks recaptured in second sample (m2) 44 The equation for the Lincoln index is shown. N = n1 × n2 m2 Use the data in Table 6.1 and the equation to estimate the population of Carcharias taurus in the area surveyed. State your answer to two significant figures. Show your working. ................................................................ [3] (d) Carcharias taurus is known as the grey nurse shark in Australia, the sand tiger shark in the USA and the spotted ragged-tooth shark in South Africa. Explain the importance of using the binomial system of species nomenclature. ................................................................................................................................................... ................................................................................................................................................... ................................................................................................................................................... ............................................................................................................................................. [2] (e) Scientists in the USA studied the growth rate of Carcharias taurus and found that its growth rate decreased over time as shown in Table 6.2. Table 6.2 age in years rate of growth / cm year –1 0 to 2 25 to 30 2 to 4 20 to 25 4 to 6 15 to 20 6 to 8 10 to 15 > 8 5 to 10 When a Carcharias taurus is born, it is around 1 m long. Calculate the approximate length of a 5-year-old Carcharias taurus, using the data in Table 6.2. State the units. Show your working. ................................................................ [3] [Total: 11]
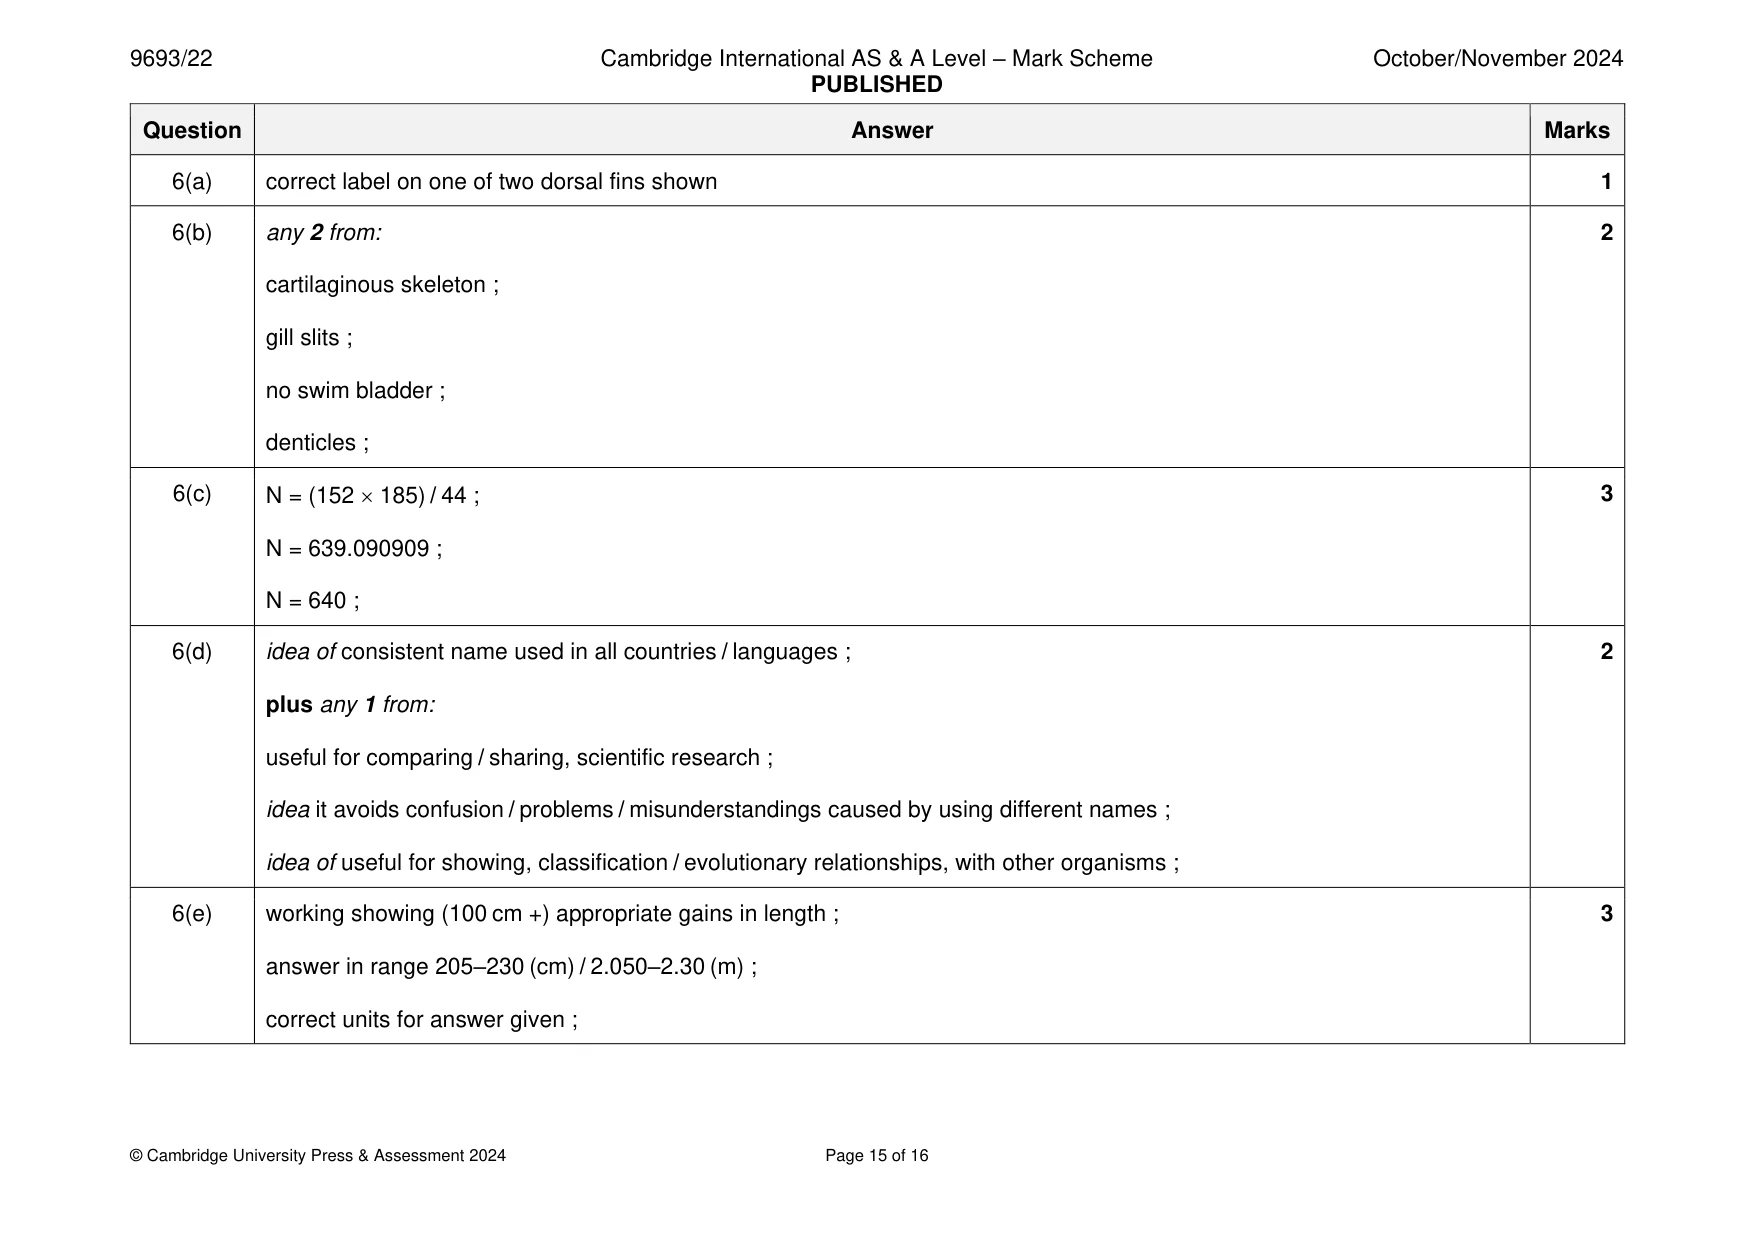
Mark scheme: 6(a) correct label on one of two dorsal fins shown 1 6(b) any 2 from: 2 cartilaginous skeleton ; gill slits ; no swim bladder ; denticles ; 6(c) N = (152 185) / 44 ; 3 N = 639.090909 ; N = 640 ; 6(d) idea of consistent name used in all countries / languages ; 2 plus any 1 from: useful for comparing / sharing, scientific research ; idea it avoids confusion / problems / misunderstandings caused by using different names ; idea of useful for showing, classification / evolutionary relationships, with other organisms ; 6(e) working showing (100 cm +) appropriate gains in length ; 3 answer in range 205–230 (cm) / 2.050–2.30 (m) ; correct units for answer given ;
Q7 · A major earthquake resulted in the formation of a tsunami
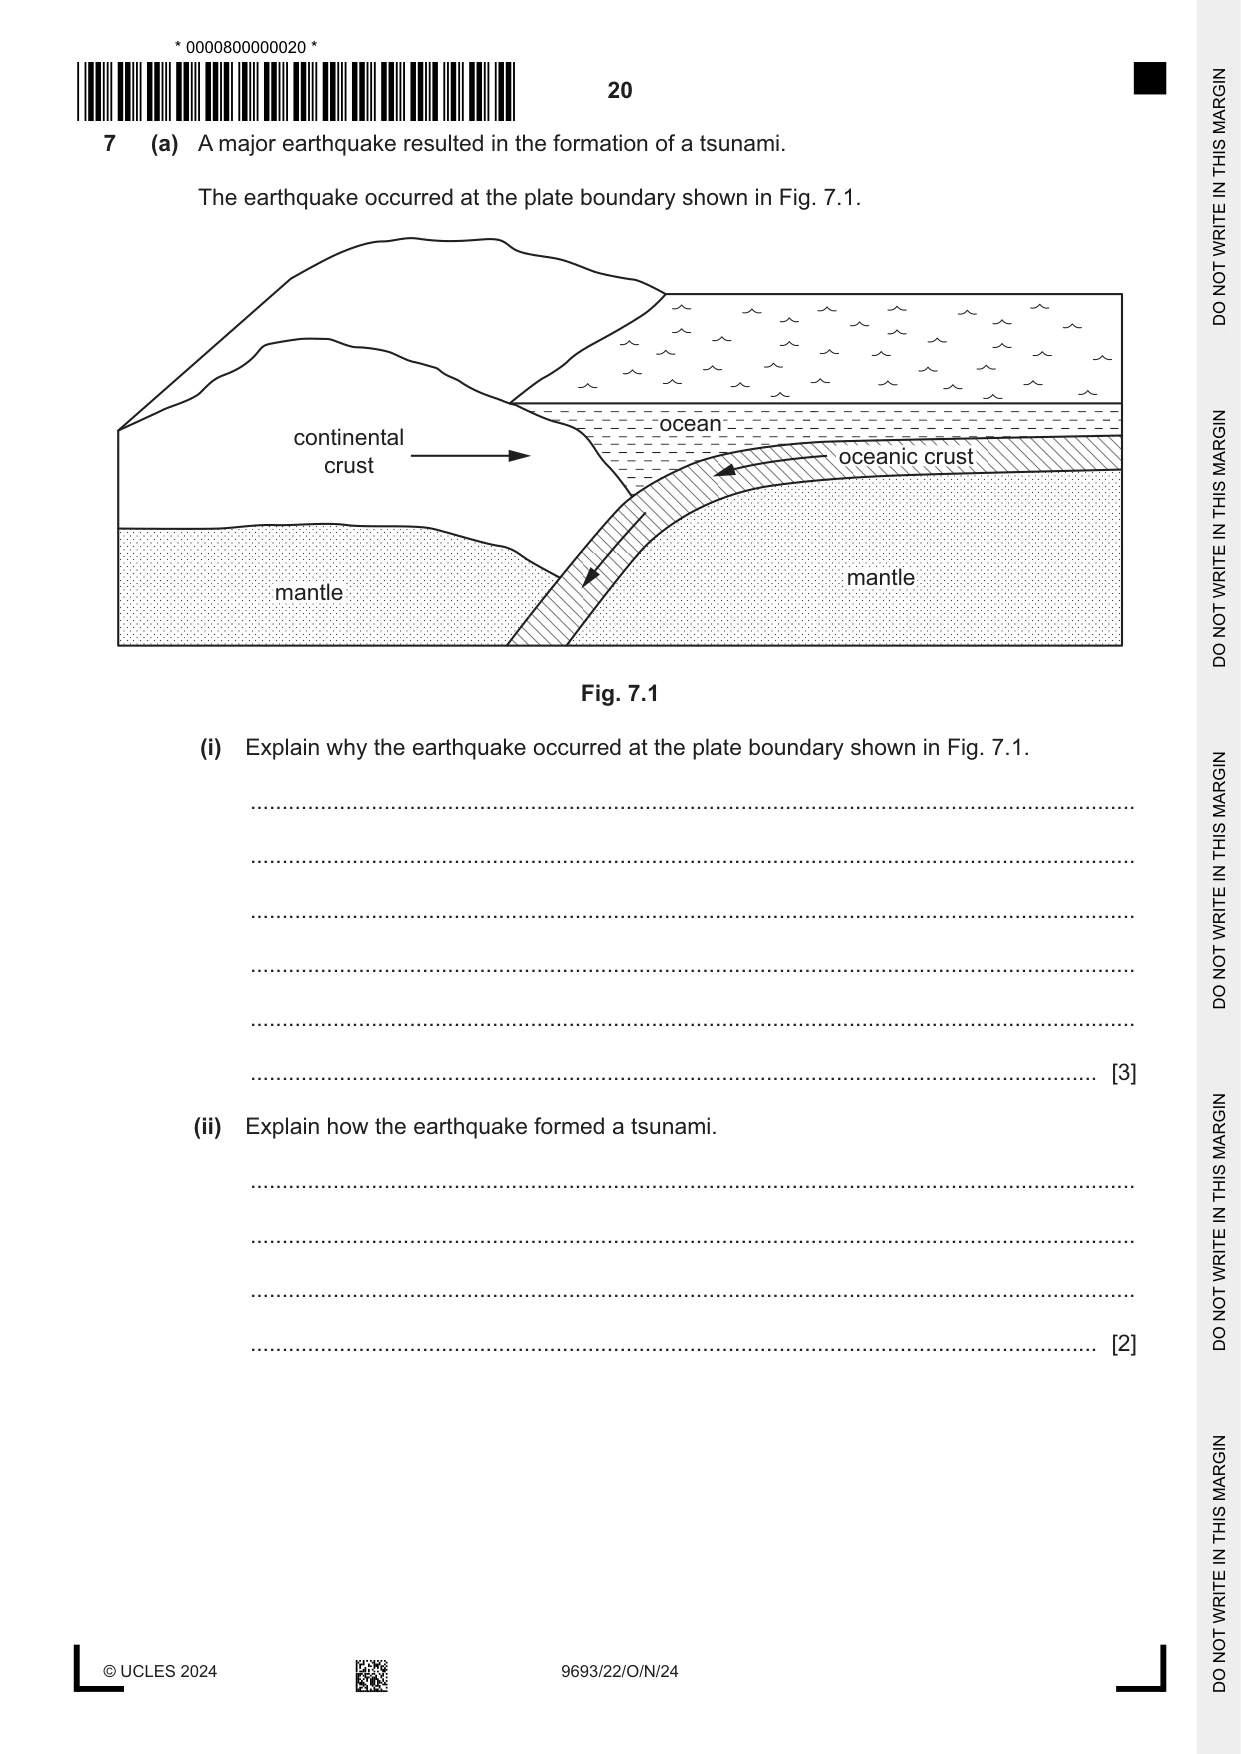
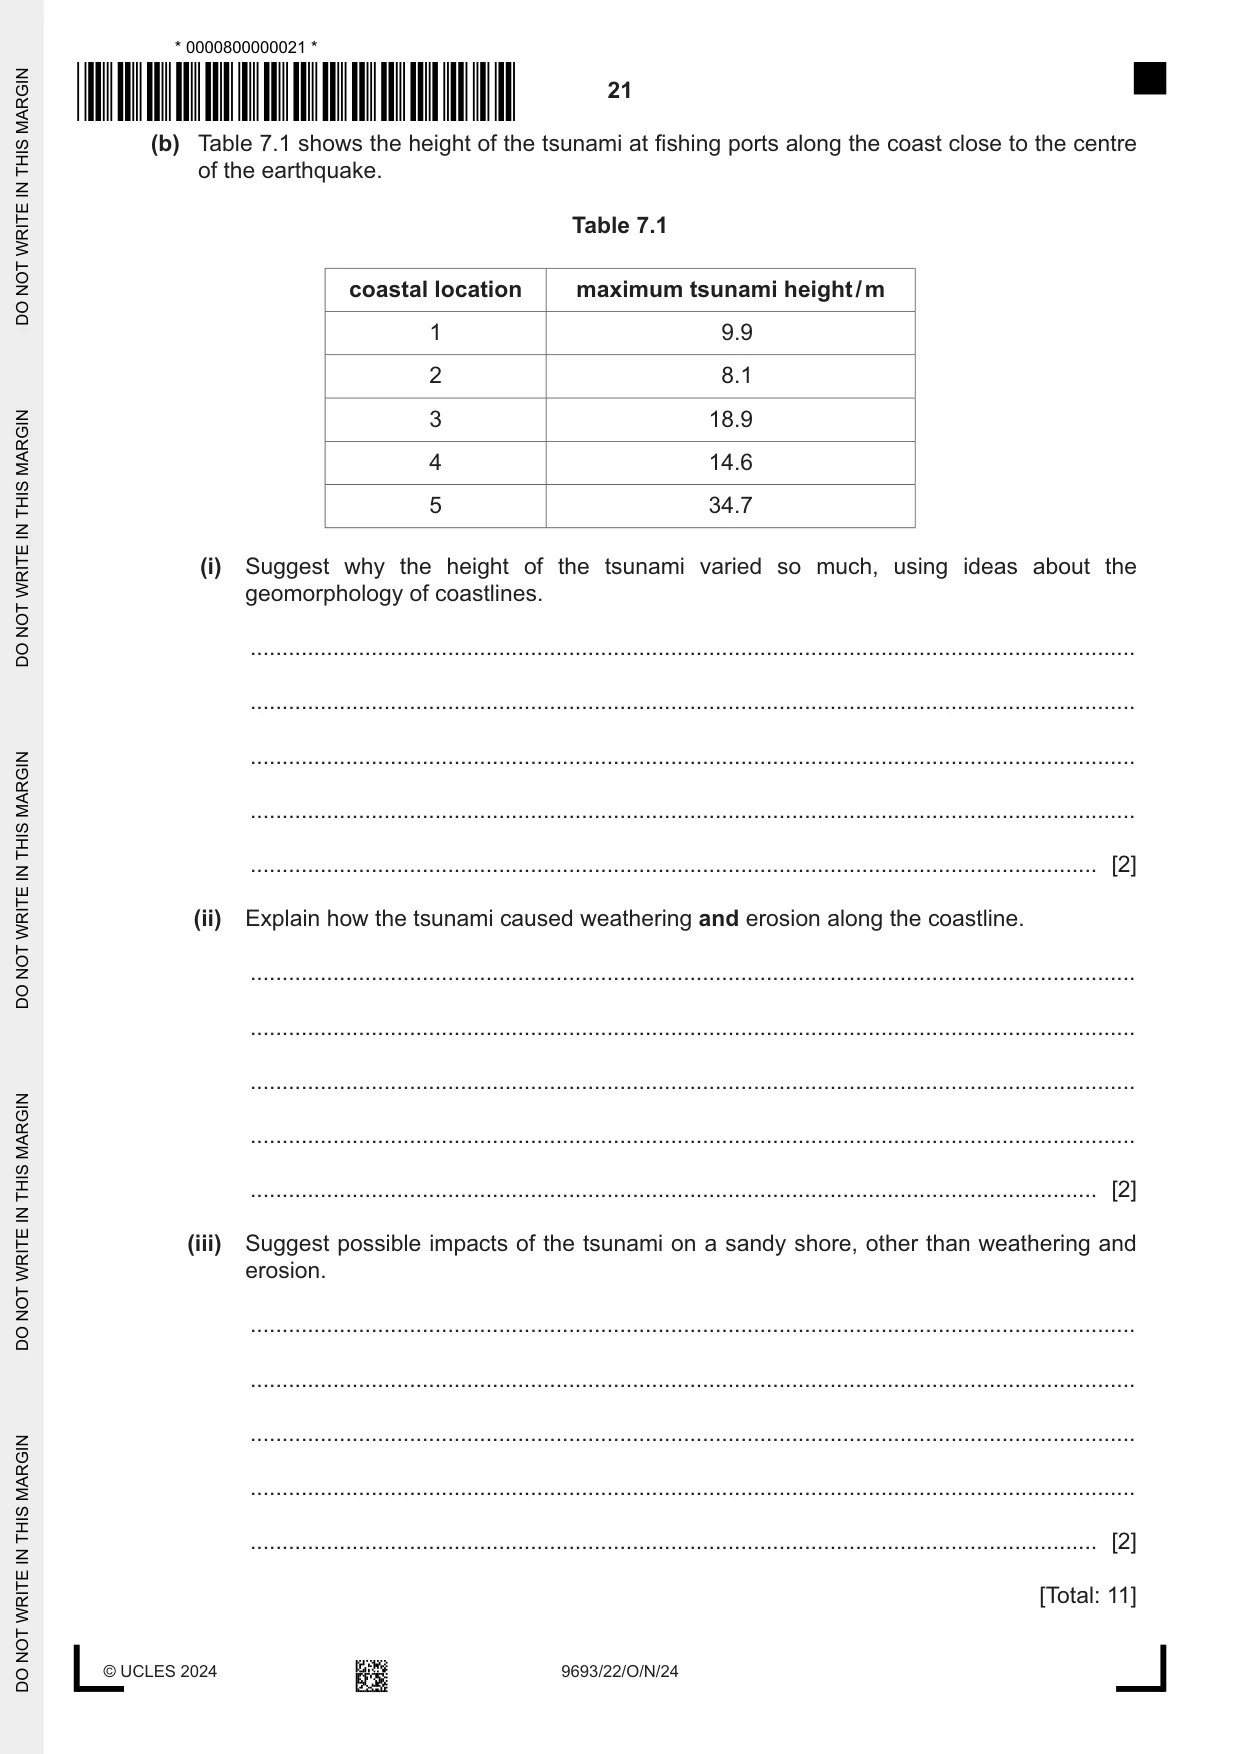
7 (a) A major earthquake resulted in the formation of a tsunami. The earthquake occurred at the plate boundary shown in Fig. 7.1. ocean continental oceanic crust crust mantle mantle Fig. 7.1 (i) Explain why the earthquake occurred at the plate boundary shown in Fig. 7.1. ........................................................................................................................................... ........................................................................................................................................... ........................................................................................................................................... ........................................................................................................................................... ........................................................................................................................................... ..................................................................................................................................... [3] (ii) Explain how the earthquake formed a tsunami. ........................................................................................................................................... ........................................................................................................................................... ........................................................................................................................................... ..................................................................................................................................... [2] (b) Table 7.1 shows the height of the tsunami at fishing ports along the coast close to the centre of the earthquake. Table 7.1 coastal location maximum tsunami height / m 1 9.9 2 8.1 3 18.9 4 14.6 5 34.7 (i) Suggest why the height of the tsunami varied so much, using ideas about the geomorphology of coastlines. ........................................................................................................................................... ........................................................................................................................................... ........................................................................................................................................... ........................................................................................................................................... ..................................................................................................................................... [2] (ii) Explain how the tsunami caused weathering and erosion along the coastline. ........................................................................................................................................... ........................................................................................................................................... ........................................................................................................................................... ........................................................................................................................................... ..................................................................................................................................... [2] (iii) Suggest possible impacts of the tsunami on a sandy shore, other than weathering and erosion. ........................................................................................................................................... ........................................................................................................................................... ........................................................................................................................................... ........................................................................................................................................... ..................................................................................................................................... [2] [Total: 11]
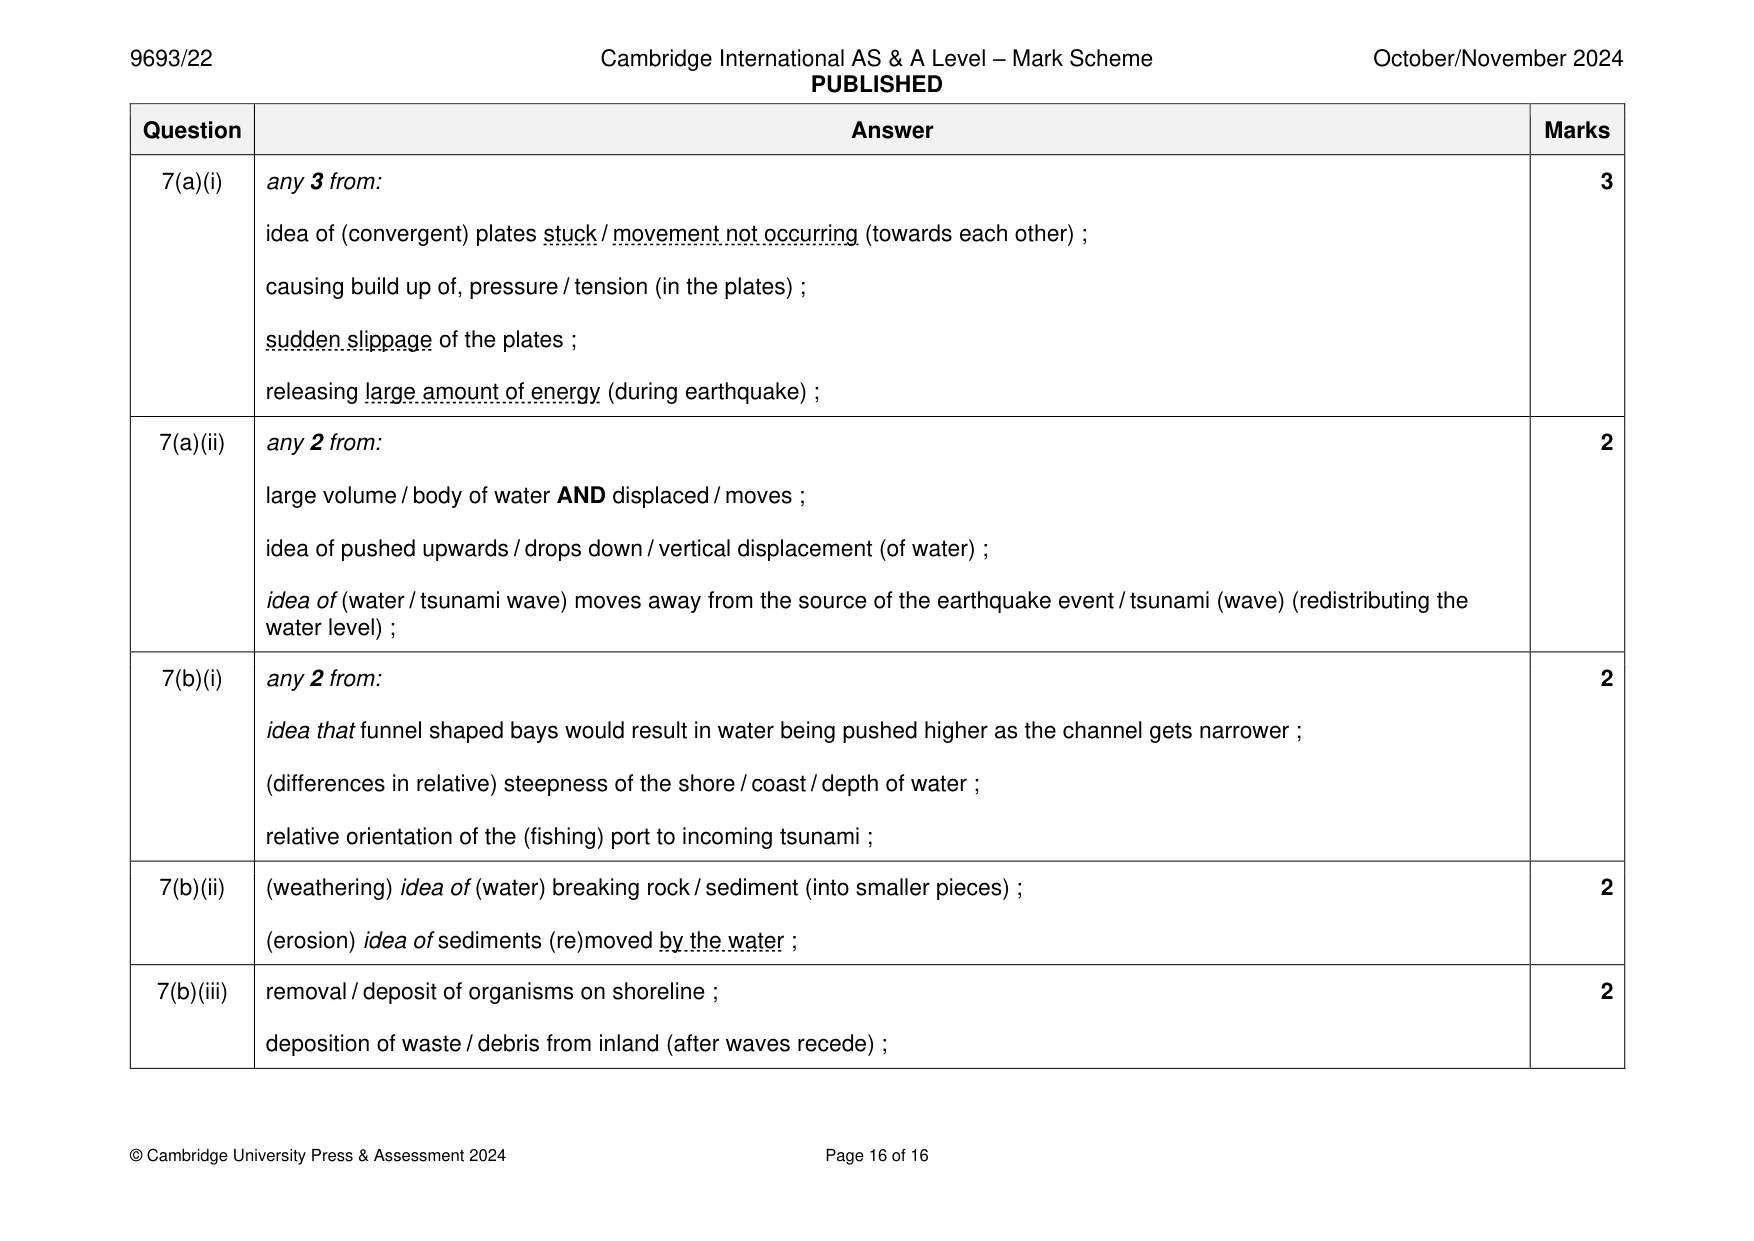
Mark scheme: 7(a)(i) any 3 from: 3 idea of (convergent) plates stuck / movement not occurring (towards each other) ; causing build up of, pressure / tension (in the plates) ; sudden slippage of the plates ; releasing large amount of energy (during earthquake) ; 7(a)(ii) any 2 from: 2 large volume / body of water AND displaced / moves ; idea of pushed upwards / drops down / vertical displacement (of water) ; idea of (water / tsunami wave) moves away from the source of the earthquake event / tsunami (wave) (redistributing the water level) ; 7(b)(i) any 2 from: 2 idea that funnel shaped bays would result in water being pushed higher as the channel gets narrower ; (differences in relative) steepness of the shore / coast / depth of water ; relative orientation of the (fishing) port to incoming tsunami ; 7(b)(ii) (weathering) idea of (water) breaking rock / sediment (into smaller pieces) ; 2 (erosion) idea of sediments (re)moved by the water ; 7(b)(iii) removal / deposit of organisms on shoreline ; 2 deposition of waste / debris from inland (after waves recede) ;
What was in this paper
The subtopics covered by these 7 questions, and how many questions each got. Open one in a new tab to see every Cambridge question on it.
What you needed in this session
Cambridge’s own grade thresholds for 2024 Oct/Nov, Paper 2 · Variant 2. A higher threshold means an easier paper — the bar moves with how the cohort did.