Cambridge A Level Marine Science 9693 — 2024 May/June Paper 4 · Variant 1
9693/41/M/J/24 · 5 questions · 75 marks · ≈84 min
The question paper and its mark scheme, free to read here and free to download. This is Cambridge’s own paper, exactly as it was sat.
Question paper24 pages


Mark scheme15 pages
Answers below. Sit the paper first if you are practising.
Questions as text
Q1 · An electron micrograph of part of a marine algal cell, Dunaliella spp
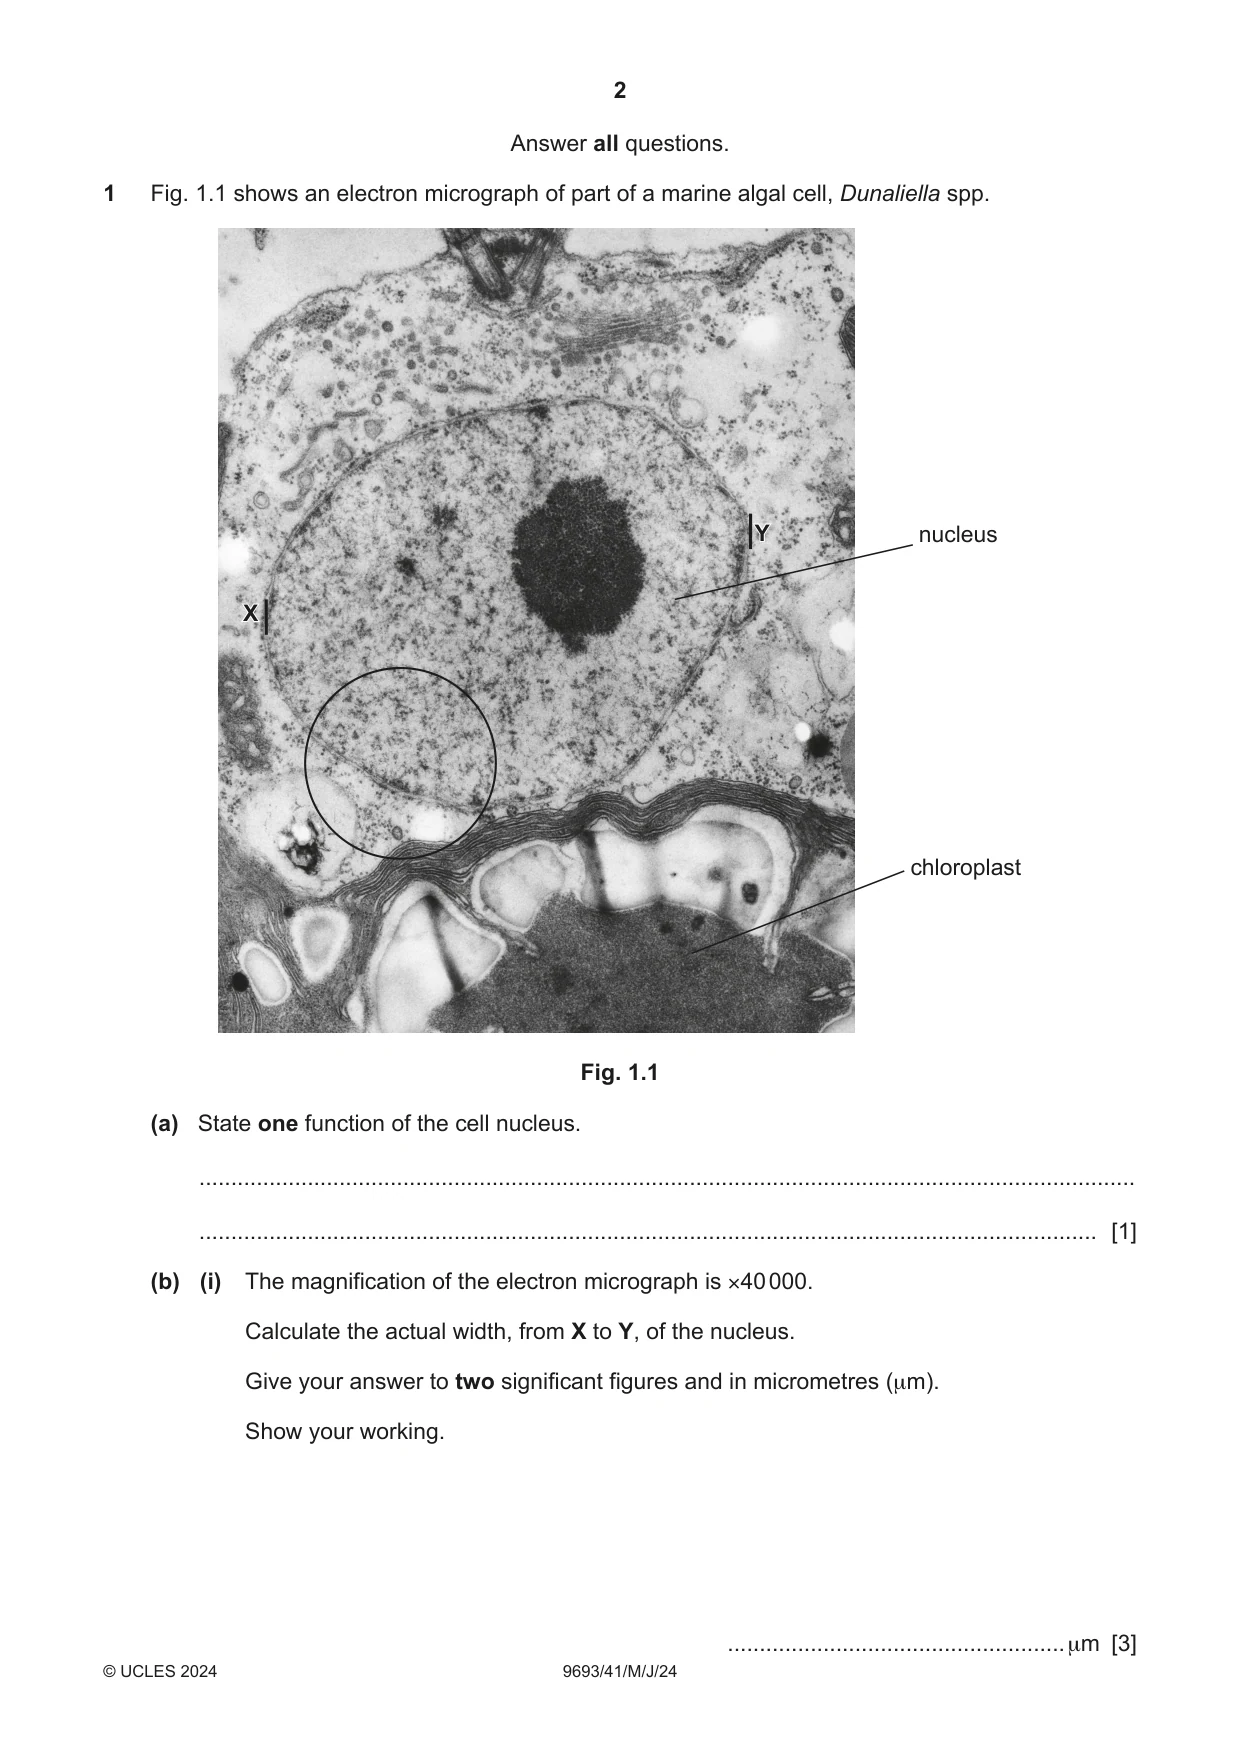
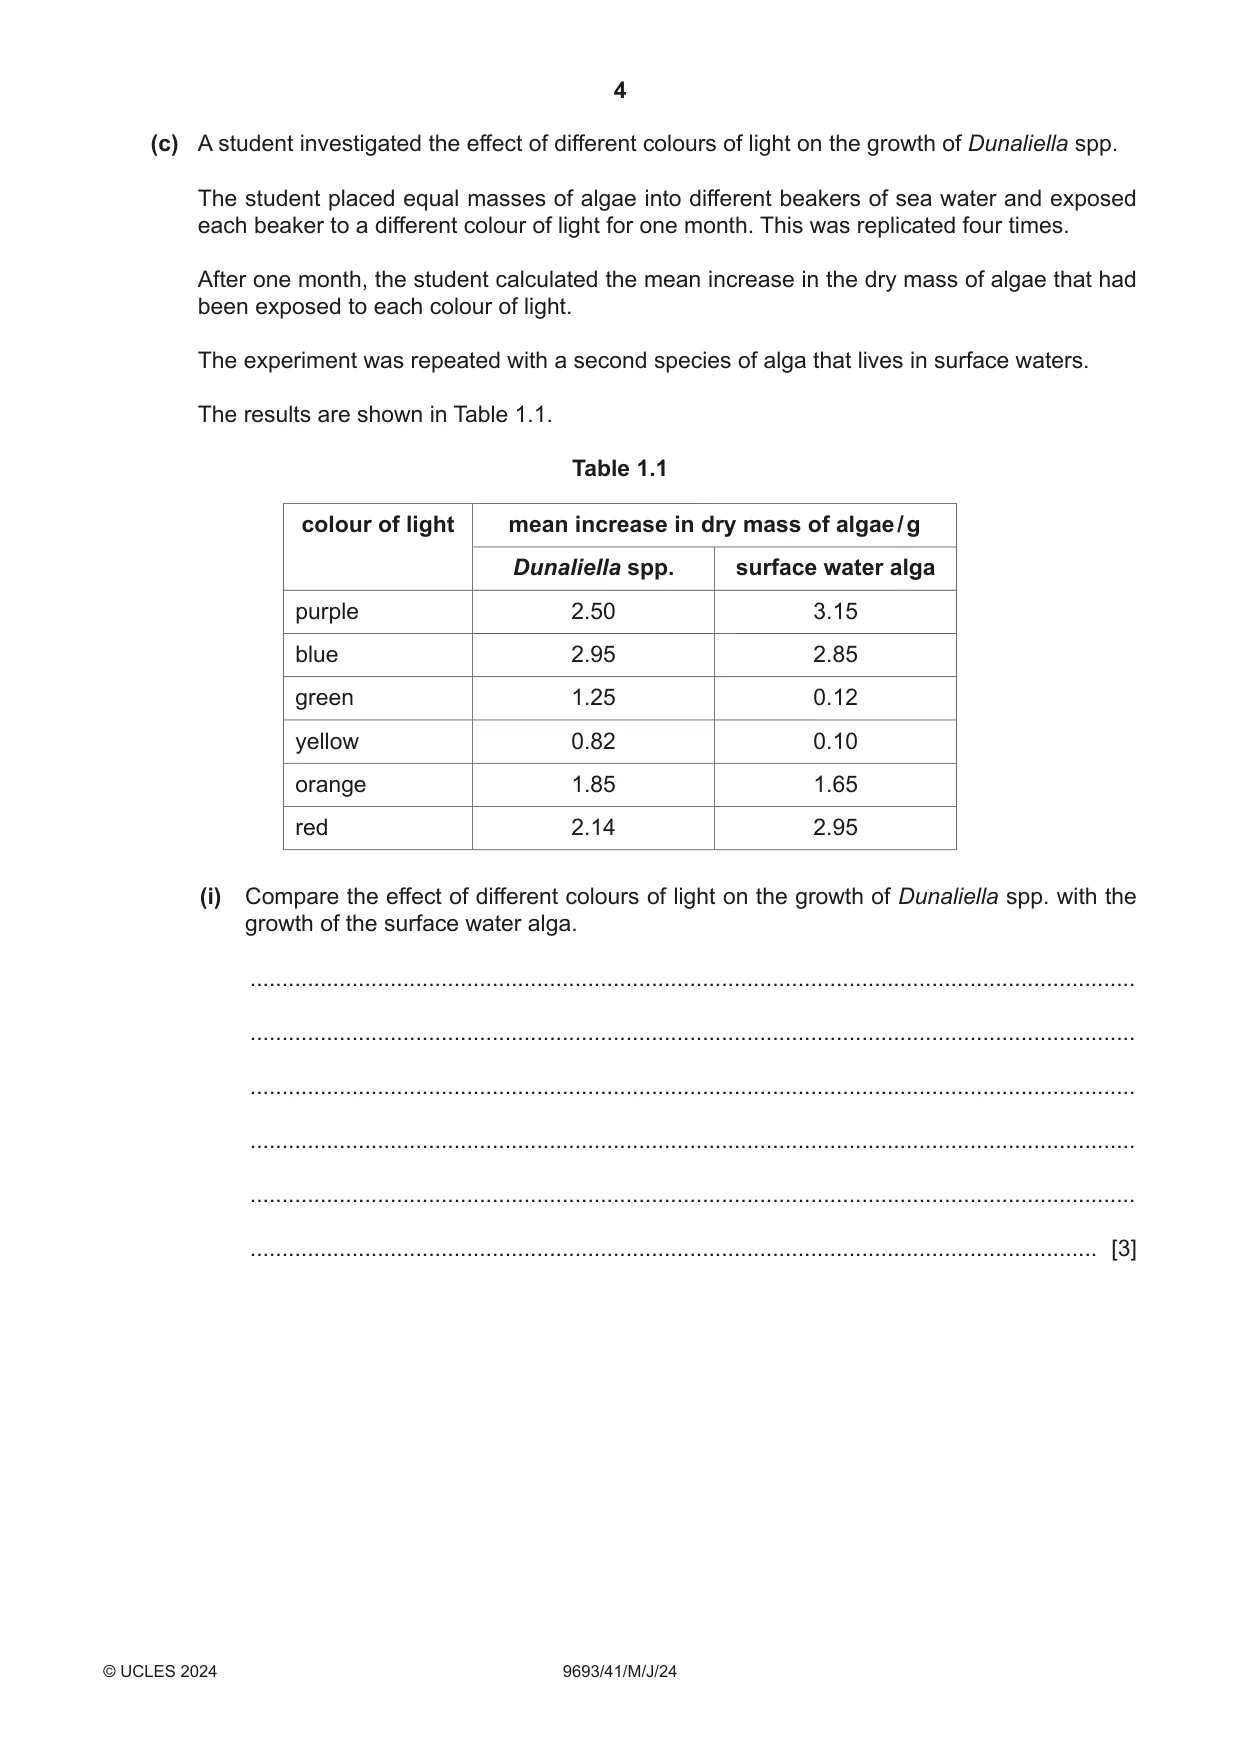
1 Fig. 1.1 shows an electron micrograph of part of a marine algal cell, Dunaliella spp. Y nucleus X chloroplast Fig. 1.1 (a) State one function of the cell nucleus. ................................................................................................................................................... ............................................................................................................................................. [1] (b) (i) The magnification of the electron micrograph is ×40 000. Calculate the actual width, from X to Y, of the nucleus. Give your answer to two significant figures and in micrometres (μm). Show your working. ..................................................... μm [3] (ii) Make a large drawing of the area of the cell shown in the circle in Fig. 1.1. [4] (c) A student investigated the effect of different colours of light on the growth of Dunaliella spp. The student placed equal masses of algae into different beakers of sea water and exposed each beaker to a different colour of light for one month. This was replicated four times. After one month, the student calculated the mean increase in the dry mass of algae that had been exposed to each colour of light. The experiment was repeated with a second species of alga that lives in surface waters. The results are shown in Table 1.1. Table 1.1 colour of light mean increase in dry mass of algae / g Dunaliella spp. surface water alga purple 2.50 3.15 blue 2.95 2.85 green 1.25 0.12 yellow 0.82 0.10 orange 1.85 1.65 red 2.14 2.95 (i) Compare the effect of different colours of light on the growth of Dunaliella spp. with the growth of the surface water alga. ........................................................................................................................................... ........................................................................................................................................... ........................................................................................................................................... ........................................................................................................................................... ........................................................................................................................................... ..................................................................................................................................... [3] (ii) The student concluded that Dunaliella spp. has additional chloroplast pigments compared with the surface alga and is adapted for living in deeper water. Discuss the student’s conclusion. ........................................................................................................................................... ........................................................................................................................................... ........................................................................................................................................... ........................................................................................................................................... ........................................................................................................................................... ..................................................................................................................................... [3] [Total: 14]
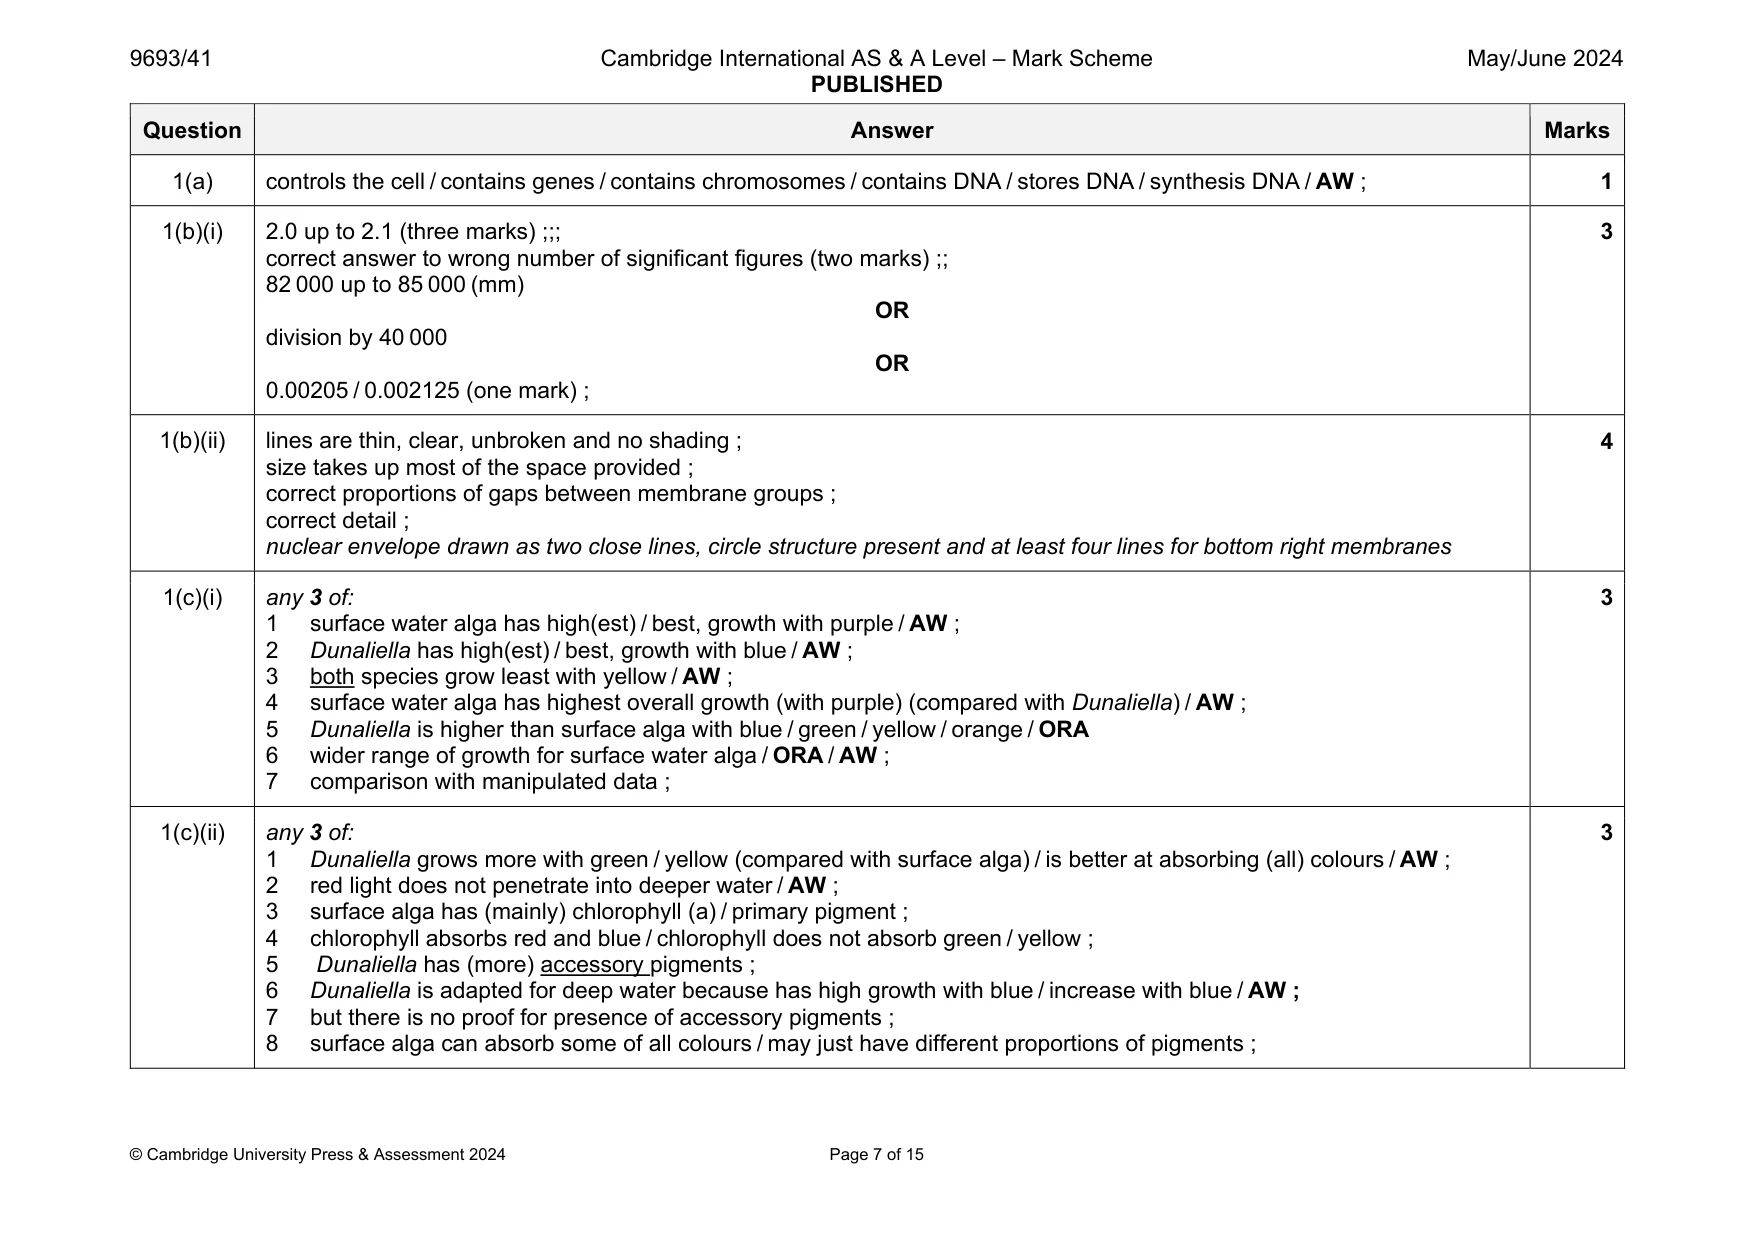
Mark scheme: 1(a) controls the cell / contains genes / contains chromosomes / contains DNA / stores DNA / synthesis DNA / AW ; 1 1(b)(i) 2.0 up to 2.1 (three marks) ;;; correct answer to wrong number of significant figures (two marks) ;; 82 000 up to 85 000 (mm) OR division by 40 000 OR 0.00205 / 0.002125 (one mark) ; 3 1(b)(ii) lines are thin, clear, unbroken and no shading ; size takes up most of the space provided ; correct proportions of gaps between membrane groups ; correct detail ; nuclear envelope drawn as two close lines, circle structure present and at least four lines for bottom right membranes 4 1(c)(i) any 3 of: 1 surface water alga has high(est) / best, growth with purple / AW ; 2 Dunaliella has high(est) / best, growth with blue / AW ; 3 both species grow least with yellow / AW ; 4 surface water alga has highest overall growth (with purple) (compared with Dunaliella) / AW ; 5 Dunaliella is higher than surface alga with blue / green / yellow / orange / ORA 6 wider range of growth for surface water alga / ORA / AW ; 7 comparison with manipulated data ; 3 1(c)(ii) any 3 of: 1 Dunaliella grows more with green / yellow (compared with surface alga) / is better at absorbing (all) colours / AW ; 2 red light does not penetrate into deeper water / AW ; 3 surface alga has (mainly) chlorophyll (a) / primary pigment ; 4 chlorophyll absorbs red and blue / chlorophyll does not absorb green / yellow ; 5 Dunaliella has (more) accessory pigments ; 6 Dunaliella is adapted for deep water because has high growth with blue / increase with blue / AW ; 7 but there is no proof for presence of accessory pigments ; 8 surface alga can absorb some of all colours / may just have different proportions of pigments ; 3
Q2 · The giant tubeworm, Riftia, lives near hydrothermal vents
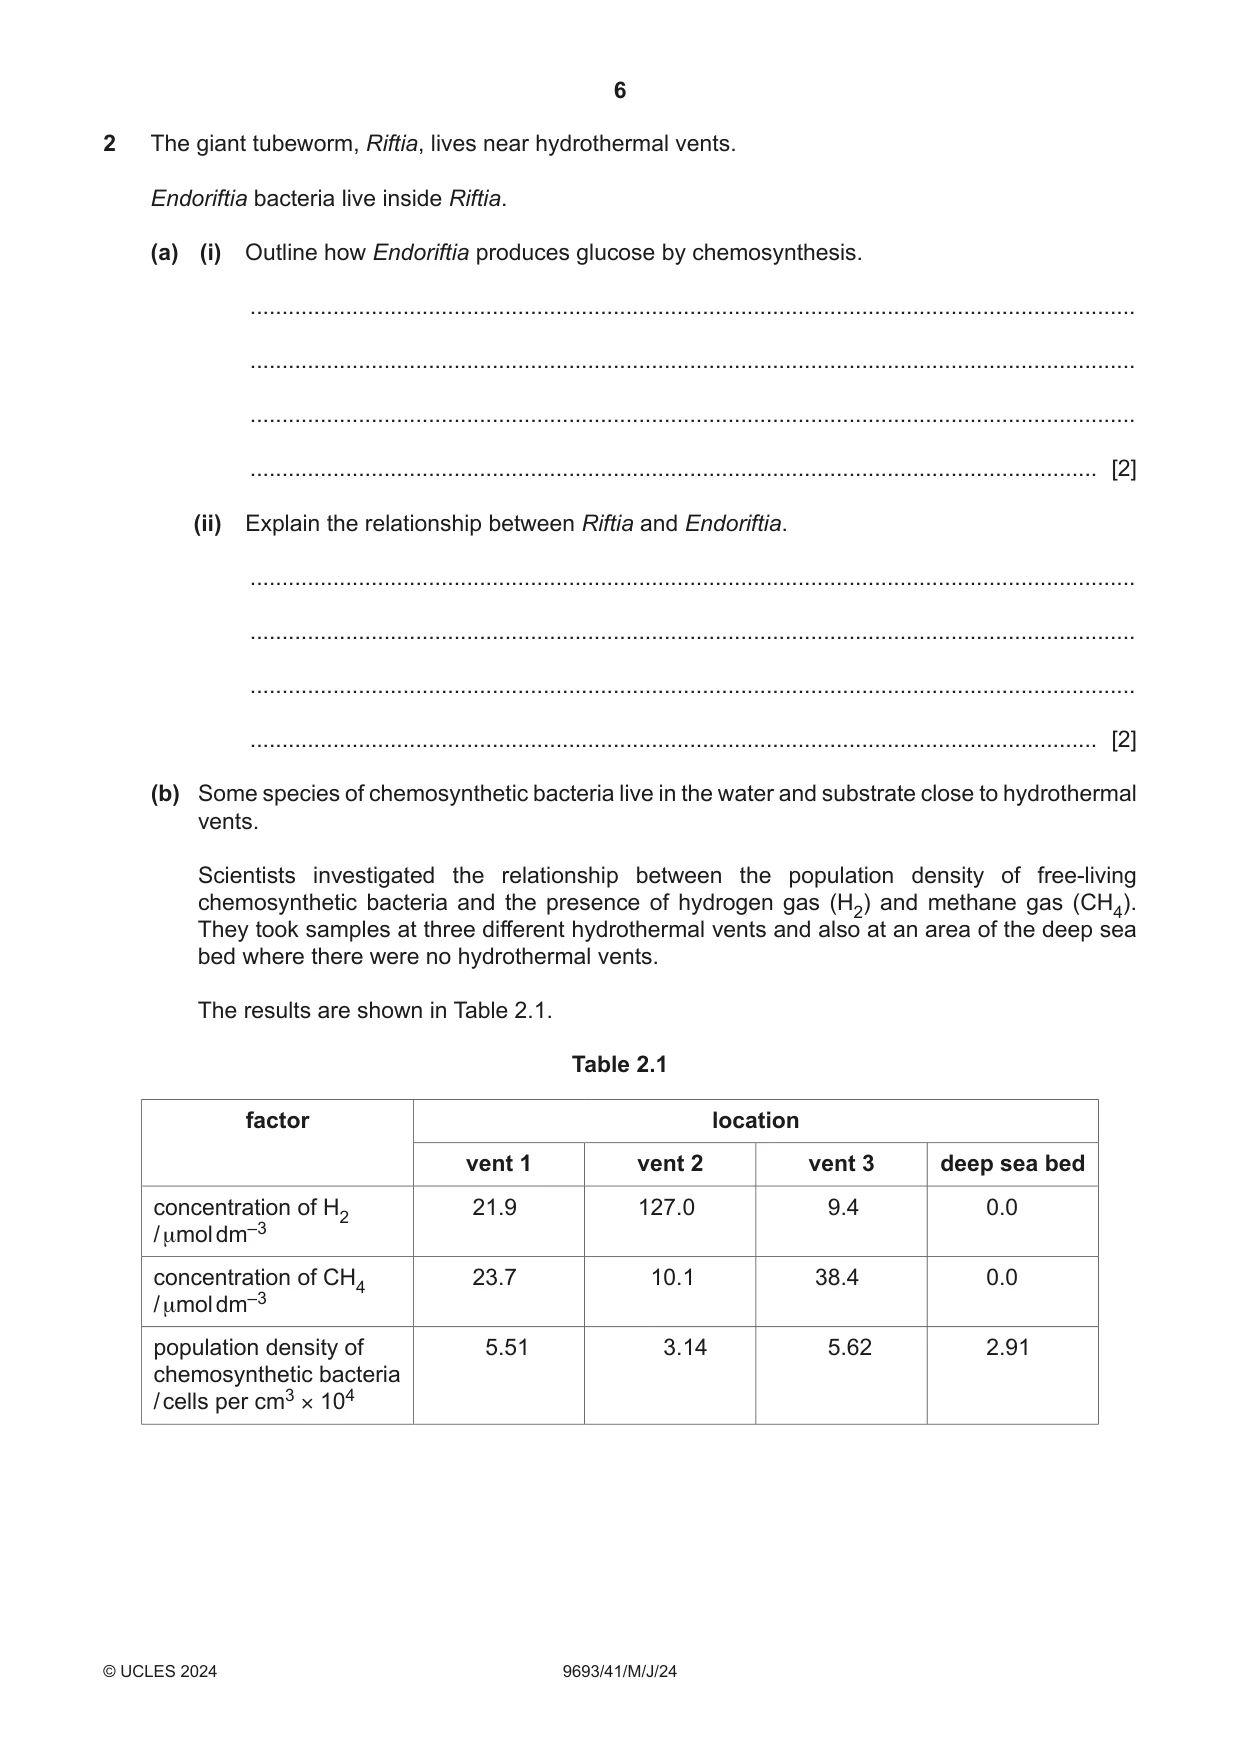
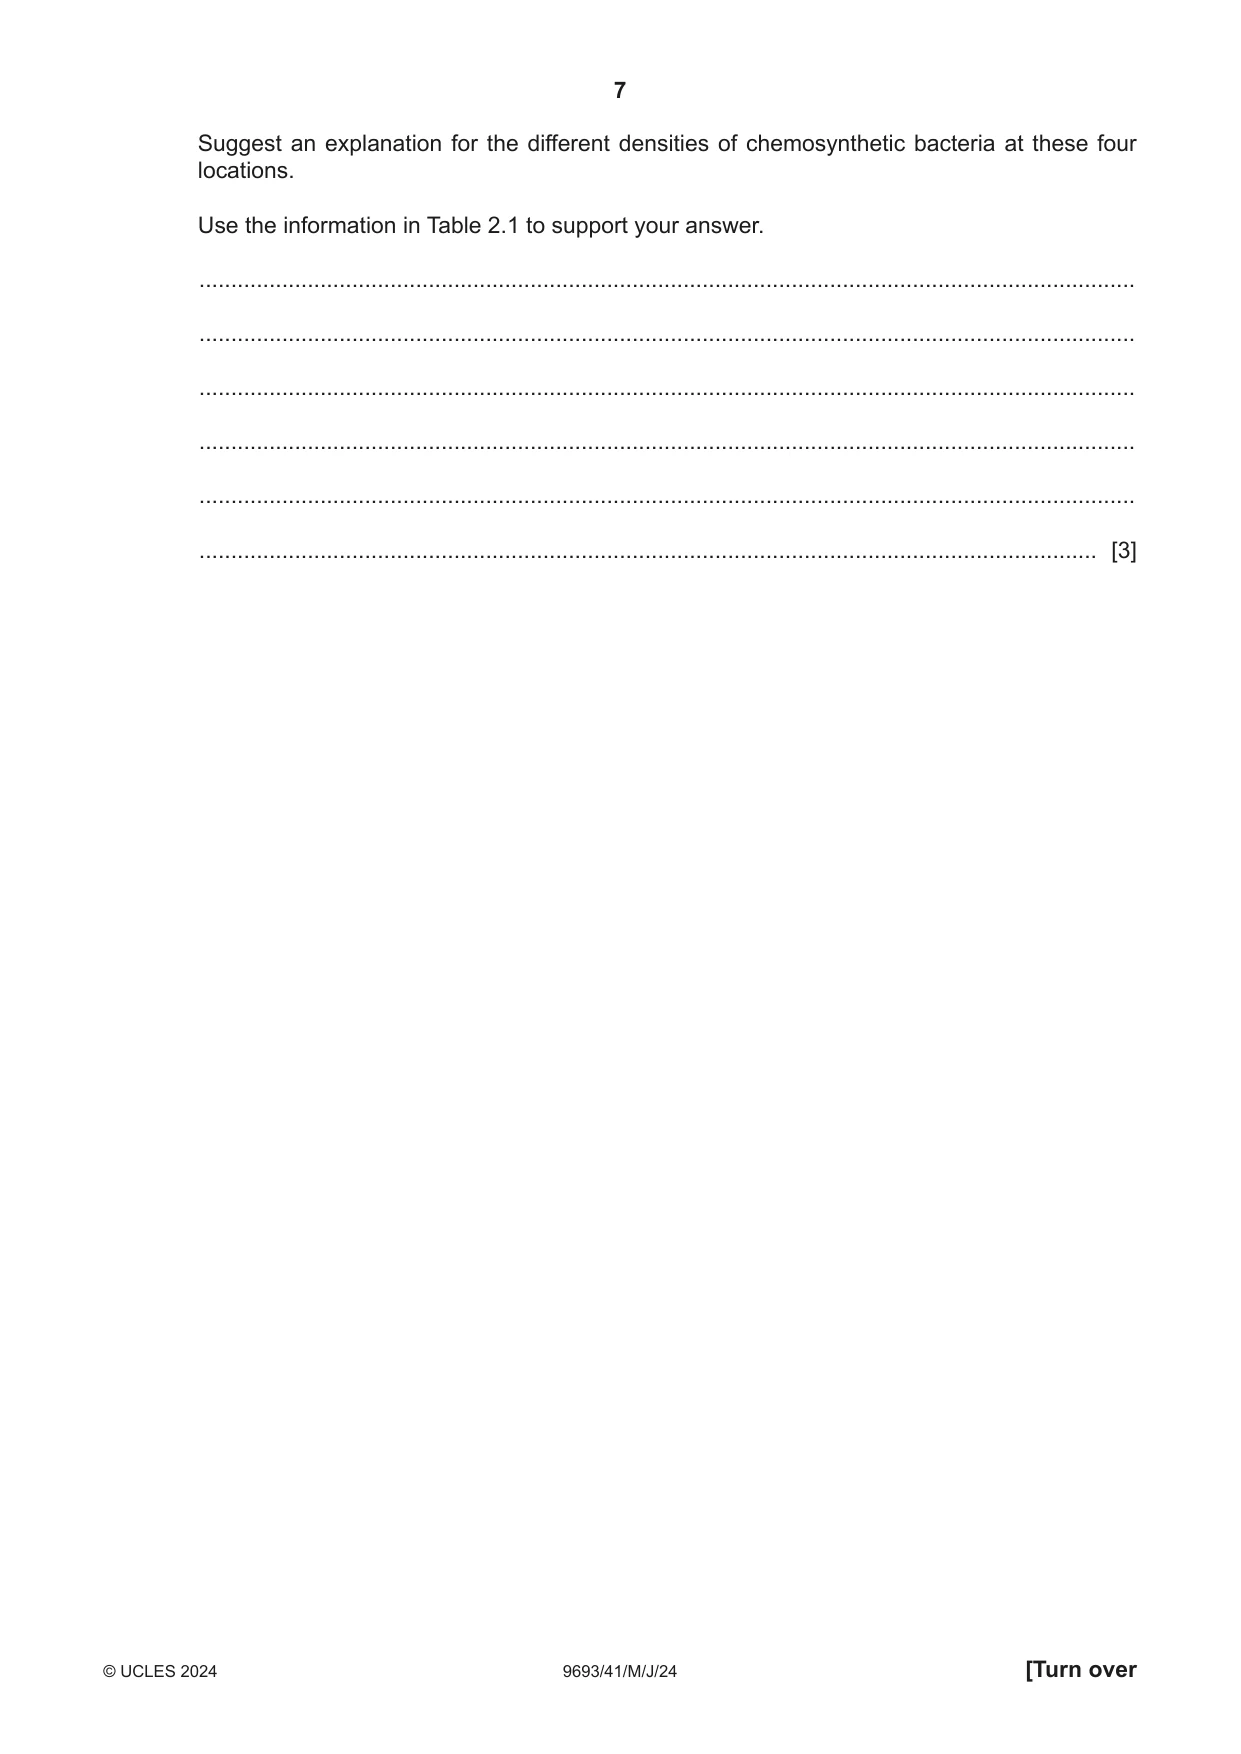
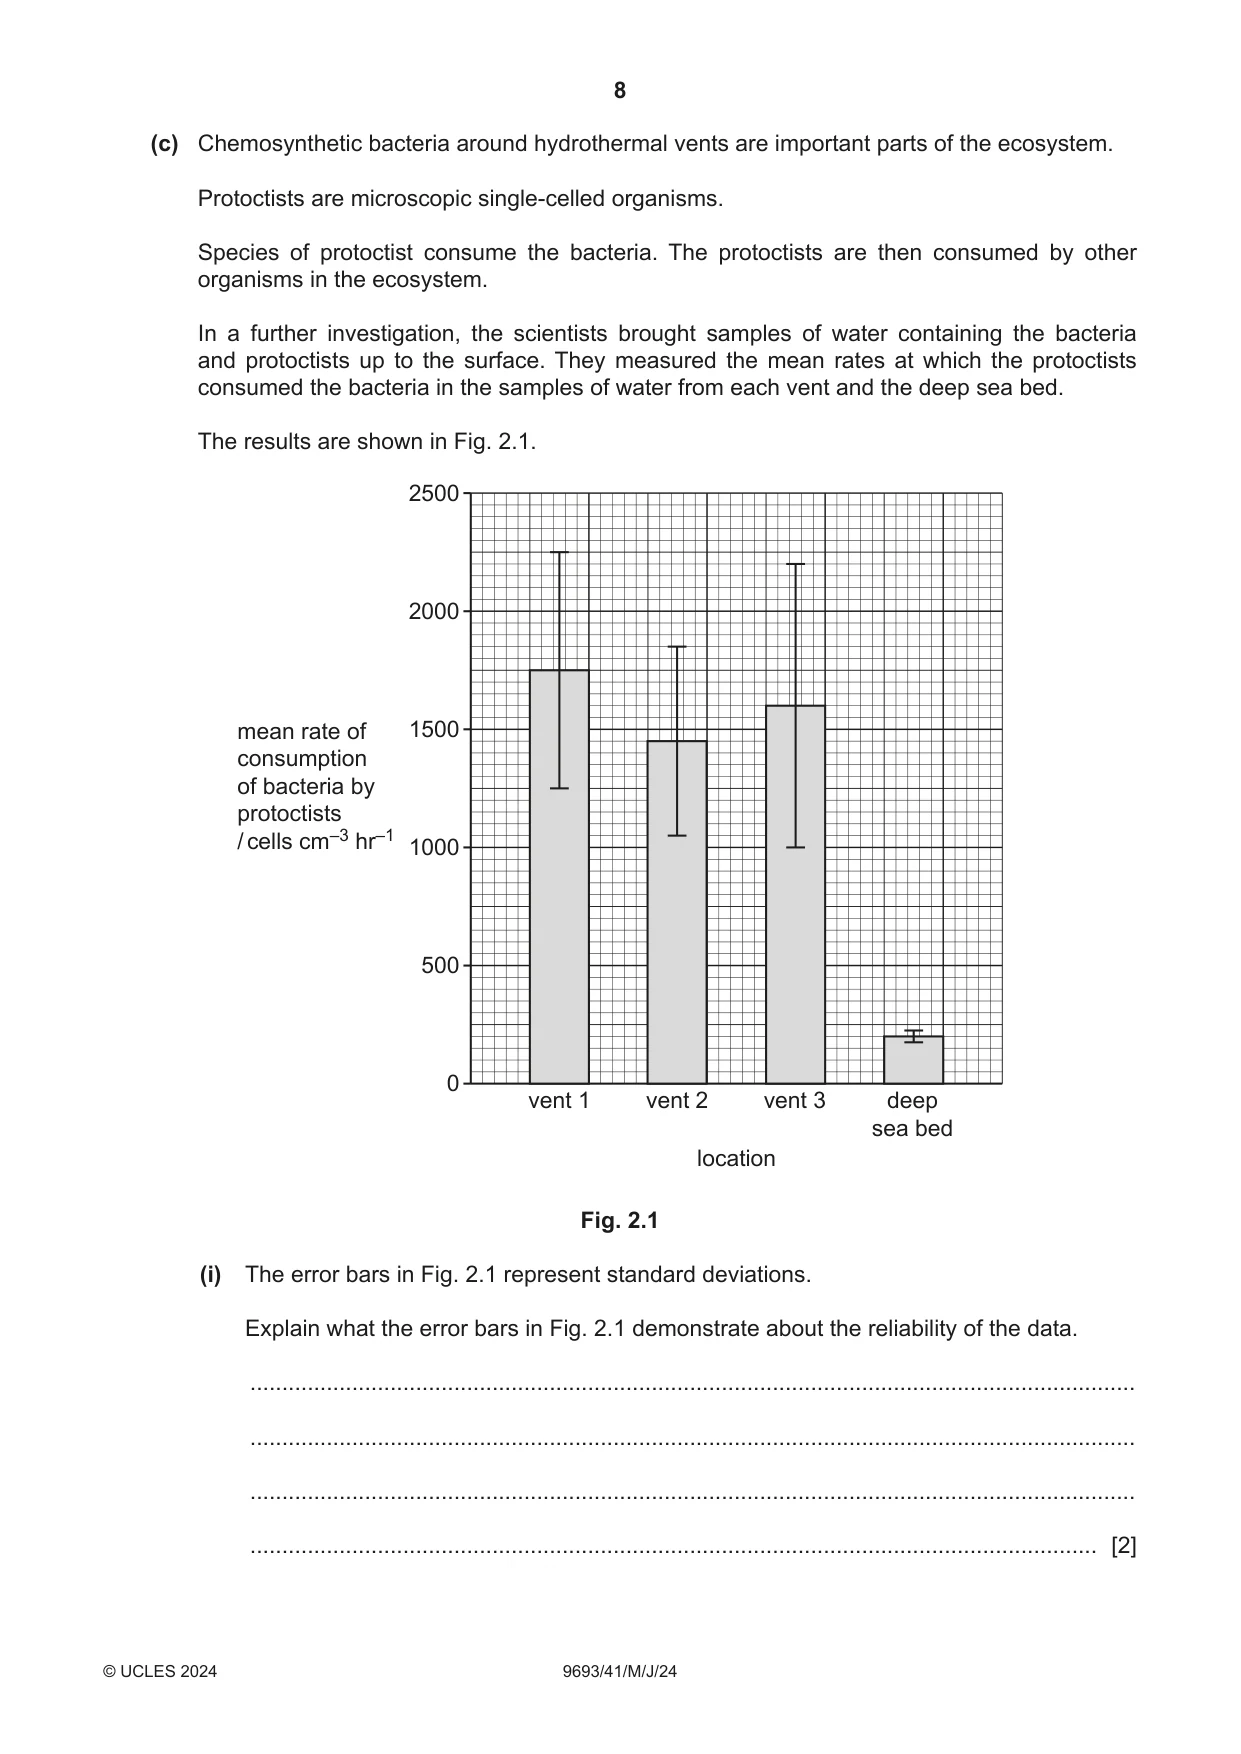
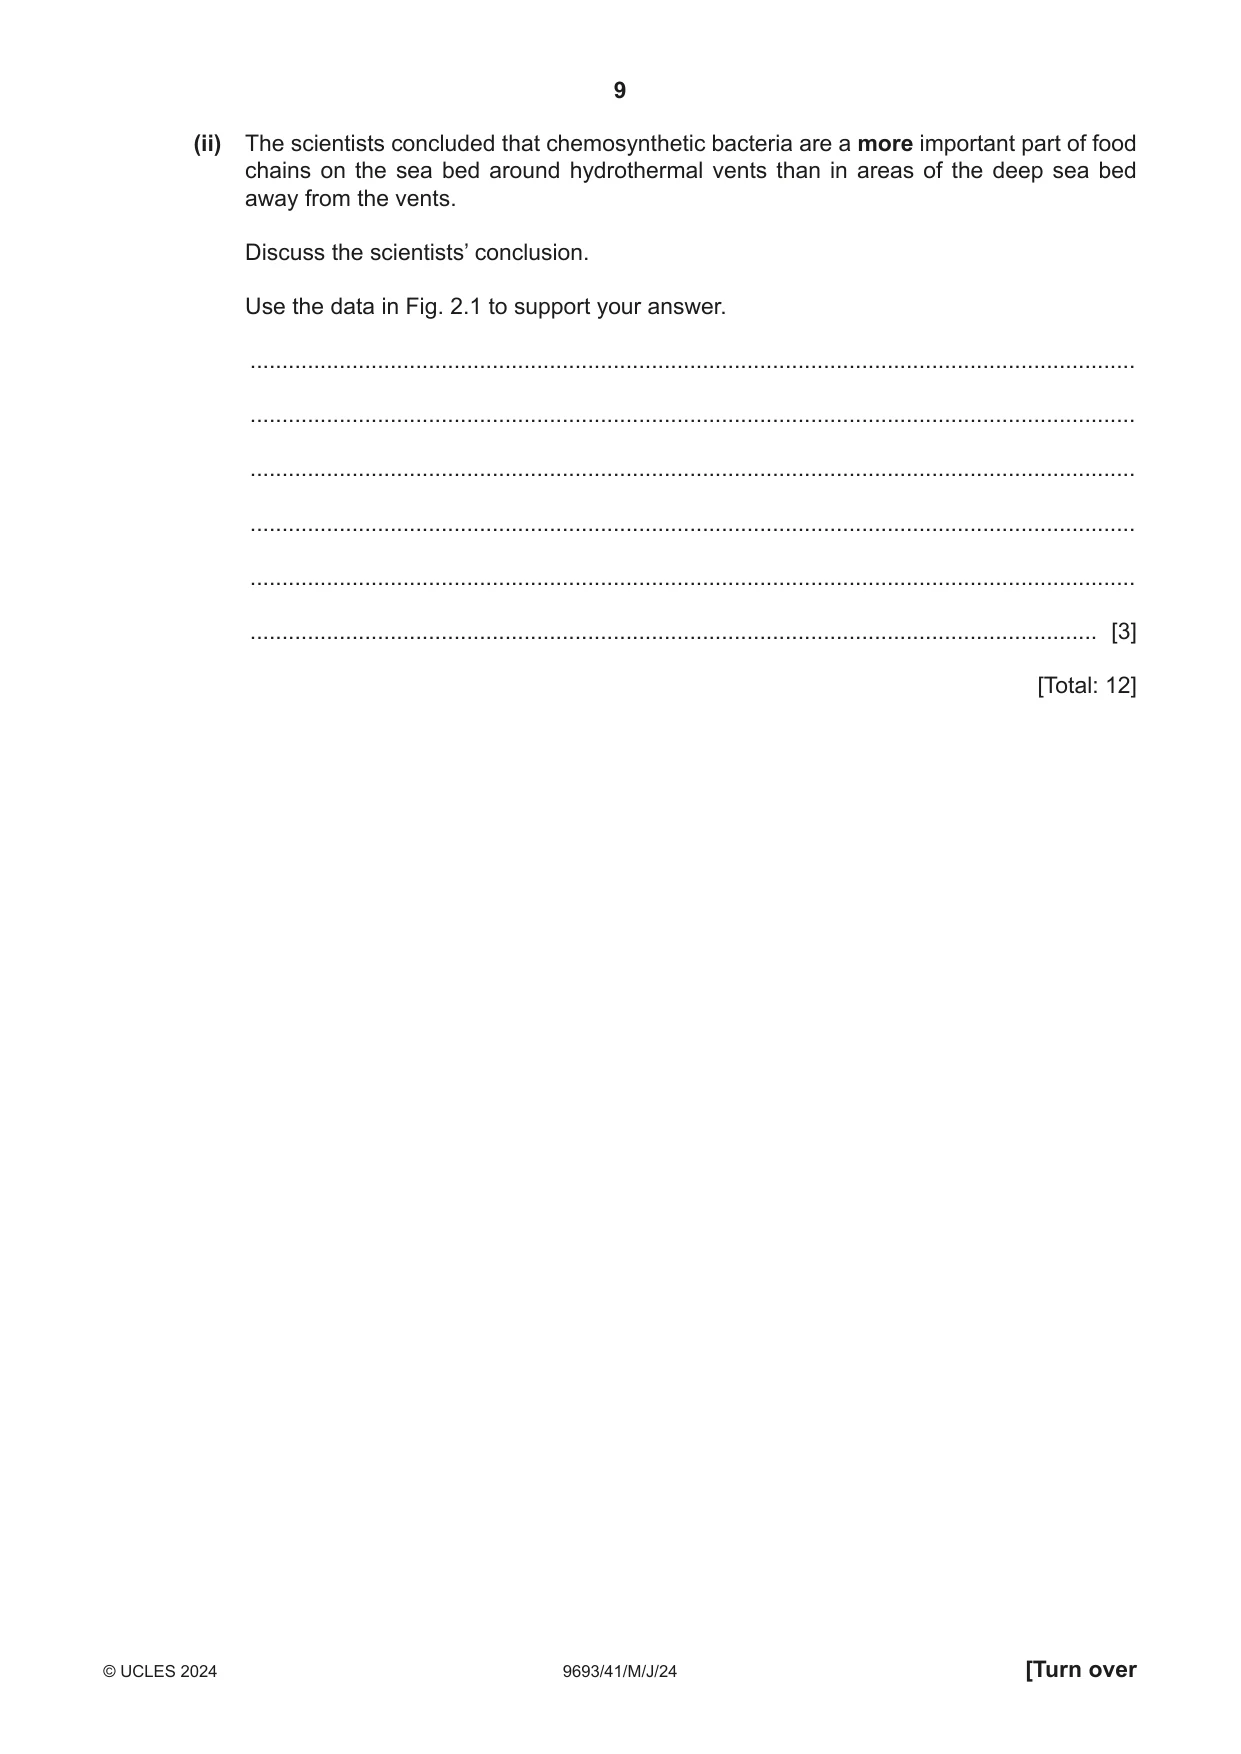
2 The giant tubeworm, Riftia, lives near hydrothermal vents. Endoriftia bacteria live inside Riftia. (a) (i) Outline how Endoriftia produces glucose by chemosynthesis. ........................................................................................................................................... ........................................................................................................................................... ........................................................................................................................................... ..................................................................................................................................... [2] (ii) Explain the relationship between Riftia and Endoriftia. ........................................................................................................................................... ........................................................................................................................................... ........................................................................................................................................... ..................................................................................................................................... [2] (b) Some species of chemosynthetic bacteria live in the water and substrate close to hydrothermal vents. Scientists investigated the relationship between the population density of free-living chemosynthetic bacteria and the presence of hydrogen gas (H2) and methane gas (CH4). They took samples at three different hydrothermal vents and also at an area of the deep sea bed where there were no hydrothermal vents. The results are shown in Table 2.1. Table 2.1 factor location vent 1 vent 2 vent 3 deep sea bed concentration of H2 21.9 127.0 9.4 0.0 / μmol dm–3 concentration of CH4 23.7 10.1 38.4 0.0 / μmol dm–3 population density of 5.51 3.14 5.62 2.91 chemosynthetic bacteria / cells per cm3 × 104 Suggest an explanation for the different densities of chemosynthetic bacteria at these four locations. Use the information in Table 2.1 to support your answer. ................................................................................................................................................... ................................................................................................................................................... ................................................................................................................................................... ................................................................................................................................................... ................................................................................................................................................... ............................................................................................................................................. [3] (c) Chemosynthetic bacteria around hydrothermal vents are important parts of the ecosystem. Protoctists are microscopic single-celled organisms. Species of protoctist consume the bacteria. The protoctists are then consumed by other organisms in the ecosystem. In a further investigation, the scientists brought samples of water containing the bacteria and protoctists up to the surface. They measured the mean rates at which the protoctists consumed the bacteria in the samples of water from each vent and the deep sea bed. The results are shown in Fig. 2.1. 2500 2000 mean rate of 1500 consumption of bacteria by protoctists / cells cm–3 hr–1 1000 500 0 vent 1 vent 2 vent 3 deep sea bed location Fig. 2.1 (i) The error bars in Fig. 2.1 represent standard deviations. Explain what the error bars in Fig. 2.1 demonstrate about the reliability of the data. ........................................................................................................................................... ........................................................................................................................................... ........................................................................................................................................... ..................................................................................................................................... [2] (ii) The scientists concluded that chemosynthetic bacteria are a more important part of food chains on the sea bed around hydrothermal vents than in areas of the deep sea bed away from the vents. Discuss the scientists’ conclusion. Use the data in Fig. 2.1 to support your answer. ........................................................................................................................................... ........................................................................................................................................... ........................................................................................................................................... ........................................................................................................................................... ........................................................................................................................................... ..................................................................................................................................... [3] [Total: 12]
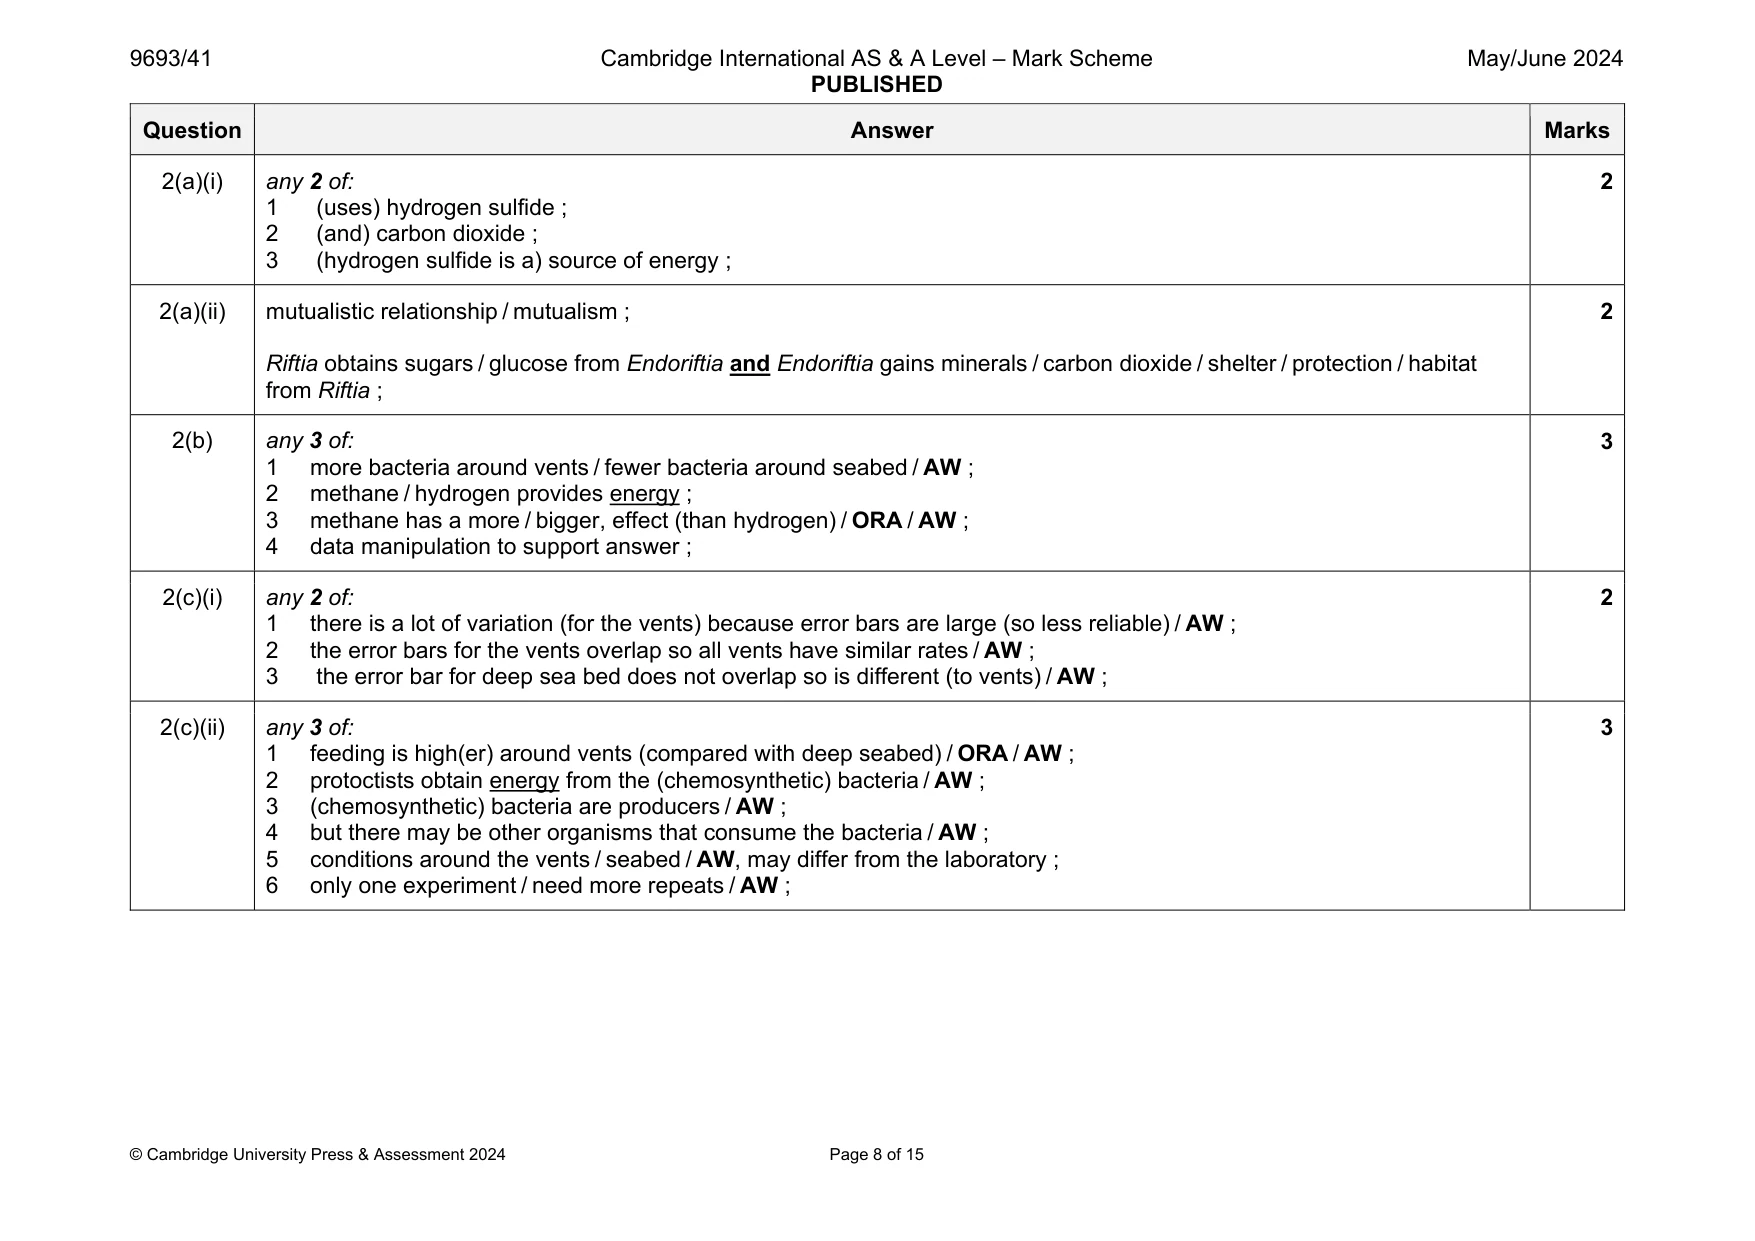
Mark scheme: 2(a)(i) any 2 of: 1 (uses) hydrogen sulfide ; 2 (and) carbon dioxide ; 3 (hydrogen sulfide is a) source of energy ; 2 2(a)(ii) mutualistic relationship / mutualism ; Riftia obtains sugars / glucose from Endoriftia and Endoriftia gains minerals / carbon dioxide / shelter / protection / habitat from Riftia ; 2 2(b) any 3 of: 1 more bacteria around vents / fewer bacteria around seabed / AW ; 2 methane / hydrogen provides energy ; 3 methane has a more / bigger, effect (than hydrogen) / ORA / AW ; 4 data manipulation to support answer ; 3 2(c)(i) any 2 of: 1 there is a lot of variation (for the vents) because error bars are large (so less reliable) / AW ; 2 the error bars for the vents overlap so all vents have similar rates / AW ; 3 the error bar for deep sea bed does not overlap so is different (to vents) / AW ; 2 2(c)(ii) any 3 of: 1 feeding is high(er) around vents (compared with deep seabed) / ORA / AW ; 2 protoctists obtain energy from the (chemosynthetic) bacteria / AW ; 3 (chemosynthetic) bacteria are producers / AW ; 4 but there may be other organisms that consume the bacteria / AW ; 5 conditions around the vents / seabed / AW, may differ from the laboratory ; 6 only one experiment / need more repeats / AW ; 3
Q3 · Aquaculture in coastal areas is used to produce large quantities of shrimp
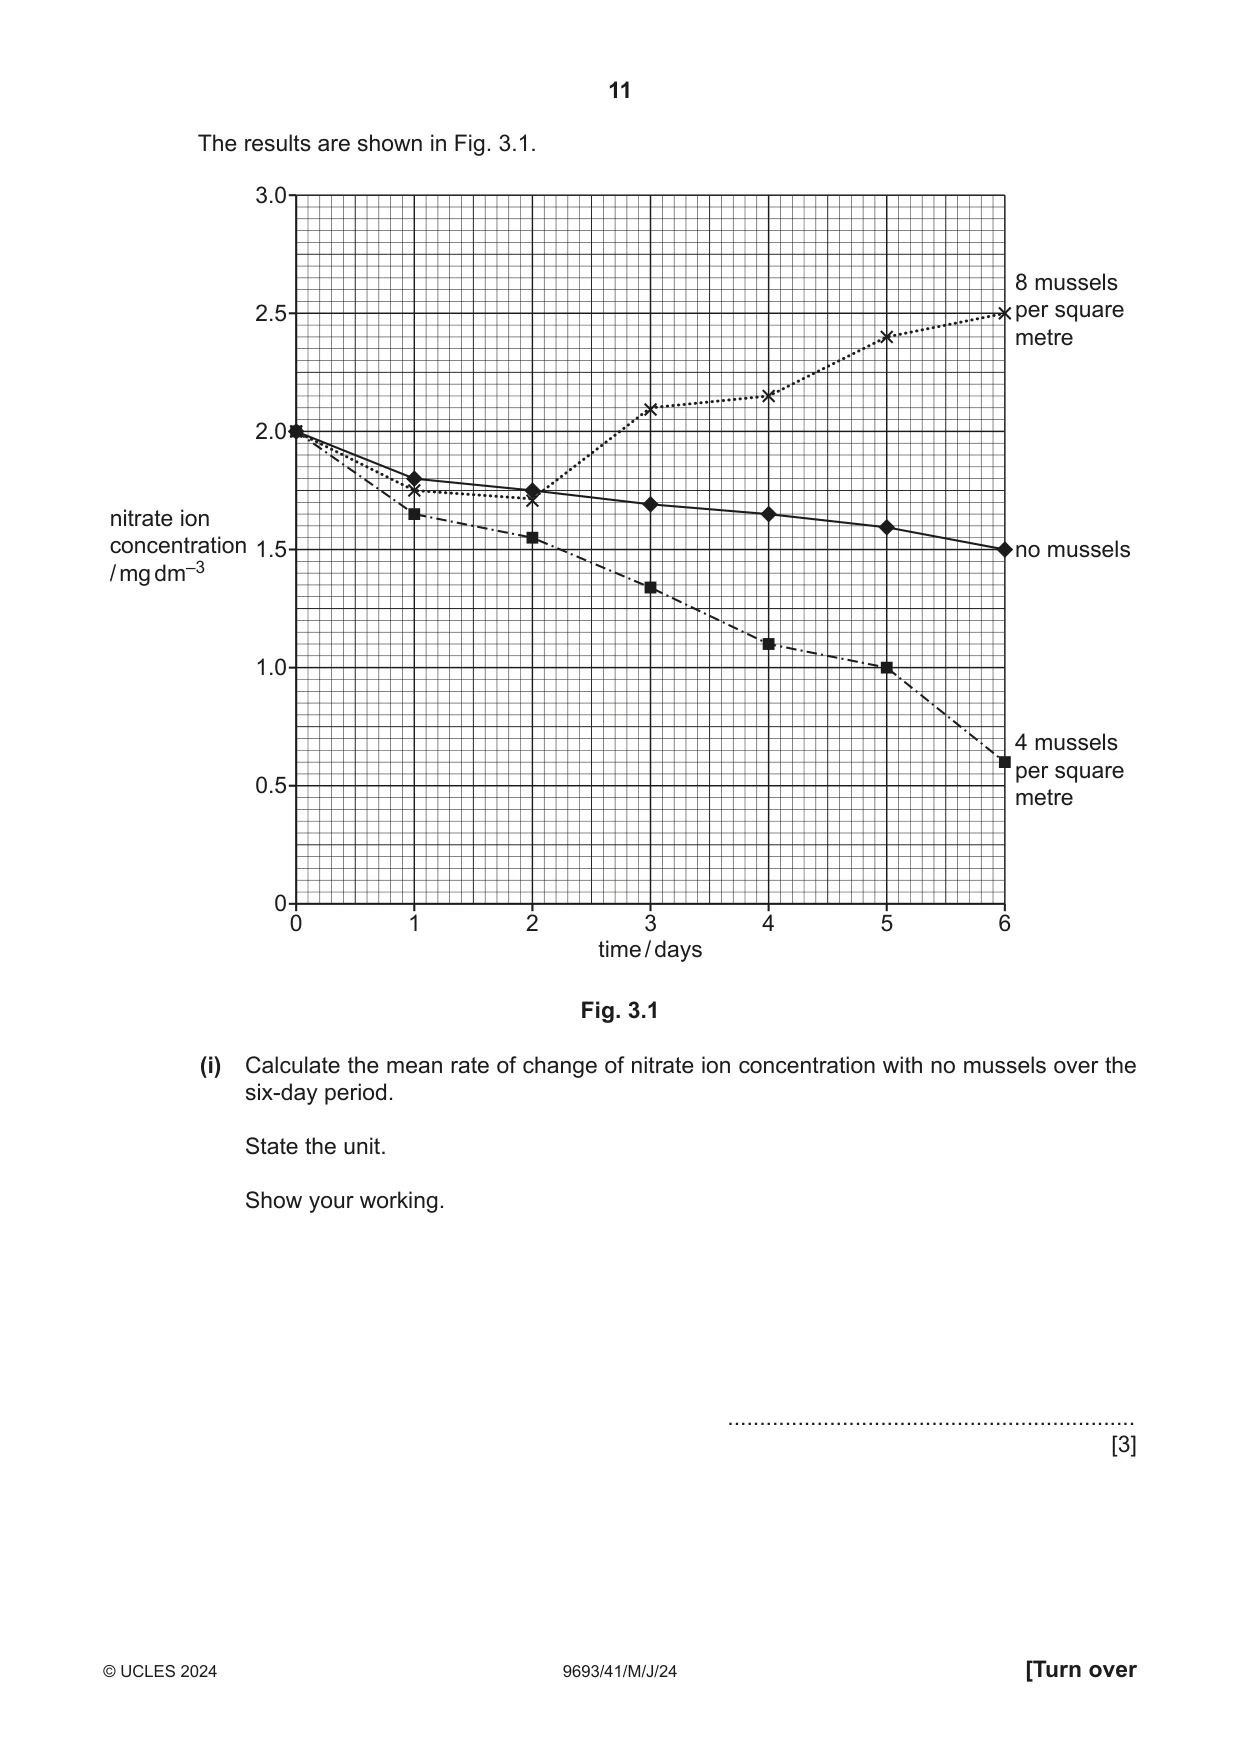
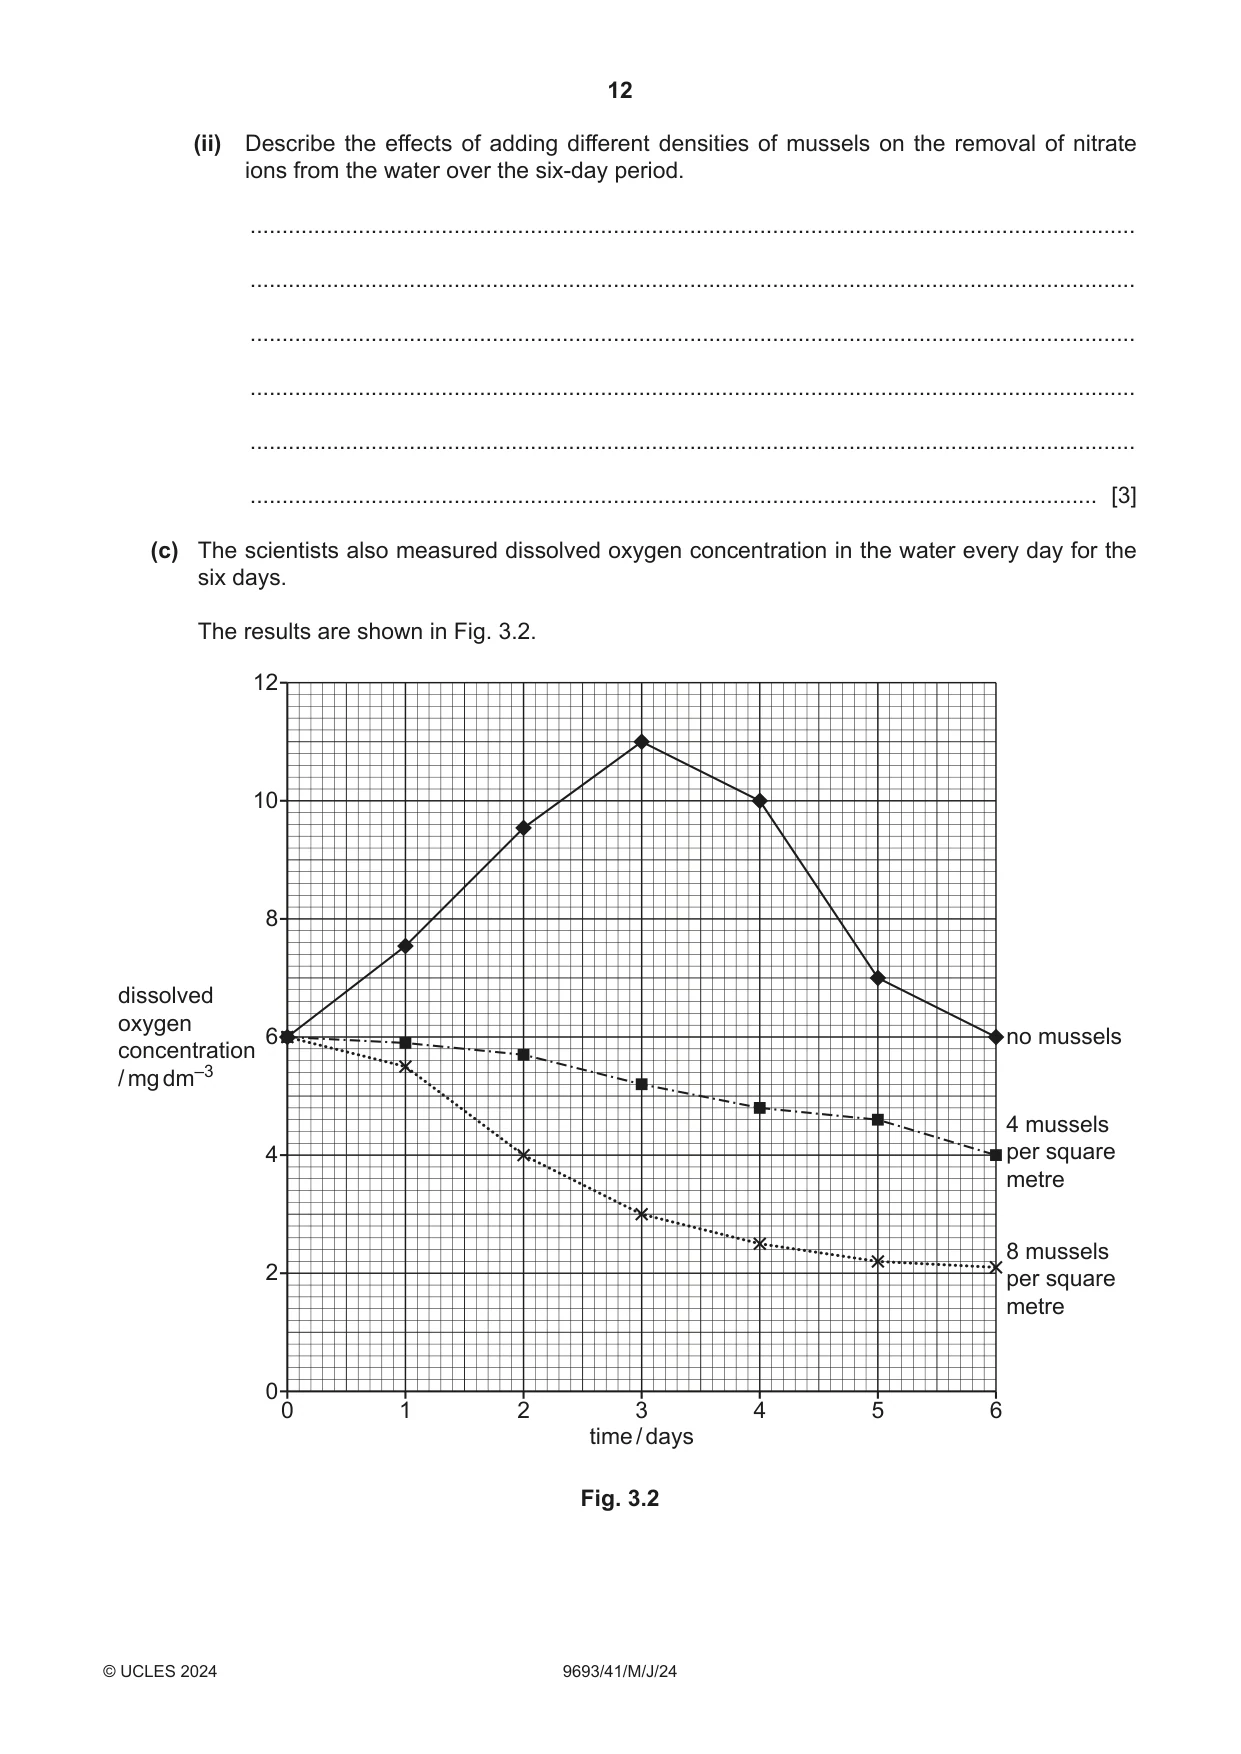
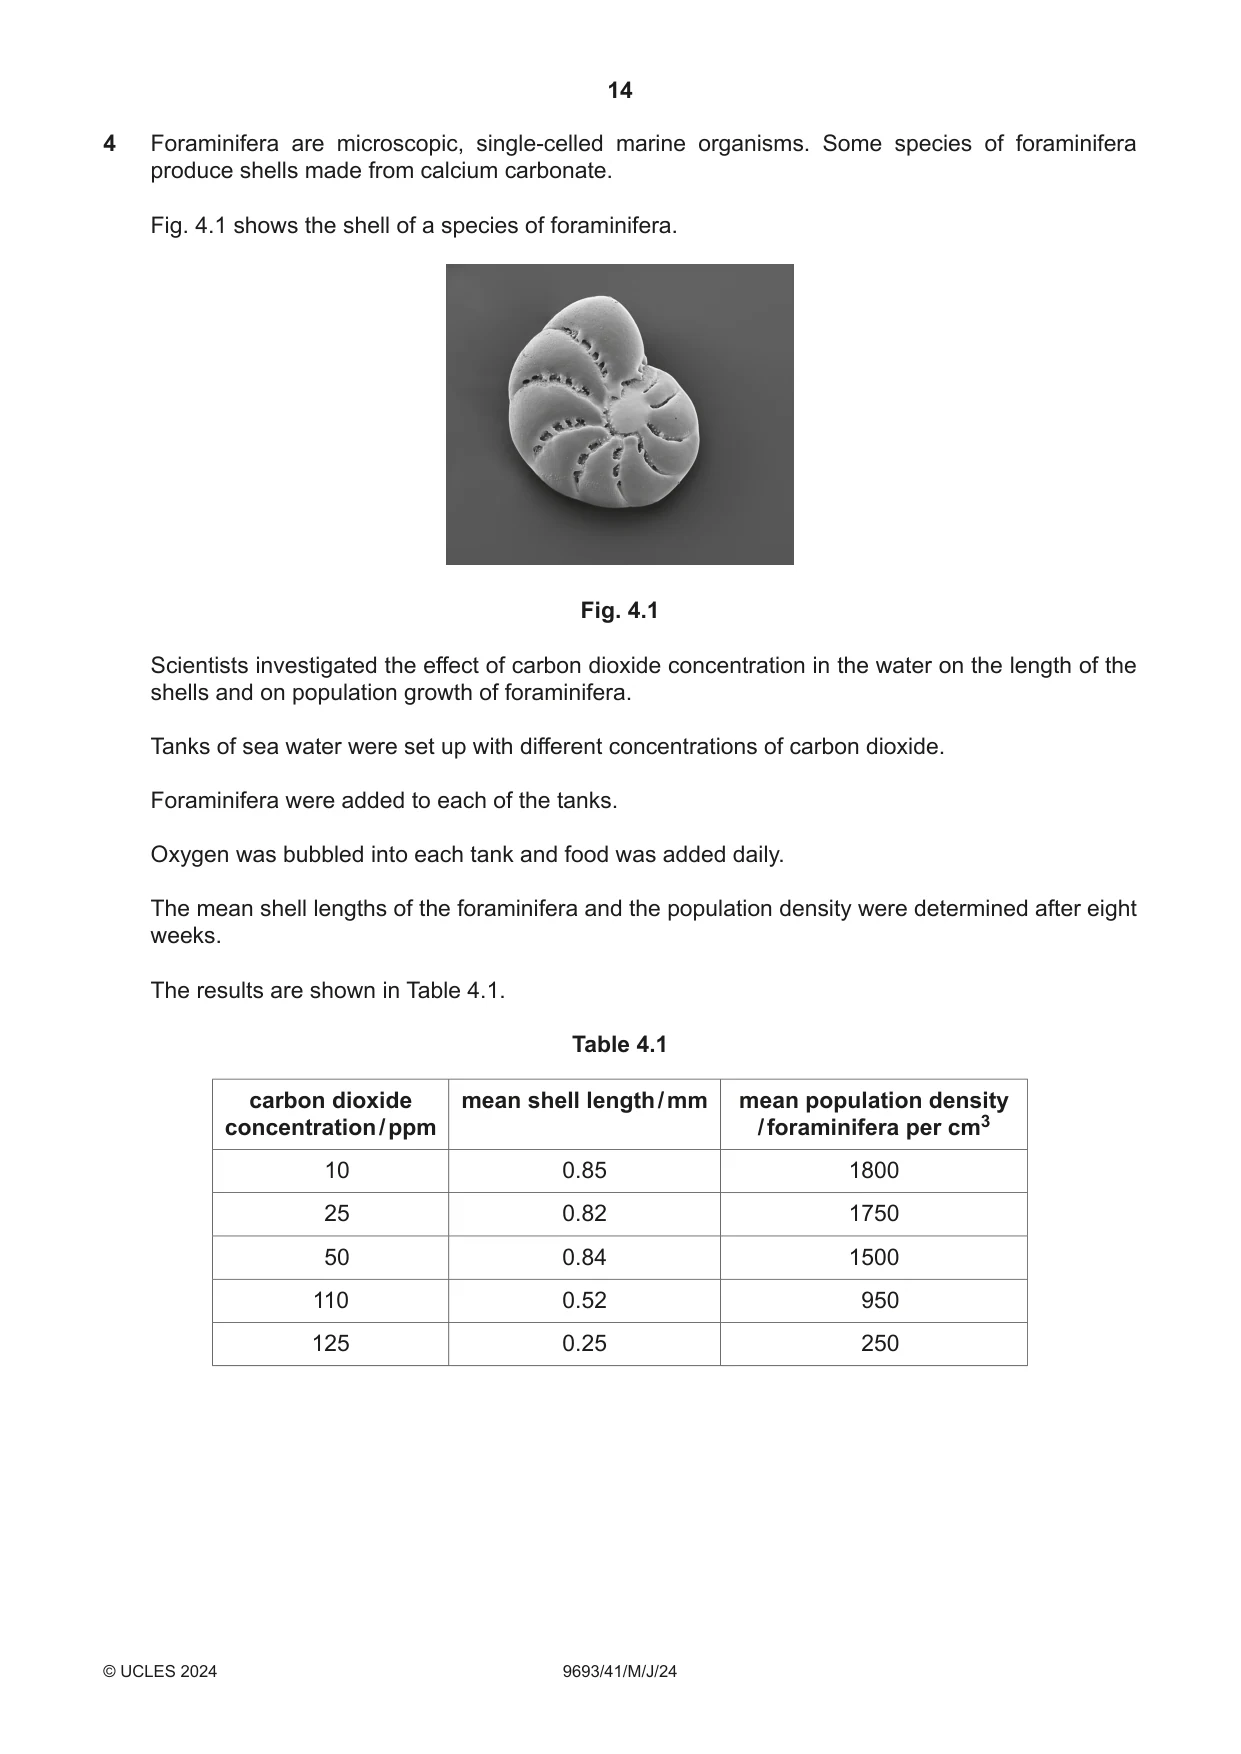
3 Aquaculture in coastal areas is used to produce large quantities of shrimp. Shrimp aquaculture can cause environmental pollution. Scientists are researching ways to make shrimp aquaculture more environmentally sustainable. (a) (i) Outline the process for aquaculture of shrimp. ........................................................................................................................................... ........................................................................................................................................... ........................................................................................................................................... ........................................................................................................................................... ........................................................................................................................................... ..................................................................................................................................... [3] (ii) Give two strategies that can be used to help ensure the long-term success of aquaculture. 1 ........................................................................................................................................ ........................................................................................................................................... 2 ........................................................................................................................................ ........................................................................................................................................... [2] (b) Mussels are filter-feeding organisms that consume microalgae and other organic waste. Wastewater from shrimp aquaculture sites contains large amounts of ammonium ions that pollute the sea. The ammonium ions are converted to nitrate ions by bacteria. Scientists investigated the effects of growing mussels and adding microalgae on the removal of nitrate ions from wastewater produced by shrimp aquaculture. • Wastewater from a shrimp aquaculture site was collected and placed into tanks. • Different densities of mussels were added to the tanks. • The same mass of microalgae was added to each tank. • The nitrate ion concentration of the water was measured at the start and every day for the next six days. The results are shown in Fig. 3.1. 3.0 8 mussels 2.5 per square metre 2.0 nitrate ion concentration 1.5 no mussels / mg dm–3 1.0 4 mussels per square 0.5 metre 0 0 1 2 3 4 5 6 time / days Fig. 3.1 (i) Calculate the mean rate of change of nitrate ion concentration with no mussels over the six-day period. State the unit. Show your working. ................................................................ [3] (ii) Describe the effects of adding different densities of mussels on the removal of nitrate ions from the water over the six-day period. ........................................................................................................................................... ........................................................................................................................................... ........................................................................................................................................... ........................................................................................................................................... ........................................................................................................................................... ..................................................................................................................................... [3] (c) The scientists also measured dissolved oxygen concentration in the water every day for the six days. The results are shown in Fig. 3.2. 12 10 8 dissolved oxygen 6 no musselsconcentration / mg dm–3 4 mussels 4 per square metre 8 mussels 2 per square metre 0 0 1 2 3 4 5 6 time / days Fig. 3.2 (i) The same mass of microalgae was added to each tank at the start. Explain the change in dissolved oxygen concentration in the water up to day three when microalgae were present with no mussels. ........................................................................................................................................... ........................................................................................................................................... ........................................................................................................................................... ..................................................................................................................................... [2] (ii) Ammonium ions are converted into nitrate ions by bacteria in the water. Nitrate ions are absorbed by algae. Mussels consume algae. Discuss the effects of adding different densities of mussels on the changes in concentration of oxygen and nitrate ions in the water. Use the information in Fig. 3.1 and Fig. 3.2 to support your answer. ........................................................................................................................................... ........................................................................................................................................... ........................................................................................................................................... ........................................................................................................................................... ........................................................................................................................................... ........................................................................................................................................... ........................................................................................................................................... ..................................................................................................................................... [4] [Total: 17]
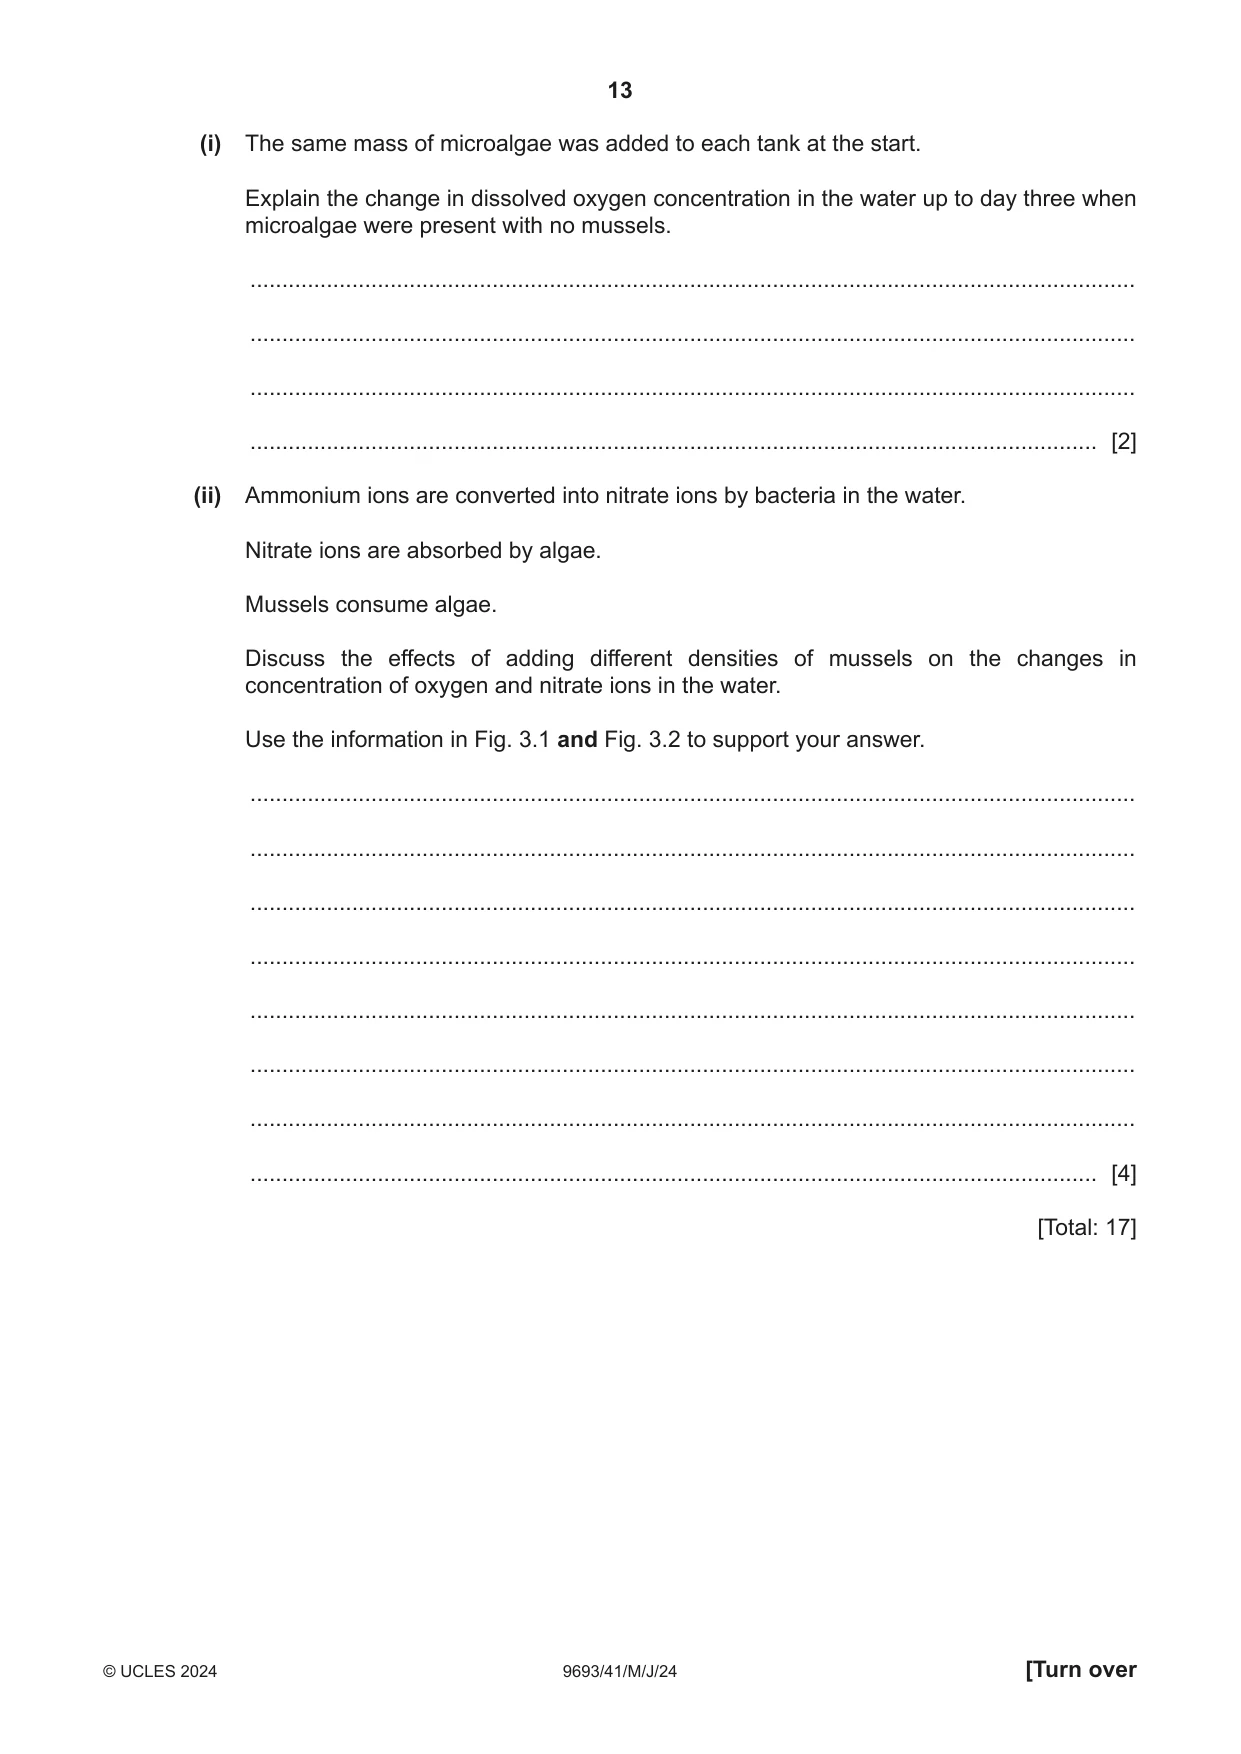
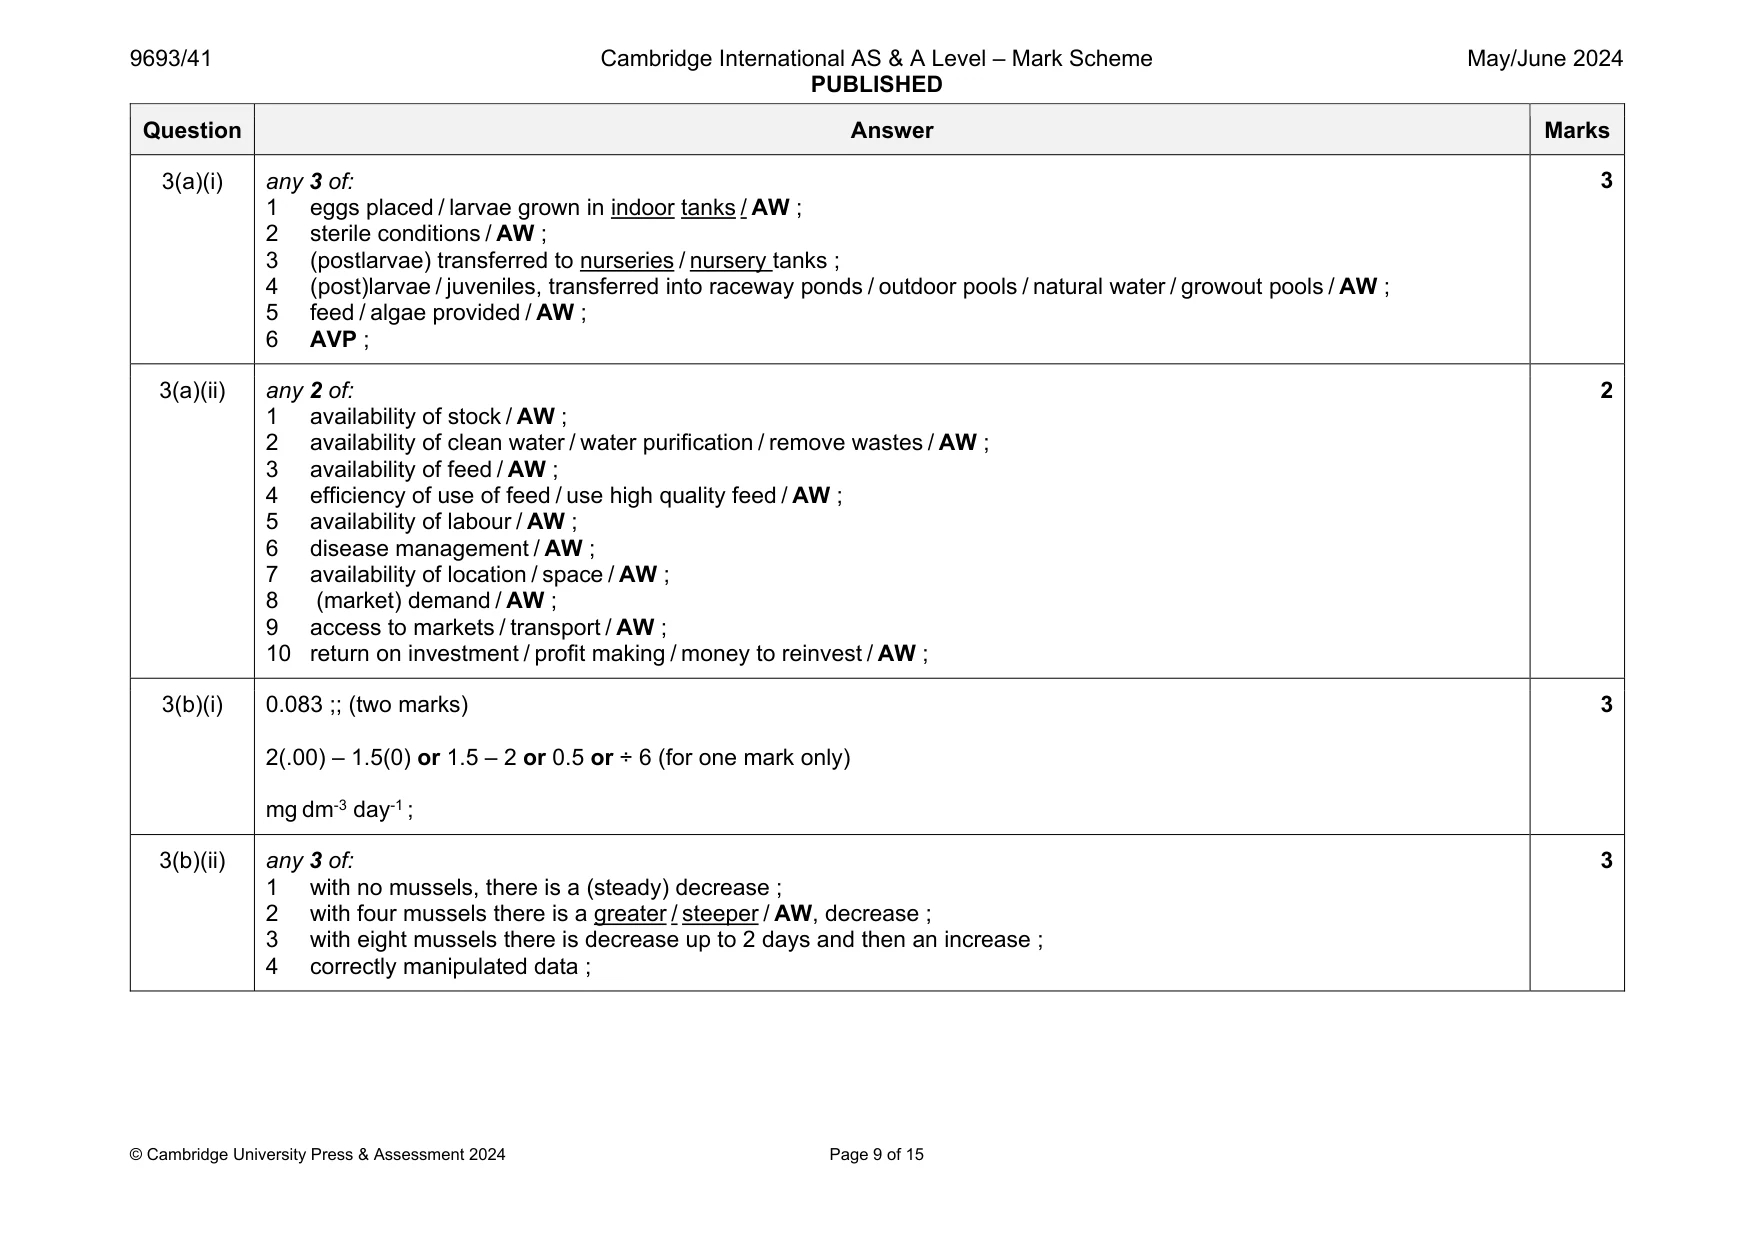
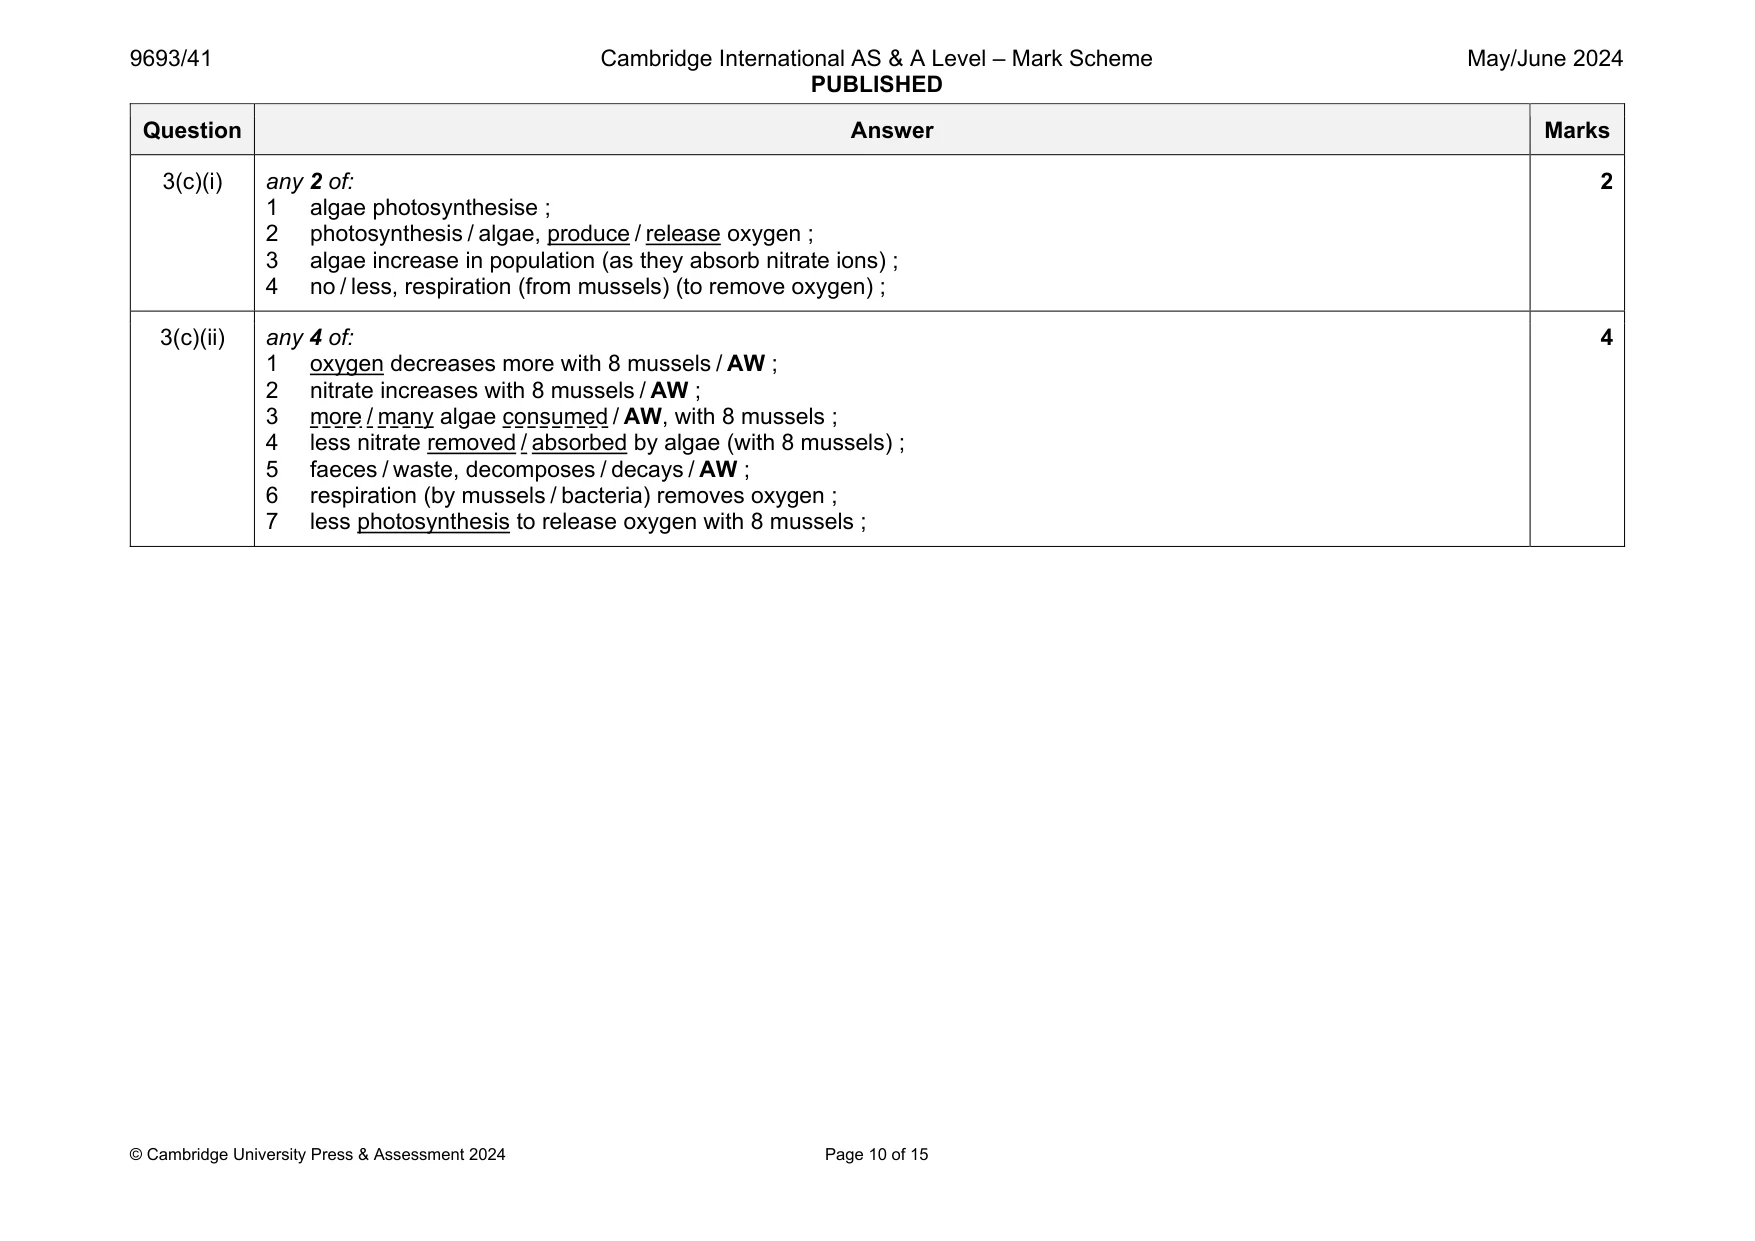
Mark scheme: 3(a)(i) any 3 of: 1 eggs placed / larvae grown in indoor tanks / AW ; 2 sterile conditions / AW ; 3 (postlarvae) transferred to nurseries / nursery tanks ; 4 (post)larvae / juveniles, transferred into raceway ponds / outdoor pools / natural water / growout pools / AW ; 5 feed / algae provided / AW ; 6 AVP ; 3(a)(ii) any 2 of: 1 availability of stock / AW ; 2 availability of clean water / water purification / remove wastes / AW ; 3 availability of feed / AW ; 4 efficiency of use of feed / use high quality feed / AW ; 5 availability of labour / AW ; 6 disease management / AW ; 7 availability of location / space / AW ; 8 (market) demand / AW ; 9 access to markets / transport / AW ; 10 return on investment / profit making / money to reinvest / AW ; 2 3(b)(i) 0.083 ;; (two marks) 2(.00) – 1.5(0) or 1.5 – 2 or 0.5 or ÷ 6 (for one mark only) mg dm-3 day-1 ; 3 3(b)(ii) any 3 of: 1 with no mussels, there is a (steady) decrease ; 2 with four mussels there is a greater / steeper / AW, decrease ; 3 with eight mussels there is decrease up to 2 days and then an increase ; 4 correctly manipulated data ; 3 Question Answer Marks 3(c)(i) any 2 of: 1 algae photosynthesise ; 2 photosynthesis / algae, produce / release oxygen ; 3 algae increase in population (as they absorb nitrate ions) ; 4 no / less, respiration (from mussels) (to remove oxygen) ; 2 3(c)(ii) any 4 of: 1 oxygen decreases more with 8 mussels / AW ; 2 nitrate increases with 8 mussels / AW ; 3 more / many algae consumed / AW, with 8 mussels ; 4 less nitrate removed / absorbed by algae (with 8 mussels) ; 5 faeces / waste, decomposes / decays / AW ; 6 respiration (by mussels / bacteria) removes oxygen ; 7 less photosynthesis to release oxygen with 8 mussels ; 4
Q4 · Foraminifera are microscopic, single-celled marine organisms
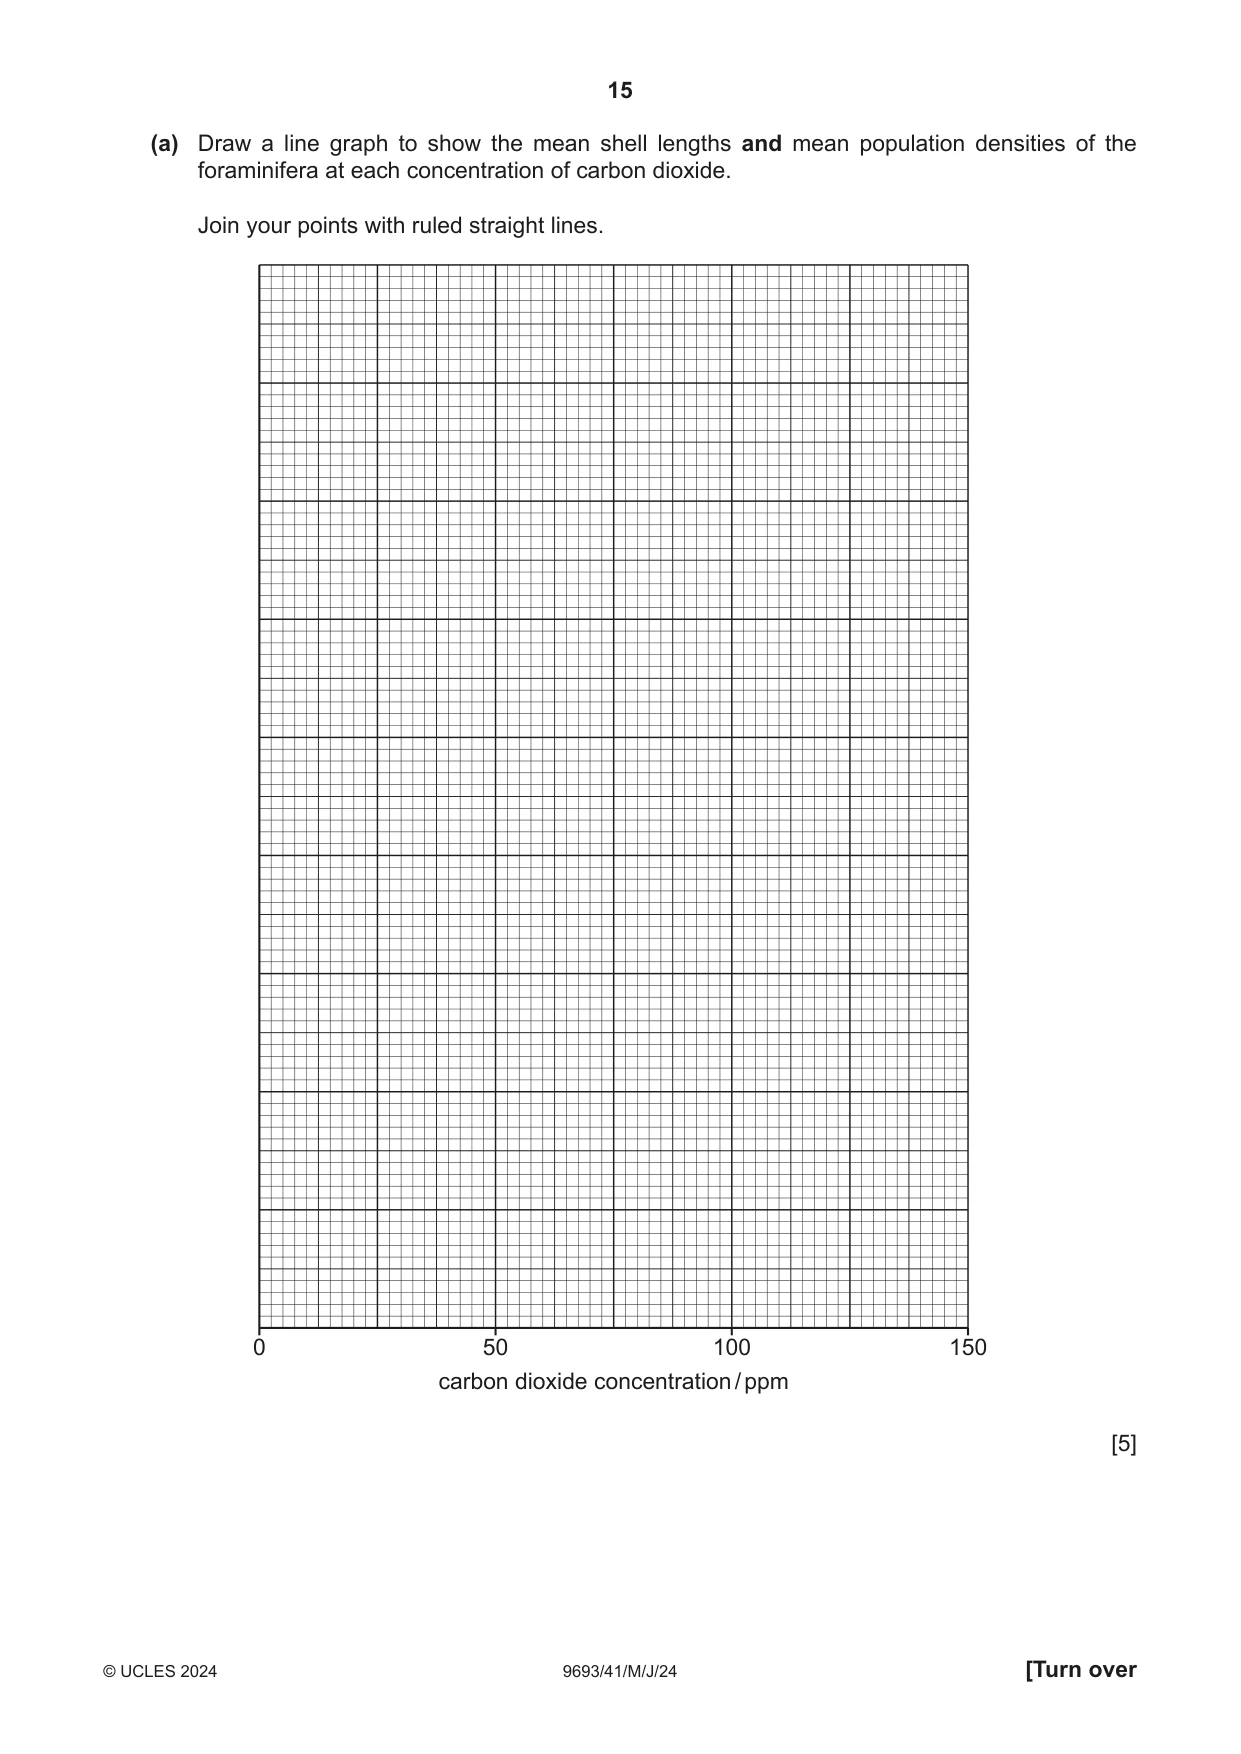
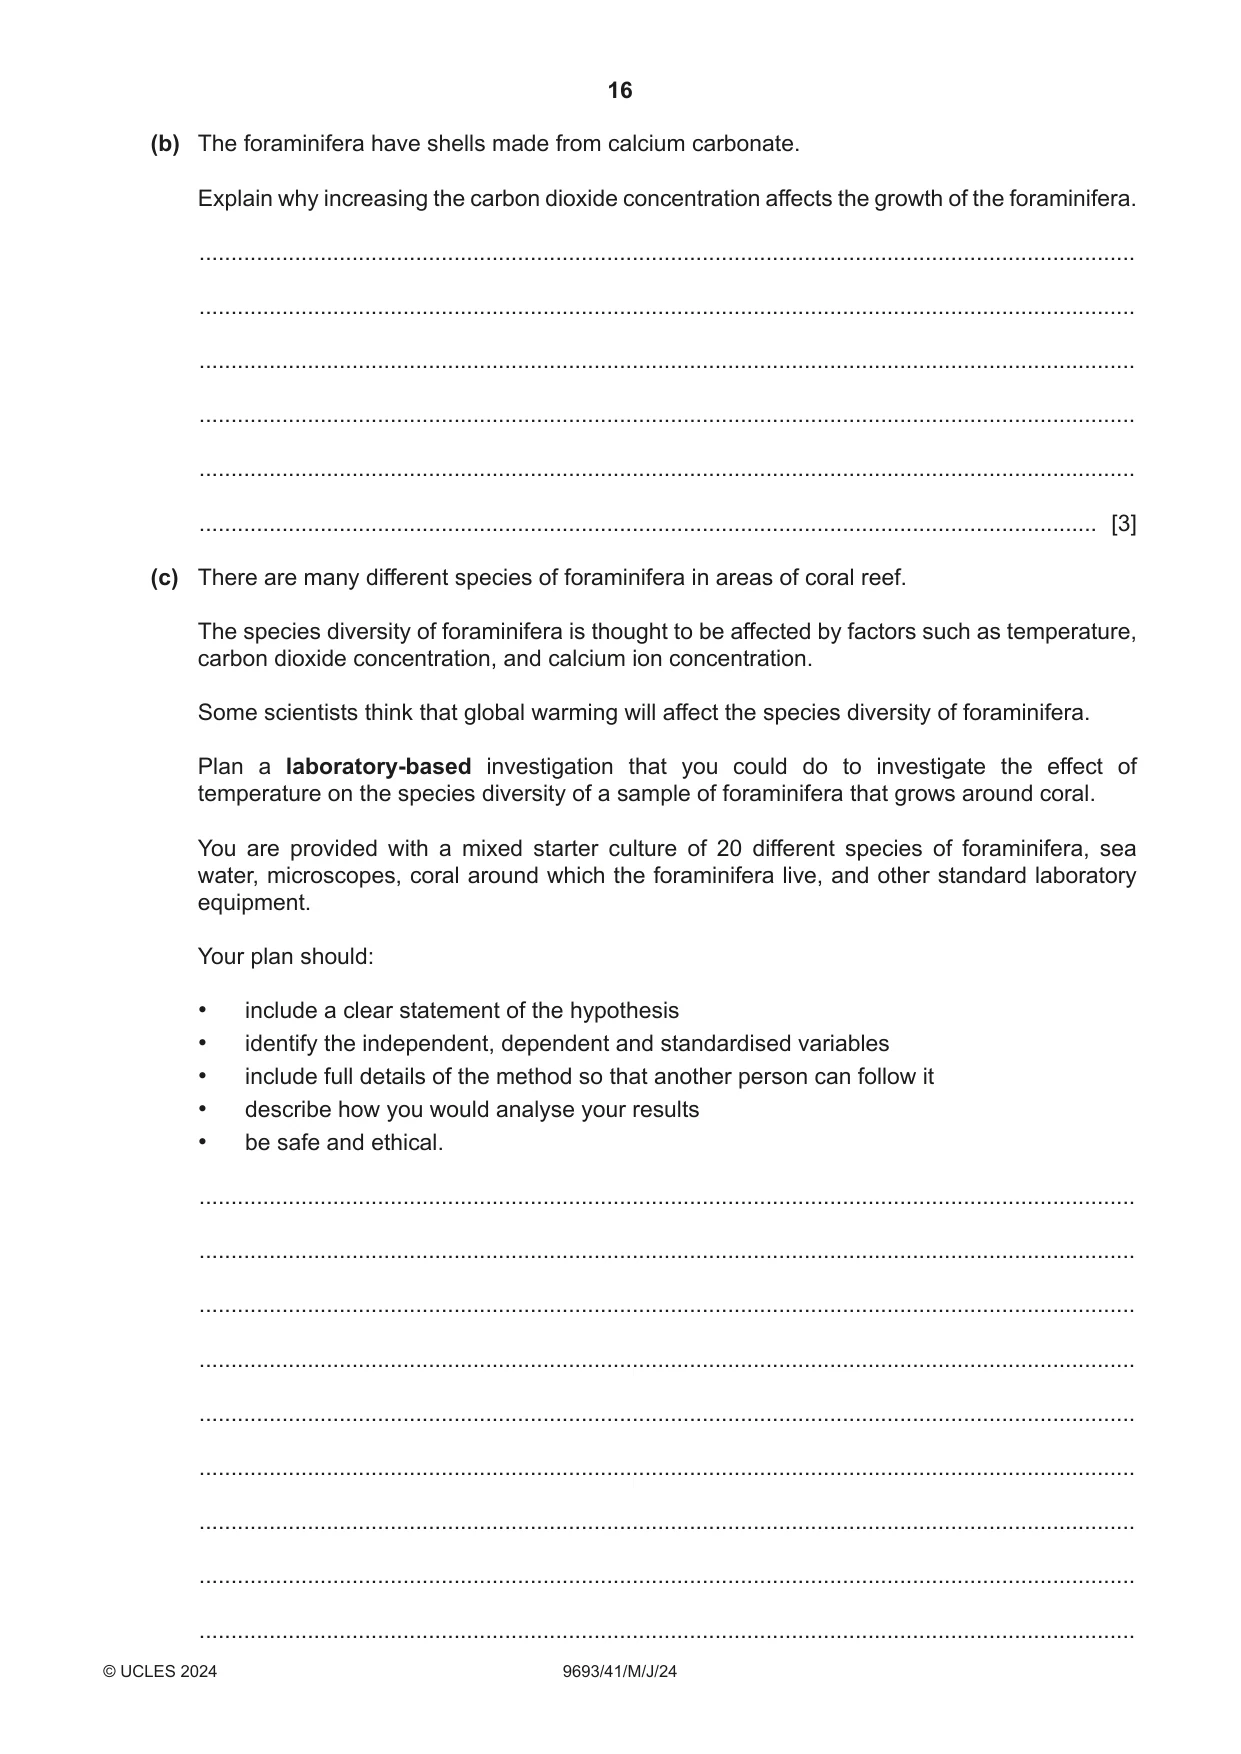
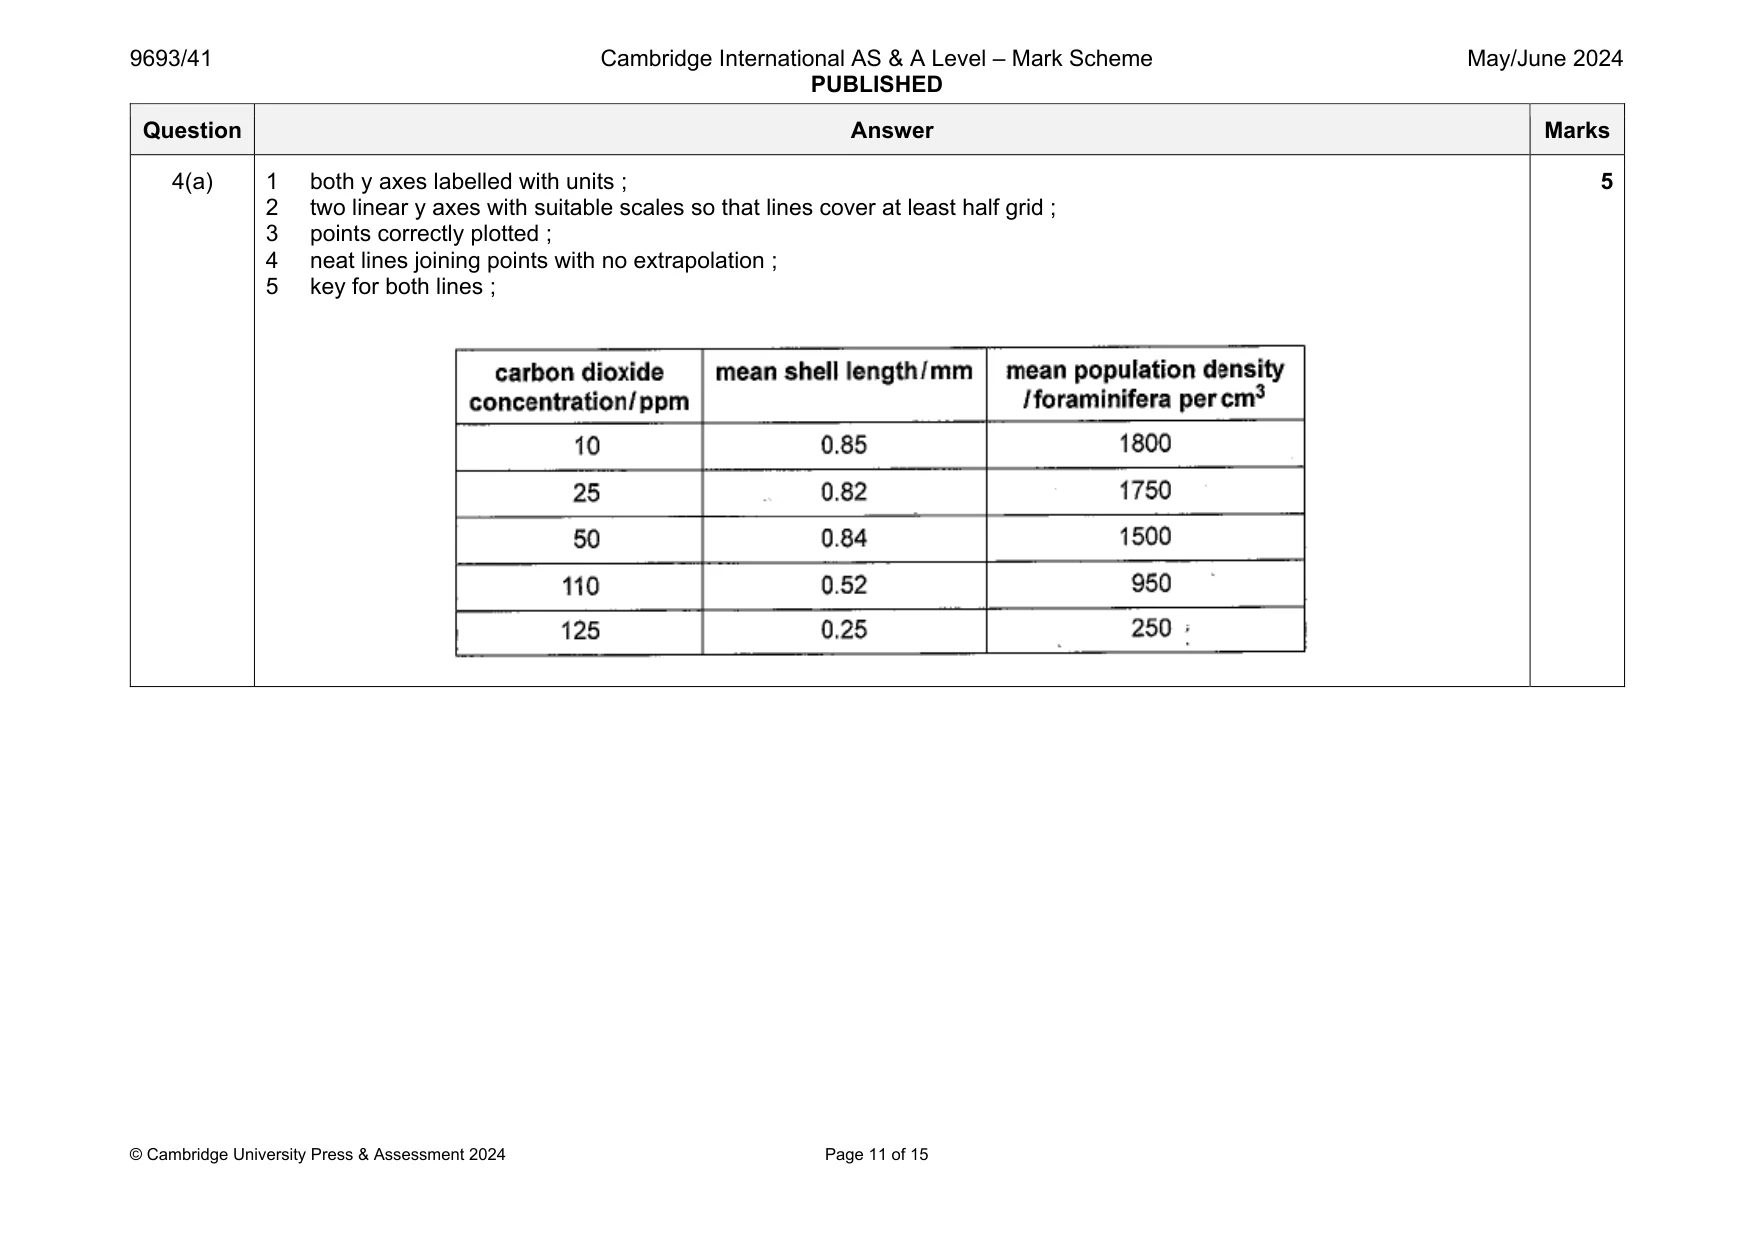
4 Foraminifera are microscopic, single-celled marine organisms. Some species of foraminifera produce shells made from calcium carbonate. Fig. 4.1 shows the shell of a species of foraminifera. Fig. 4.1 Scientists investigated the effect of carbon dioxide concentration in the water on the length of the shells and on population growth of foraminifera. Tanks of sea water were set up with different concentrations of carbon dioxide. Foraminifera were added to each of the tanks. Oxygen was bubbled into each tank and food was added daily. The mean shell lengths of the foraminifera and the population density were determined after eight weeks. The results are shown in Table 4.1. Table 4.1 carbon dioxide mean shell length / mm mean population density concentration / ppm / foraminifera per cm3 10 0.85 1800 25 0.82 1750 50 0.84 1500 110 0.52 950 125 0.25 250 (b) The foraminifera have shells made from calcium carbonate. Explain why increasing the carbon dioxide concentration affects the growth of the foraminifera. ................................................................................................................................................... ................................................................................................................................................... ................................................................................................................................................... ................................................................................................................................................... ................................................................................................................................................... ............................................................................................................................................. [3] (c) There are many different species of foraminifera in areas of coral reef. The species diversity of foraminifera is thought to be affected by factors such as temperature, carbon dioxide concentration, and calcium ion concentration. Some scientists think that global warming will affect the species diversity of foraminifera. Plan a laboratory-based investigation that you could do to investigate the effect of temperature on the species diversity of a sample of foraminifera that grows around coral. You are provided with a mixed starter culture of 20 different species of foraminifera, sea water, microscopes, coral around which the foraminifera live, and other standard laboratory equipment. Your plan should: • include a clear statement of the hypothesis • identify the independent, dependent and standardised variables • include full details of the method so that another person can follow it • describe how you would analyse your results • be safe and ethical. ................................................................................................................................................... ................................................................................................................................................... ................................................................................................................................................... ................................................................................................................................................... ................................................................................................................................................... ................................................................................................................................................... ................................................................................................................................................... ................................................................................................................................................... ................................................................................................................................................... ................................................................................................................................................... ................................................................................................................................................... ................................................................................................................................................... ................................................................................................................................................... ................................................................................................................................................... ................................................................................................................................................... ................................................................................................................................................... ................................................................................................................................................... ................................................................................................................................................... ................................................................................................................................................... ................................................................................................................................................... ................................................................................................................................................... ................................................................................................................................................... ................................................................................................................................................... ................................................................................................................................................... ................................................................................................................................................... ................................................................................................................................................... ................................................................................................................................................... ................................................................................................................................................... ................................................................................................................................................... ................................................................................................................................................... ................................................................................................................................................... ................................................................................................................................................... ................................................................................................................................................... ................................................................................................................................................... ................................................................................................................................................... ........................................................................................................................................... [11] [Total: 19]
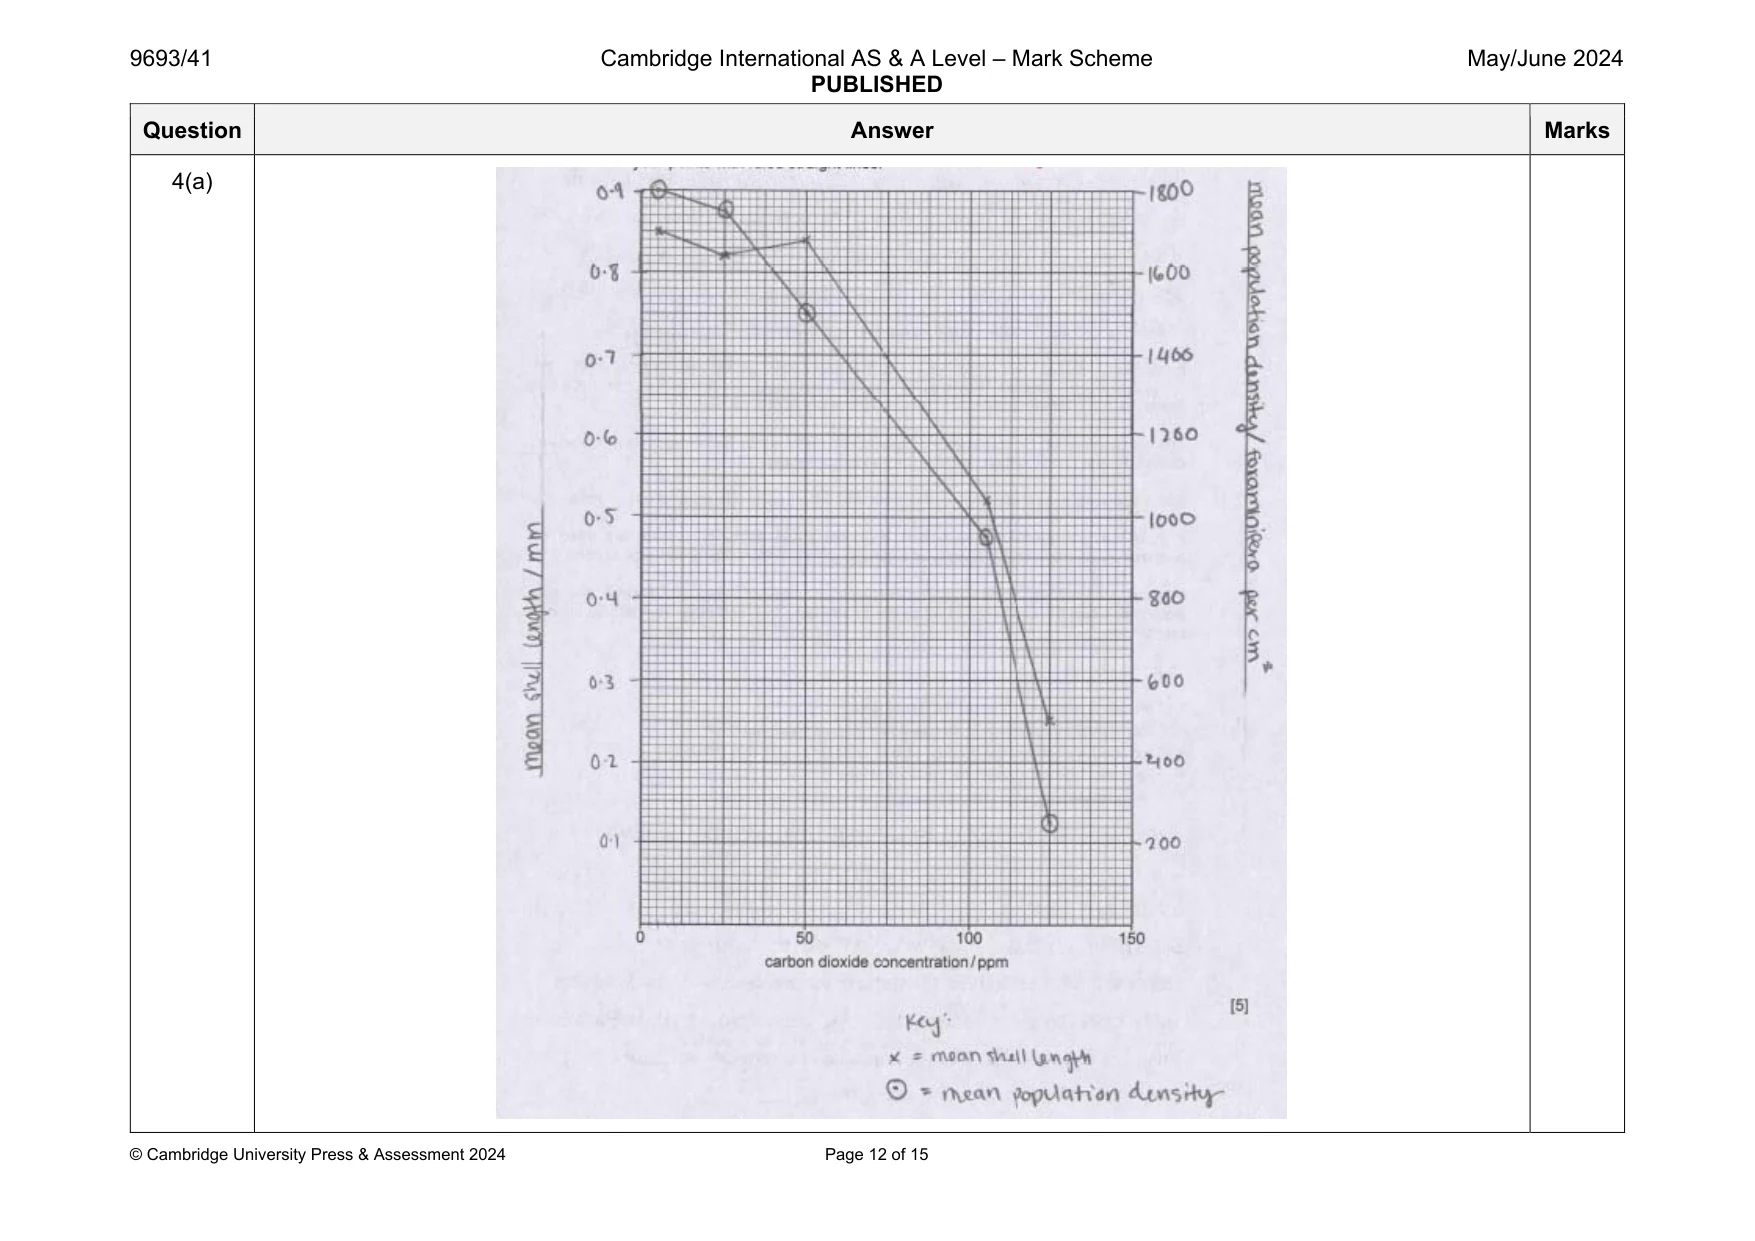
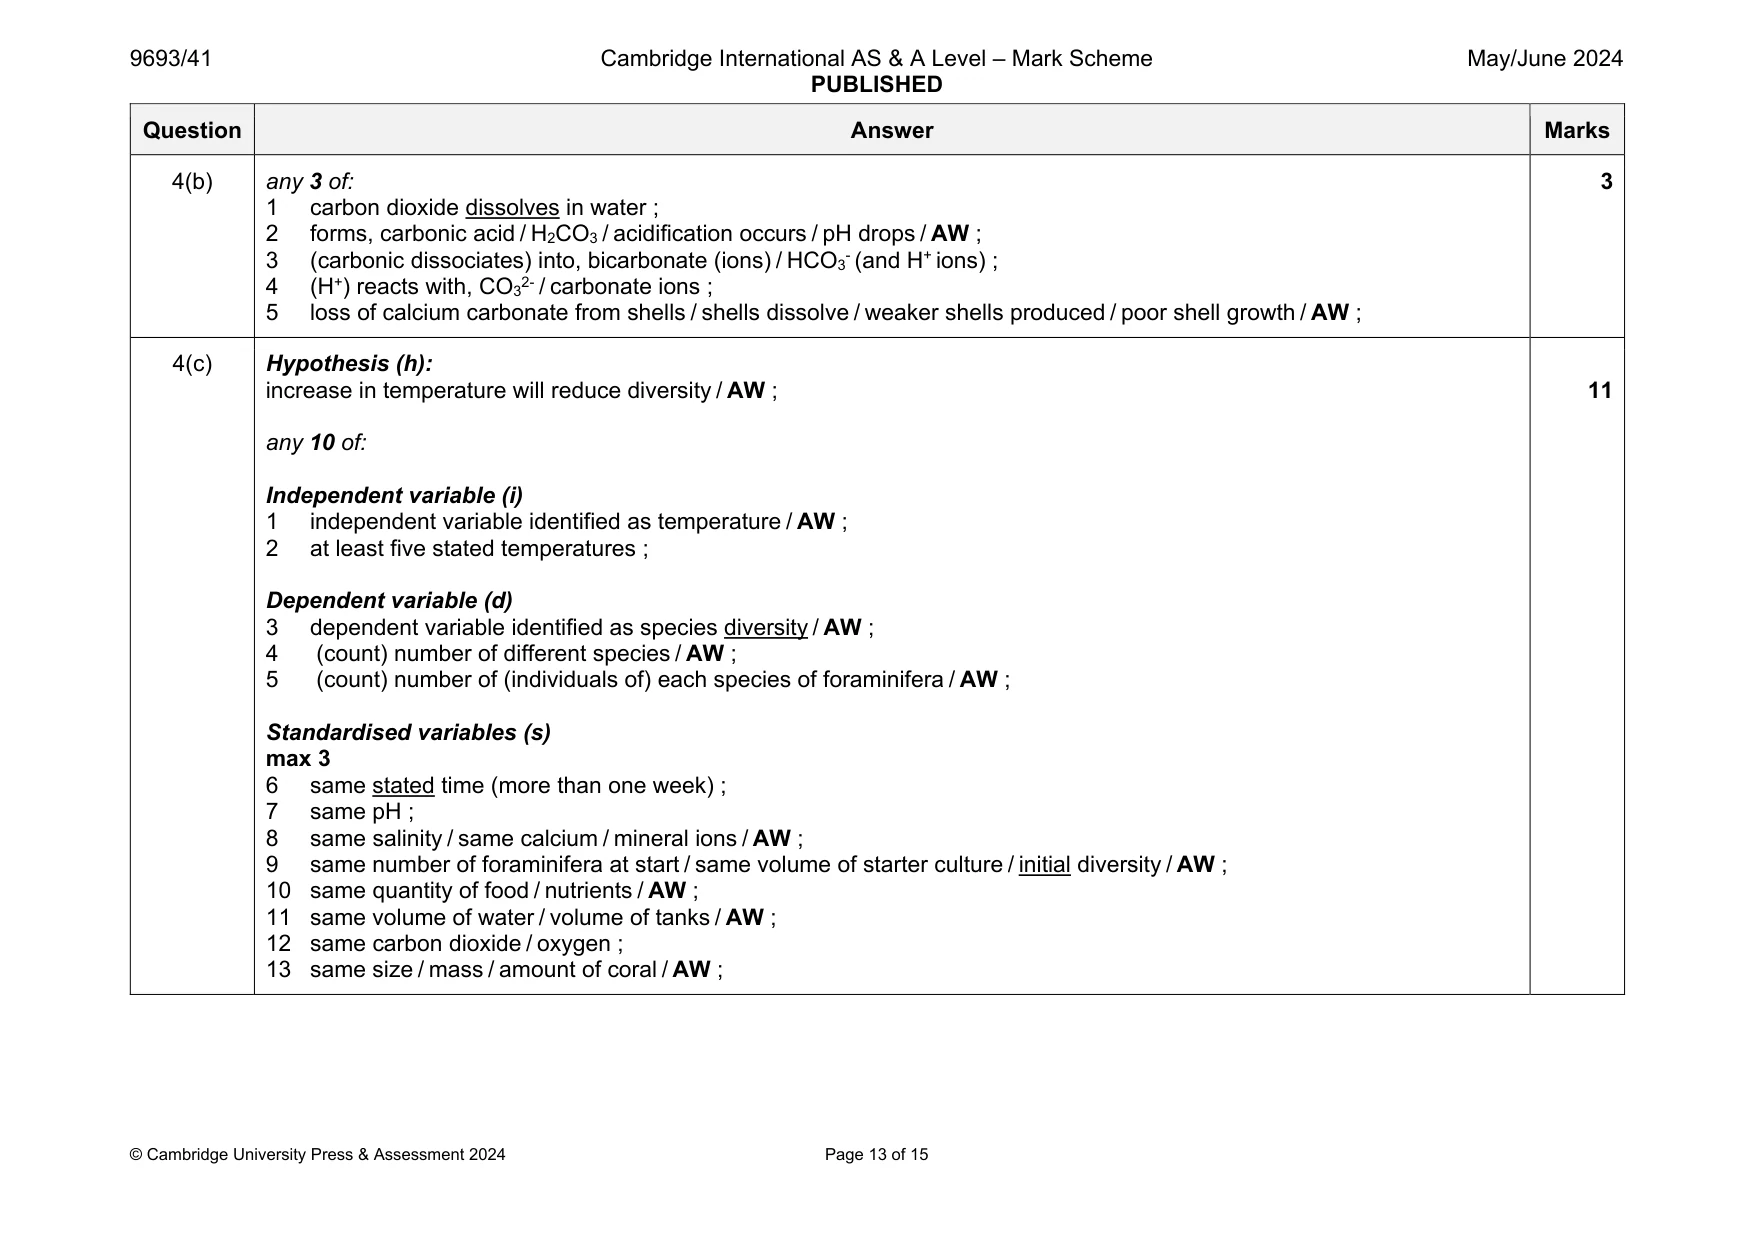
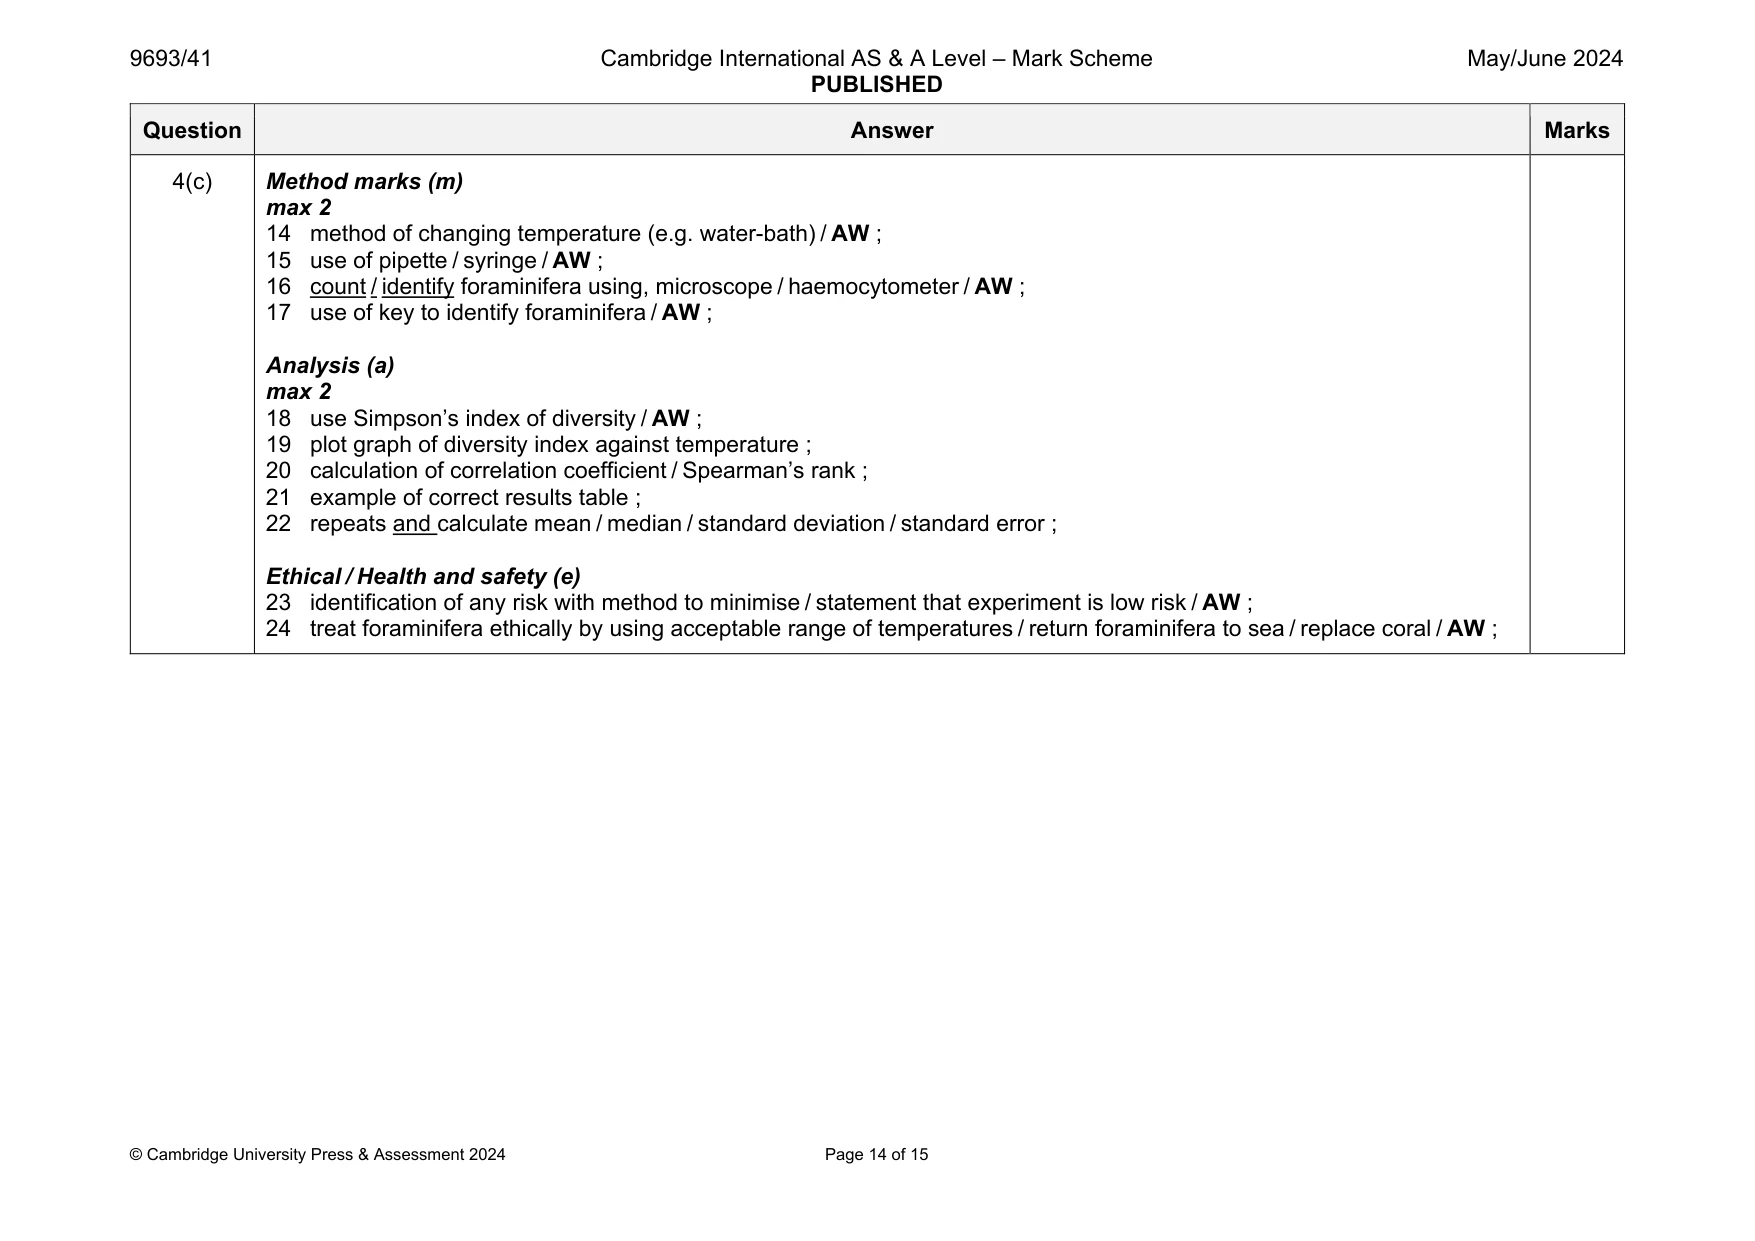
Mark scheme: 4(a) 1 both y axes labelled with units ; 2 two linear y axes with suitable scales so that lines cover at least half grid ; 3 points correctly plotted ; 4 neat lines joining points with no extrapolation ; 5 key for both lines ; 5 Question Answer Marks 4(a) Question Answer Marks 4(b) any 3 of: 1 carbon dioxide dissolves in water ; 2 forms, carbonic acid / H2CO3 / acidification occurs / pH drops / AW ; 3 (carbonic dissociates) into, bicarbonate (ions) / HCO3- (and H+ ions) ; 4 (H+) reacts with, CO32- / carbonate ions ; 5 loss of calcium carbonate from shells / shells dissolve / weaker shells produced / poor shell growth / AW ; 3 4(c) Hypothesis (h): increase in temperature will reduce diversity / AW ; any 10 of: Independent variable (i) 1 independent variable identified as temperature / AW ; 2 at least five stated temperatures ; Dependent variable (d) 3 dependent variable identified as species diversity / AW ; 4 (count) number of different species / AW ; 5 (count) number of (individuals of) each species of foraminifera / AW ; Standardised variables (s) max 3 6 same stated time (more than one week) ; 7 same pH ; 8 same salinity / same calcium / mineral ions / AW ; 9 same number of foraminifera at start / same volume of starter culture / initial diversity / AW ; 10 same quantity of food / nutrients / AW ; 11 same volume of water / volume of tanks / AW ; 12 same carbon dioxide / oxygen ; 13 same size / mass / amount of coral / AW ; 11 Question Answer Marks 4(c) Method marks (m) max 2 14 method of changing temperature (e.g. water-bath) / AW ; 15 use of pipette / syringe / AW ; 16 count / identify foraminifera using, microscope / haemocytometer / AW ; 17 use of key to identify foraminifera / AW ; Analysis (a) max 2 18 use Simpson’s index of diversity / AW ; 19 plot graph of diversity index against temperature ; 20 calculation of correlation coefficient / Spearman’s rank ; 21 example of correct results table ; 22 repeats and calculate mean / median / standard deviation / standard error ; Ethical / Health and safety (e) 23 identification of any risk with method to minimise / statement that experiment is low risk / AW ; 24 treat foraminifera ethically by using acceptable range of temperatures / return foraminifera to sea / replace coral / AW ;
Q5 · Explain why international cooperation and legislation are necessary for the effective…
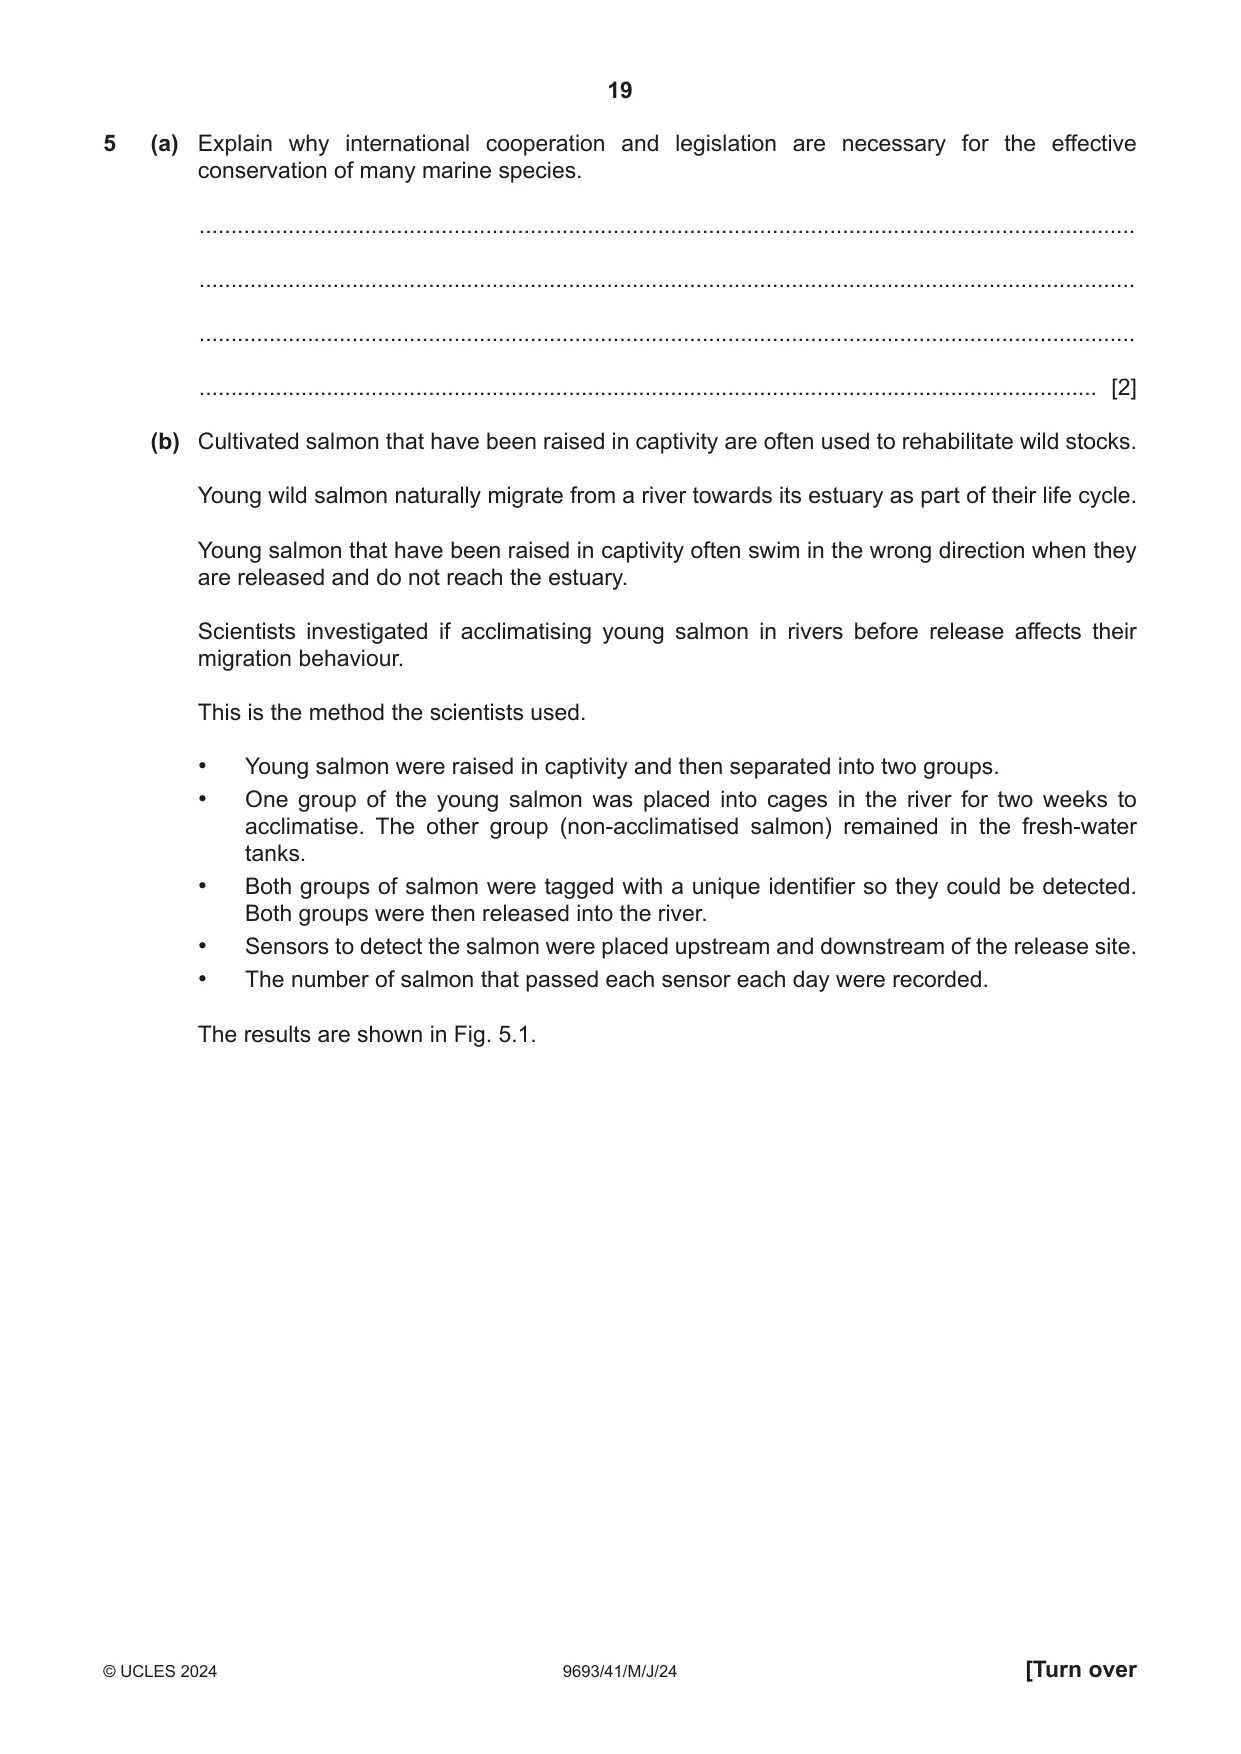
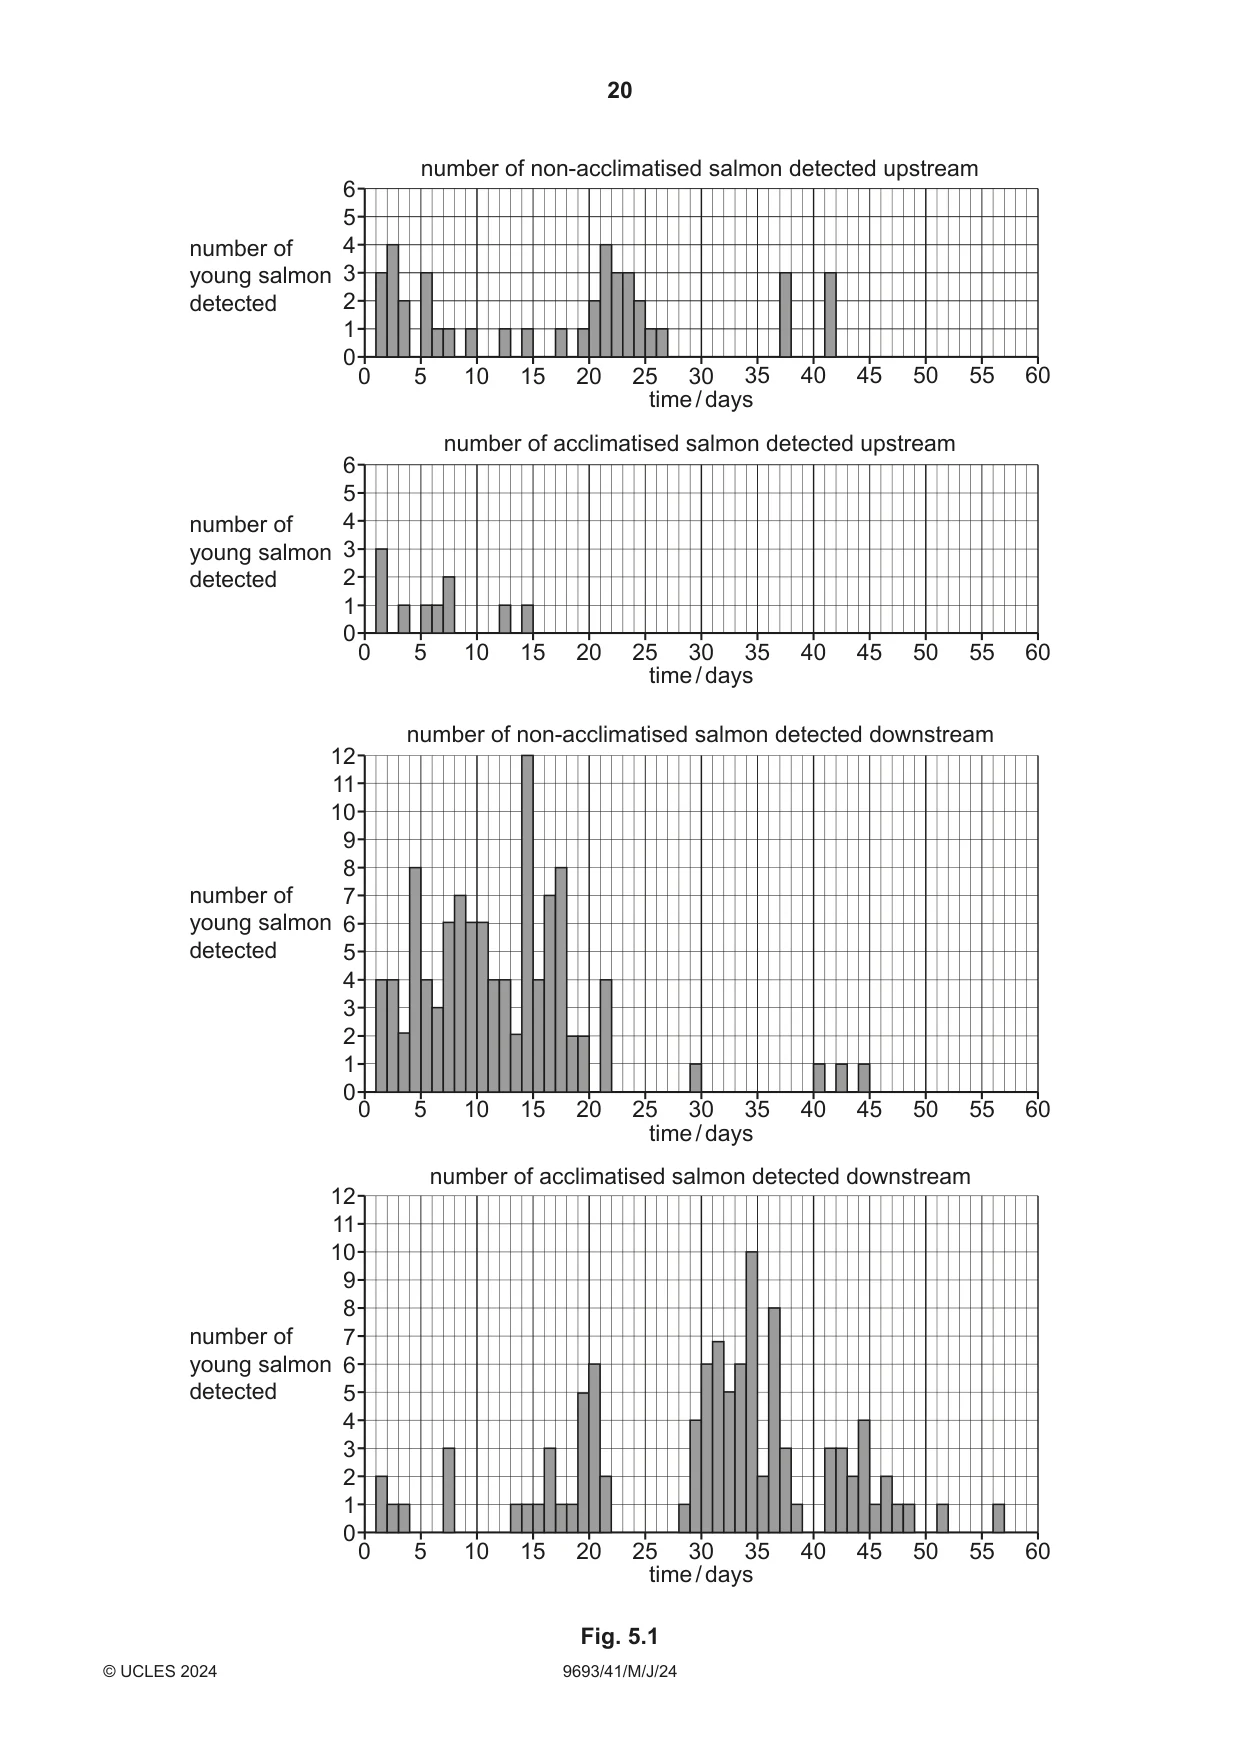
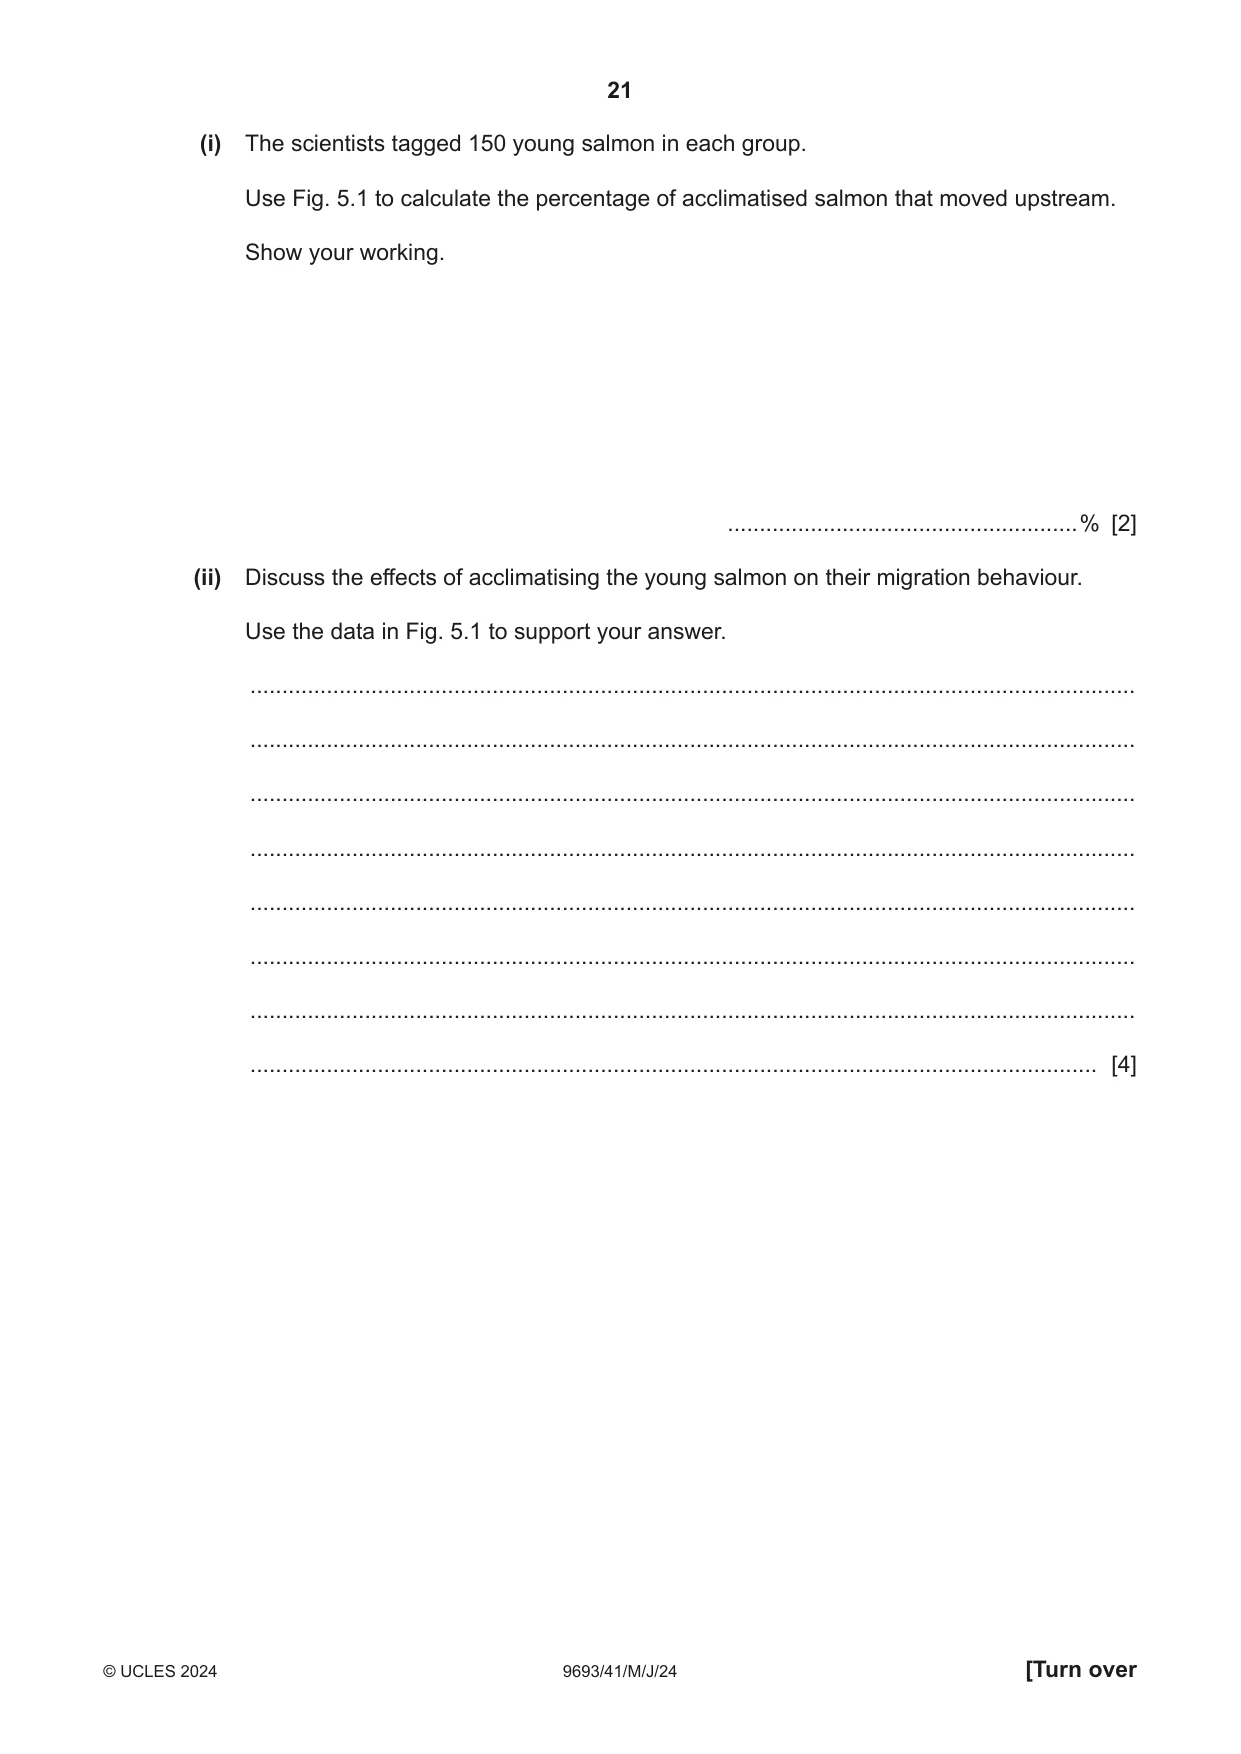
5 (a) Explain why international cooperation and legislation are necessary for the effective conservation of many marine species. ................................................................................................................................................... ................................................................................................................................................... ................................................................................................................................................... ............................................................................................................................................. [2] (b) Cultivated salmon that have been raised in captivity are often used to rehabilitate wild stocks. Young wild salmon naturally migrate from a river towards its estuary as part of their life cycle. Young salmon that have been raised in captivity often swim in the wrong direction when they are released and do not reach the estuary. Scientists investigated if acclimatising young salmon in rivers before release affects their migration behaviour. This is the method the scientists used. • Young salmon were raised in captivity and then separated into two groups. • One group of the young salmon was placed into cages in the river for two weeks to acclimatise. The other group (non-acclimatised salmon) remained in the fresh-water tanks. • Both groups of salmon were tagged with a unique identifier so they could be detected. Both groups were then released into the river. • Sensors to detect the salmon were placed upstream and downstream of the release site. • The number of salmon that passed each sensor each day were recorded. The results are shown in Fig. 5.1. number of non-acclimatised salmon detected upstream 6 5 number of 4 young salmon 3 detected 2 1 0 0 5 10 15 20 25 30 35 40 45 50 55 60 time / days number of acclimatised salmon detected upstream 6 5 number of 4 young salmon 3 detected 2 1 0 0 5 10 15 20 25 30 35 40 45 50 55 60 time / days number of non-acclimatised salmon detected downstream 12 11 10 9 8 number of 7 young salmon 6 detected 5 4 3 2 1 0 0 5 10 15 20 25 30 35 40 45 50 55 60 time / days number of acclimatised salmon detected downstream 12 11 10 9 8 number of 7 young salmon 6 detected 5 4 3 2 1 0 0 5 10 15 20 25 30 35 40 45 50 55 60 time / days Fig. 5.1 (i) The scientists tagged 150 young salmon in each group. Use Fig. 5.1 to calculate the percentage of acclimatised salmon that moved upstream. Show your working. .......................................................% [2] (ii) Discuss the effects of acclimatising the young salmon on their migration behaviour. Use the data in Fig. 5.1 to support your answer. ........................................................................................................................................... ........................................................................................................................................... ........................................................................................................................................... ........................................................................................................................................... ........................................................................................................................................... ........................................................................................................................................... ........................................................................................................................................... ..................................................................................................................................... [4]
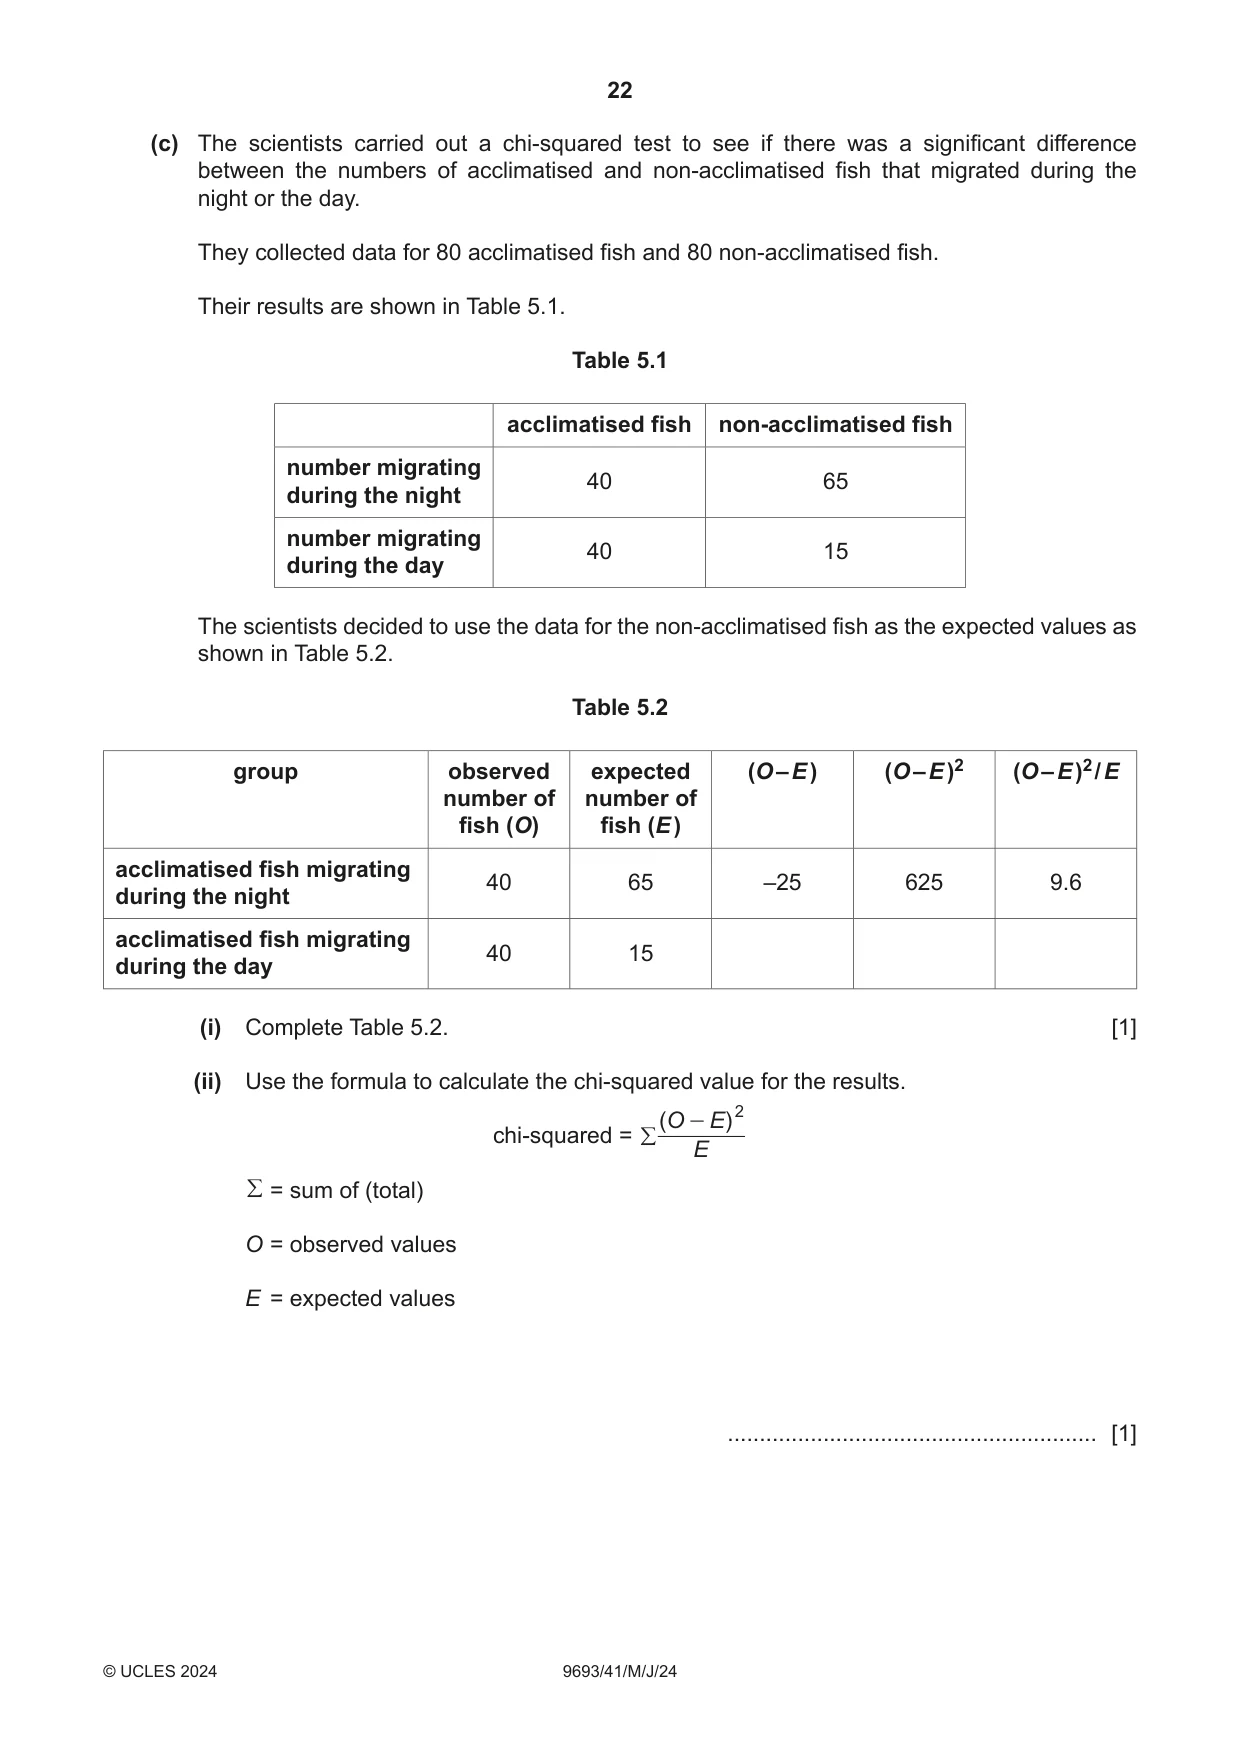
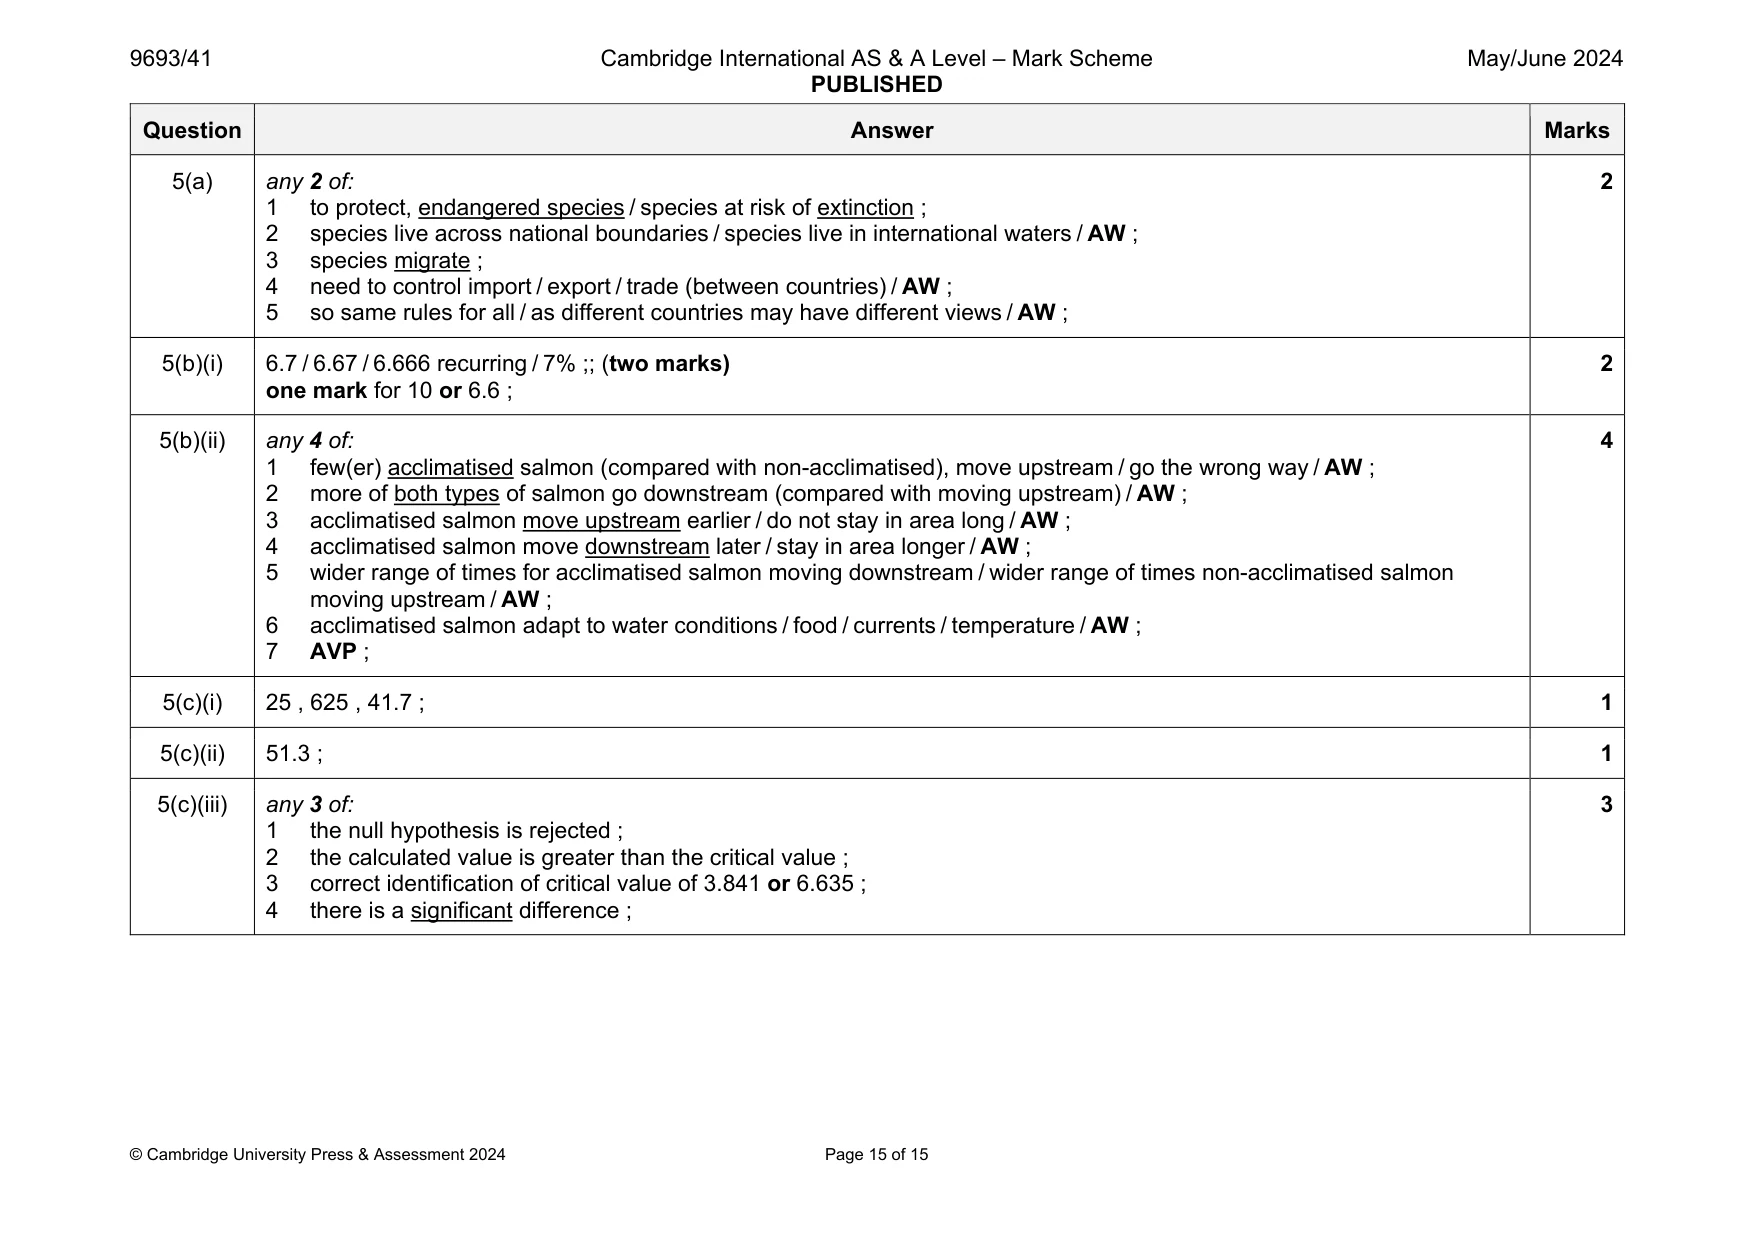
Mark scheme: 5(a) any 2 of: 1 to protect, endangered species / species at risk of extinction ; 2 species live across national boundaries / species live in international waters / AW ; 3 species migrate ; 4 need to control import / export / trade (between countries) / AW ; 5 so same rules for all / as different countries may have different views / AW ; 2 5(b)(i) 6.7 / 6.67 / 6.666 recurring / 7% ;; (two marks) one mark for 10 or 6.6 ; 2 5(b)(ii) any 4 of: 1 few(er) acclimatised salmon (compared with non-acclimatised), move upstream / go the wrong way / AW ; 2 more of both types of salmon go downstream (compared with moving upstream) / AW ; 3 acclimatised salmon move upstream earlier / do not stay in area long / AW ; 4 acclimatised salmon move downstream later / stay in area longer / AW ; 5 wider range of times for acclimatised salmon moving downstream / wider range of times non-acclimatised salmon moving upstream / AW ; 6 acclimatised salmon adapt to water conditions / food / currents / temperature / AW ; 7 AVP ; 4 5(c)(i) 25 , 625 , 41.7 ; 1 5(c)(ii) 51.3 ; 1 5(c)(iii) any 3 of: 1 the null hypothesis is rejected ; 2 the calculated value is greater than the critical value ; 3 correct identification of critical value of 3.841 or 6.635 ; 4 there is a significant difference ; 3
What was in this paper
The subtopics covered by these 5 questions, and how many questions each got. Open one in a new tab to see every Cambridge question on it.
What you needed in this session
Cambridge’s own grade thresholds for 2024 May/June, Paper 4 · Variant 1. A higher threshold means an easier paper — the bar moves with how the cohort did.