Cambridge A Level Marine Science 9693 — 2022 May/June Paper 4 · Variant 1
9693/41/M/J/22 · 6 questions · 75 marks · ≈84 min
The question paper and its mark scheme, free to read here and free to download. This is Cambridge’s own paper, exactly as it was sat.
Question paper24 pages




Mark scheme16 pages
Answers below. Sit the paper first if you are practising.
Questions as text
Q1 · Pollution by plastics and microplastics is affecting many marine ecosystems
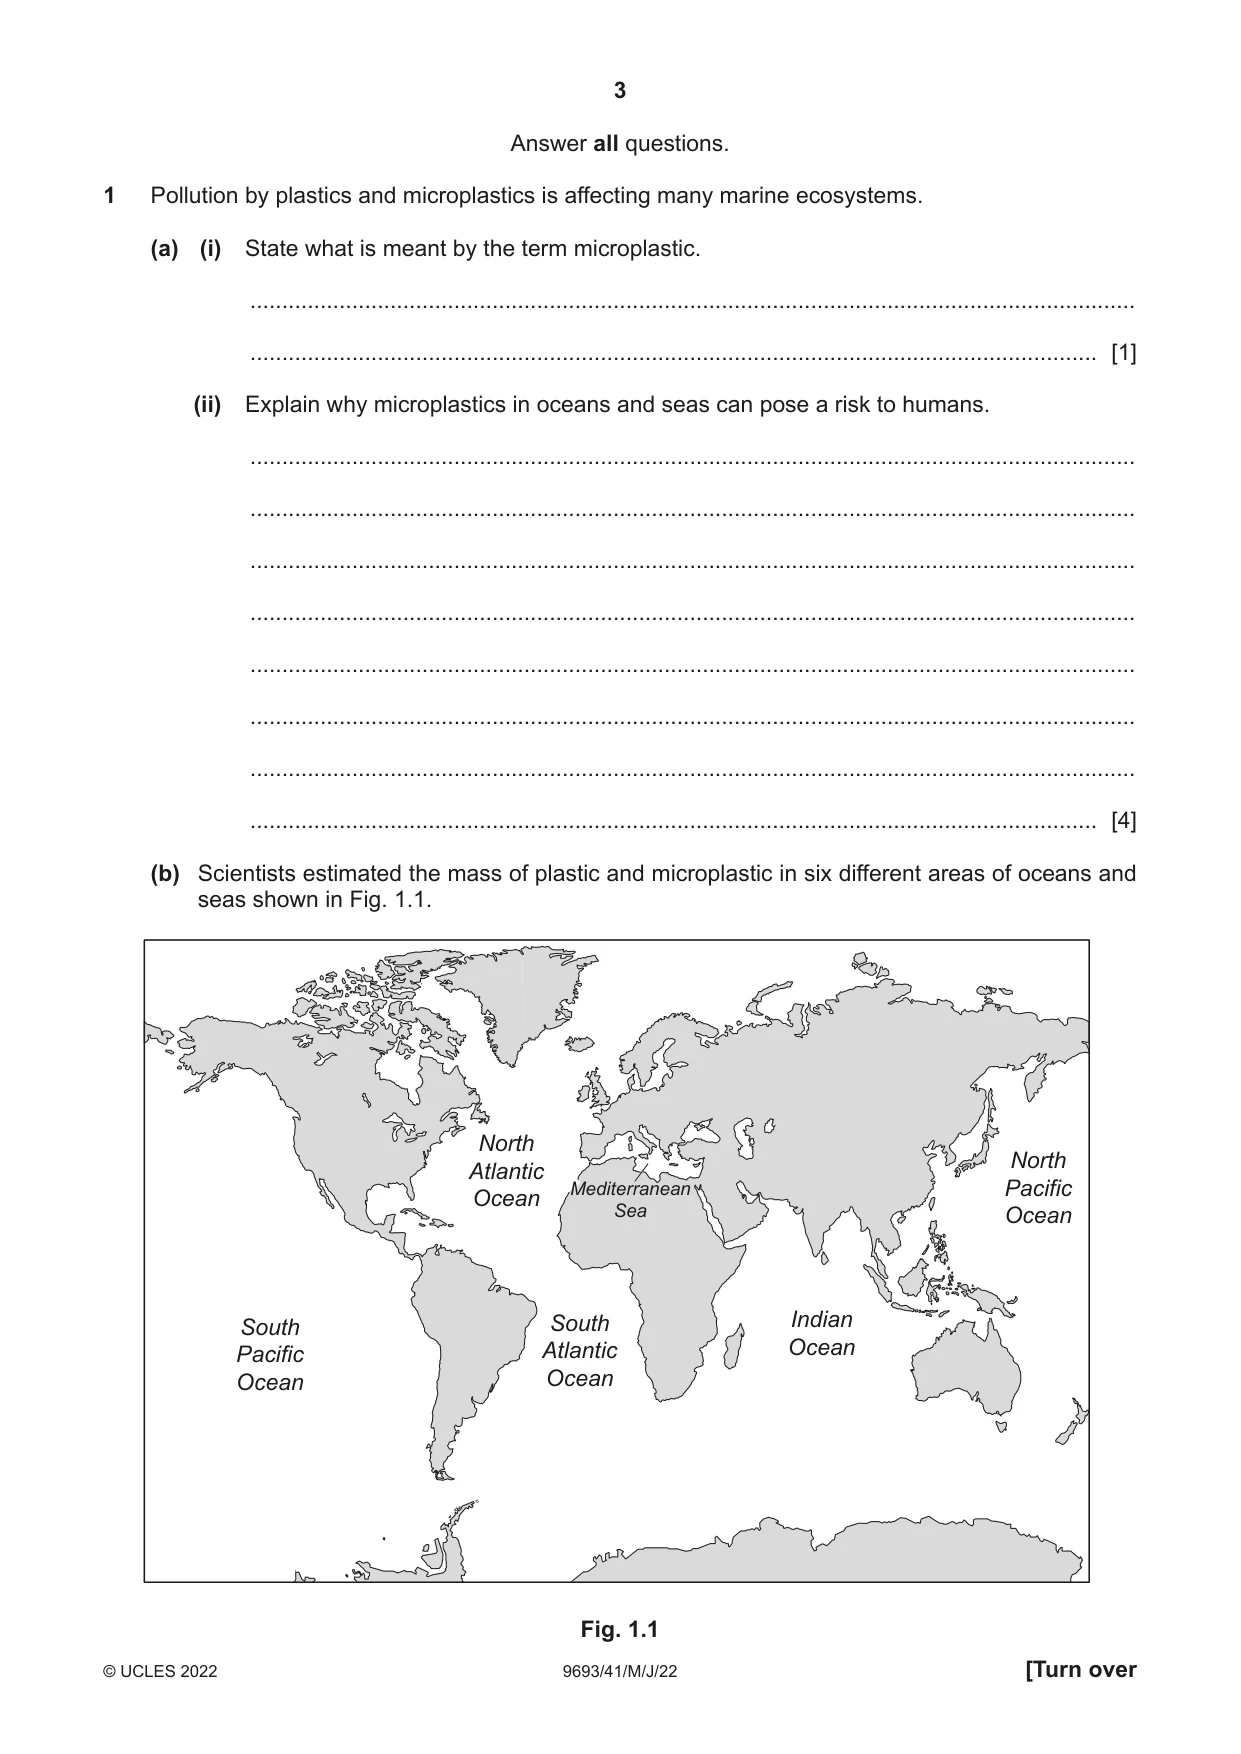
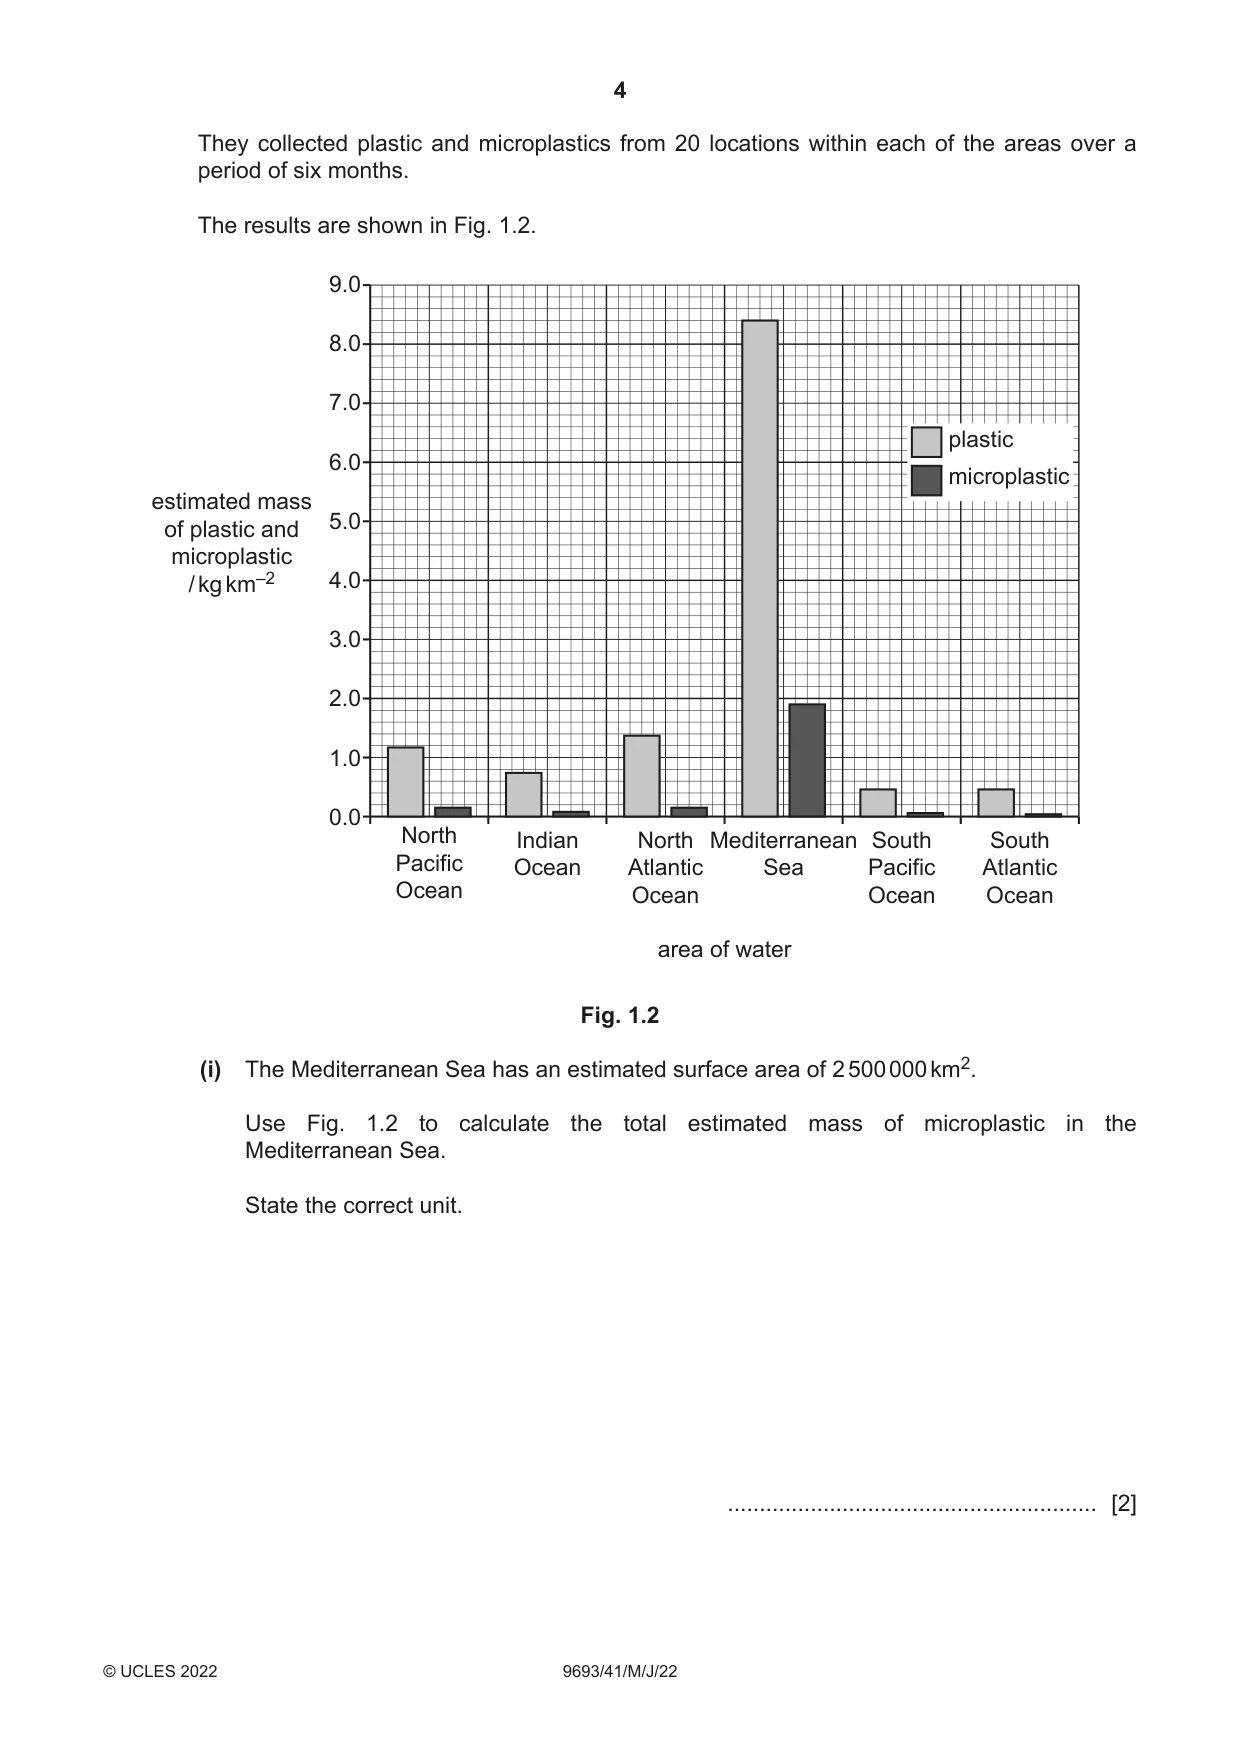
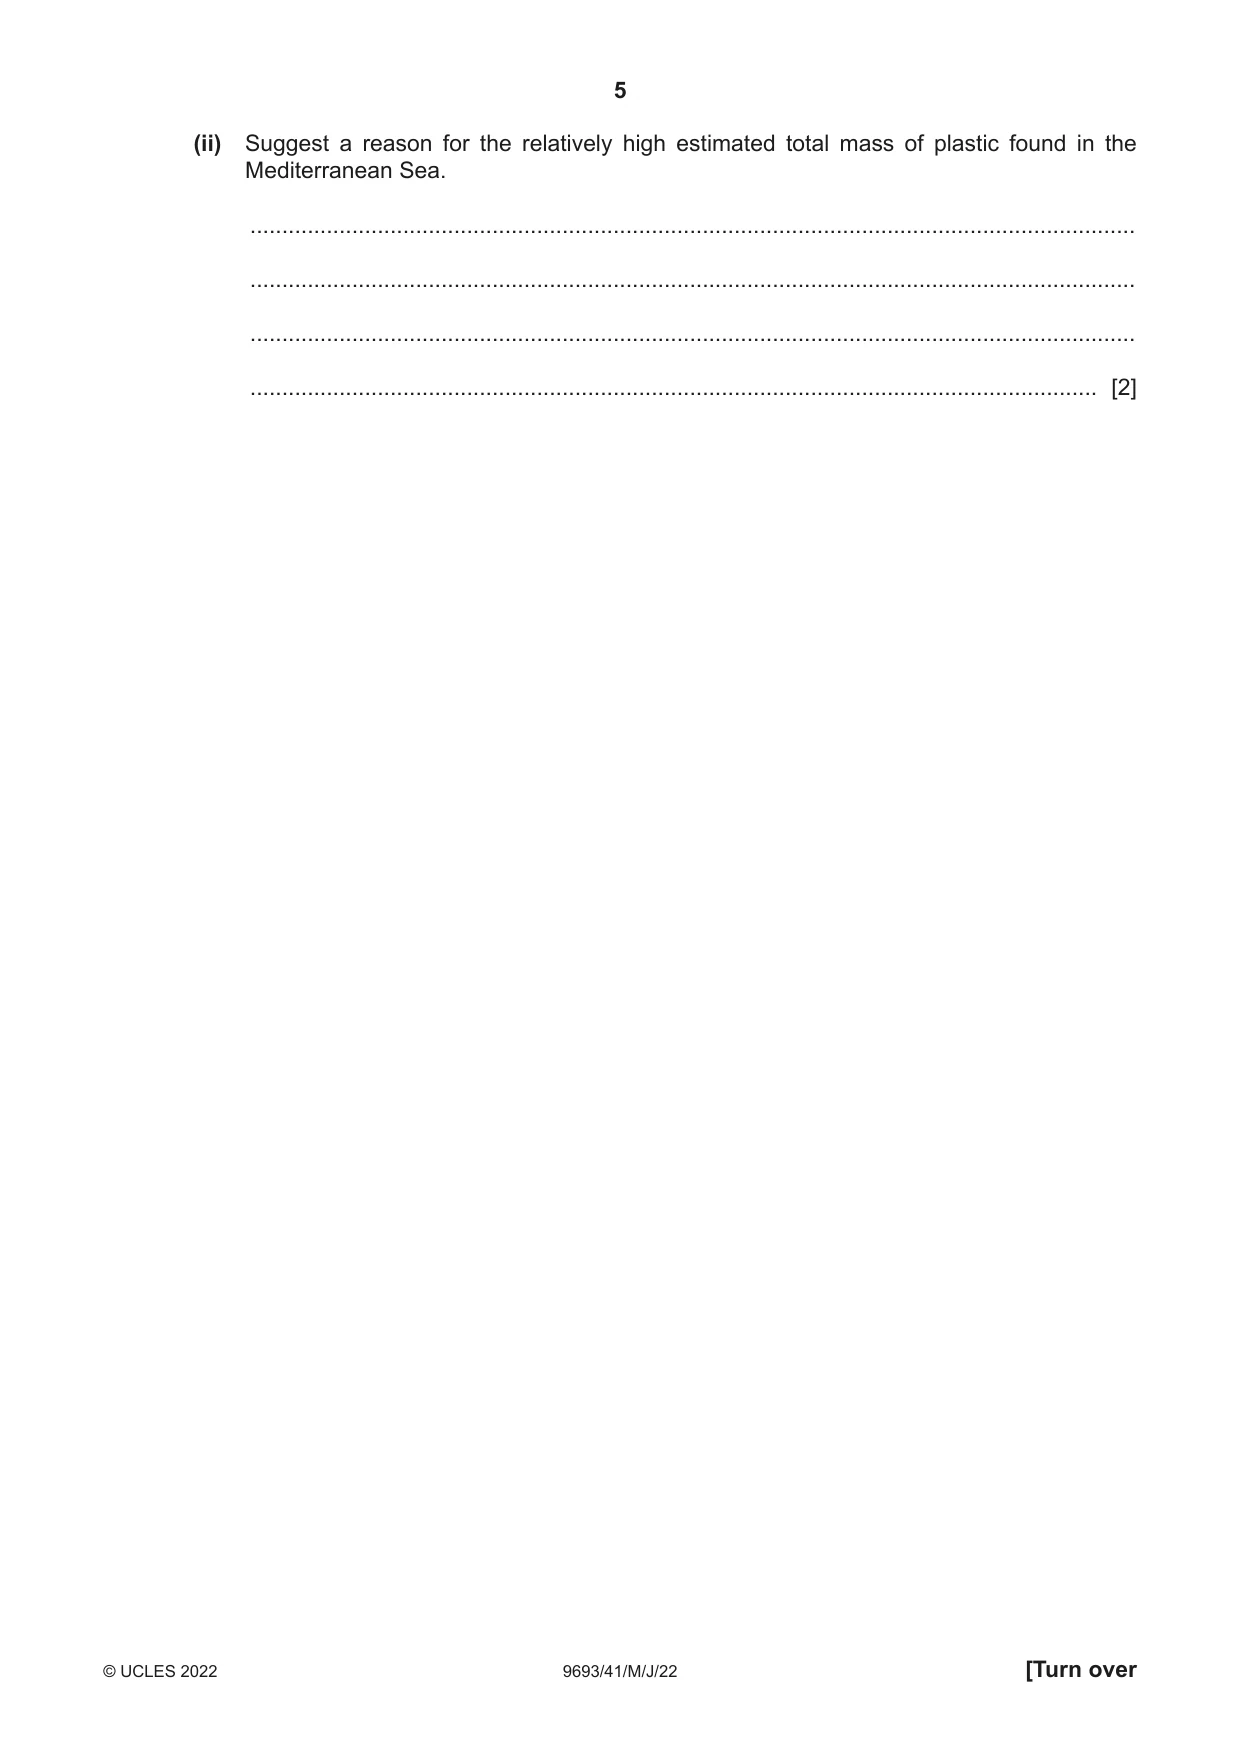
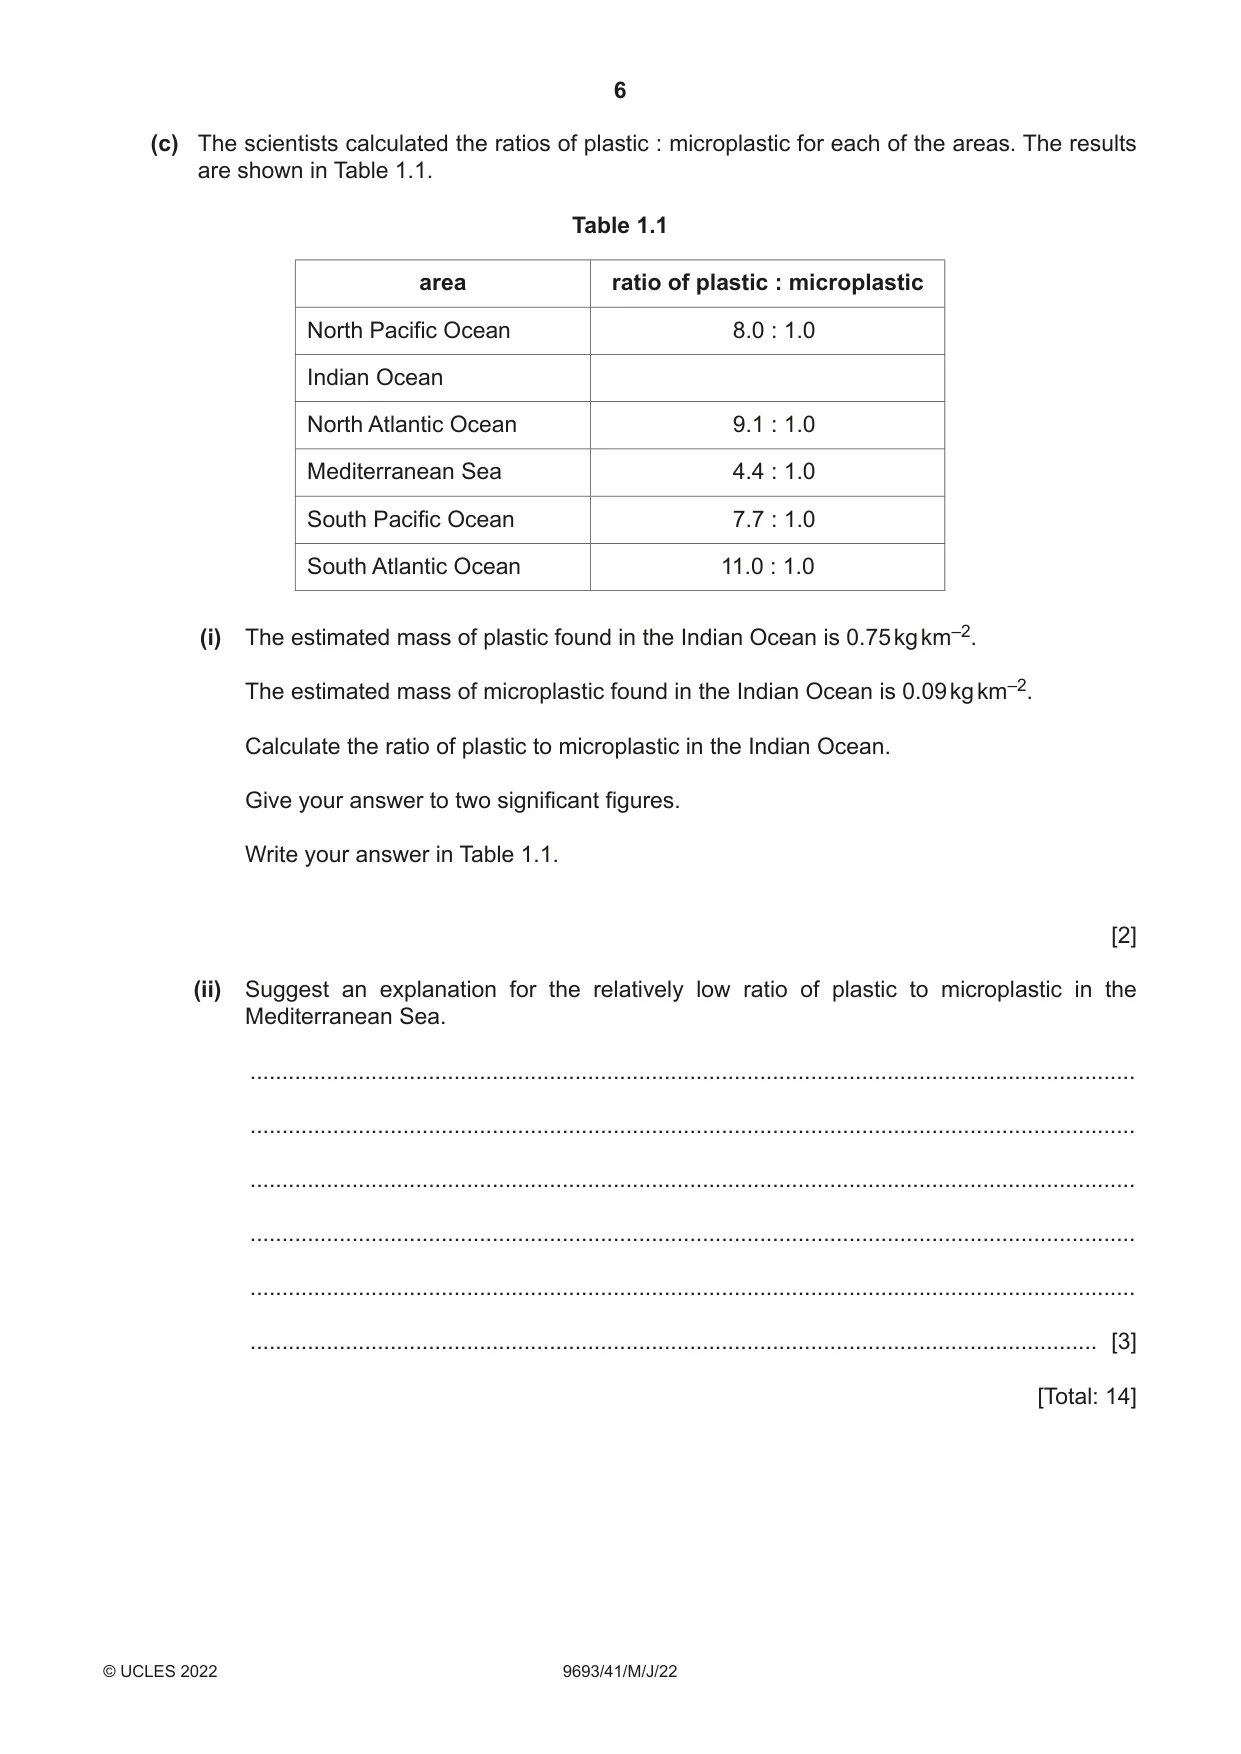
1 Pollution by plastics and microplastics is affecting many marine ecosystems. (a) (i) State what is meant by the term microplastic. ........................................................................................................................................... ..................................................................................................................................... [1] (ii) Explain why microplastics in oceans and seas can pose a risk to humans. ........................................................................................................................................... ........................................................................................................................................... ........................................................................................................................................... ........................................................................................................................................... ........................................................................................................................................... ........................................................................................................................................... ........................................................................................................................................... ..................................................................................................................................... [4] (b) Scientists estimated the mass of plastic and microplastic in six different areas of oceans and seas shown in Fig. 1.1. North North Atlantic Mediterranean Pacific Ocean Sea Ocean South South Indian Pacific Atlantic Ocean Ocean Ocean Fig. 1.1 They collected plastic and microplastics from 20 locations within each of the areas over a period of six months. The results are shown in Fig. 1.2. 9.0 8.0 7.0 plastic 6.0 microplastic estimated mass 5.0 of plastic and microplastic / kg km–2 4.0 3.0 2.0 1.0 0.0 North Indian North Mediterranean South South Pacific Ocean Atlantic Sea Pacific Atlantic Ocean Ocean Ocean Ocean area of water Fig. 1.2 (i) The Mediterranean Sea has an estimated surface area of 2 500 000 km2. Use Fig. 1.2 to calculate the total estimated mass of microplastic in the Mediterranean Sea. State the correct unit. .......................................................... [2] (ii) Suggest a reason for the relatively high estimated total mass of plastic found in the Mediterranean Sea. ........................................................................................................................................... ........................................................................................................................................... ........................................................................................................................................... ..................................................................................................................................... [2] (c) The scientists calculated the ratios of plastic : microplastic for each of the areas. The results are shown in Table 1.1. Table 1.1 area ratio of plastic : microplastic North Pacific Ocean 8.0 : 1.0 Indian Ocean North Atlantic Ocean 9.1 : 1.0 Mediterranean Sea 4.4 : 1.0 South Pacific Ocean 7.7 : 1.0 South Atlantic Ocean 11.0 : 1.0 (i) The estimated mass of plastic found in the Indian Ocean is 0.75 kg km–2. The estimated mass of microplastic found in the Indian Ocean is 0.09 kg km–2. Calculate the ratio of plastic to microplastic in the Indian Ocean. Give your answer to two significant figures. Write your answer in Table 1.1. [2] (ii) Suggest an explanation for the relatively low ratio of plastic to microplastic in the Mediterranean Sea. ........................................................................................................................................... ........................................................................................................................................... ........................................................................................................................................... ........................................................................................................................................... ........................................................................................................................................... ..................................................................................................................................... [3] [Total: 14]
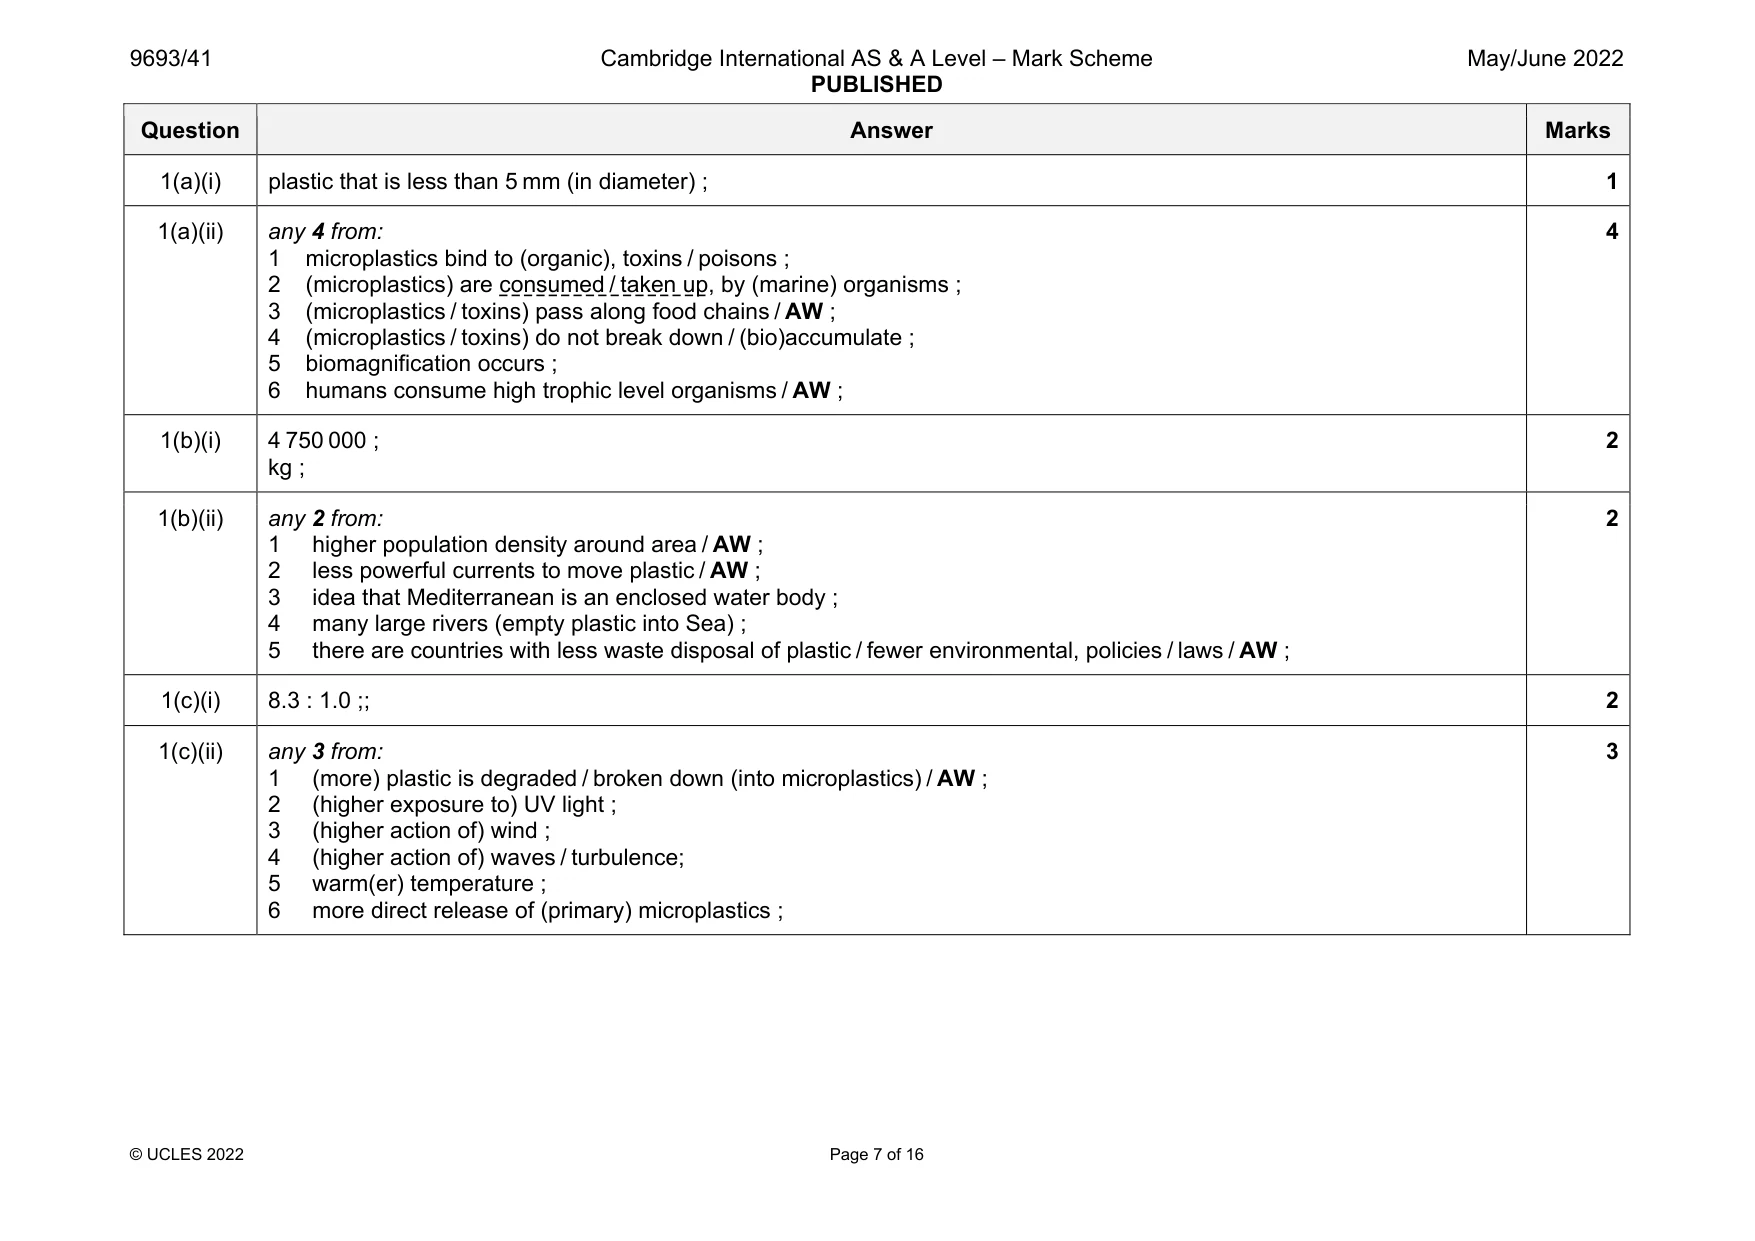
Mark scheme: 1(a)(i) plastic that is less than 5 mm (in diameter) ; 1 1(a)(ii) any 4 from: 1 microplastics bind to (organic), toxins / poisons ; 2 (microplastics) are consumed / taken up, by (marine) organisms ; 3 (microplastics / toxins) pass along food chains / AW ; 4 (microplastics / toxins) do not break down / (bio)accumulate ; 5 biomagnification occurs ; 6 humans consume high trophic level organisms / AW ; 4 1(b)(i) 4 750 000 ; kg ; 2 1(b)(ii) any 2 from: 1 higher population density around area / AW ; 2 less powerful currents to move plastic / AW ; 3 idea that Mediterranean is an enclosed water body ; 4 many large rivers (empty plastic into Sea) ; 5 there are countries with less waste disposal of plastic / fewer environmental, policies / laws / AW ; 2 1(c)(i) 8.3 : 1.0 ;; 2 1(c)(ii) any 3 from: 1 (more) plastic is degraded / broken down (into microplastics) / AW ; 2 (higher exposure to) UV light ; 3 (higher action of) wind ; 4 (higher action of) waves / turbulence; 5 warm(er) temperature ; 6 more direct release of (primary) microplastics ; 3
Q2 · In Norway, some electricity is generated by using osmotic power stations
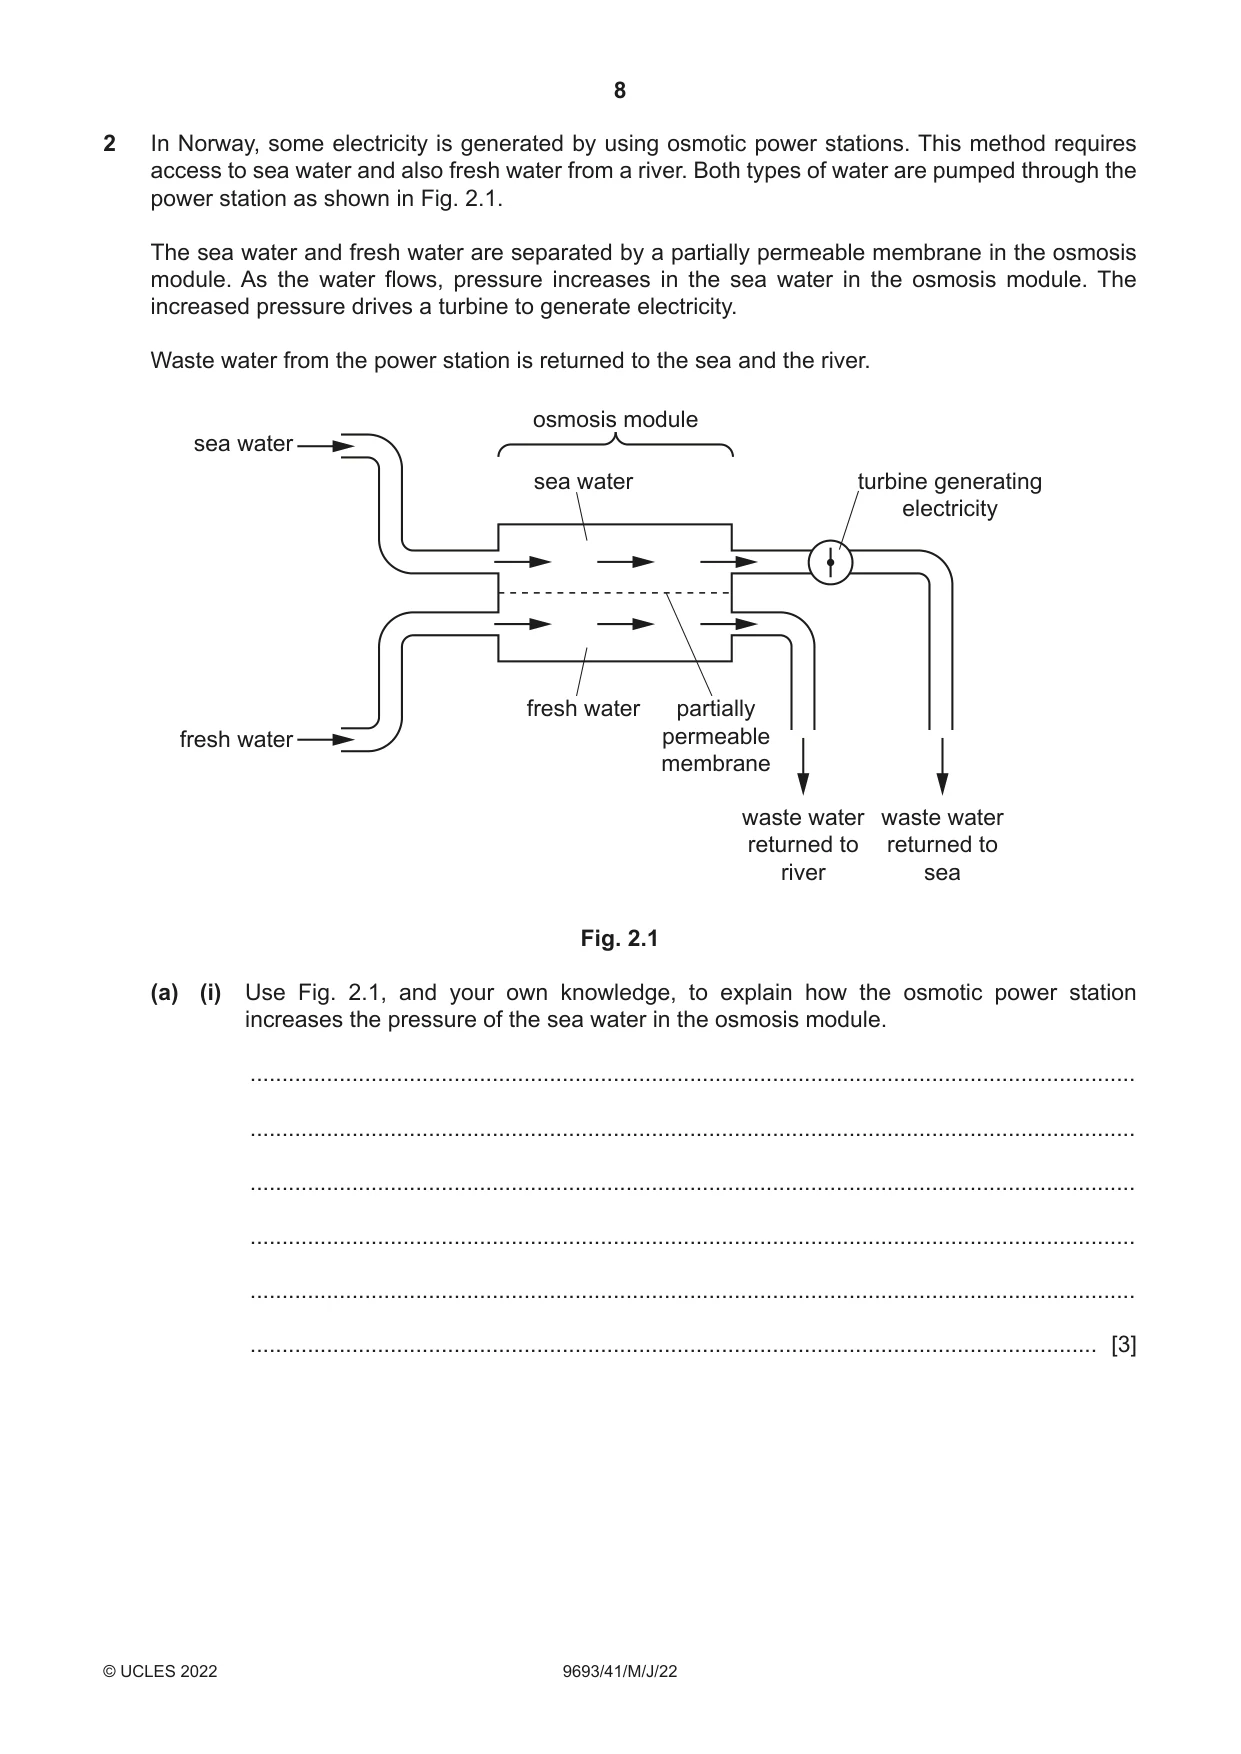
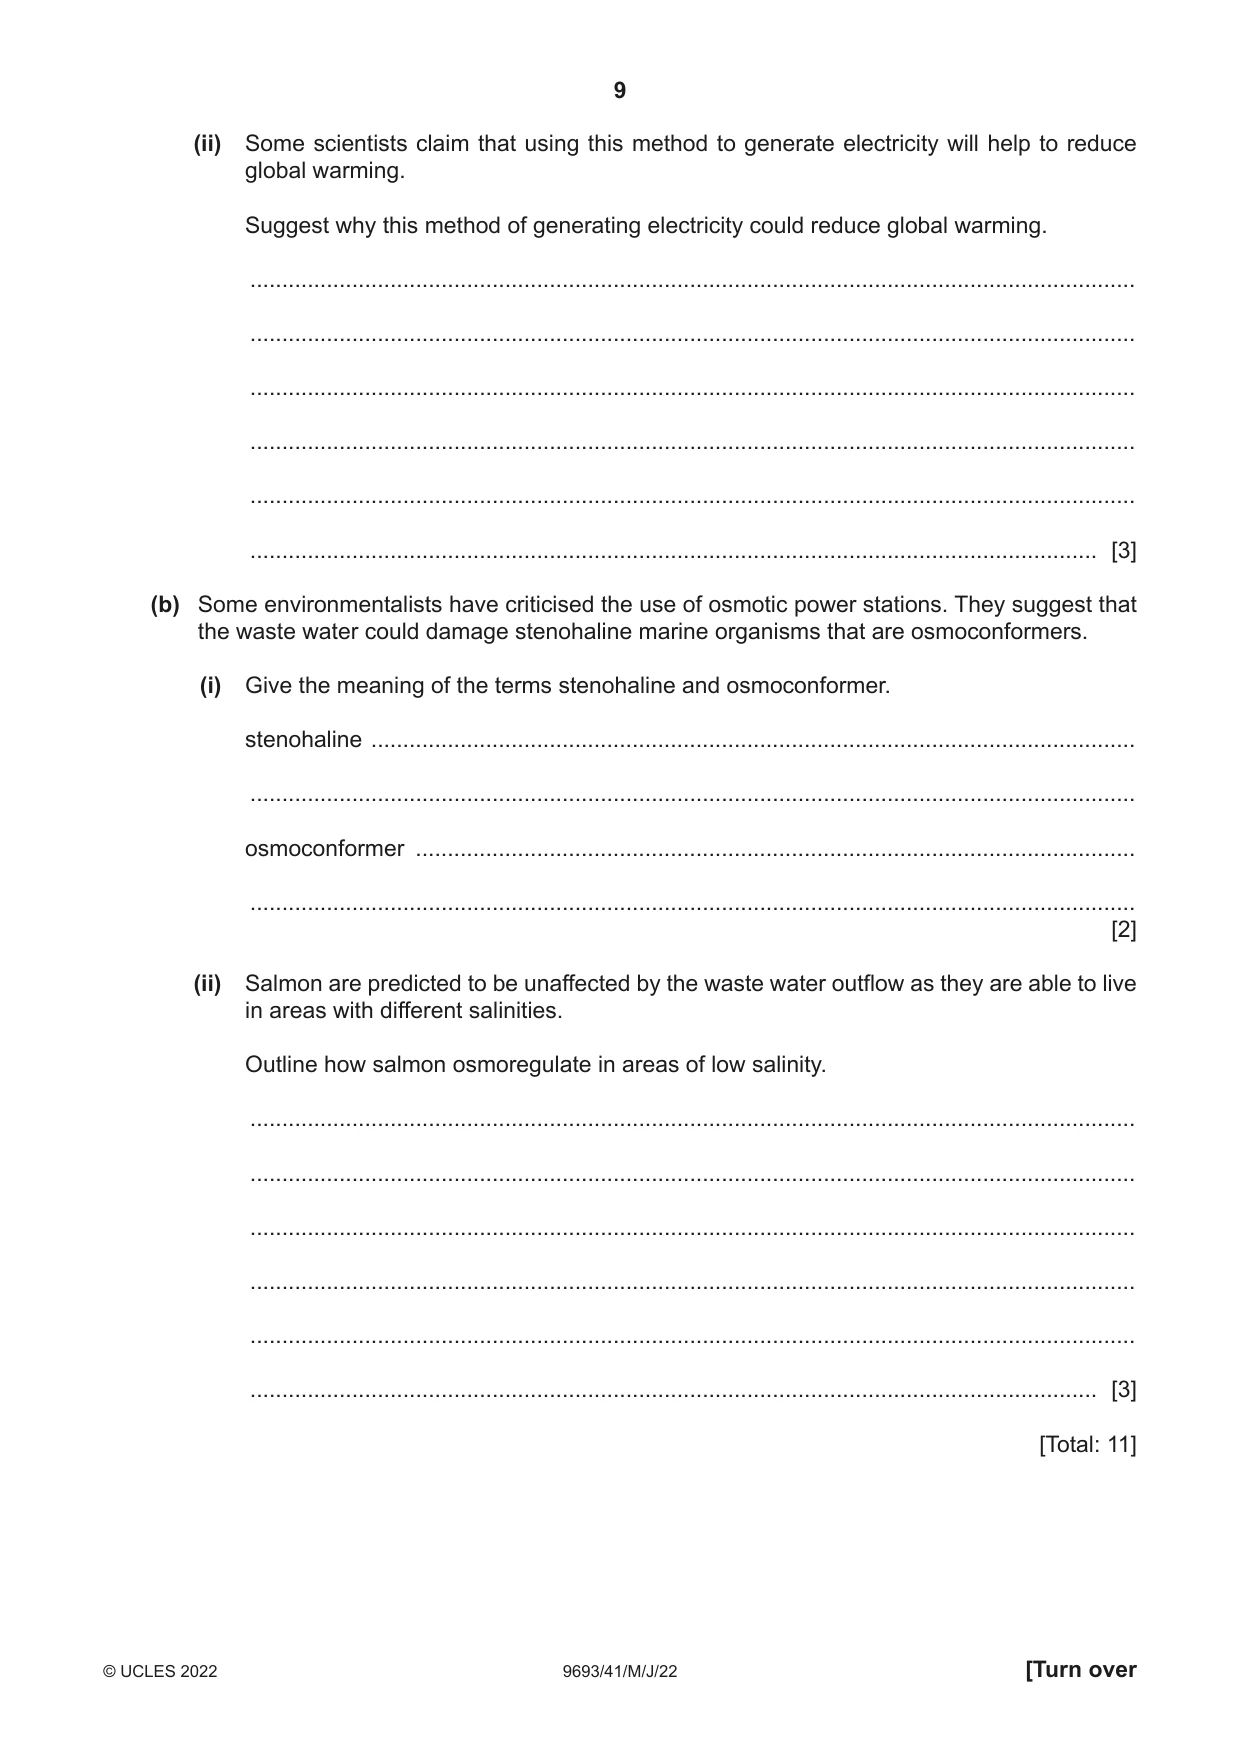
2 In Norway, some electricity is generated by using osmotic power stations. This method requires access to sea water and also fresh water from a river. Both types of water are pumped through the power station as shown in Fig. 2.1. The sea water and fresh water are separated by a partially permeable membrane in the osmosis module. As the water flows, pressure increases in the sea water in the osmosis module. The increased pressure drives a turbine to generate electricity. Waste water from the power station is returned to the sea and the river. osmosis module sea water sea water turbine generating electricity fresh water partially fresh water permeable membrane waste water waste water returned to returned to river sea Fig. 2.1 (a) (i) Use Fig. 2.1, and your own knowledge, to explain how the osmotic power station increases the pressure of the sea water in the osmosis module. ........................................................................................................................................... ........................................................................................................................................... ........................................................................................................................................... ........................................................................................................................................... ........................................................................................................................................... ..................................................................................................................................... [3] (ii) Some scientists claim that using this method to generate electricity will help to reduce global warming. Suggest why this method of generating electricity could reduce global warming. ........................................................................................................................................... ........................................................................................................................................... ........................................................................................................................................... ........................................................................................................................................... ........................................................................................................................................... ..................................................................................................................................... [3] (b) Some environmentalists have criticised the use of osmotic power stations. They suggest that the waste water could damage stenohaline marine organisms that are osmoconformers. (i) Give the meaning of the terms stenohaline and osmoconformer. stenohaline ........................................................................................................................ ........................................................................................................................................... osmoconformer ................................................................................................................. ........................................................................................................................................... [2] (ii) Salmon are predicted to be unaffected by the waste water outflow as they are able to live in areas with different salinities. Outline how salmon osmoregulate in areas of low salinity. ........................................................................................................................................... ........................................................................................................................................... ........................................................................................................................................... ........................................................................................................................................... ........................................................................................................................................... ..................................................................................................................................... [3] [Total: 11]
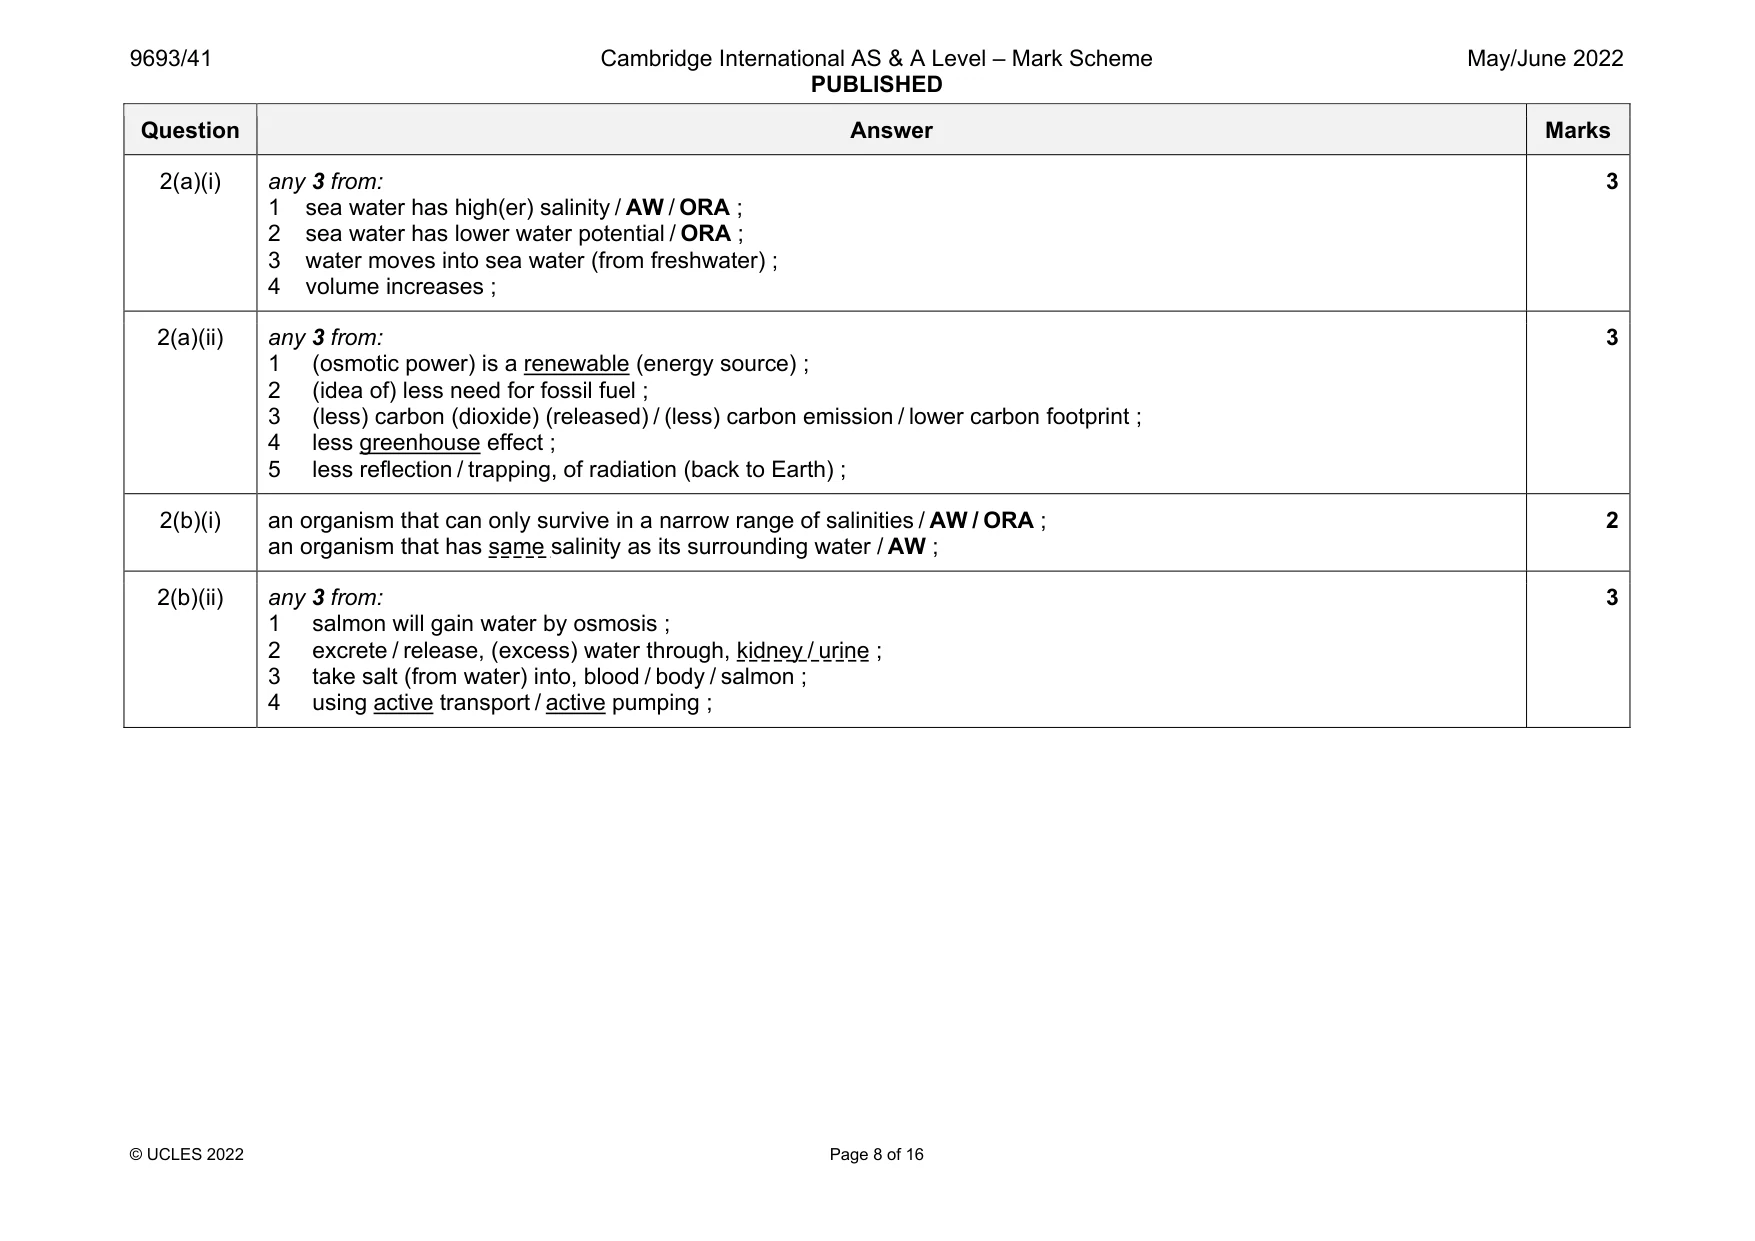
Mark scheme: 2(a)(i) any 3 from: 1 sea water has high(er) salinity / AW / ORA ; 2 sea water has lower water potential / ORA ; 3 water moves into sea water (from freshwater) ; 4 volume increases ; 3 2(a)(ii) any 3 from: 1 (osmotic power) is a renewable (energy source) ; 2 (idea of) less need for fossil fuel ; 3 (less) carbon (dioxide) (released) / (less) carbon emission / lower carbon footprint ; 4 less greenhouse effect ; 5 less reflection / trapping, of radiation (back to Earth) ; 3 2(b)(i) an organism that can only survive in a narrow range of salinities / AW / ORA ; an organism that has same salinity as its surrounding water / AW ; 2 2(b)(ii) any 3 from: 1 salmon will gain water by osmosis ; 2 excrete / release, (excess) water through, kidney / urine ; 3 take salt (from water) into, blood / body / salmon ; 4 using active transport / active pumping ; 3
Q3 · Describe and explain the ecological relationship between Endoriftia and Riftia
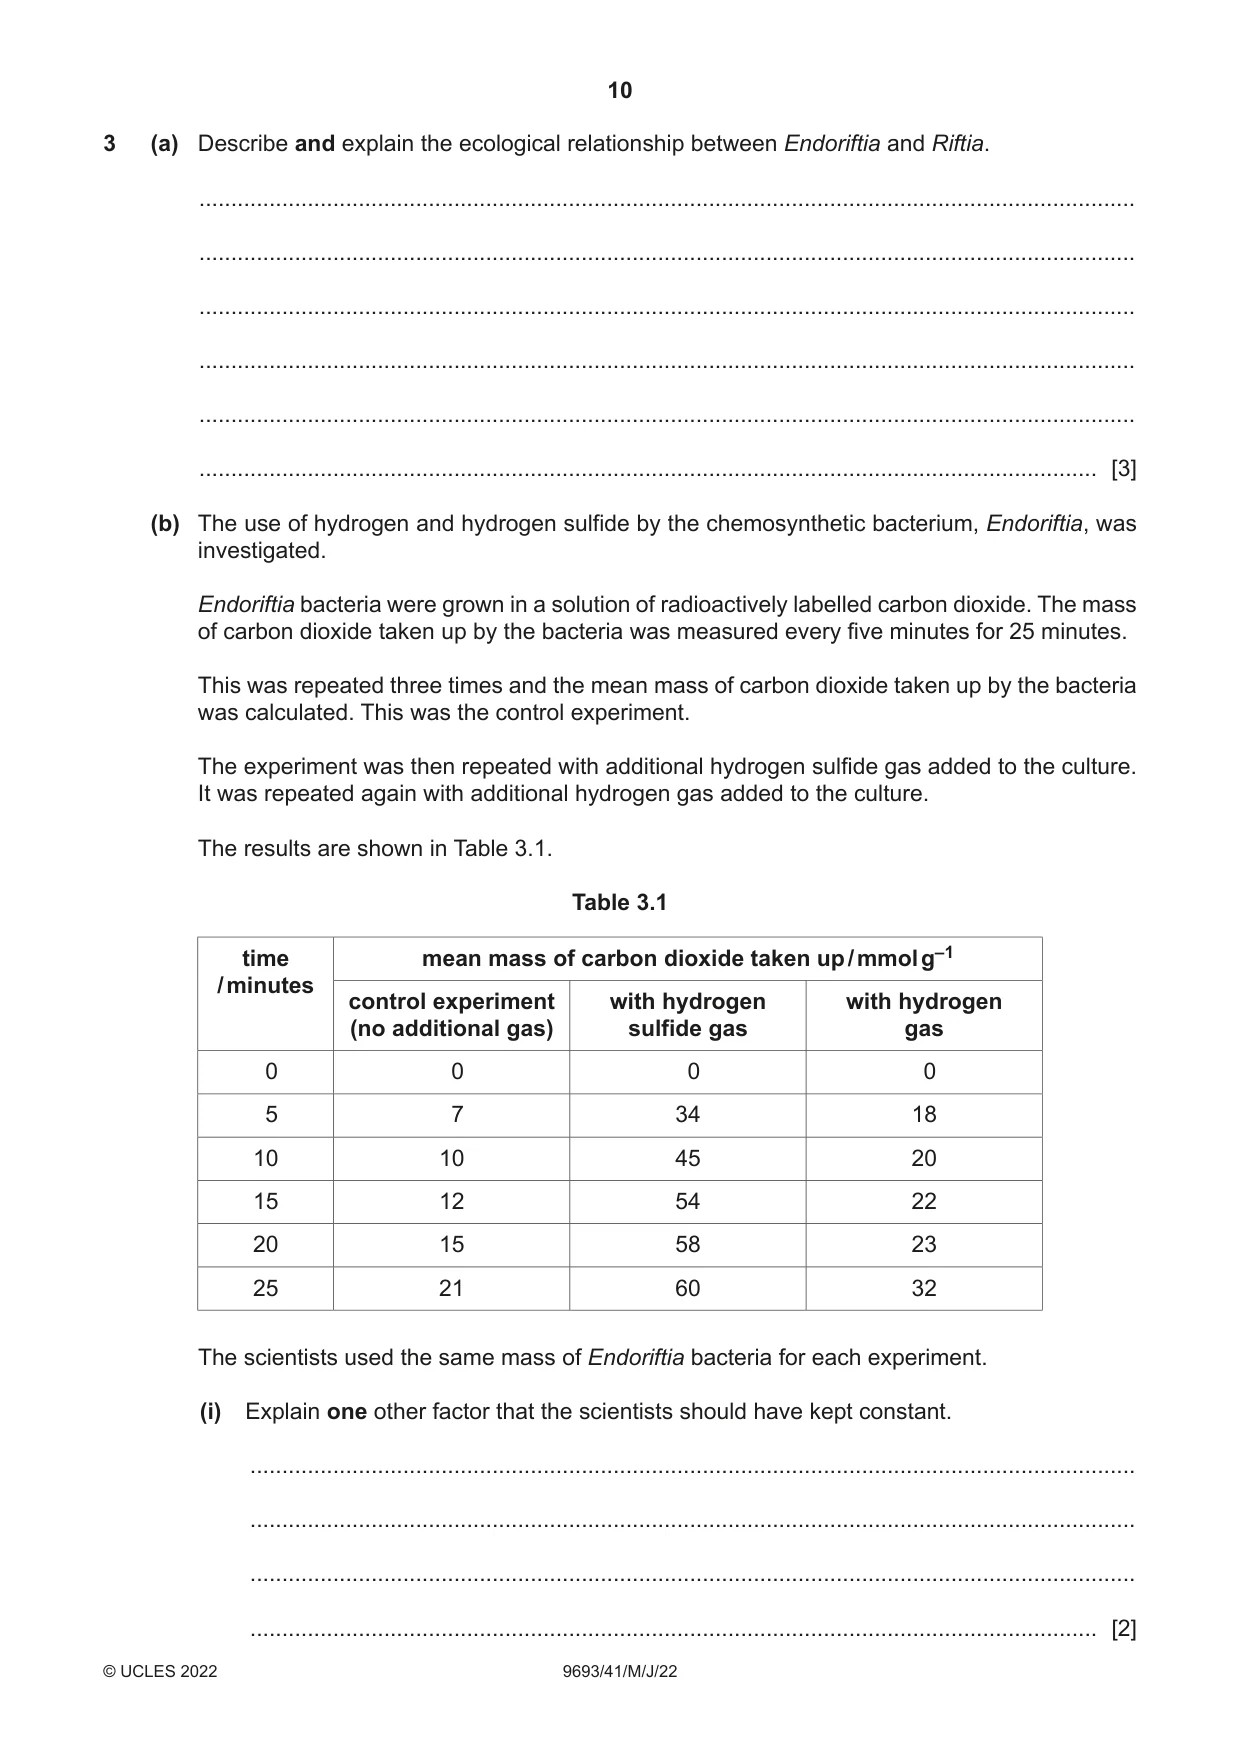
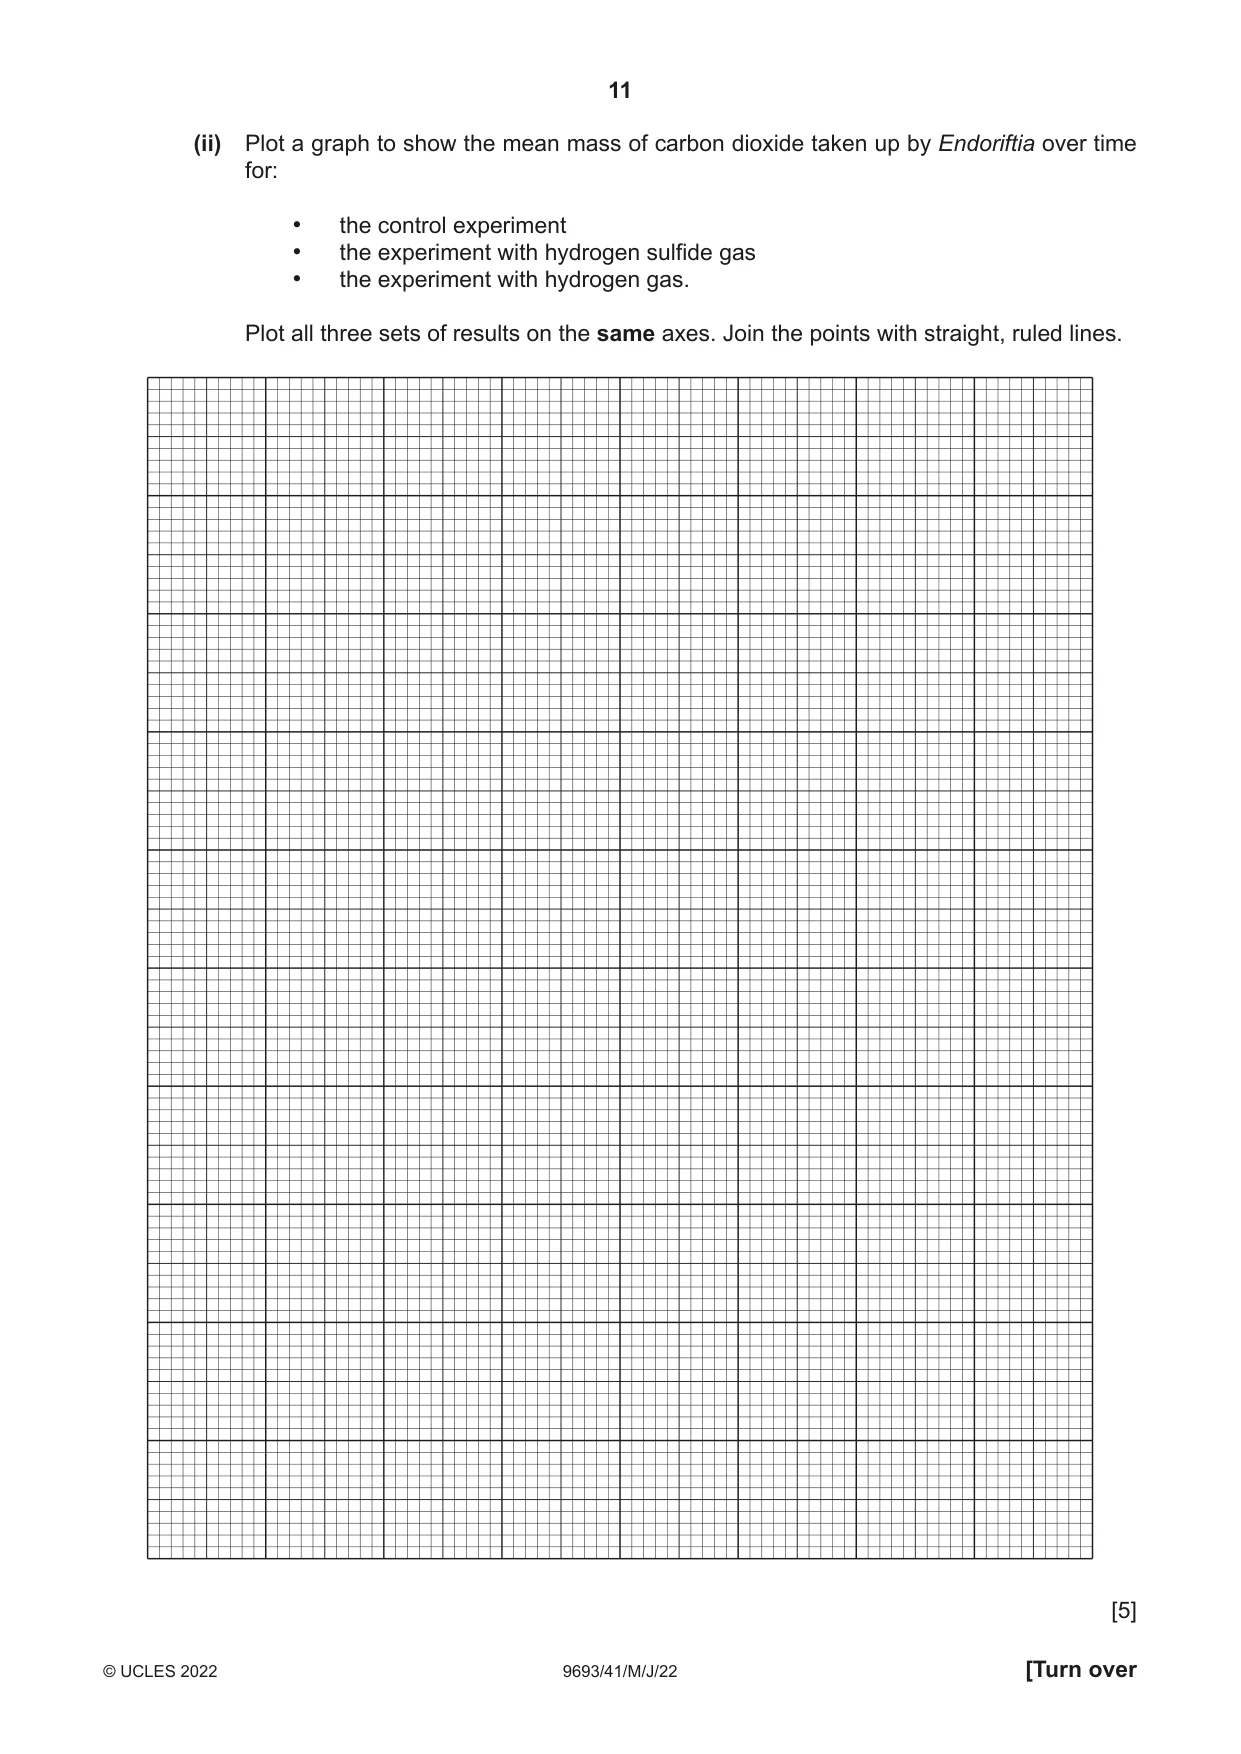
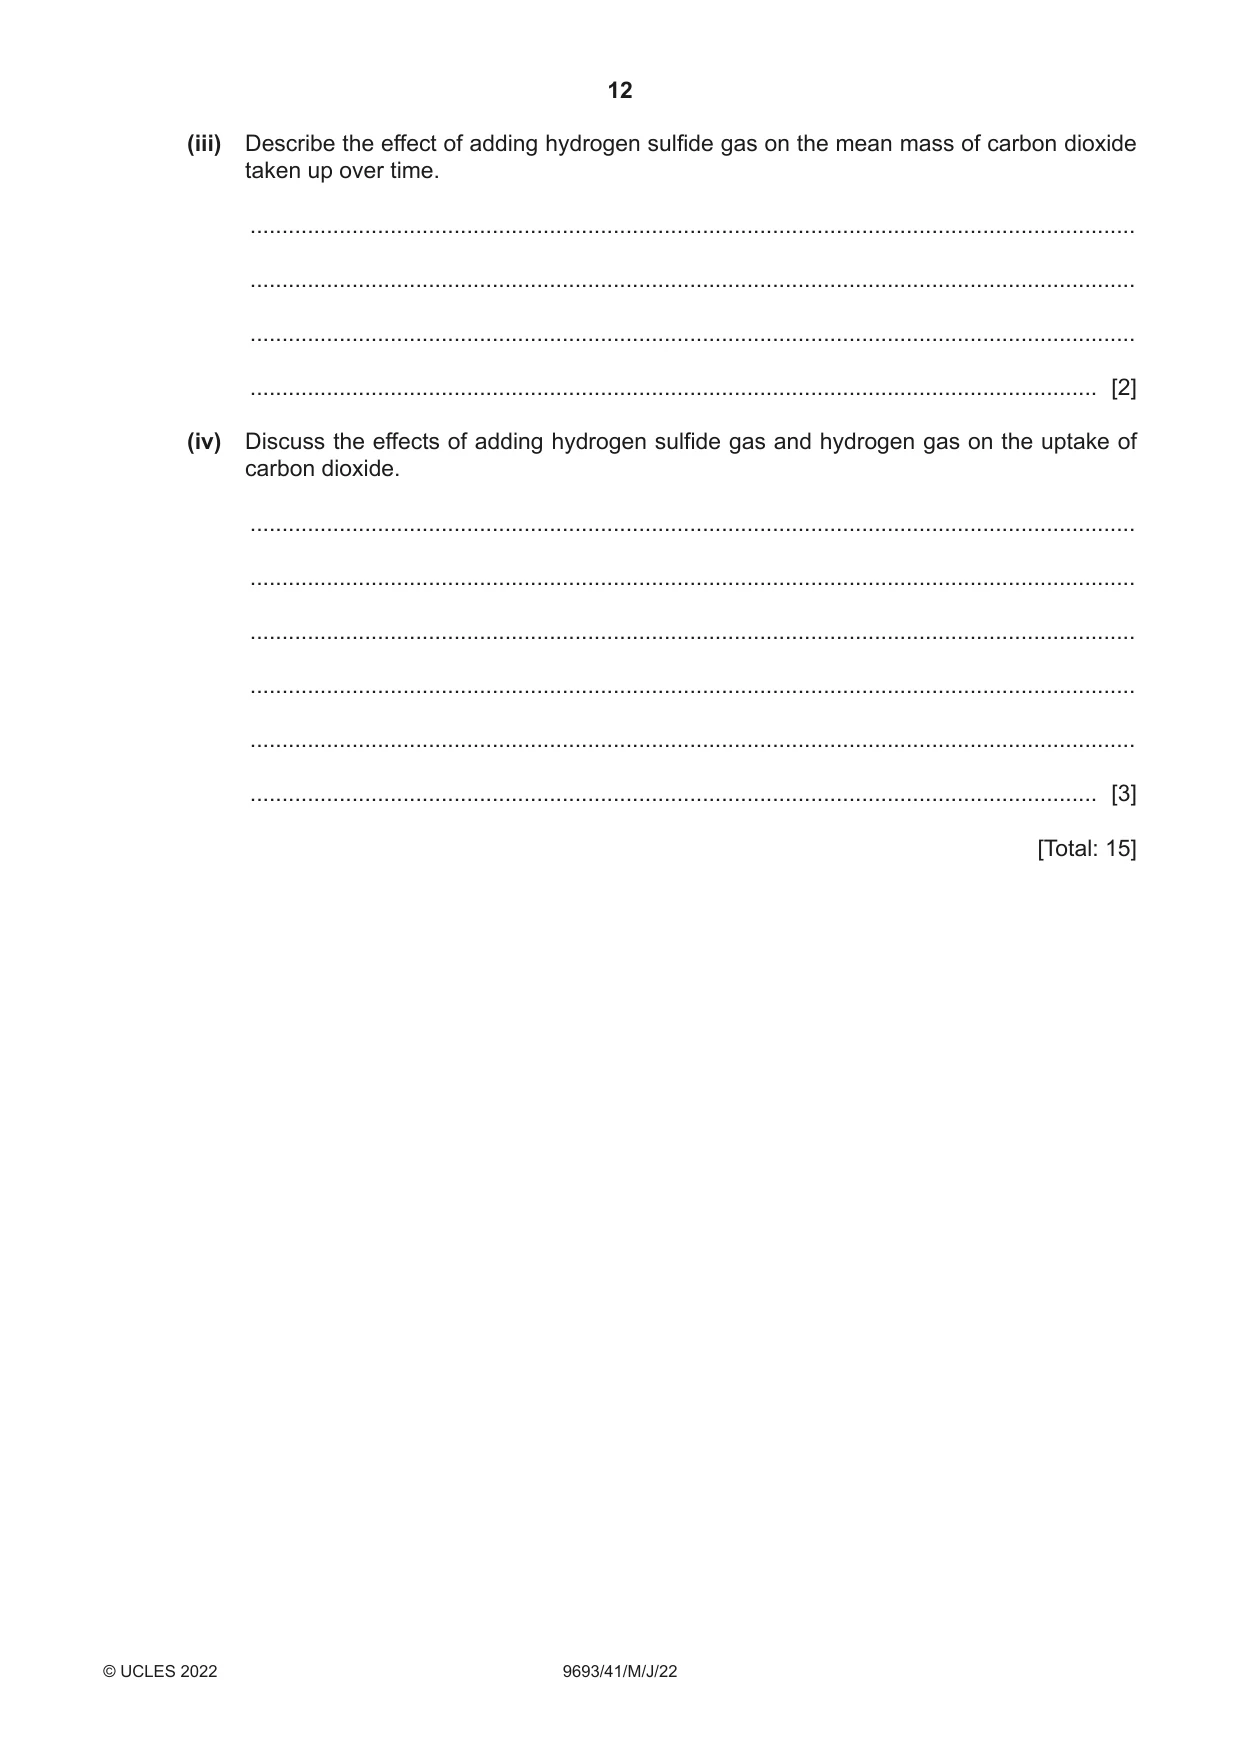
3 (a) Describe and explain the ecological relationship between Endoriftia and Riftia. ................................................................................................................................................... ................................................................................................................................................... ................................................................................................................................................... ................................................................................................................................................... ................................................................................................................................................... ............................................................................................................................................. [3] (b) The use of hydrogen and hydrogen sulfide by the chemosynthetic bacterium, Endoriftia, was investigated. Endoriftia bacteria were grown in a solution of radioactively labelled carbon dioxide. The mass of carbon dioxide taken up by the bacteria was measured every five minutes for 25 minutes. This was repeated three times and the mean mass of carbon dioxide taken up by the bacteria was calculated. This was the control experiment. The experiment was then repeated with additional hydrogen sulfide gas added to the culture. It was repeated again with additional hydrogen gas added to the culture. The results are shown in Table 3.1. Table 3.1 time mean mass of carbon dioxide taken up / mmol g–1 / minutes control experiment with hydrogen with hydrogen (no additional gas) sulfide gas gas 0 0 0 0 5 7 34 18 10 10 45 20 15 12 54 22 20 15 58 23 25 21 60 32 The scientists used the same mass of Endoriftia bacteria for each experiment. (i) Explain one other factor that the scientists should have kept constant. ........................................................................................................................................... ........................................................................................................................................... ........................................................................................................................................... ..................................................................................................................................... [2] (iii) Describe the effect of adding hydrogen sulfide gas on the mean mass of carbon dioxide taken up over time. ........................................................................................................................................... ........................................................................................................................................... ........................................................................................................................................... ..................................................................................................................................... [2] (iv) Discuss the effects of adding hydrogen sulfide gas and hydrogen gas on the uptake of carbon dioxide. ........................................................................................................................................... ........................................................................................................................................... ........................................................................................................................................... ........................................................................................................................................... ........................................................................................................................................... ..................................................................................................................................... [3] [Total: 15]
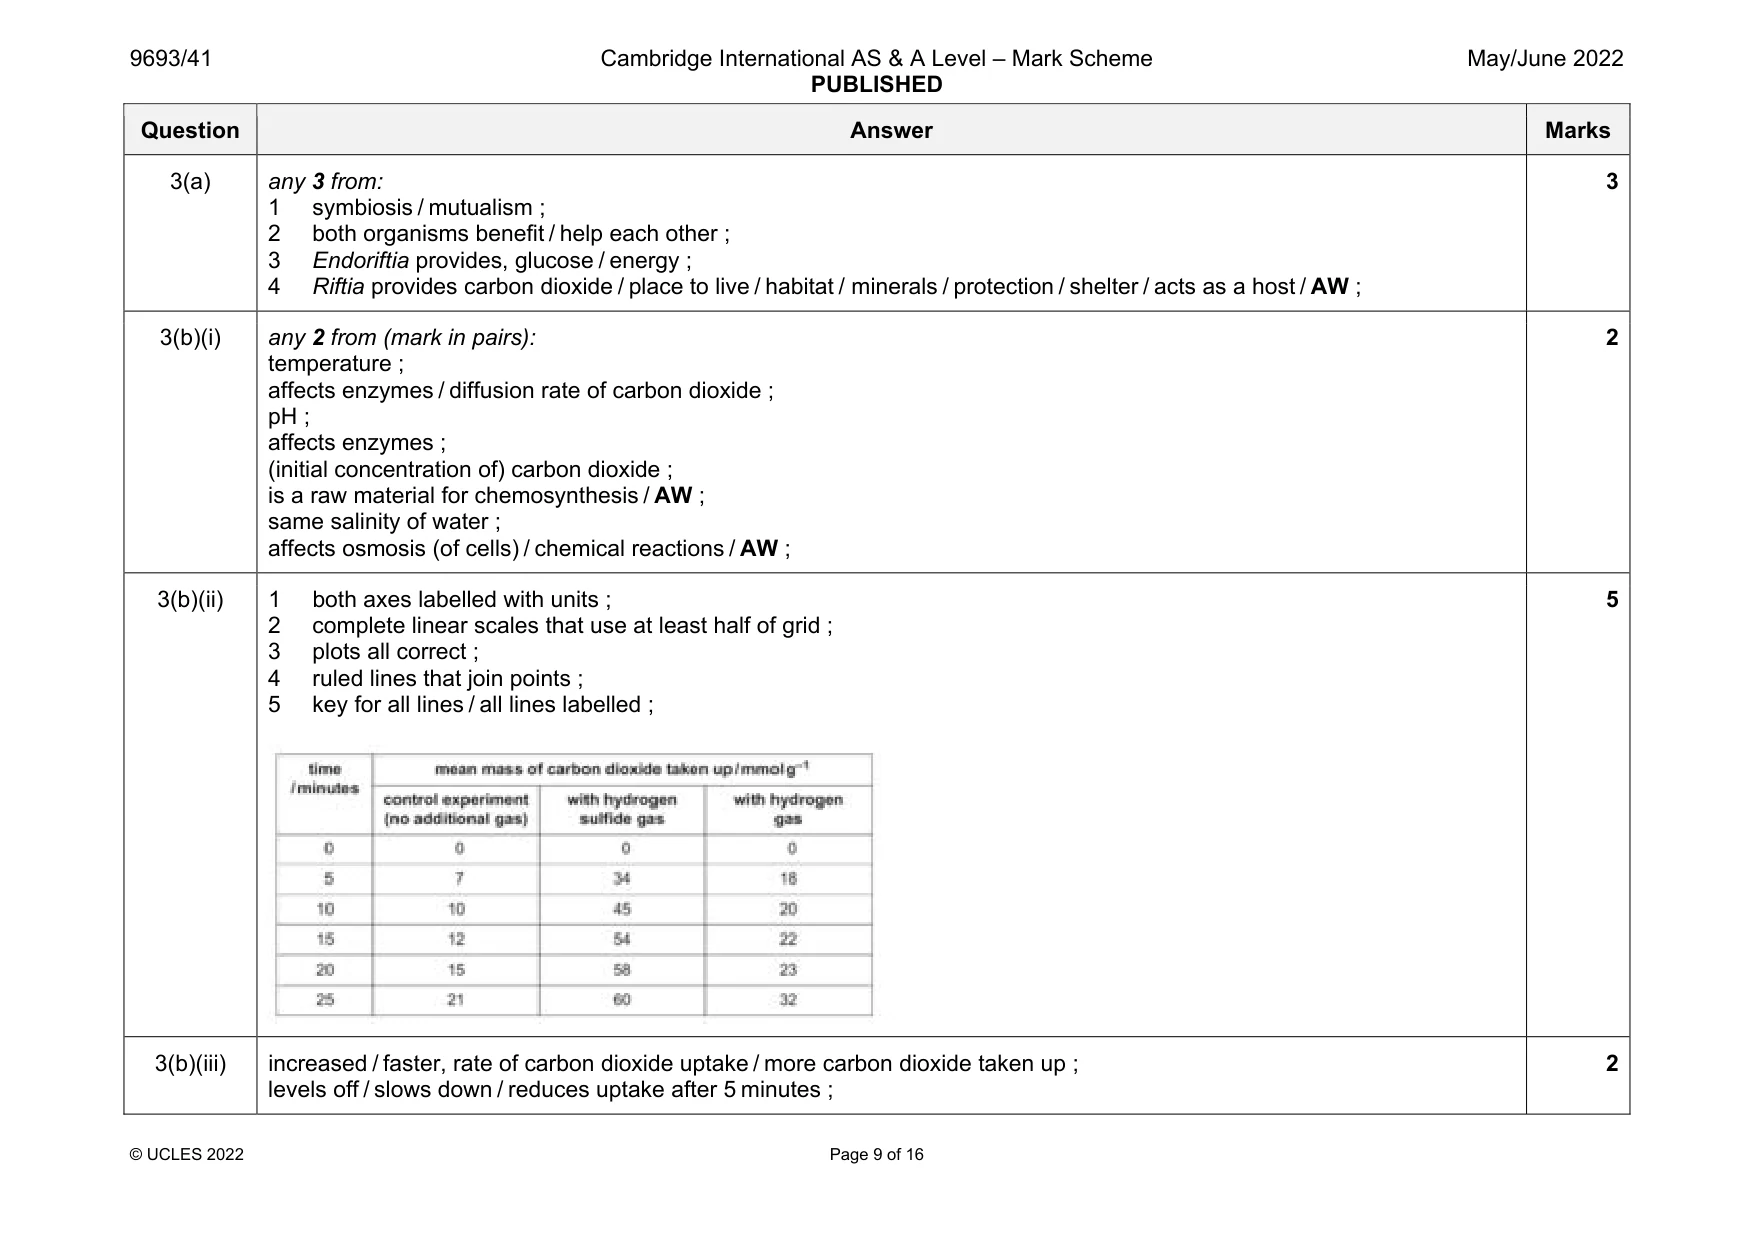
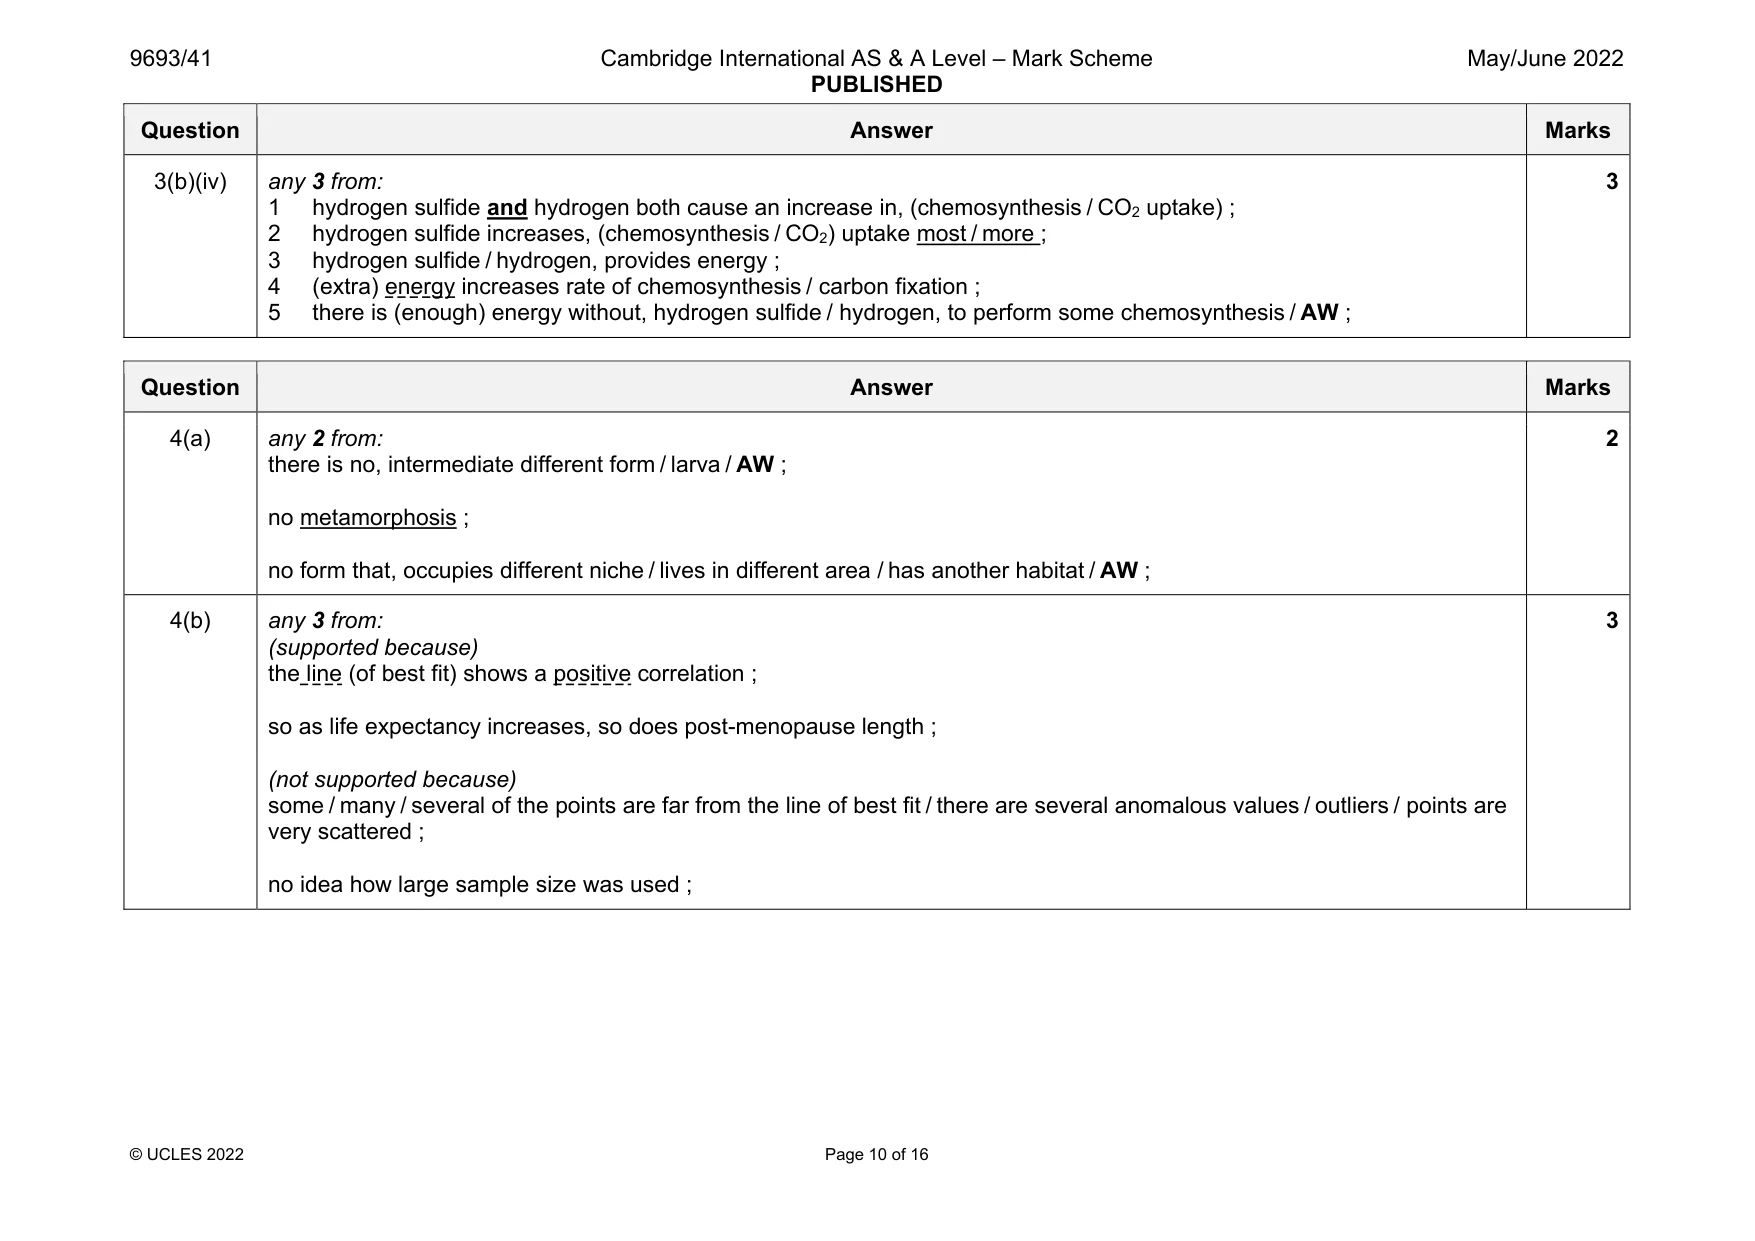
Mark scheme: 3(a) any 3 from: 1 symbiosis / mutualism ; 2 both organisms benefit / help each other ; 3 Endoriftia provides, glucose / energy ; 4 Riftia provides carbon dioxide / place to live / habitat / minerals / protection / shelter / acts as a host / AW ; 3 3(b)(i) any 2 from (mark in pairs): temperature ; affects enzymes / diffusion rate of carbon dioxide ; pH ; affects enzymes ; (initial concentration of) carbon dioxide ; is a raw material for chemosynthesis / AW ; same salinity of water ; affects osmosis (of cells) / chemical reactions / AW ; 2 3(b)(ii) 1 both axes labelled with units ; 2 complete linear scales that use at least half of grid ; 3 plots all correct ; 4 ruled lines that join points ; 5 key for all lines / all lines labelled ; 5 3(b)(iii) increased / faster, rate of carbon dioxide uptake / more carbon dioxide taken up ; levels off / slows down / reduces uptake after 5 minutes ; 2 Question Answer Marks 3(b)(iv) any 3 from: 1 hydrogen sulfide and hydrogen both cause an increase in, (chemosynthesis / CO2 uptake) ; 2 hydrogen sulfide increases, (chemosynthesis / CO2) uptake most / more ; 3 hydrogen sulfide / hydrogen, provides energy ; 4 (extra) energy increases rate of chemosynthesis / carbon fixation ; 5 there is (enough) energy without, hydrogen sulfide / hydrogen, to perform some chemosynthesis / AW ; 3
Q4 · Part of the life cycle of the orca (killer whale)
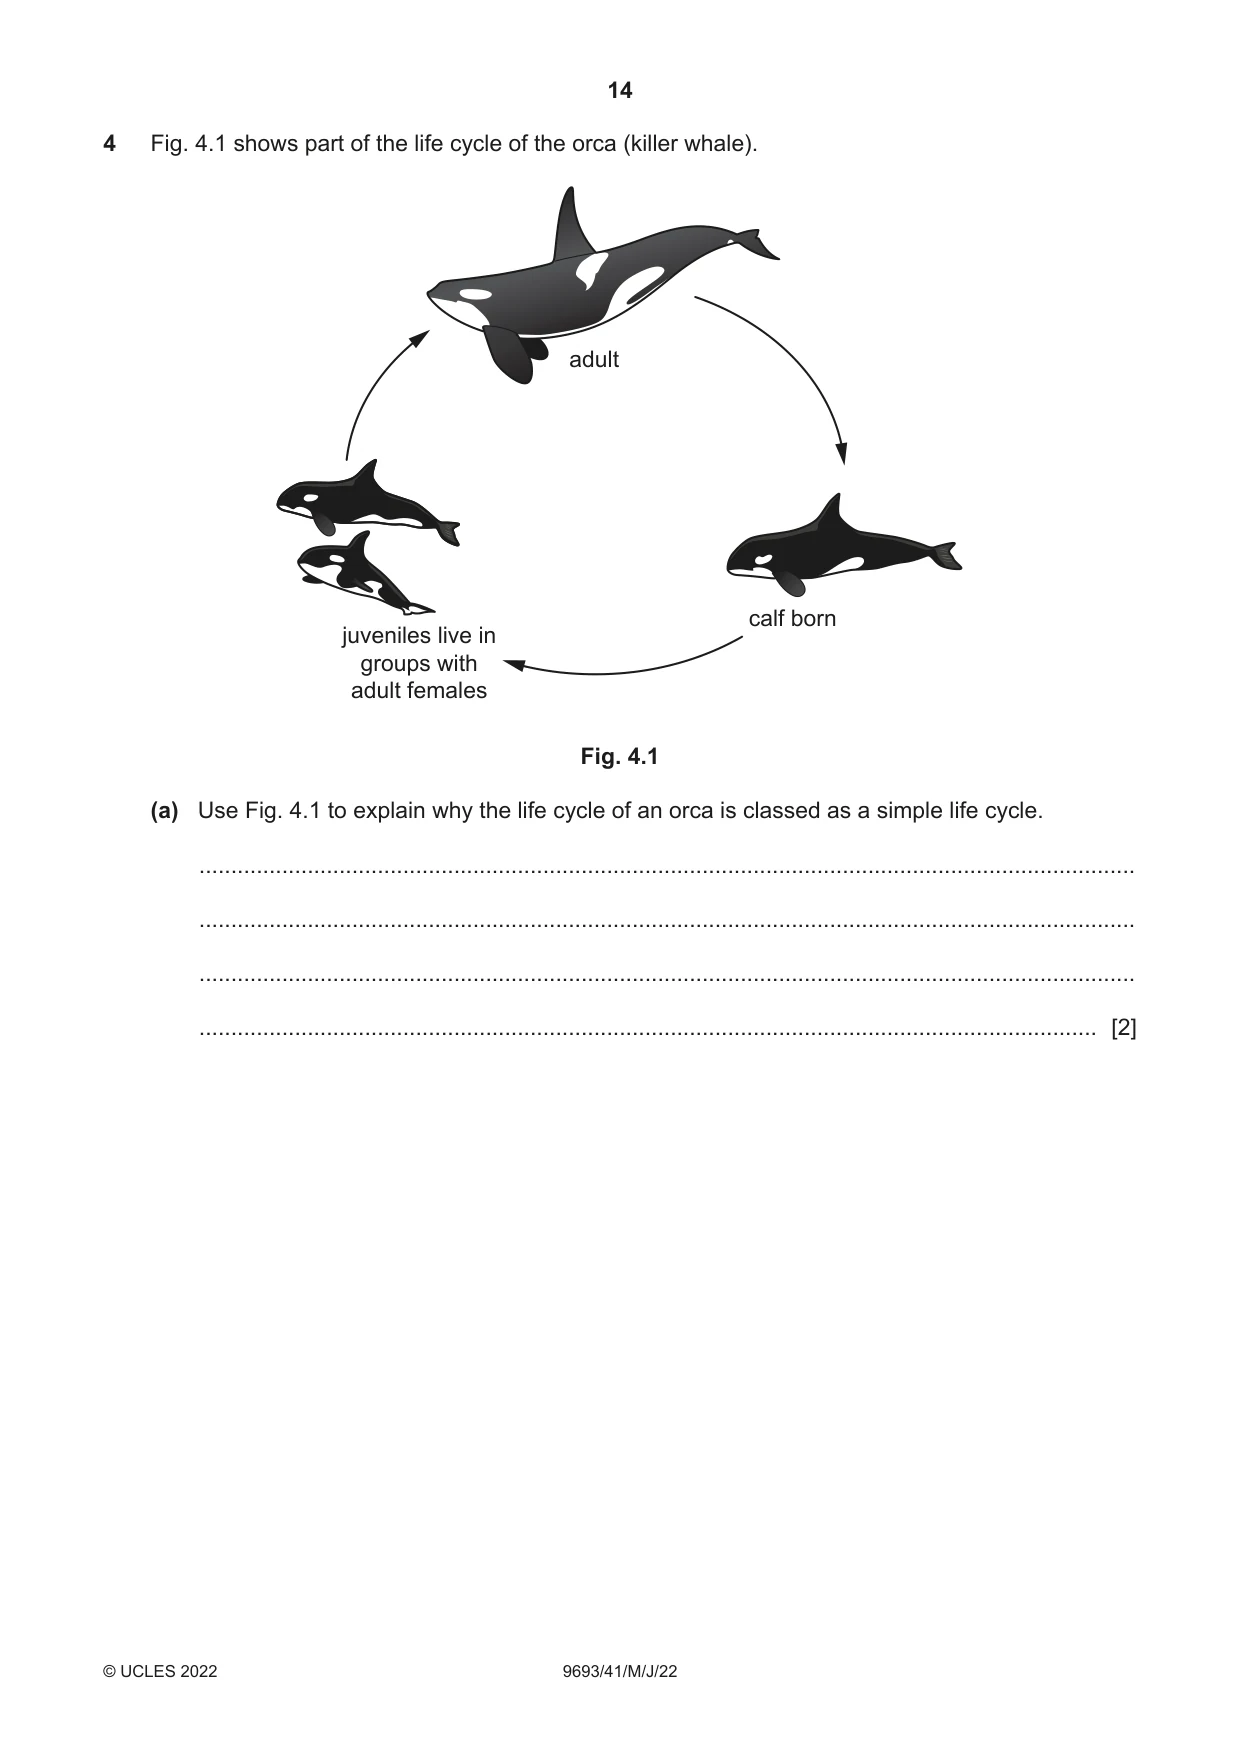
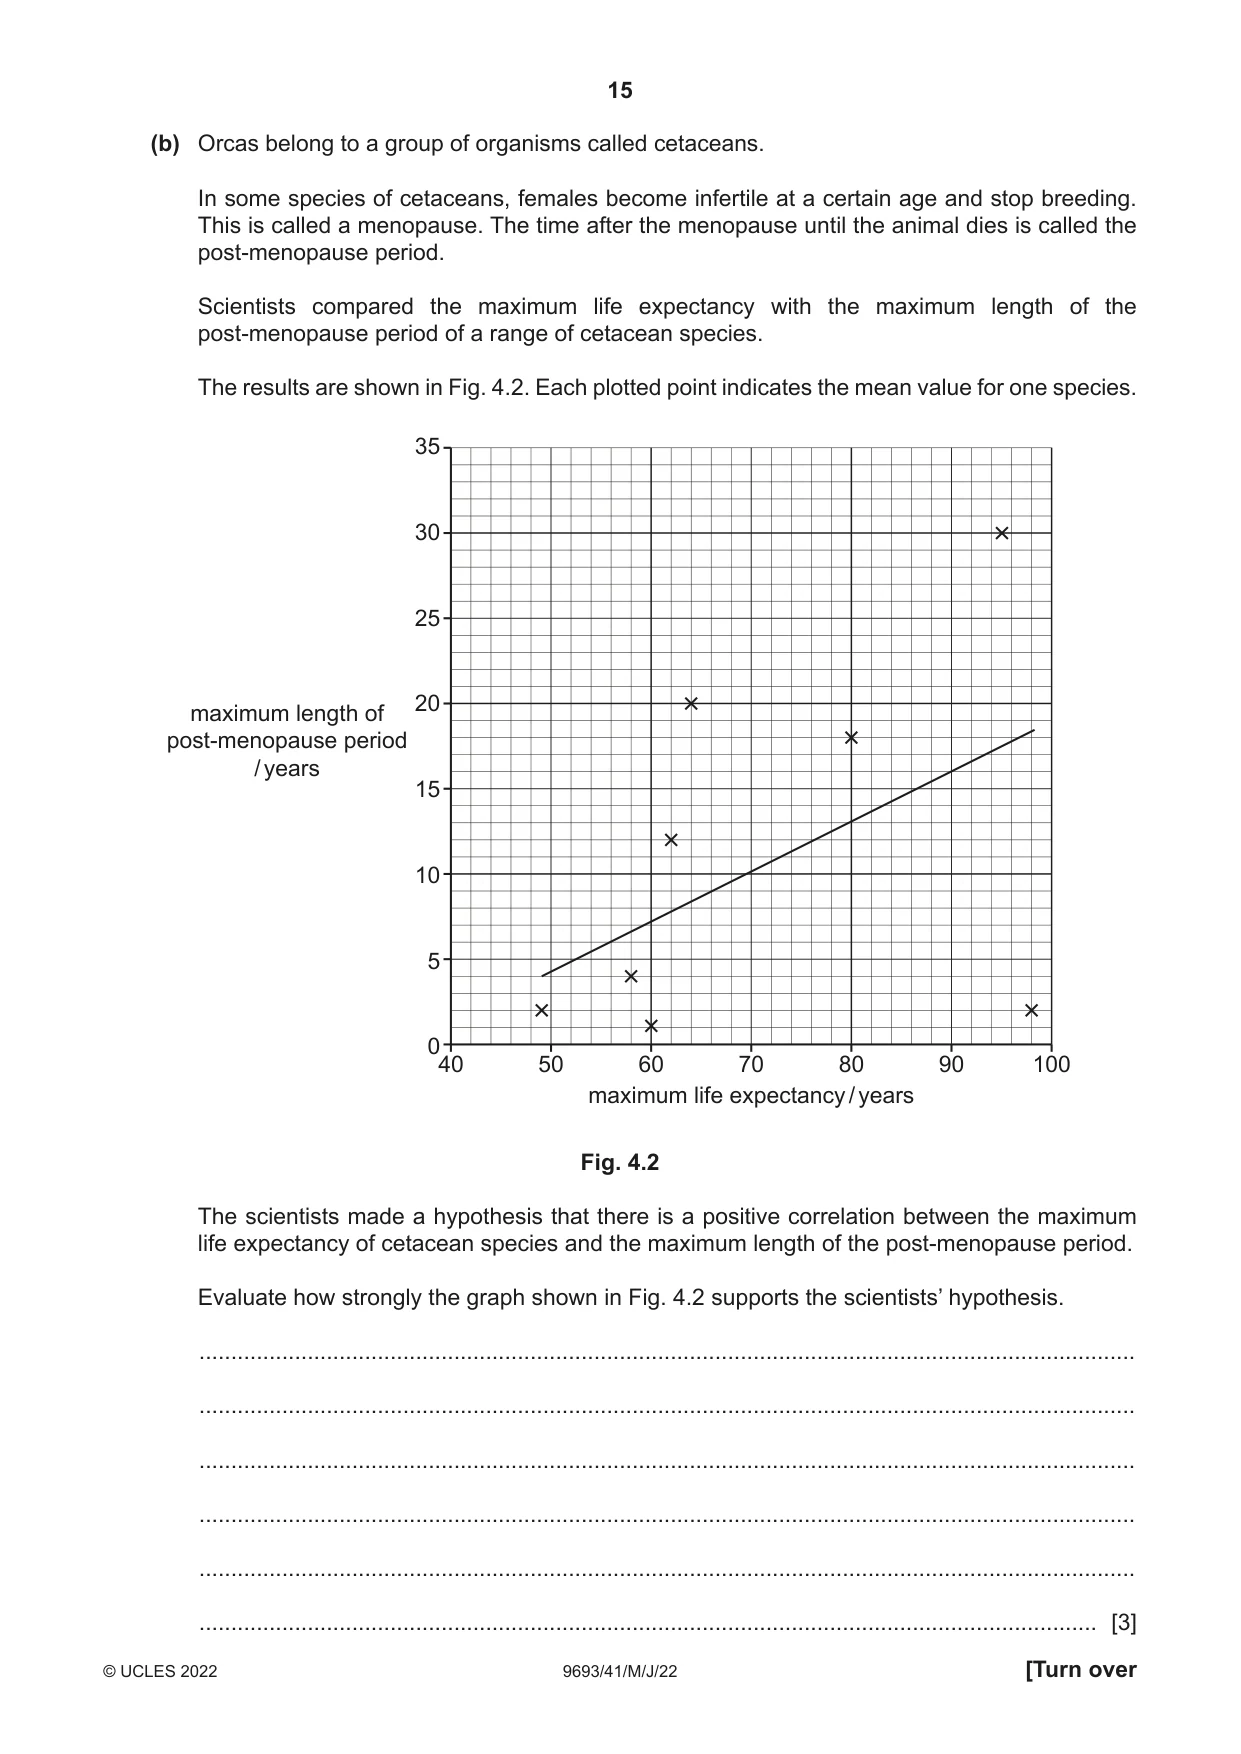
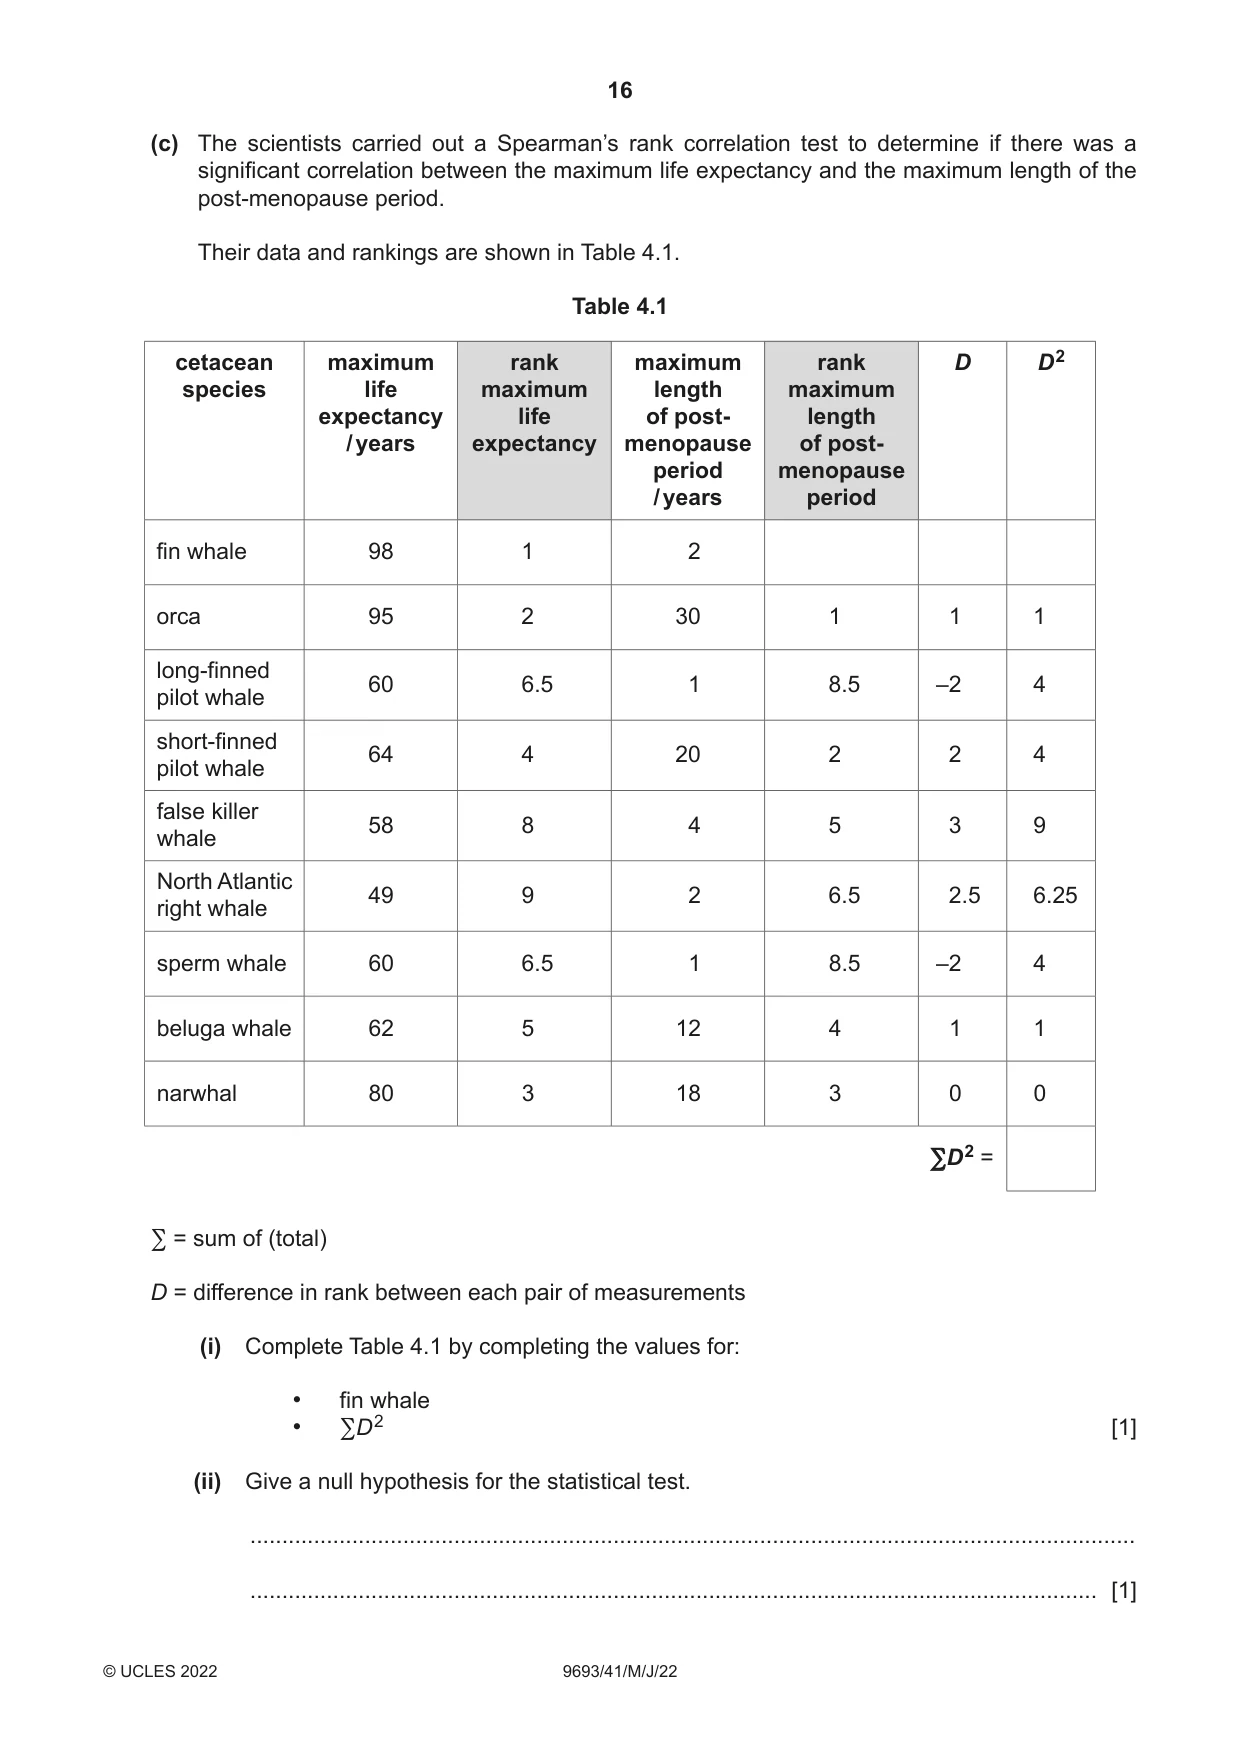
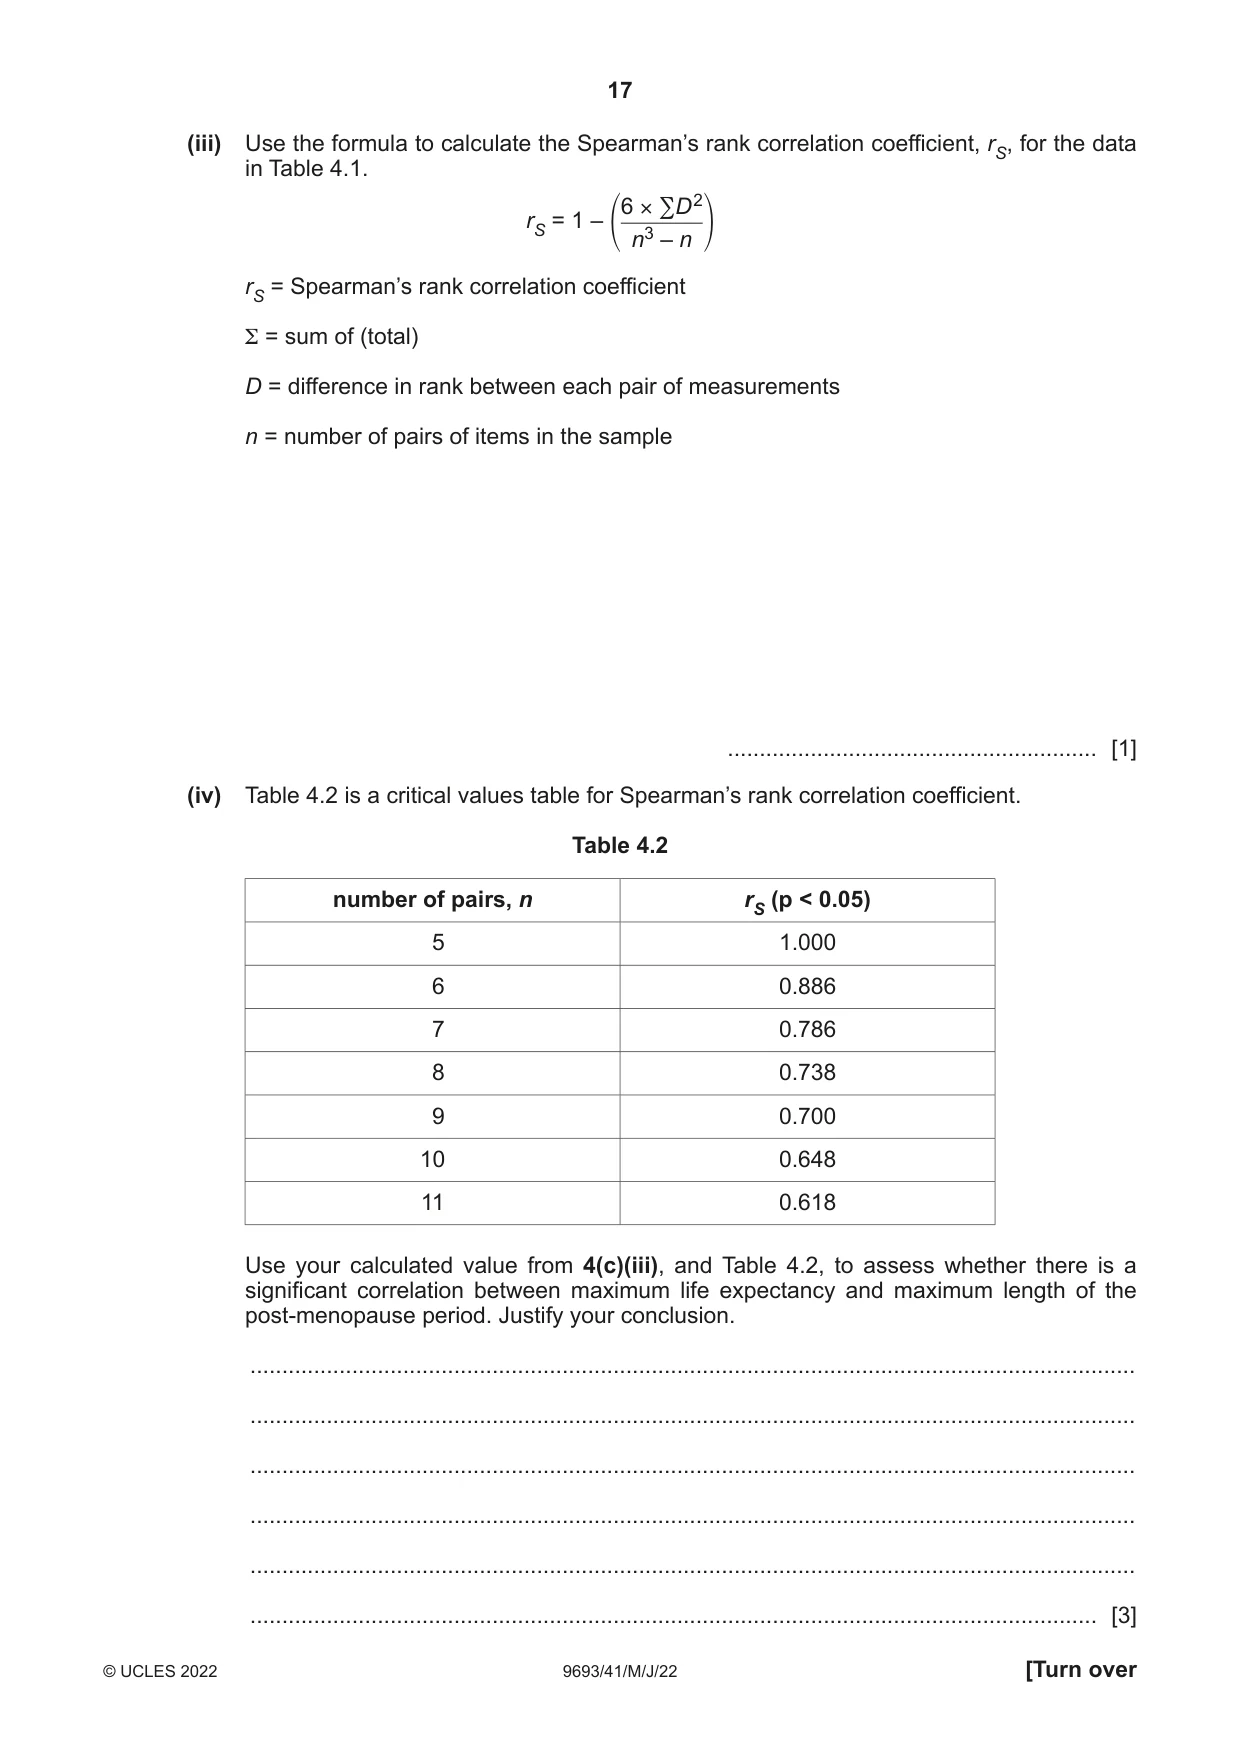
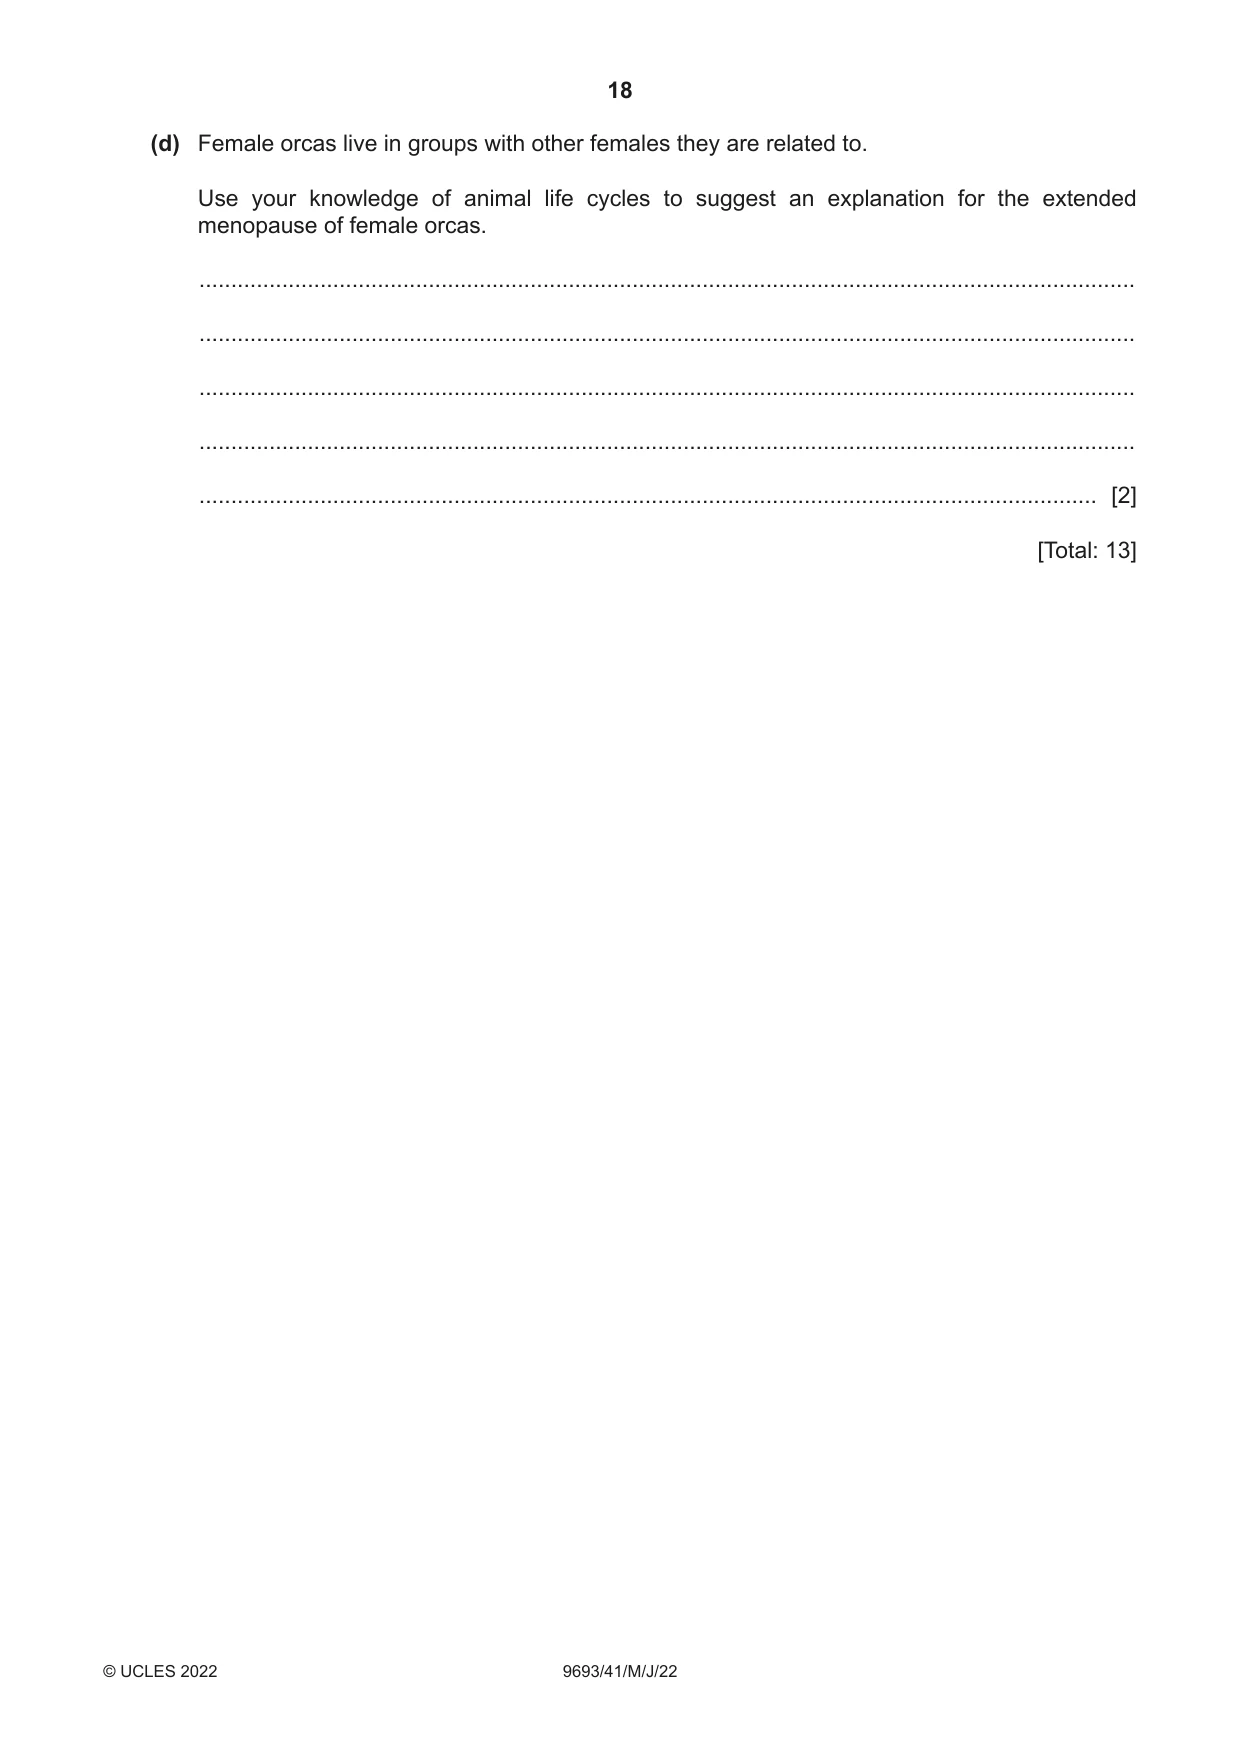
4 Fig. 4.1 shows part of the life cycle of the orca (killer whale). adult calf born juveniles live in groups with adult females Fig. 4.1 (a) Use Fig. 4.1 to explain why the life cycle of an orca is classed as a simple life cycle. ................................................................................................................................................... ................................................................................................................................................... ................................................................................................................................................... ............................................................................................................................................. [2] (b) Orcas belong to a group of organisms called cetaceans. In some species of cetaceans, females become infertile at a certain age and stop breeding. This is called a menopause. The time after the menopause until the animal dies is called the post-menopause period. Scientists compared the maximum life expectancy with the maximum length of the post-menopause period of a range of cetacean species. The results are shown in Fig. 4.2. Each plotted point indicates the mean value for one species. 35 30 25 20 maximum length of post-menopause period / years 15 10 5 0 40 50 60 70 80 90 100 maximum life expectancy / years Fig. 4.2 The scientists made a hypothesis that there is a positive correlation between the maximum life expectancy of cetacean species and the maximum length of the post-menopause period. Evaluate how strongly the graph shown in Fig. 4.2 supports the scientists’ hypothesis. ................................................................................................................................................... ................................................................................................................................................... ................................................................................................................................................... ................................................................................................................................................... ................................................................................................................................................... ............................................................................................................................................. [3] (c) The scientists carried out a Spearman’s rank correlation test to determine if there was a significant correlation between the maximum life expectancy and the maximum length of the post-menopause period. Their data and rankings are shown in Table 4.1. Table 4.1 cetacean maximum rank maximum rank D D 2 species life maximum length maximum expectancy life of post- length / years expectancy menopause of post- period menopause / years period fin whale 98 1 2 orca 95 2 30 1 1 1 long-finned 60 6.5 1 8.5 –2 4 pilot whale short-finned 64 4 20 2 2 4 pilot whale false killer 58 8 4 5 3 9 whale North Atlantic 49 9 2 6.5 2.5 6.25 right whale sperm whale 60 6.5 1 8.5 –2 4 beluga whale 62 5 12 4 1 1 narwhal 80 3 18 3 0 0 ∑D 2 = ∑ = sum of (total) D = difference in rank between each pair of measurements (i) Complete Table 4.1 by completing the values for: • fin whale • ∑D 2 [1] (ii) Give a null hypothesis for the statistical test. ........................................................................................................................................... ..................................................................................................................................... [1] (iii) Use the formula to calculate the Spearman’s rank correlation coefficient, rS, for the data in Table 4.1. 6 × ∑D 2 rS = 1 – n3 – n rS = Spearman’s rank correlation coefficient Σ = sum of (total) D = difference in rank between each pair of measurements n = number of pairs of items in the sample .......................................................... [1] (iv) Table 4.2 is a critical values table for Spearman’s rank correlation coefficient. Table 4.2 number of pairs, n rS (p < 0.05) 5 1.000 6 0.886 7 0.786 8 0.738 9 0.700 10 0.648 11 0.618 Use your calculated value from 4(c)(iii), and Table 4.2, to assess whether there is a significant correlation between maximum life expectancy and maximum length of the post-menopause period. Justify your conclusion. ........................................................................................................................................... ........................................................................................................................................... ........................................................................................................................................... ........................................................................................................................................... ........................................................................................................................................... ..................................................................................................................................... [3] (d) Female orcas live in groups with other females they are related to. Use your knowledge of animal life cycles to suggest an explanation for the extended menopause of female orcas. ................................................................................................................................................... ................................................................................................................................................... ................................................................................................................................................... ................................................................................................................................................... ............................................................................................................................................. [2] [Total: 13]
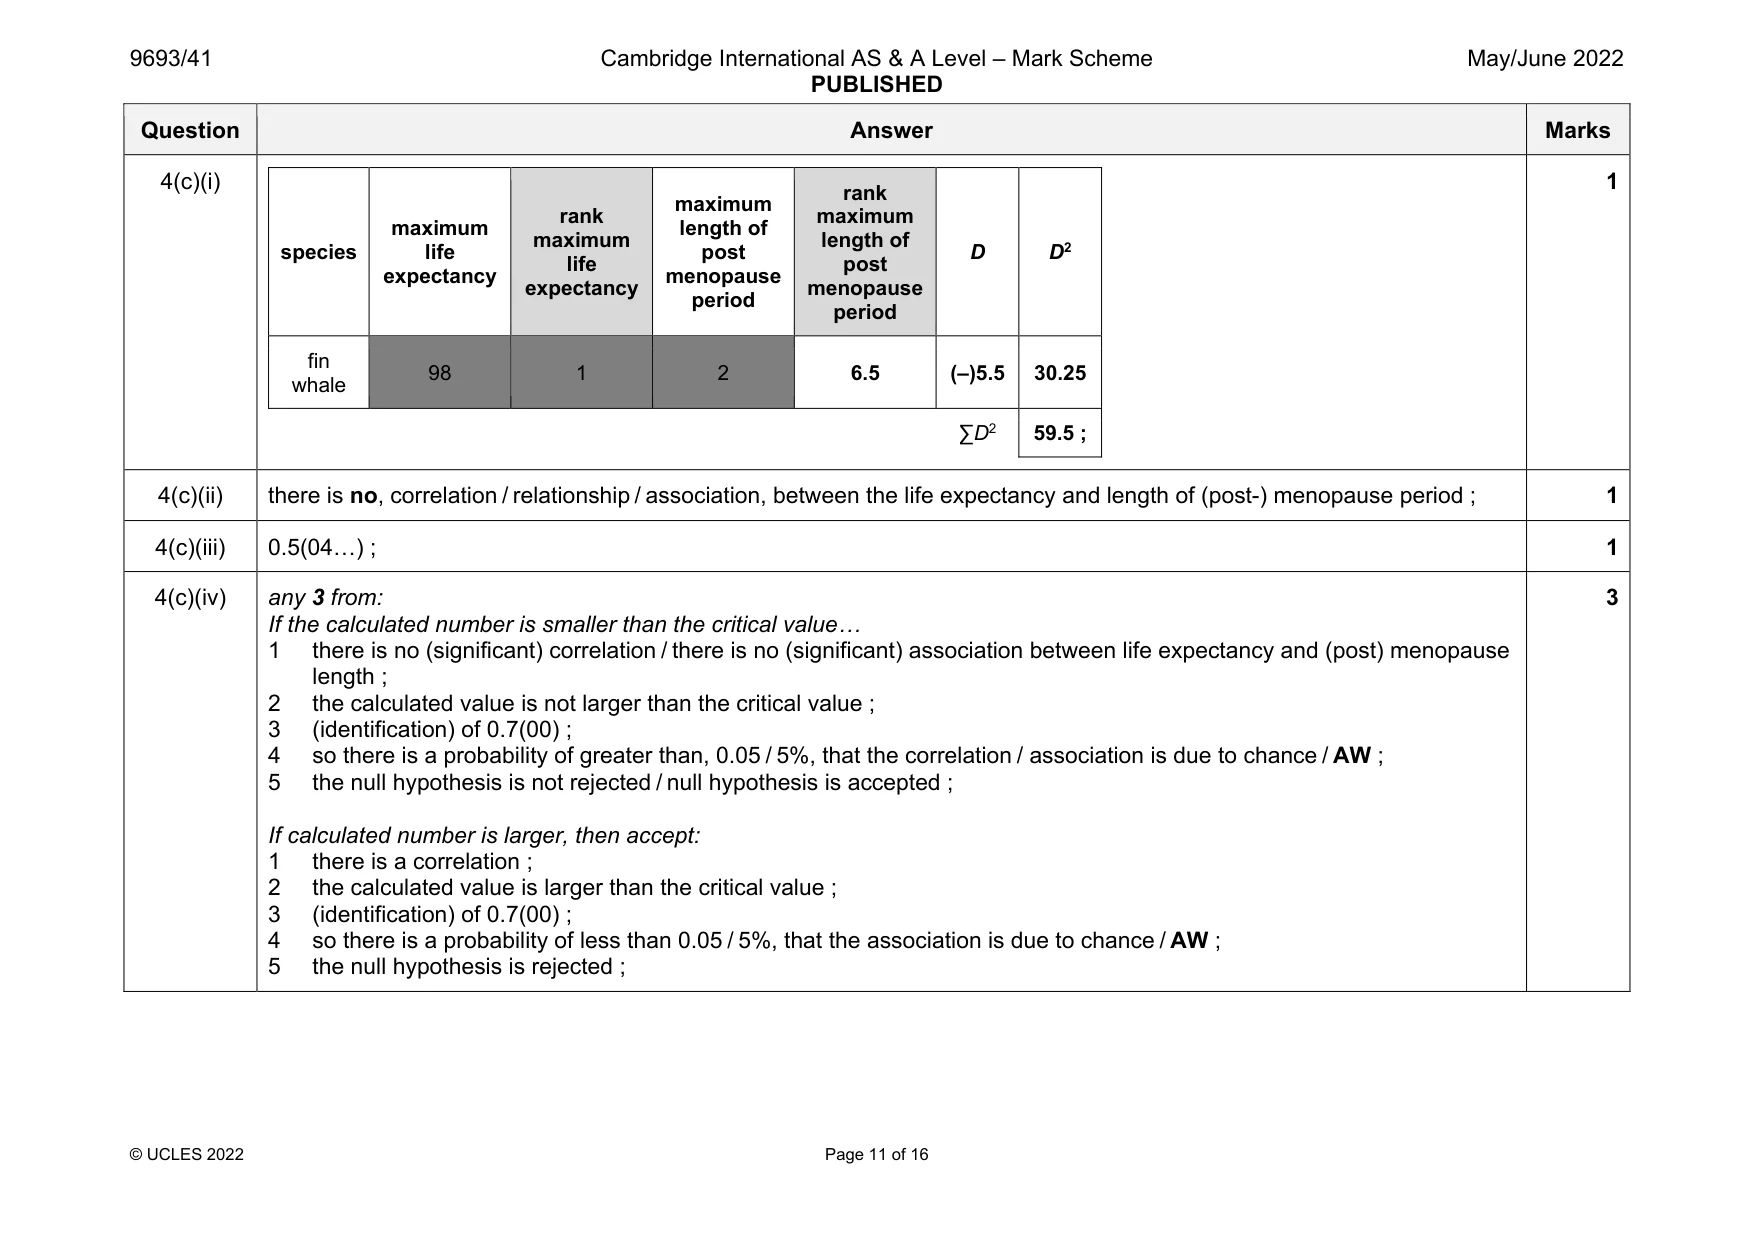
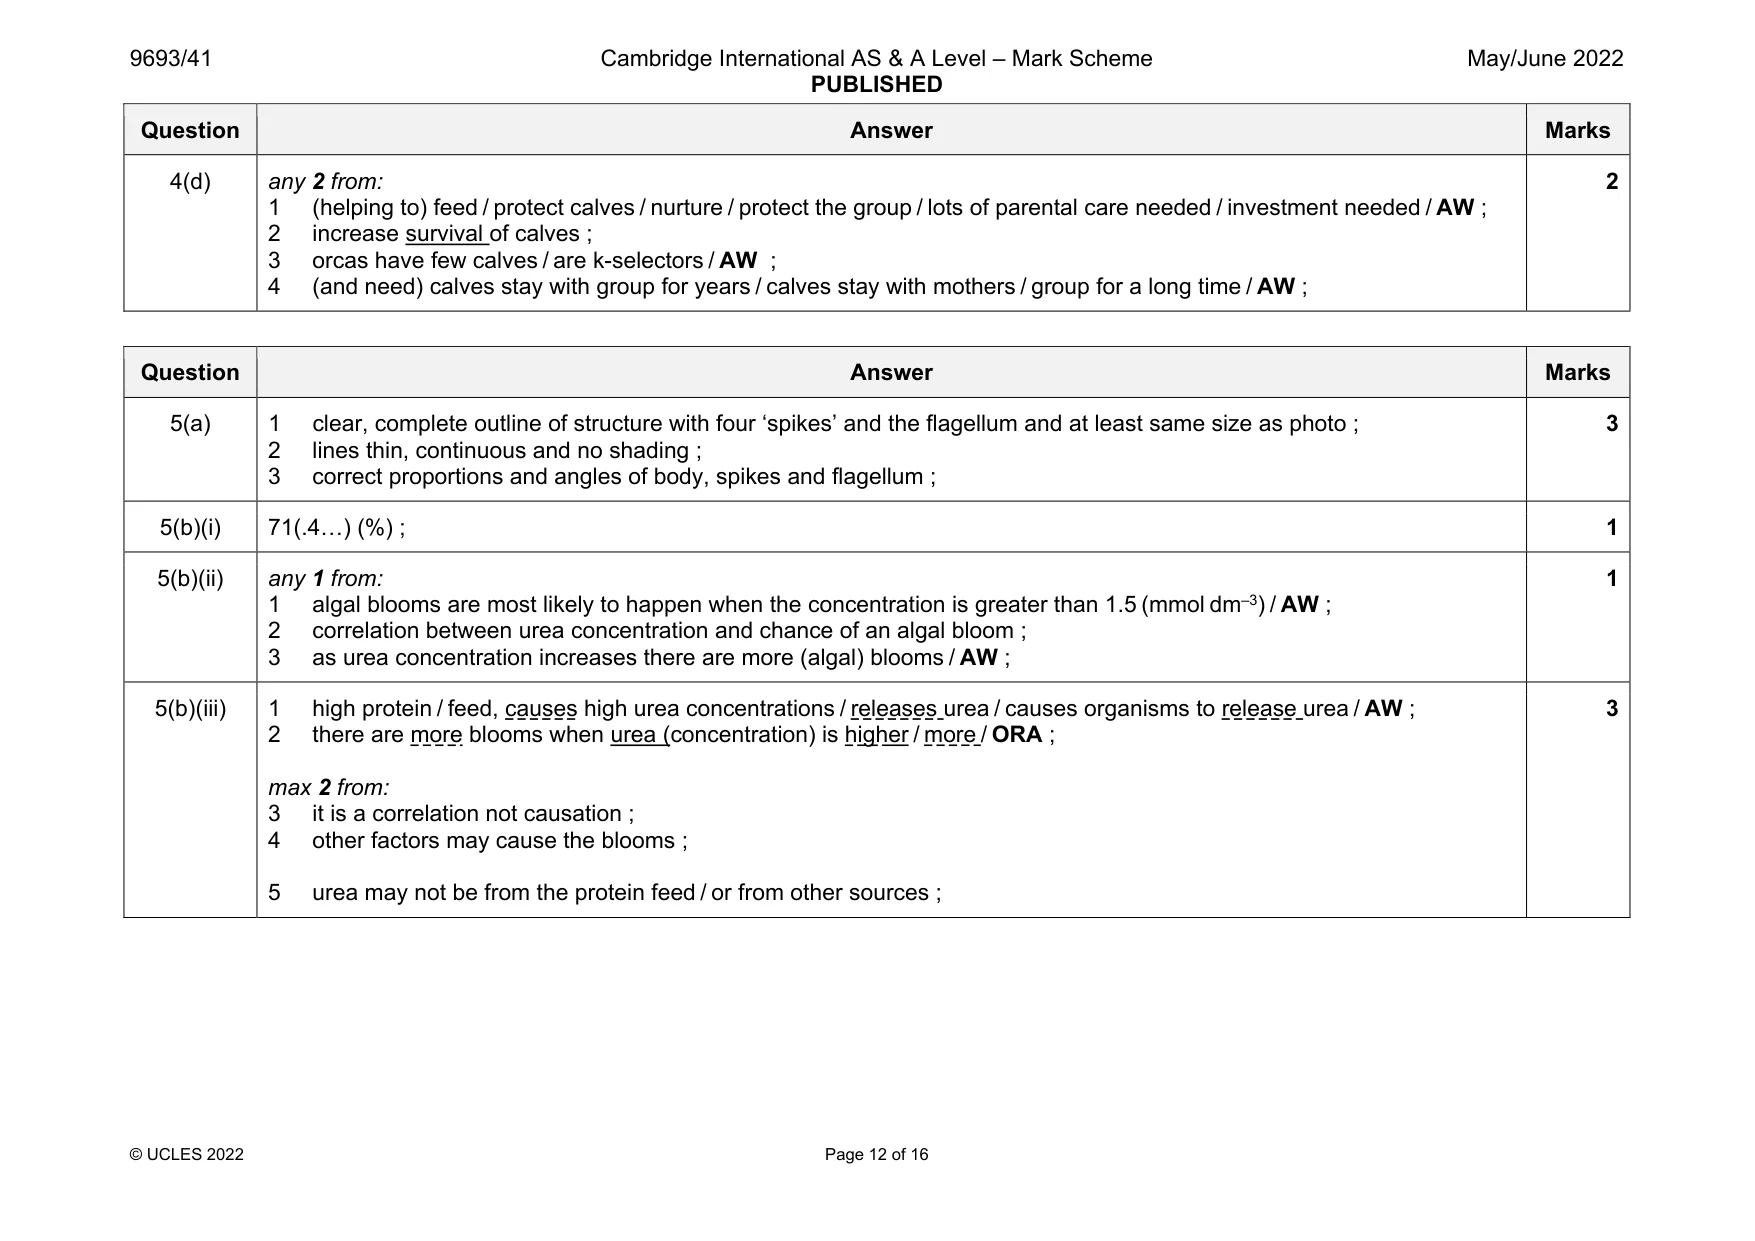
Mark scheme: 4(a) any 2 from: there is no, intermediate different form / larva / AW ; no metamorphosis ; no form that, occupies different niche / lives in different area / has another habitat / AW ; 4(b) any 3 from: (supported because) the line (of best fit) shows a positive correlation ; so as life expectancy increases, so does post-menopause length ; (not supported because) some / many / several of the points are far from the line of best fit / there are several anomalous values / outliers / points are very scattered ; no idea how large sample size was used ; 3 Question Answer Marks 4(c)(i) species maximum life expectancy rank maximum life expectancy maximum length of post menopause period rank maximum length of post menopause period D D2 fin whale 98 1 2 6.5 (–)5.5 30.25 ∑D2 59.5 ; 1 4(c)(ii) there is no, correlation / relationship / association, between the life expectancy and length of (post-) menopause period ; 1 4(c)(iii) 0.5(04…) ; 1 4(c)(iv) any 3 from: If the calculated number is smaller than the critical value… 1 there is no (significant) correlation / there is no (significant) association between life expectancy and (post) menopause length ; 2 the calculated value is not larger than the critical value ; 3 (identification) of 0.7(00) ; 4 so there is a probability of greater than, 0.05 / 5%, that the correlation / association is due to chance / AW ; 5 the null hypothesis is not rejected / null hypothesis is accepted ; If calculated number is larger, then accept: 1 there is a correlation ; 2 the calculated value is larger than the critical value ; 3 (identification) of 0.7(00) ; 4 so there is a probability of less than 0.05 / 5%, that the association is due to chance / AW ; 5 the null hypothesis is rejected ; 3 Question Answer Marks 4(d) any 2 from: 1 (helping to) feed / protect calves / nurture / protect the group / lots of parental care needed / investment needed / AW ; 2 increase survival of calves ; 3 orcas have few calves / are k-selectors / AW ; 4 (and need) calves stay with group for years / calves stay with mothers / group for a long time / AW ; 2
Q5 · High protein feed is often used in aquaculture
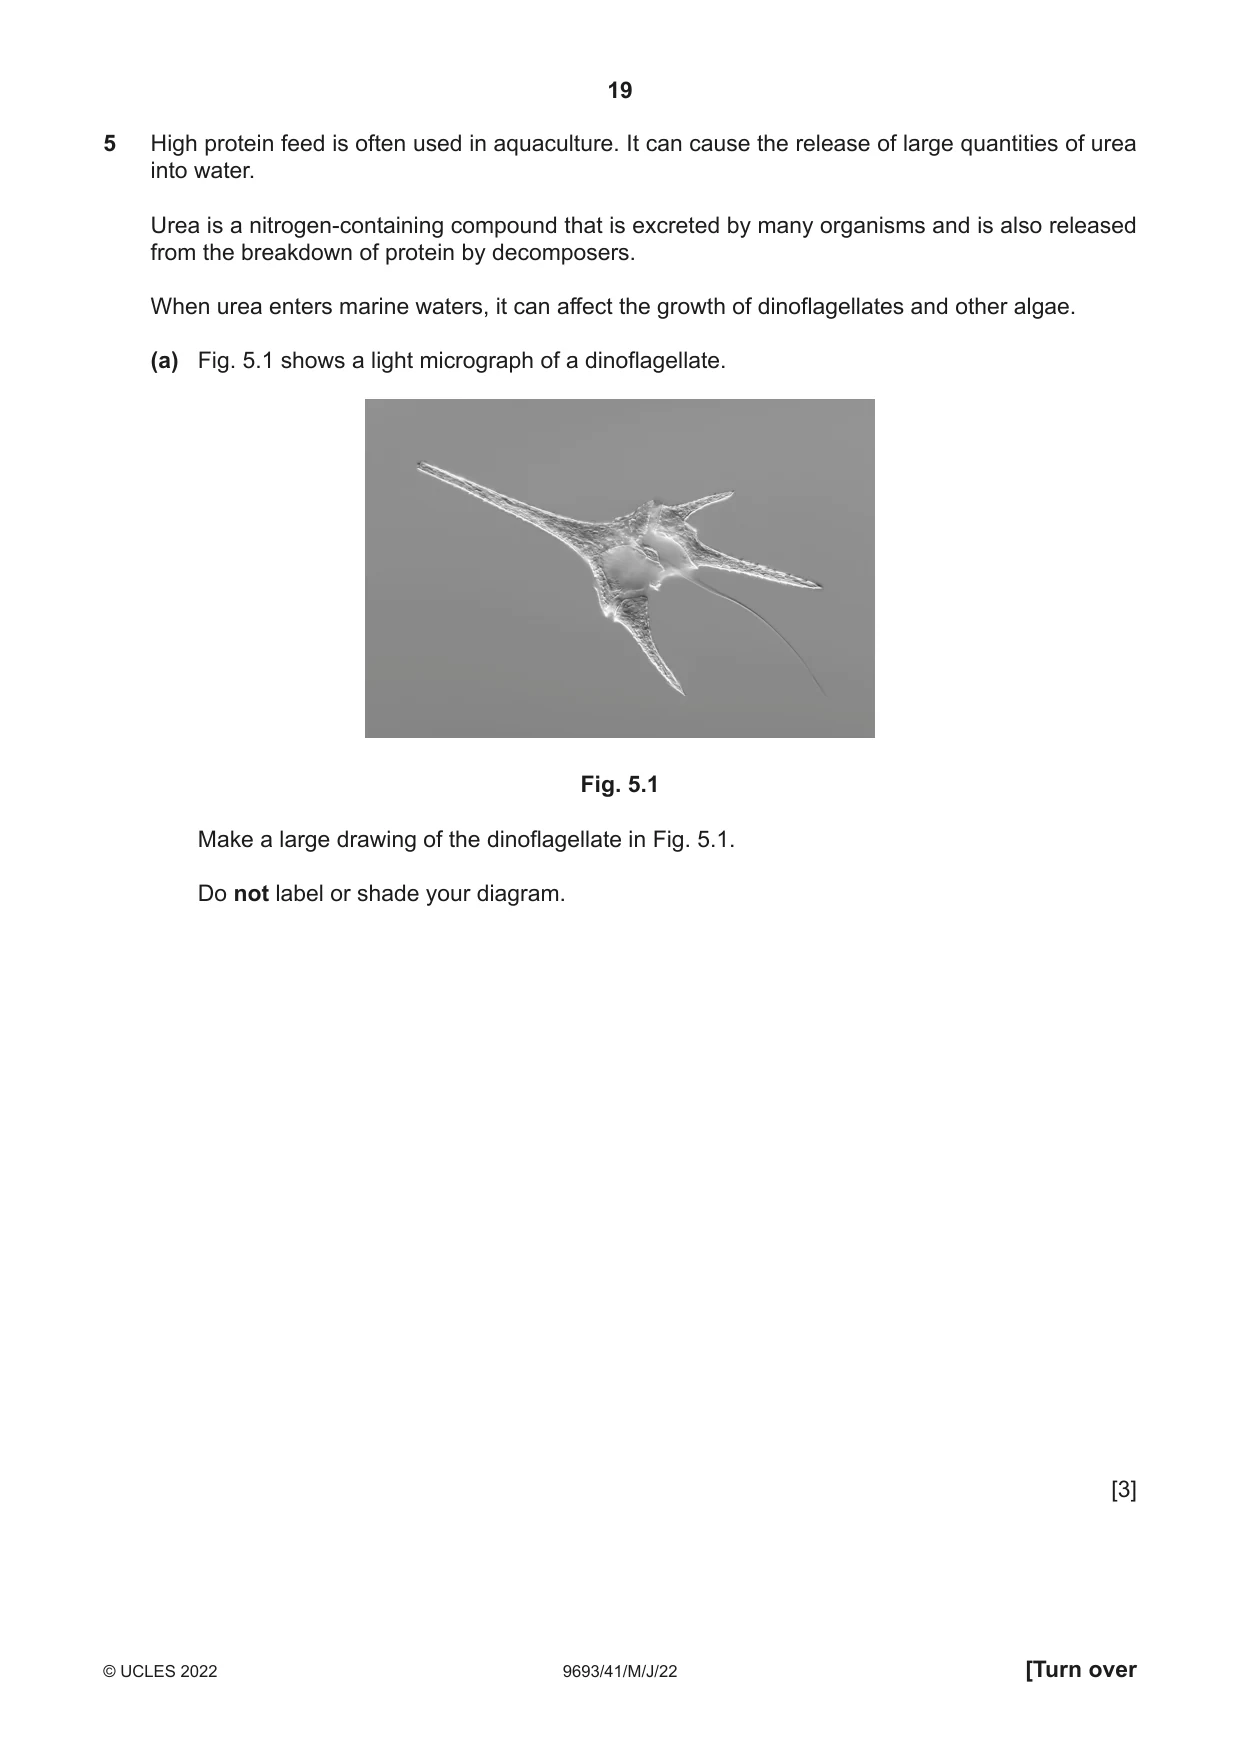
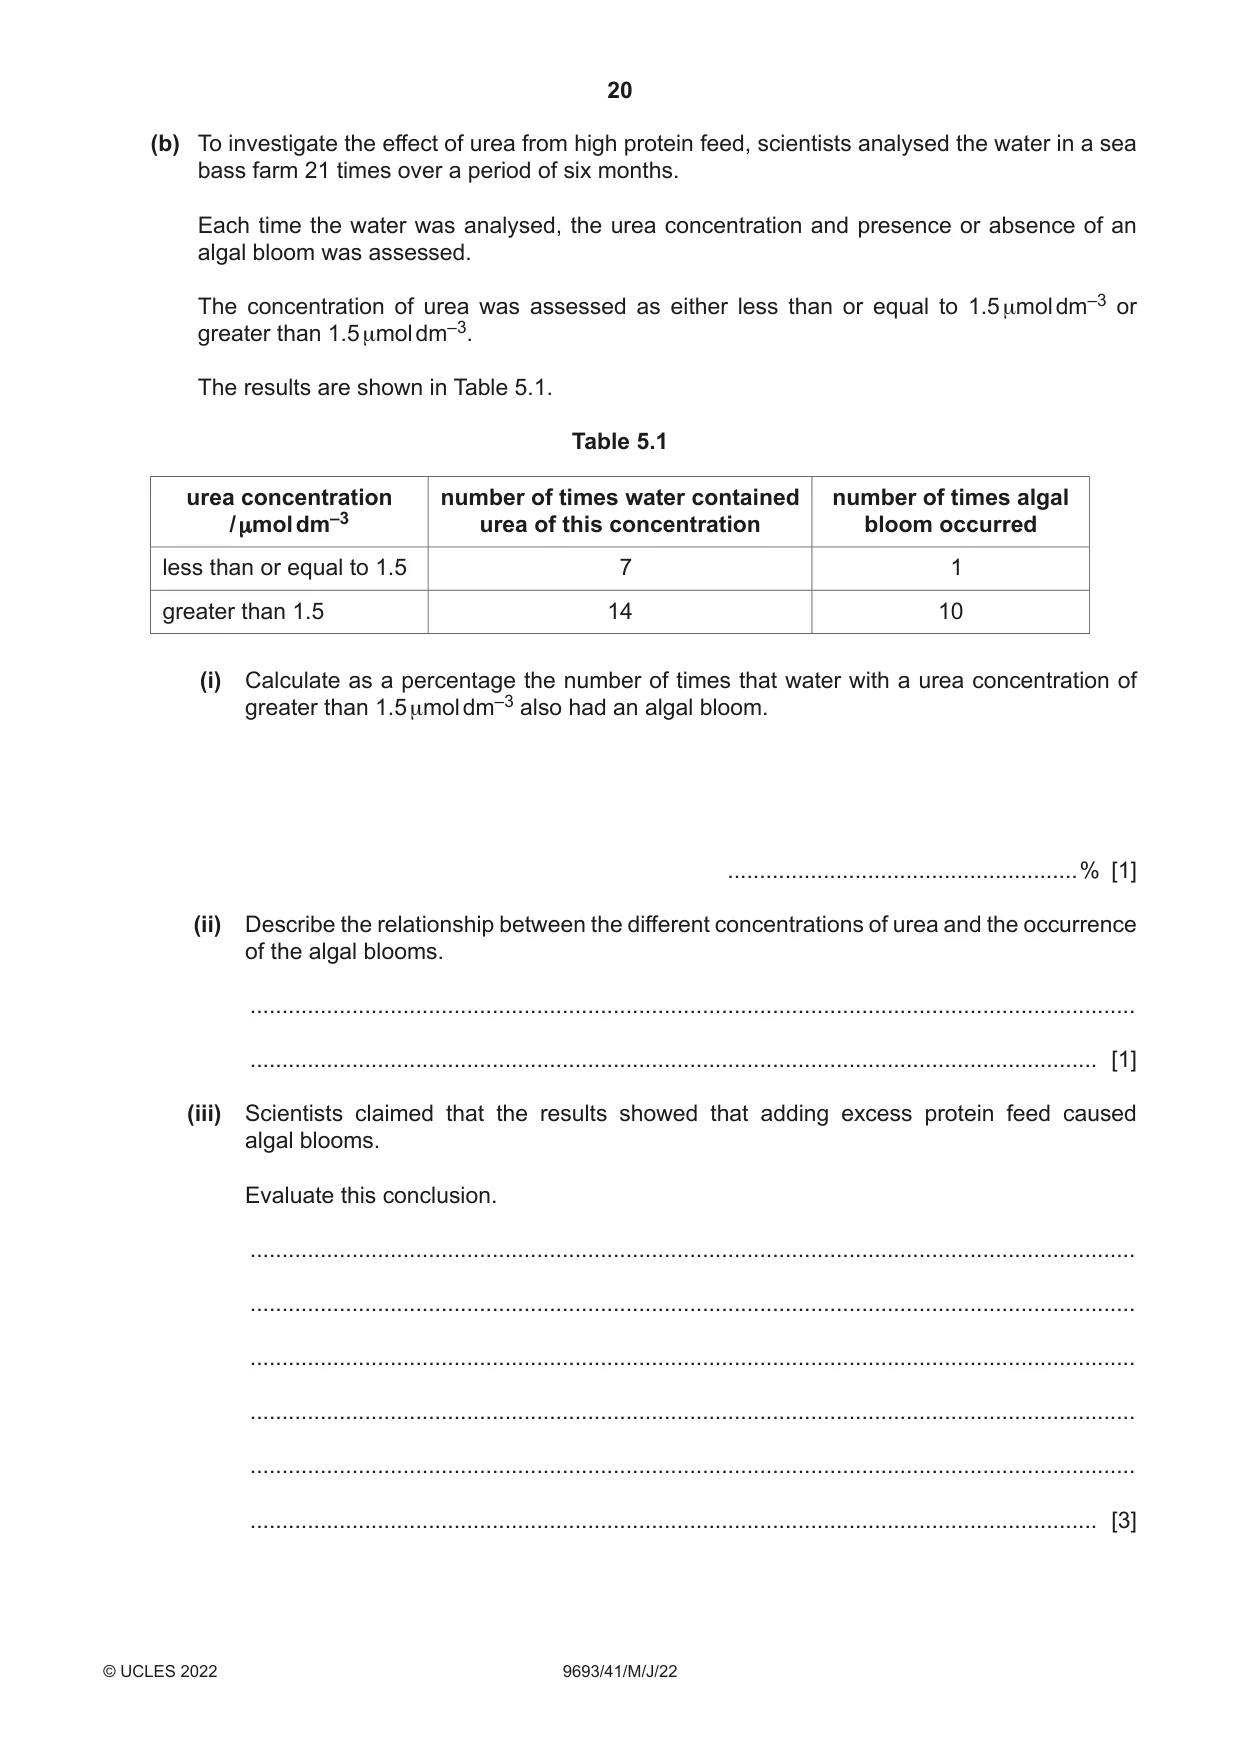
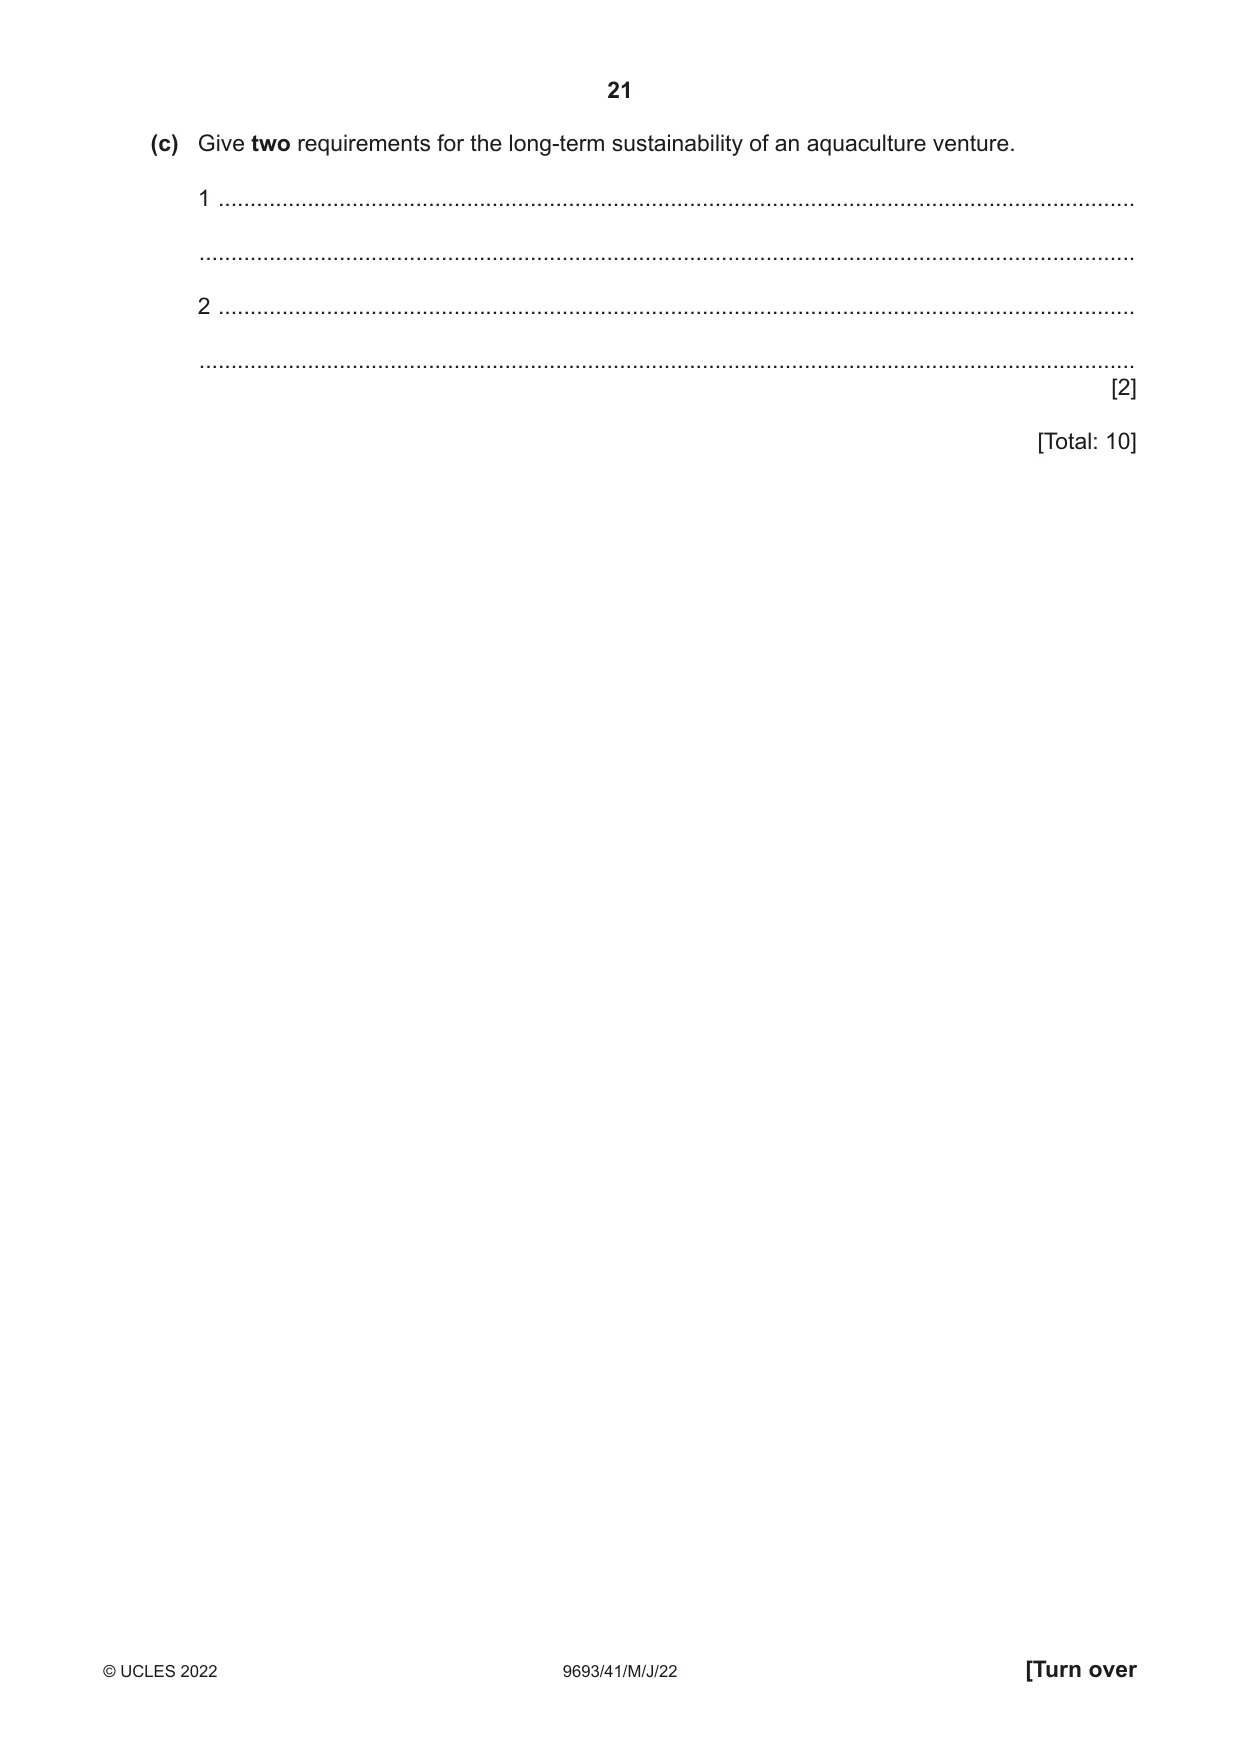
5 High protein feed is often used in aquaculture. It can cause the release of large quantities of urea into water. Urea is a nitrogen-containing compound that is excreted by many organisms and is also released from the breakdown of protein by decomposers. When urea enters marine waters, it can affect the growth of dinoflagellates and other algae. (a) Fig. 5.1 shows a light micrograph of a dinoflagellate. Fig. 5.1 Make a large drawing of the dinoflagellate in Fig. 5.1. Do not label or shade your diagram. [3] (b) To investigate the effect of urea from high protein feed, scientists analysed the water in a sea bass farm 21 times over a period of six months. Each time the water was analysed, the urea concentration and presence or absence of an algal bloom was assessed. The concentration of urea was assessed as either less than or equal to 1.5 μmol dm–3 or greater than 1.5 μmol dm–3. The results are shown in Table 5.1. Table 5.1 urea concentration number of times water contained number of times algal / μmol dm–3 urea of this concentration bloom occurred less than or equal to 1.5 7 1 greater than 1.5 14 10 (i) Calculate as a percentage the number of times that water with a urea concentration of greater than 1.5 μmol dm–3 also had an algal bloom. .......................................................% [1] (ii) Describe the relationship between the different concentrations of urea and the occurrence of the algal blooms. ........................................................................................................................................... ..................................................................................................................................... [1] (iii) Scientists claimed that the results showed that adding excess protein feed caused algal blooms. Evaluate this conclusion. ........................................................................................................................................... ........................................................................................................................................... ........................................................................................................................................... ........................................................................................................................................... ........................................................................................................................................... ..................................................................................................................................... [3] (c) Give two requirements for the long-term sustainability of an aquaculture venture. 1 ................................................................................................................................................ ................................................................................................................................................... 2 ................................................................................................................................................ ................................................................................................................................................... [2] [Total: 10]
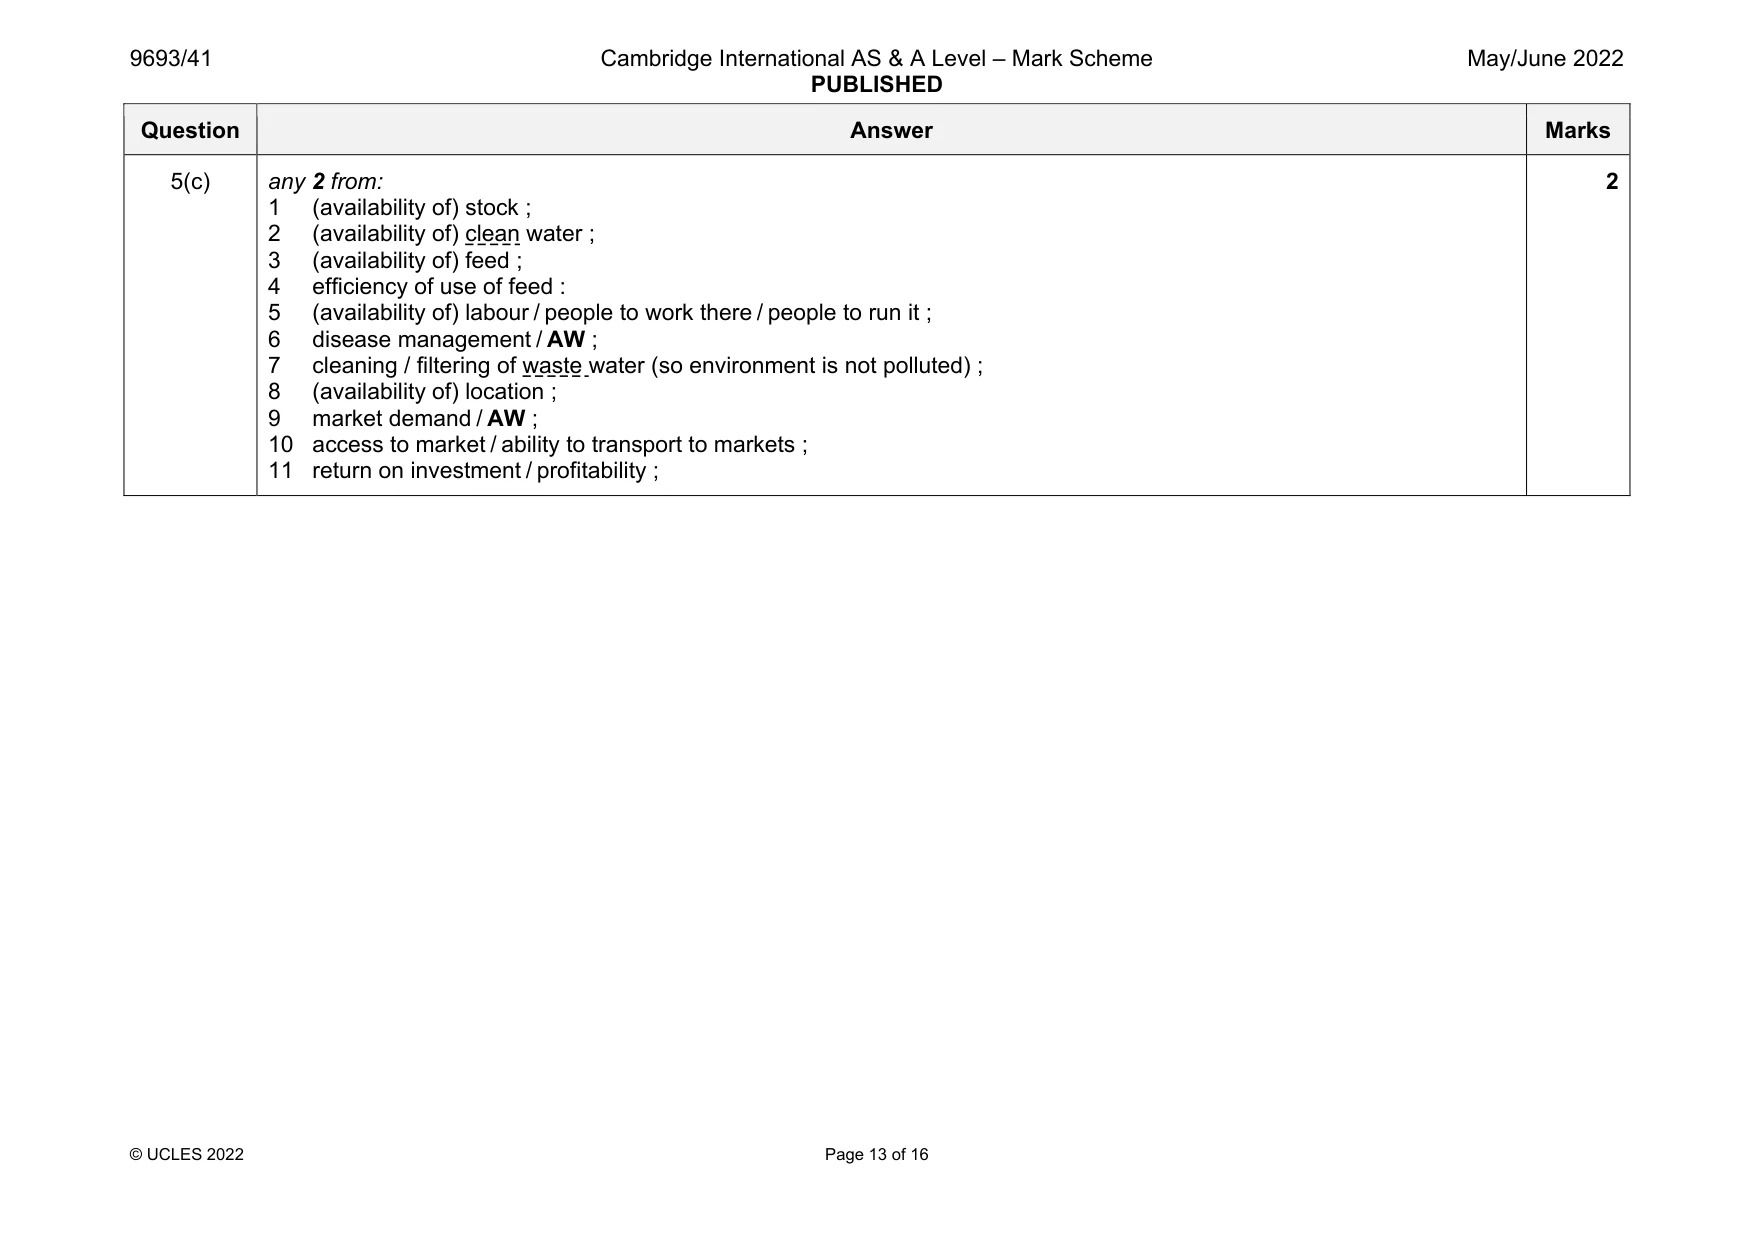
Mark scheme: 5(a) 1 clear, complete outline of structure with four ‘spikes’ and the flagellum and at least same size as photo ; 2 lines thin, continuous and no shading ; 3 correct proportions and angles of body, spikes and flagellum ; 3 5(b)(i) 71(.4…) (%) ; 1 5(b)(ii) any 1 from: 1 algal blooms are most likely to happen when the concentration is greater than 1.5 (mmol dm–3) / AW ; 2 correlation between urea concentration and chance of an algal bloom ; 3 as urea concentration increases there are more (algal) blooms / AW ; 1 5(b)(iii) 1 high protein / feed, causes high urea concentrations / releases urea / causes organisms to release urea / AW ; 2 there are more blooms when urea (concentration) is higher / more / ORA ; max 2 from: 3 it is a correlation not causation ; 4 other factors may cause the blooms ; 5 urea may not be from the protein feed / or from other sources ; 3 Question Answer Marks 5(c) any 2 from: 1 (availability of) stock ; 2 (availability of) clean water ; 3 (availability of) feed ; 4 efficiency of use of feed : 5 (availability of) labour / people to work there / people to run it ; 6 disease management / AW ; 7 cleaning / filtering of waste water (so environment is not polluted) ; 8 (availability of) location ; 9 market demand / AW ; 10 access to market / ability to transport to markets ; 11 return on investment / profitability ; 2
Q6 · Ammonium nitrate is commonly used as an agricultural fertiliser
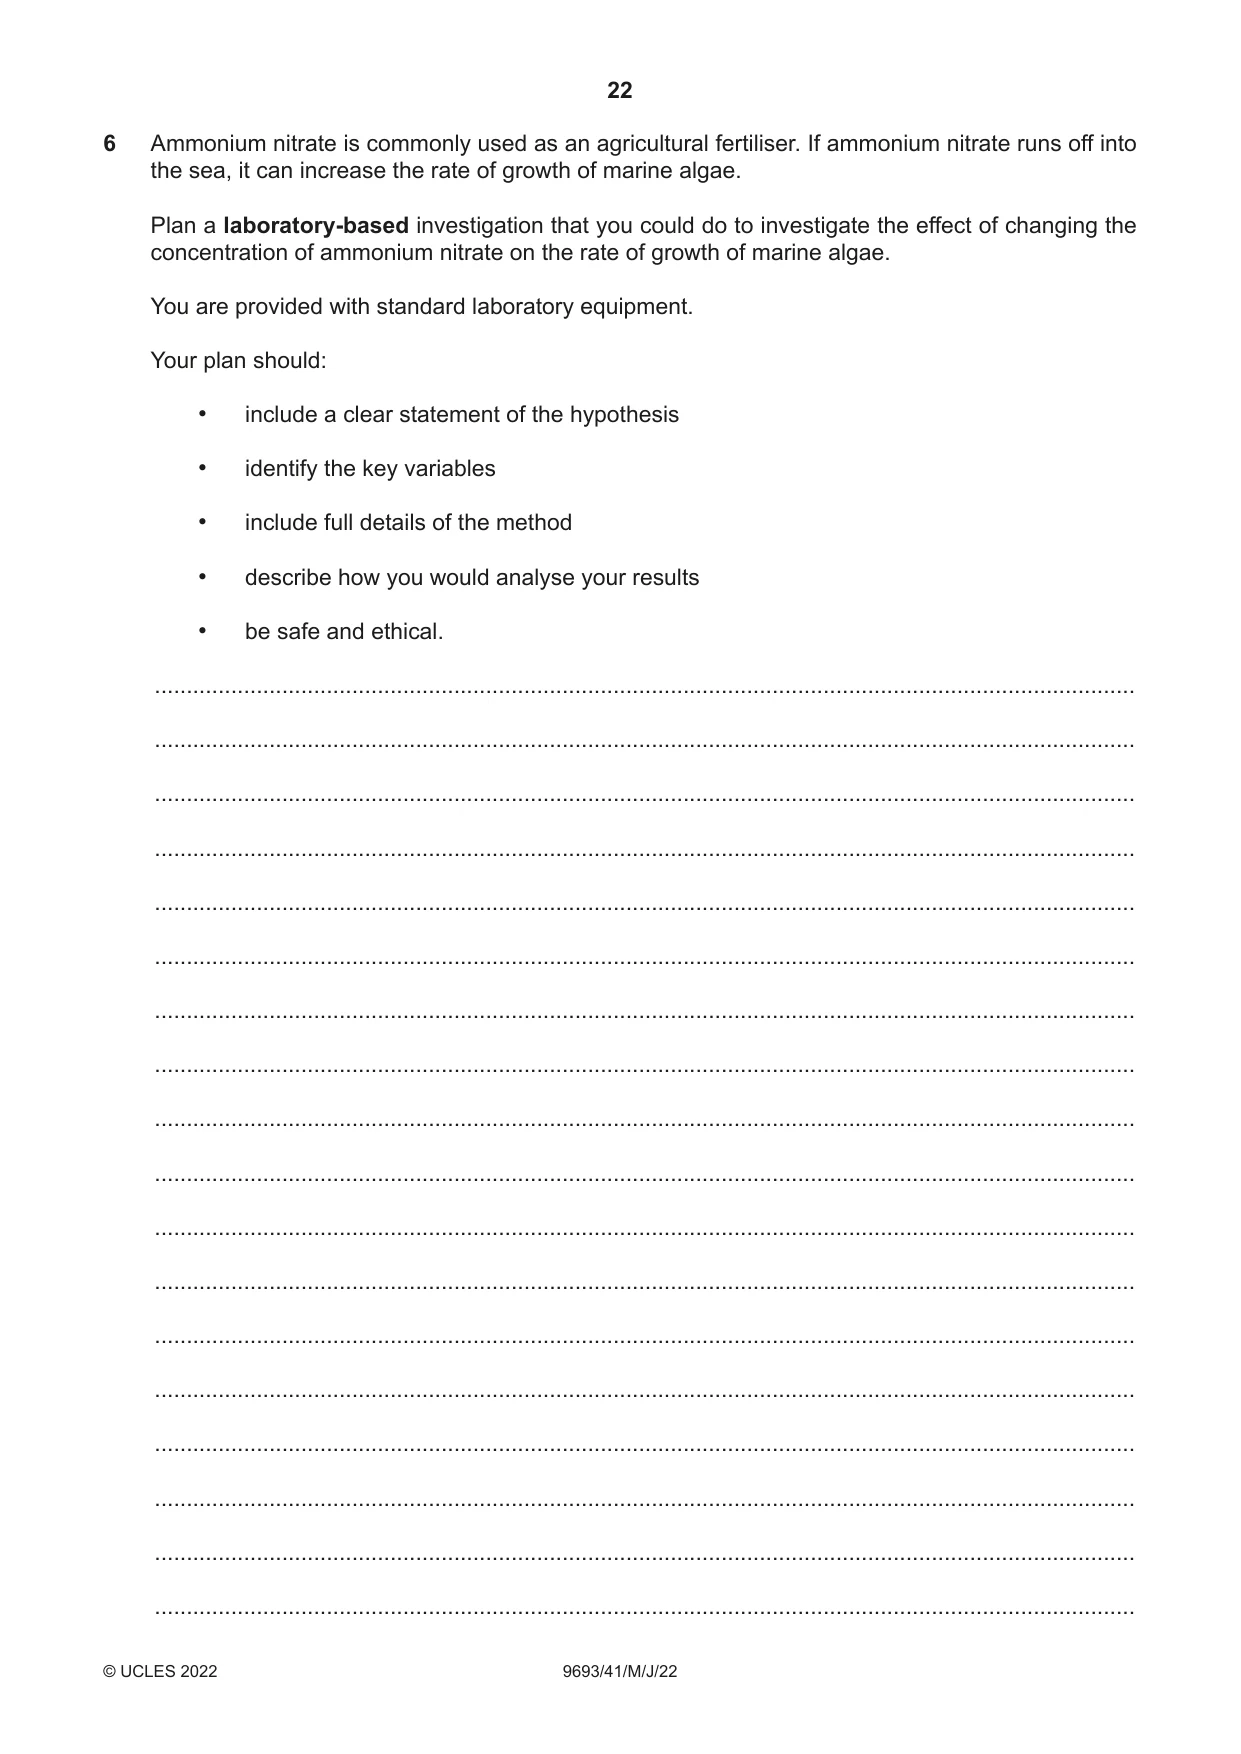
6 Ammonium nitrate is commonly used as an agricultural fertiliser. If ammonium nitrate runs off into the sea, it can increase the rate of growth of marine algae. Plan a laboratory-based investigation that you could do to investigate the effect of changing the concentration of ammonium nitrate on the rate of growth of marine algae. You are provided with standard laboratory equipment. Your plan should: • include a clear statement of the hypothesis • identify the key variables • include full details of the method • describe how you would analyse your results • be safe and ethical. .......................................................................................................................................................... .......................................................................................................................................................... .......................................................................................................................................................... .......................................................................................................................................................... .......................................................................................................................................................... .......................................................................................................................................................... .......................................................................................................................................................... .......................................................................................................................................................... .......................................................................................................................................................... .......................................................................................................................................................... .......................................................................................................................................................... .......................................................................................................................................................... .......................................................................................................................................................... .......................................................................................................................................................... .......................................................................................................................................................... .......................................................................................................................................................... .......................................................................................................................................................... .......................................................................................................................................................... .......................................................................................................................................................... .......................................................................................................................................................... .......................................................................................................................................................... .......................................................................................................................................................... .......................................................................................................................................................... .......................................................................................................................................................... .......................................................................................................................................................... .......................................................................................................................................................... .......................................................................................................................................................... .......................................................................................................................................................... .......................................................................................................................................................... .......................................................................................................................................................... .......................................................................................................................................................... .................................................................................................................................................. [12]
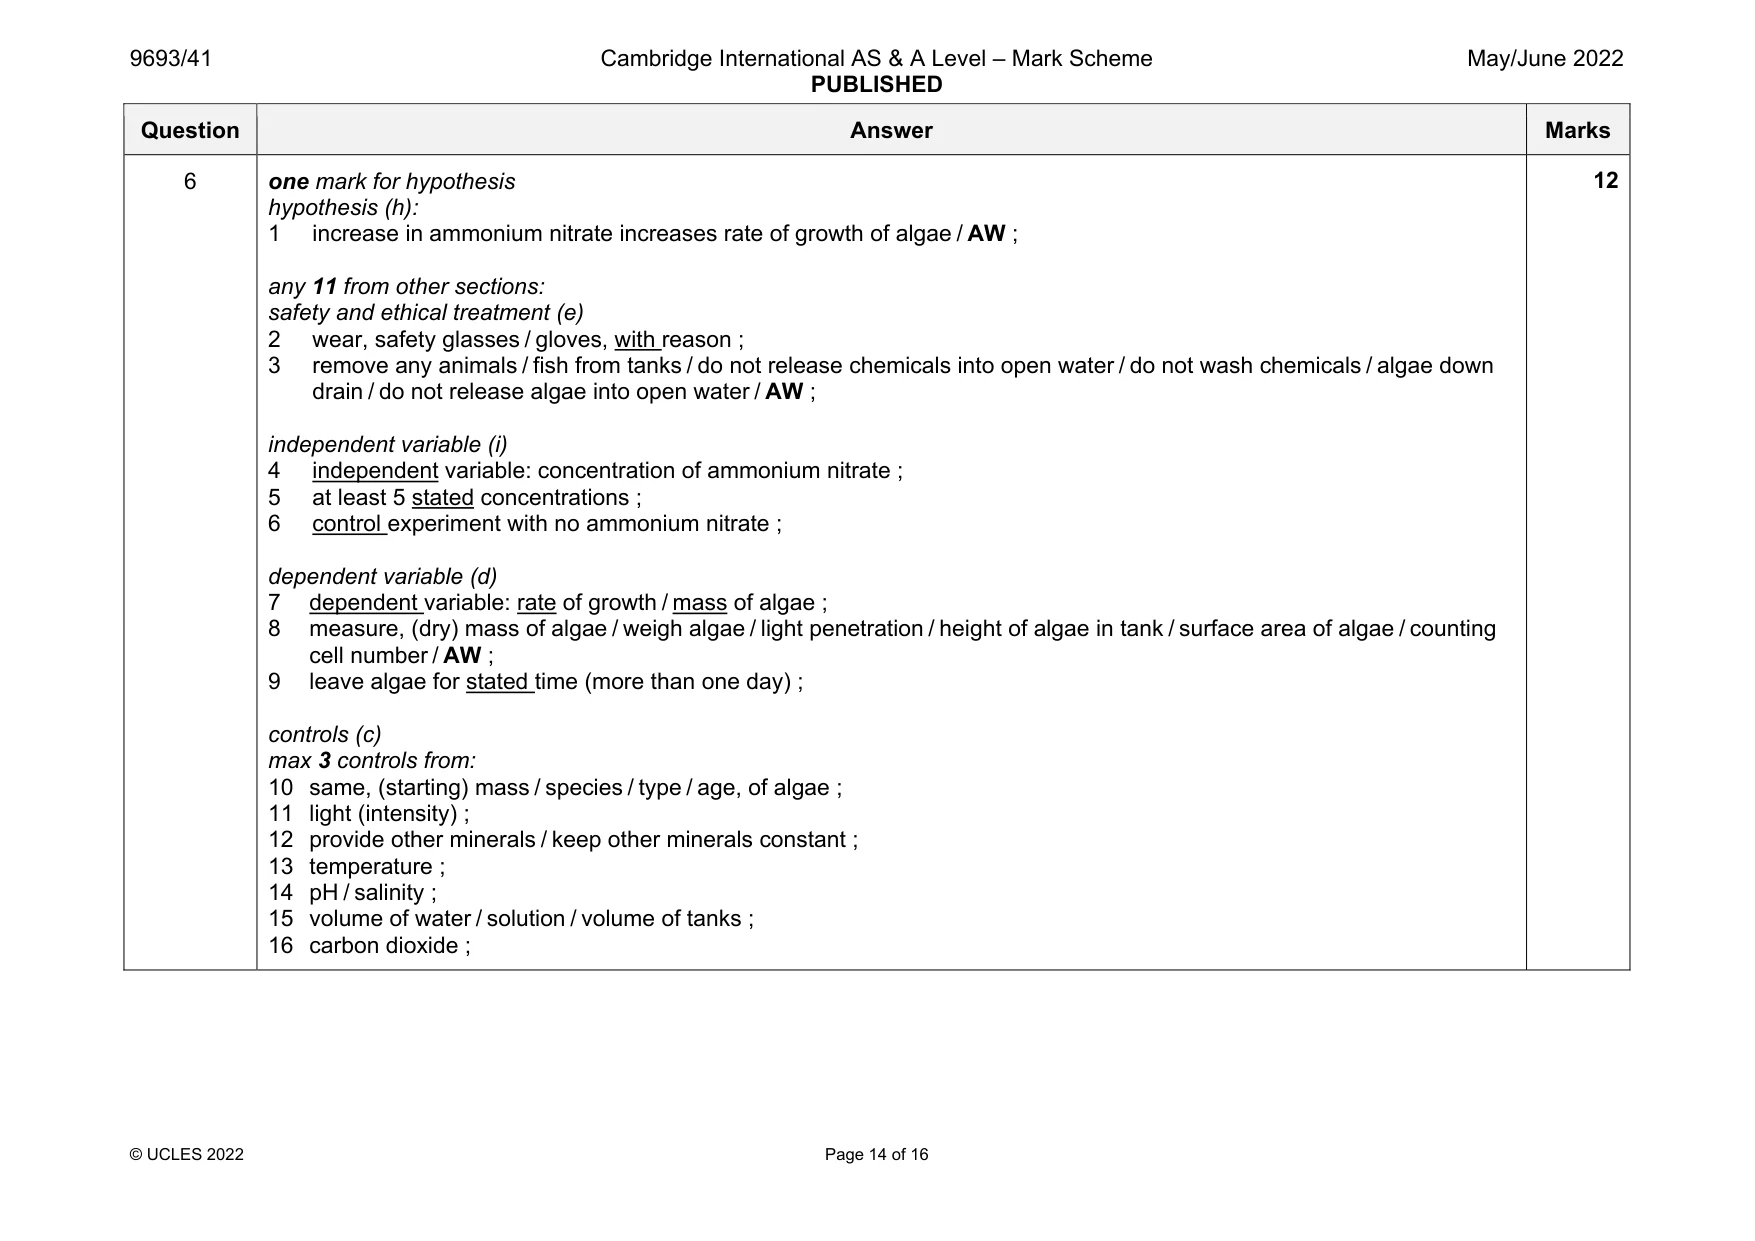
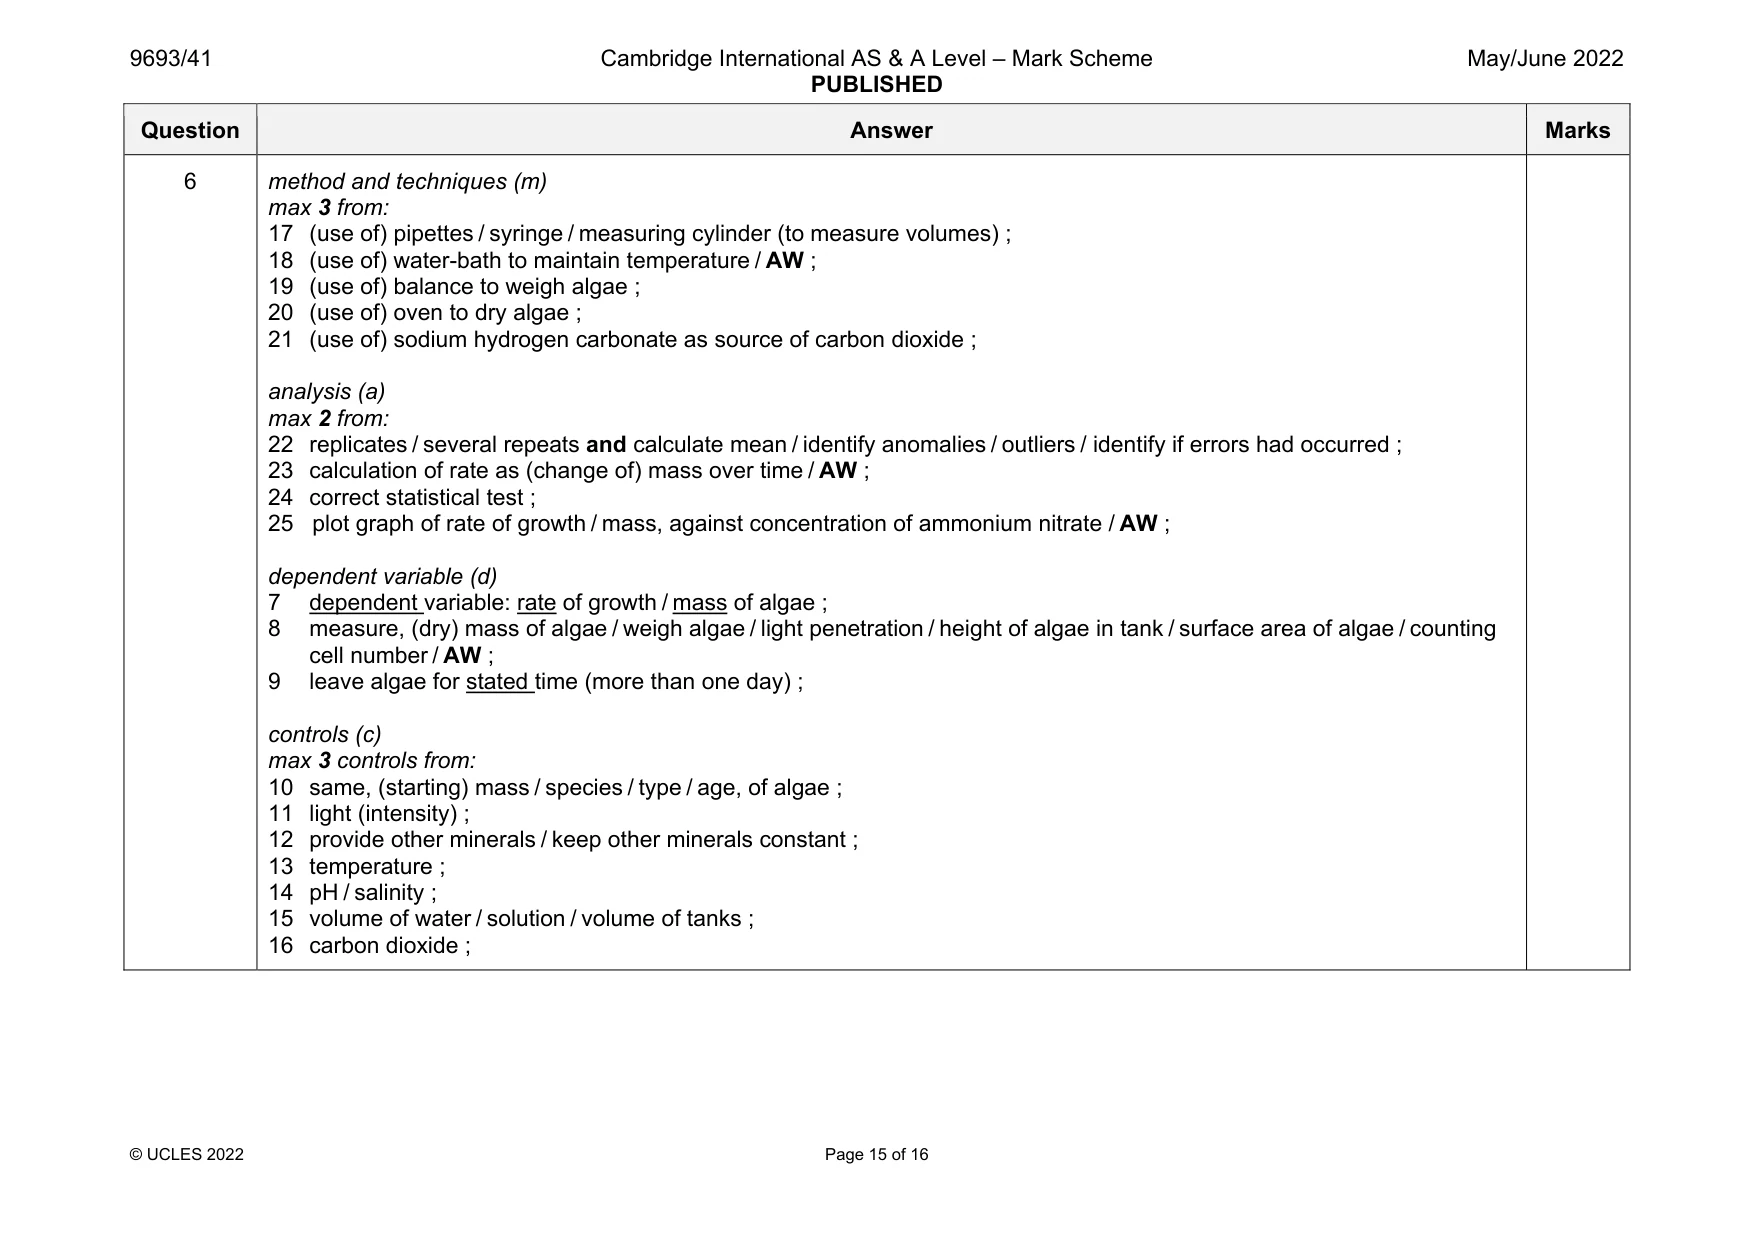
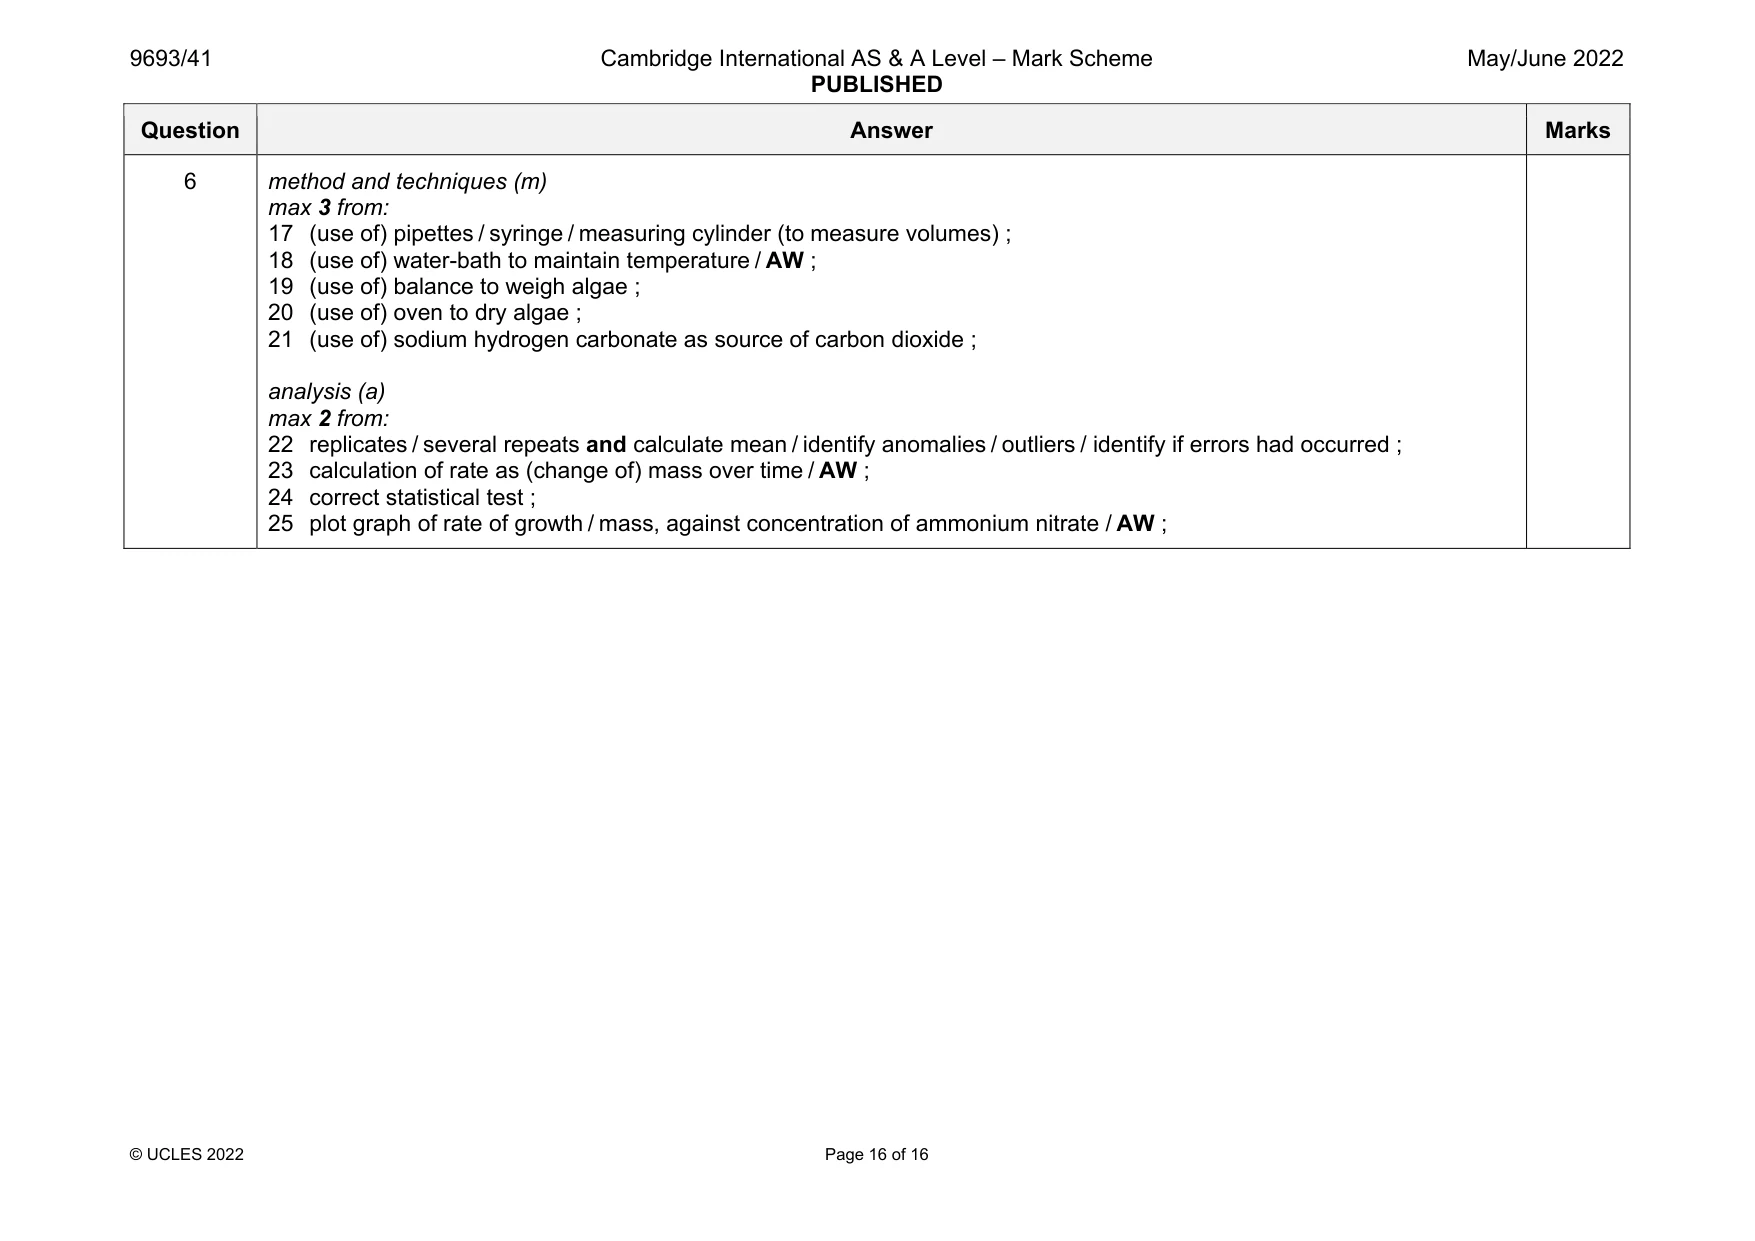
Mark scheme: 6 one mark for hypothesis hypothesis (h): 1 increase in ammonium nitrate increases rate of growth of algae / AW ; any 11 from other sections: safety and ethical treatment (e) 2 wear, safety glasses / gloves, with reason ; 3 remove any animals / fish from tanks / do not release chemicals into open water / do not wash chemicals / algae down drain / do not release algae into open water / AW ; independent variable (i) 4 independent variable: concentration of ammonium nitrate ; 5 at least 5 stated concentrations ; 6 control experiment with no ammonium nitrate ; dependent variable (d) 7 dependent variable: rate of growth / mass of algae ; 8 measure, (dry) mass of algae / weigh algae / light penetration / height of algae in tank / surface area of algae / counting cell number / AW ; 9 leave algae for stated time (more than one day) ; controls (c) max 3 controls from: 10 same, (starting) mass / species / type / age, of algae ; 11 light (intensity) ; 12 provide other minerals / keep other minerals constant ; 13 temperature ; 14 pH / salinity ; 15 volume of water / solution / volume of tanks ; 16 carbon dioxide ; Question Answer Marks 6 method and techniques (m) max 3 from: 17 (use of) pipettes / syringe / measuring cylinder (to measure volumes) ; 18 (use of) water-bath to maintain temperature / AW ; 19 (use of) balance to weigh algae ; 20 (use of) oven to dry algae ; 21 (use of) sodium hydrogen carbonate as source of carbon dioxide ; analysis (a) max 2 from: 22 replicates / several repeats and calculate mean / identify anomalies / outliers / identify if errors had occurred ; 23 calculation of rate as (change of) mass over time / AW ; 24 correct statistical test ; 25 plot graph of rate of growth / mass, against concentration of ammonium nitrate / AW ; dependent variable (d) 7 dependent variable: rate of growth / mass of algae ; 8 measure, (dry) mass of algae / weigh algae / light penetration / height of algae in tank / surface area of algae / counting cell number / AW ; 9 leave algae for stated time (more than one day) ; controls (c) max 3 controls from: 10 same, (starting) mass / species / type / age, of algae ; 11 light (intensity) ; 12 provide other minerals / keep other minerals constant ; 13 temperature ; 14 pH / salinity ; 15 volume of water / solution / volume of tanks ; 16 carbon dioxide ; Question Answer Marks 6 method and techniques (m) max 3 from: 17 (use of) pipettes / syringe / measuring cylinder (to measure volumes) ; 18 (use of) water-bath to maintain temperature / AW ; 19 (use of) balance to weigh algae ; 20 (use of) oven to dry algae ; 21 (use of) sodium hydrogen carbonate as source of carbon dioxide ; analysis (a) max 2 from: 22 replicates / several repeats and calculate mean / identify anomalies / outliers / identify if errors had occurred ; 23 calculation of rate as (change of) mass over time / AW ; 24 correct statistical test ; 25 plot graph of rate of growth / mass, against concentration of ammonium nitrate / AW ;
What was in this paper
The subtopics covered by these 6 questions, and how many questions each got. Open one in a new tab to see every Cambridge question on it.
What you needed in this session
Cambridge’s own grade thresholds for 2022 May/June, Paper 4 · Variant 1. A higher threshold means an easier paper — the bar moves with how the cohort did.