Cambridge A Level Marine Science 9693 — 2024 Oct/Nov Paper 4 · Variant 1
9693/41/O/N/24 · 5 questions · 75 marks · ≈84 min
The question paper and its mark scheme, free to read here and free to download. This is Cambridge’s own paper, exactly as it was sat.
Question paper20 pages

Mark scheme14 pages
Answers below. Sit the paper first if you are practising.
Questions as text
Q1 · Some barnacles and a dogwhelk on a rock
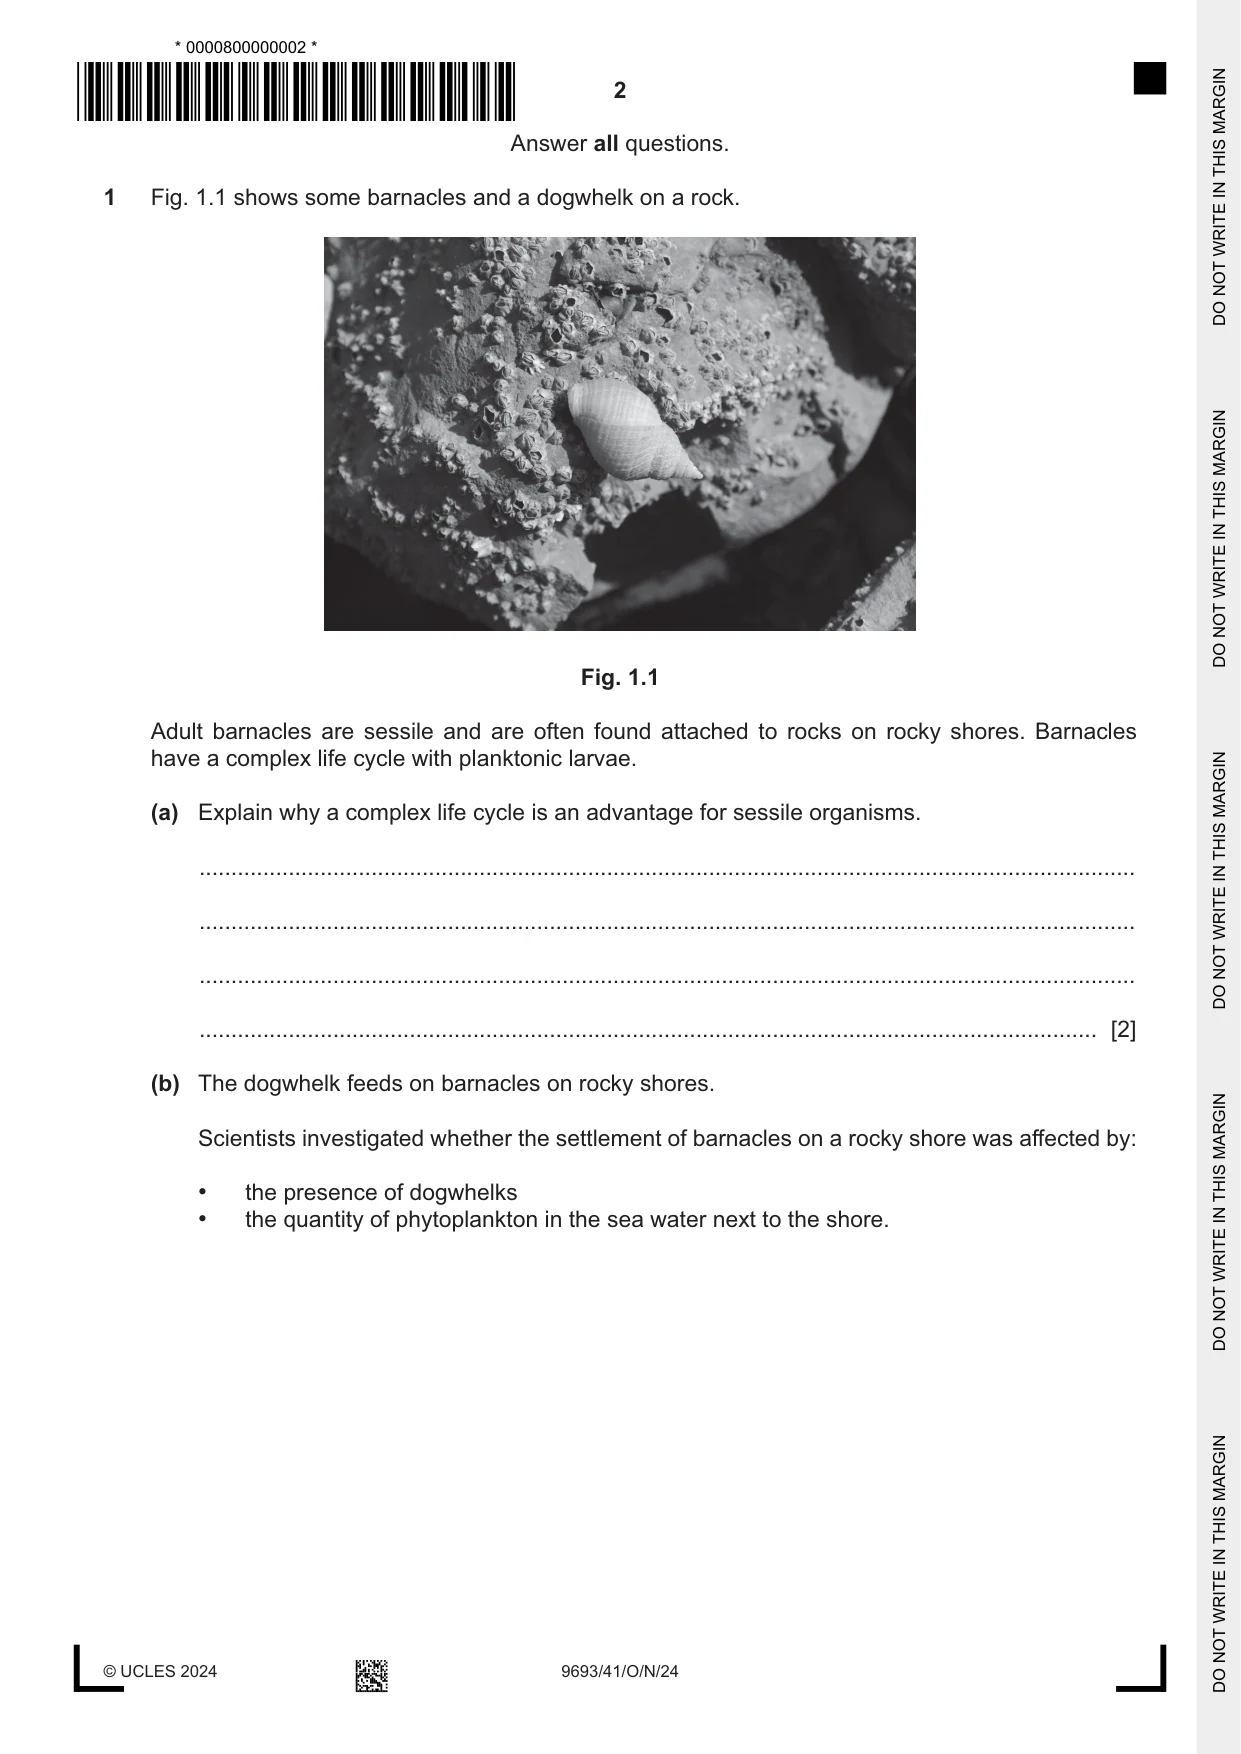
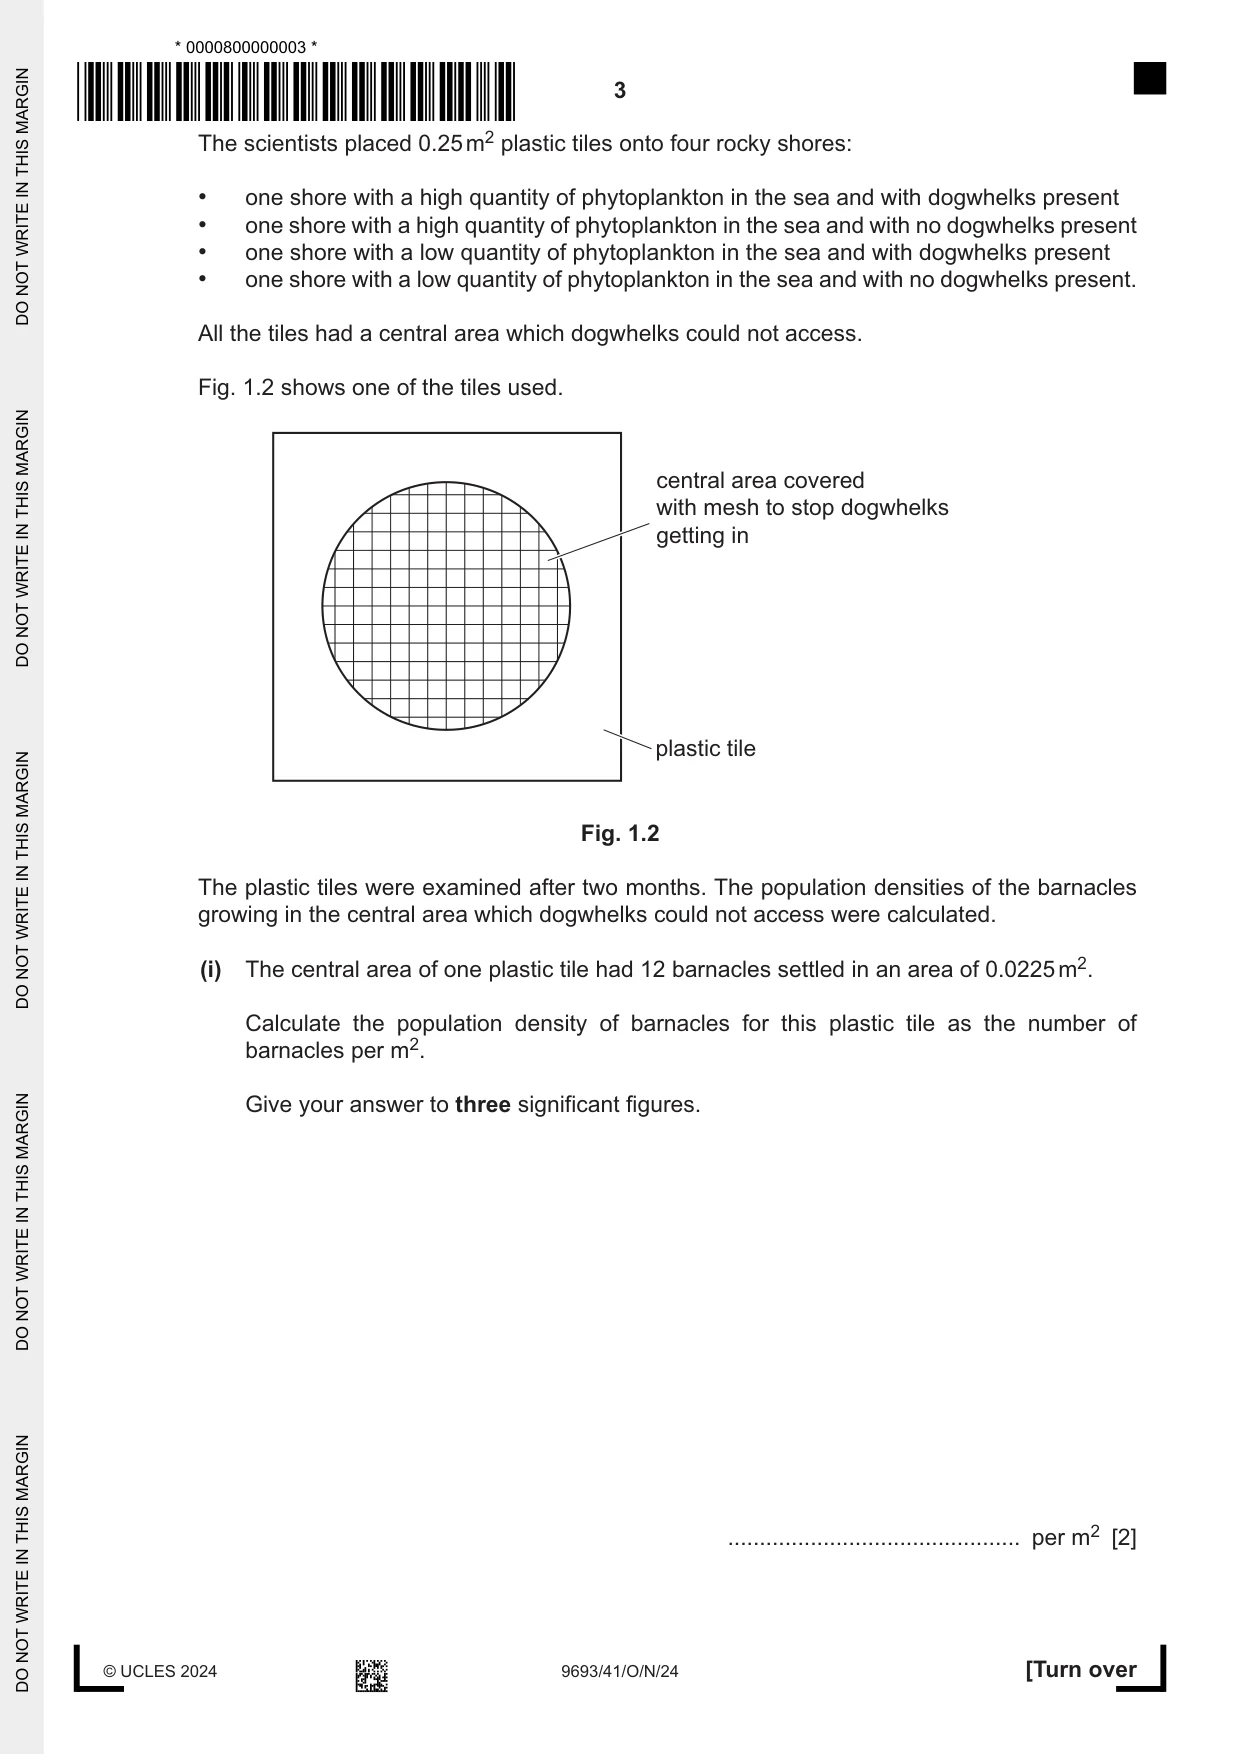
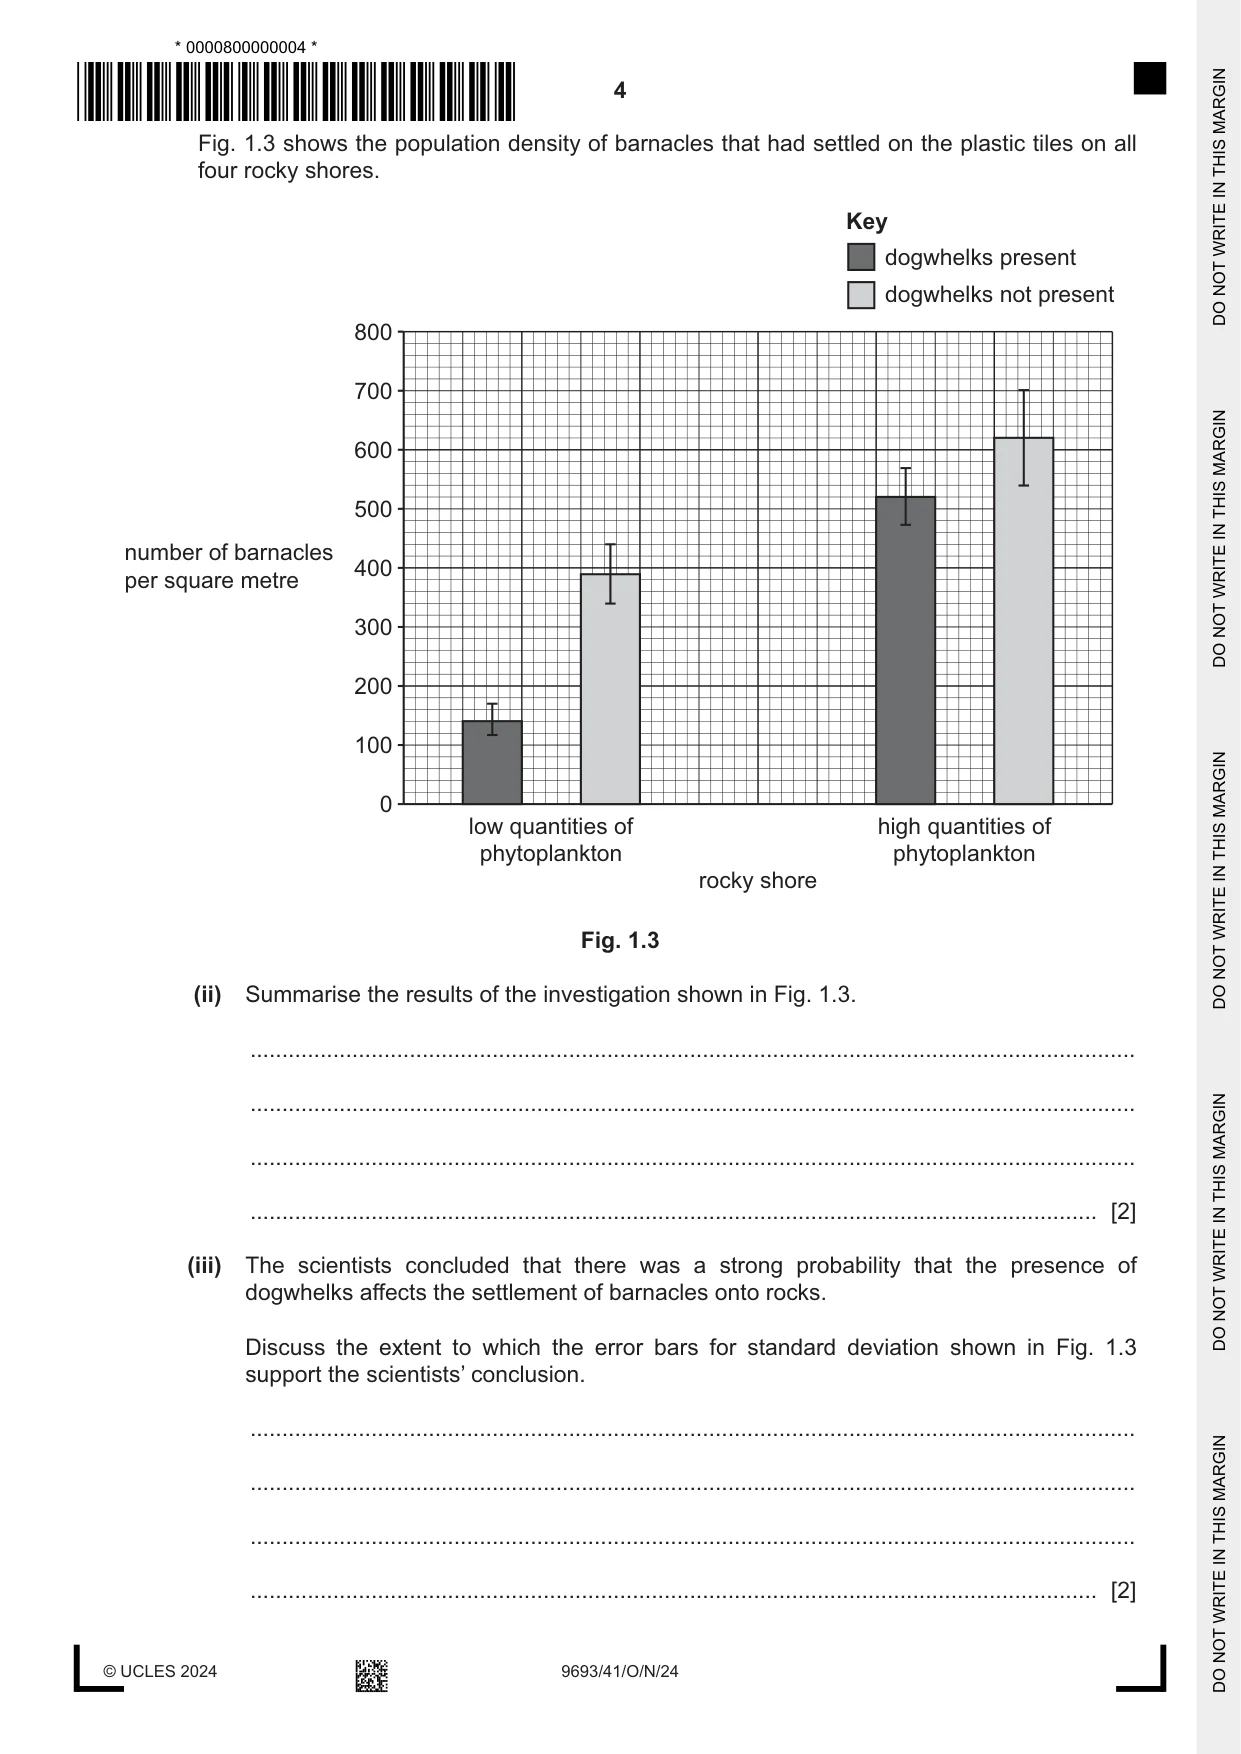
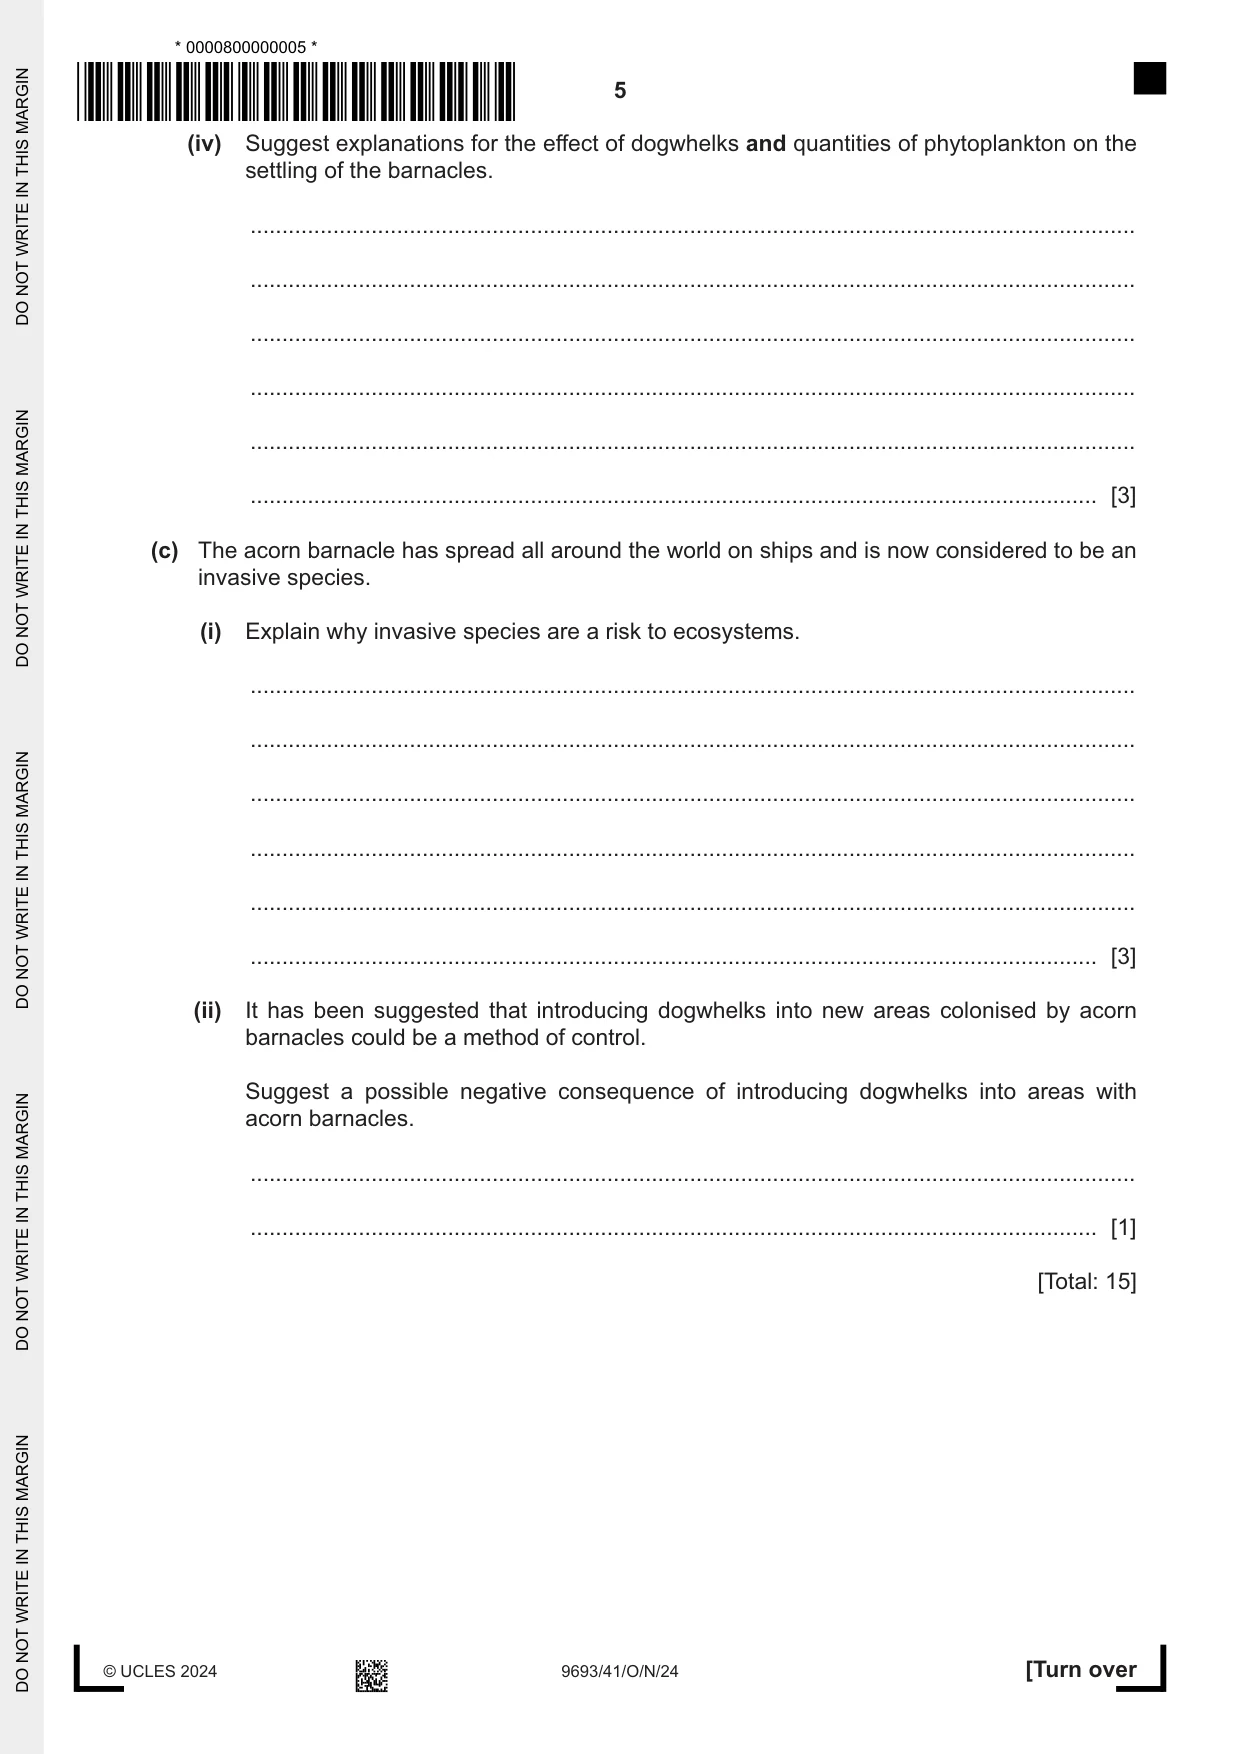
1 Fig. 1.1 shows some barnacles and a dogwhelk on a rock. Fig. 1.1 Adult barnacles are sessile and are often found attached to rocks on rocky shores. Barnacles have a complex life cycle with planktonic larvae. (a) Explain why a complex life cycle is an advantage for sessile organisms. ................................................................................................................................................... ................................................................................................................................................... ................................................................................................................................................... ............................................................................................................................................. [2] (b) The dogwhelk feeds on barnacles on rocky shores. Scientists investigated whether the settlement of barnacles on a rocky shore was affected by: • the presence of dogwhelks • the quantity of phytoplankton in the sea water next to the shore. The scientists placed 0.25 m2 plastic tiles onto four rocky shores: • one shore with a high quantity of phytoplankton in the sea and with dogwhelks present • one shore with a high quantity of phytoplankton in the sea and with no dogwhelks present • one shore with a low quantity of phytoplankton in the sea and with dogwhelks present • one shore with a low quantity of phytoplankton in the sea and with no dogwhelks present. All the tiles had a central area which dogwhelks could not access. Fig. 1.2 shows one of the tiles used. central area covered with mesh to stop dogwhelks getting in plastic tile Fig. 1.2 The plastic tiles were examined after two months. The population densities of the barnacles growing in the central area which dogwhelks could not access were calculated. (i) The central area of one plastic tile had 12 barnacles settled in an area of 0.0225 m2. Calculate the population density of barnacles for this plastic tile as the number of barnacles per m2. Give your answer to three significant figures. .............................................. per m2 [2] Fig. 1.3 shows the population density of barnacles that had settled on the plastic tiles on all four rocky shores. Key dogwhelks present dogwhelks not present 800 700 600 500 number of barnacles 400 per square metre 300 200 100 0 low quantities of high quantities of phytoplankton phytoplankton rocky shore Fig. 1.3 (ii) Summarise the results of the investigation shown in Fig. 1.3. ........................................................................................................................................... ........................................................................................................................................... ........................................................................................................................................... ..................................................................................................................................... [2] (iii) The scientists concluded that there was a strong probability that the presence of dogwhelks affects the settlement of barnacles onto rocks. Discuss the extent to which the error bars for standard deviation shown in Fig. 1.3 support the scientists’ conclusion. ........................................................................................................................................... ........................................................................................................................................... ........................................................................................................................................... ..................................................................................................................................... [2] (iv) Suggest explanations for the effect of dogwhelks and quantities of phytoplankton on the settling of the barnacles. ........................................................................................................................................... ........................................................................................................................................... ........................................................................................................................................... ........................................................................................................................................... ........................................................................................................................................... ..................................................................................................................................... [3] (c) The acorn barnacle has spread all around the world on ships and is now considered to be an invasive species. (i) Explain why invasive species are a risk to ecosystems. ........................................................................................................................................... ........................................................................................................................................... ........................................................................................................................................... ........................................................................................................................................... ........................................................................................................................................... ..................................................................................................................................... [3] (ii) It has been suggested that introducing dogwhelks into new areas colonised by acorn barnacles could be a method of control. Suggest a possible negative consequence of introducing dogwhelks into areas with acorn barnacles. ........................................................................................................................................... ..................................................................................................................................... [1] [Total: 15]
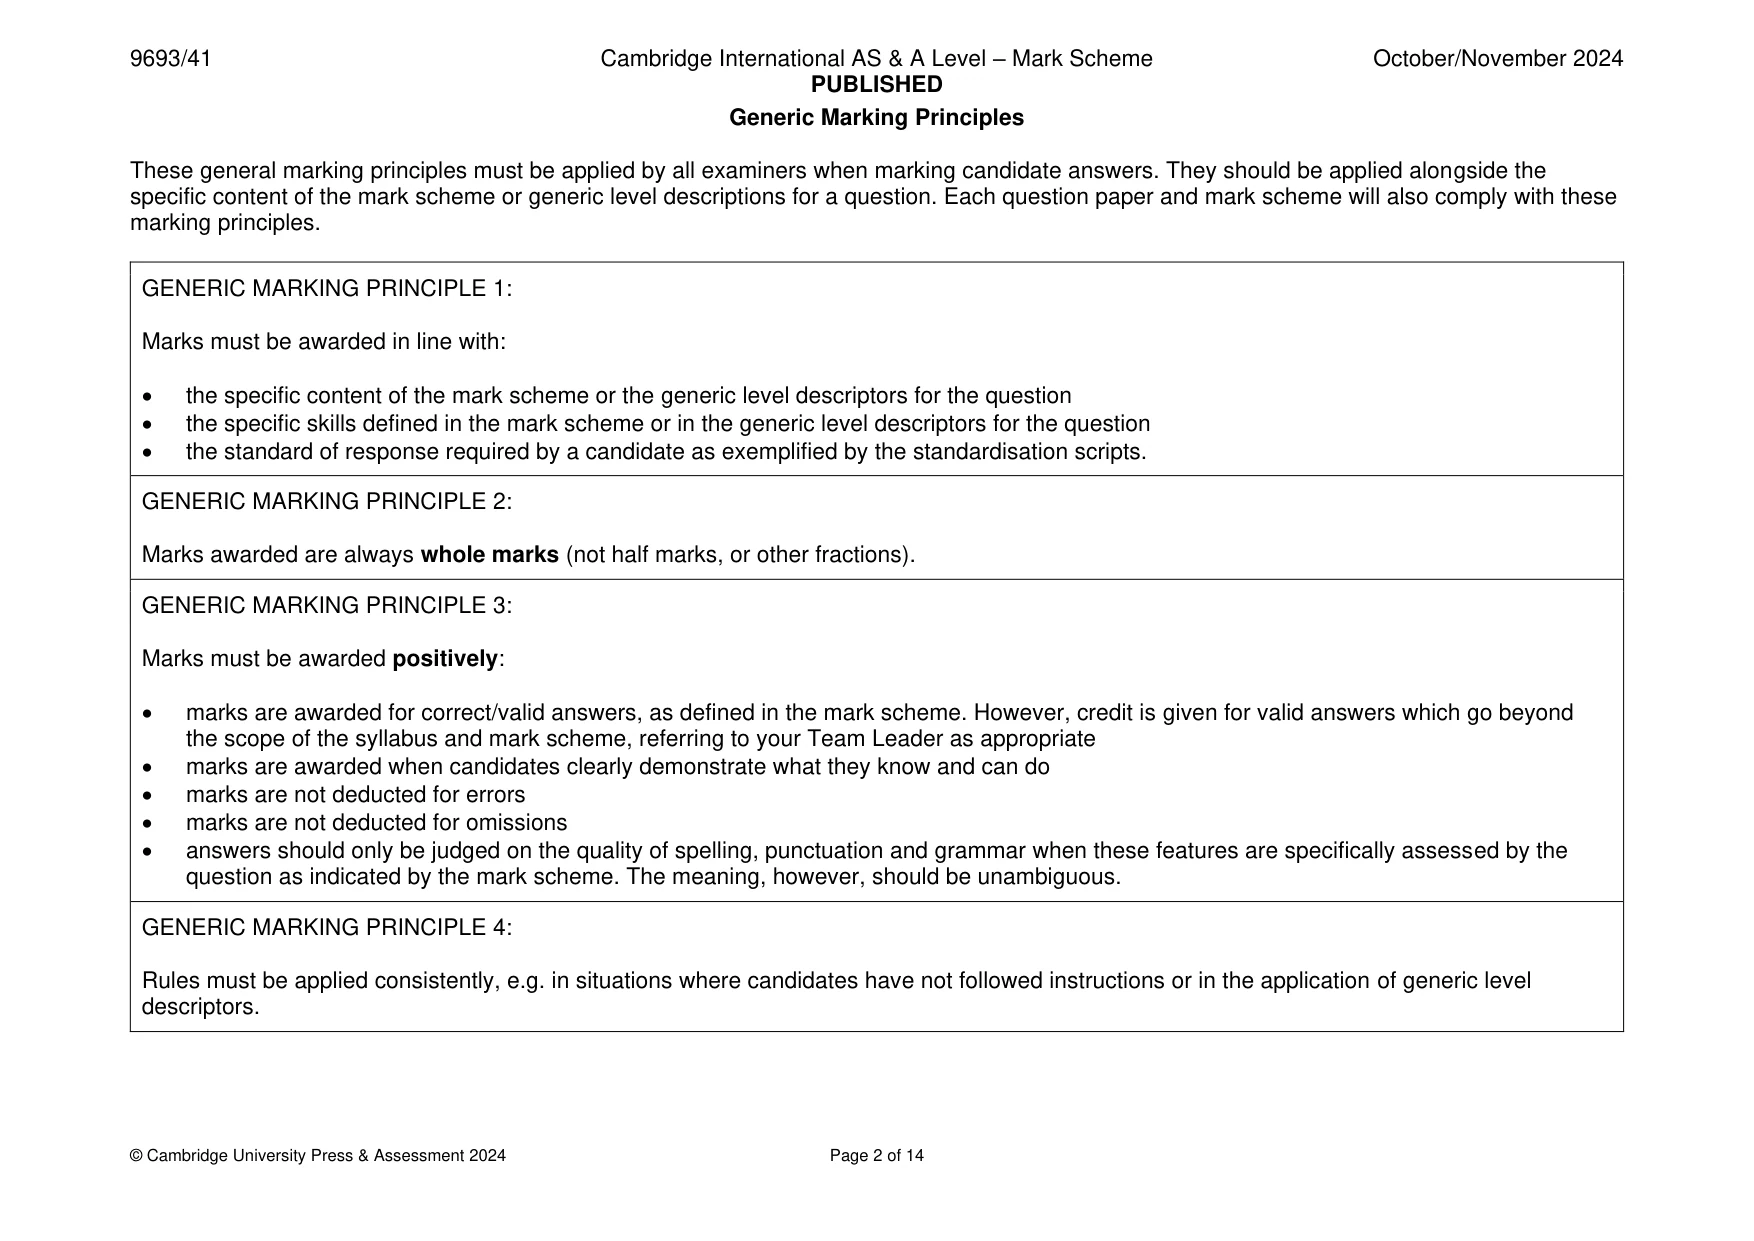
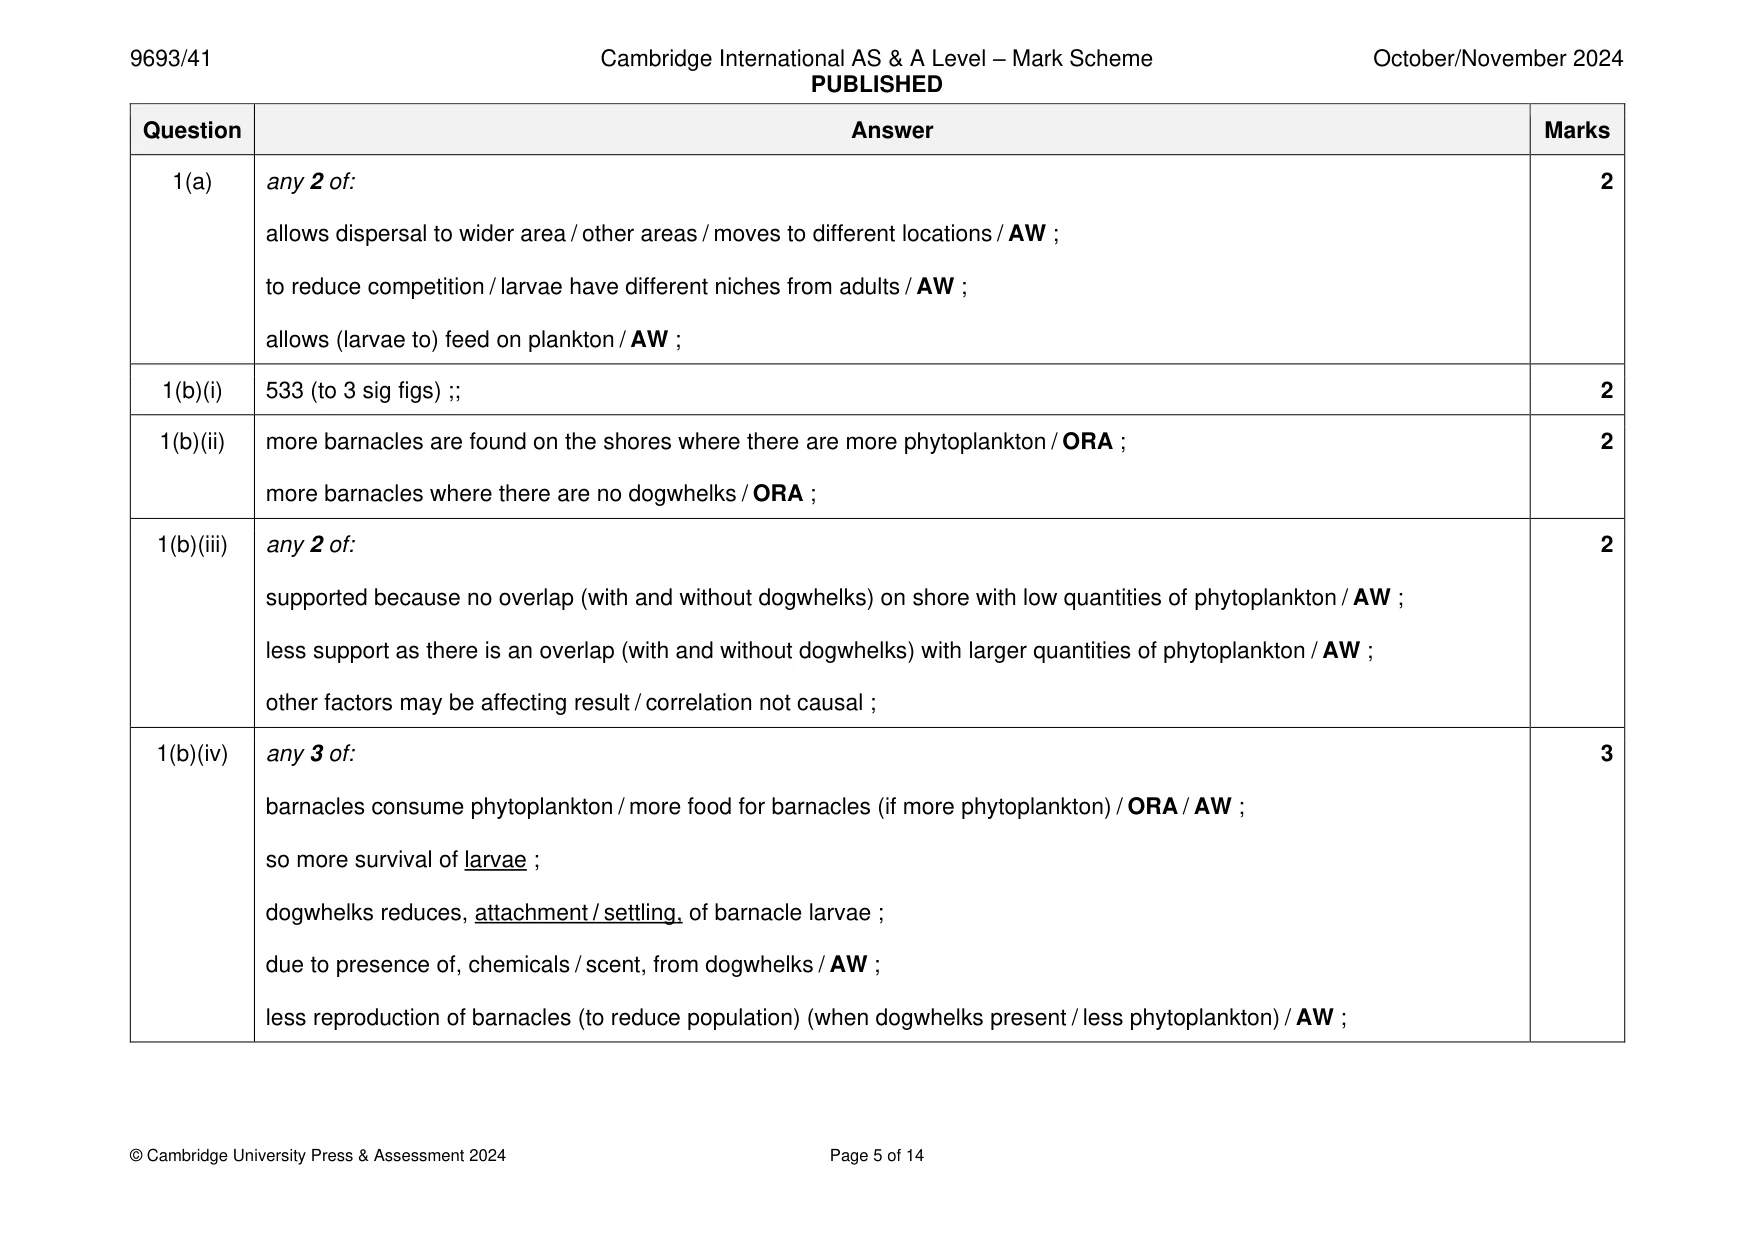
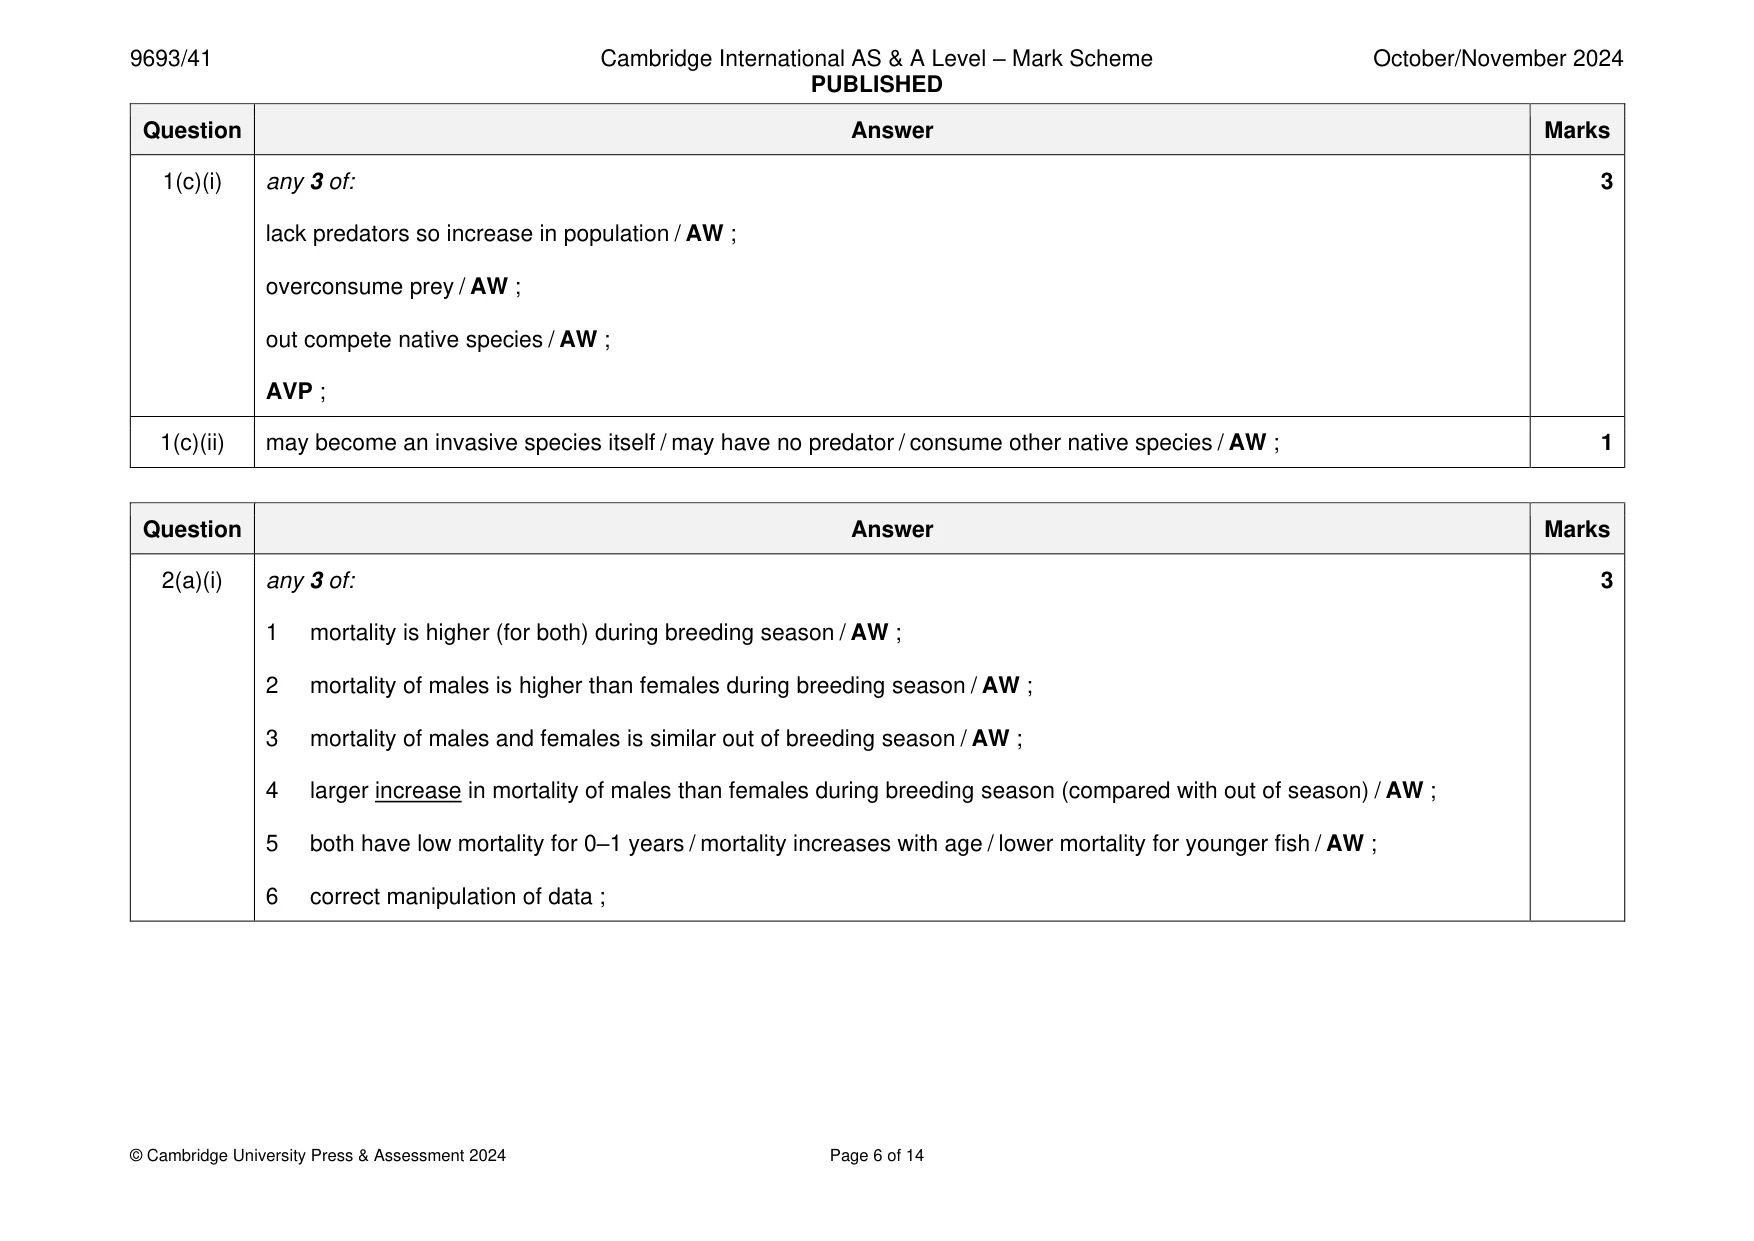
Mark scheme: Question Answer Marks 1(a) any 2 of: 2 allows dispersal to wider area / other areas / moves to different locations / AW ; to reduce competition / larvae have different niches from adults / AW ; allows (larvae to) feed on plankton / AW ; 1(b)(i) 533 (to 3 sig figs) ;; 2 1(b)(ii) more barnacles are found on the shores where there are more phytoplankton / ORA ; 2 more barnacles where there are no dogwhelks / ORA ; 1(b)(iii) any 2 of: 2 supported because no overlap (with and without dogwhelks) on shore with low quantities of phytoplankton / AW ; less support as there is an overlap (with and without dogwhelks) with larger quantities of phytoplankton / AW ; other factors may be affecting result / correlation not causal ; 1(b)(iv) any 3 of: 3 barnacles consume phytoplankton / more food for barnacles (if more phytoplankton) / ORA / AW ; so more survival of larvae ; dogwhelks reduces, attachment / settling, of barnacle larvae ; due to presence of, chemicals / scent, from dogwhelks / AW ; less reproduction of barnacles (to reduce population) (when dogwhelks present / less phytoplankton) / AW ; 1(c)(i) any 3 of: 3 lack predators so increase in population / AW ; overconsume prey / AW ; out compete native species / AW ; AVP ; 1(c)(ii) may become an invasive species itself / may have no predator / consume other native species / AW ; 1
Q2 · Plaice is a benthic flatfish caught by commercial fishing ships
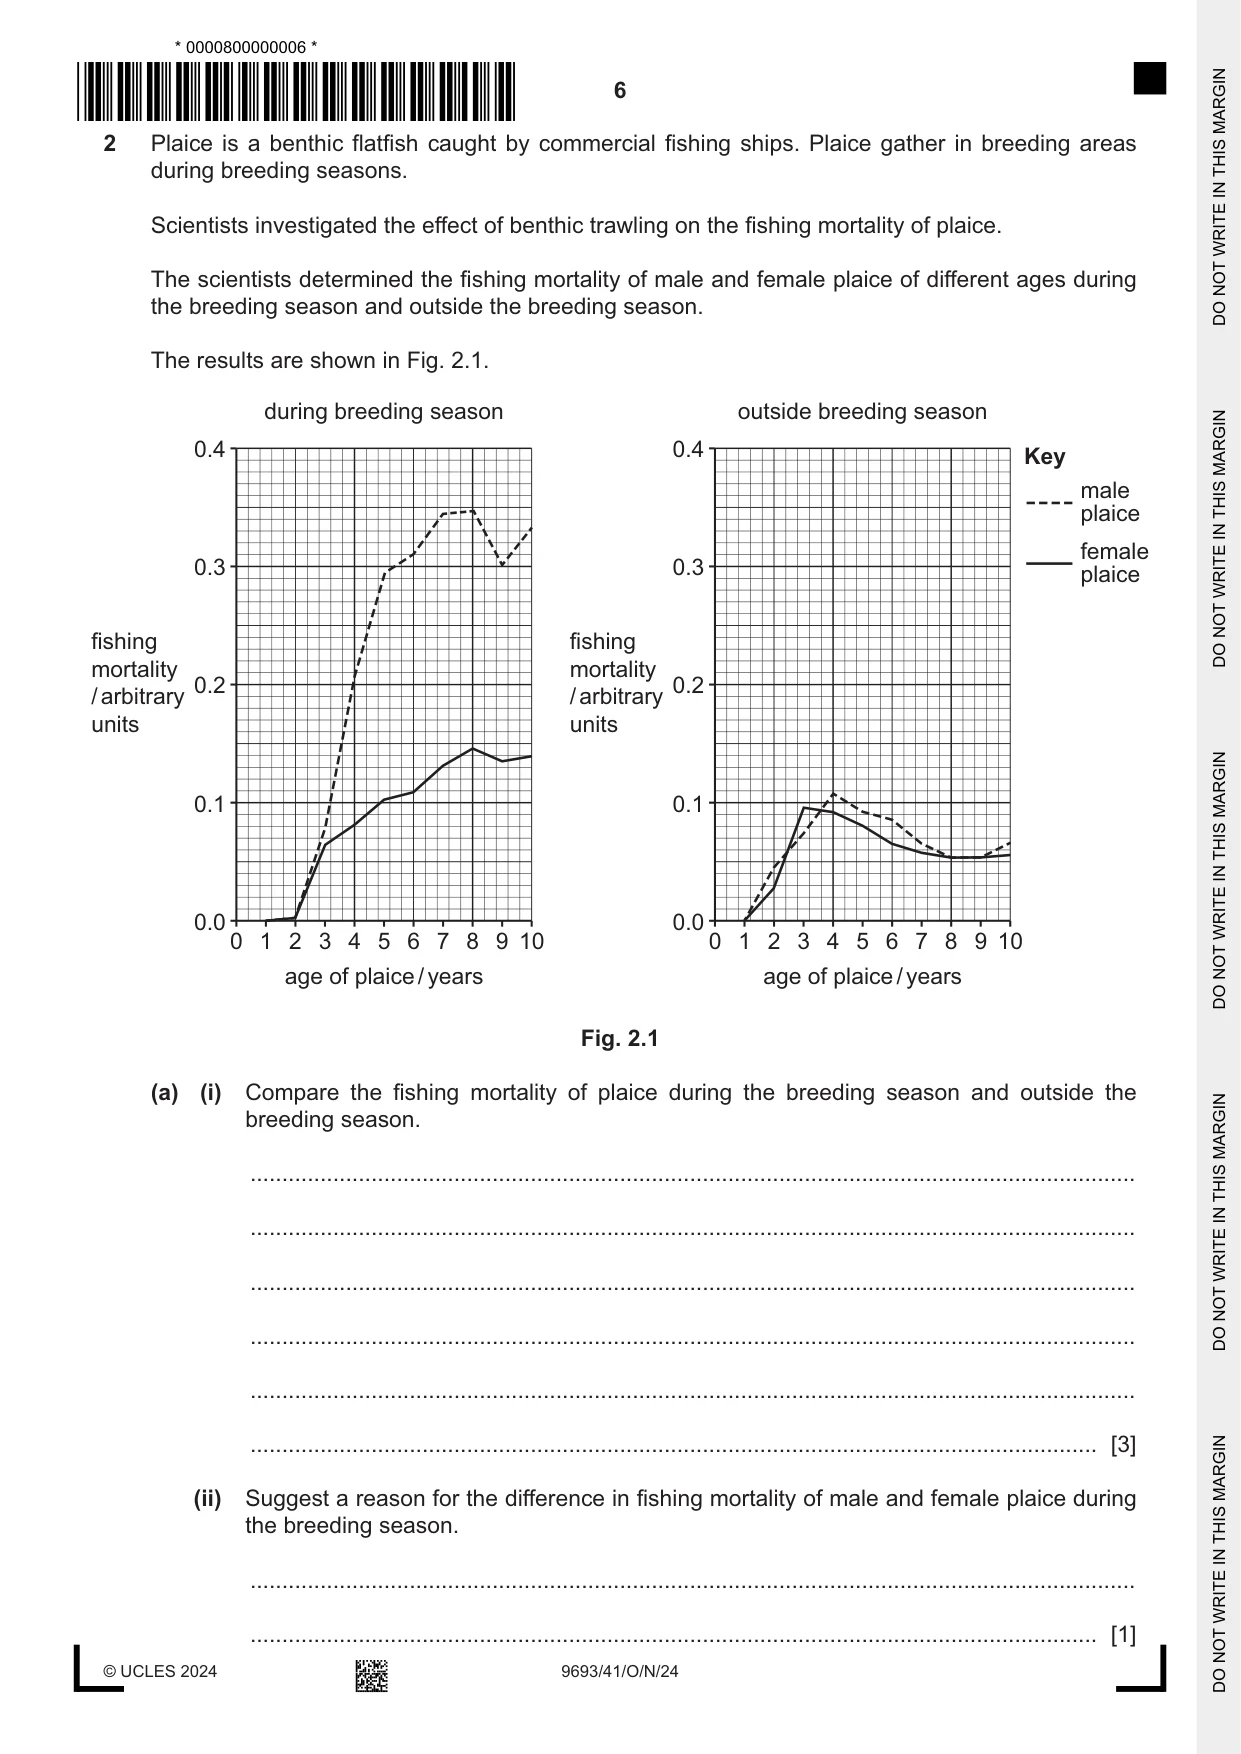
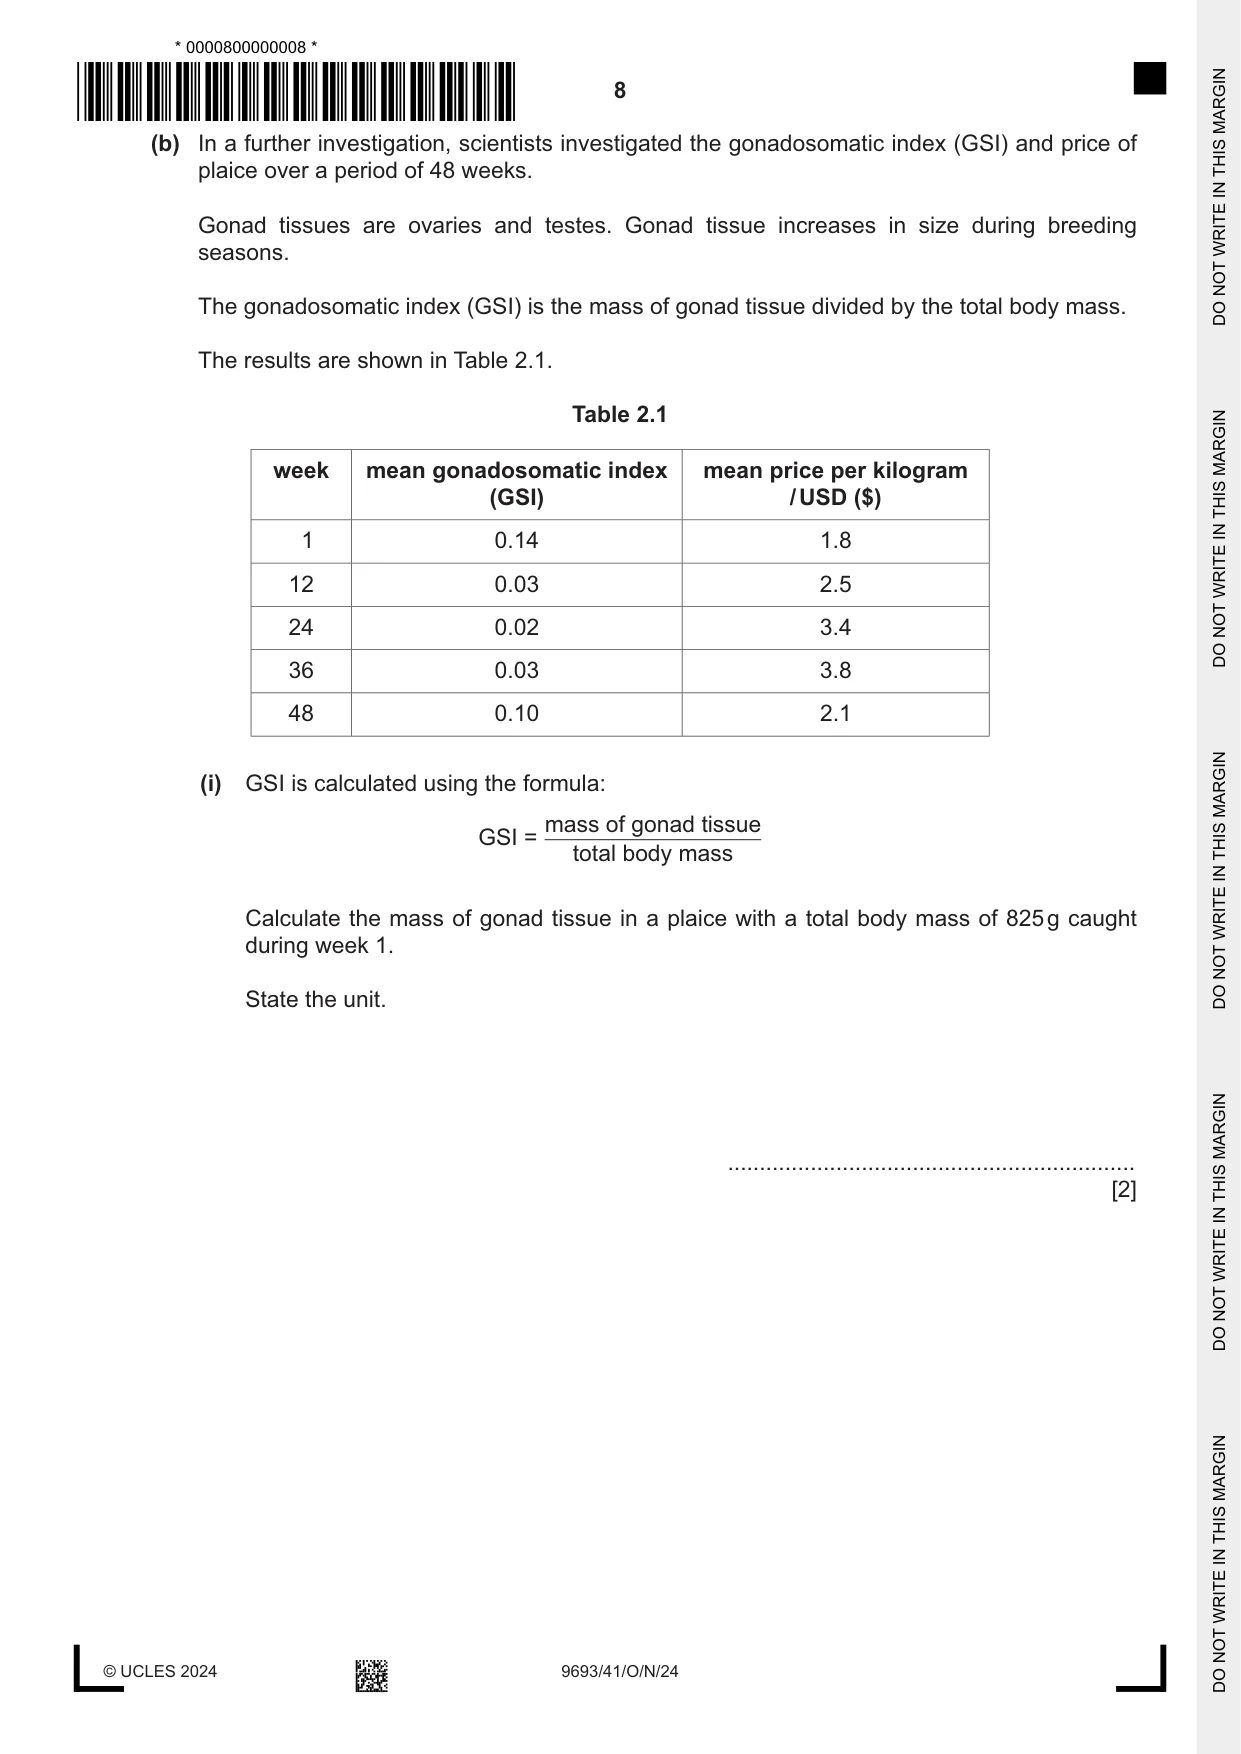
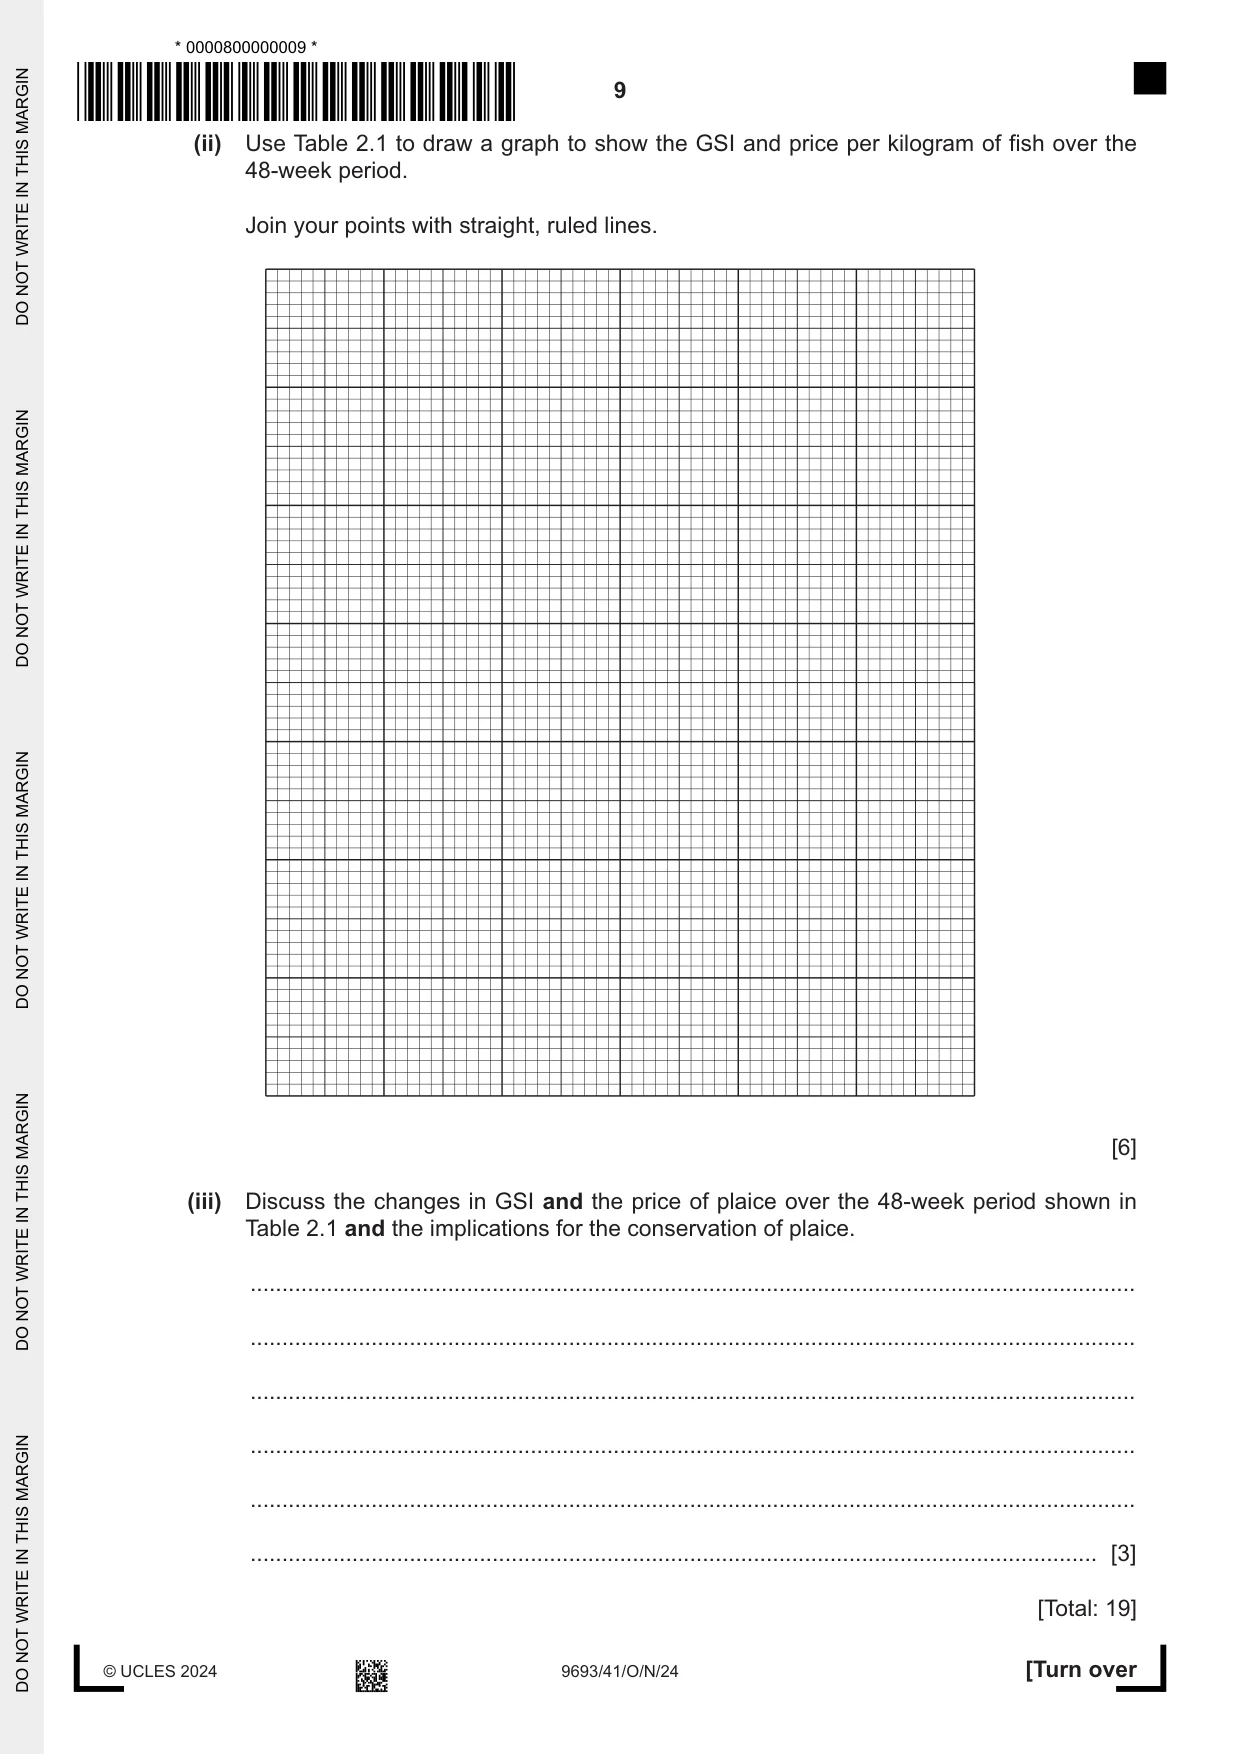
2 Plaice is a benthic flatfish caught by commercial fishing ships. Plaice gather in breeding areas during breeding seasons. Scientists investigated the effect of benthic trawling on the fishing mortality of plaice. The scientists determined the fishing mortality of male and female plaice of different ages during the breeding season and outside the breeding season. The results are shown in Fig. 2.1. during breeding season outside breeding season 0.4 0.4 Key male plaice female 0.3 0.3 plaice fishing fishing mortality mortality 0.2 0.2/ arbitrary / arbitrary units units 0.1 0.1 0.0 0.0 0 1 2 3 4 5 6 7 8 9 10 0 1 2 3 4 5 6 7 8 9 10 age of plaice / years age of plaice / years Fig. 2.1 (a) (i) Compare the fishing mortality of plaice during the breeding season and outside the breeding season. ........................................................................................................................................... ........................................................................................................................................... ........................................................................................................................................... ........................................................................................................................................... ........................................................................................................................................... ..................................................................................................................................... [3] (ii) Suggest a reason for the difference in fishing mortality of male and female plaice during the breeding season. ........................................................................................................................................... ..................................................................................................................................... [1] (iii) Suggest a reason for the difference in the fishing mortality of plaice during the breeding season and outside the breeding season. ........................................................................................................................................... ..................................................................................................................................... [1] (iv) Use Fig. 2.1 to explain why intensive harvesting of plaice during the breeding season would affect the sustainability of the population. ........................................................................................................................................... ........................................................................................................................................... ........................................................................................................................................... ........................................................................................................................................... ........................................................................................................................................... ..................................................................................................................................... [3] (b) In a further investigation, scientists investigated the gonadosomatic index (GSI) and price of plaice over a period of 48 weeks. Gonad tissues are ovaries and testes. Gonad tissue increases in size during breeding seasons. The gonadosomatic index (GSI) is the mass of gonad tissue divided by the total body mass. The results are shown in Table 2.1. Table 2.1 week mean gonadosomatic index mean price per kilogram (GSI) / USD ($) 1 0.14 1.8 12 0.03 2.5 24 0.02 3.4 36 0.03 3.8 48 0.10 2.1 (i) GSI is calculated using the formula: mass of gonad tissue GSI = total body mass Calculate the mass of gonad tissue in a plaice with a total body mass of 825 g caught during week 1. State the unit. ................................................................ [2] (ii) Use Table 2.1 to draw a graph to show the GSI and price per kilogram of fish over the 48-week period. Join your points with straight, ruled lines. [6] (iii) Discuss the changes in GSI and the price of plaice over the 48-week period shown in Table 2.1 and the implications for the conservation of plaice. ........................................................................................................................................... ........................................................................................................................................... ........................................................................................................................................... ........................................................................................................................................... ........................................................................................................................................... ..................................................................................................................................... [3] [Total: 19]
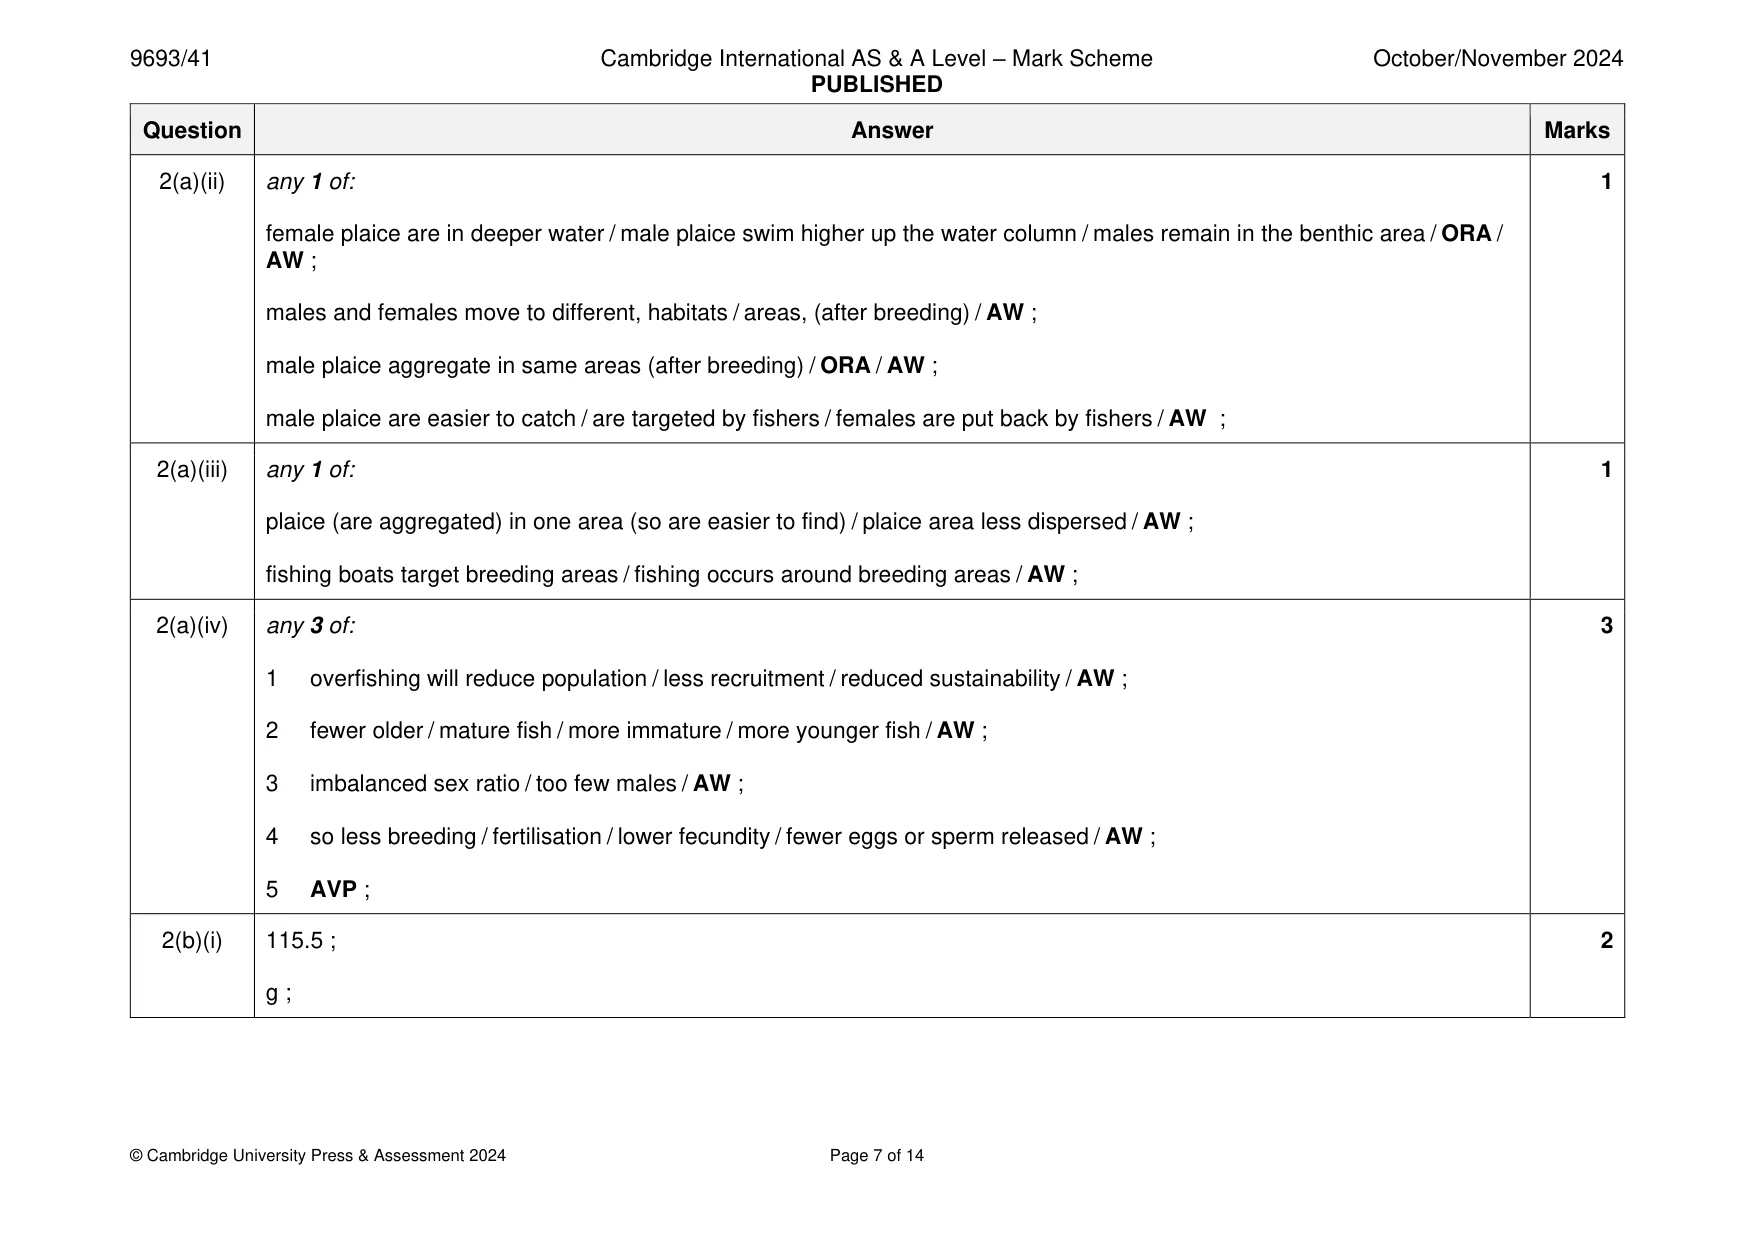
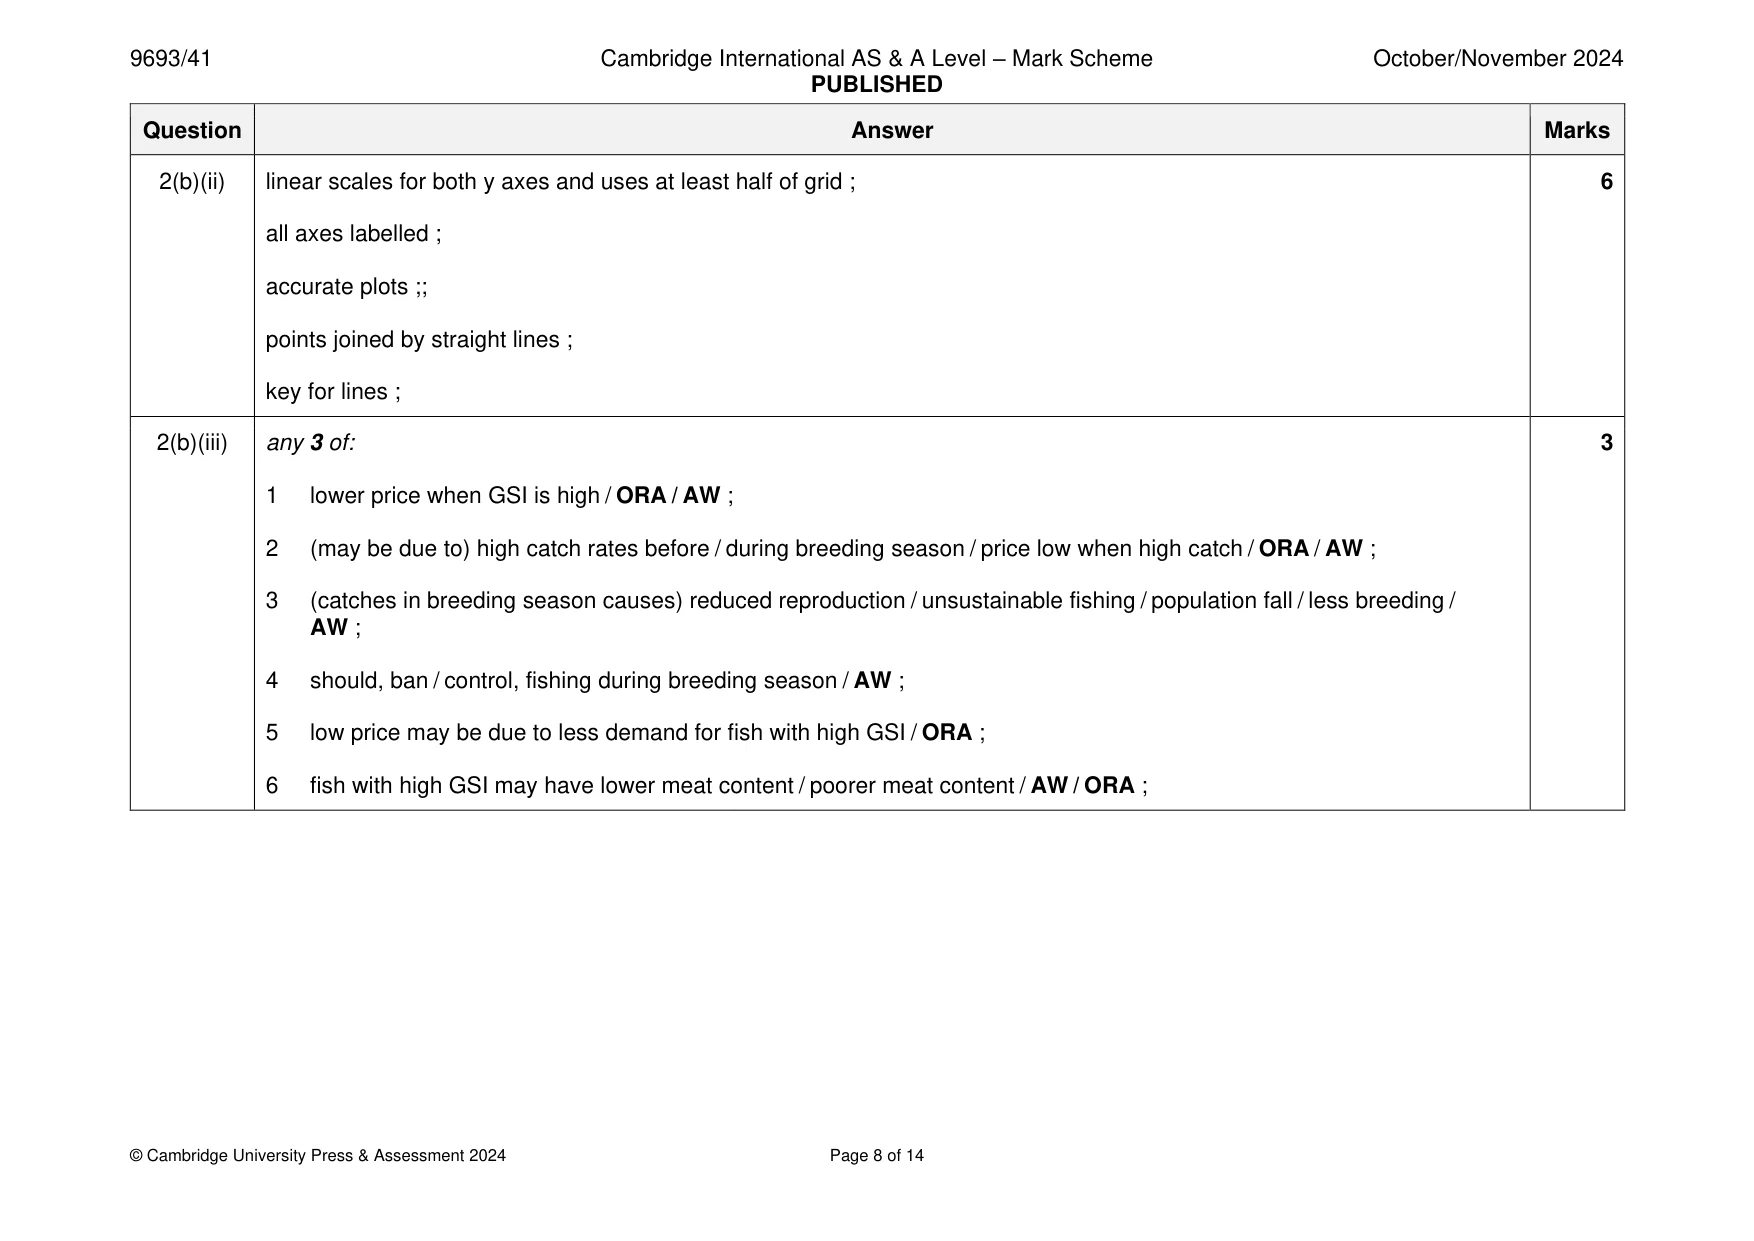
Mark scheme: 2(a)(i) any 3 of: 3 1 mortality is higher (for both) during breeding season / AW ; 2 mortality of males is higher than females during breeding season / AW ; 3 mortality of males and females is similar out of breeding season / AW ; 4 larger increase in mortality of males than females during breeding season (compared with out of season) / AW ; 5 both have low mortality for 0–1 years / mortality increases with age / lower mortality for younger fish / AW ; 6 correct manipulation of data ; 2(a)(ii) any 1 of: 1 female plaice are in deeper water / male plaice swim higher up the water column / males remain in the benthic area / ORA / AW ; males and females move to different, habitats / areas, (after breeding) / AW ; male plaice aggregate in same areas (after breeding) / ORA / AW ; male plaice are easier to catch / are targeted by fishers / females are put back by fishers / AW ; 2(a)(iii) any 1 of: 1 plaice (are aggregated) in one area (so are easier to find) / plaice area less dispersed / AW ; fishing boats target breeding areas / fishing occurs around breeding areas / AW ; 2(a)(iv) any 3 of: 3 1 overfishing will reduce population / less recruitment / reduced sustainability / AW ; 2 fewer older / mature fish / more immature / more younger fish / AW ; 3 imbalanced sex ratio / too few males / AW ; 4 so less breeding / fertilisation / lower fecundity / fewer eggs or sperm released / AW ; 5 AVP ; 2(b)(i) 115.5 ; 2 g ; 2(b)(ii) linear scales for both y axes and uses at least half of grid ; 6 all axes labelled ; accurate plots ;; points joined by straight lines ; key for lines ; 2(b)(iii) any 3 of: 3 1 lower price when GSI is high / ORA / AW ; 2 (may be due to) high catch rates before / during breeding season / price low when high catch / ORA / AW ; 3 (catches in breeding season causes) reduced reproduction / unsustainable fishing / population fall / less breeding / AW ; 4 should, ban / control, fishing during breeding season / AW ; 5 low price may be due to less demand for fish with high GSI / ORA ; 6 fish with high GSI may have lower meat content / poorer meat content / AW / ORA ;
Q3 · Agriculture poses a threat to coral reefs in many parts of the world due to the run-off…
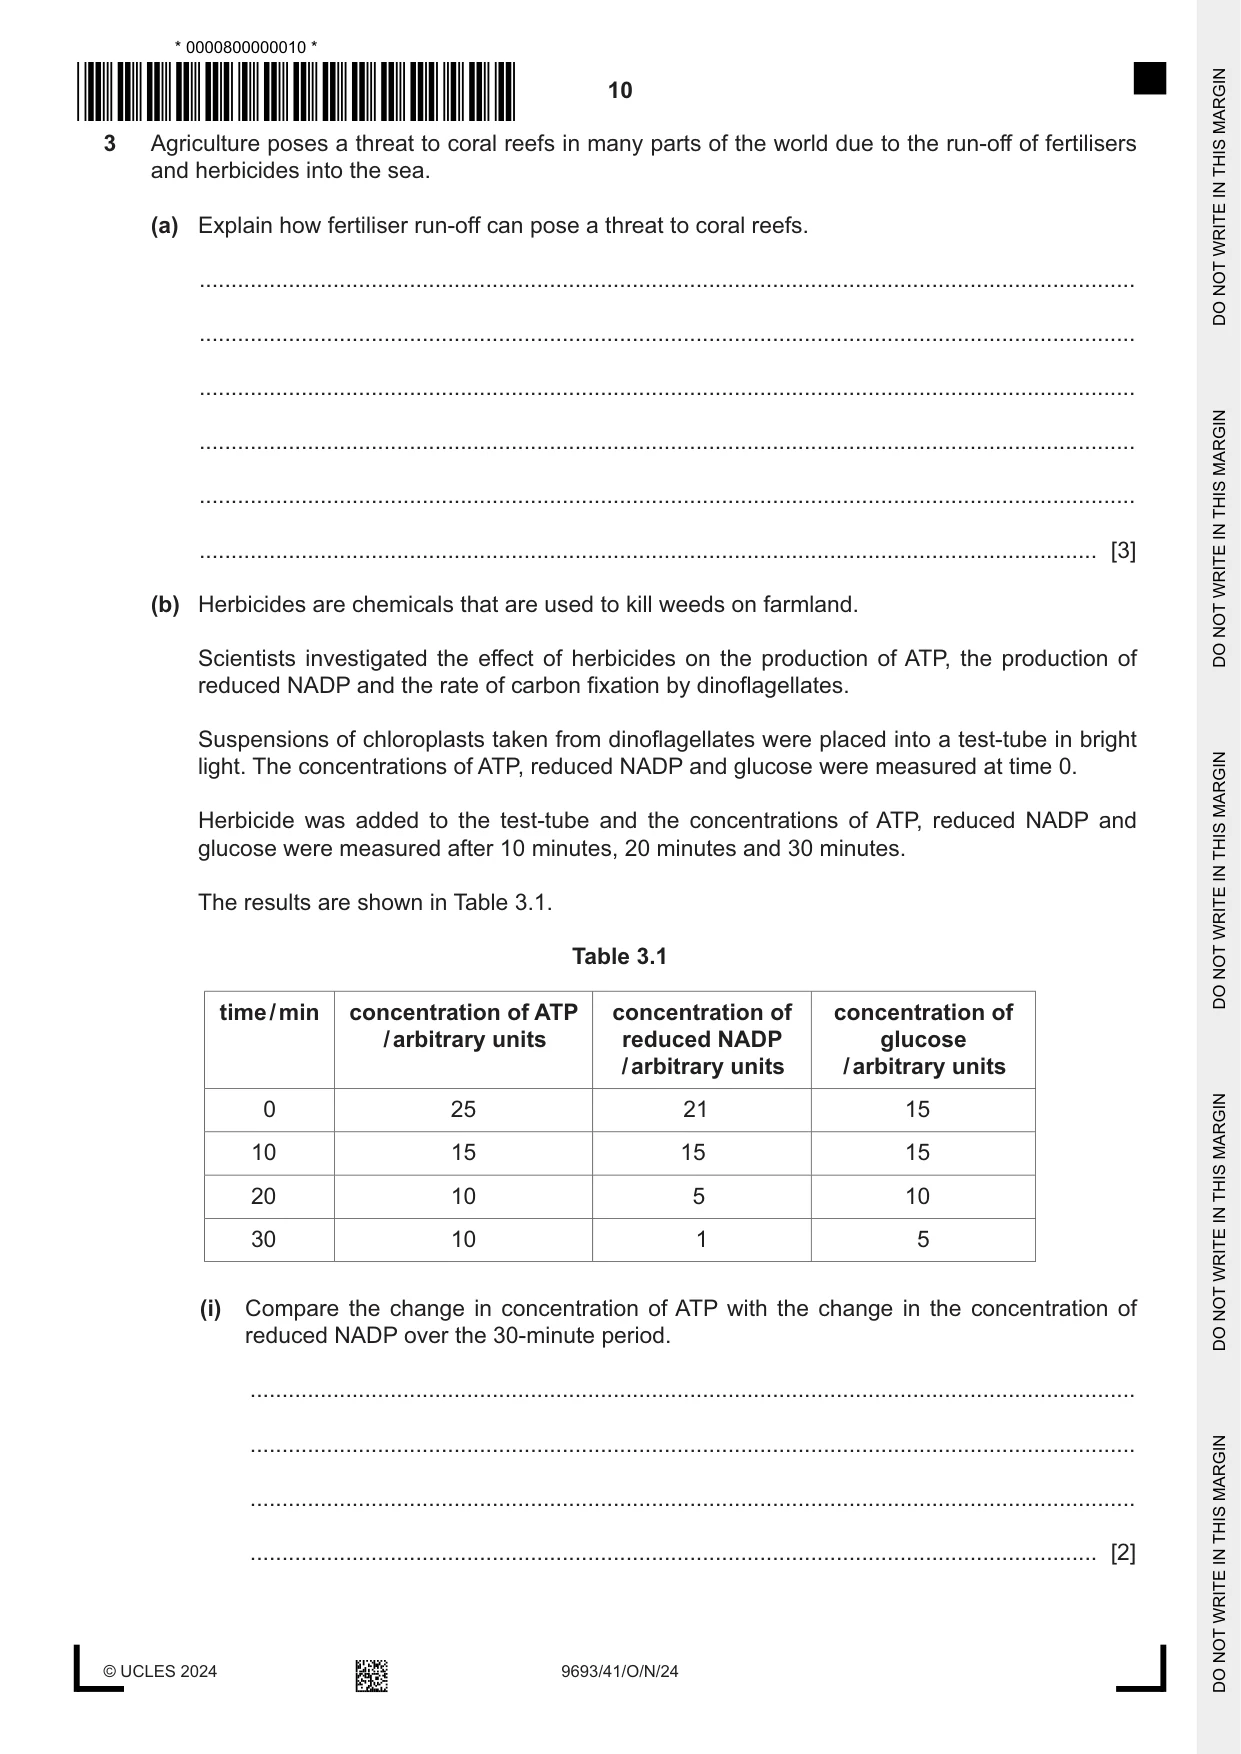
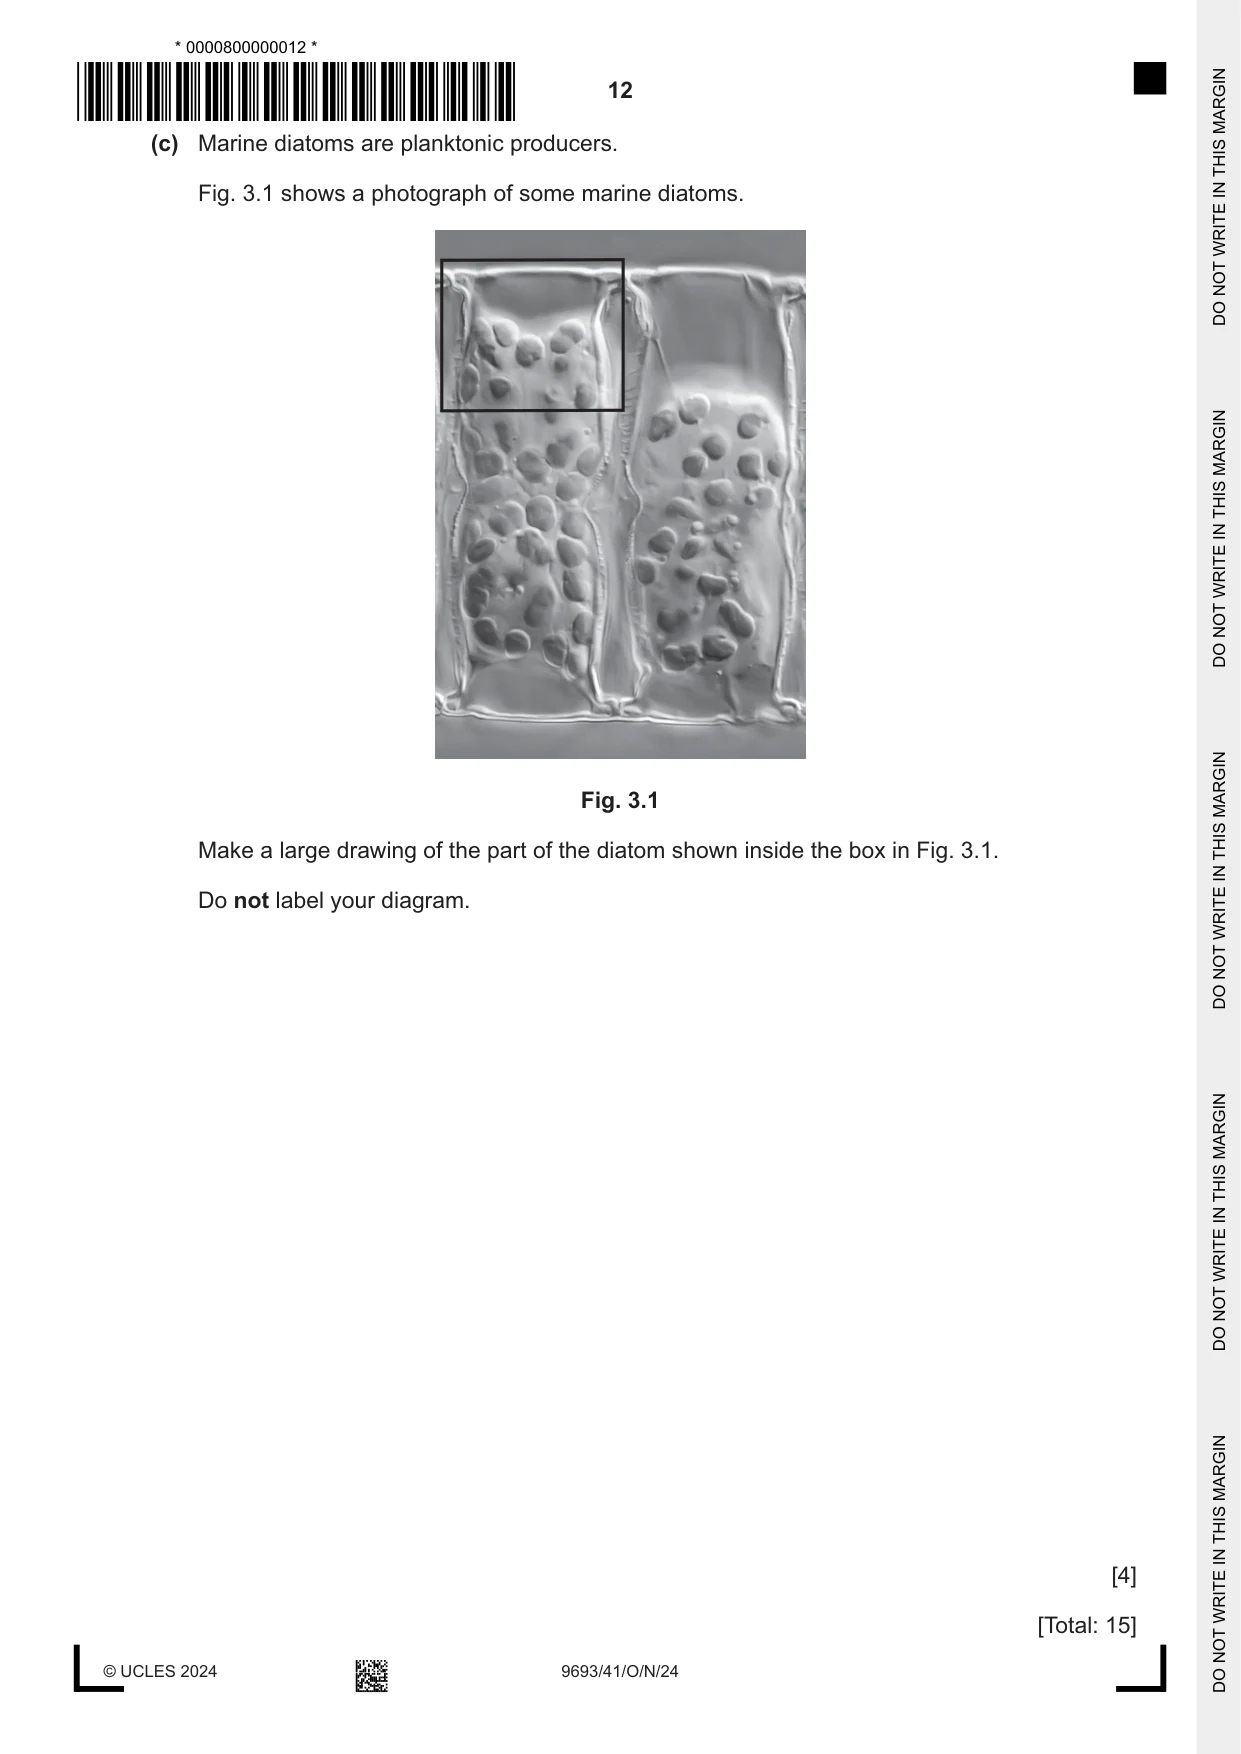
3 Agriculture poses a threat to coral reefs in many parts of the world due to the run-off of fertilisers and herbicides into the sea. (a) Explain how fertiliser run-off can pose a threat to coral reefs. ................................................................................................................................................... ................................................................................................................................................... ................................................................................................................................................... ................................................................................................................................................... ................................................................................................................................................... ............................................................................................................................................. [3] (b) Herbicides are chemicals that are used to kill weeds on farmland. Scientists investigated the effect of herbicides on the production of ATP, the production of reduced NADP and the rate of carbon fixation by dinoflagellates. Suspensions of chloroplasts taken from dinoflagellates were placed into a test-tube in bright light. The concentrations of ATP, reduced NADP and glucose were measured at time 0. Herbicide was added to the test-tube and the concentrations of ATP, reduced NADP and glucose were measured after 10 minutes, 20 minutes and 30 minutes. The results are shown in Table 3.1. Table 3.1 time / min concentration of ATP concentration of concentration of / arbitrary units reduced NADP glucose / arbitrary units / arbitrary units 0 25 21 15 10 15 15 15 20 10 5 10 30 10 1 5 (i) Compare the change in concentration of ATP with the change in the concentration of reduced NADP over the 30-minute period. ........................................................................................................................................... ........................................................................................................................................... ........................................................................................................................................... ..................................................................................................................................... [2] (ii) The herbicide reduces the concentration of chlorophyll in the chloroplasts of dinoflagellates. Explain the effect of adding herbicide on the changes in concentration of ATP and reduced NADP shown in Table 3.1. ........................................................................................................................................... ........................................................................................................................................... ........................................................................................................................................... ........................................................................................................................................... ........................................................................................................................................... ..................................................................................................................................... [3] (iii) Explain the effect of adding herbicide on the change in concentration of glucose shown in Table 3.1. ........................................................................................................................................... ........................................................................................................................................... ........................................................................................................................................... ........................................................................................................................................... ........................................................................................................................................... ..................................................................................................................................... [3] (c) Marine diatoms are planktonic producers. Fig. 3.1 shows a photograph of some marine diatoms. Fig. 3.1 Make a large drawing of the part of the diatom shown inside the box in Fig. 3.1. Do not label your diagram. [4] [Total: 15]
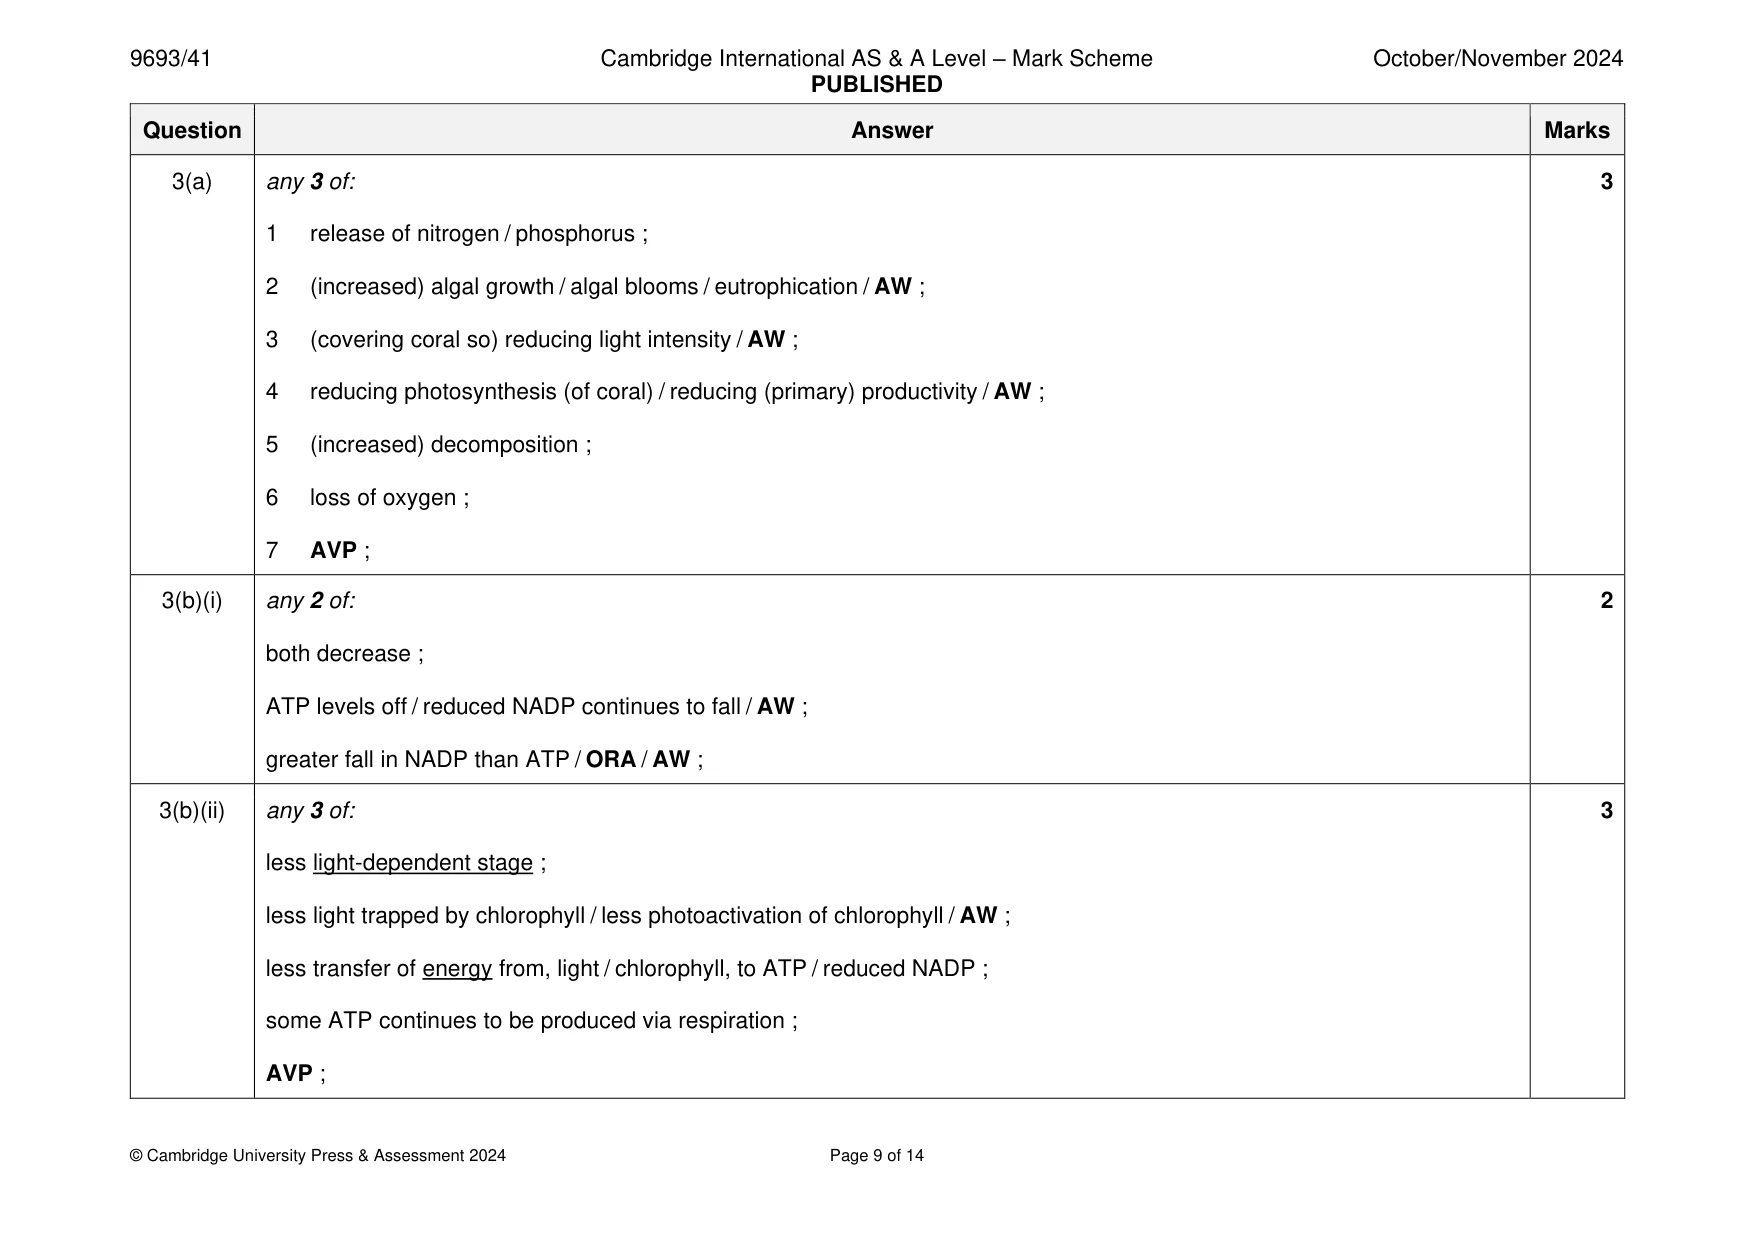
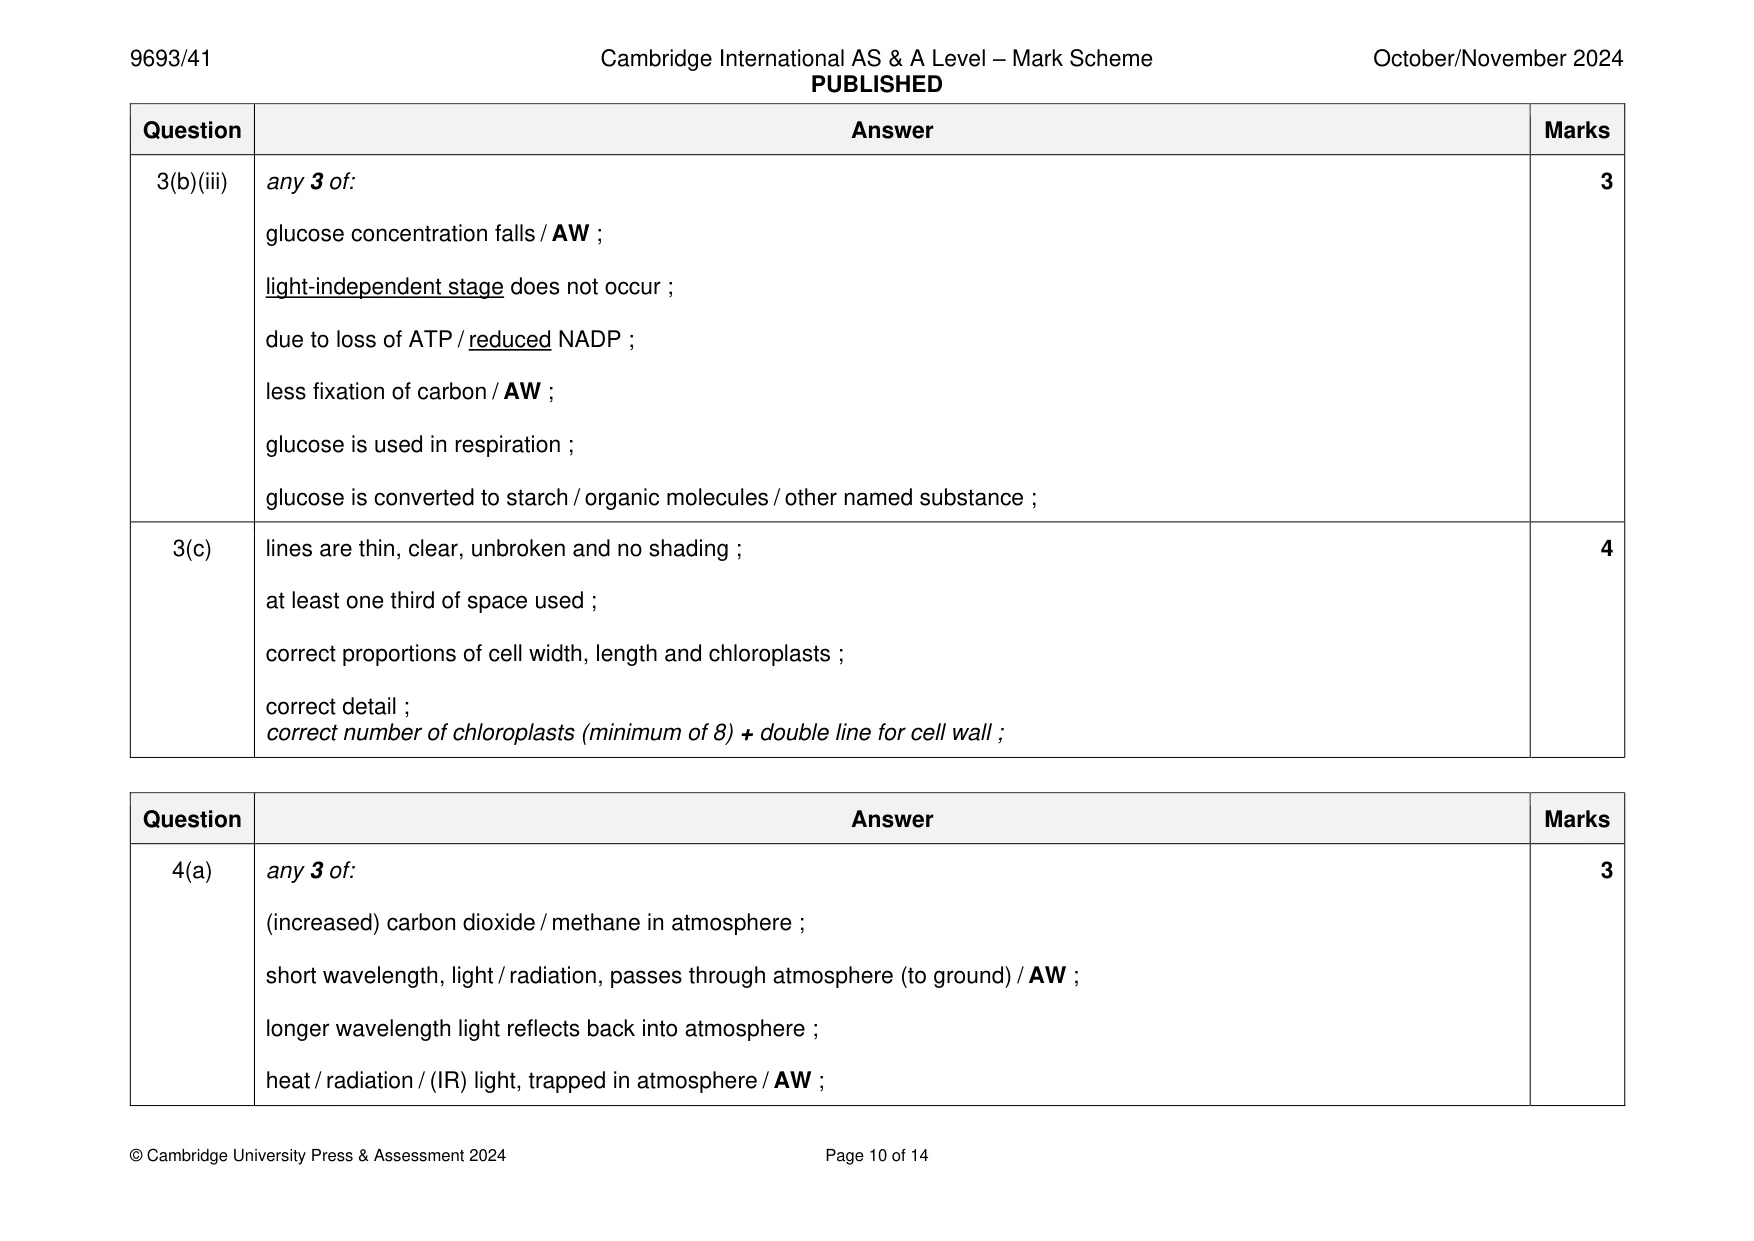
Mark scheme: 3(a) any 3 of: 3 1 release of nitrogen / phosphorus ; 2 (increased) algal growth / algal blooms / eutrophication / AW ; 3 (covering coral so) reducing light intensity / AW ; 4 reducing photosynthesis (of coral) / reducing (primary) productivity / AW ; 5 (increased) decomposition ; 6 loss of oxygen ; 7 AVP ; 3(b)(i) any 2 of: 2 both decrease ; ATP levels off / reduced NADP continues to fall / AW ; greater fall in NADP than ATP / ORA / AW ; 3(b)(ii) any 3 of: 3 less light-dependent stage ; less light trapped by chlorophyll / less photoactivation of chlorophyll / AW ; less transfer of energy from, light / chlorophyll, to ATP / reduced NADP ; some ATP continues to be produced via respiration ; AVP ; 3(b)(iii) any 3 of: 3 glucose concentration falls / AW ; light-independent stage does not occur ; due to loss of ATP / reduced NADP ; less fixation of carbon / AW ; glucose is used in respiration ; glucose is converted to starch / organic molecules / other named substance ; 3(c) lines are thin, clear, unbroken and no shading ; 4 at least one third of space used ; correct proportions of cell width, length and chloroplasts ; correct detail ; correct number of chloroplasts (minimum of 8) + double line for cell wall ;
Q4 · A female green sea turtle returning to the sea after laying eggs in a nest
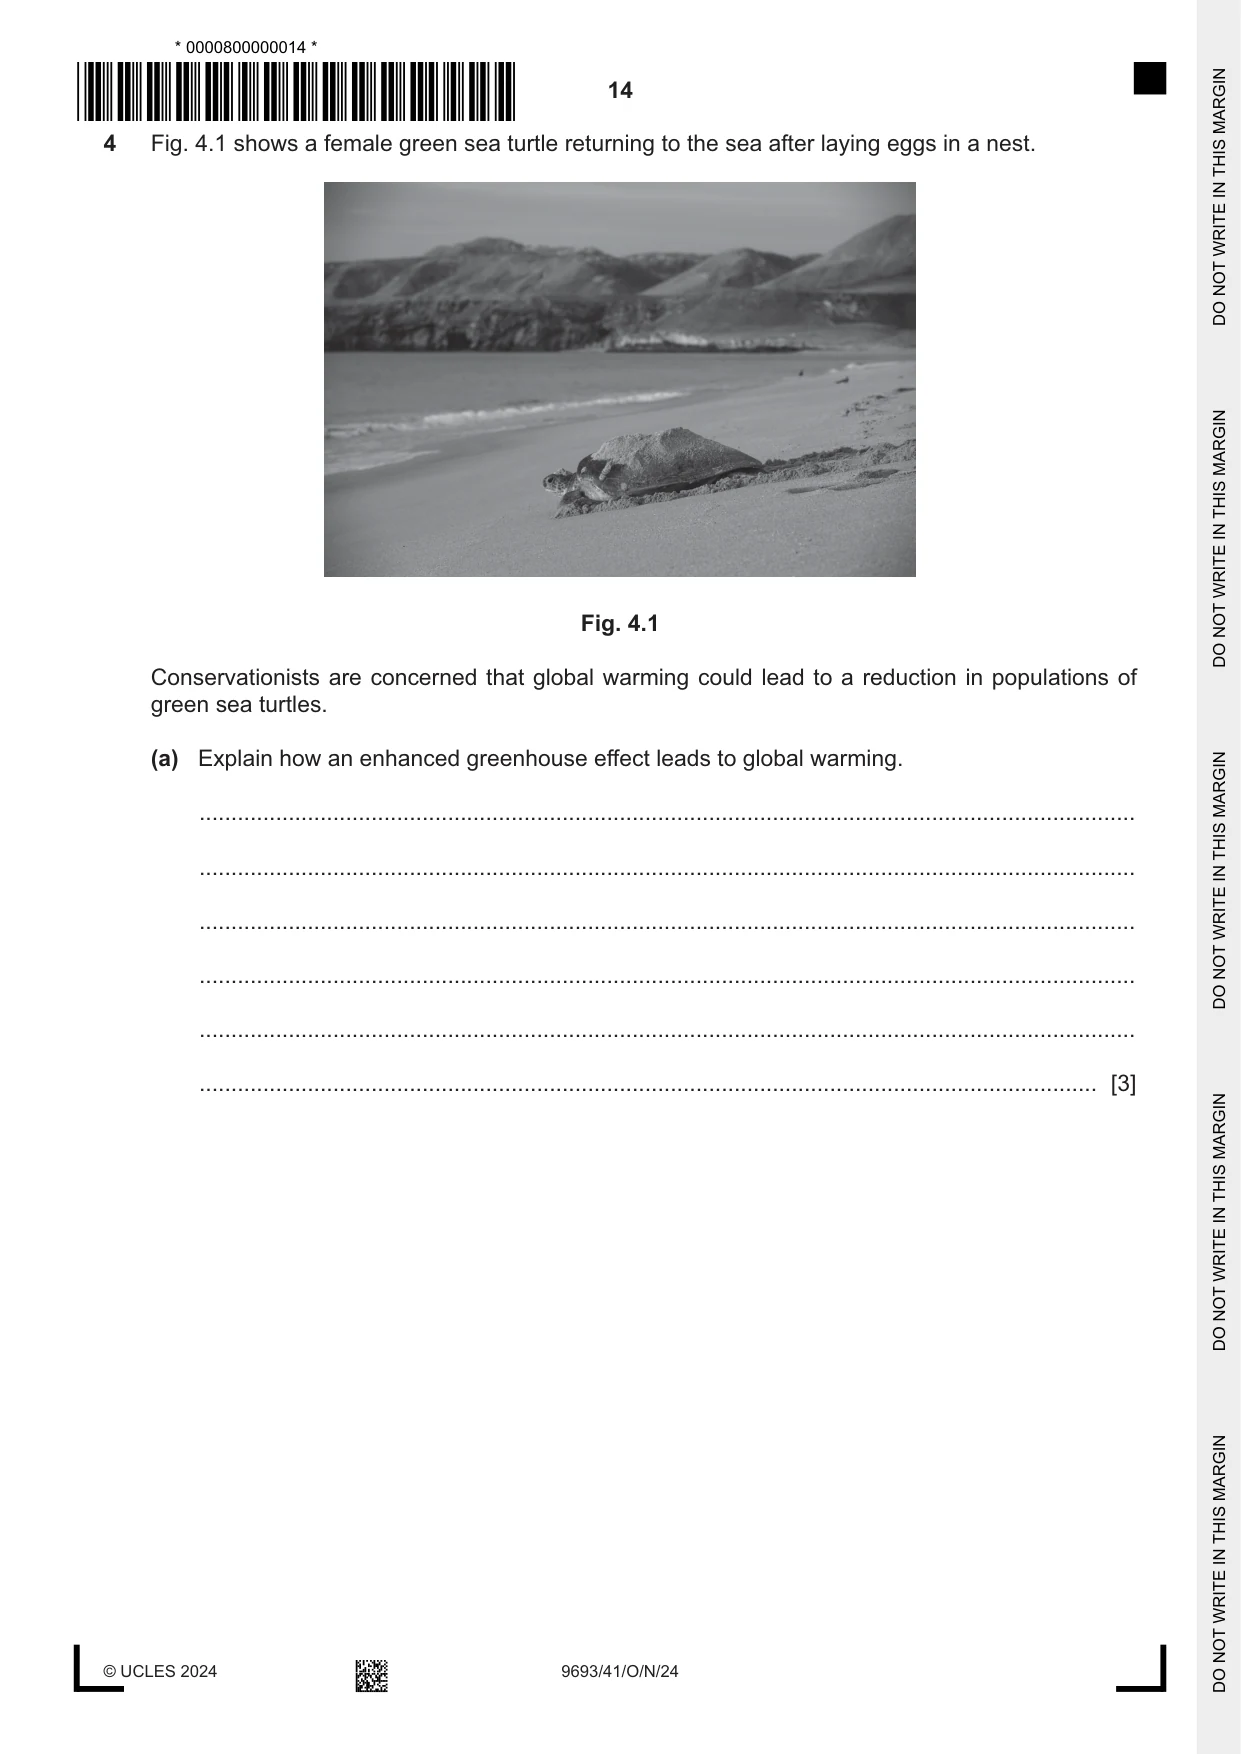
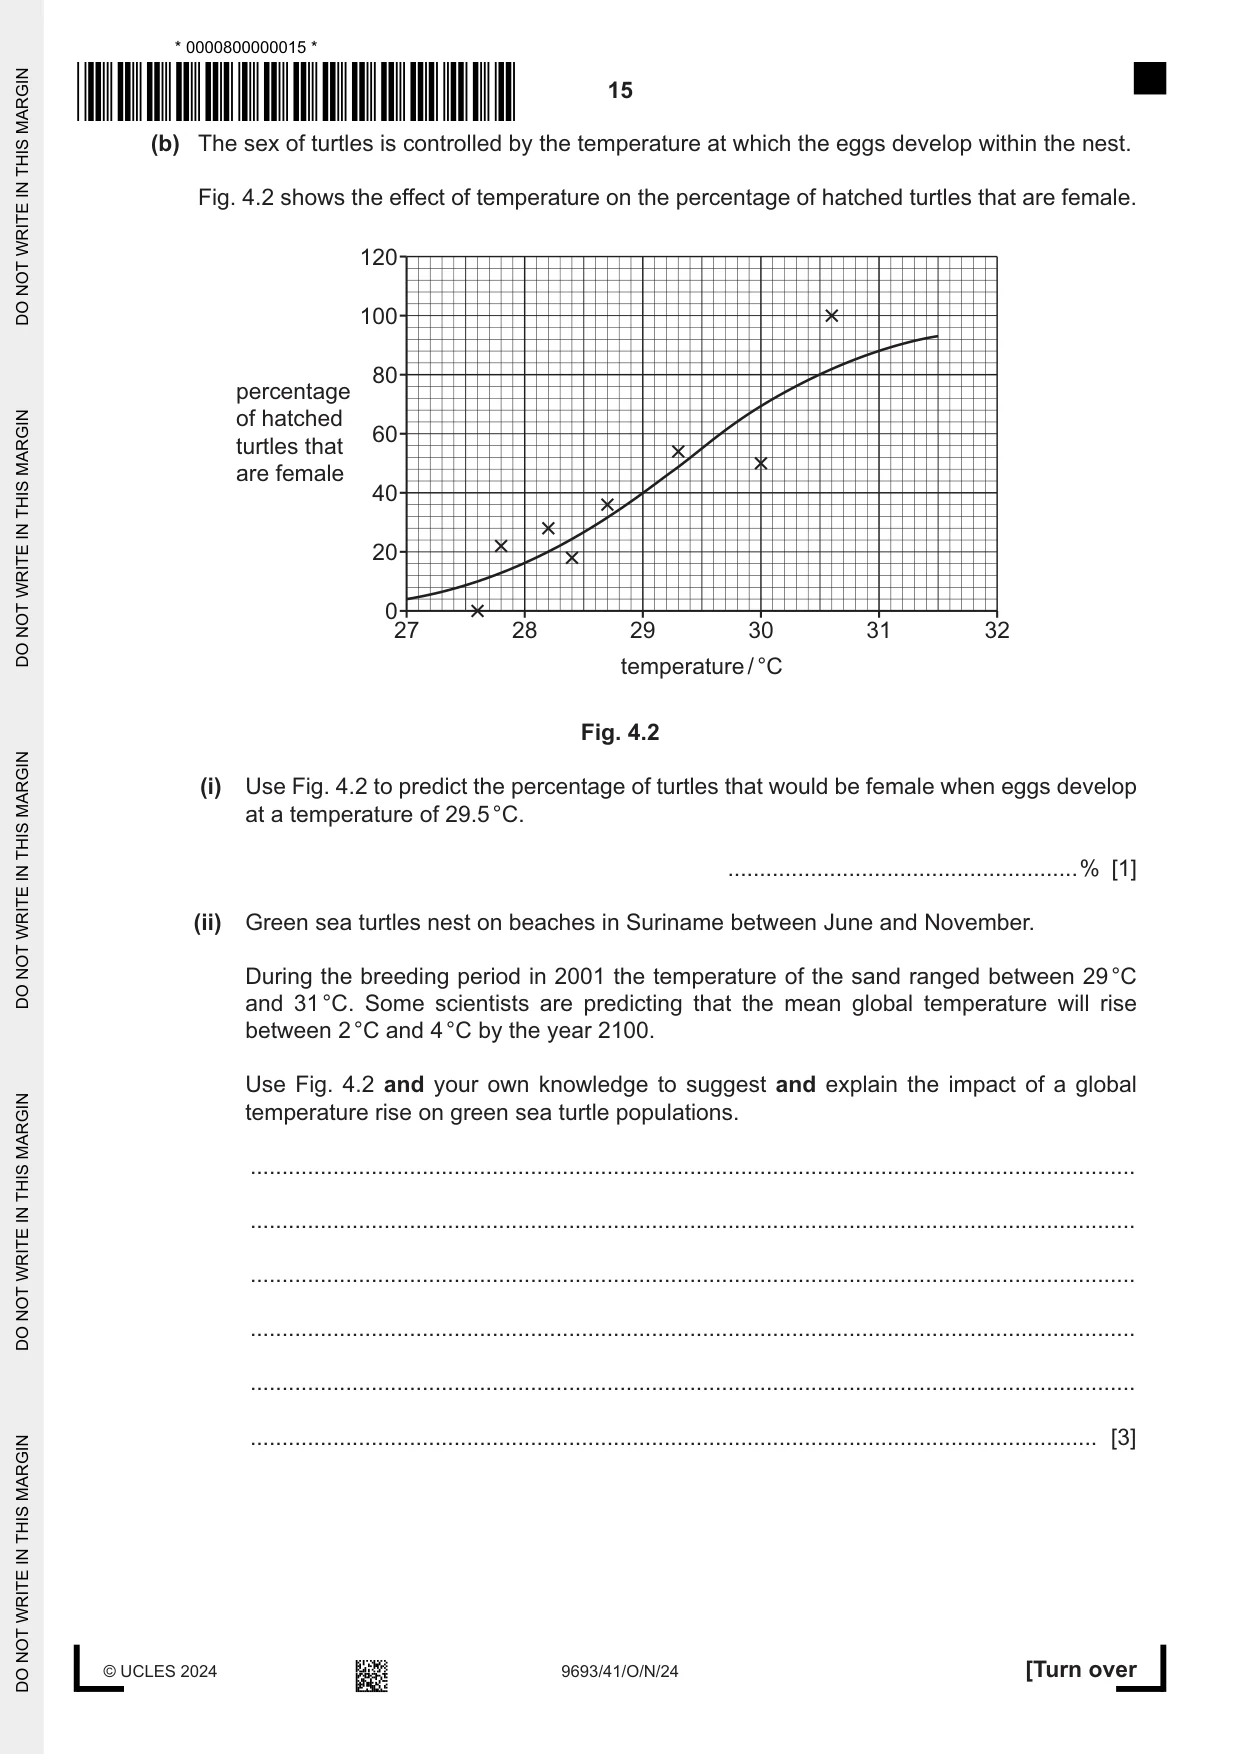
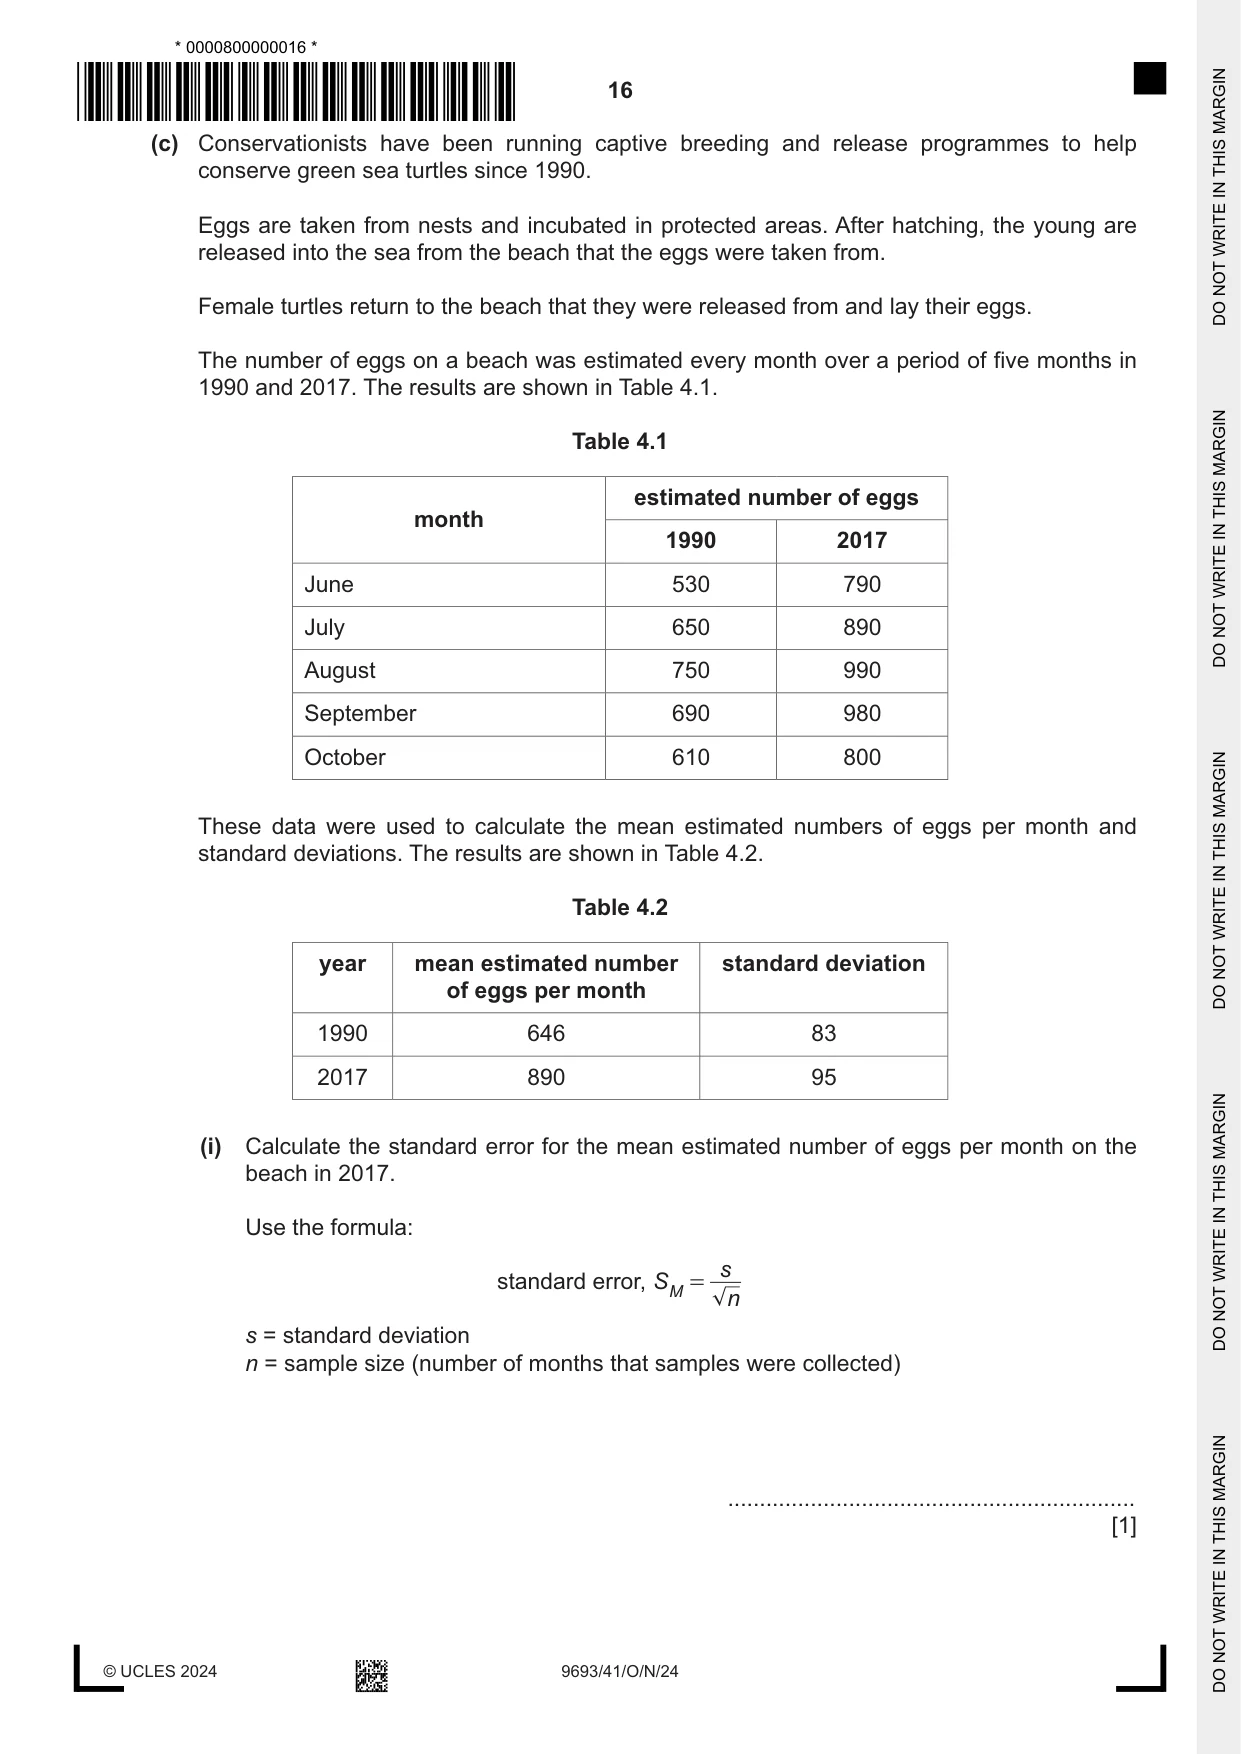
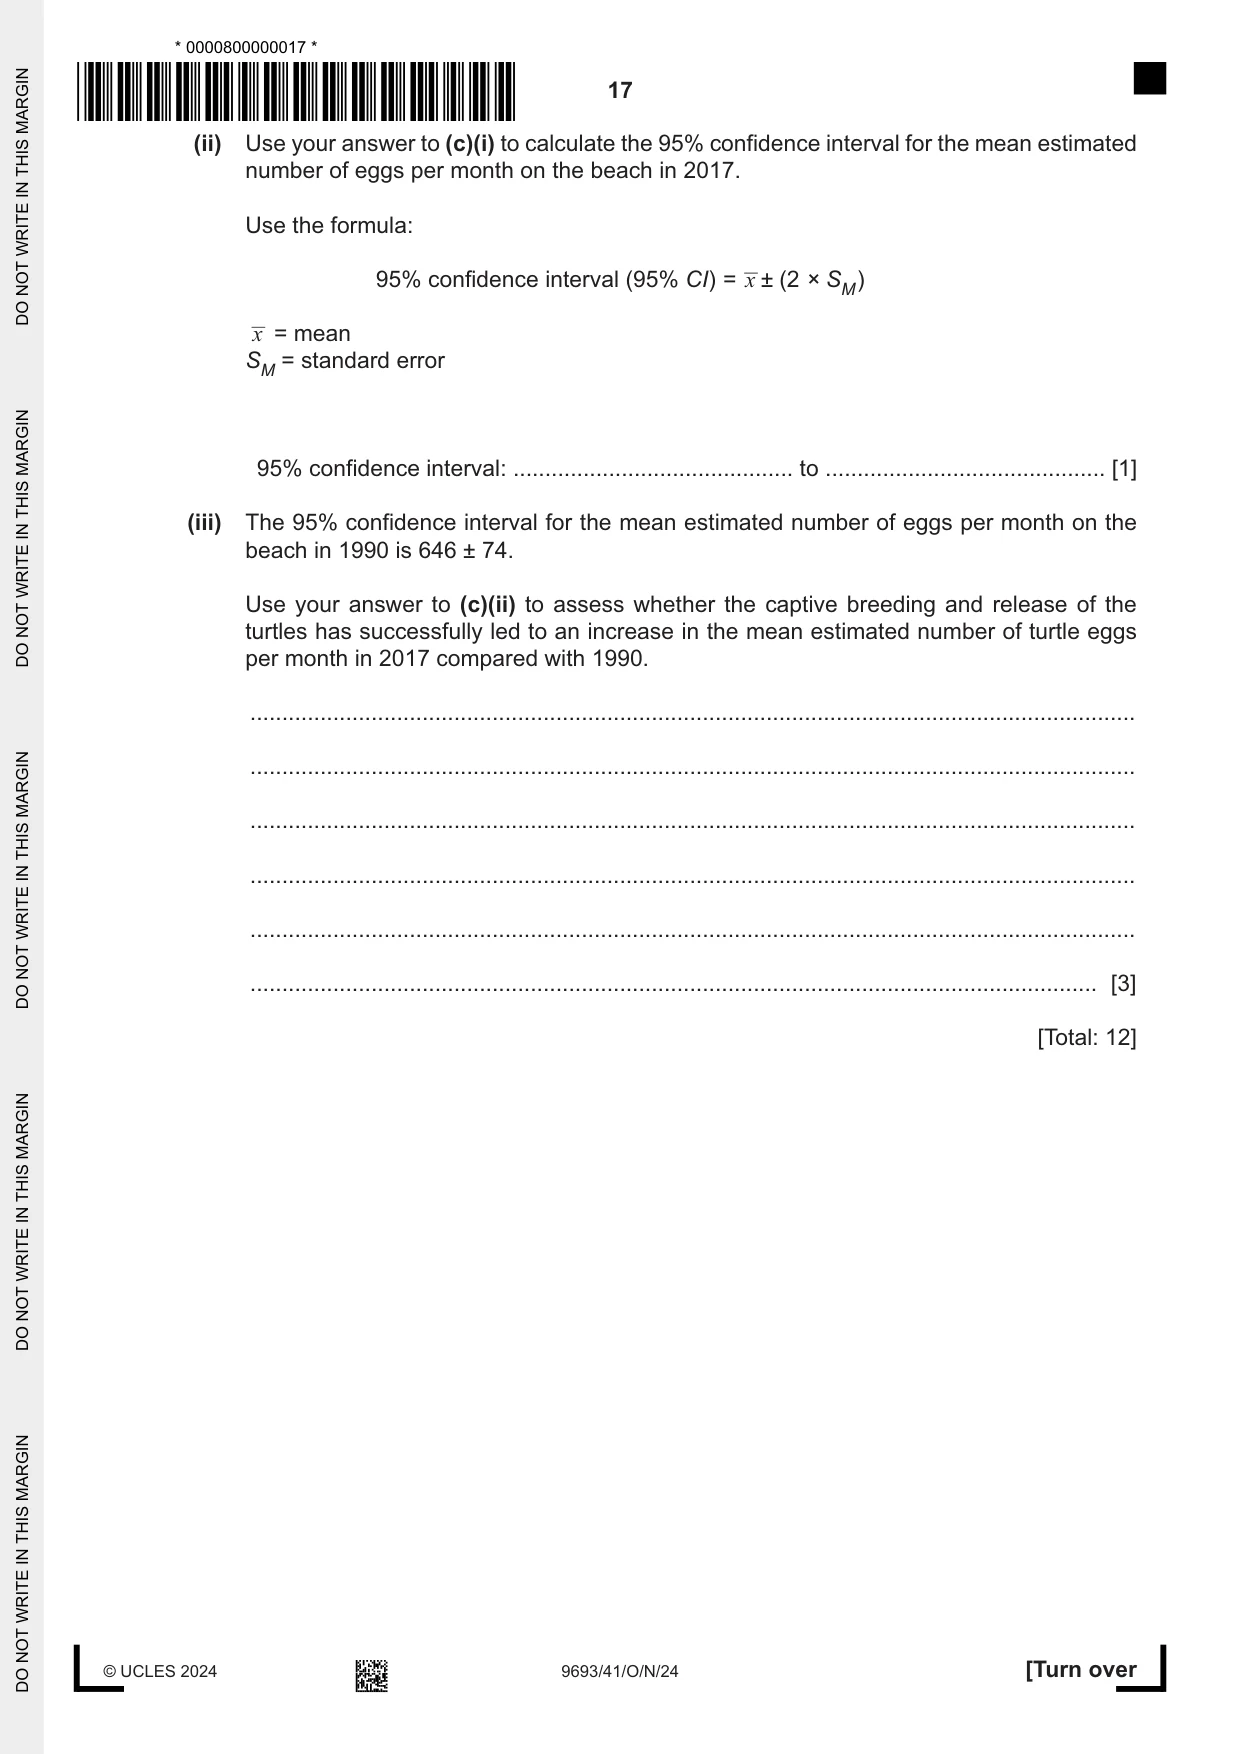
4 Fig. 4.1 shows a female green sea turtle returning to the sea after laying eggs in a nest. Fig. 4.1 Conservationists are concerned that global warming could lead to a reduction in populations of green sea turtles. (a) Explain how an enhanced greenhouse effect leads to global warming. ................................................................................................................................................... ................................................................................................................................................... ................................................................................................................................................... ................................................................................................................................................... ................................................................................................................................................... ............................................................................................................................................. [3] (b) The sex of turtles is controlled by the temperature at which the eggs develop within the nest. Fig. 4.2 shows the effect of temperature on the percentage of hatched turtles that are female. 120 100 80 percentage of hatched 60 turtles that are female 40 20 0 27 28 29 30 31 32 temperature / °C Fig. 4.2 (i) Use Fig. 4.2 to predict the percentage of turtles that would be female when eggs develop at a temperature of 29.5 °C. .......................................................% [1] (ii) Green sea turtles nest on beaches in Suriname between June and November. During the breeding period in 2001 the temperature of the sand ranged between 29 °C and 31 °C. Some scientists are predicting that the mean global temperature will rise between 2 °C and 4 °C by the year 2100. Use Fig. 4.2 and your own knowledge to suggest and explain the impact of a global temperature rise on green sea turtle populations. ........................................................................................................................................... ........................................................................................................................................... ........................................................................................................................................... ........................................................................................................................................... ........................................................................................................................................... ..................................................................................................................................... [3] (c) Conservationists have been running captive breeding and release programmes to help conserve green sea turtles since 1990. Eggs are taken from nests and incubated in protected areas. After hatching, the young are released into the sea from the beach that the eggs were taken from. Female turtles return to the beach that they were released from and lay their eggs. The number of eggs on a beach was estimated every month over a period of five months in 1990 and 2017. The results are shown in Table 4.1. Table 4.1 estimated number of eggs month 1990 2017 June 530 790 July 650 890 August 750 990 September 690 980 October 610 800 These data were used to calculate the mean estimated numbers of eggs per month and standard deviations. The results are shown in Table 4.2. Table 4.2 year mean estimated number standard deviation of eggs per month 1990 646 83 2017 890 95 (i) Calculate the standard error for the mean estimated number of eggs per month on the beach in 2017. Use the formula: s standard error, S = M n s = standard deviation n = sample size (number of months that samples were collected) ................................................................ [1] (ii) Use your answer to (c)(i) to calculate the 95% confidence interval for the mean estimated number of eggs per month on the beach in 2017. Use the formula: 95% confidence interval (95% CI) = x ± (2 × SM) x = mean SM = standard error 95% confidence interval: ............................................ to ............................................ [1] (iii) The 95% confidence interval for the mean estimated number of eggs per month on the beach in 1990 is 646 ± 74. Use your answer to (c)(ii) to assess whether the captive breeding and release of the turtles has successfully led to an increase in the mean estimated number of turtle eggs per month in 2017 compared with 1990. ........................................................................................................................................... ........................................................................................................................................... ........................................................................................................................................... ........................................................................................................................................... ........................................................................................................................................... ..................................................................................................................................... [3] [Total: 12]
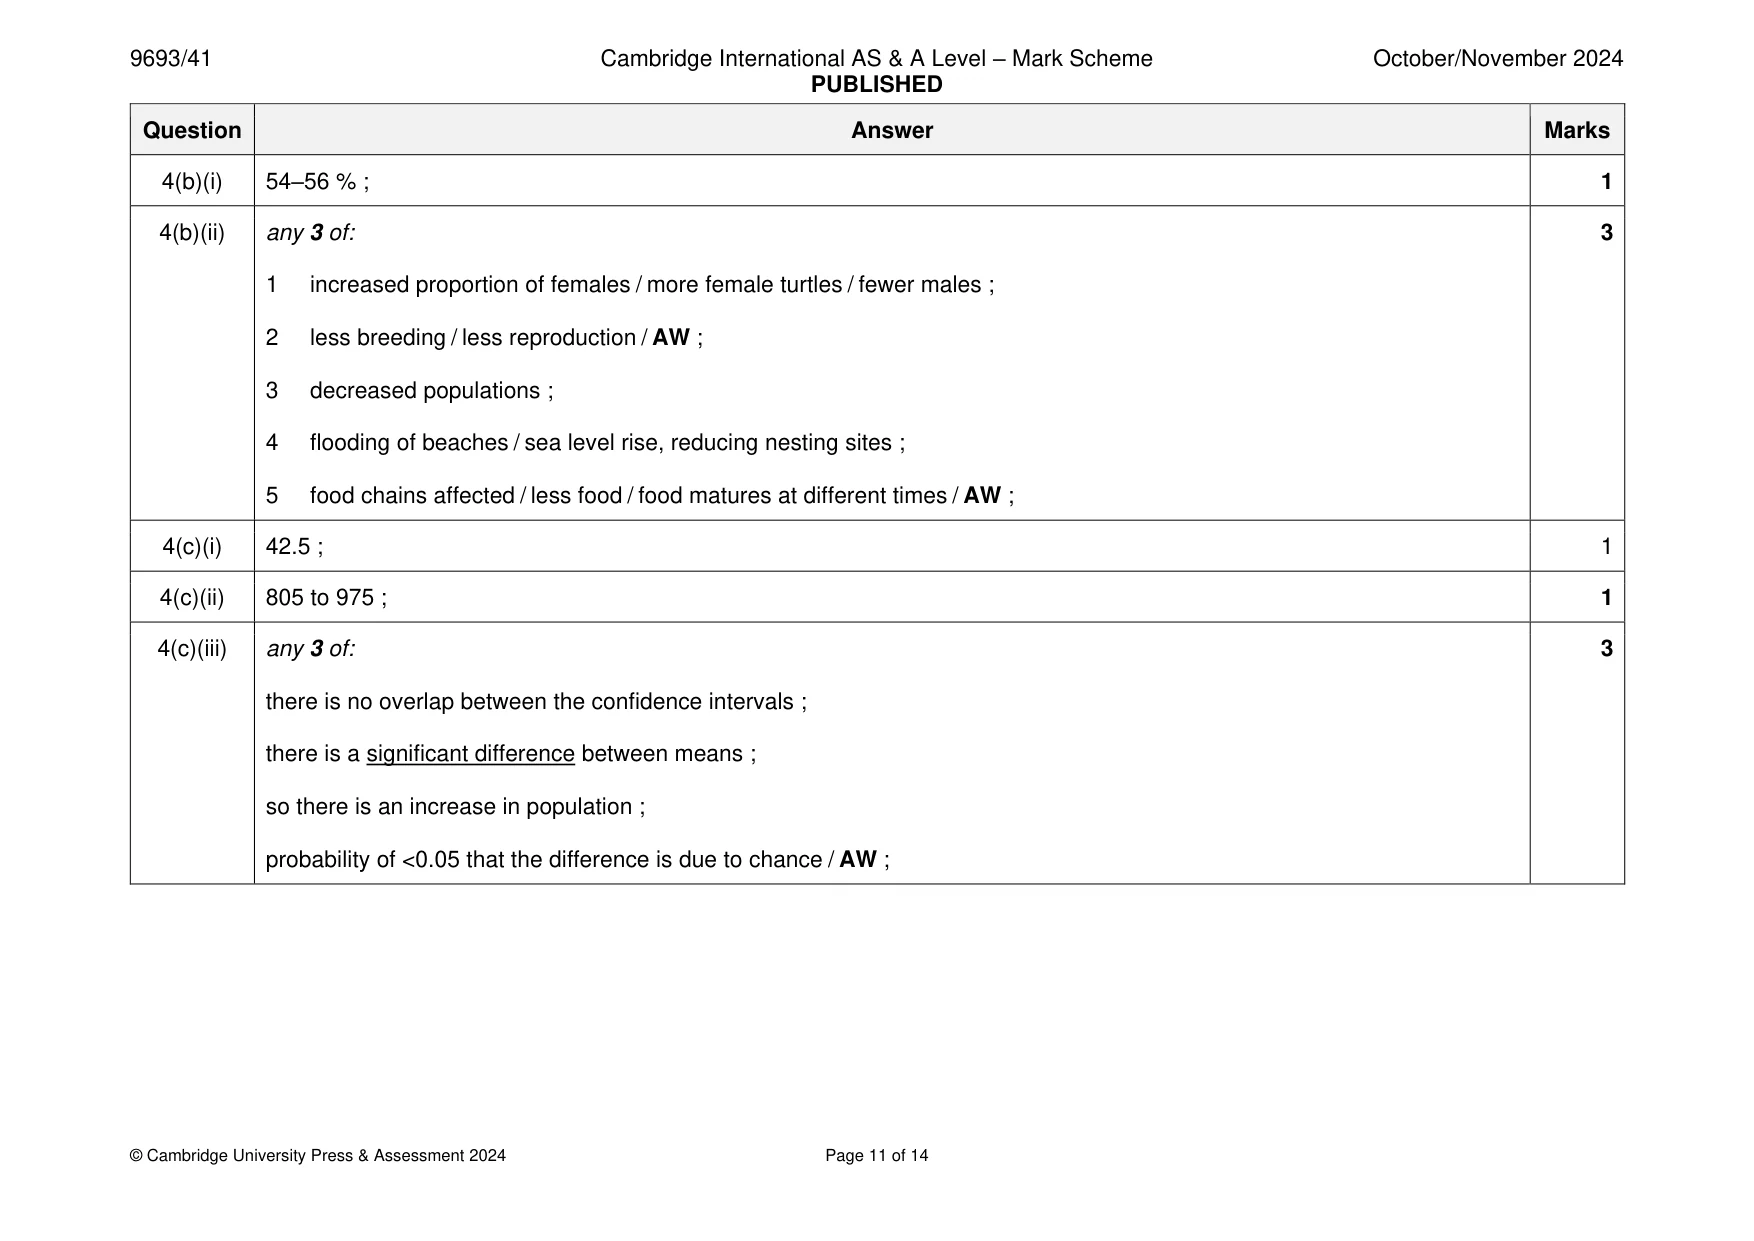
Mark scheme: 4(a) any 3 of: 3 (increased) carbon dioxide / methane in atmosphere ; short wavelength, light / radiation, passes through atmosphere (to ground) / AW ; longer wavelength light reflects back into atmosphere ; heat / radiation / (IR) light, trapped in atmosphere / AW ; 4(b)(i) 54–56 % ; 1 4(b)(ii) any 3 of: 3 1 increased proportion of females / more female turtles / fewer males ; 2 less breeding / less reproduction / AW ; 3 decreased populations ; 4 flooding of beaches / sea level rise, reducing nesting sites ; 5 food chains affected / less food / food matures at different times / AW ; 4(c)(i) 42.5 ; 1 4(c)(ii) 805 to 975 ; 1 4(c)(iii) any 3 of: 3 there is no overlap between the confidence intervals ; there is a significant difference between means ; so there is an increase in population ; probability of <0.05 that the difference is due to chance / AW ;
Q5 · Marine organisms are affected by the salinity of sea water
5 Marine organisms are affected by the salinity of sea water. (a) Explain why tuna need to constantly drink sea water. ................................................................................................................................................... ................................................................................................................................................... ................................................................................................................................................... ................................................................................................................................................... ................................................................................................................................................... ............................................................................................................................................. [3] (b) Some kelp species can adapt the water potential of their cells to match the surrounding sea water. Plan a laboratory investigation that you could do to compare the water potential of cells of kelp collected from an estuary and a rocky shore. You are provided with standard laboratory apparatus and materials. Your plan should: • include a clear statement of the hypothesis • identify the independent, dependent and standardised variables • include full details of the method so that another person can follow it • describe how you would analyse your results • be safe and ethical. ................................................................................................................................................... ................................................................................................................................................... ................................................................................................................................................... ................................................................................................................................................... ................................................................................................................................................... ................................................................................................................................................... ................................................................................................................................................... ................................................................................................................................................... ................................................................................................................................................... ................................................................................................................................................... ................................................................................................................................................... ................................................................................................................................................... ................................................................................................................................................... ................................................................................................................................................... ................................................................................................................................................... ................................................................................................................................................... ................................................................................................................................................... ................................................................................................................................................... ................................................................................................................................................... ................................................................................................................................................... ................................................................................................................................................... ................................................................................................................................................... ................................................................................................................................................... ................................................................................................................................................... ................................................................................................................................................... ................................................................................................................................................... ........................................................................................................................................... [11] [Total: 14]
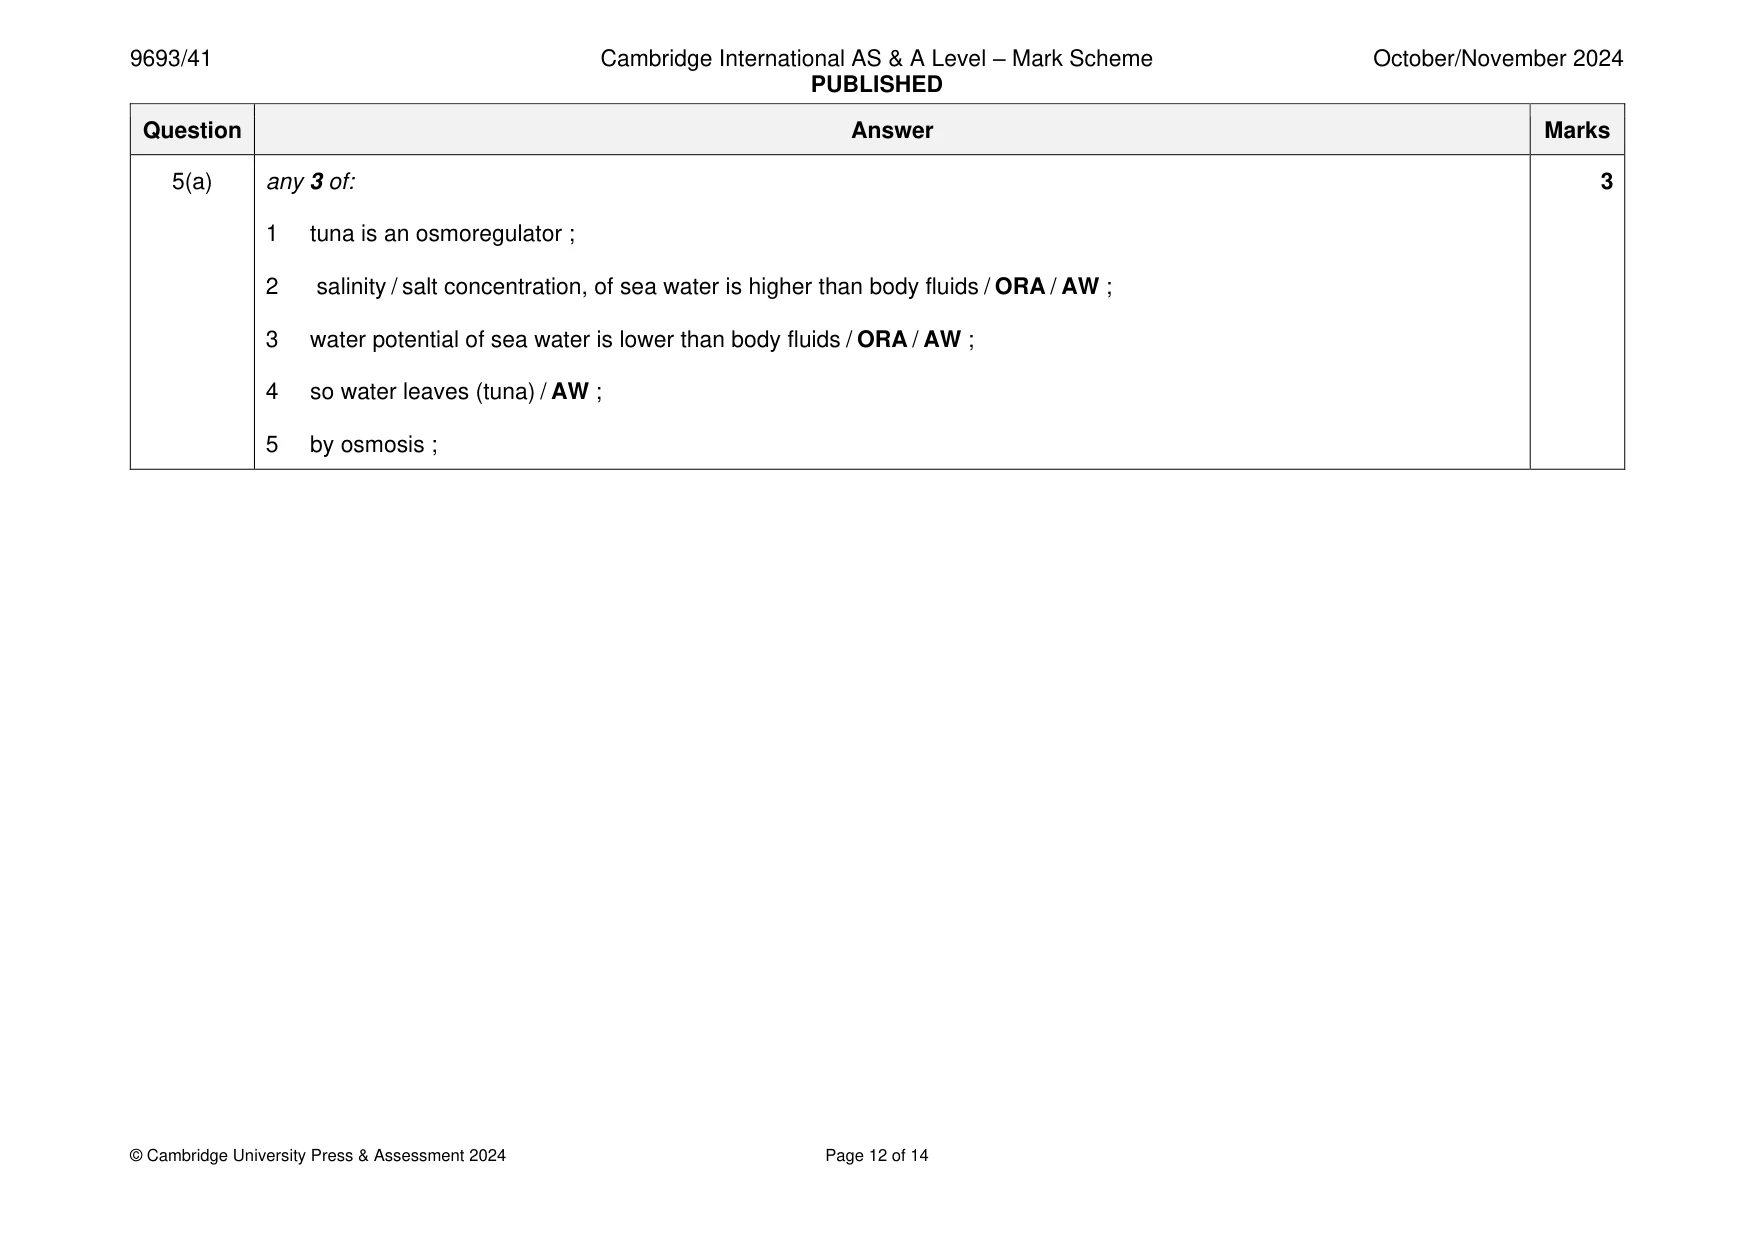
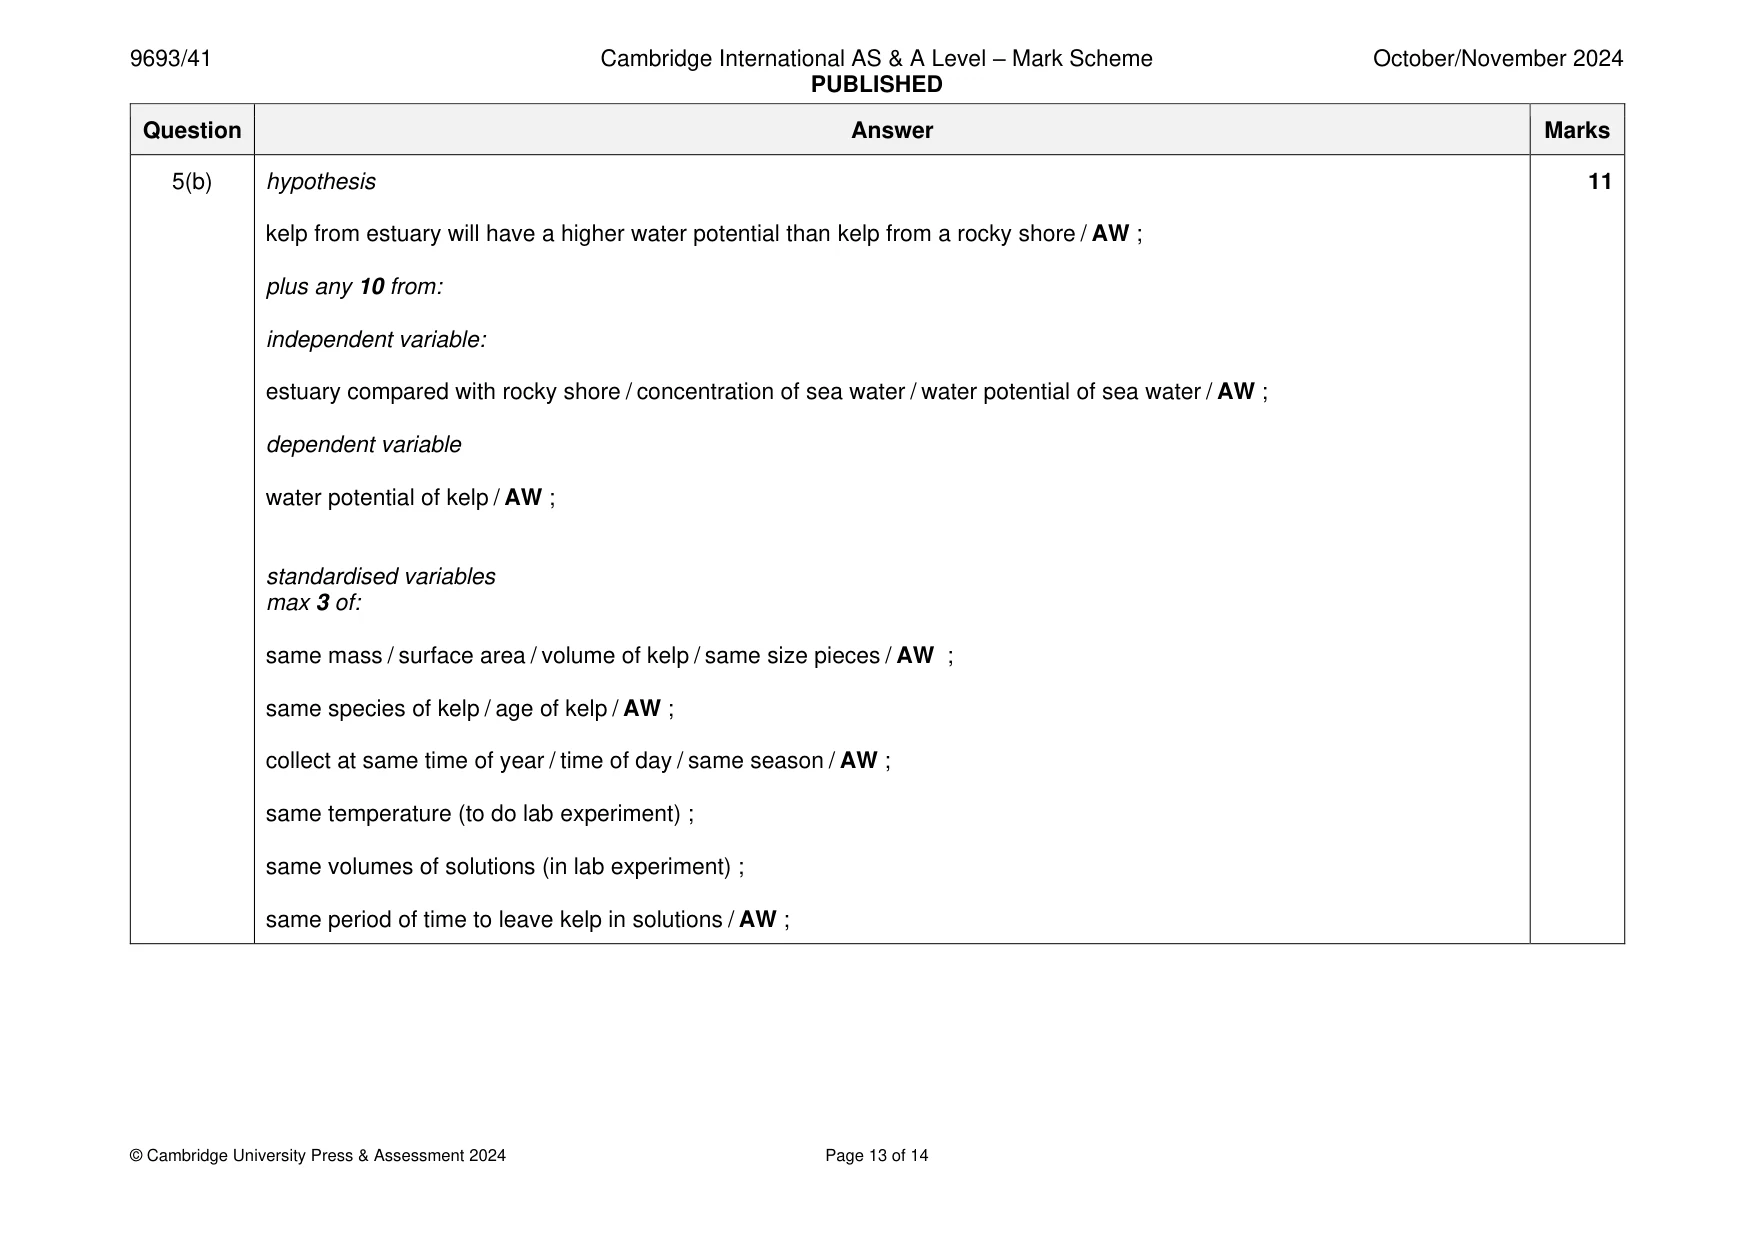
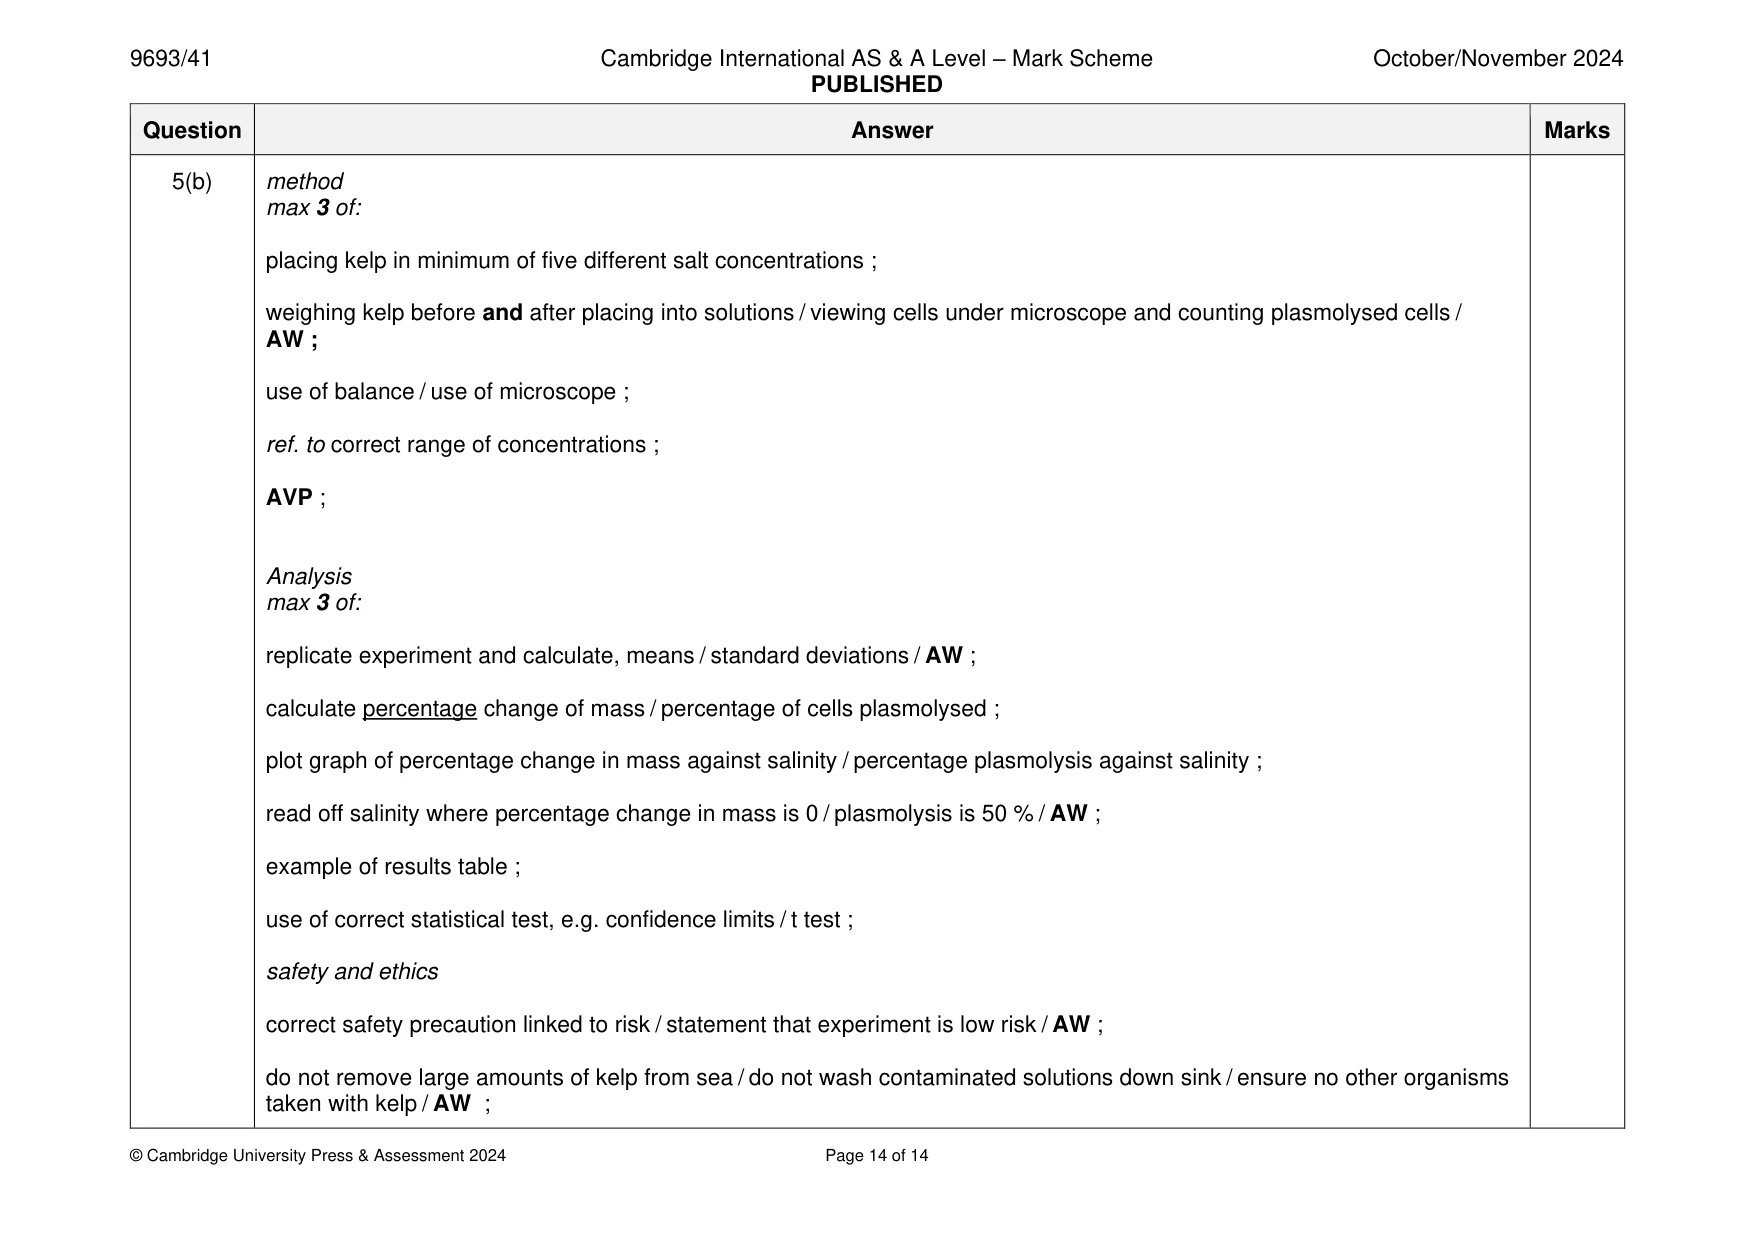
Mark scheme: 5(a) any 3 of: 3 1 tuna is an osmoregulator ; 2 salinity / salt concentration, of sea water is higher than body fluids / ORA / AW ; 3 water potential of sea water is lower than body fluids / ORA / AW ; 4 so water leaves (tuna) / AW ; 5 by osmosis ; 5(b) hypothesis 11 kelp from estuary will have a higher water potential than kelp from a rocky shore / AW ; plus any 10 from: independent variable: estuary compared with rocky shore / concentration of sea water / water potential of sea water / AW ; dependent variable water potential of kelp / AW ; standardised variables max 3 of: same mass / surface area / volume of kelp / same size pieces / AW ; same species of kelp / age of kelp / AW ; collect at same time of year / time of day / same season / AW ; same temperature (to do lab experiment) ; same volumes of solutions (in lab experiment) ; same period of time to leave kelp in solutions / AW ; 5(b) method max 3 of: placing kelp in minimum of five different salt concentrations ; weighing kelp before and after placing into solutions / viewing cells under microscope and counting plasmolysed cells / AW ; use of balance / use of microscope ; ref. to correct range of concentrations ; AVP ; Analysis max 3 of: replicate experiment and calculate, means / standard deviations / AW ; calculate percentage change of mass / percentage of cells plasmolysed ; plot graph of percentage change in mass against salinity / percentage plasmolysis against salinity ; read off salinity where percentage change in mass is 0 / plasmolysis is 50 % / AW ; example of results table ; use of correct statistical test, e.g. confidence limits / t test ; safety and ethics correct safety precaution linked to risk / statement that experiment is low risk / AW ; do not remove large amounts of kelp from sea / do not wash contaminated solutions down sink / ensure no other organisms taken with kelp / AW ;
What was in this paper
The subtopics covered by these 5 questions, and how many questions each got. Open one in a new tab to see every Cambridge question on it.
What you needed in this session
Cambridge’s own grade thresholds for 2024 Oct/Nov, Paper 4 · Variant 1. A higher threshold means an easier paper — the bar moves with how the cohort did.