Cambridge A Level Marine Science 9693 — 2023 May/June Paper 4 · Variant 1
9693/41/M/J/23 · 6 questions · 75 marks · ≈84 min
The question paper and its mark scheme, free to read here and free to download. This is Cambridge’s own paper, exactly as it was sat.
Question paper20 pages


Mark scheme14 pages
Answers below. Sit the paper first if you are practising.
Questions as text
Q1 · A diagram of a cell from the leaf of a species of seagrass
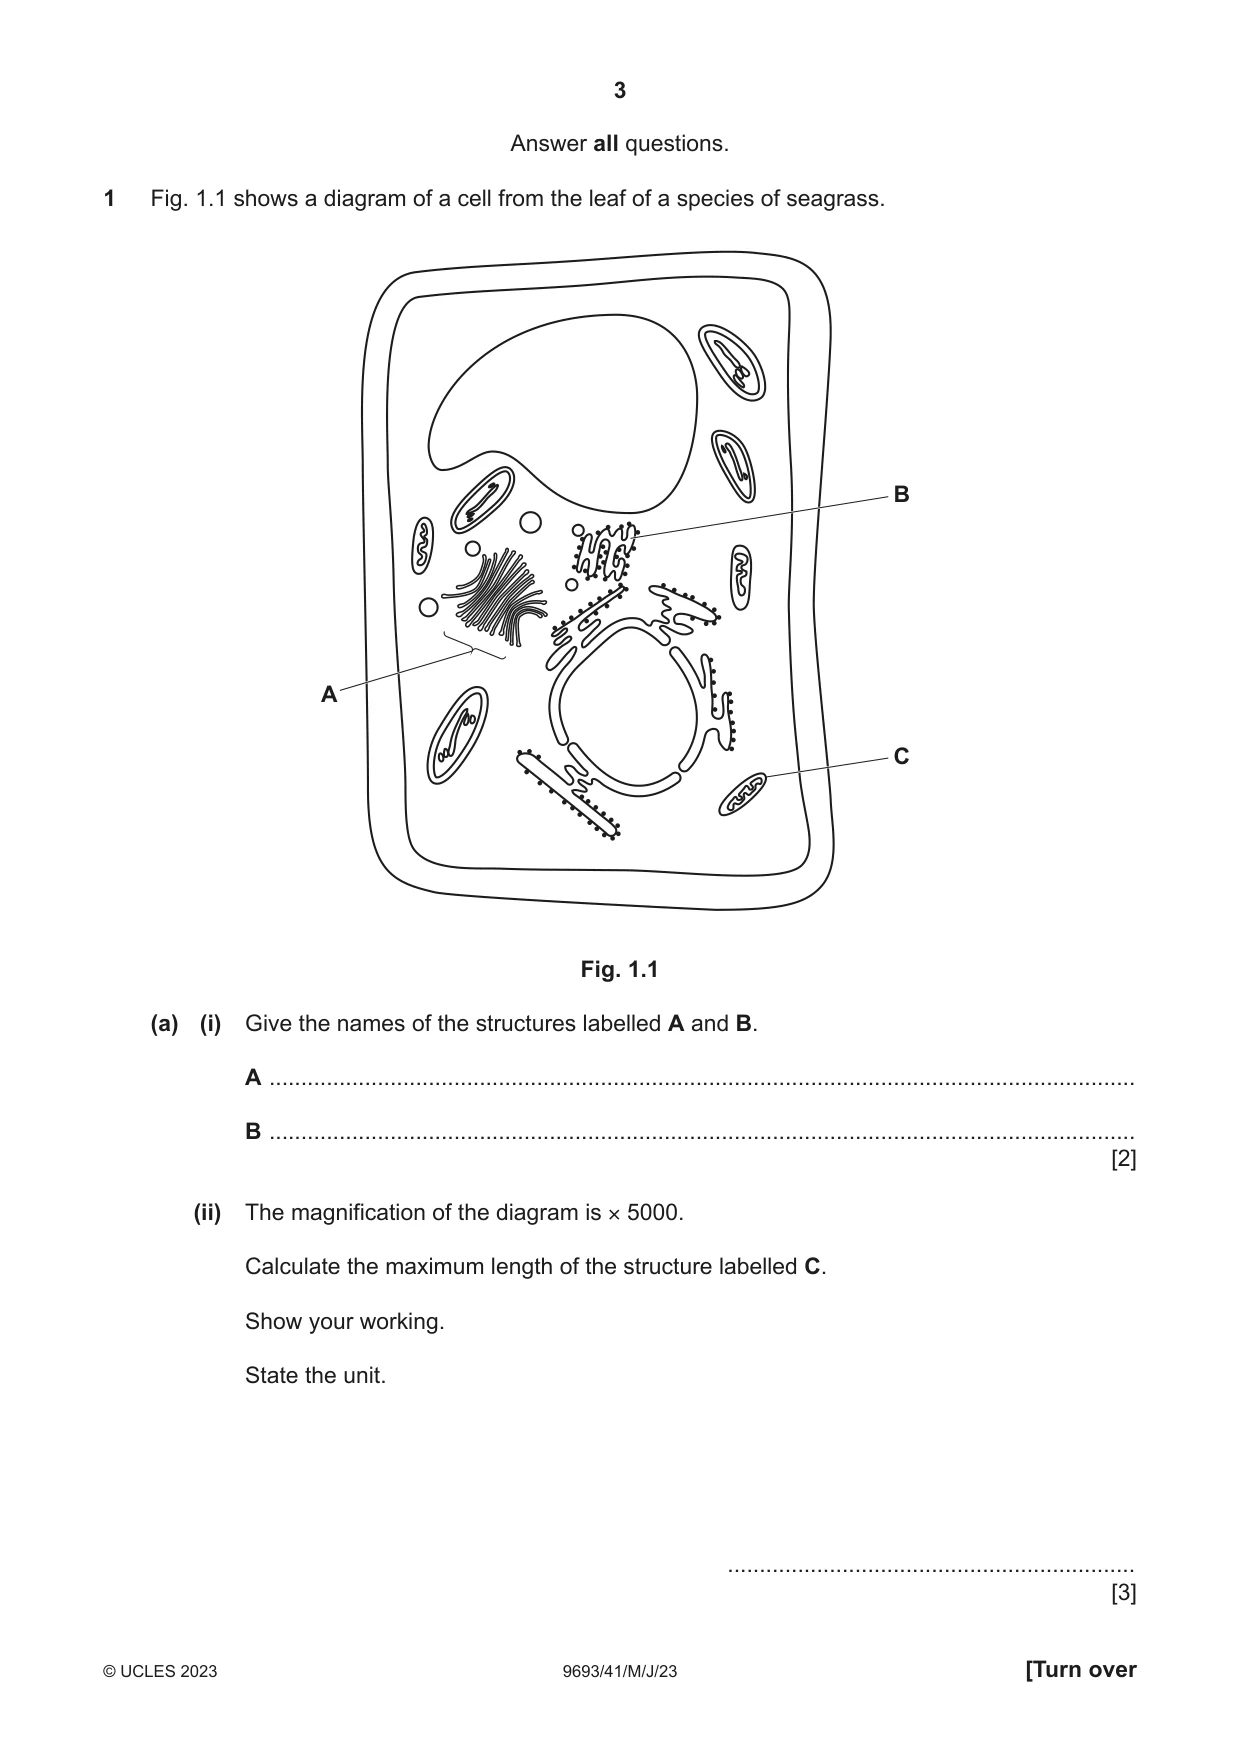
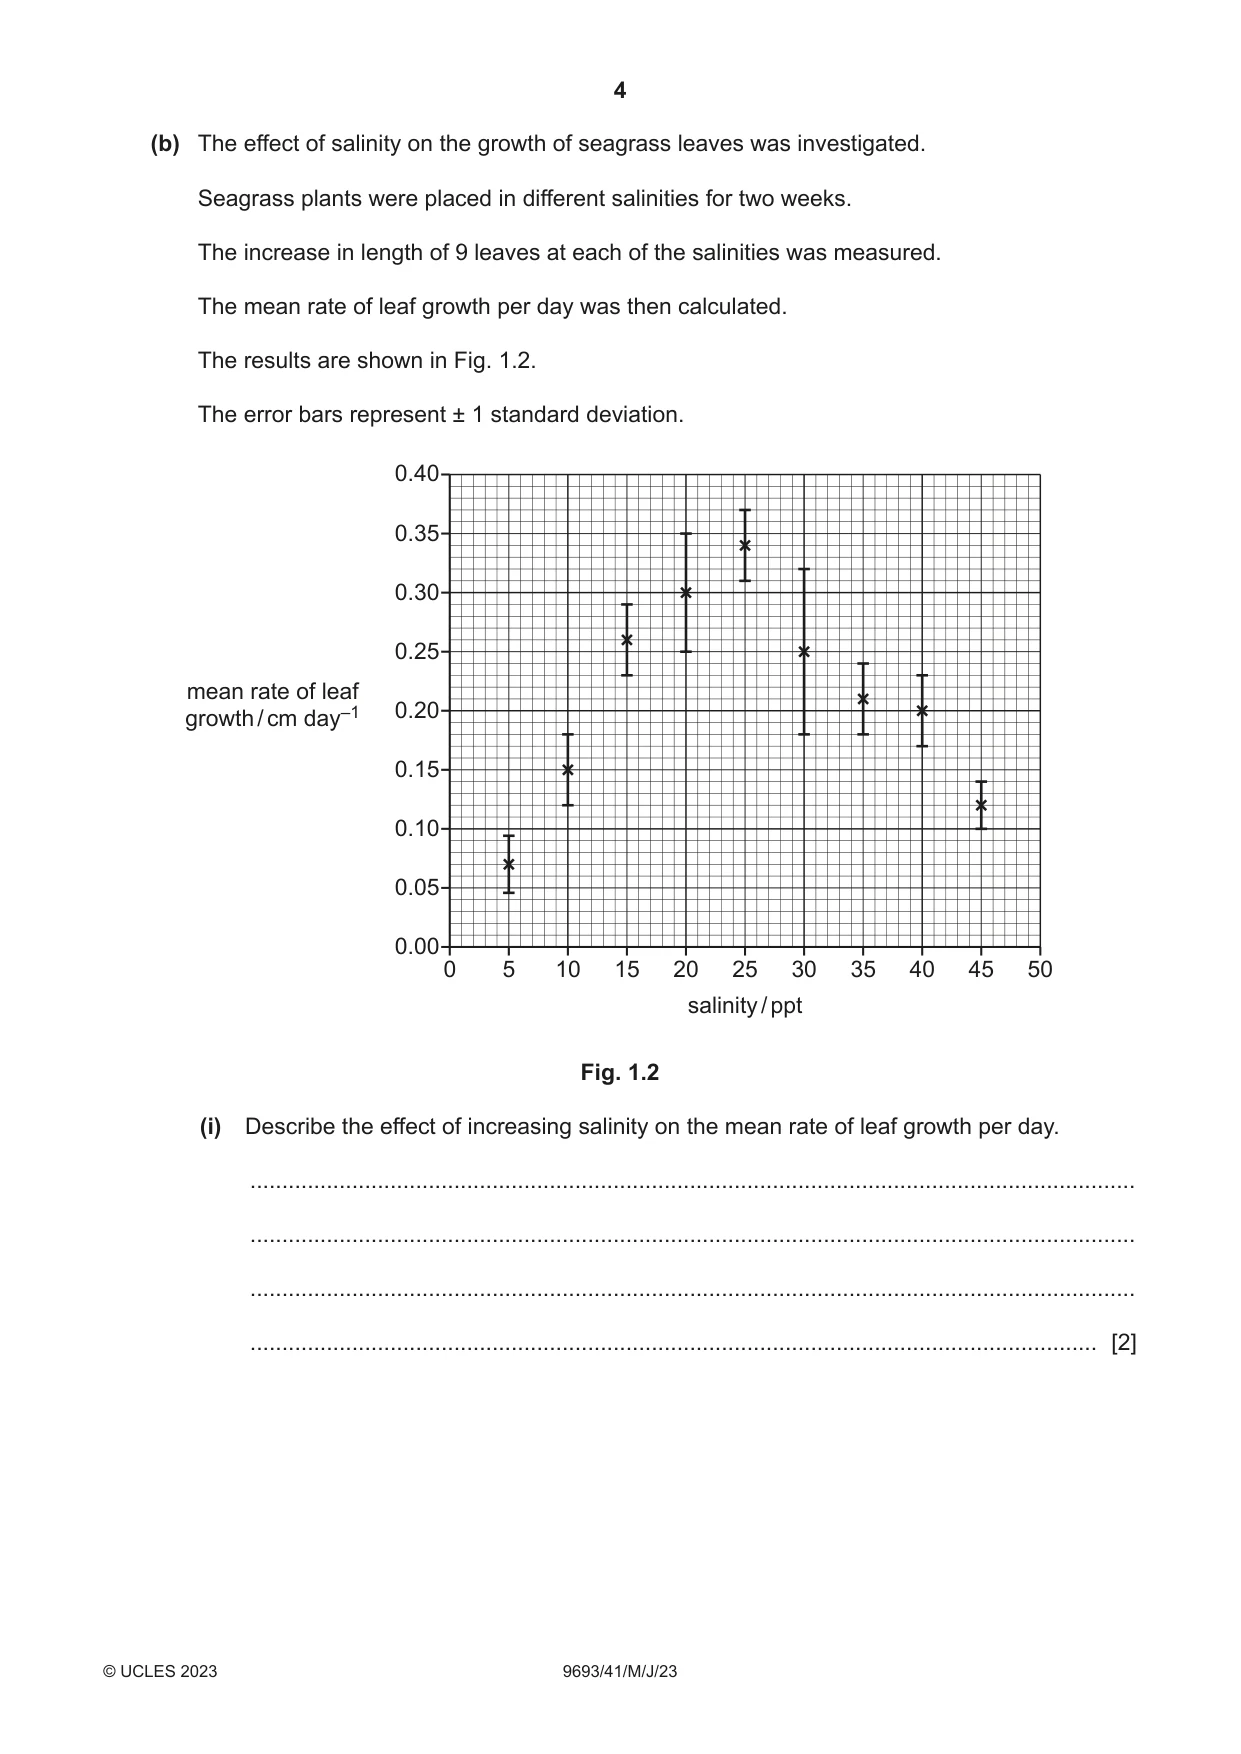
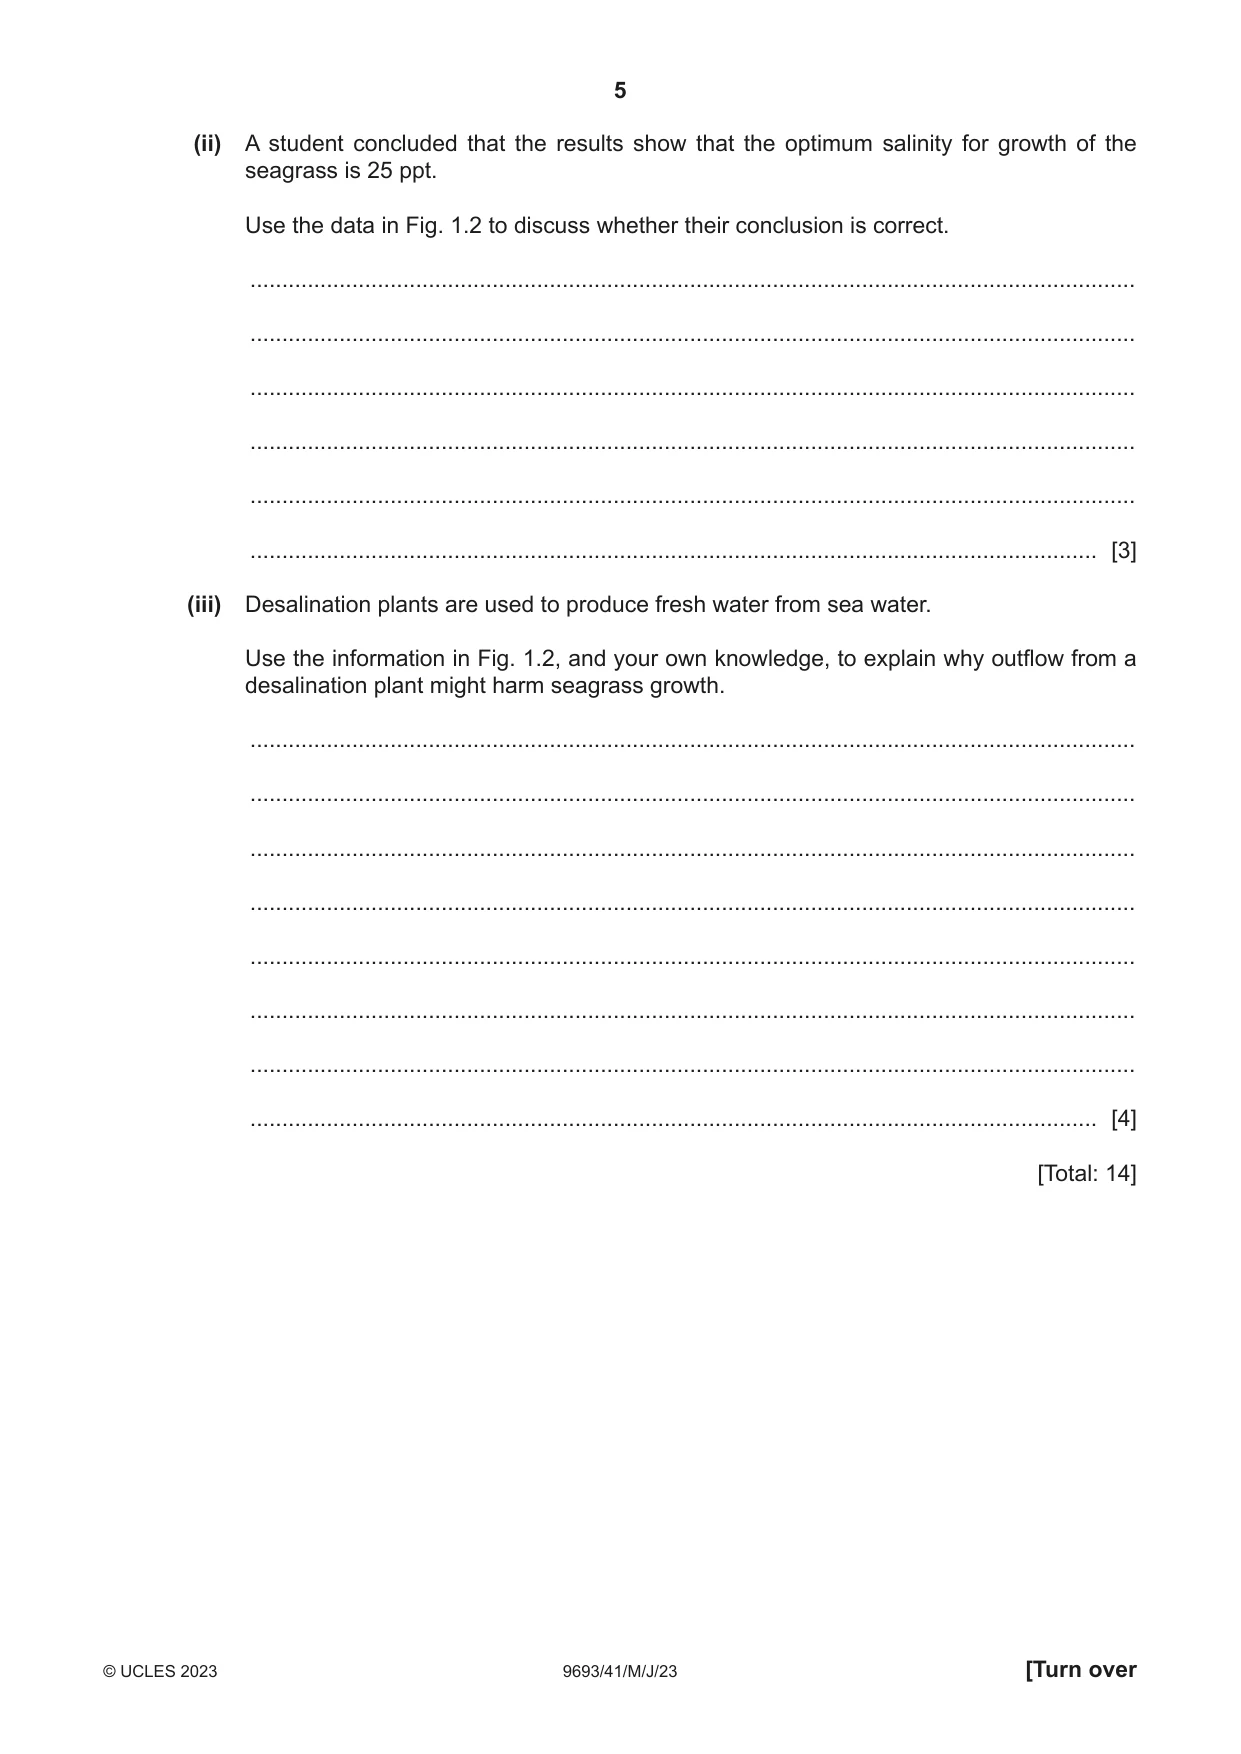
1 Fig. 1.1 shows a diagram of a cell from the leaf of a species of seagrass. B A C Fig. 1.1 (a) (i) Give the names of the structures labelled A and B. A ........................................................................................................................................ B ........................................................................................................................................ [2] (ii) The magnification of the diagram is × 5000. Calculate the maximum length of the structure labelled C. Show your working. State the unit. ................................................................ [3] (b) The effect of salinity on the growth of seagrass leaves was investigated. Seagrass plants were placed in different salinities for two weeks. The increase in length of 9 leaves at each of the salinities was measured. The mean rate of leaf growth per day was then calculated. The results are shown in Fig. 1.2. The error bars represent ± 1 standard deviation. 0.40 0.35 0.30 0.25 mean rate of leaf 0.20 growth / cm day–1 0.15 0.10 0.05 0.00 0 5 10 15 20 25 30 35 40 45 50 salinity / ppt Fig. 1.2 (i) Describe the effect of increasing salinity on the mean rate of leaf growth per day. ........................................................................................................................................... ........................................................................................................................................... ........................................................................................................................................... ..................................................................................................................................... [2] (ii) A student concluded that the results show that the optimum salinity for growth of the seagrass is 25 ppt. Use the data in Fig. 1.2 to discuss whether their conclusion is correct. ........................................................................................................................................... ........................................................................................................................................... ........................................................................................................................................... ........................................................................................................................................... ........................................................................................................................................... ..................................................................................................................................... [3] (iii) Desalination plants are used to produce fresh water from sea water. Use the information in Fig. 1.2, and your own knowledge, to explain why outflow from a desalination plant might harm seagrass growth. ........................................................................................................................................... ........................................................................................................................................... ........................................................................................................................................... ........................................................................................................................................... ........................................................................................................................................... ........................................................................................................................................... ........................................................................................................................................... ..................................................................................................................................... [4] [Total: 14]
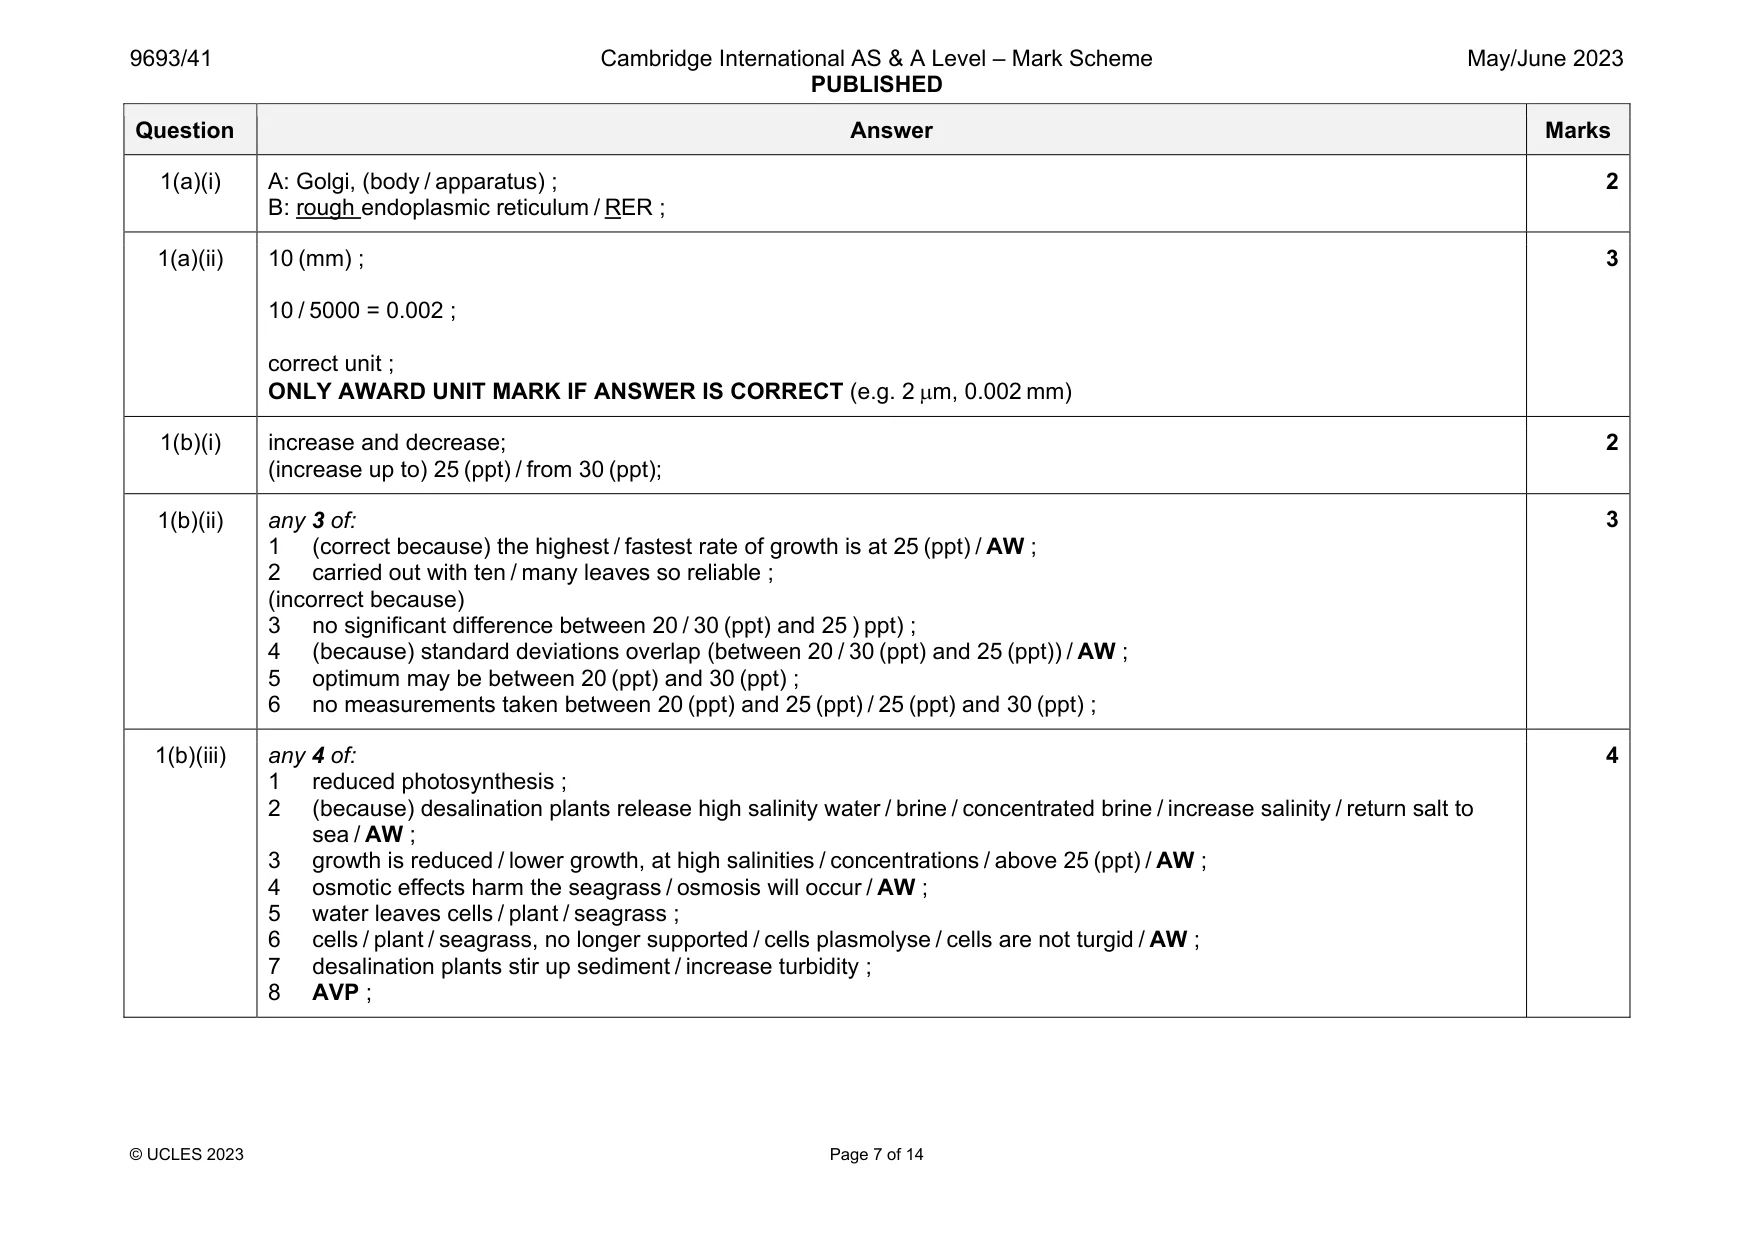
Mark scheme: 1(a)(i) A: Golgi, (body / apparatus) ; B: rough endoplasmic reticulum / RER ; 2 1(a)(ii) 10 (mm) ; 10 / 5000 = 0.002 ; correct unit ; ONLY AWARD UNIT MARK IF ANSWER IS CORRECT (e.g. 2 m, 0.002 mm) 3 1(b)(i) increase and decrease; (increase up to) 25 (ppt) / from 30 (ppt); 2 1(b)(ii) any 3 of: 1 (correct because) the highest / fastest rate of growth is at 25 (ppt) / AW ; 2 carried out with ten / many leaves so reliable ; (incorrect because) 3 no significant difference between 20 / 30 (ppt) and 25 ) ppt) ; 4 (because) standard deviations overlap (between 20 / 30 (ppt) and 25 (ppt)) / AW ; 5 optimum may be between 20 (ppt) and 30 (ppt) ; 6 no measurements taken between 20 (ppt) and 25 (ppt) / 25 (ppt) and 30 (ppt) ; 3 1(b)(iii) any 4 of: 1 reduced photosynthesis ; 2 (because) desalination plants release high salinity water / brine / concentrated brine / increase salinity / return salt to sea / AW ; 3 growth is reduced / lower growth, at high salinities / concentrations / above 25 (ppt) / AW ; 4 osmotic effects harm the seagrass / osmosis will occur / AW ; 5 water leaves cells / plant / seagrass ; 6 cells / plant / seagrass, no longer supported / cells plasmolyse / cells are not turgid / AW ; 7 desalination plants stir up sediment / increase turbidity ; 8 AVP ; 4
Q2 · Photosynthesis occurs in chloroplasts
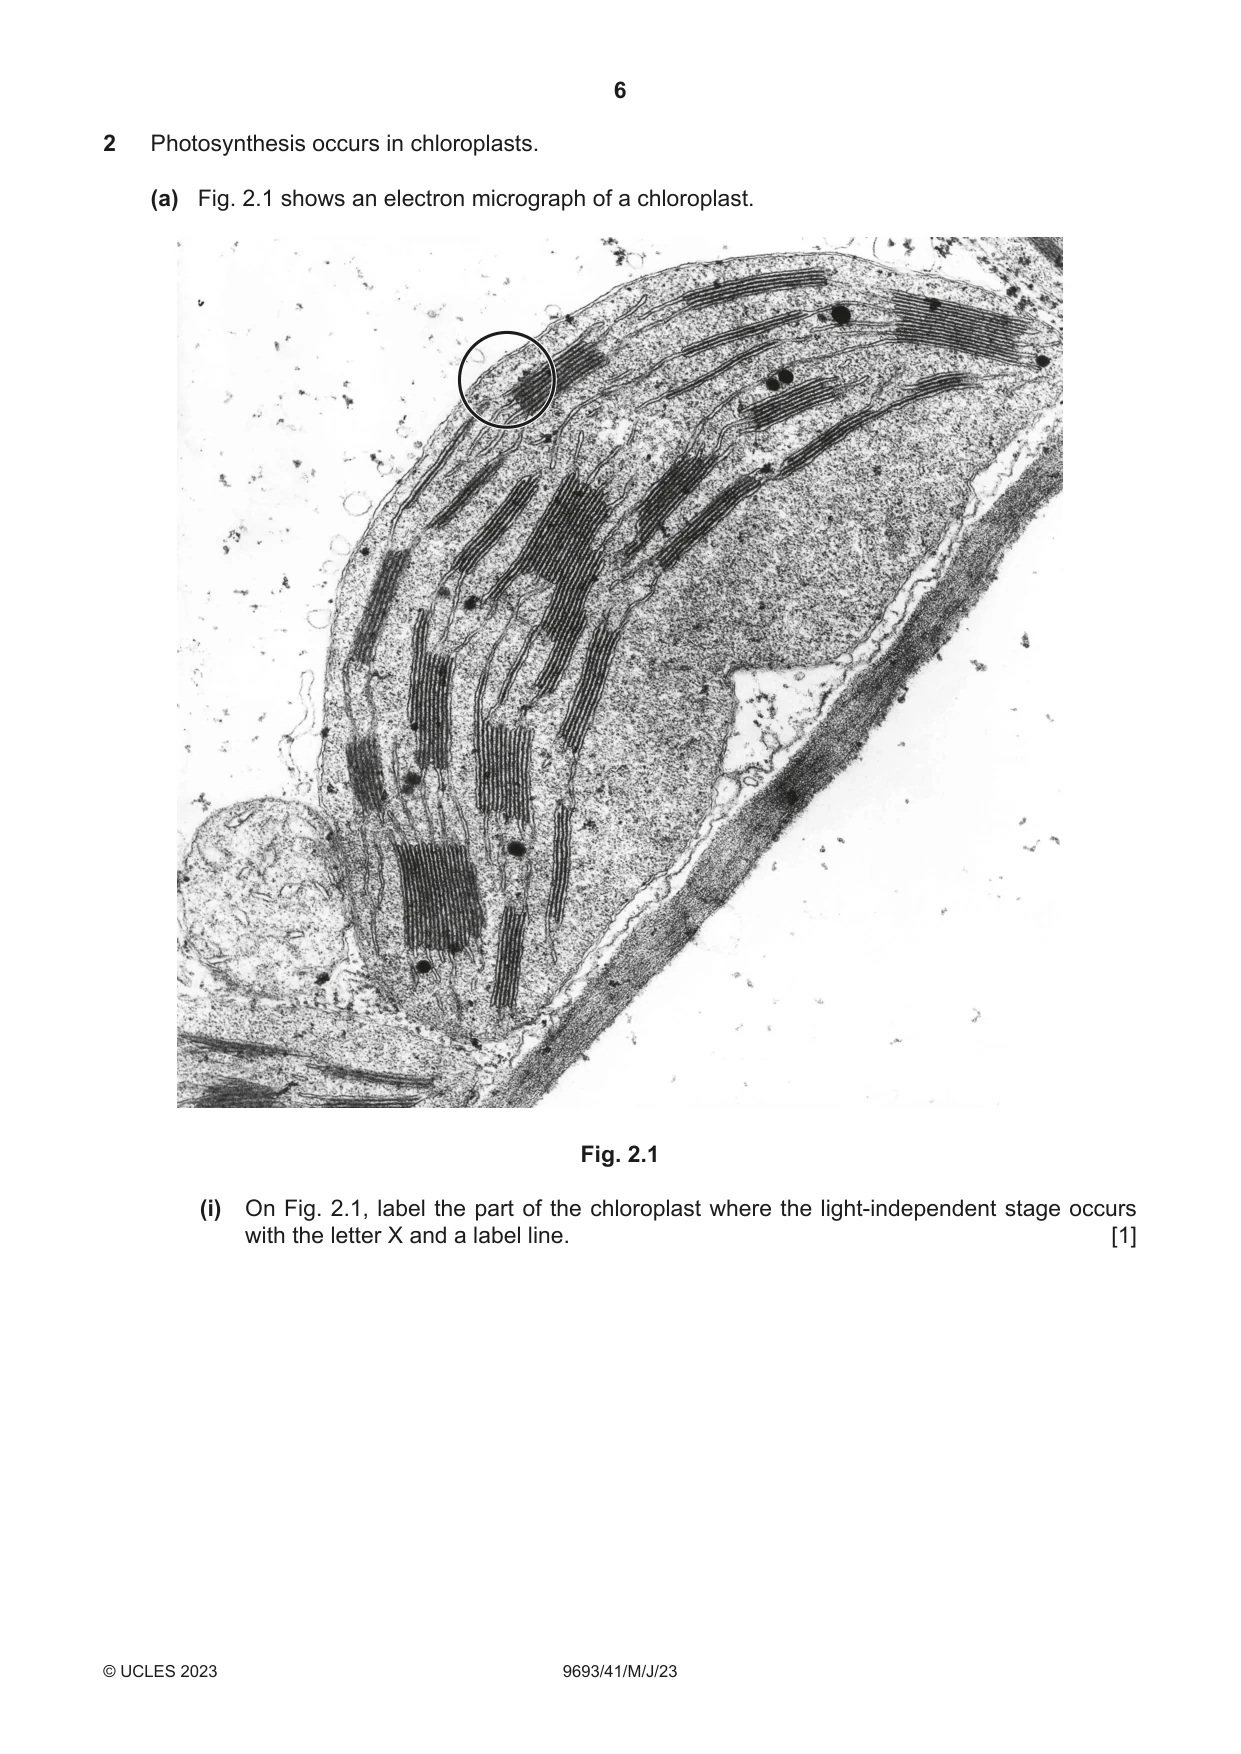
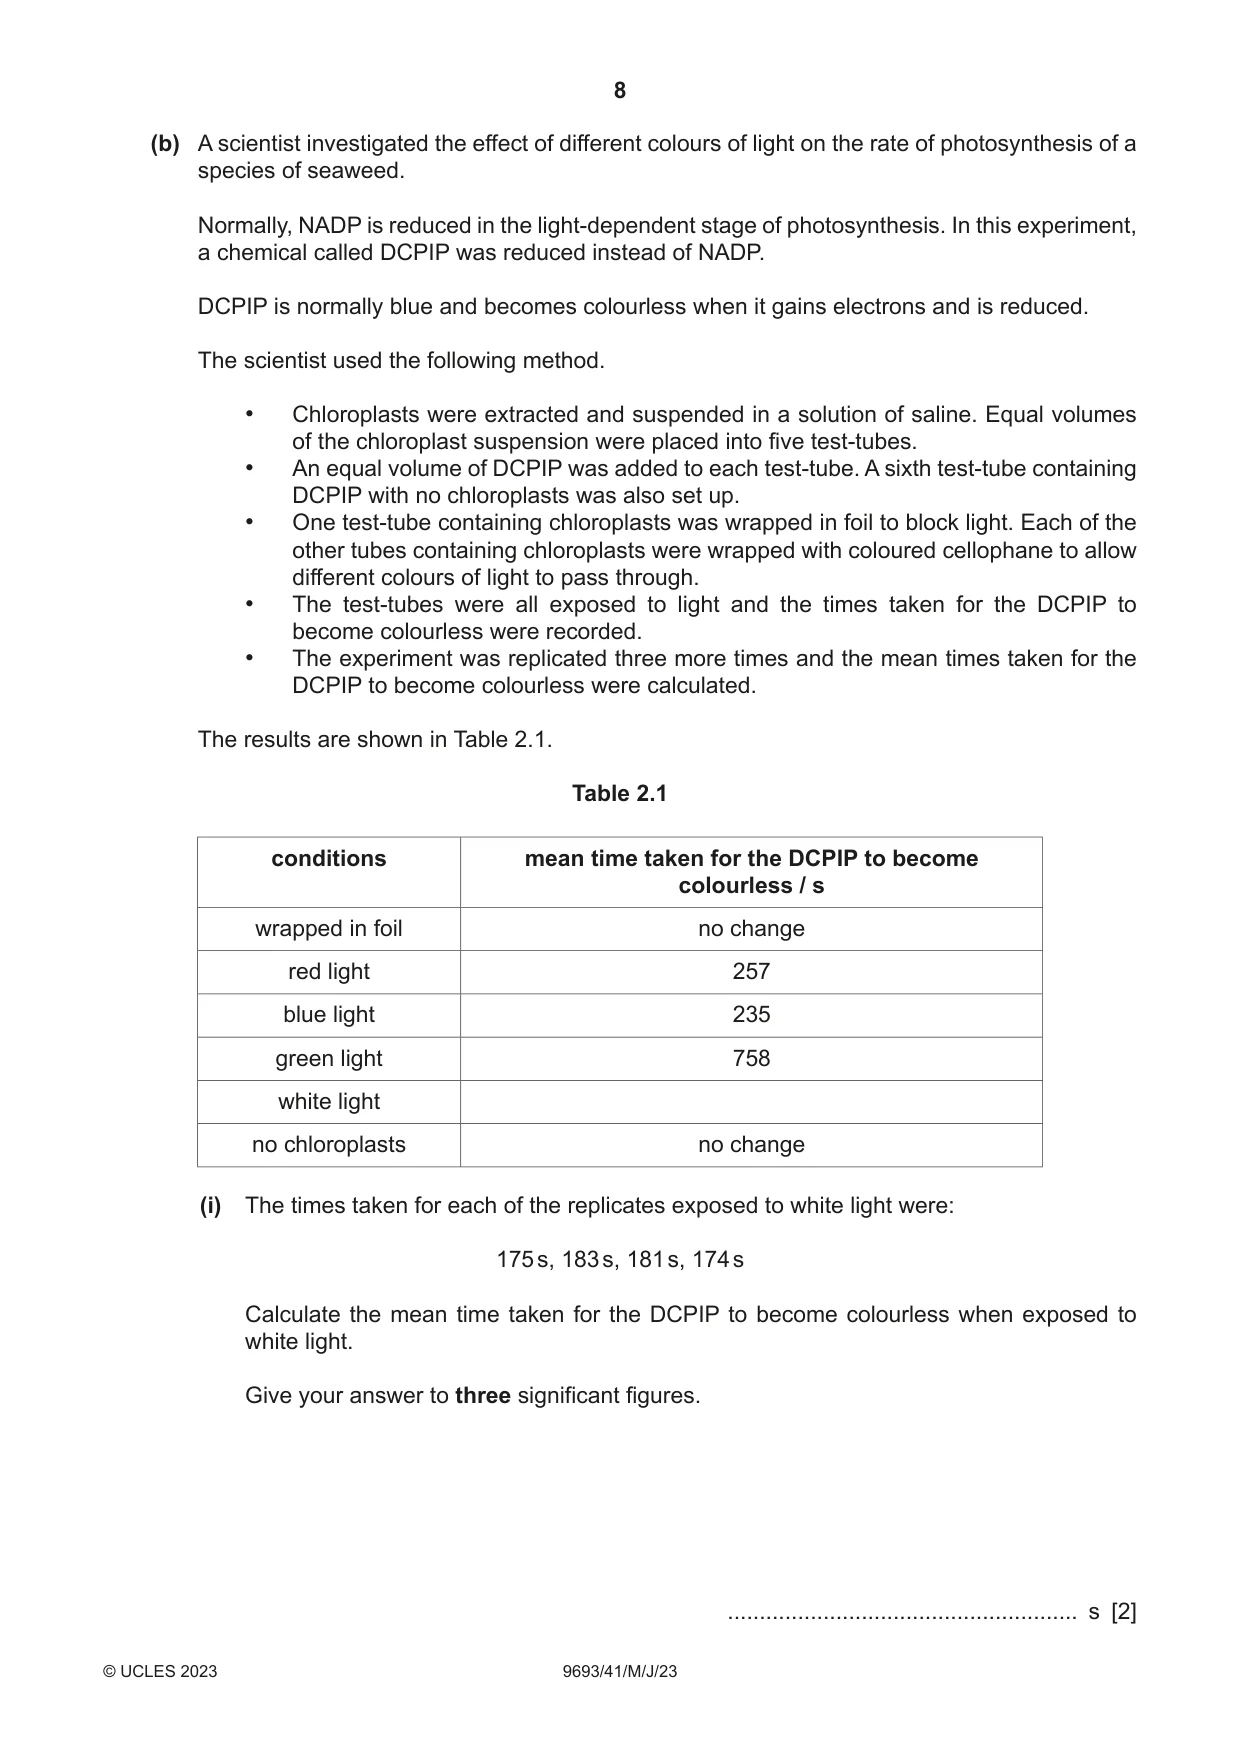
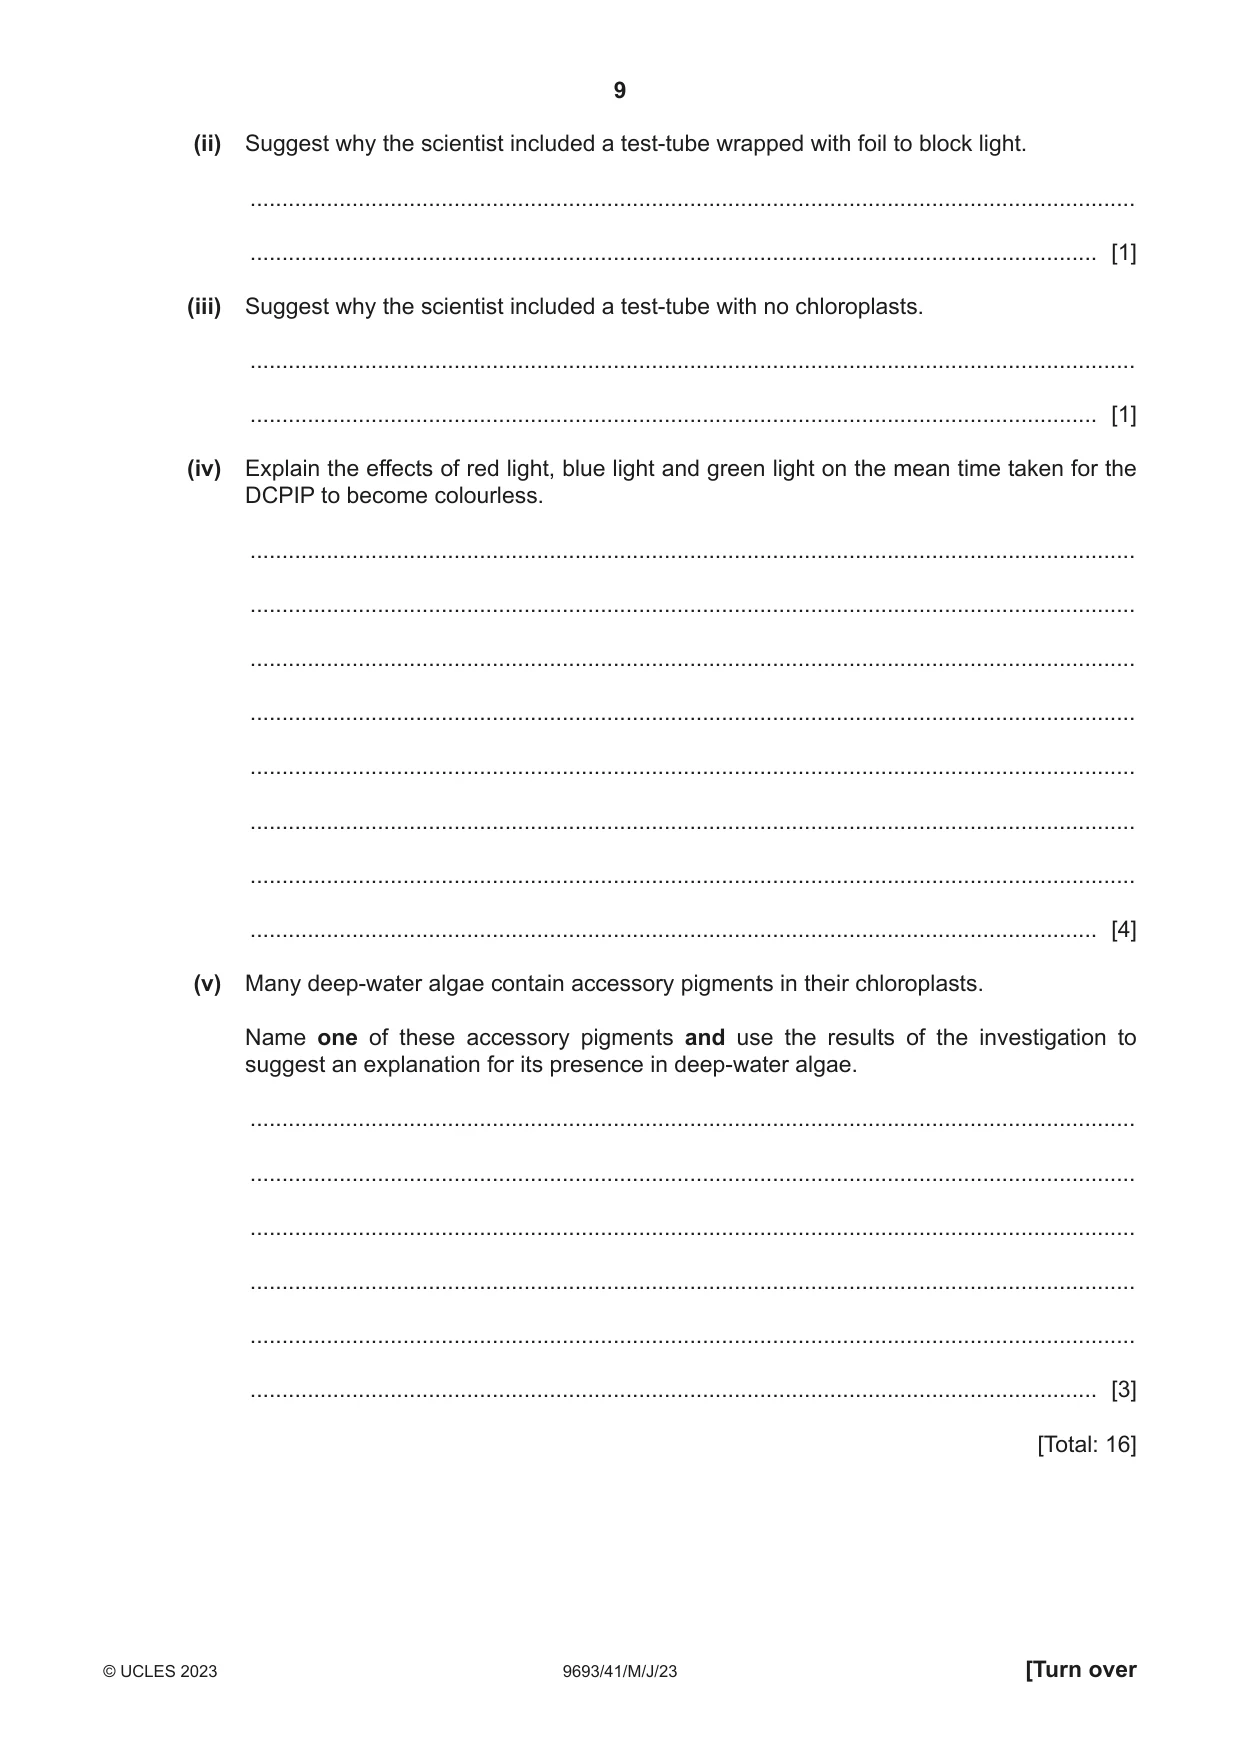
2 Photosynthesis occurs in chloroplasts. (a) Fig. 2.1 shows an electron micrograph of a chloroplast. Fig. 2.1 (i) On Fig. 2.1, label the part of the chloroplast where the light-independent stage occurs with the letter X and a label line. [1] (ii) Make a large drawing of the part of the chloroplast shown in the circle in Fig. 2.1. Do not label your drawing. [4] (b) A scientist investigated the effect of different colours of light on the rate of photosynthesis of a species of seaweed. Normally, NADP is reduced in the light-dependent stage of photosynthesis. In this experiment, a chemical called DCPIP was reduced instead of NADP. DCPIP is normally blue and becomes colourless when it gains electrons and is reduced. The scientist used the following method. • Chloroplasts were extracted and suspended in a solution of saline. Equal volumes of the chloroplast suspension were placed into five test-tubes. • An equal volume of DCPIP was added to each test-tube. A sixth test-tube containing DCPIP with no chloroplasts was also set up. • One test-tube containing chloroplasts was wrapped in foil to block light. Each of the other tubes containing chloroplasts were wrapped with coloured cellophane to allow different colours of light to pass through. • The test-tubes were all exposed to light and the times taken for the DCPIP to become colourless were recorded. • The experiment was replicated three more times and the mean times taken for the DCPIP to become colourless were calculated. The results are shown in Table 2.1. Table 2.1 conditions mean time taken for the DCPIP to become colourless / s wrapped in foil no change red light 257 blue light 235 green light 758 white light no chloroplasts no change (i) The times taken for each of the replicates exposed to white light were: 175 s, 183 s, 181 s, 174 s Calculate the mean time taken for the DCPIP to become colourless when exposed to white light. Give your answer to three significant figures. ....................................................... s [2] (ii) Suggest why the scientist included a test-tube wrapped with foil to block light. ........................................................................................................................................... ..................................................................................................................................... [1] (iii) Suggest why the scientist included a test-tube with no chloroplasts. ........................................................................................................................................... ..................................................................................................................................... [1] (iv) Explain the effects of red light, blue light and green light on the mean time taken for the DCPIP to become colourless. ........................................................................................................................................... ........................................................................................................................................... ........................................................................................................................................... ........................................................................................................................................... ........................................................................................................................................... ........................................................................................................................................... ........................................................................................................................................... ..................................................................................................................................... [4] (v) Many deep-water algae contain accessory pigments in their chloroplasts. Name one of these accessory pigments and use the results of the investigation to suggest an explanation for its presence in deep-water algae. ........................................................................................................................................... ........................................................................................................................................... ........................................................................................................................................... ........................................................................................................................................... ........................................................................................................................................... ..................................................................................................................................... [3] [Total: 16]
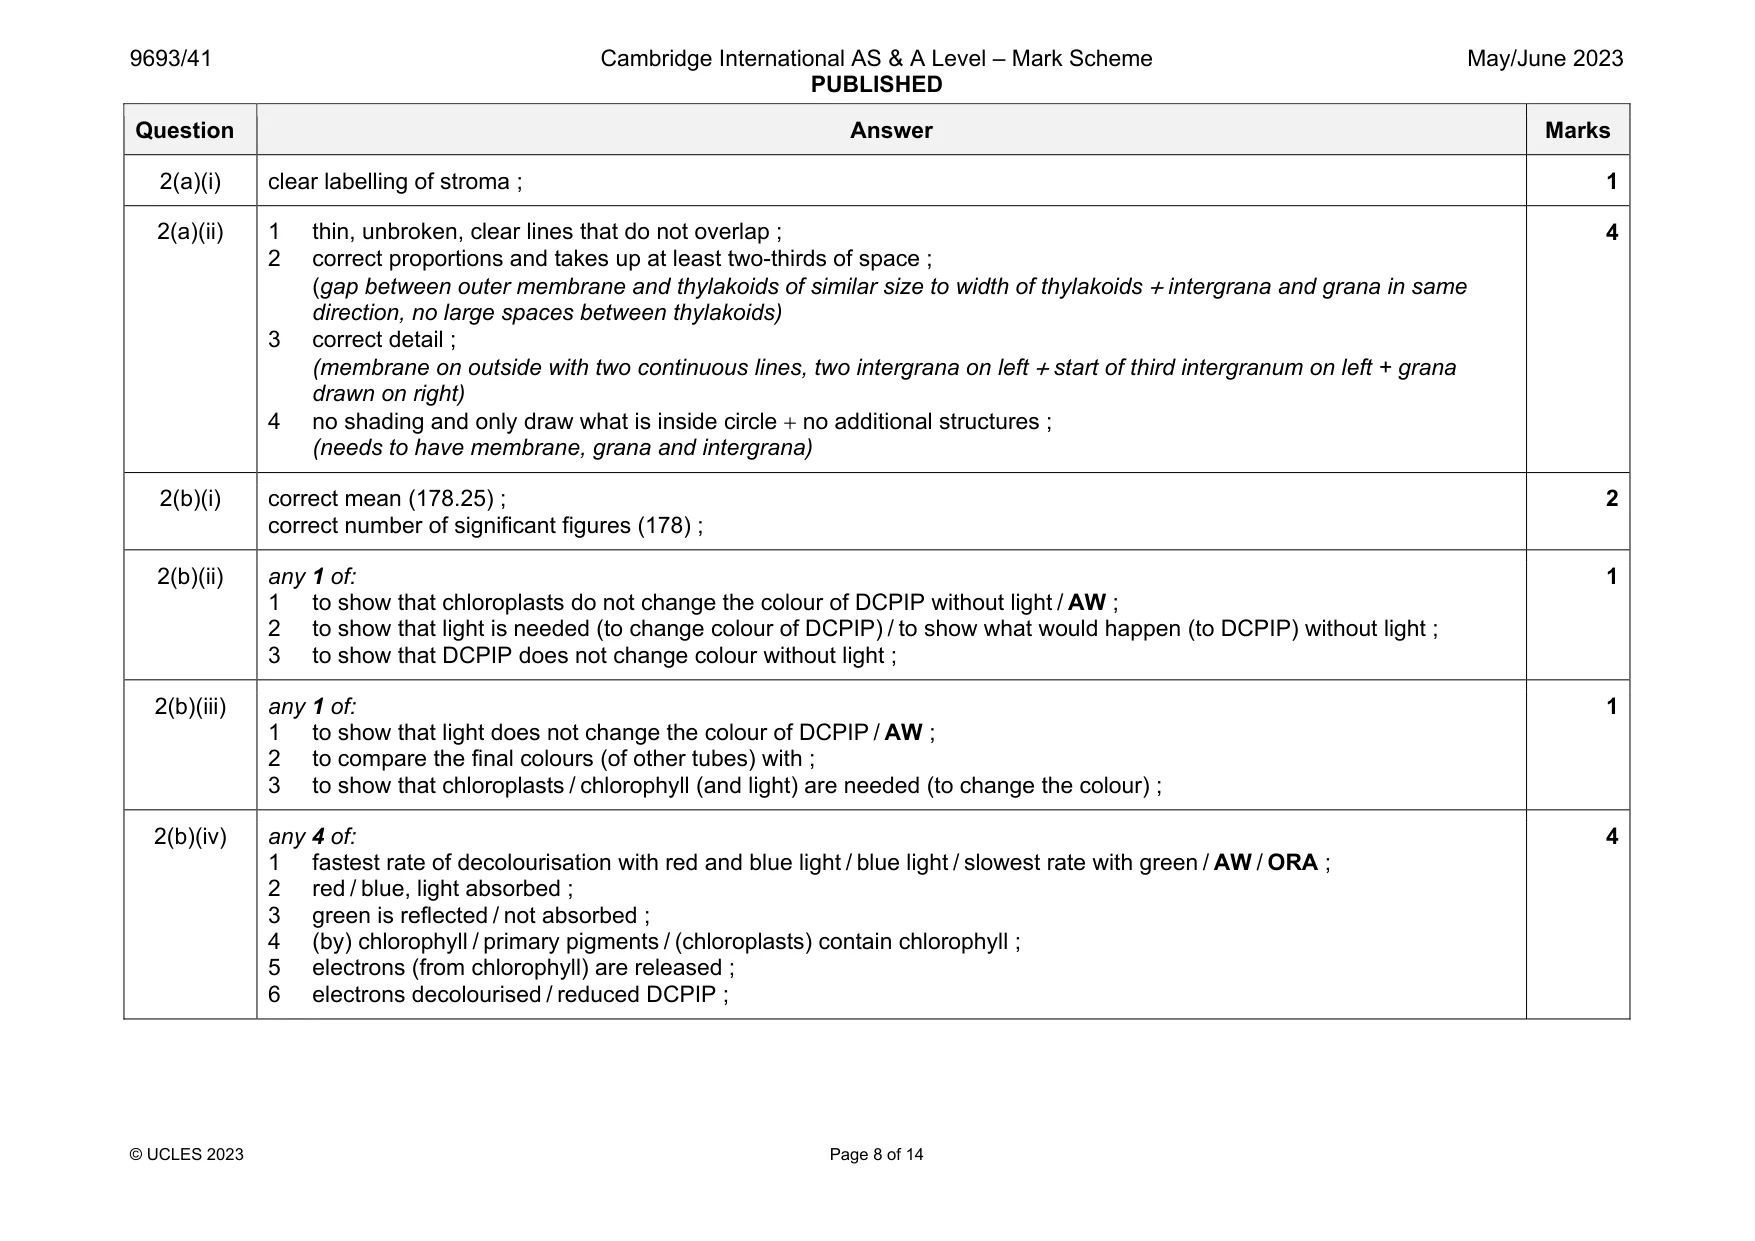
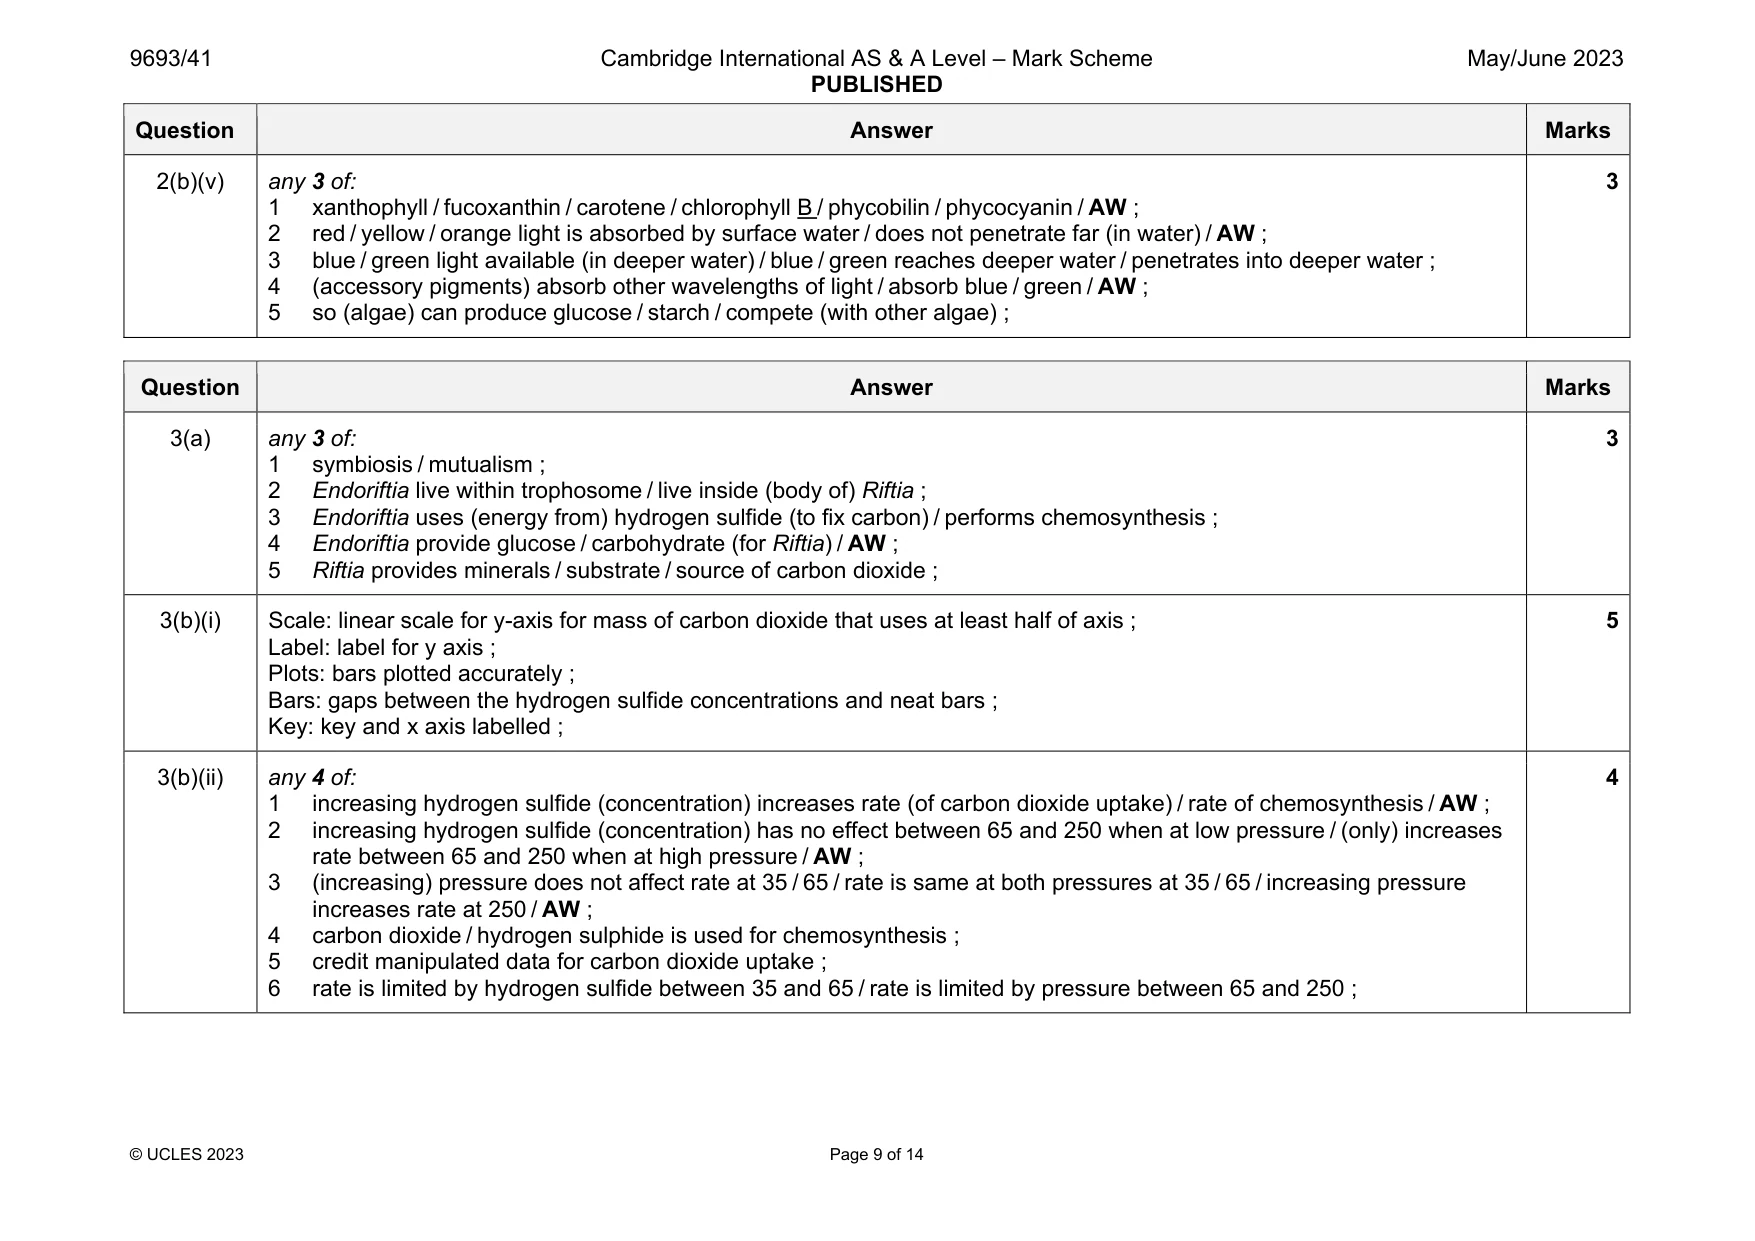
Mark scheme: 2(a)(i) clear labelling of stroma ; 1 2(a)(ii) 1 thin, unbroken, clear lines that do not overlap ; 2 correct proportions and takes up at least two-thirds of space ; (gap between outer membrane and thylakoids of similar size to width of thylakoids intergrana and grana in same direction, no large spaces between thylakoids) 3 correct detail ; (membrane on outside with two continuous lines, two intergrana on left start of third intergranum on left + grana drawn on right) 4 no shading and only draw what is inside circle no additional structures ; (needs to have membrane, grana and intergrana) 4 2(b)(i) correct mean (178.25) ; correct number of significant figures (178) ; 2 2(b)(ii) any 1 of: 1 to show that chloroplasts do not change the colour of DCPIP without light / AW ; 2 to show that light is needed (to change colour of DCPIP) / to show what would happen (to DCPIP) without light ; 3 to show that DCPIP does not change colour without light ; 1 2(b)(iii) any 1 of: 1 to show that light does not change the colour of DCPIP / AW ; 2 to compare the final colours (of other tubes) with ; 3 to show that chloroplasts / chlorophyll (and light) are needed (to change the colour) ; 1 2(b)(iv) any 4 of: 1 fastest rate of decolourisation with red and blue light / blue light / slowest rate with green / AW / ORA ; 2 red / blue, light absorbed ; 3 green is reflected / not absorbed ; 4 (by) chlorophyll / primary pigments / (chloroplasts) contain chlorophyll ; 5 electrons (from chlorophyll) are released ; 6 electrons decolourised / reduced DCPIP ; 4 Question Answer Marks 2(b)(v) any 3 of: 1 xanthophyll / fucoxanthin / carotene / chlorophyll B / phycobilin / phycocyanin / AW ; 2 red / yellow / orange light is absorbed by surface water / does not penetrate far (in water) / AW ; 3 blue / green light available (in deeper water) / blue / green reaches deeper water / penetrates into deeper water ; 4 (accessory pigments) absorb other wavelengths of light / absorb blue / green / AW ; 5 so (algae) can produce glucose / starch / compete (with other algae) ; 3
Q3 · Tubeworms, Riftia, near a hydrothermal vent
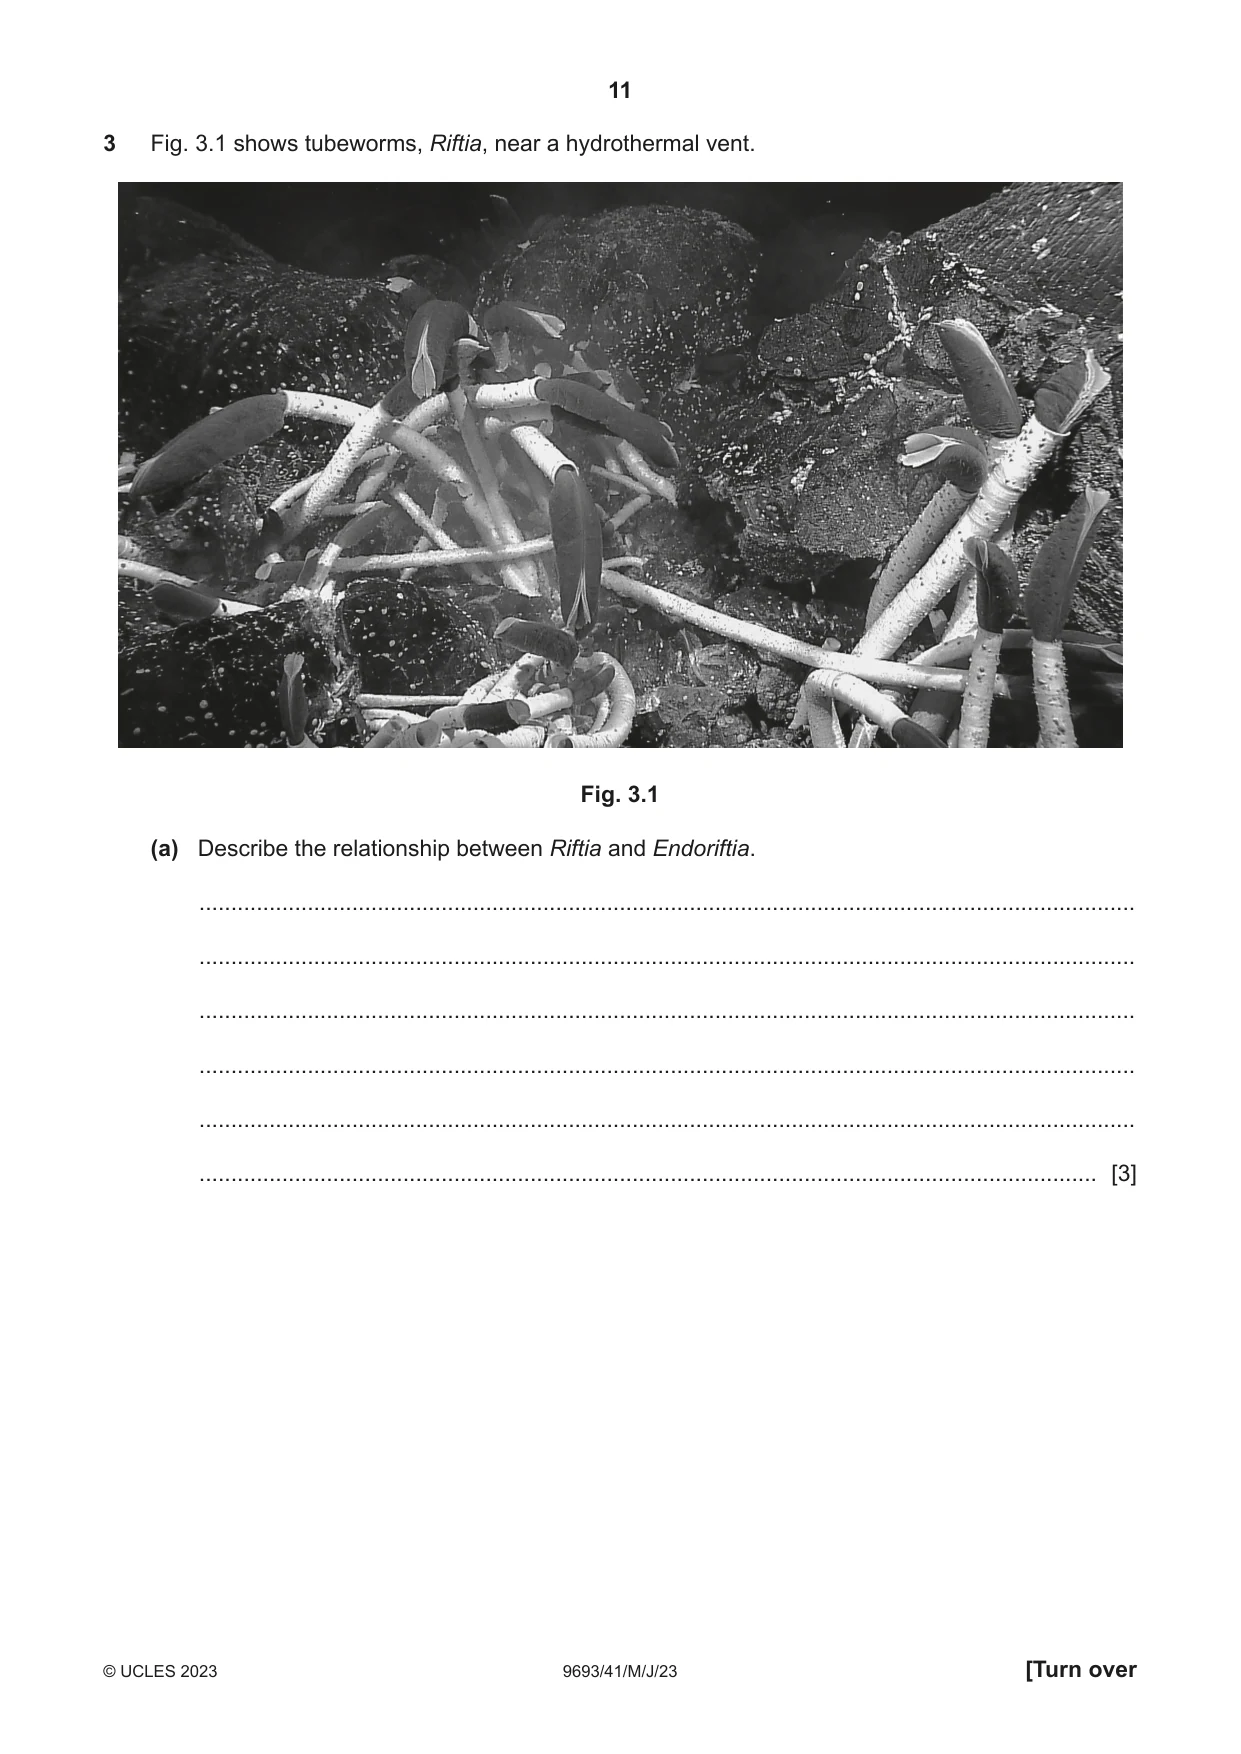
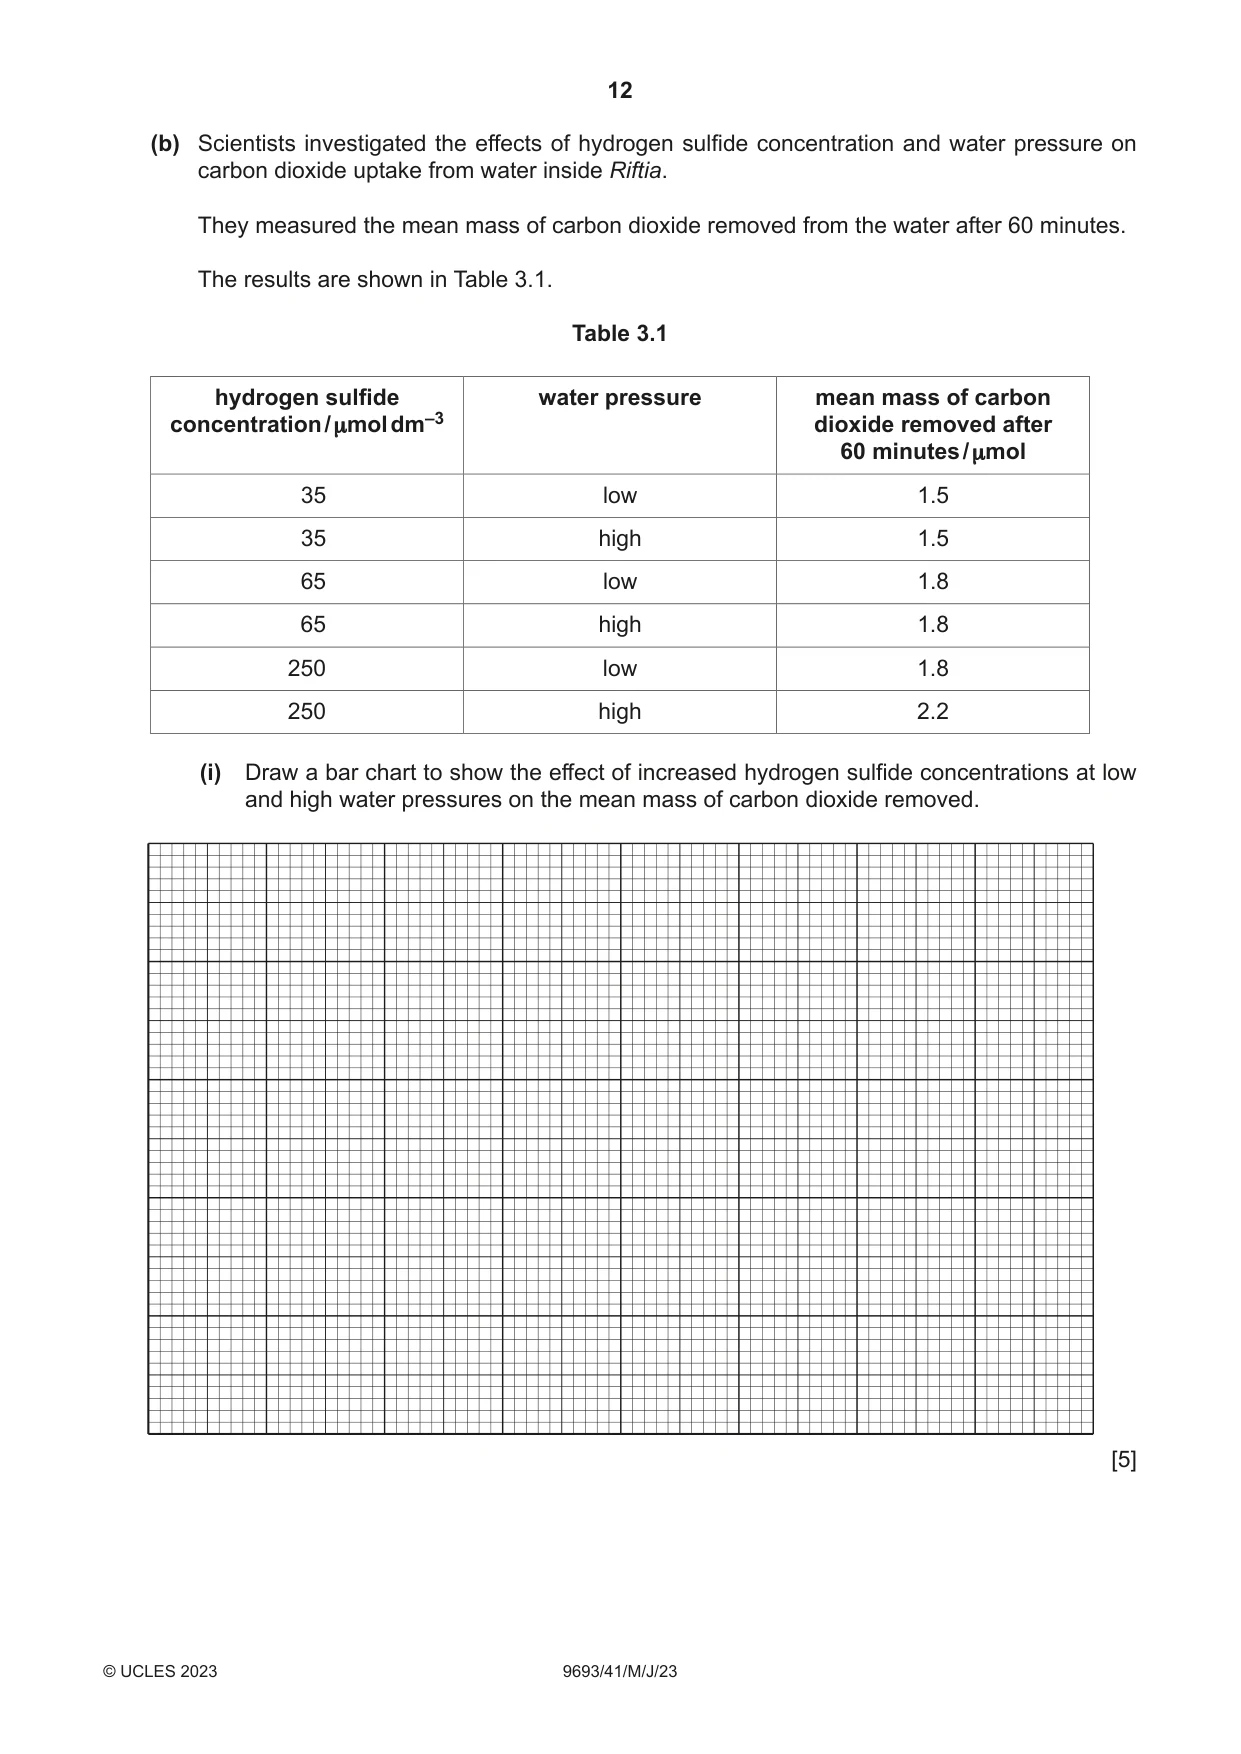
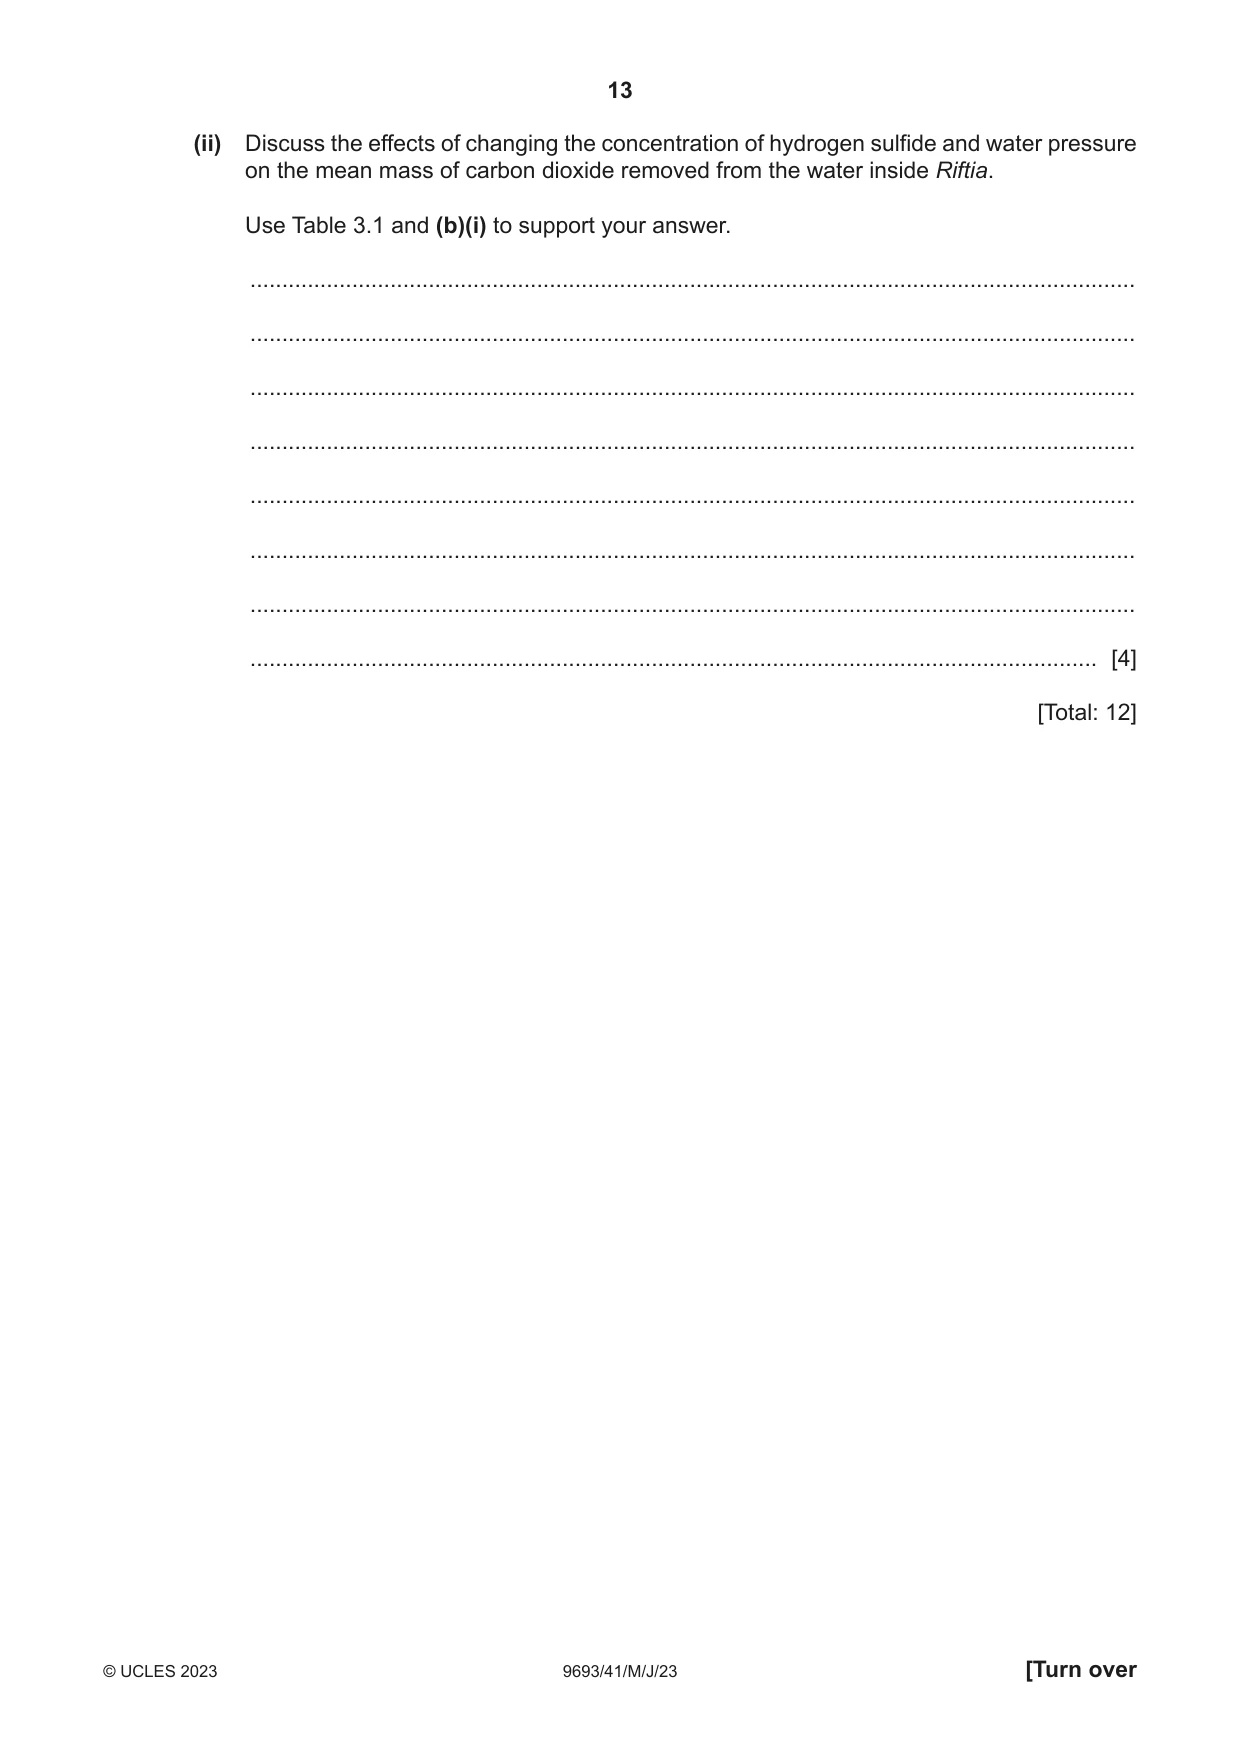
3 Fig. 3.1 shows tubeworms, Riftia, near a hydrothermal vent. Fig. 3.1 (a) Describe the relationship between Riftia and Endoriftia. ................................................................................................................................................... ................................................................................................................................................... ................................................................................................................................................... ................................................................................................................................................... ................................................................................................................................................... ............................................................................................................................................. [3] (b) Scientists investigated the effects of hydrogen sulfide concentration and water pressure on carbon dioxide uptake from water inside Riftia. They measured the mean mass of carbon dioxide removed from the water after 60 minutes. The results are shown in Table 3.1. Table 3.1 hydrogen sulfide water pressure mean mass of carbon concentration / μmol dm–3 dioxide removed after 60 minutes / μmol 35 low 1.5 35 high 1.5 65 low 1.8 65 high 1.8 250 low 1.8 250 high 2.2 (i) Draw a bar chart to show the effect of increased hydrogen sulfide concentrations at low and high water pressures on the mean mass of carbon dioxide removed. [5] (ii) Discuss the effects of changing the concentration of hydrogen sulfide and water pressure on the mean mass of carbon dioxide removed from the water inside Riftia. Use Table 3.1 and (b)(i) to support your answer. ........................................................................................................................................... ........................................................................................................................................... ........................................................................................................................................... ........................................................................................................................................... ........................................................................................................................................... ........................................................................................................................................... ........................................................................................................................................... ..................................................................................................................................... [4] [Total: 12]
Mark scheme: 3(a) any 3 of: 1 symbiosis / mutualism ; 2 Endoriftia live within trophosome / live inside (body of) Riftia ; 3 Endoriftia uses (energy from) hydrogen sulfide (to fix carbon) / performs chemosynthesis ; 4 Endoriftia provide glucose / carbohydrate (for Riftia) / AW ; 5 Riftia provides minerals / substrate / source of carbon dioxide ; 3(b)(i) Scale: linear scale for y-axis for mass of carbon dioxide that uses at least half of axis ; Label: label for y axis ; Plots: bars plotted accurately ; Bars: gaps between the hydrogen sulfide concentrations and neat bars ; Key: key and x axis labelled ; 5 3(b)(ii) any 4 of: 1 increasing hydrogen sulfide (concentration) increases rate (of carbon dioxide uptake) / rate of chemosynthesis / AW ; 2 increasing hydrogen sulfide (concentration) has no effect between 65 and 250 when at low pressure / (only) increases rate between 65 and 250 when at high pressure / AW ; 3 (increasing) pressure does not affect rate at 35 / 65 / rate is same at both pressures at 35 / 65 / increasing pressure increases rate at 250 / AW ; 4 carbon dioxide / hydrogen sulphide is used for chemosynthesis ; 5 credit manipulated data for carbon dioxide uptake ; 6 rate is limited by hydrogen sulfide between 35 and 65 / rate is limited by pressure between 65 and 250 ; 4
Q4 · Aquaculture is used to produce large quantities of seafood
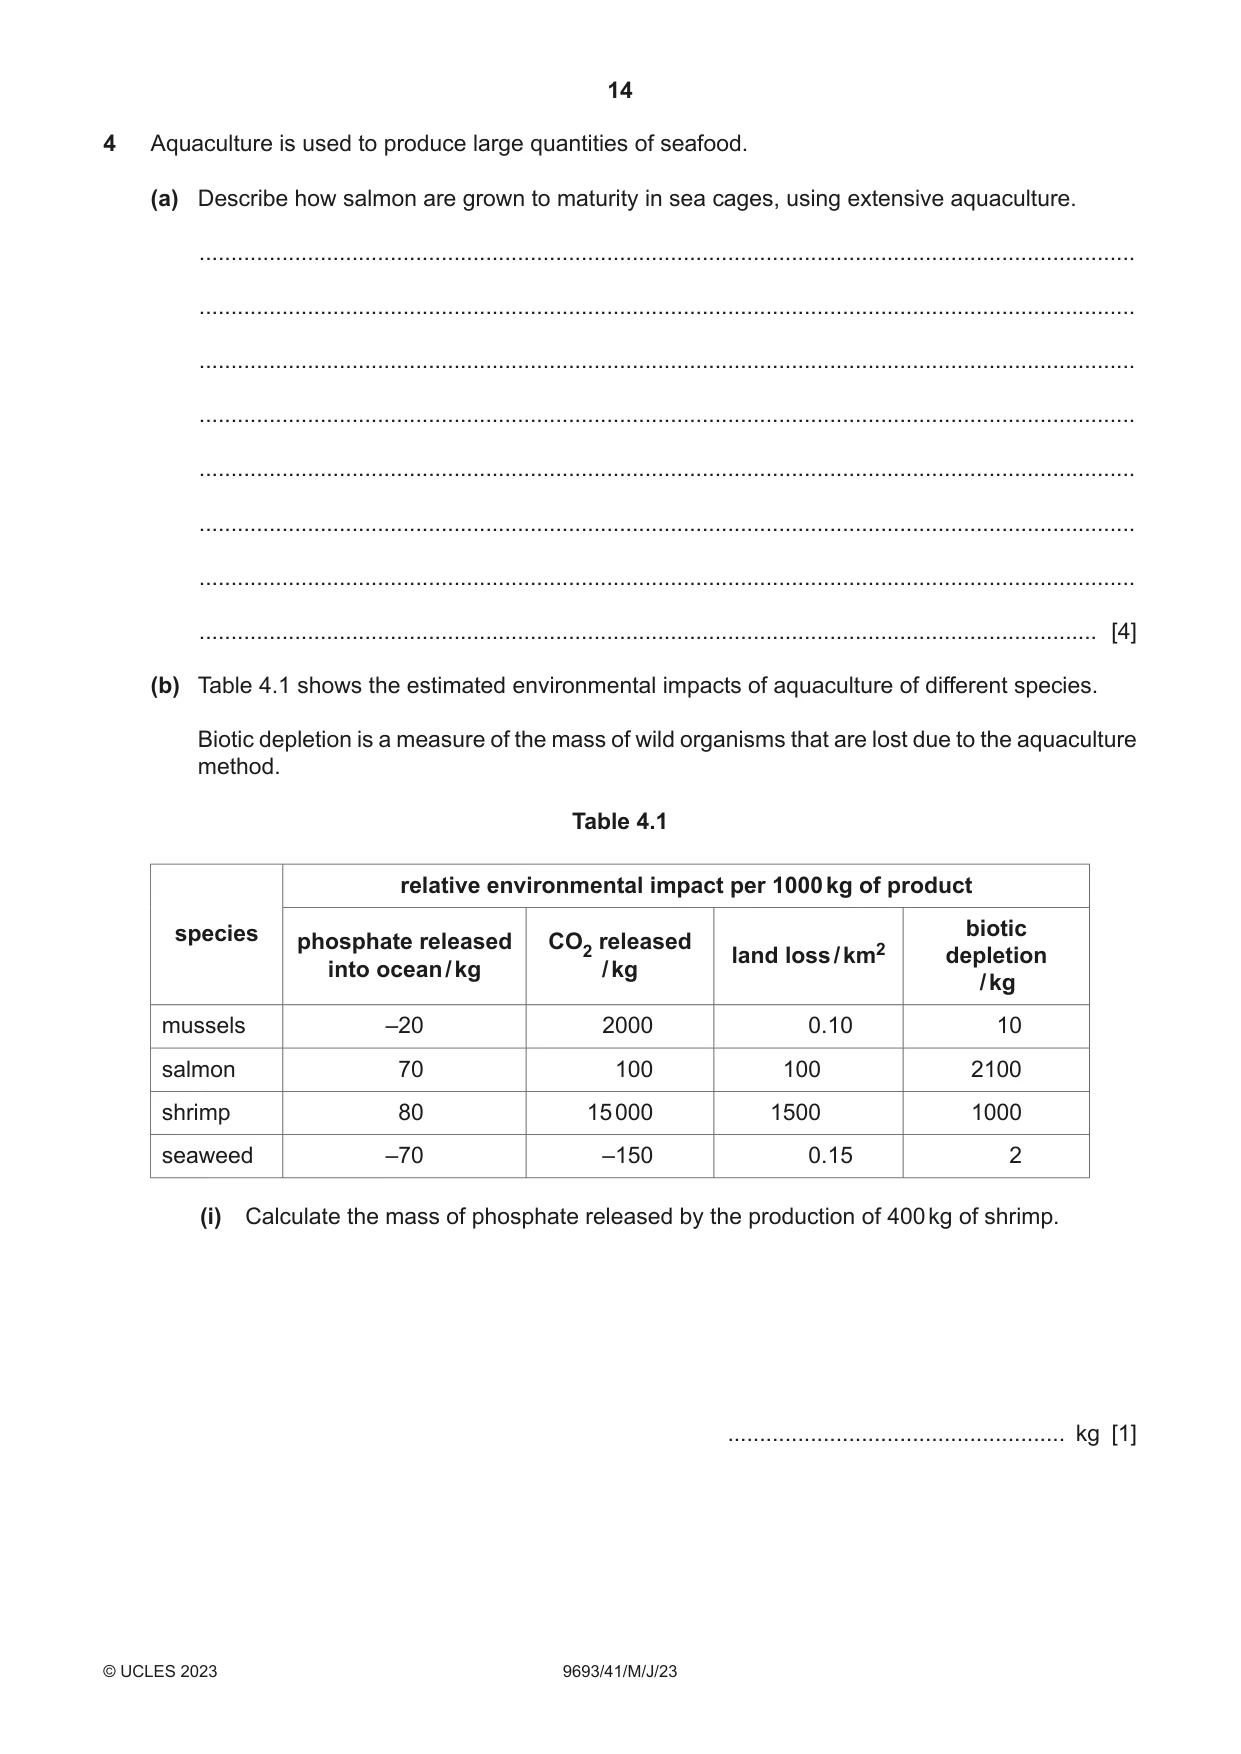
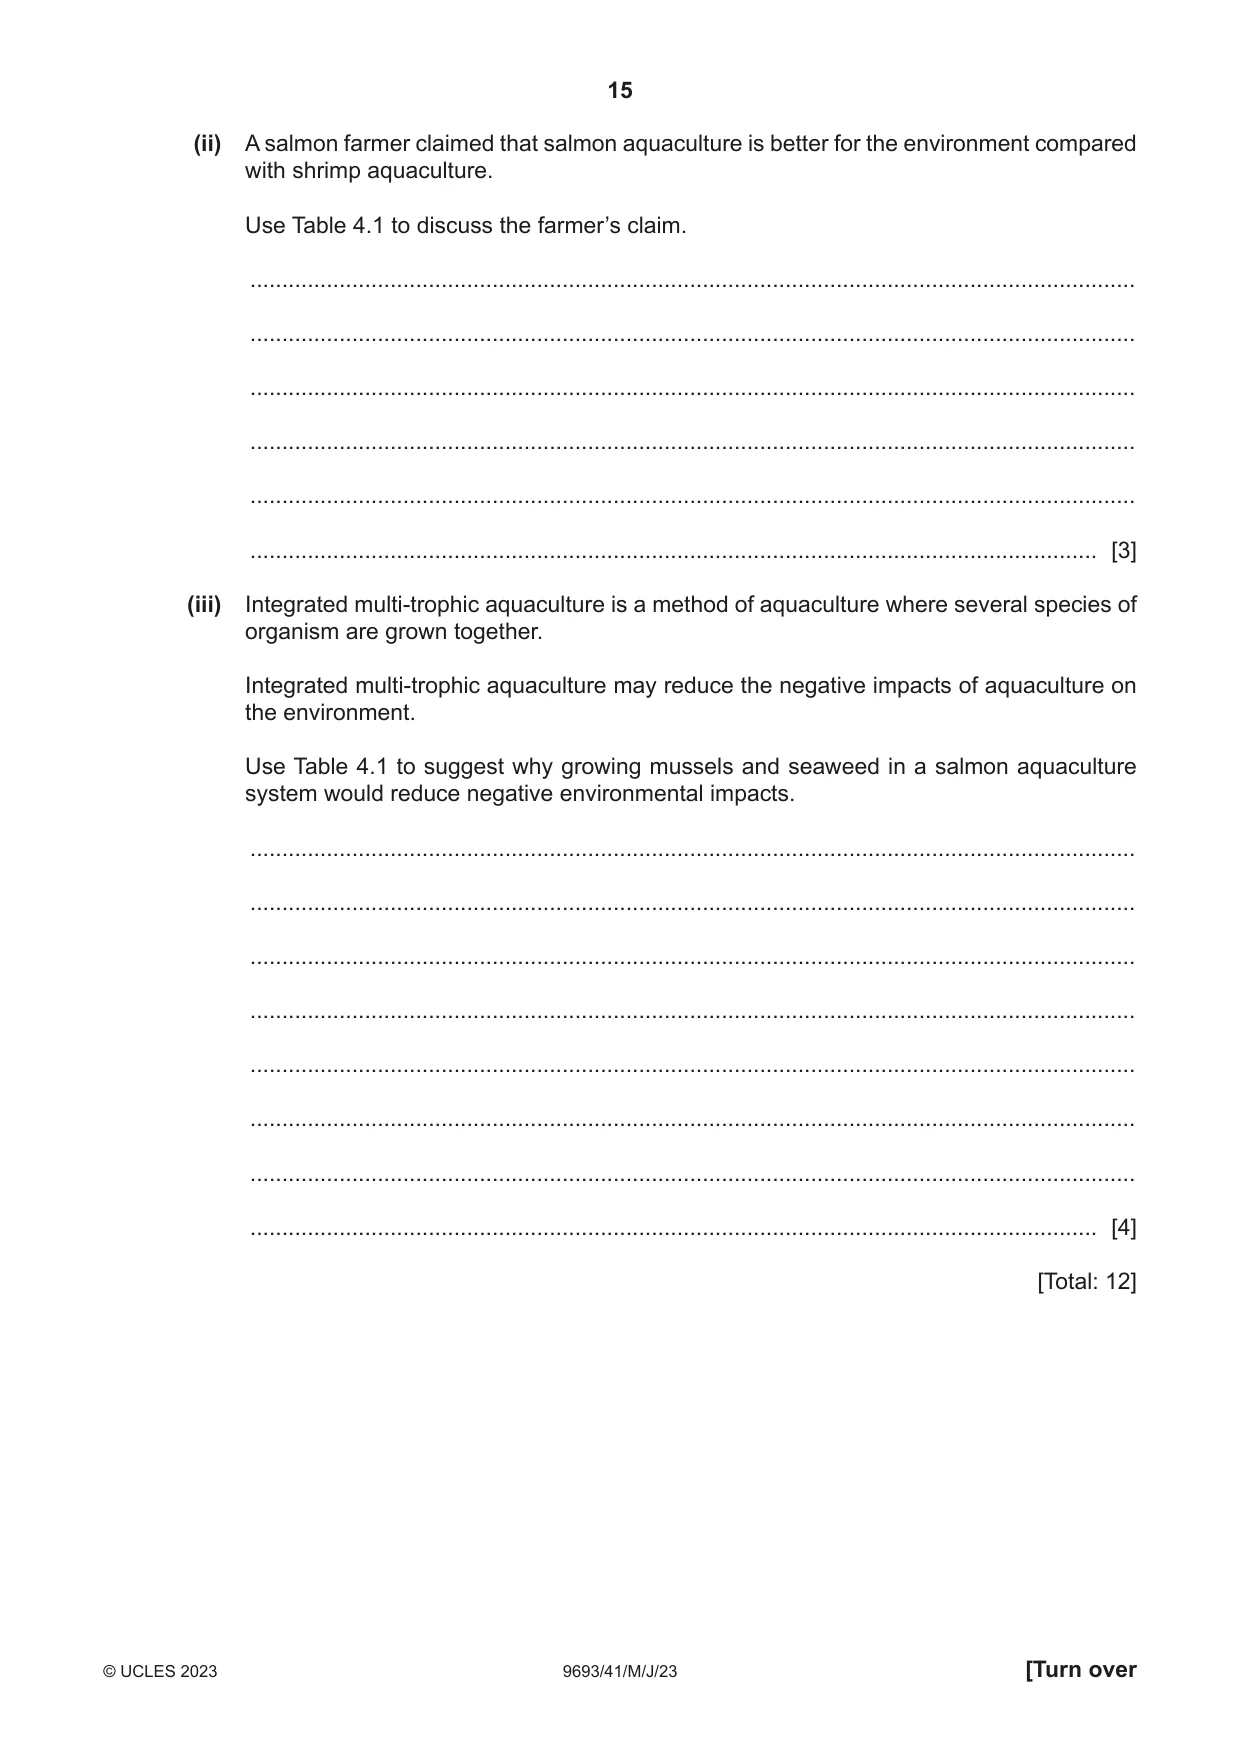
4 Aquaculture is used to produce large quantities of seafood. (a) Describe how salmon are grown to maturity in sea cages, using extensive aquaculture. ................................................................................................................................................... ................................................................................................................................................... ................................................................................................................................................... ................................................................................................................................................... ................................................................................................................................................... ................................................................................................................................................... ................................................................................................................................................... ............................................................................................................................................. [4] (b) Table 4.1 shows the estimated environmental impacts of aquaculture of different species. Biotic depletion is a measure of the mass of wild organisms that are lost due to the aquaculture method. Table 4.1 relative environmental impact per 1000 kg of product species biotic phosphate released CO2 released land loss / km2 depletion into ocean / kg / kg / kg mussels –20 2000 0.10 10 salmon 70 100 100 2100 shrimp 80 15 000 1500 1000 seaweed –70 –150 0.15 2 (i) Calculate the mass of phosphate released by the production of 400 kg of shrimp. ..................................................... kg [1] (ii) A salmon farmer claimed that salmon aquaculture is better for the environment compared with shrimp aquaculture. Use Table 4.1 to discuss the farmer’s claim. ........................................................................................................................................... ........................................................................................................................................... ........................................................................................................................................... ........................................................................................................................................... ........................................................................................................................................... ..................................................................................................................................... [3] (iii) Integrated multi-trophic aquaculture is a method of aquaculture where several species of organism are grown together. Integrated multi-trophic aquaculture may reduce the negative impacts of aquaculture on the environment. Use Table 4.1 to suggest why growing mussels and seaweed in a salmon aquaculture system would reduce negative environmental impacts. ........................................................................................................................................... ........................................................................................................................................... ........................................................................................................................................... ........................................................................................................................................... ........................................................................................................................................... ........................................................................................................................................... ........................................................................................................................................... ..................................................................................................................................... [4] [Total: 12]
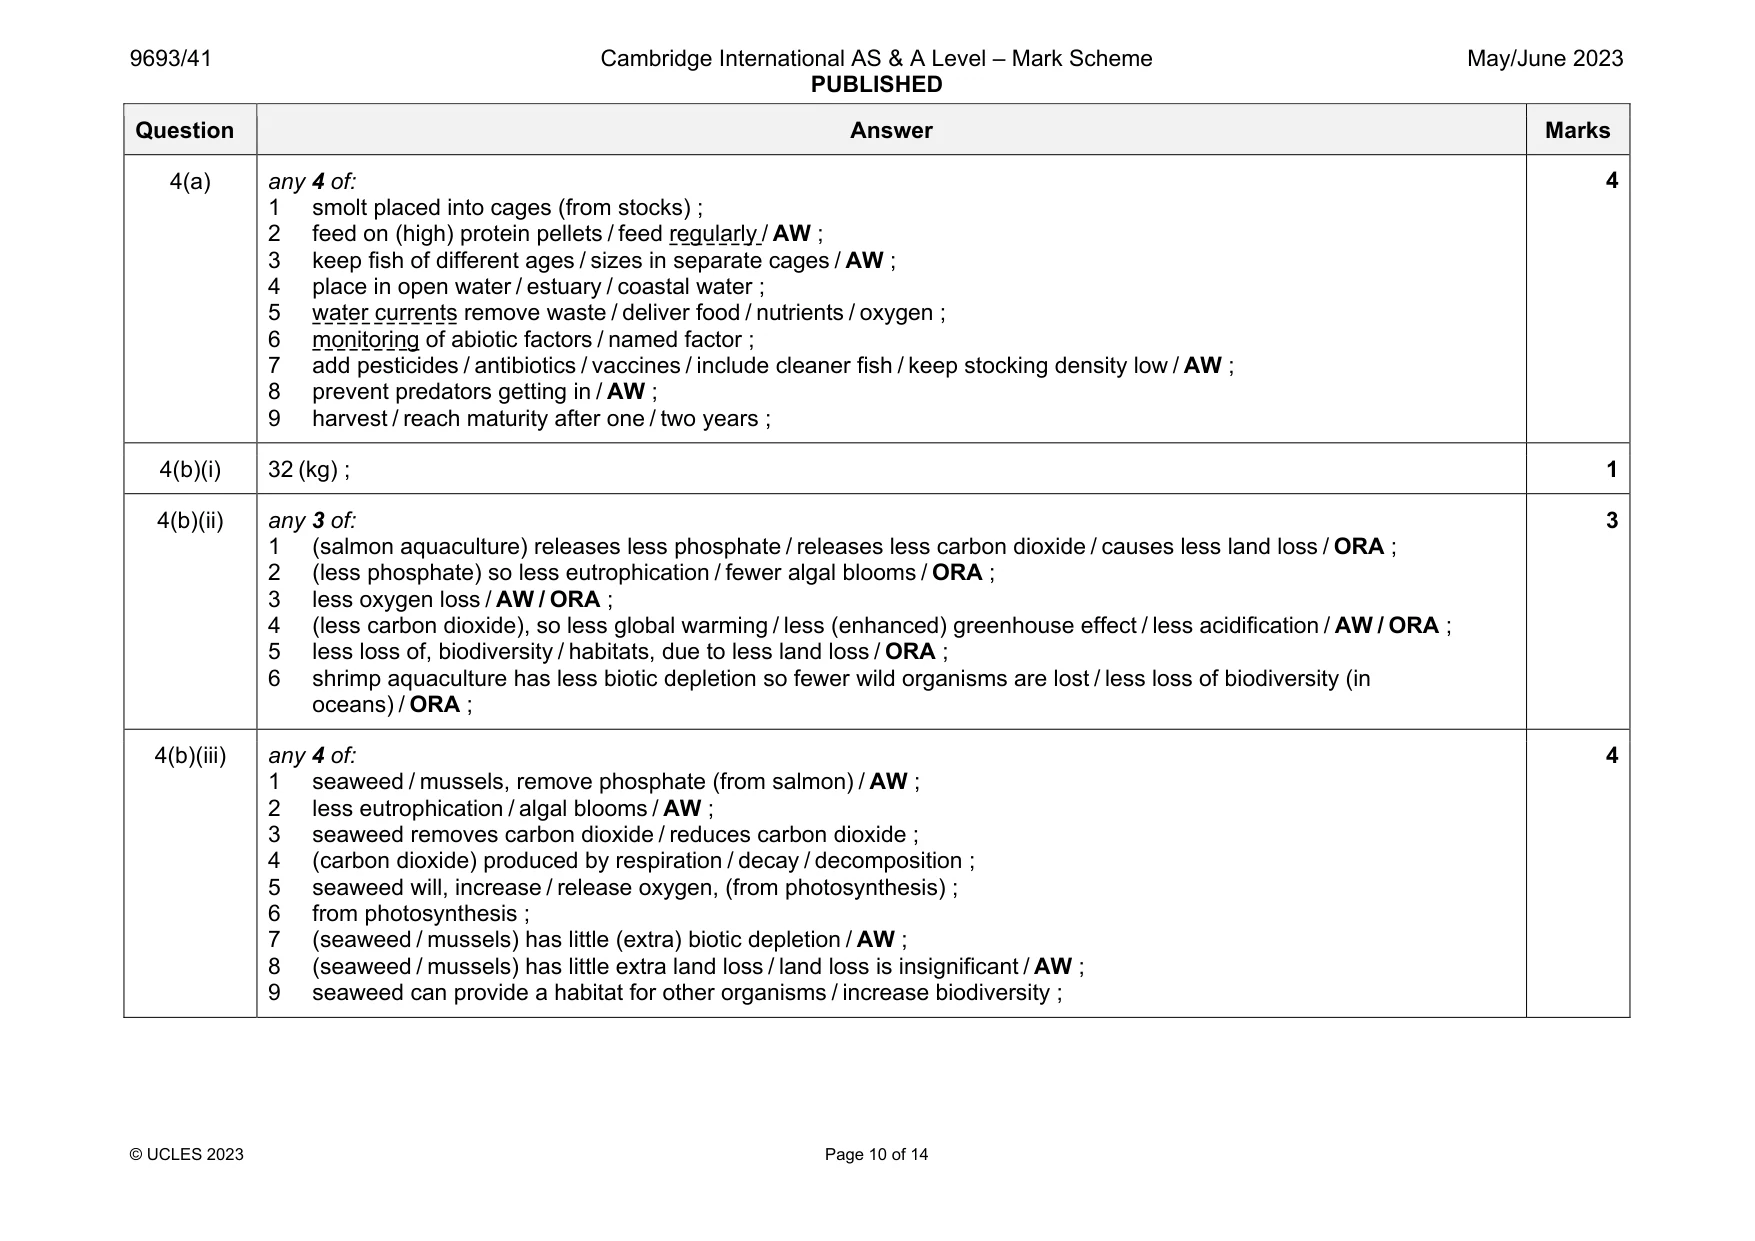
Mark scheme: 4(a) any 4 of: 1 smolt placed into cages (from stocks) ; 2 feed on (high) protein pellets / feed regularly / AW ; 3 keep fish of different ages / sizes in separate cages / AW ; 4 place in open water / estuary / coastal water ; 5 water currents remove waste / deliver food / nutrients / oxygen ; 6 monitoring of abiotic factors / named factor ; 7 add pesticides / antibiotics / vaccines / include cleaner fish / keep stocking density low / AW ; 8 prevent predators getting in / AW ; 9 harvest / reach maturity after one / two years ; 4(b)(i) 32 (kg) ; 1 4(b)(ii) any 3 of: 1 (salmon aquaculture) releases less phosphate / releases less carbon dioxide / causes less land loss / ORA ; 2 (less phosphate) so less eutrophication / fewer algal blooms / ORA ; 3 less oxygen loss / AW / ORA ; 4 (less carbon dioxide), so less global warming / less (enhanced) greenhouse effect / less acidification / AW / ORA ; 5 less loss of, biodiversity / habitats, due to less land loss / ORA ; 6 shrimp aquaculture has less biotic depletion so fewer wild organisms are lost / less loss of biodiversity (in oceans) / ORA ; 3 4(b)(iii) any 4 of: 1 seaweed / mussels, remove phosphate (from salmon) / AW ; 2 less eutrophication / algal blooms / AW ; 3 seaweed removes carbon dioxide / reduces carbon dioxide ; 4 (carbon dioxide) produced by respiration / decay / decomposition ; 5 seaweed will, increase / release oxygen, (from photosynthesis) ; 6 from photosynthesis ; 7 (seaweed / mussels) has little (extra) biotic depletion / AW ; 8 (seaweed / mussels) has little extra land loss / land loss is insignificant / AW ; 9 seaweed can provide a habitat for other organisms / increase biodiversity ; 4
Q5 · Describe how microplastics are formed
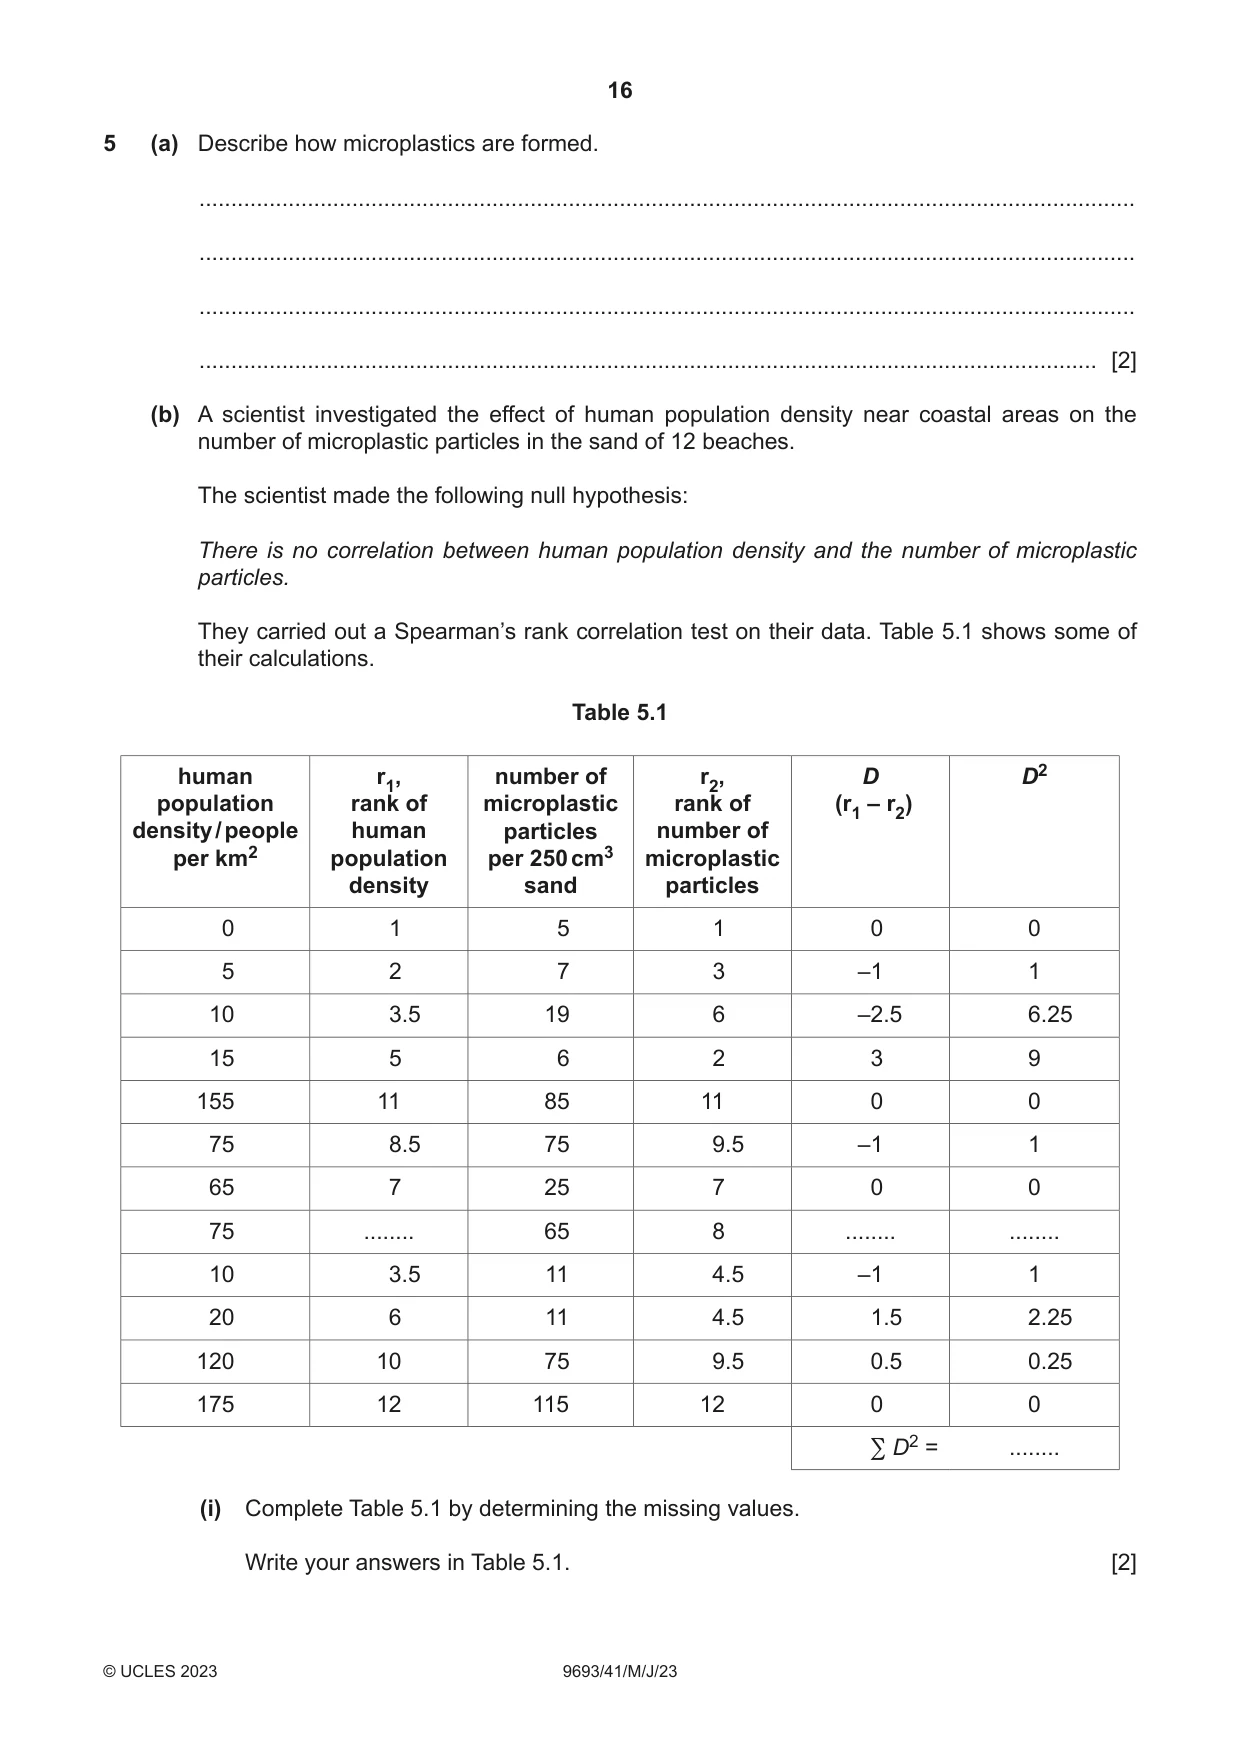
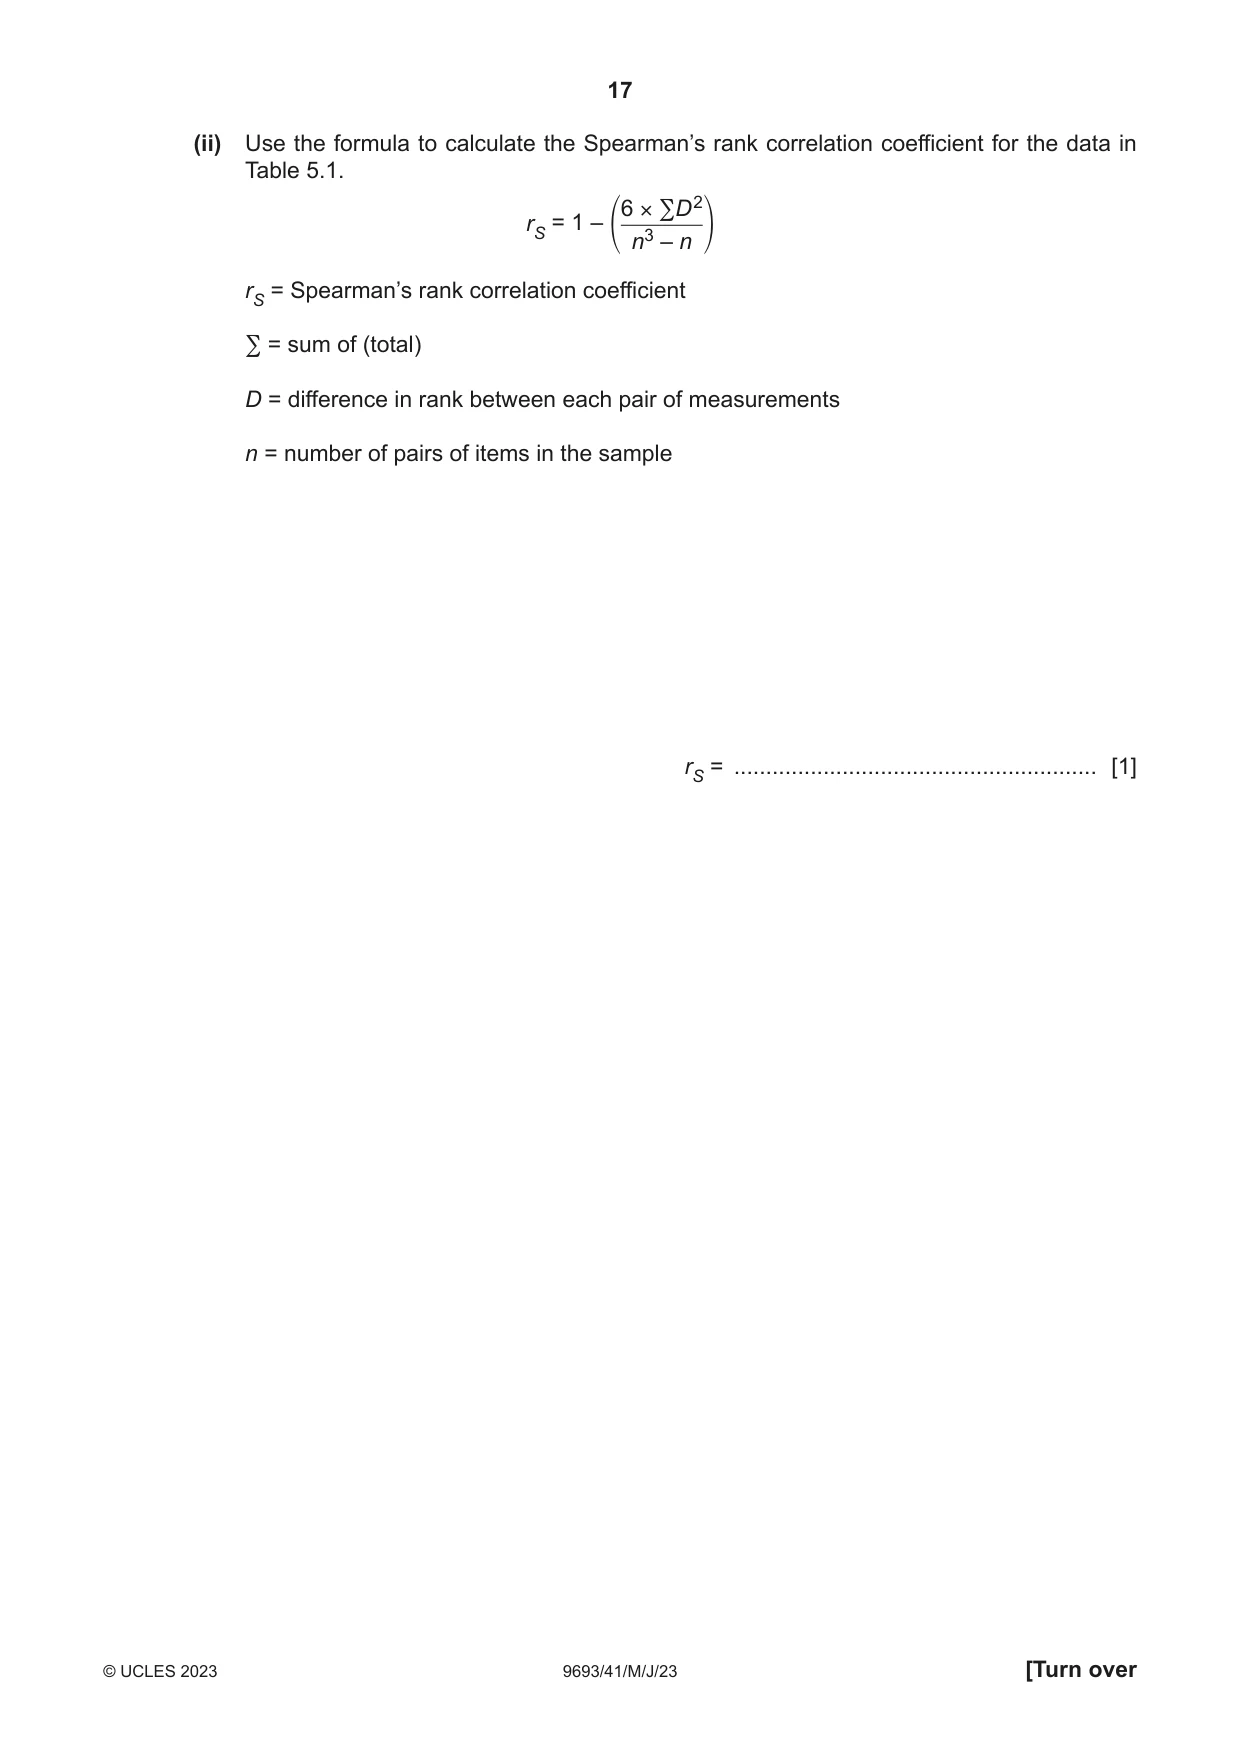
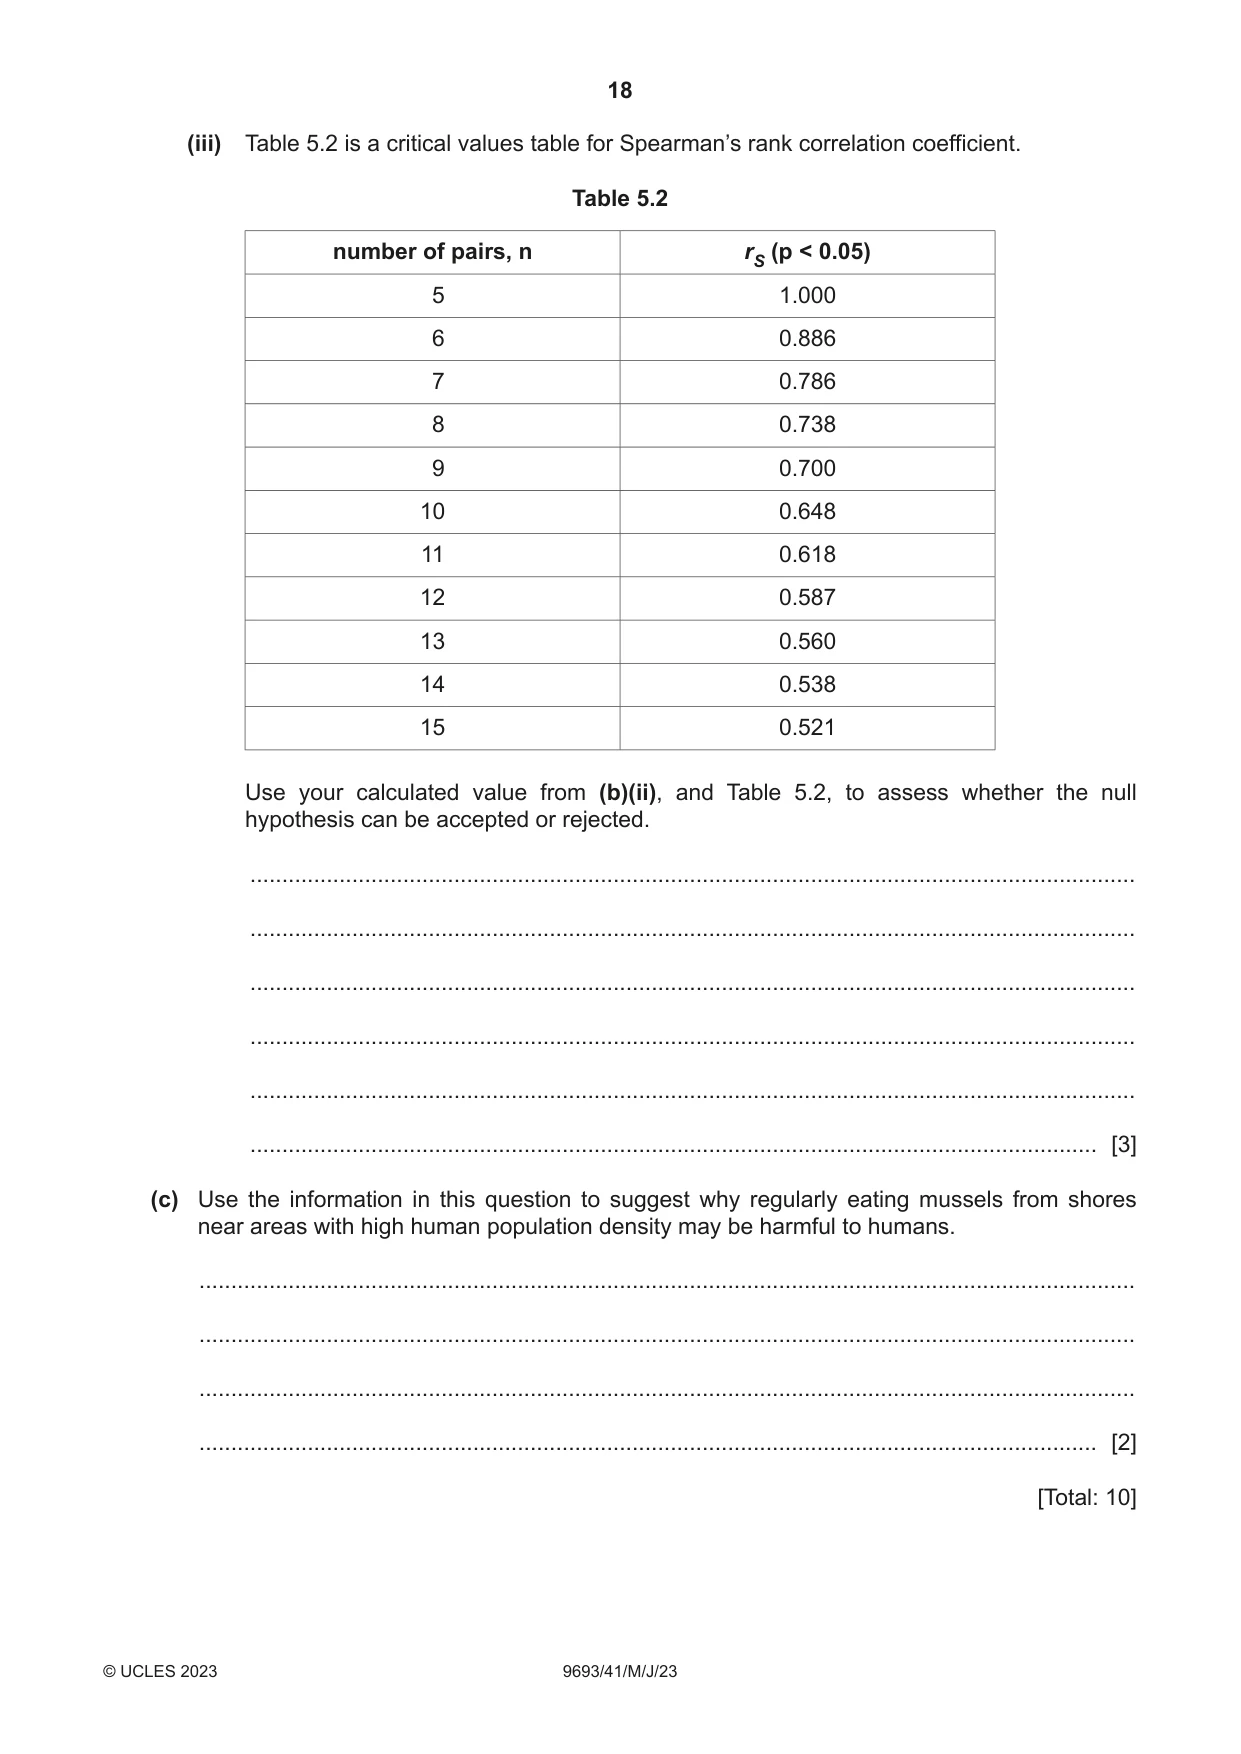
5 (a) Describe how microplastics are formed. ................................................................................................................................................... ................................................................................................................................................... ................................................................................................................................................... ............................................................................................................................................. [2] (b) A scientist investigated the effect of human population density near coastal areas on the number of microplastic particles in the sand of 12 beaches. The scientist made the following null hypothesis: There is no correlation between human population density and the number of microplastic particles. They carried out a Spearman’s rank correlation test on their data. Table 5.1 shows some of their calculations. Table 5.1 human r1, number of r2, D D2 population rank of microplastic rank of (r1 – r2) density / people human particles number of per km2 population per 250 cm3 microplastic density sand particles 0 1 5 1 0 0 5 2 7 3 –1 1 10 3.5 19 6 –2.5 6.25 15 5 6 2 3 9 155 11 85 11 0 0 75 8.5 75 9.5 –1 1 65 7 25 7 0 0 75 ........ 65 8 ........ ........ 10 3.5 11 4.5 –1 1 20 6 11 4.5 1.5 2.25 120 10 75 9.5 0.5 0.25 175 12 115 12 0 0 ∑ D2 = ........ (i) Complete Table 5.1 by determining the missing values. Write your answers in Table 5.1. [2] (ii) Use the formula to calculate the Spearman’s rank correlation coefficient for the data in Table 5.1. 6 × ∑D 2 rS = 1 – n3 – n rS = Spearman’s rank correlation coefficient ∑ = sum of (total) D = difference in rank between each pair of measurements n = number of pairs of items in the sample rS = ......................................................... [1] (iii) Table 5.2 is a critical values table for Spearman’s rank correlation coefficient. Table 5.2 number of pairs, n rS (p < 0.05) 5 1.000 6 0.886 7 0.786 8 0.738 9 0.700 10 0.648 11 0.618 12 0.587 13 0.560 14 0.538 15 0.521 Use your calculated value from (b)(ii), and Table 5.2, to assess whether the null hypothesis can be accepted or rejected. ........................................................................................................................................... ........................................................................................................................................... ........................................................................................................................................... ........................................................................................................................................... ........................................................................................................................................... ..................................................................................................................................... [3] (c) Use the information in this question to suggest why regularly eating mussels from shores near areas with high human population density may be harmful to humans. ................................................................................................................................................... ................................................................................................................................................... ................................................................................................................................................... ............................................................................................................................................. [2] [Total: 10]
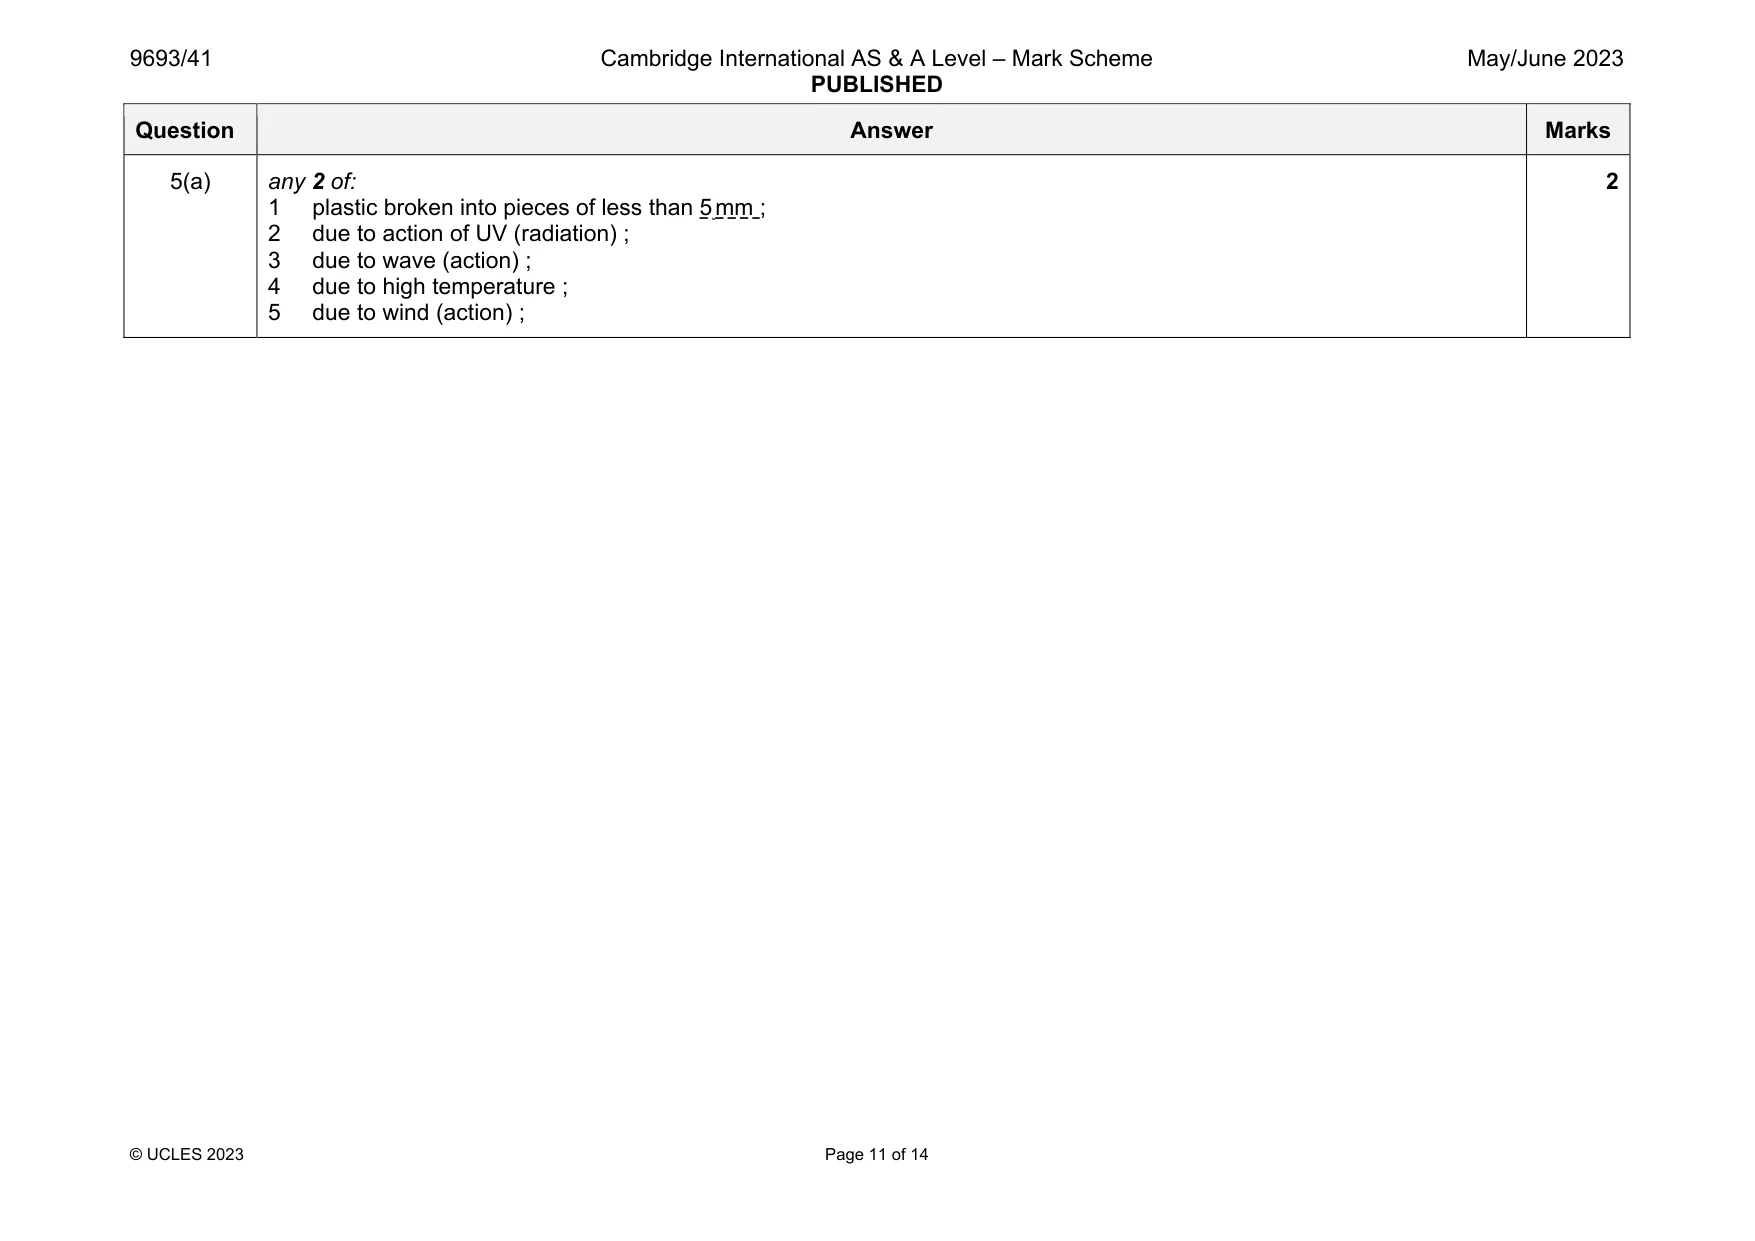
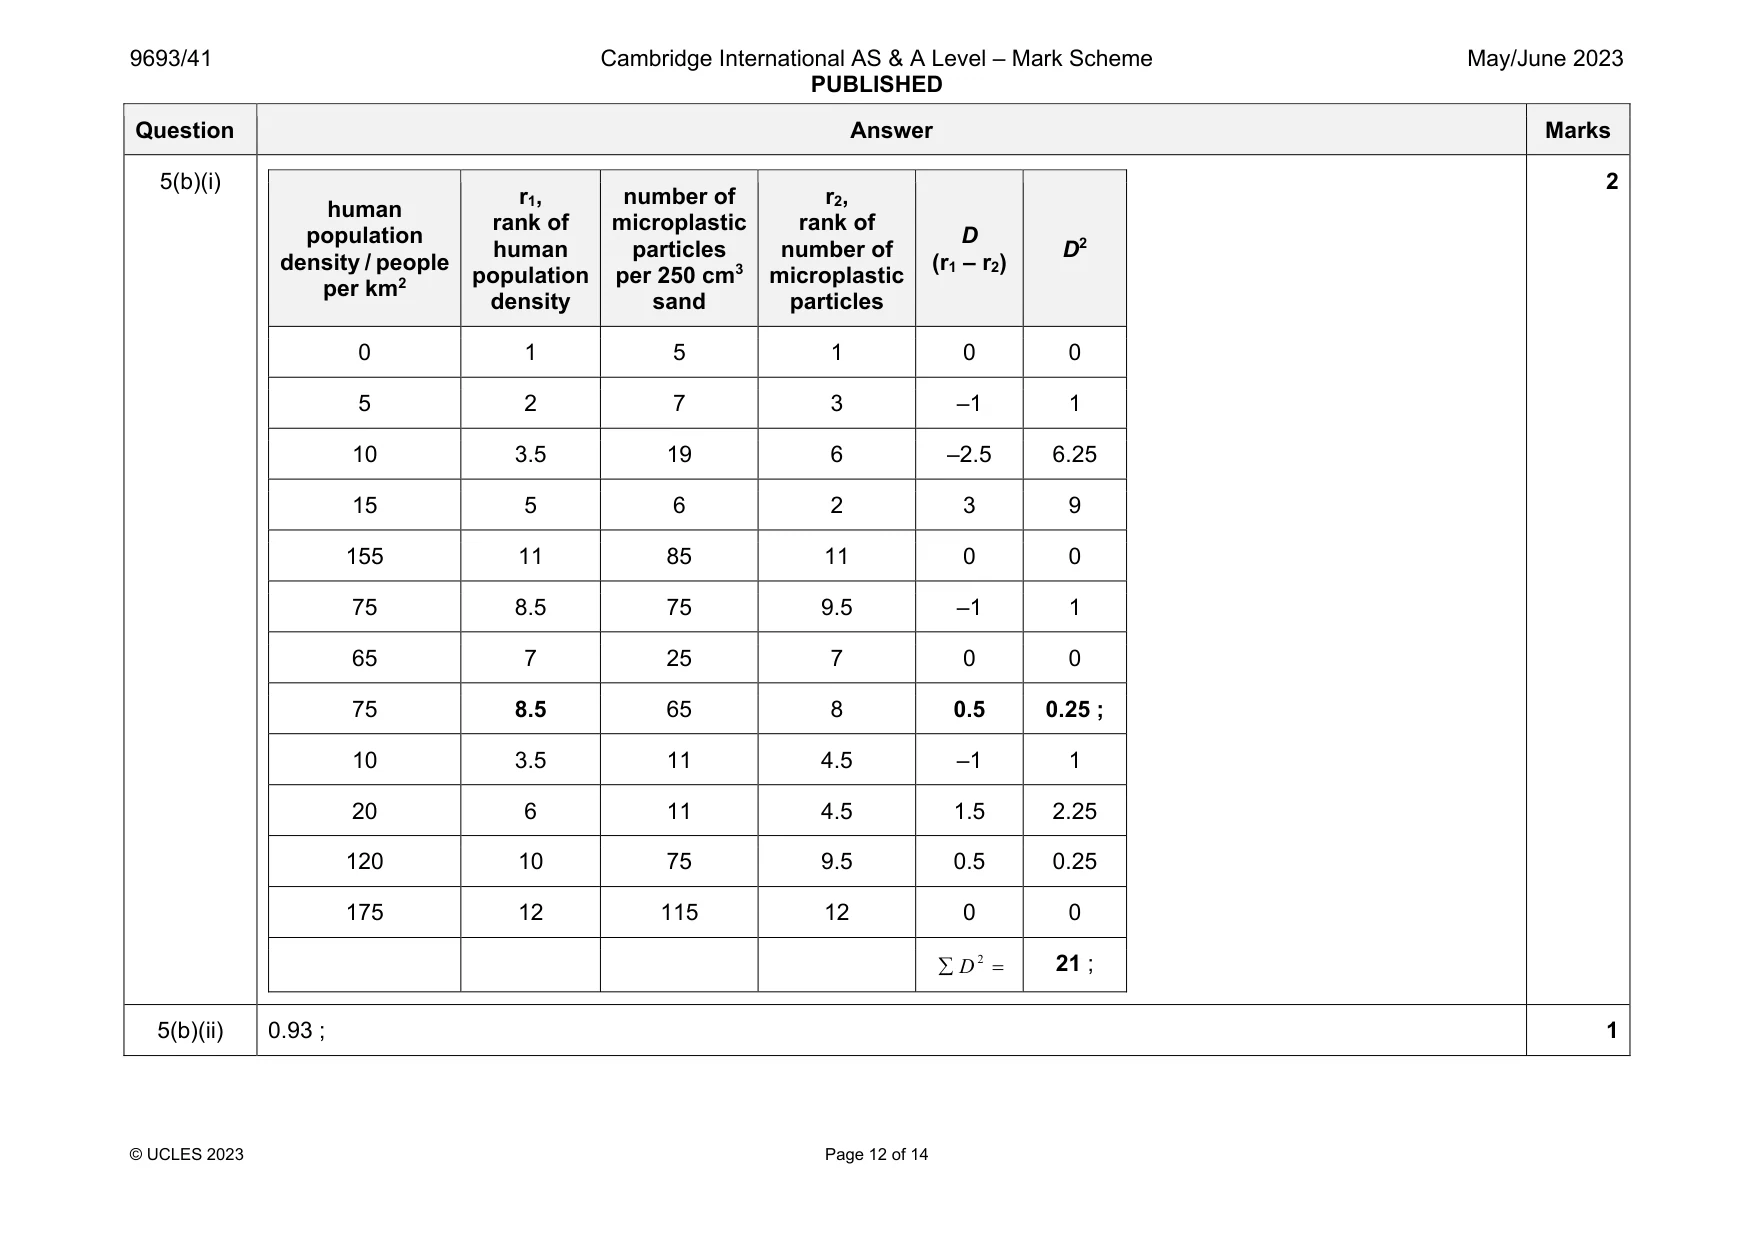
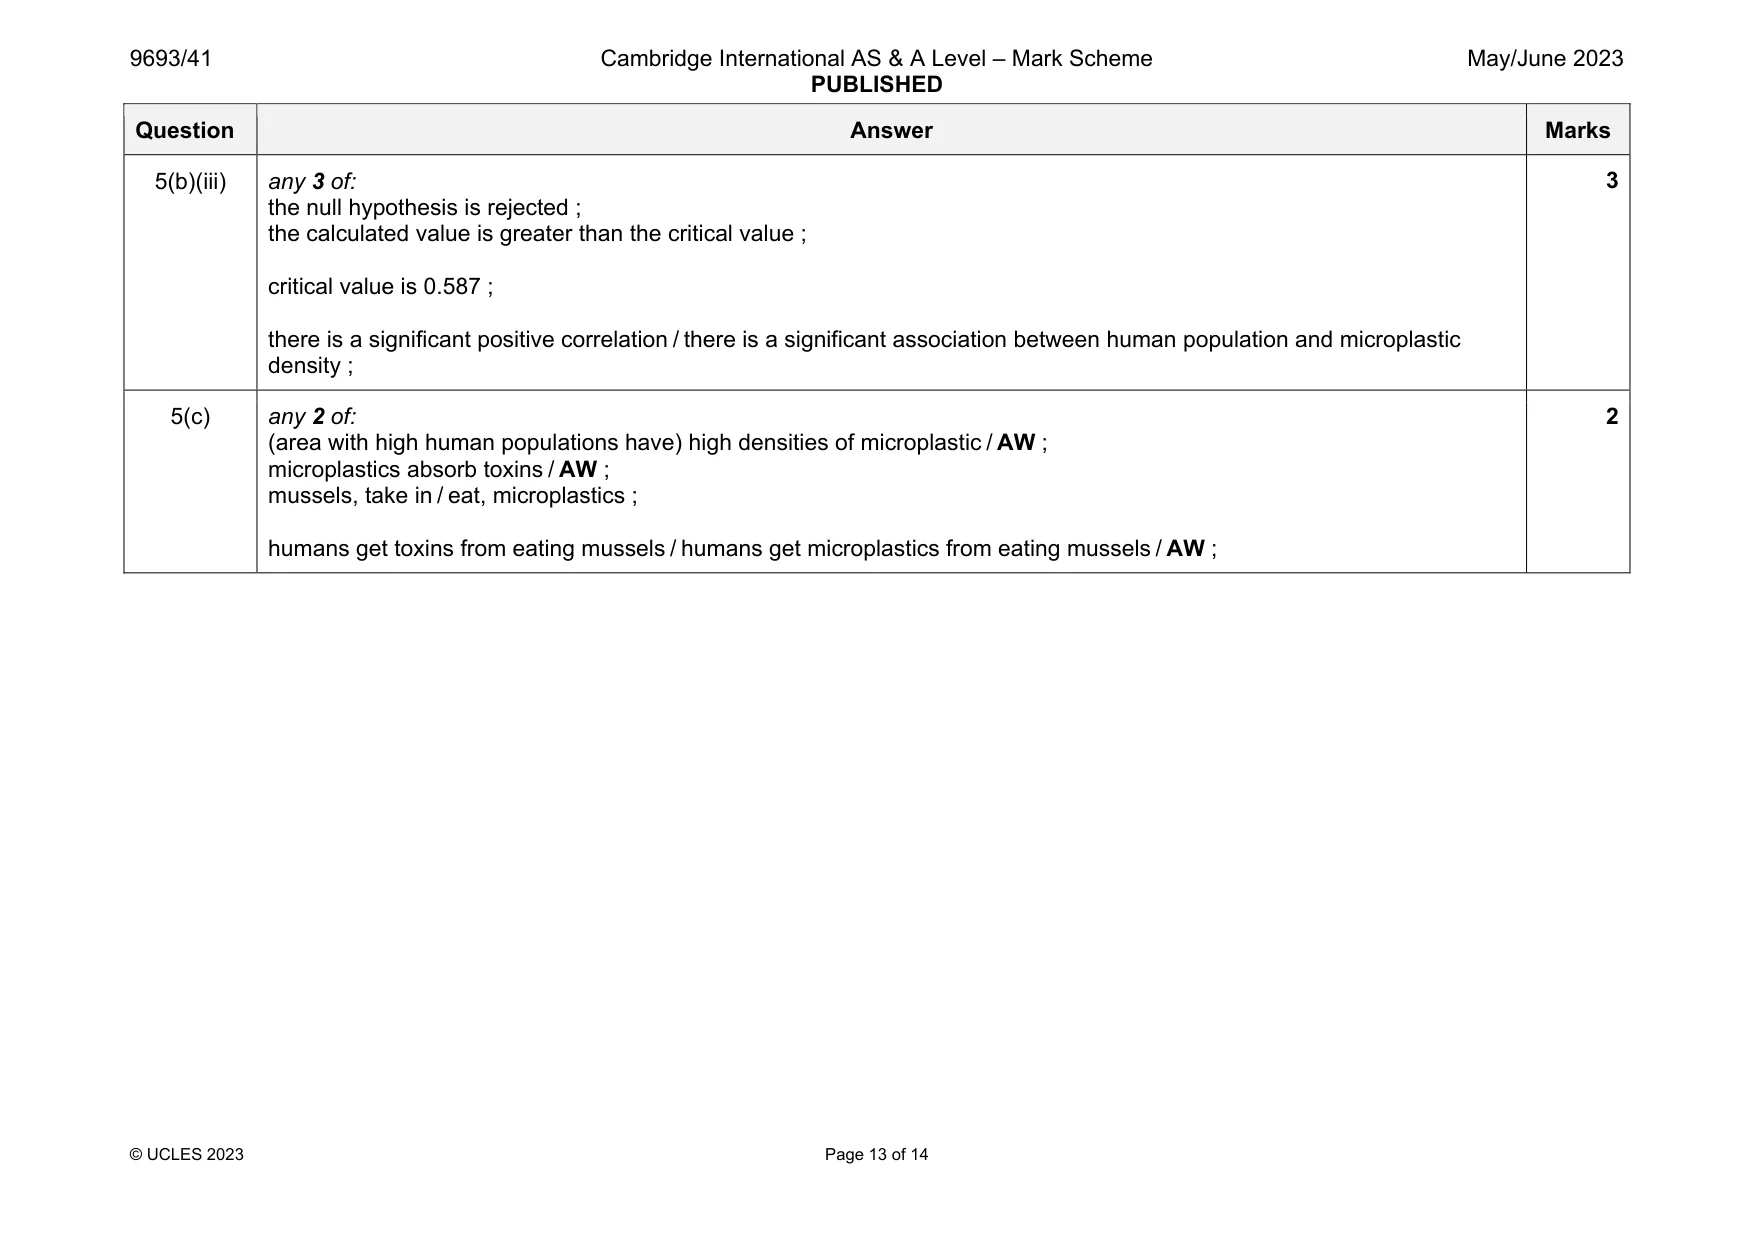
Mark scheme: 5(a) any 2 of: 1 plastic broken into pieces of less than 5 mm ; 2 due to action of UV (radiation) ; 3 due to wave (action) ; 4 due to high temperature ; 5 due to wind (action) ; 2 Question Answer Marks 5(b)(i) human population density / people per km2 r1, rank of human population density number of microplastic particles per 250 cm3 sand r2, rank of number of microplastic particles D (r1 – r2) D2 0 1 5 1 0 0 5 2 7 3 –1 1 10 3.5 19 6 –2.5 6.25 15 5 6 2 3 9 155 11 85 11 0 0 75 8.5 75 9.5 –1 1 65 7 25 7 0 0 75 8.5 65 8 0.5 0.25 ; 10 3.5 11 4.5 –1 1 20 6 11 4.5 1.5 2.25 120 10 75 9.5 0.5 0.25 175 12 115 12 0 0 2 D 21 ; 2 5(b)(ii) 0.93 ; 1 Question Answer Marks 5(b)(iii) any 3 of: the null hypothesis is rejected ; the calculated value is greater than the critical value ; critical value is 0.587 ; there is a significant positive correlation / there is a significant association between human population and microplastic density ; 3 5(c) any 2 of: (area with high human populations have) high densities of microplastic / AW ; microplastics absorb toxins / AW ; mussels, take in / eat, microplastics ; humans get toxins from eating mussels / humans get microplastics from eating mussels / AW ; 2
Q6 · Oysters have a complex life cycle with a larval stage and an adult stage
6 Oysters have a complex life cycle with a larval stage and an adult stage. The larvae live in the open water until they settle on a substrate and mature into adults. It has been suggested that ocean acidification might affect the settling of oyster larvae onto substrates. Plan an ethical, laboratory investigation that you could do to investigate the effect of changing the pH on the settling of oyster larvae onto a substrate. Your plan should: • include a clear statement of the hypothesis • identify the independent, dependent and standardised variables • include full details of the method so that another person can follow it • describe how you would analyse your results • be safe and ethical. .......................................................................................................................................................... .......................................................................................................................................................... .......................................................................................................................................................... .......................................................................................................................................................... .......................................................................................................................................................... .......................................................................................................................................................... .......................................................................................................................................................... .......................................................................................................................................................... .......................................................................................................................................................... .......................................................................................................................................................... .......................................................................................................................................................... .......................................................................................................................................................... .......................................................................................................................................................... .......................................................................................................................................................... .......................................................................................................................................................... .......................................................................................................................................................... .......................................................................................................................................................... .......................................................................................................................................................... .......................................................................................................................................................... .......................................................................................................................................................... .......................................................................................................................................................... .......................................................................................................................................................... .......................................................................................................................................................... .......................................................................................................................................................... .......................................................................................................................................................... .......................................................................................................................................................... .......................................................................................................................................................... .................................................................................................................................................. [11] The boundaries and names shown, the designations used and the presentation of material on any maps contained in this question paper/insert do not imply official endorsement or acceptance by Cambridge Assessment International Education concerning the legal status of any country, territory, or area or any of its authorities, or of the delimitation of its frontiers or boundaries.
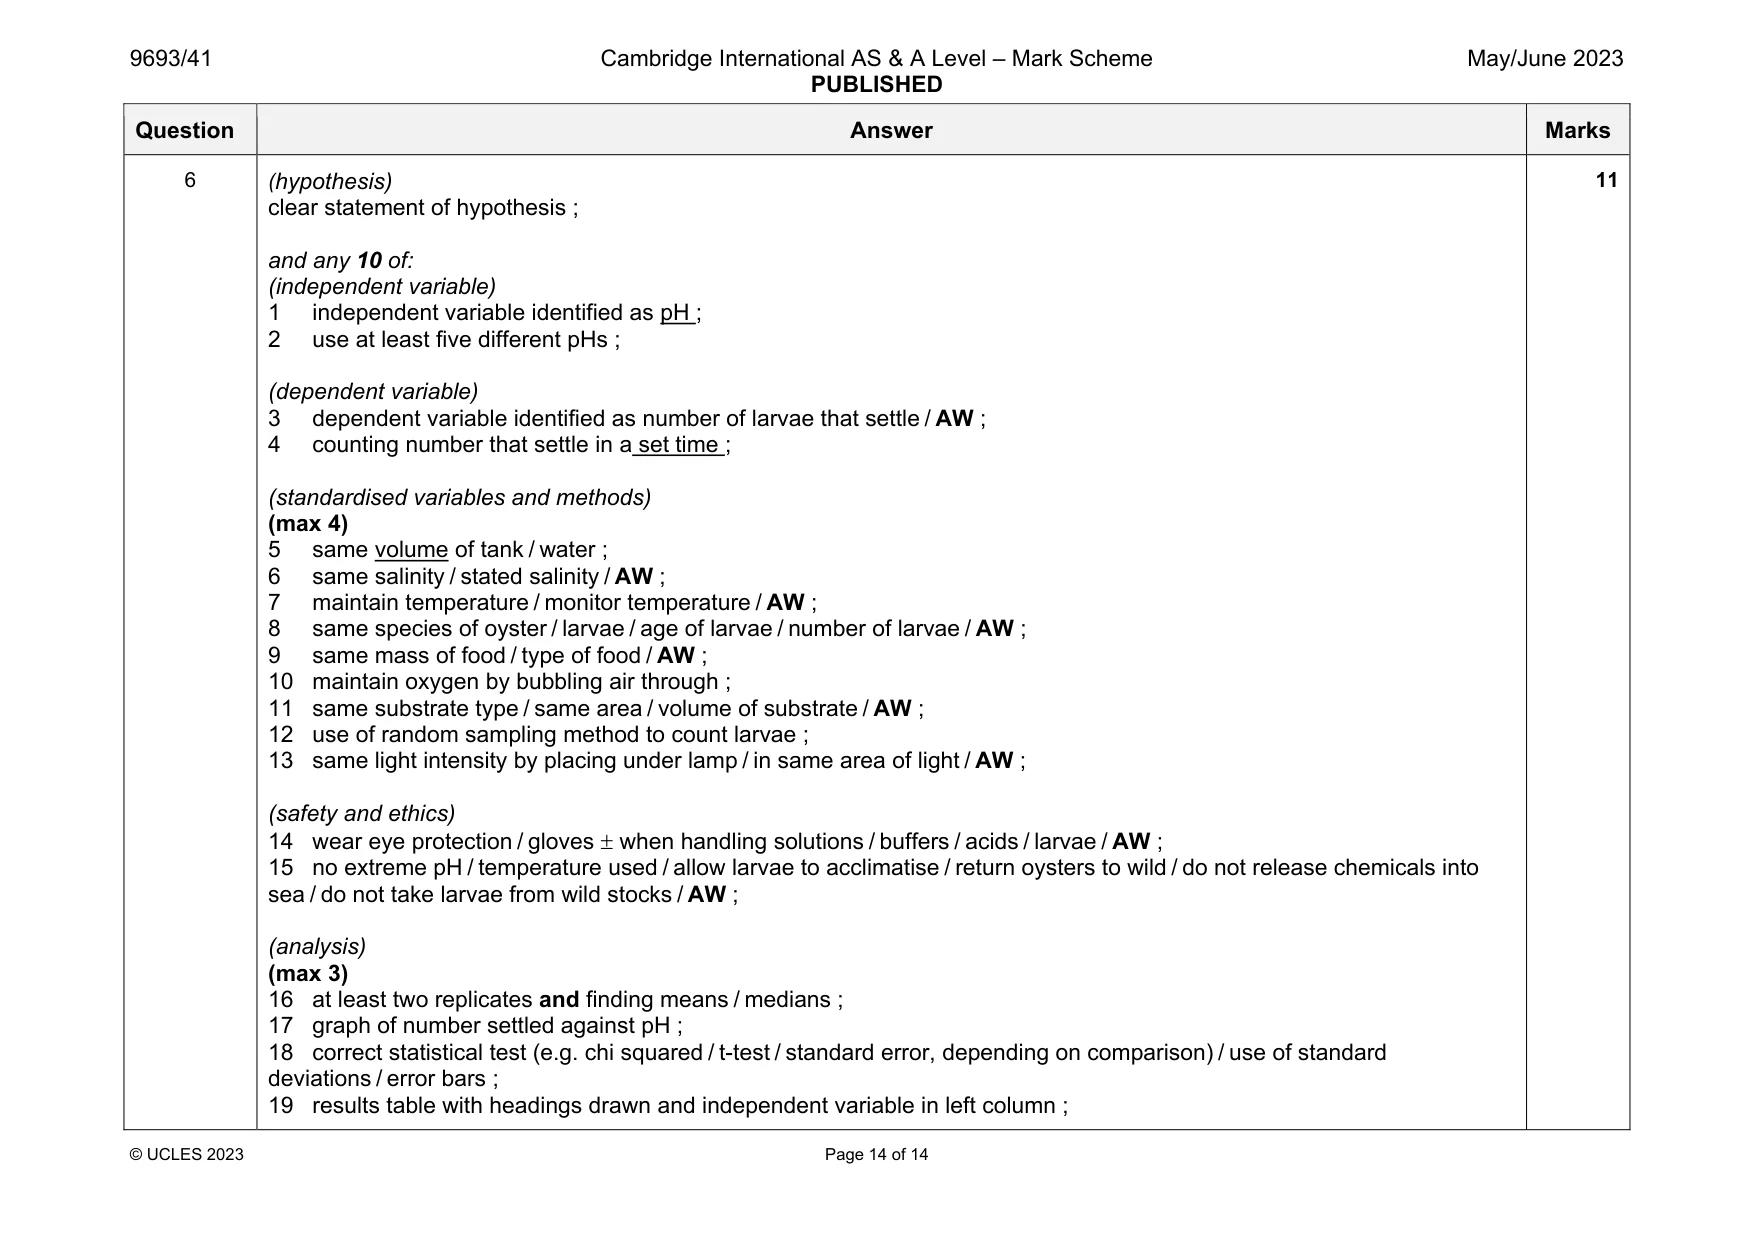
Mark scheme: 6 (hypothesis) clear statement of hypothesis ; and any 10 of: (independent variable) 1 independent variable identified as pH ; 2 use at least five different pHs ; (dependent variable) 3 dependent variable identified as number of larvae that settle / AW ; 4 counting number that settle in a set time ; (standardised variables and methods) (max 4) 5 same volume of tank / water ; 6 same salinity / stated salinity / AW ; 7 maintain temperature / monitor temperature / AW ; 8 same species of oyster / larvae / age of larvae / number of larvae / AW ; 9 same mass of food / type of food / AW ; 10 maintain oxygen by bubbling air through ; 11 same substrate type / same area / volume of substrate / AW ; 12 use of random sampling method to count larvae ; 13 same light intensity by placing under lamp / in same area of light / AW ; (safety and ethics) 14 wear eye protection / gloves when handling solutions / buffers / acids / larvae / AW ; 15 no extreme pH / temperature used / allow larvae to acclimatise / return oysters to wild / do not release chemicals into sea / do not take larvae from wild stocks / AW ; (analysis) (max 3) 16 at least two replicates and finding means / medians ; 17 graph of number settled against pH ; 18 correct statistical test (e.g. chi squared / t-test / standard error, depending on comparison) / use of standard deviations / error bars ; 19 results table with headings drawn and independent variable in left column ;
What was in this paper
The subtopics covered by these 6 questions, and how many questions each got. Open one in a new tab to see every Cambridge question on it.
What you needed in this session
Cambridge’s own grade thresholds for 2023 May/June, Paper 4 · Variant 1. A higher threshold means an easier paper — the bar moves with how the cohort did.