Cambridge A Level Marine Science 9693 — 2023 May/June Paper 4 · Variant 3
9693/43/M/J/23 · 5 questions · 75 marks · ≈84 min
The question paper and its mark scheme, free to read here and free to download. This is Cambridge’s own paper, exactly as it was sat.
Question paper20 pages



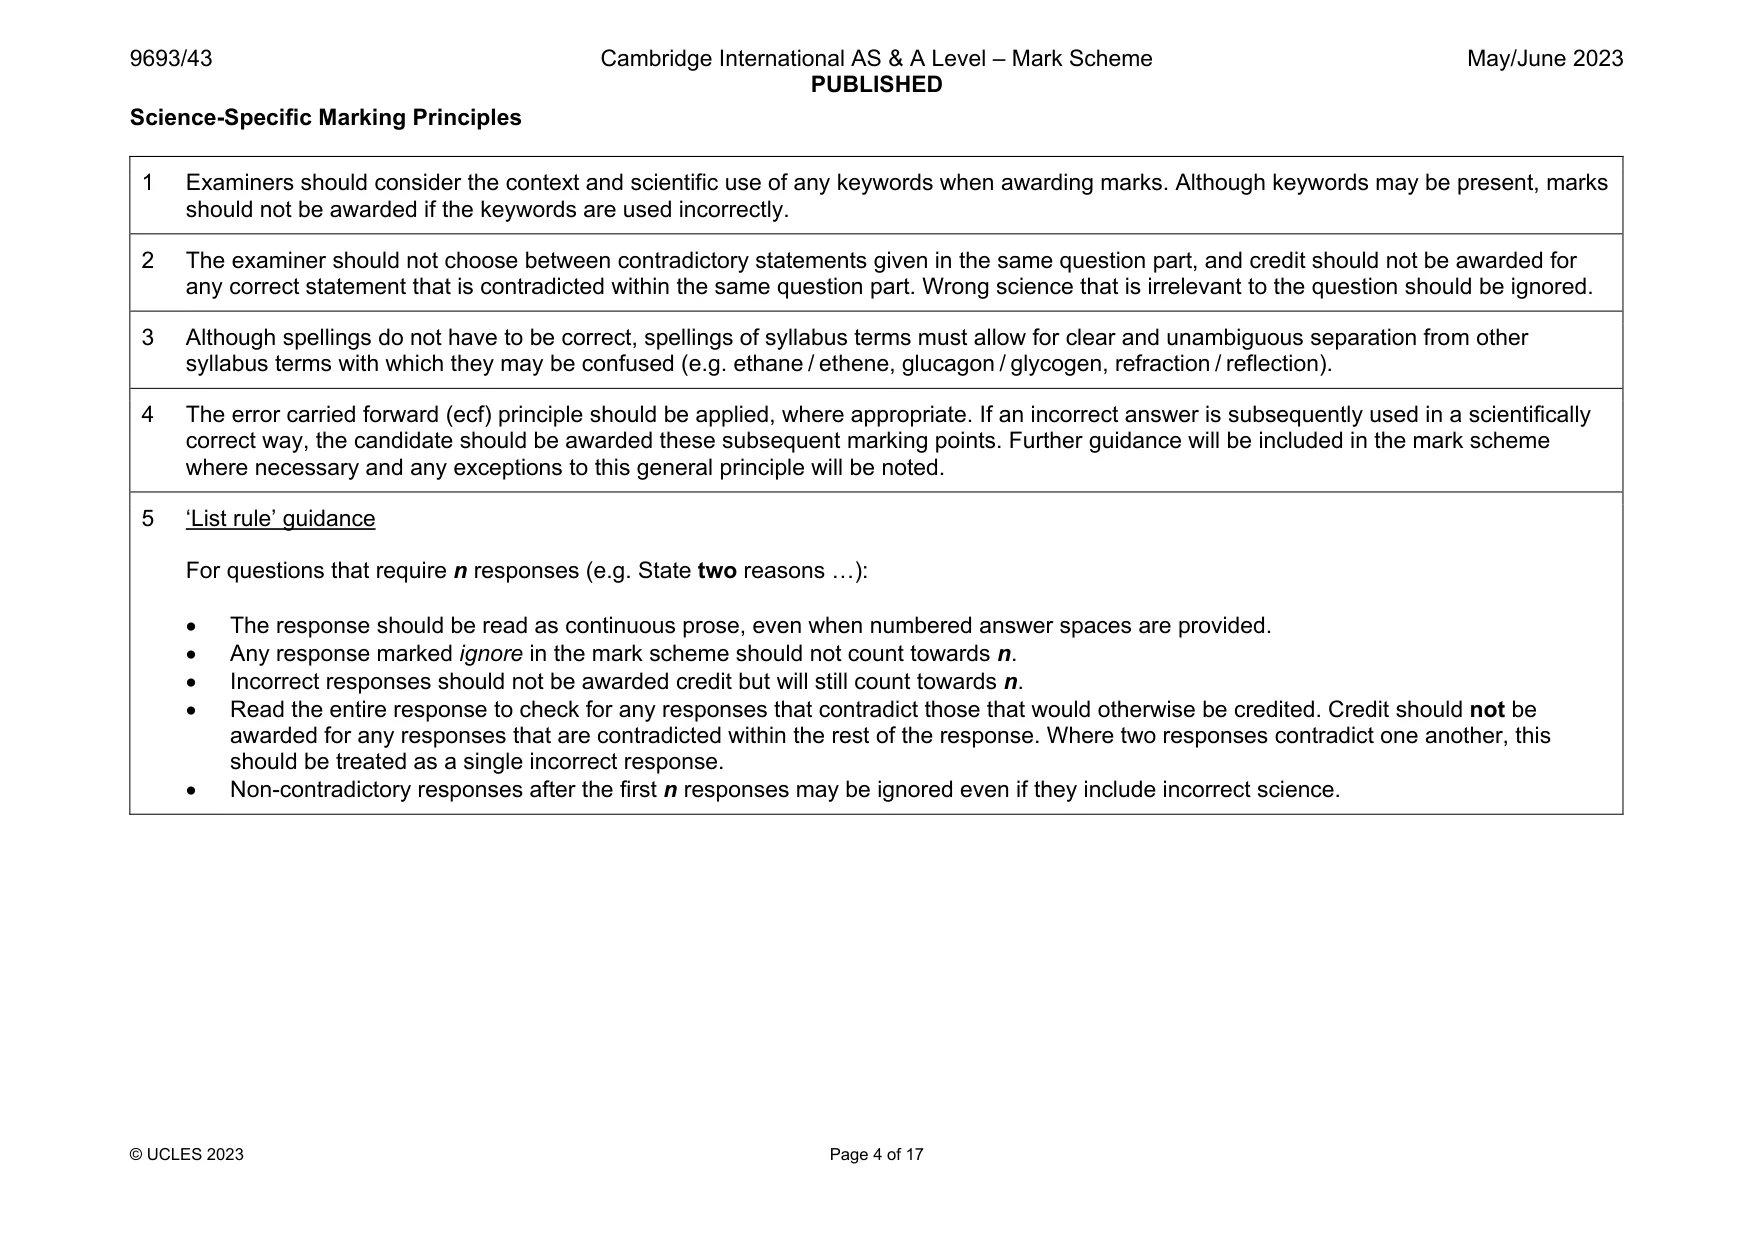
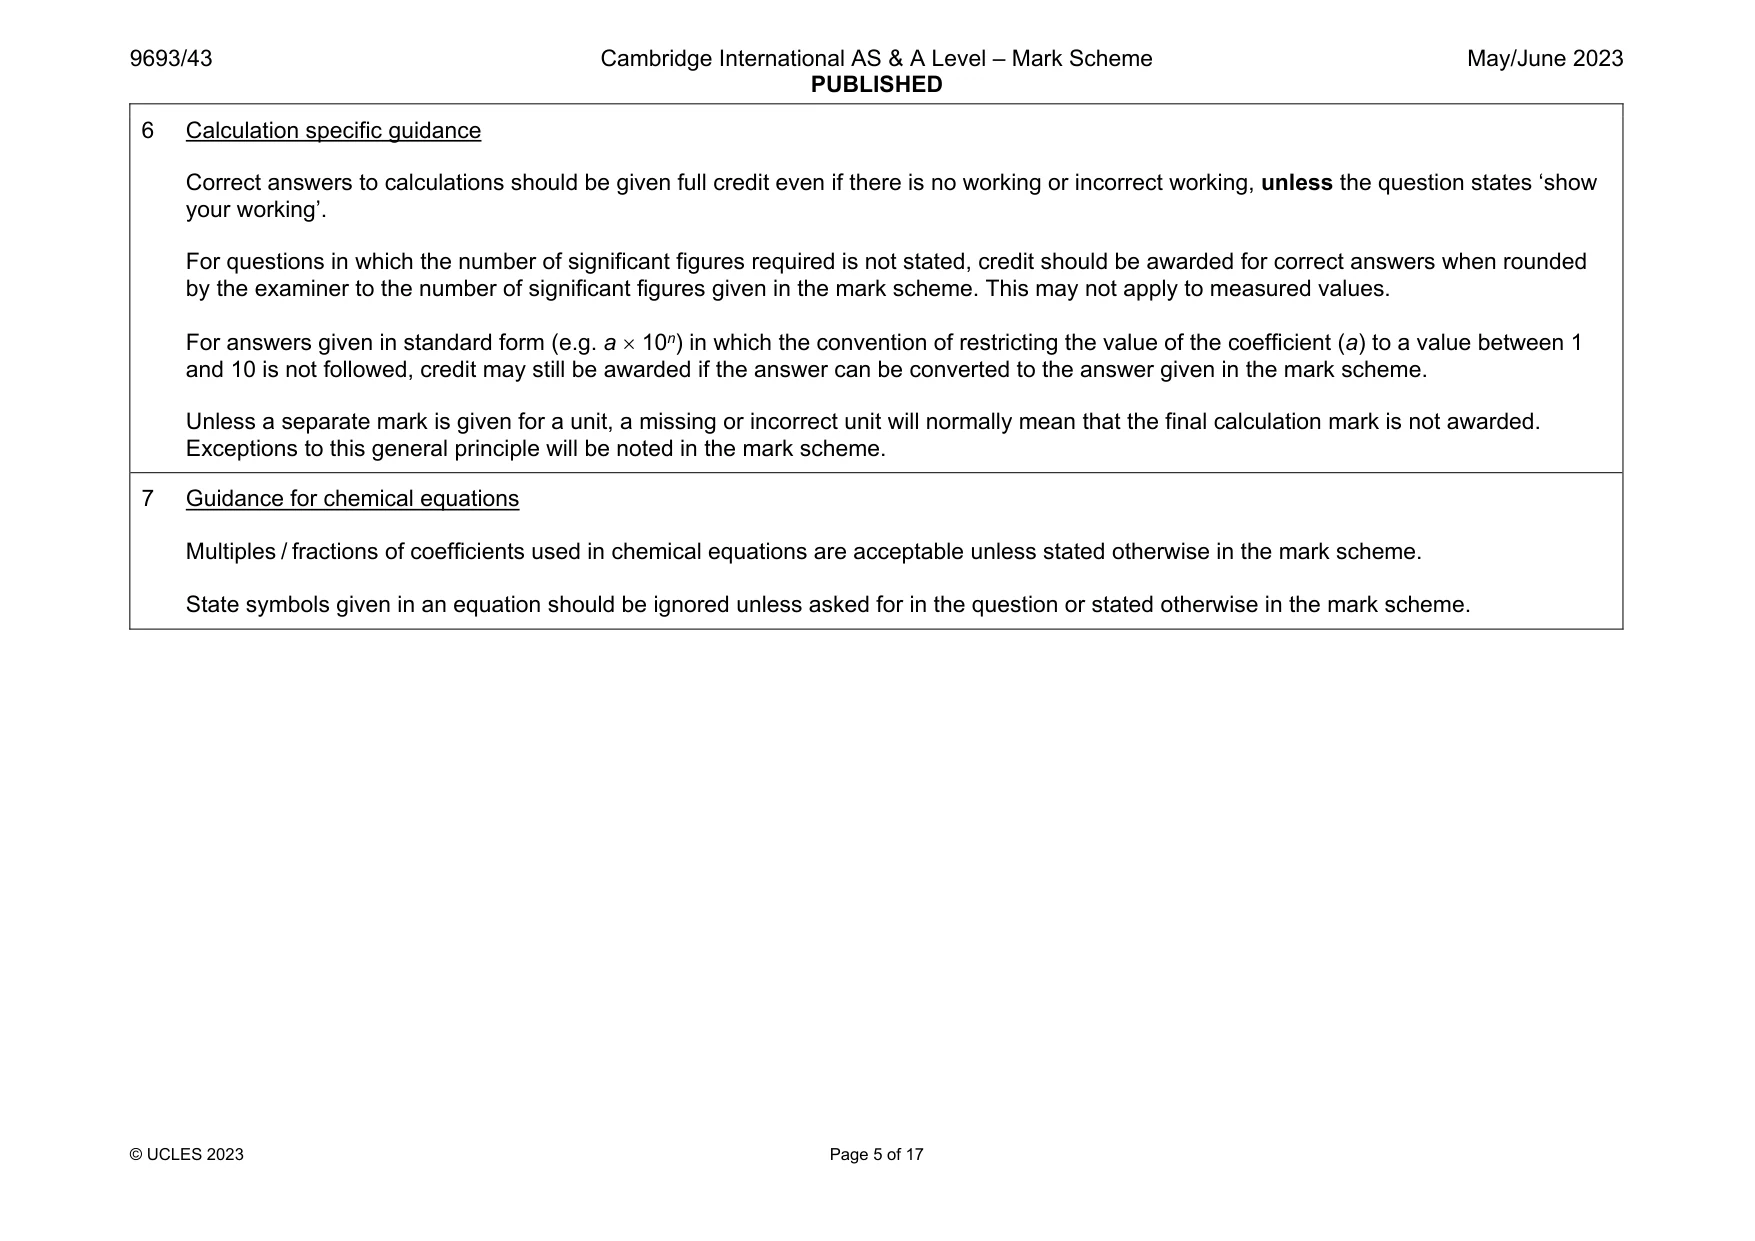
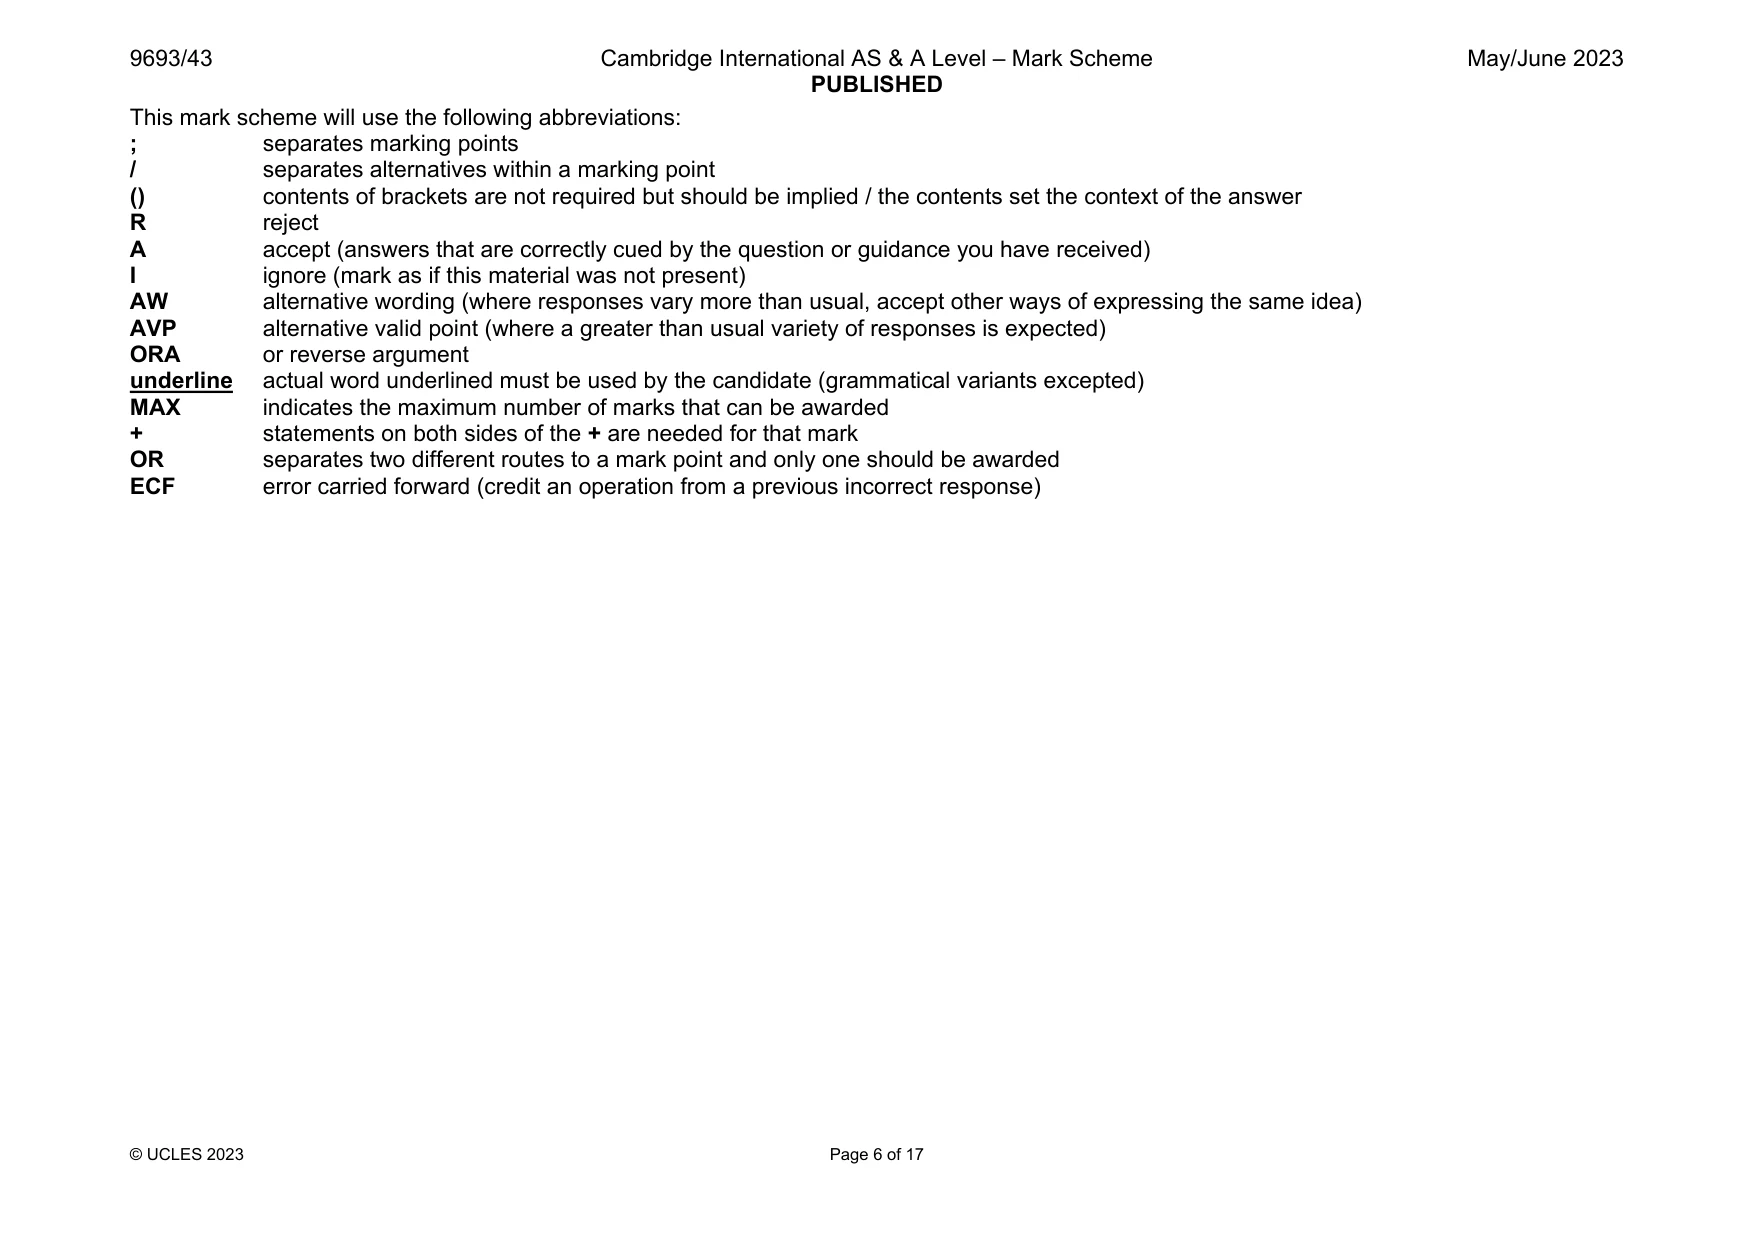
Mark scheme17 pages
Answers below. Sit the paper first if you are practising.
Questions as text
Q1 · A diagram of a section of a cell surface membrane
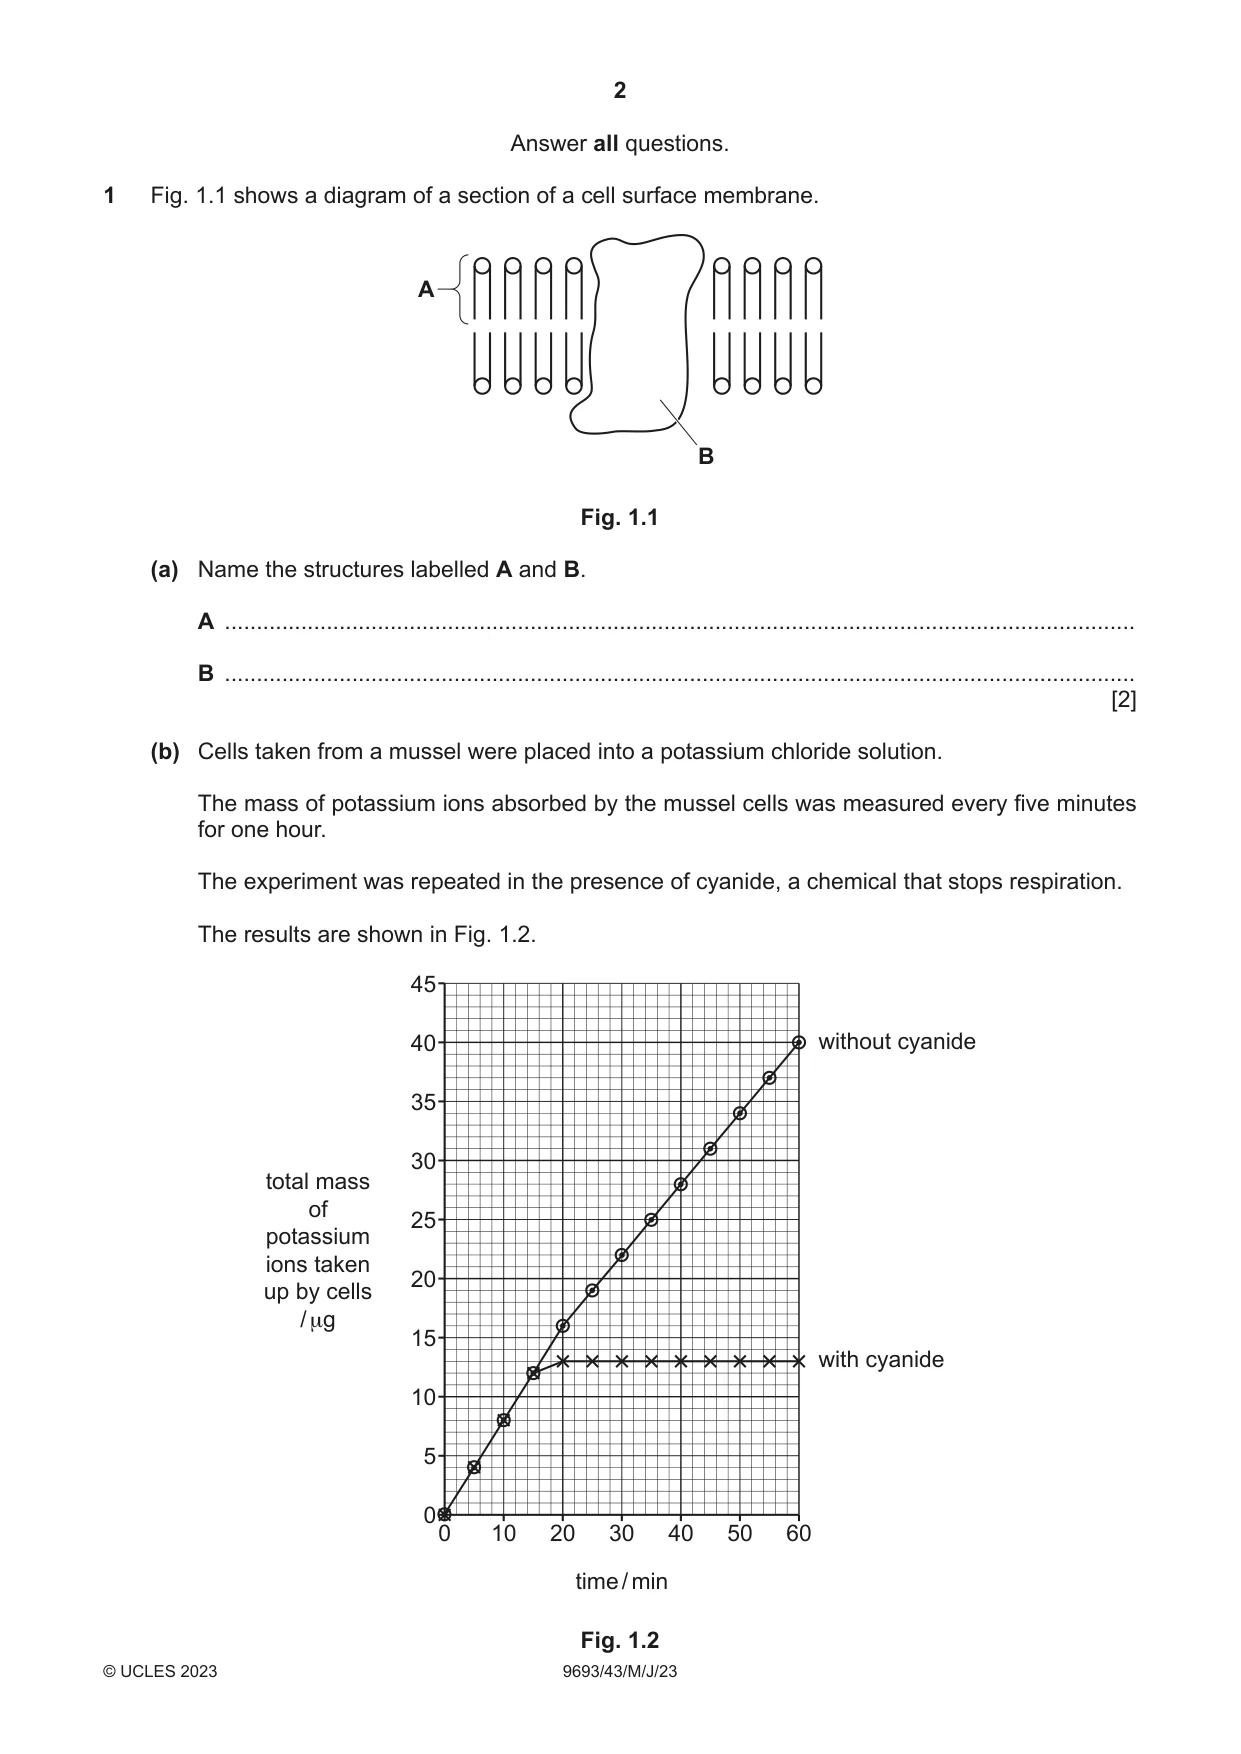
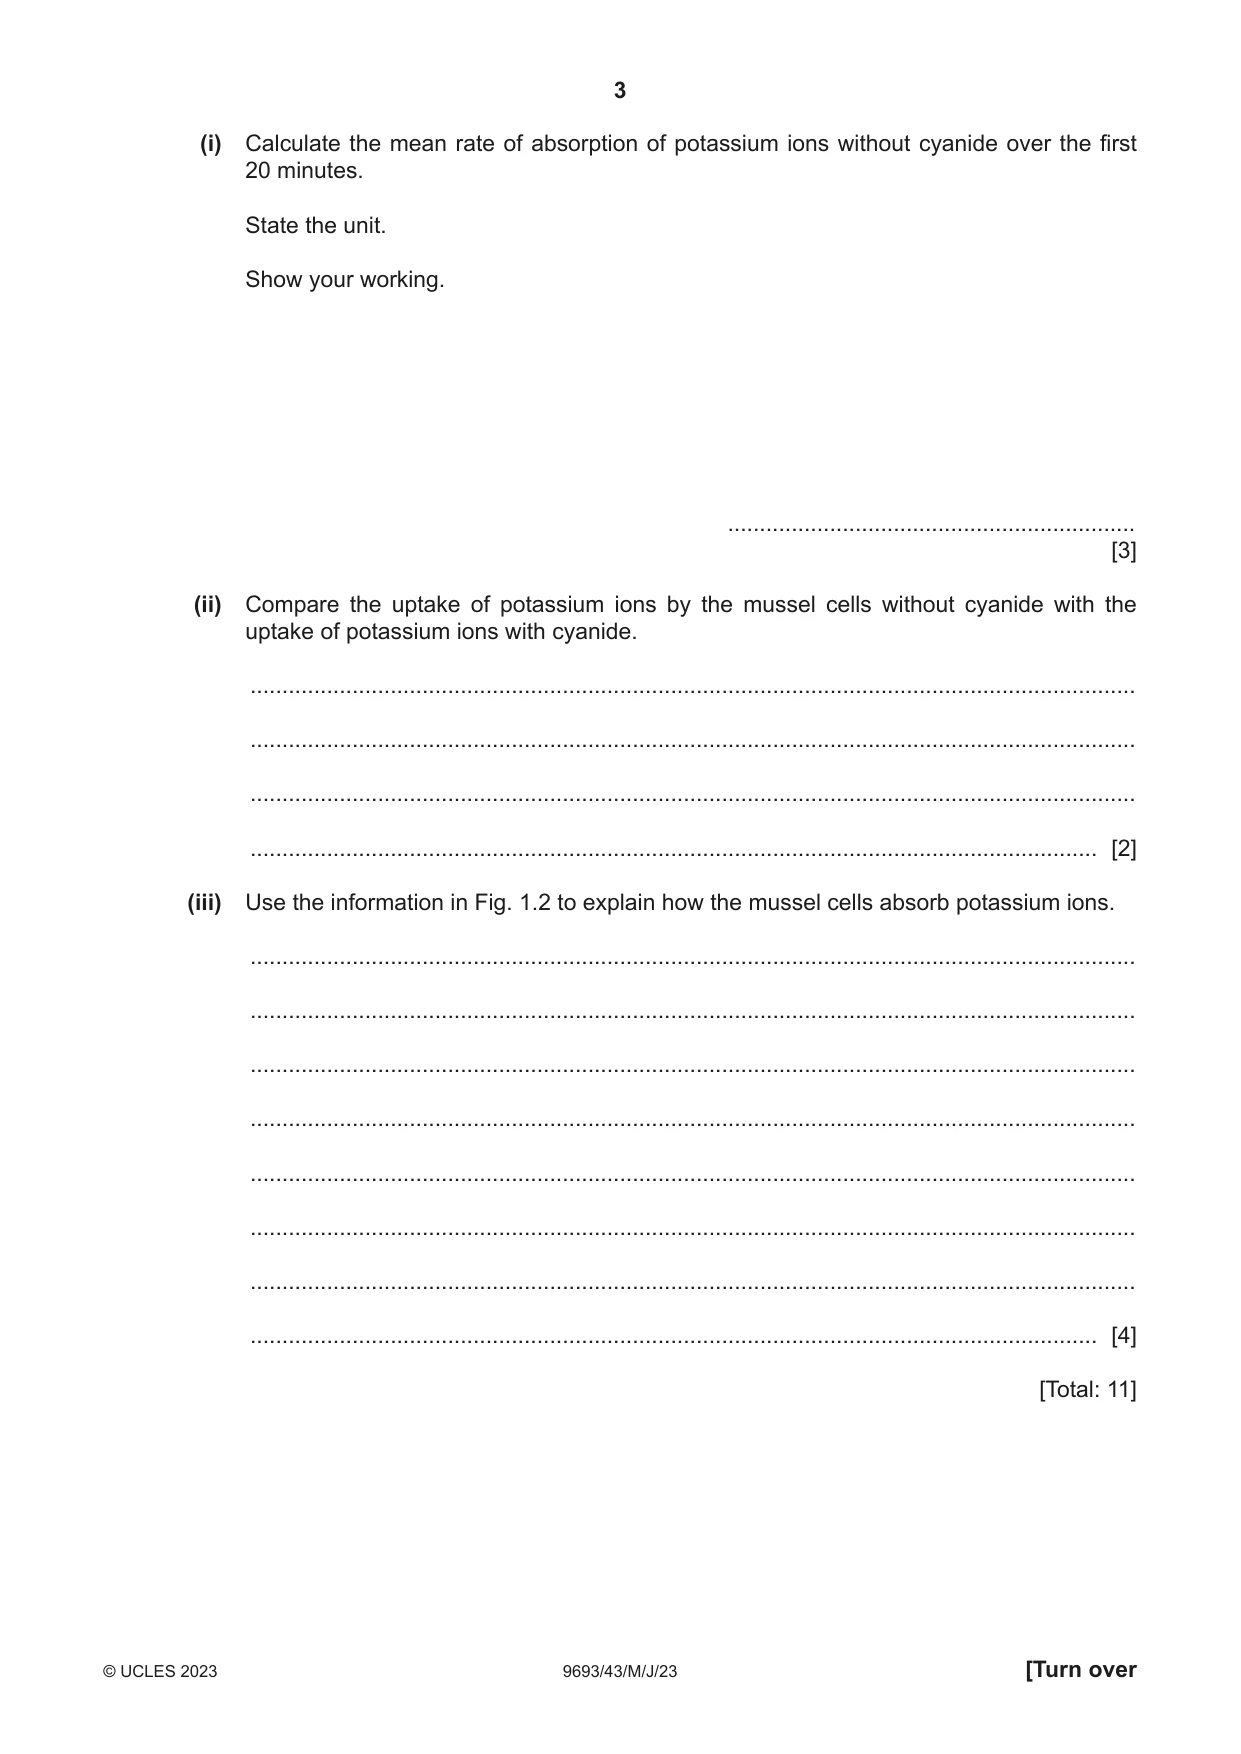
1 Fig. 1.1 shows a diagram of a section of a cell surface membrane. A B Fig. 1.1 (a) Name the structures labelled A and B. A ............................................................................................................................................... B ............................................................................................................................................... [2] (b) Cells taken from a mussel were placed into a potassium chloride solution. The mass of potassium ions absorbed by the mussel cells was measured every five minutes for one hour. The experiment was repeated in the presence of cyanide, a chemical that stops respiration. The results are shown in Fig. 1.2. 45 40 without cyanide 35 30 total mass of 25 potassium ions taken 20 up by cells / μg 15 with cyanide 10 5 0 0 10 20 30 40 50 60 time / min Fig. 1.2 (i) Calculate the mean rate of absorption of potassium ions without cyanide over the first 20 minutes. State the unit. Show your working. ................................................................ [3] (ii) Compare the uptake of potassium ions by the mussel cells without cyanide with the uptake of potassium ions with cyanide. ........................................................................................................................................... ........................................................................................................................................... ........................................................................................................................................... ..................................................................................................................................... [2] (iii) Use the information in Fig. 1.2 to explain how the mussel cells absorb potassium ions. ........................................................................................................................................... ........................................................................................................................................... ........................................................................................................................................... ........................................................................................................................................... ........................................................................................................................................... ........................................................................................................................................... ........................................................................................................................................... ..................................................................................................................................... [4] [Total: 11]
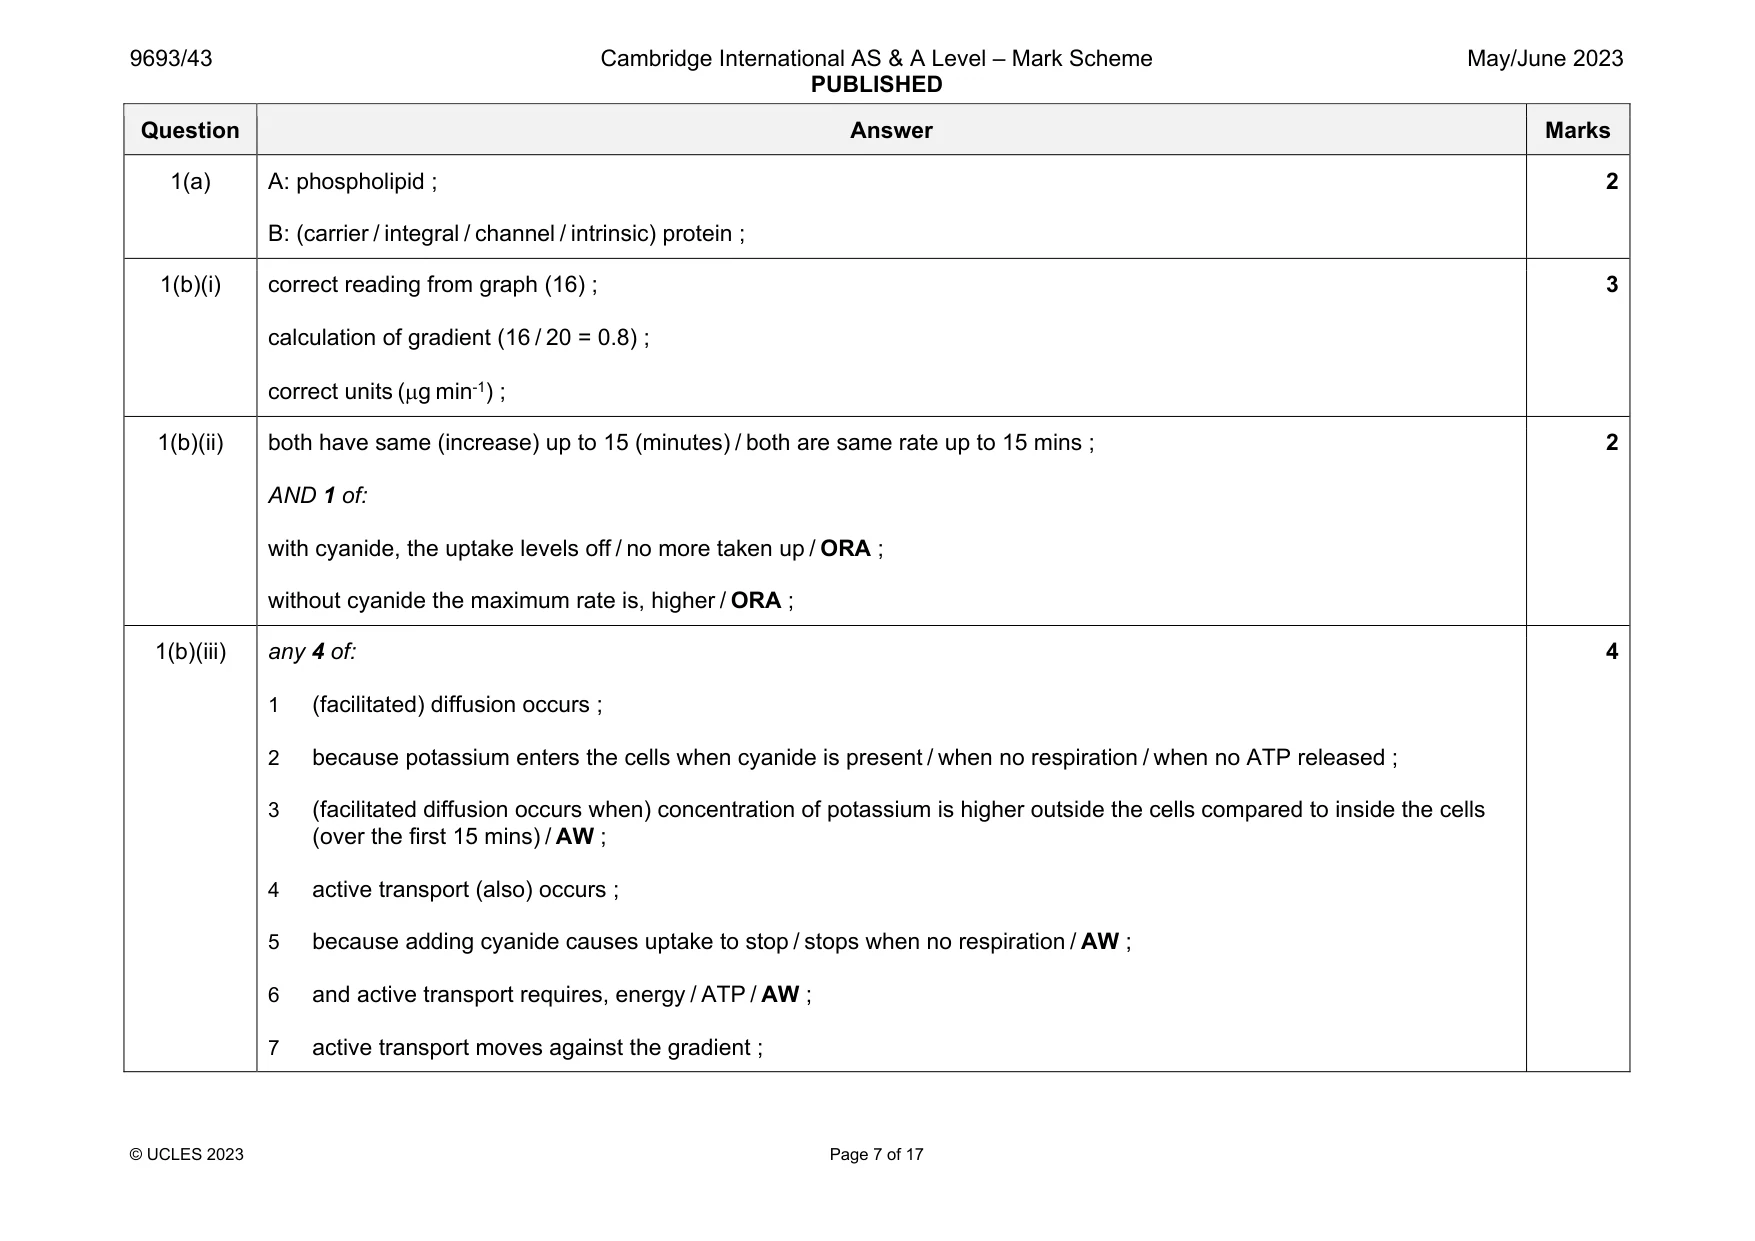
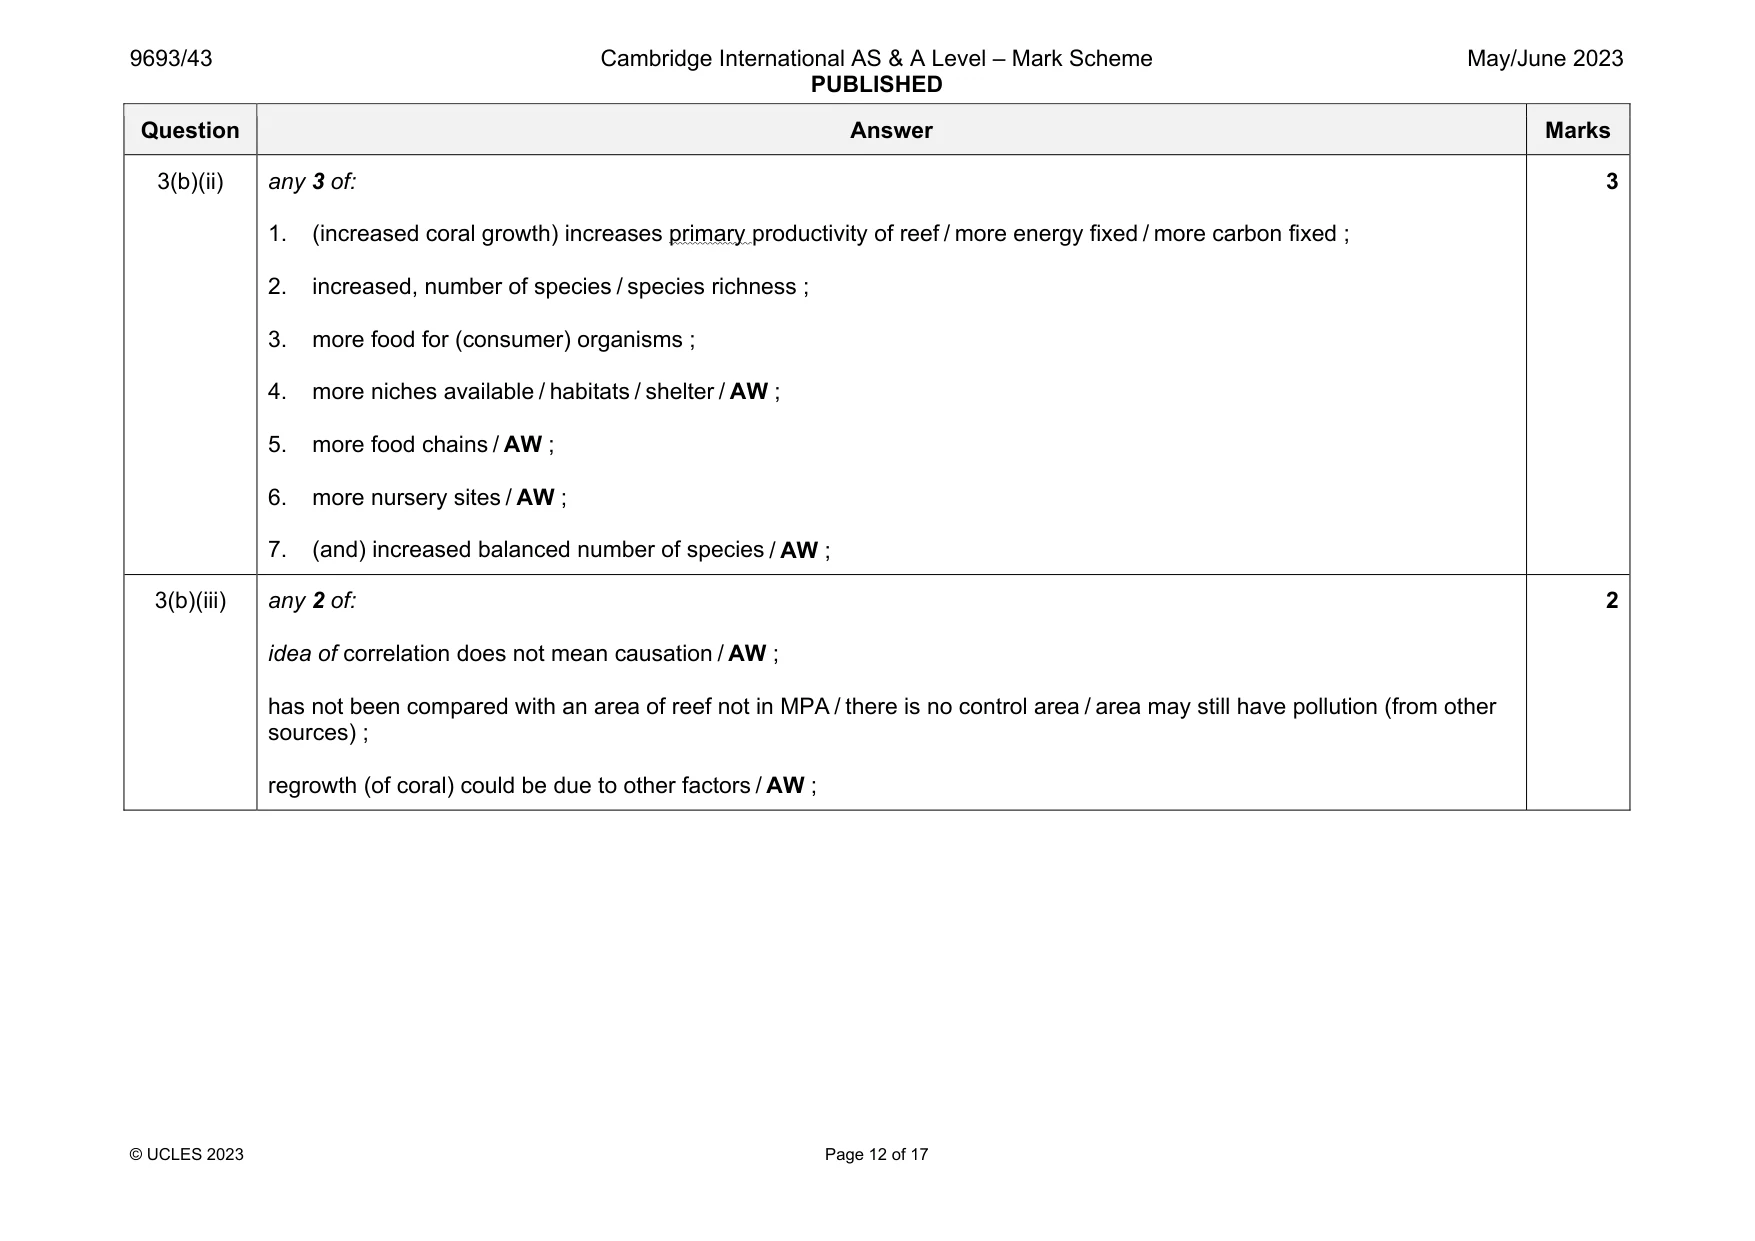
Mark scheme: 1(a) A: phospholipid ; B: (carrier / integral / channel / intrinsic) protein ; 2 1(b)(i) correct reading from graph (16) ; calculation of gradient (16 / 20 = 0.8) ; correct units (g min-1) ; 3 1(b)(ii) both have same (increase) up to 15 (minutes) / both are same rate up to 15 mins ; AND 1 of: with cyanide, the uptake levels off / no more taken up / ORA ; without cyanide the maximum rate is, higher / ORA ; 2 1(b)(iii) any 4 of: 1 (facilitated) diffusion occurs ; 2 because potassium enters the cells when cyanide is present / when no respiration / when no ATP released ; 3 (facilitated diffusion occurs when) concentration of potassium is higher outside the cells compared to inside the cells (over the first 15 mins) / AW ; 4 active transport (also) occurs ; 5 because adding cyanide causes uptake to stop / stops when no respiration / AW ; 6 and active transport requires, energy / ATP / AW ; 7 active transport moves against the gradient ; 4
Q2 · Scientists compared the sustainability of three different fishing methods for an Indian…
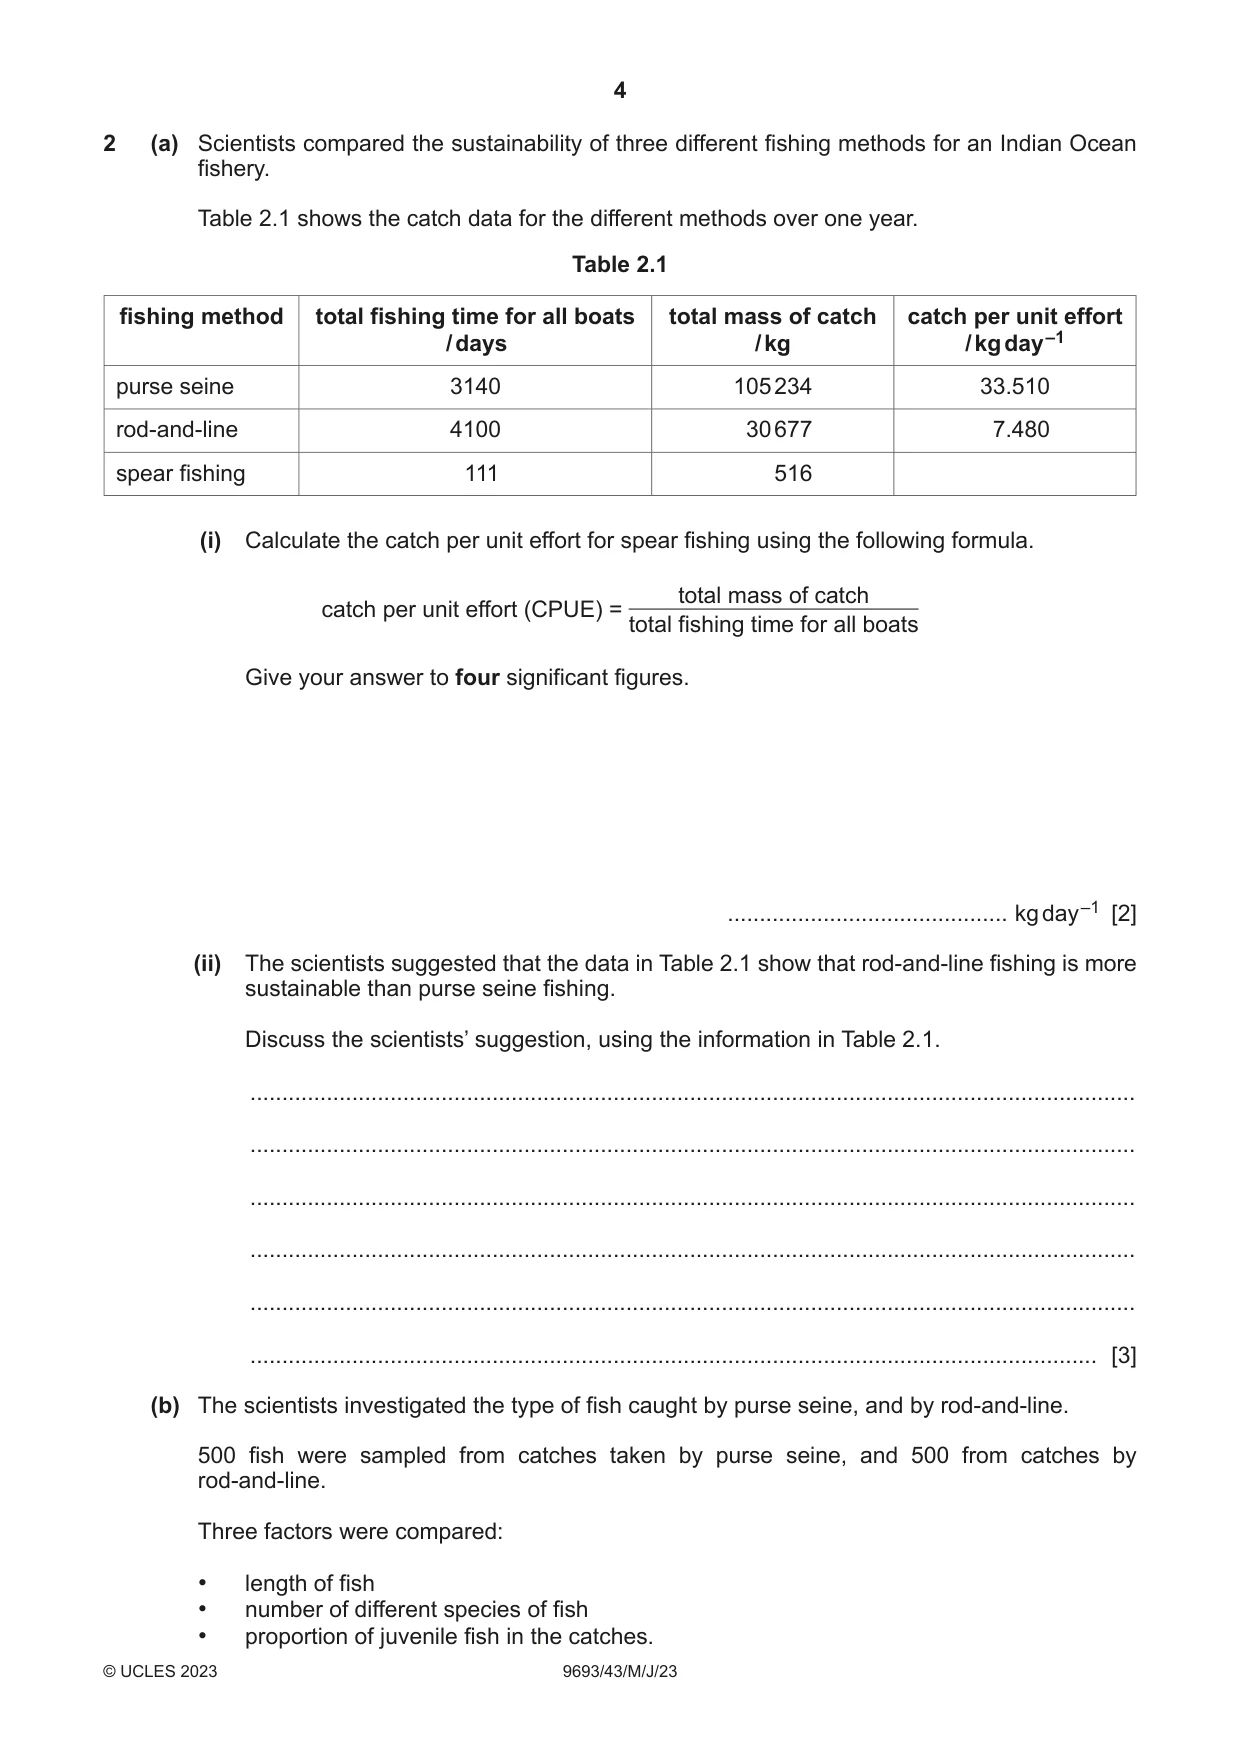
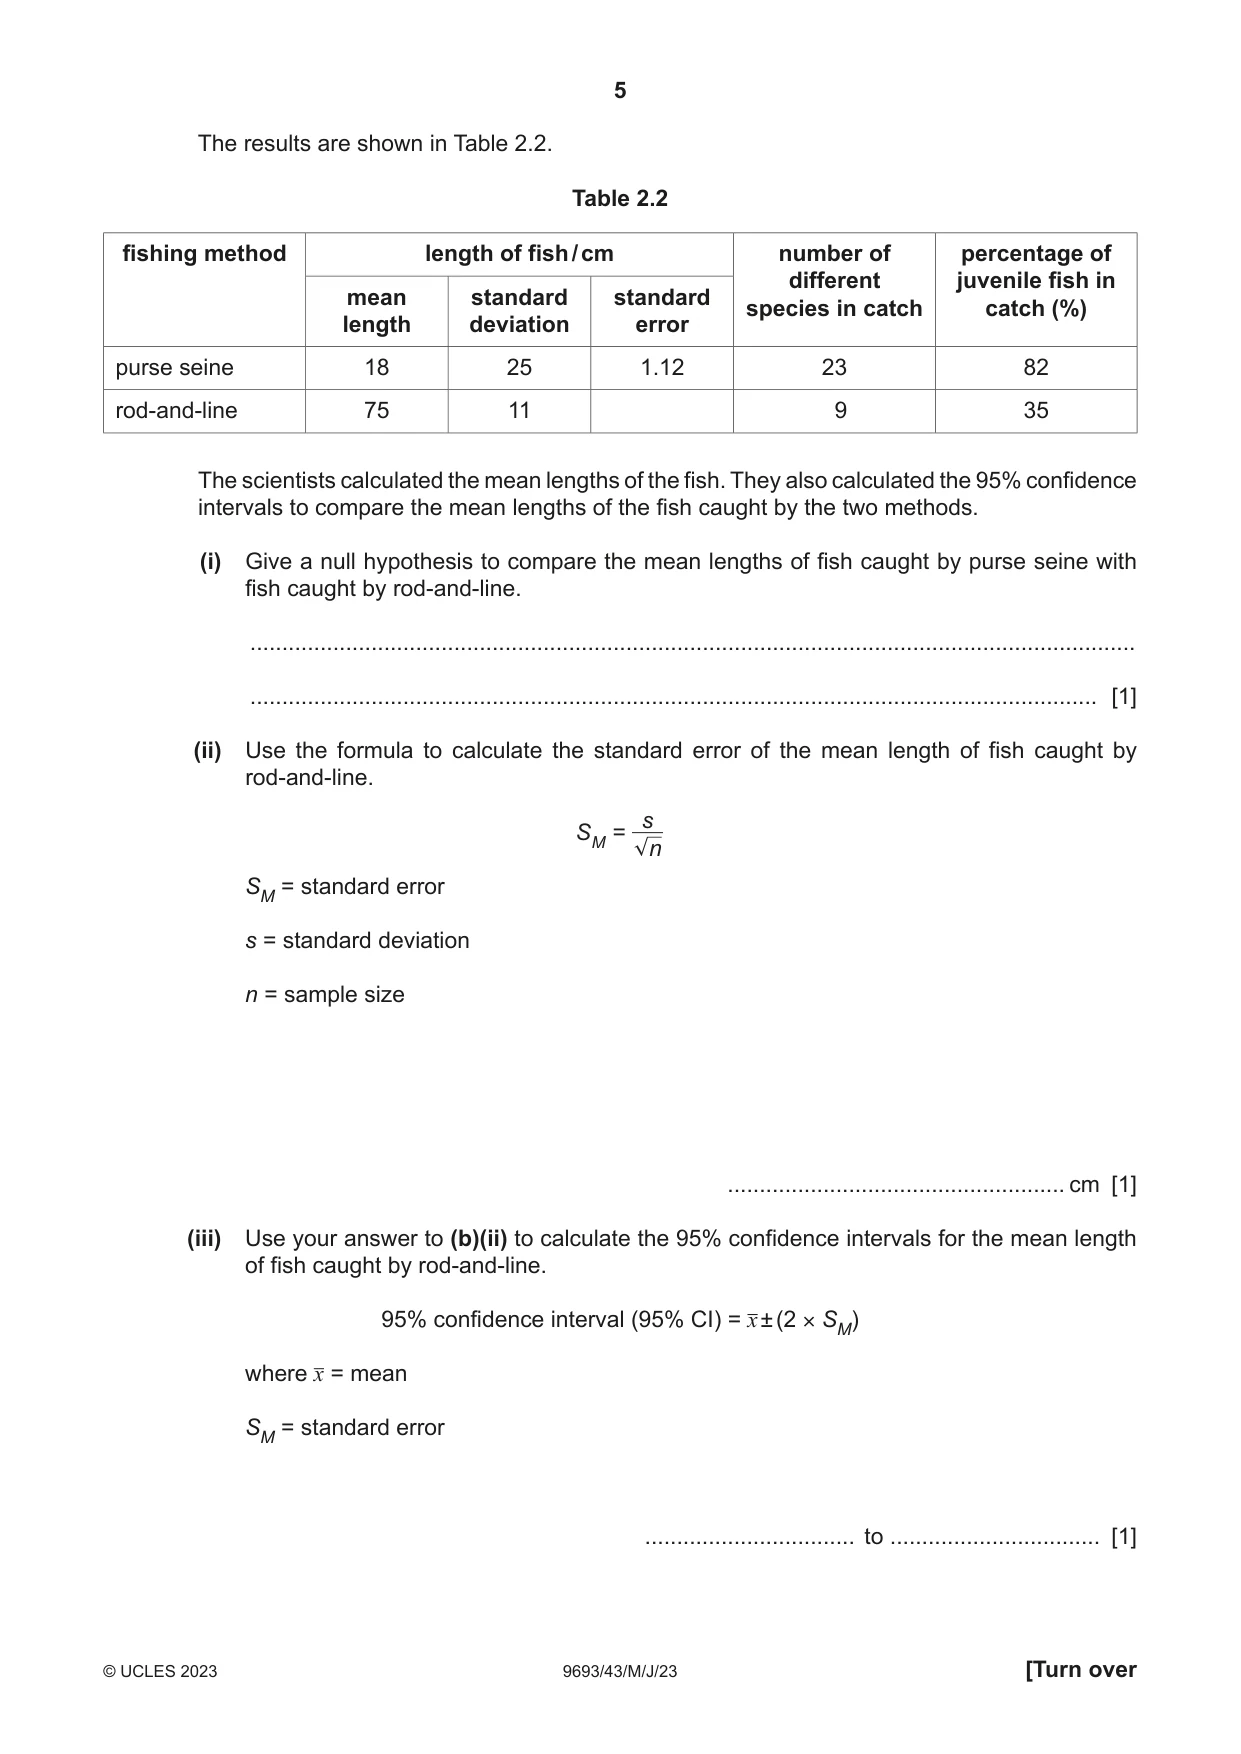
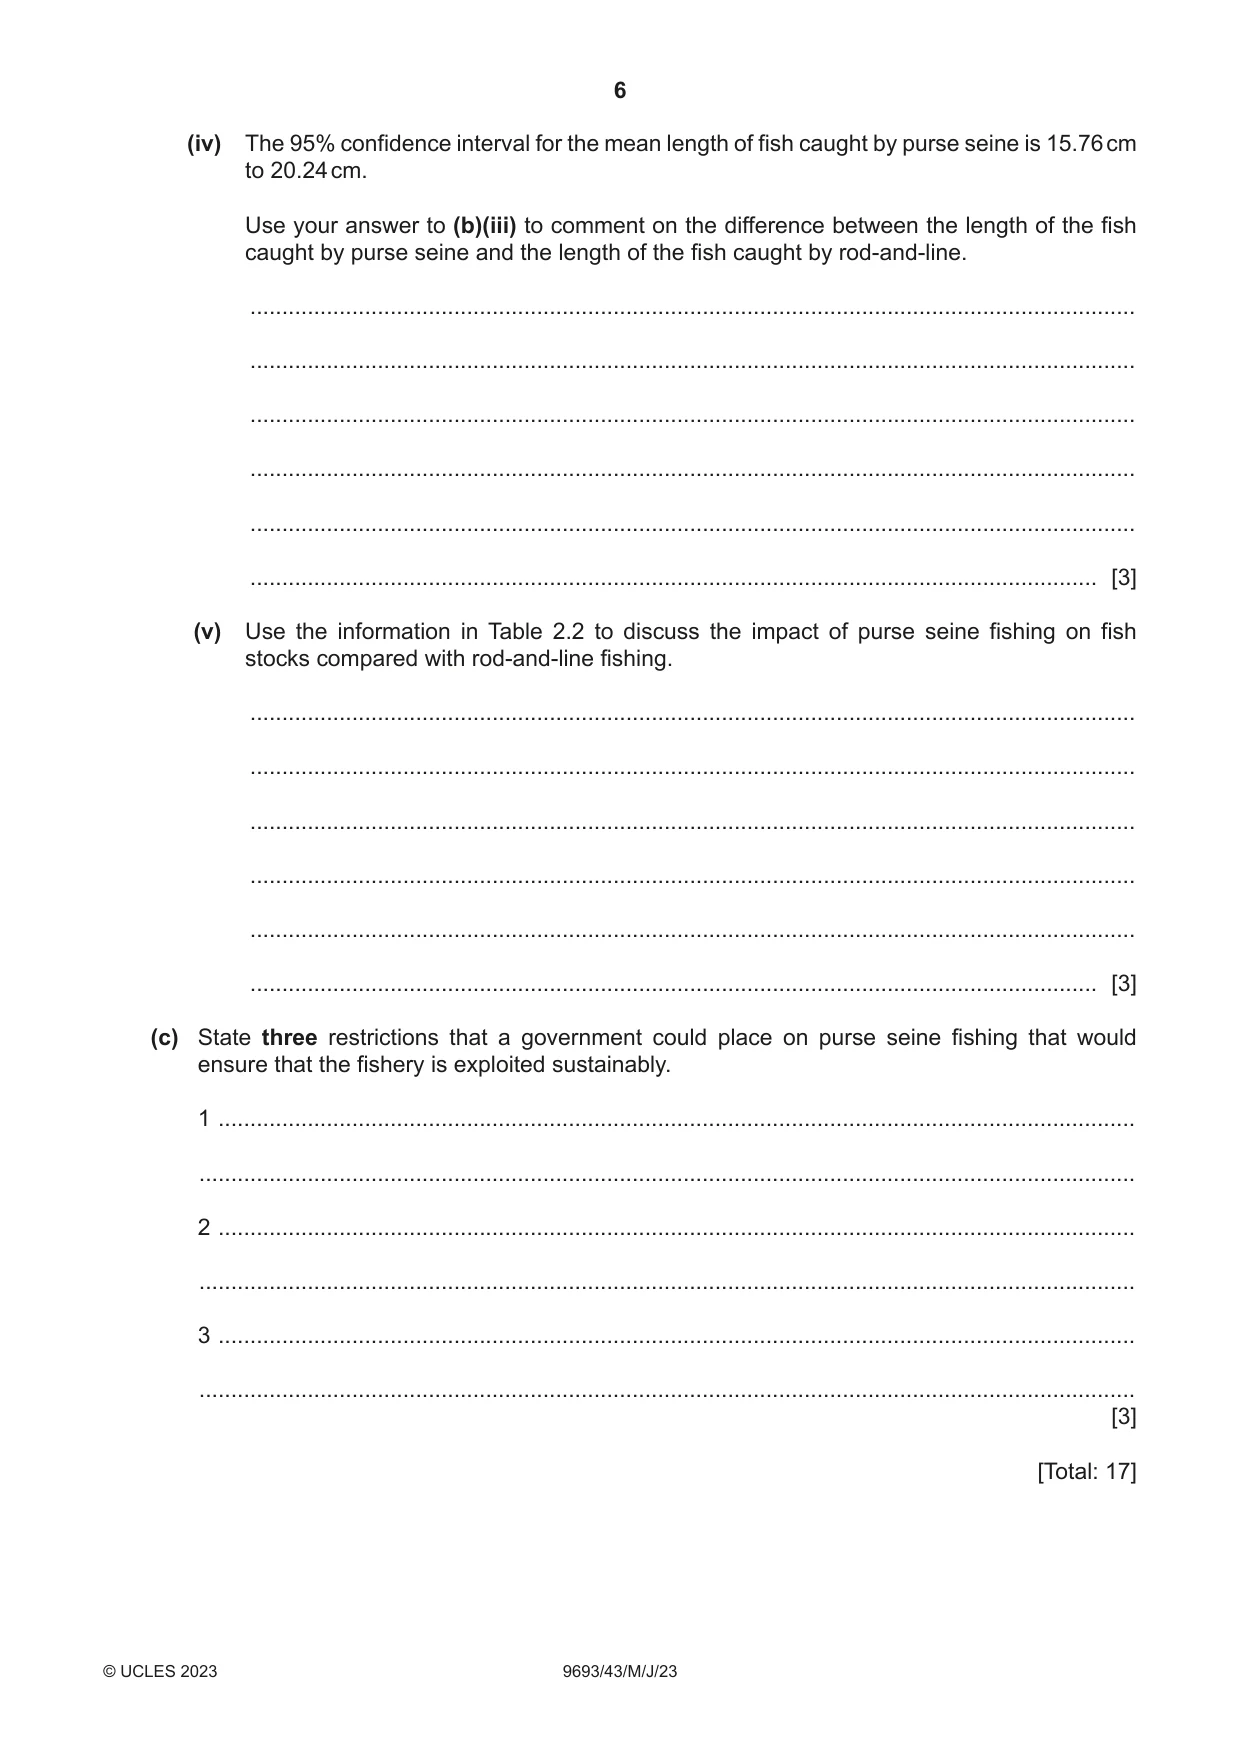
2 (a) Scientists compared the sustainability of three different fishing methods for an Indian Ocean fishery. Table 2.1 shows the catch data for the different methods over one year. Table 2.1 fishing method total fishing time for all boats total mass of catch catch per unit effort / days / kg / kg day –1 purse seine 3140 105 234 33.510 rod‑and‑line 4100 30 677 7.480 spear fishing 111 516 (i) Calculate the catch per unit effort for spear fishing using the following formula. total mass of catch catch per unit effort (CPUE) = total fishing time for all boats Give your answer to four significant figures. ............................................ kg day –1 [2] (ii) The scientists suggested that the data in Table 2.1 show that rod‑and‑line fishing is more sustainable than purse seine fishing. Discuss the scientists’ suggestion, using the information in Table 2.1. ........................................................................................................................................... ........................................................................................................................................... ........................................................................................................................................... ........................................................................................................................................... ........................................................................................................................................... ..................................................................................................................................... [3] (b) The scientists investigated the type of fish caught by purse seine, and by rod‑and‑line. 500 fish were sampled from catches taken by purse seine, and 500 from catches by rod‑and‑line. Three factors were compared: • length of fish • number of different species of fish • proportion of juvenile fish in the catches. The results are shown in Table 2.2. Table 2.2 fishing method length of fish / cm number of percentage of different juvenile fish in mean standard standard species in catch catch (%) length deviation error purse seine 18 25 1.12 23 82 rod‑and‑line 75 11 9 35 The scientists calculated the mean lengths of the fish. They also calculated the 95% confidence intervals to compare the mean lengths of the fish caught by the two methods. (i) Give a null hypothesis to compare the mean lengths of fish caught by purse seine with fish caught by rod‑and‑line. ........................................................................................................................................... ..................................................................................................................................... [1] (ii) Use the formula to calculate the standard error of the mean length of fish caught by rod‑and‑line. s S M = n SM = standard error s = standard deviation n = sample size ..................................................... cm [1] (iii) Use your answer to (b)(ii) to calculate the 95% confidence intervals for the mean length of fish caught by rod‑and‑line. 95% confidence interval (95% CI) = x ± (2 × SM) where x = mean SM = standard error ................................. to ................................. [1] (iv) The 95% confidence interval for the mean length of fish caught by purse seine is 15.76 cm to 20.24 cm. Use your answer to (b)(iii) to comment on the difference between the length of the fish caught by purse seine and the length of the fish caught by rod‑and‑line. ........................................................................................................................................... ........................................................................................................................................... ........................................................................................................................................... ........................................................................................................................................... ........................................................................................................................................... ..................................................................................................................................... [3] (v) Use the information in Table 2.2 to discuss the impact of purse seine fishing on fish stocks compared with rod‑and‑line fishing. ........................................................................................................................................... ........................................................................................................................................... ........................................................................................................................................... ........................................................................................................................................... ........................................................................................................................................... ..................................................................................................................................... [3] (c) State three restrictions that a government could place on purse seine fishing that would ensure that the fishery is exploited sustainably. 1 ................................................................................................................................................ ................................................................................................................................................... 2 ................................................................................................................................................ ................................................................................................................................................... 3 ................................................................................................................................................ ................................................................................................................................................... [3] [Total: 17]
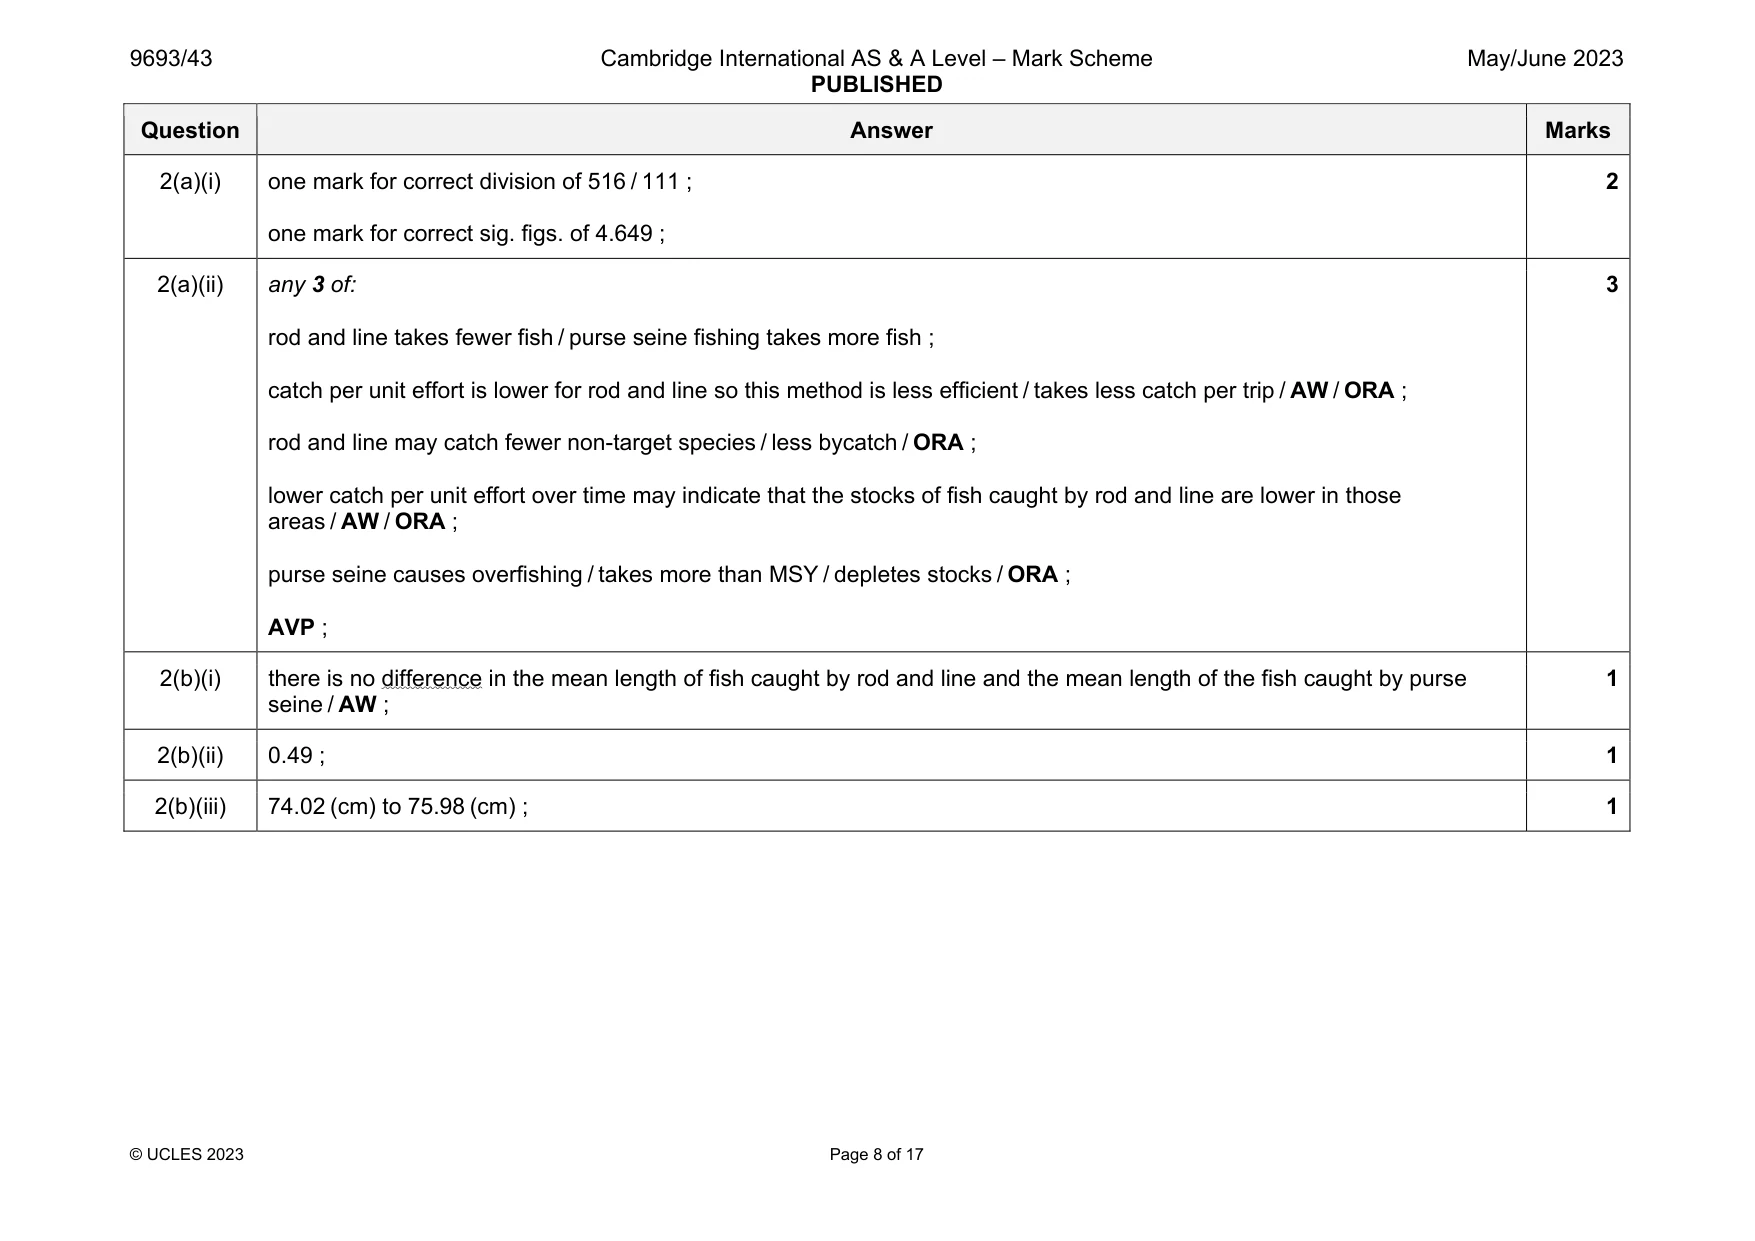
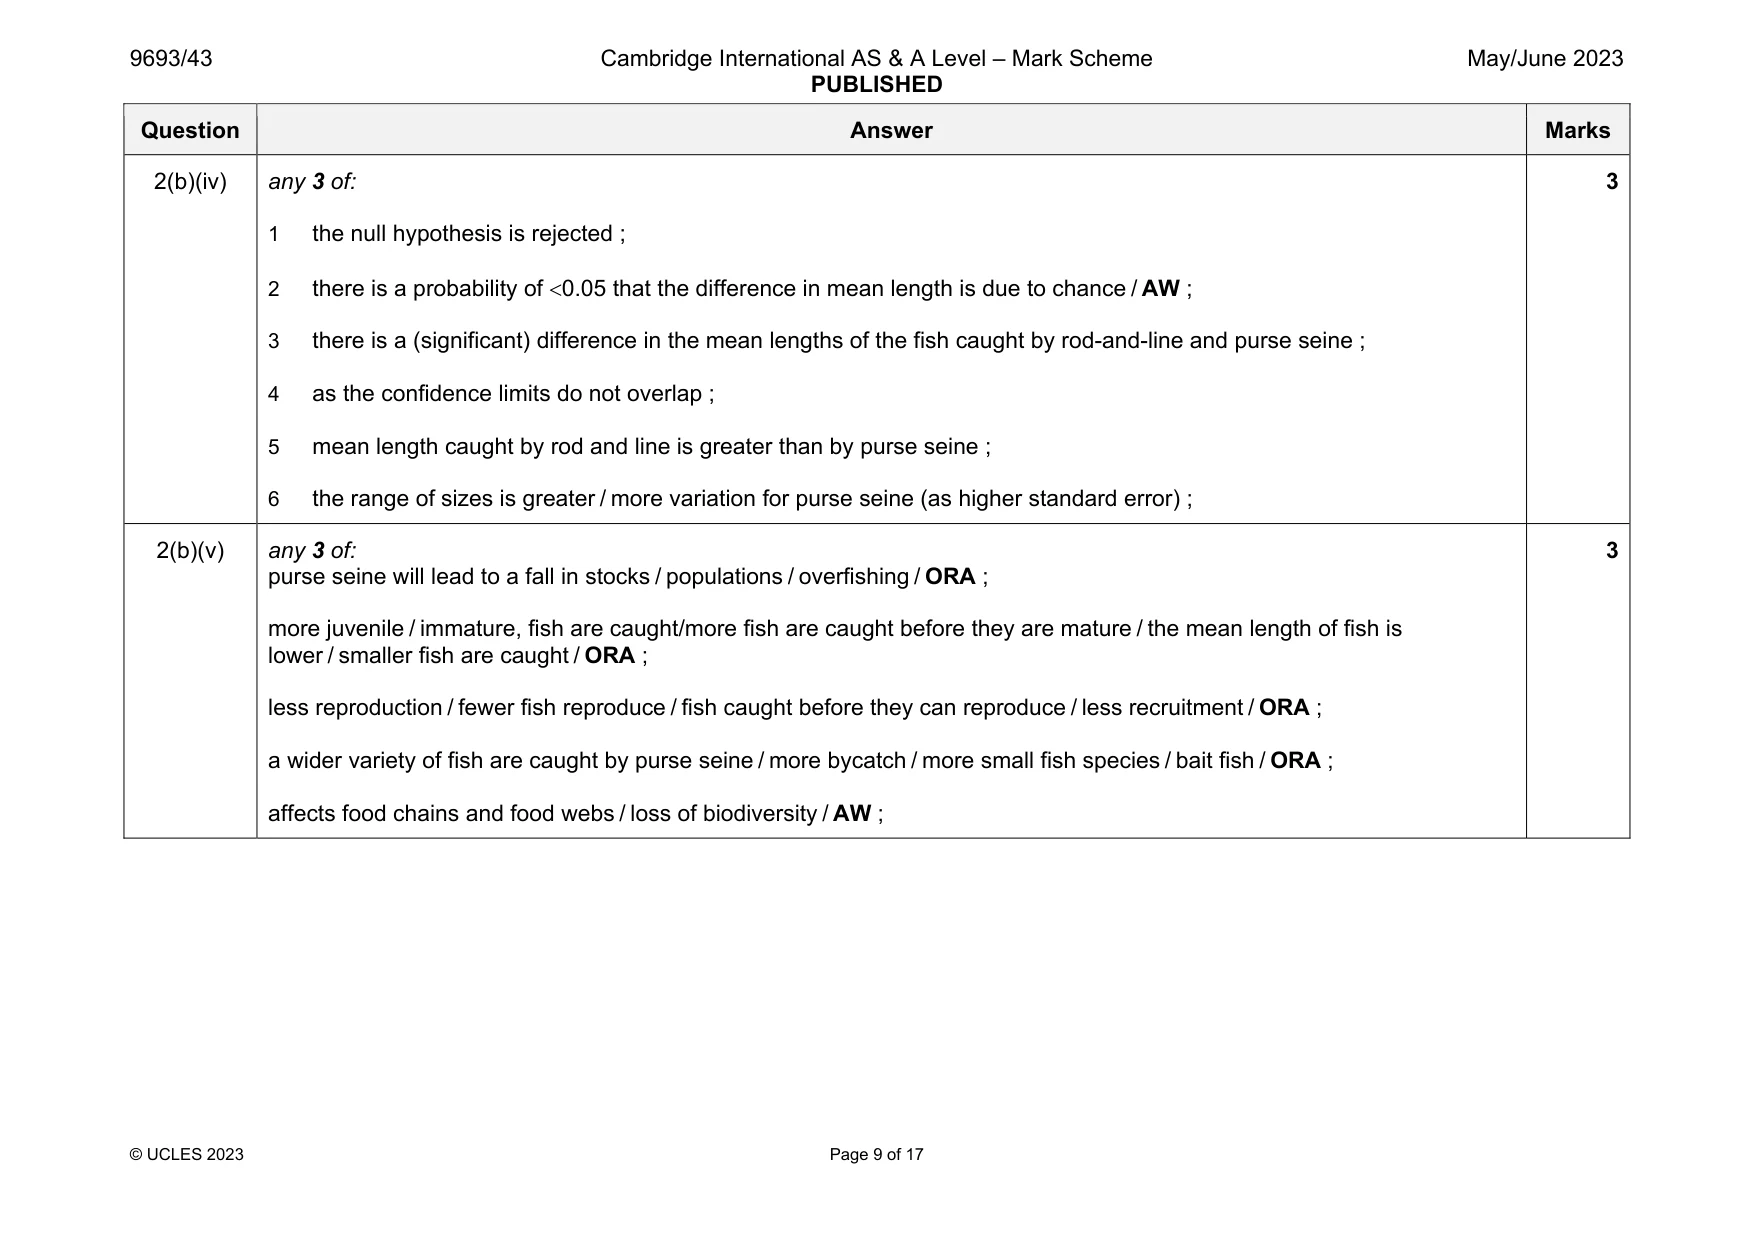
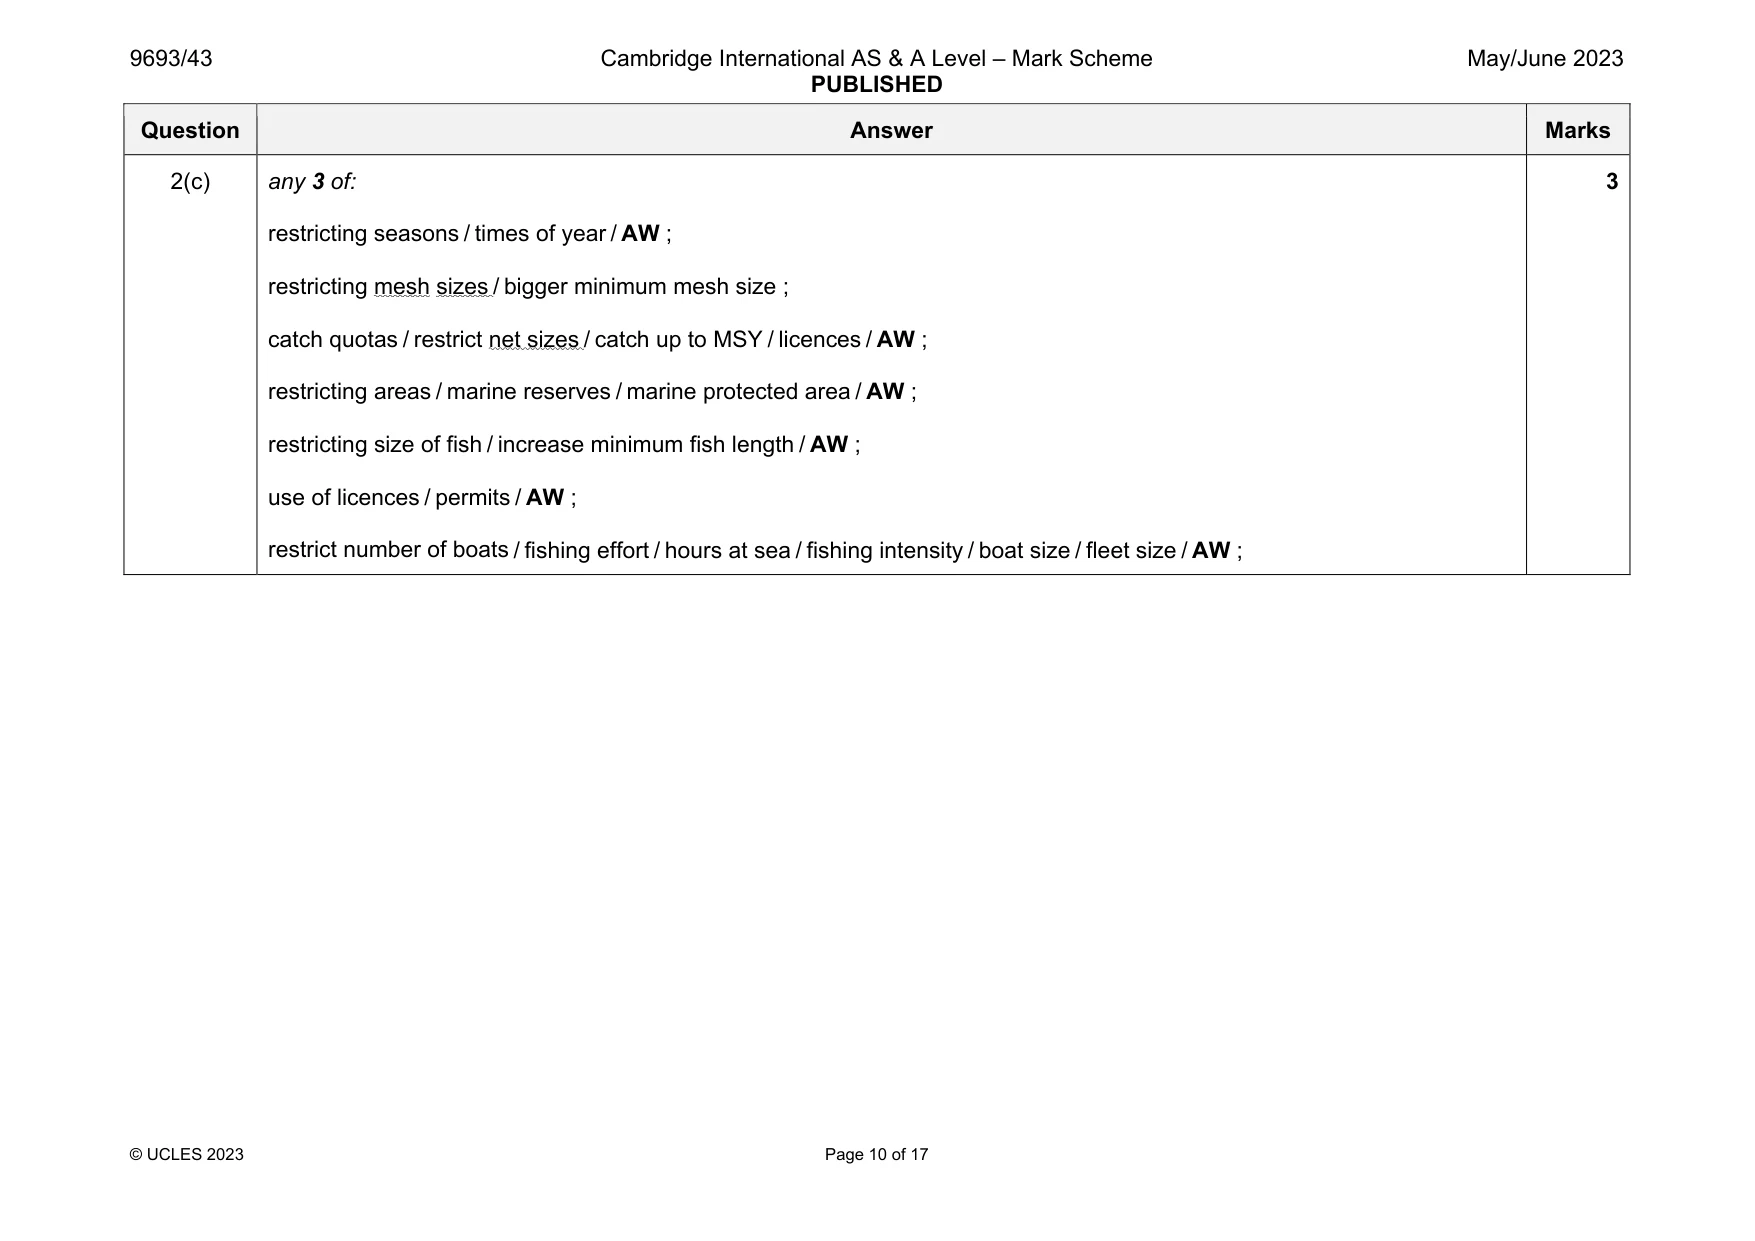
Mark scheme: 2(a)(i) one mark for correct division of 516 / 111 ; one mark for correct sig. figs. of 4.649 ; 2 2(a)(ii) any 3 of: rod and line takes fewer fish / purse seine fishing takes more fish ; catch per unit effort is lower for rod and line so this method is less efficient / takes less catch per trip / AW / ORA ; rod and line may catch fewer non-target species / less bycatch / ORA ; lower catch per unit effort over time may indicate that the stocks of fish caught by rod and line are lower in those areas / AW / ORA ; purse seine causes overfishing / takes more than MSY / depletes stocks / ORA ; AVP ; 3 2(b)(i) there is no difference in the mean length of fish caught by rod and line and the mean length of the fish caught by purse seine / AW ; 1 2(b)(ii) 0.49 ; 1 2(b)(iii) 74.02 (cm) to 75.98 (cm) ; 1 Question Answer Marks 2(b)(iv) any 3 of: 1 the null hypothesis is rejected ; 2 there is a probability of 0.05 that the difference in mean length is due to chance / AW ; 3 there is a (significant) difference in the mean lengths of the fish caught by rod-and-line and purse seine ; 4 as the confidence limits do not overlap ; 5 mean length caught by rod and line is greater than by purse seine ; 6 the range of sizes is greater / more variation for purse seine (as higher standard error) ; 3 2(b)(v) any 3 of: purse seine will lead to a fall in stocks / populations / overfishing / ORA ; more juvenile / immature, fish are caught/more fish are caught before they are mature / the mean length of fish is lower / smaller fish are caught / ORA ; less reproduction / fewer fish reproduce / fish caught before they can reproduce / less recruitment / ORA ; a wider variety of fish are caught by purse seine / more bycatch / more small fish species / bait fish / ORA ; affects food chains and food webs / loss of biodiversity / AW ; 3 Question Answer Marks 2(c) any 3 of: restricting seasons / times of year / AW ; restricting mesh sizes / bigger minimum mesh size ; catch quotas / restrict net sizes / catch up to MSY / licences / AW ; restricting areas / marine reserves / marine protected area / AW ; restricting size of fish / increase minimum fish length / AW ; use of licences / permits / AW ; restrict number of boats / fishing effort / hours at sea / fishing intensity / boat size / fleet size / AW ; 3
Q3 · An area of coral reef had been damaged by pollution from agricultural run‑off containing…
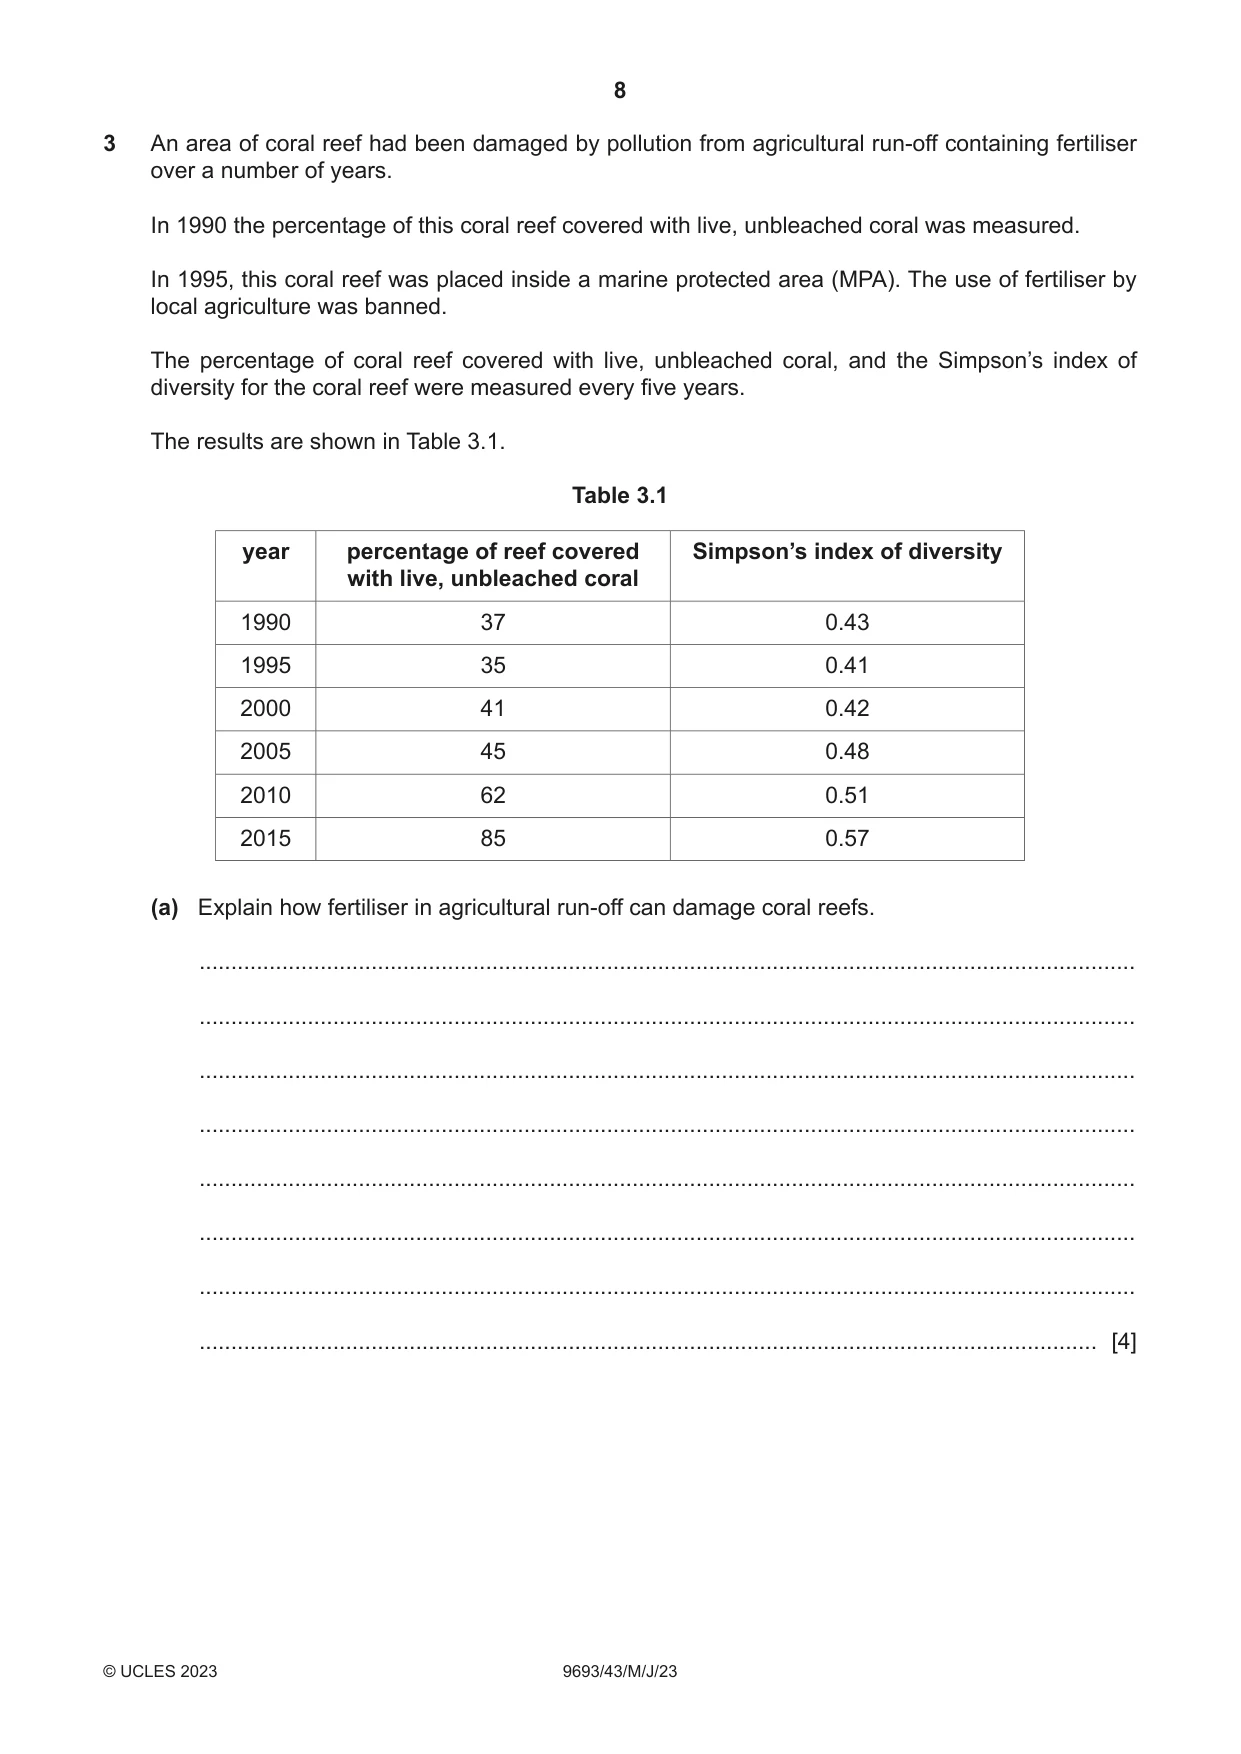
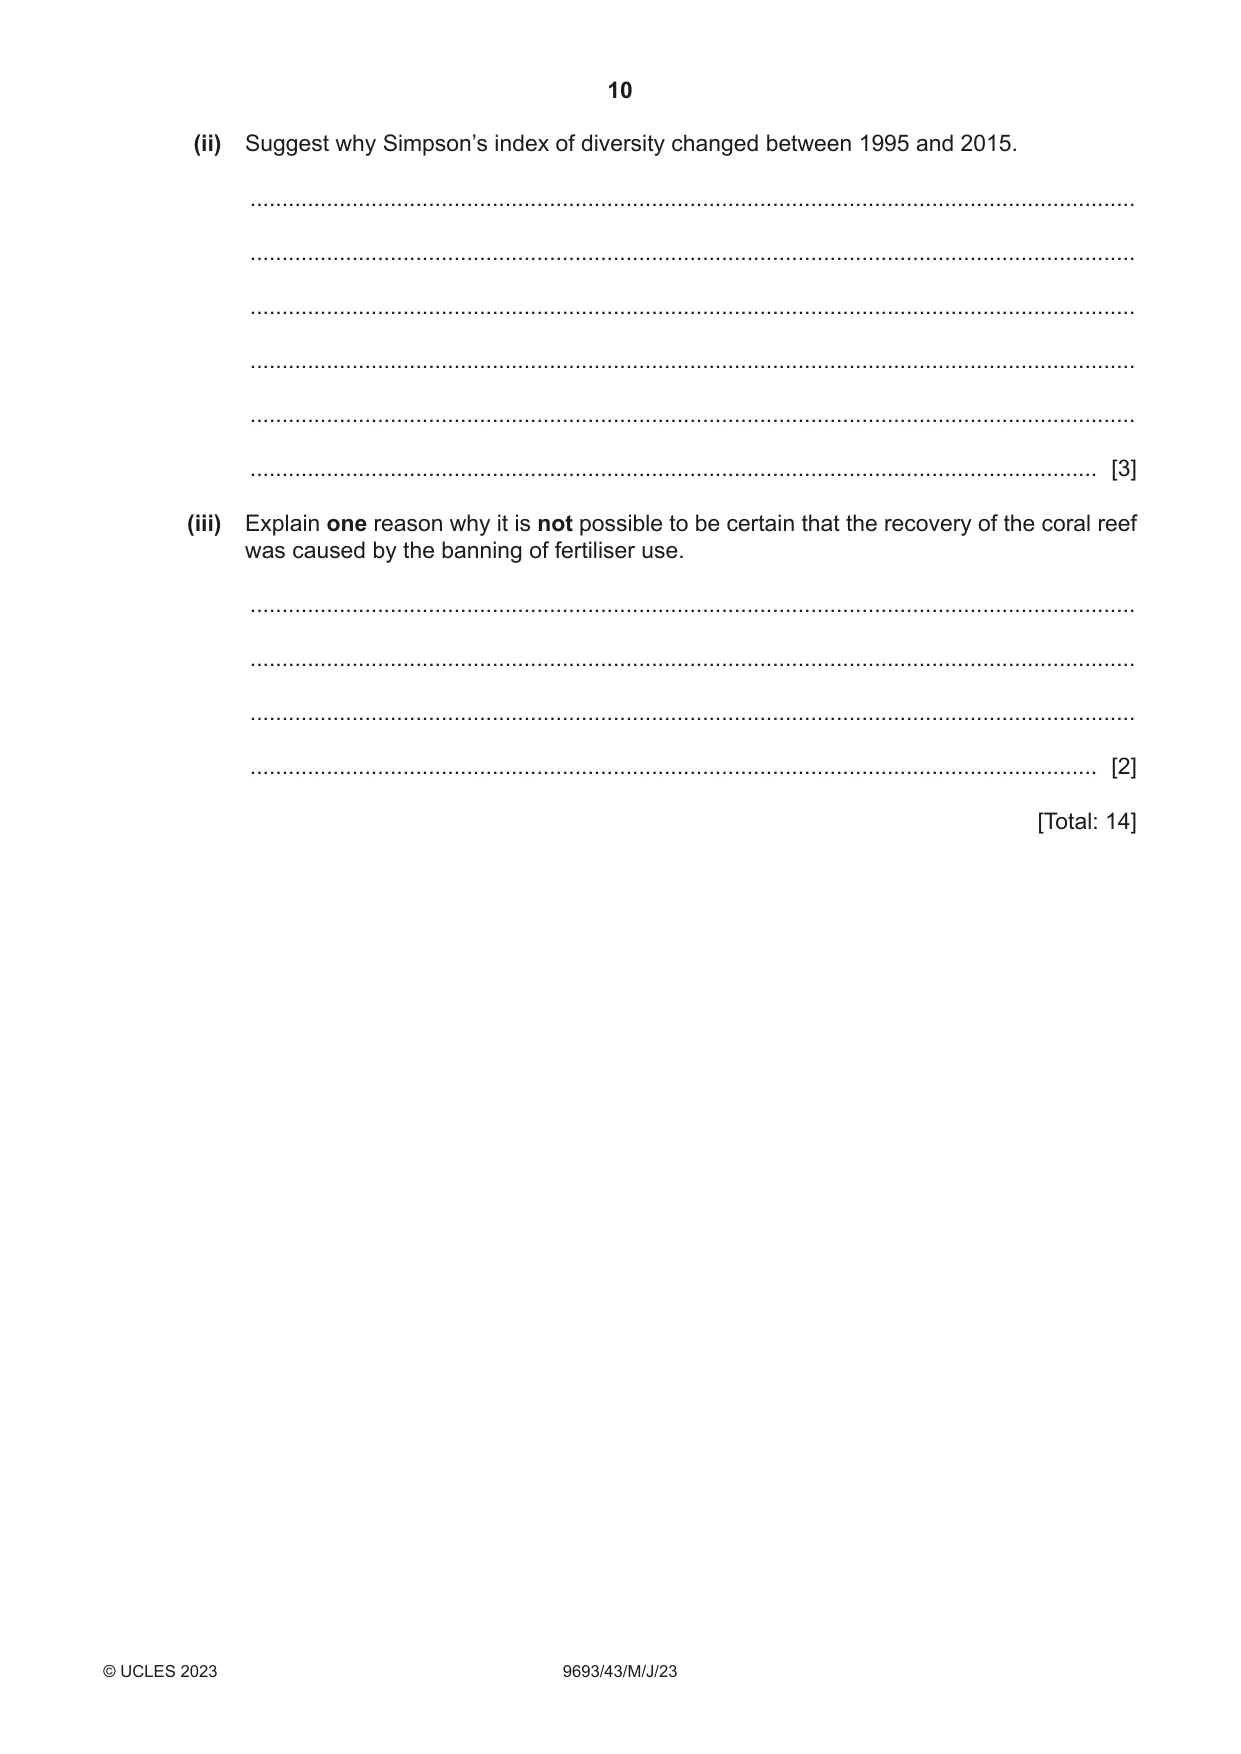
3 An area of coral reef had been damaged by pollution from agricultural run‑off containing fertiliser over a number of years. In 1990 the percentage of this coral reef covered with live, unbleached coral was measured. In 1995, this coral reef was placed inside a marine protected area (MPA). The use of fertiliser by local agriculture was banned. The percentage of coral reef covered with live, unbleached coral, and the Simpson’s index of diversity for the coral reef were measured every five years. The results are shown in Table 3.1. Table 3.1 year percentage of reef covered Simpson’s index of diversity with live, unbleached coral 1990 37 0.43 1995 35 0.41 2000 41 0.42 2005 45 0.48 2010 62 0.51 2015 85 0.57 (a) Explain how fertiliser in agricultural run‑off can damage coral reefs. ................................................................................................................................................... ................................................................................................................................................... ................................................................................................................................................... ................................................................................................................................................... ................................................................................................................................................... ................................................................................................................................................... ................................................................................................................................................... ............................................................................................................................................. [4] (ii) Suggest why Simpson’s index of diversity changed between 1995 and 2015. ........................................................................................................................................... ........................................................................................................................................... ........................................................................................................................................... ........................................................................................................................................... ........................................................................................................................................... ..................................................................................................................................... [3] (iii) Explain one reason why it is not possible to be certain that the recovery of the coral reef was caused by the banning of fertiliser use. ........................................................................................................................................... ........................................................................................................................................... ........................................................................................................................................... ..................................................................................................................................... [2] [Total: 14]
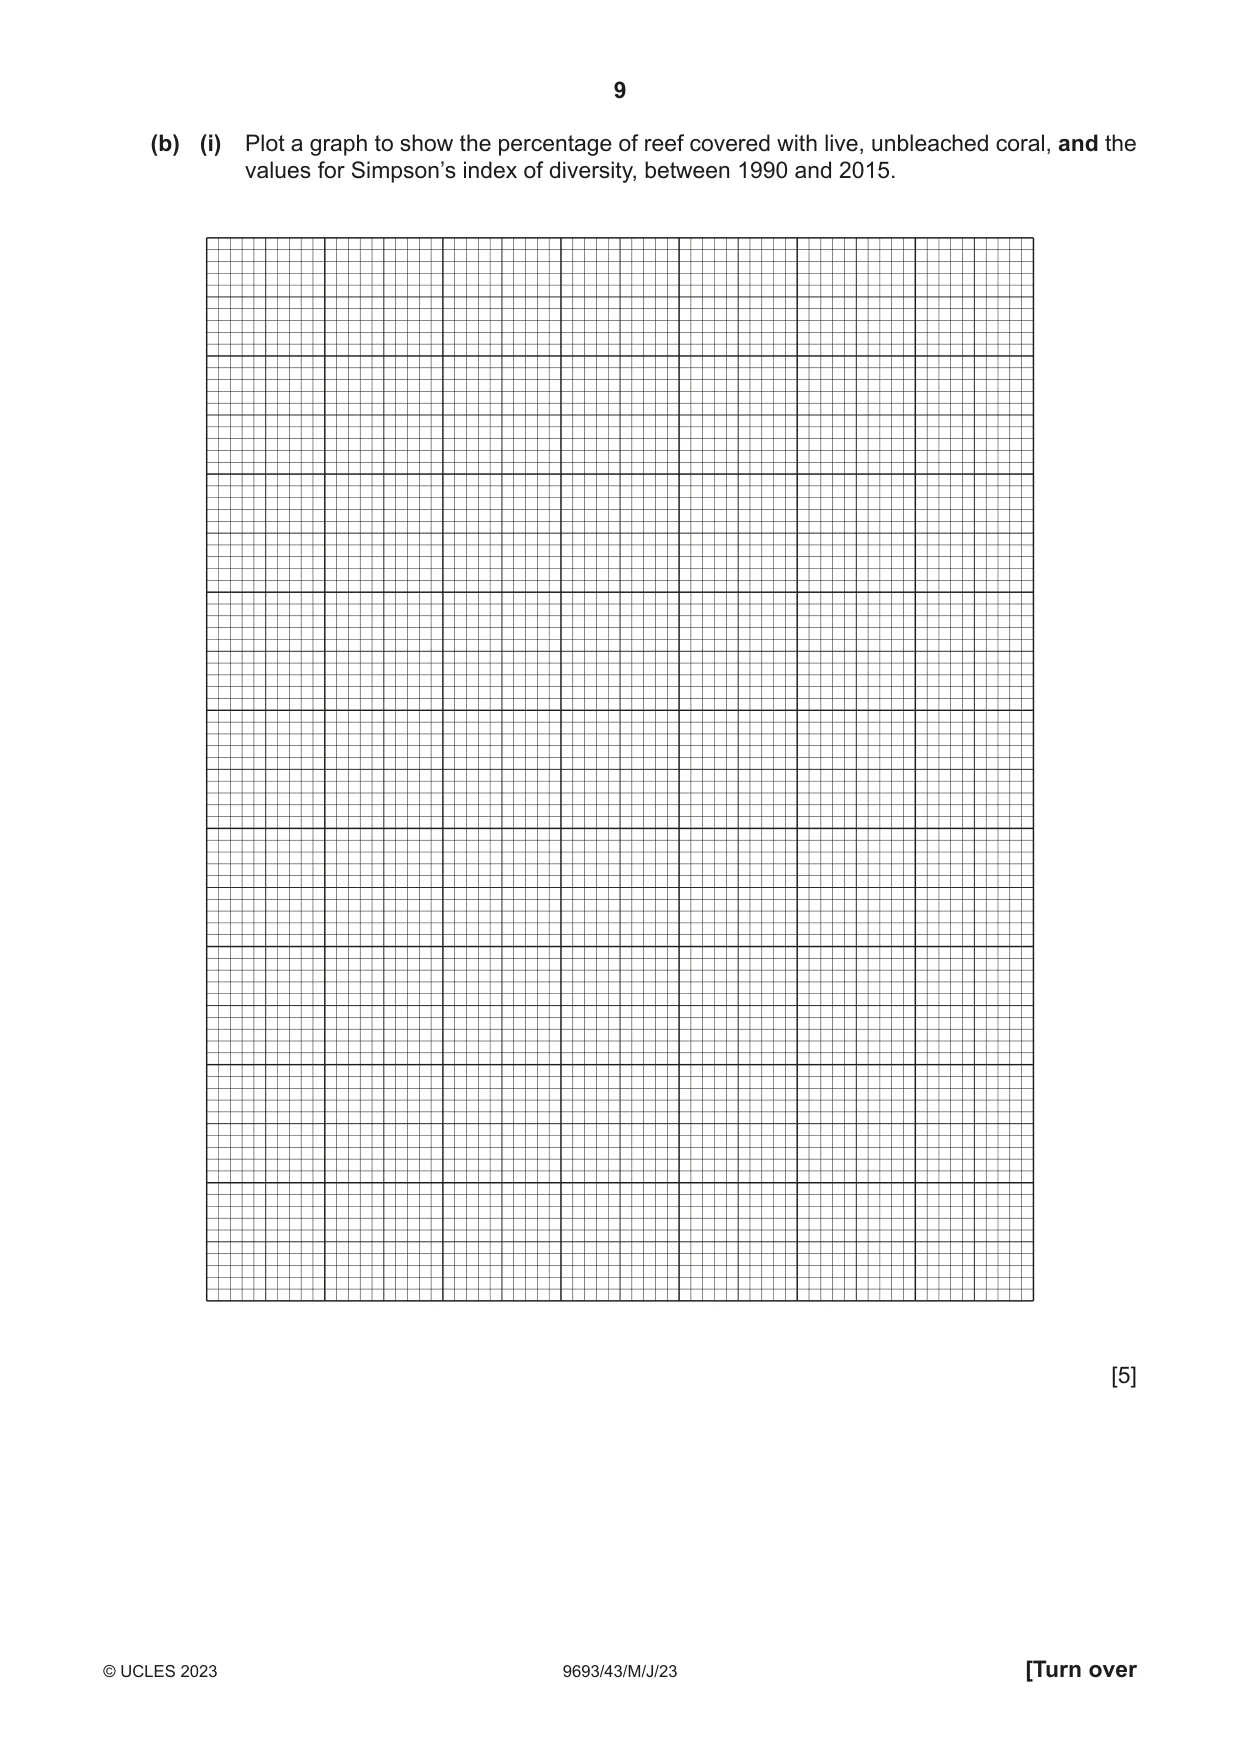
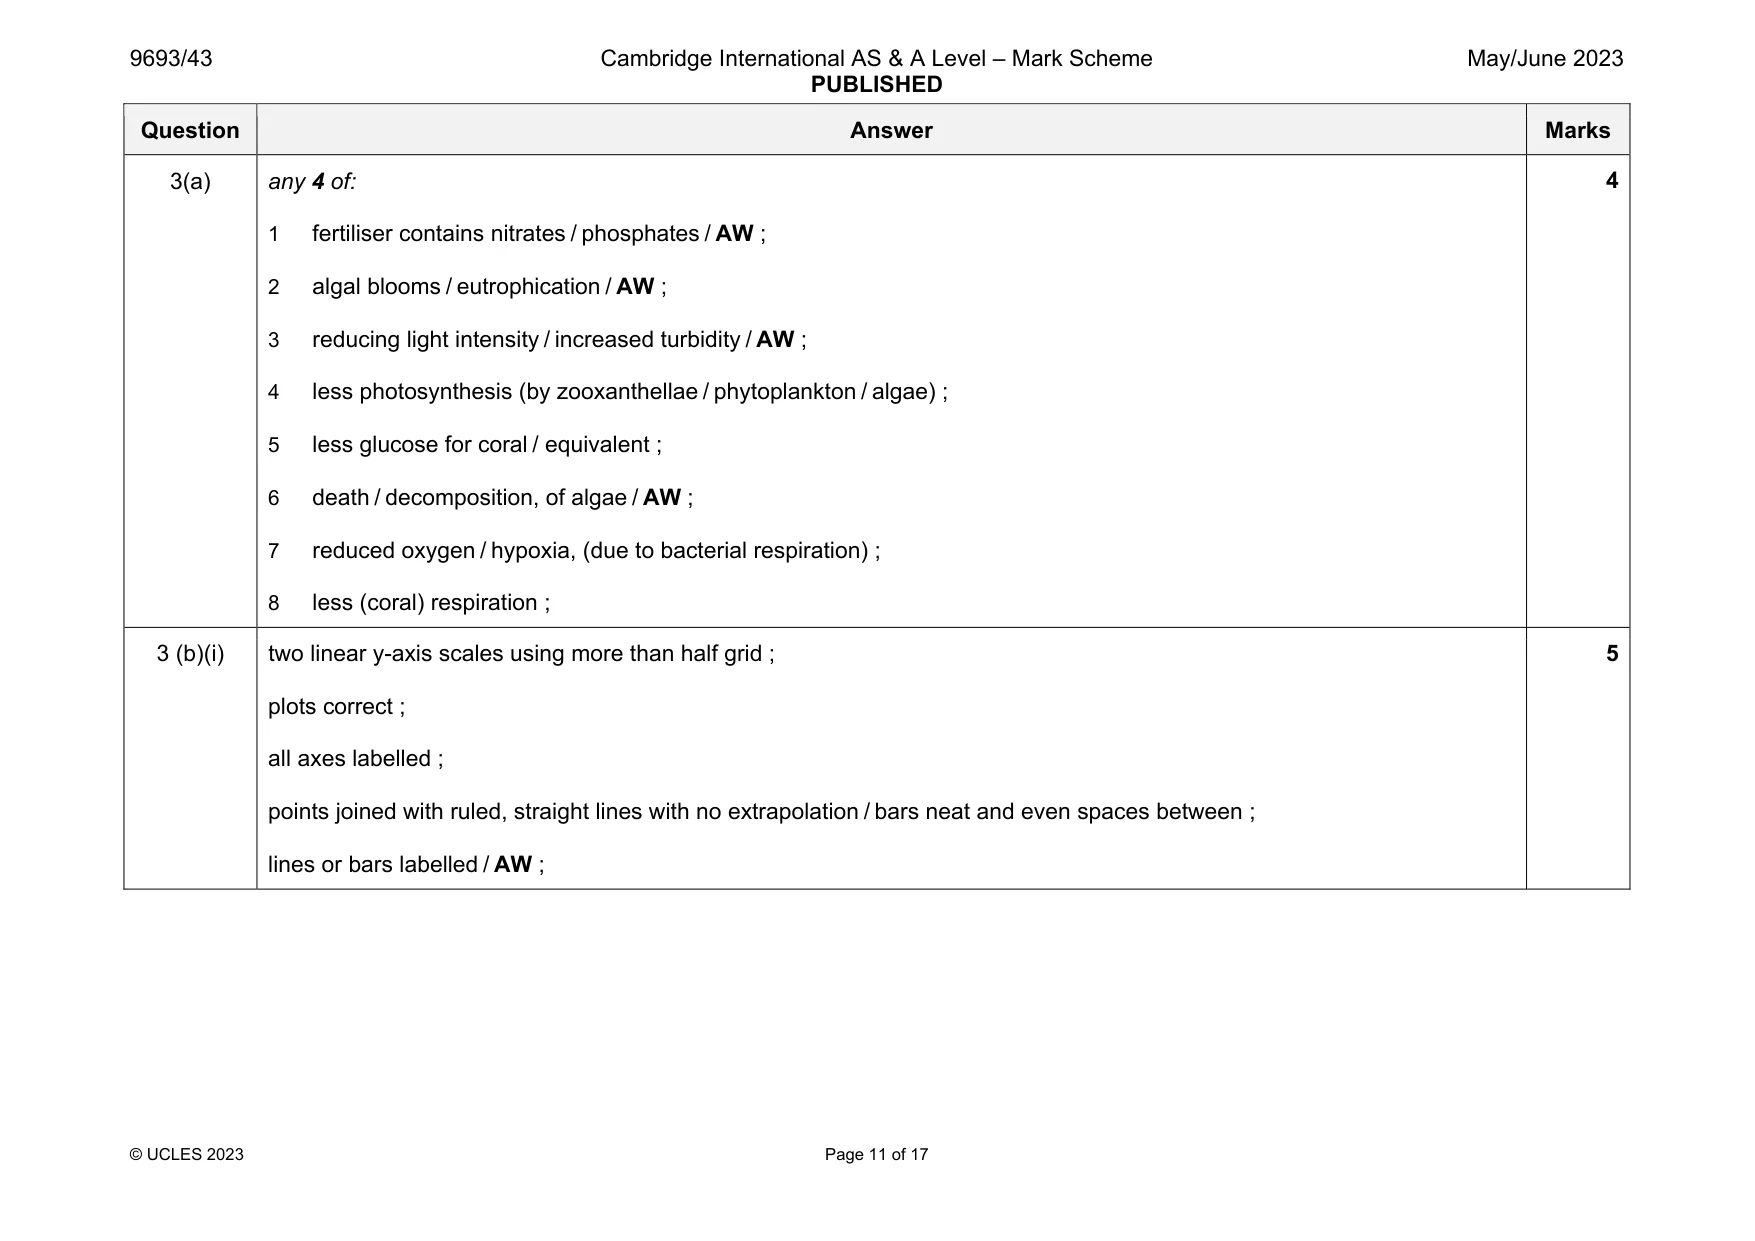
Mark scheme: 3(a) any 4 of: 1 fertiliser contains nitrates / phosphates / AW ; 2 algal blooms / eutrophication / AW ; 3 reducing light intensity / increased turbidity / AW ; 4 less photosynthesis (by zooxanthellae / phytoplankton / algae) ; 5 less glucose for coral / equivalent ; 6 death / decomposition, of algae / AW ; 7 reduced oxygen / hypoxia, (due to bacterial respiration) ; 8 less (coral) respiration ; 3 (b)(i) two linear y-axis scales using more than half grid ; plots correct ; all axes labelled ; points joined with ruled, straight lines with no extrapolation / bars neat and even spaces between ; lines or bars labelled / AW ; 5 Question Answer Marks 3(b)(ii) any 3 of: 1. (increased coral growth) increases primary productivity of reef / more energy fixed / more carbon fixed ; 2. increased, number of species / species richness ; 3. more food for (consumer) organisms ; 4. more niches available / habitats / shelter / AW ; 5. more food chains / AW ; 6. more nursery sites / AW ; 7. (and) increased balanced number of species / AW ; 3 3(b)(iii) any 2 of: idea of correlation does not mean causation / AW ; has not been compared with an area of reef not in MPA / there is no control area / area may still have pollution (from other sources) ; regrowth (of coral) could be due to other factors / AW ; 2
Q4 · Killifish are a euryhaline species of fish
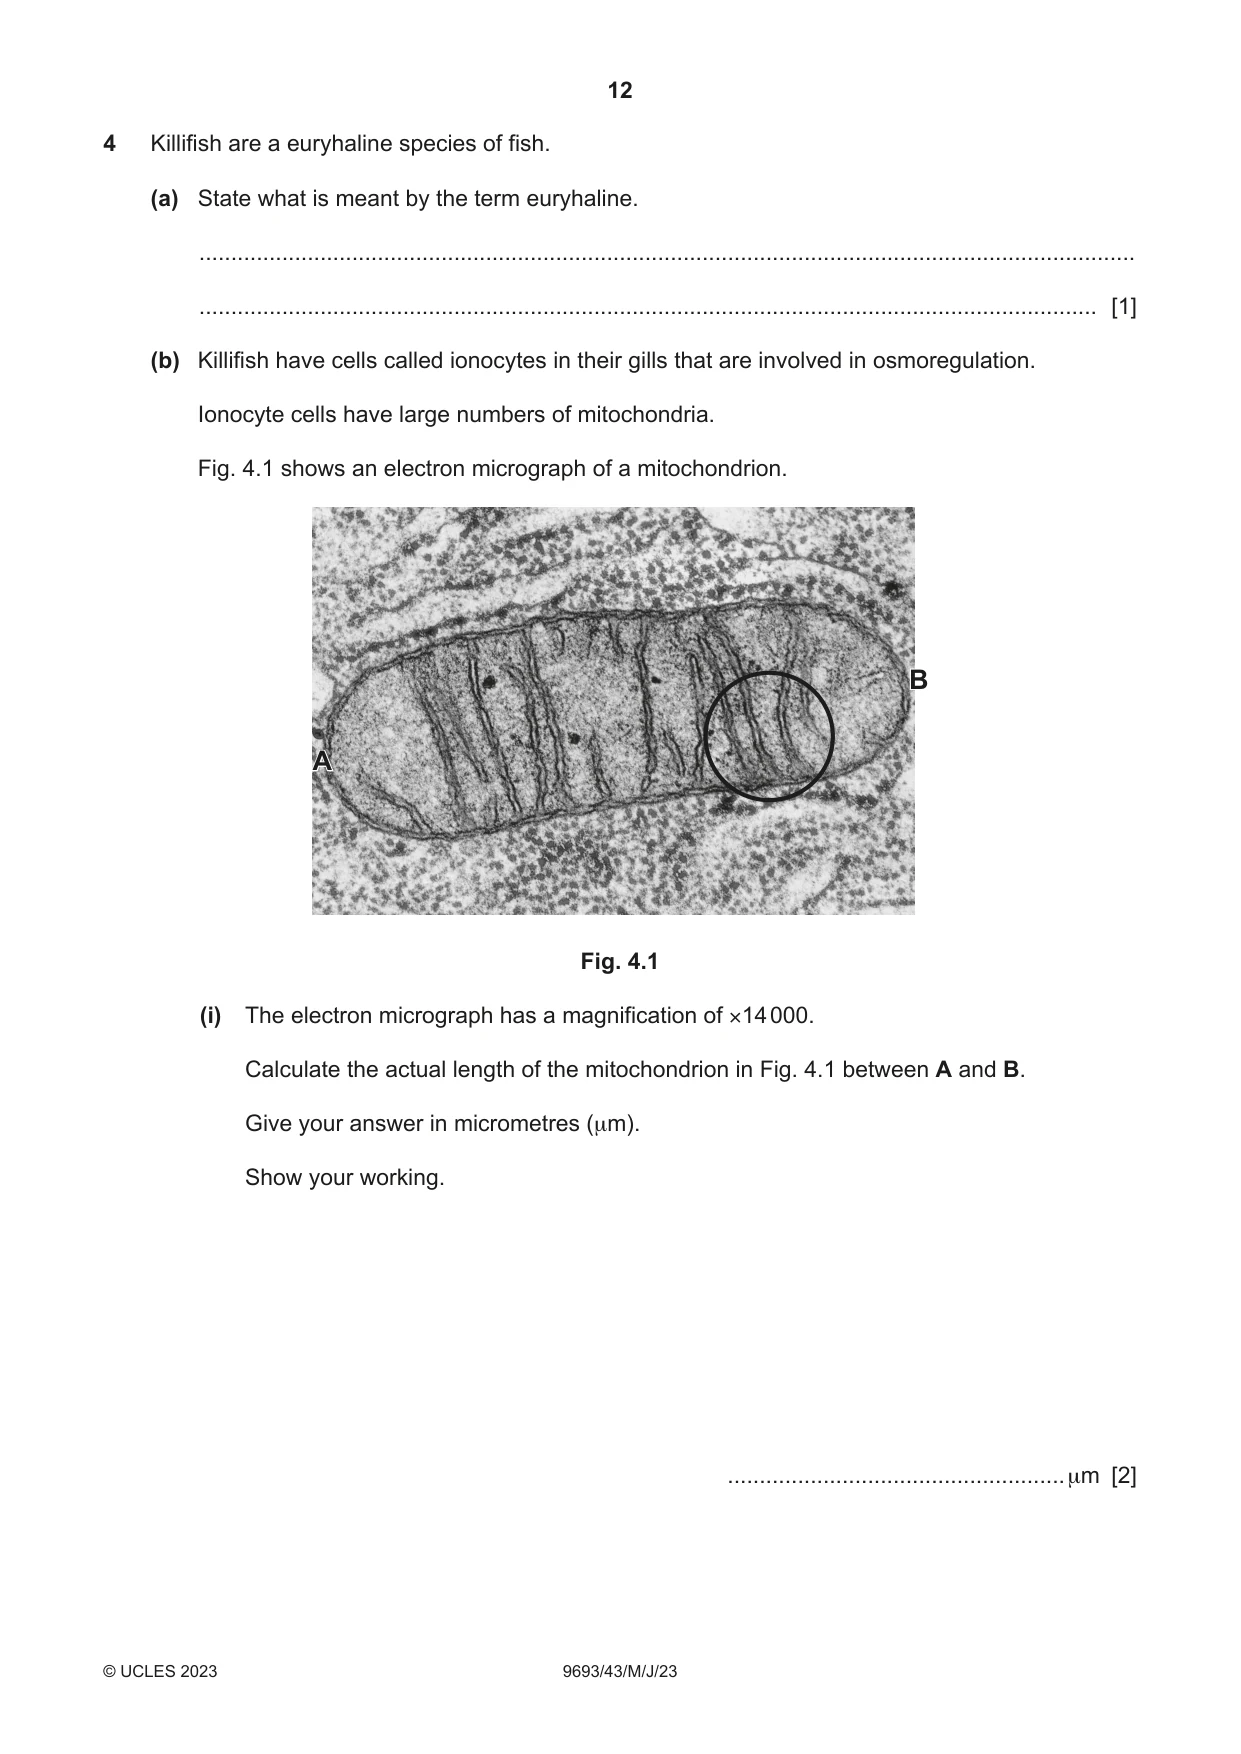
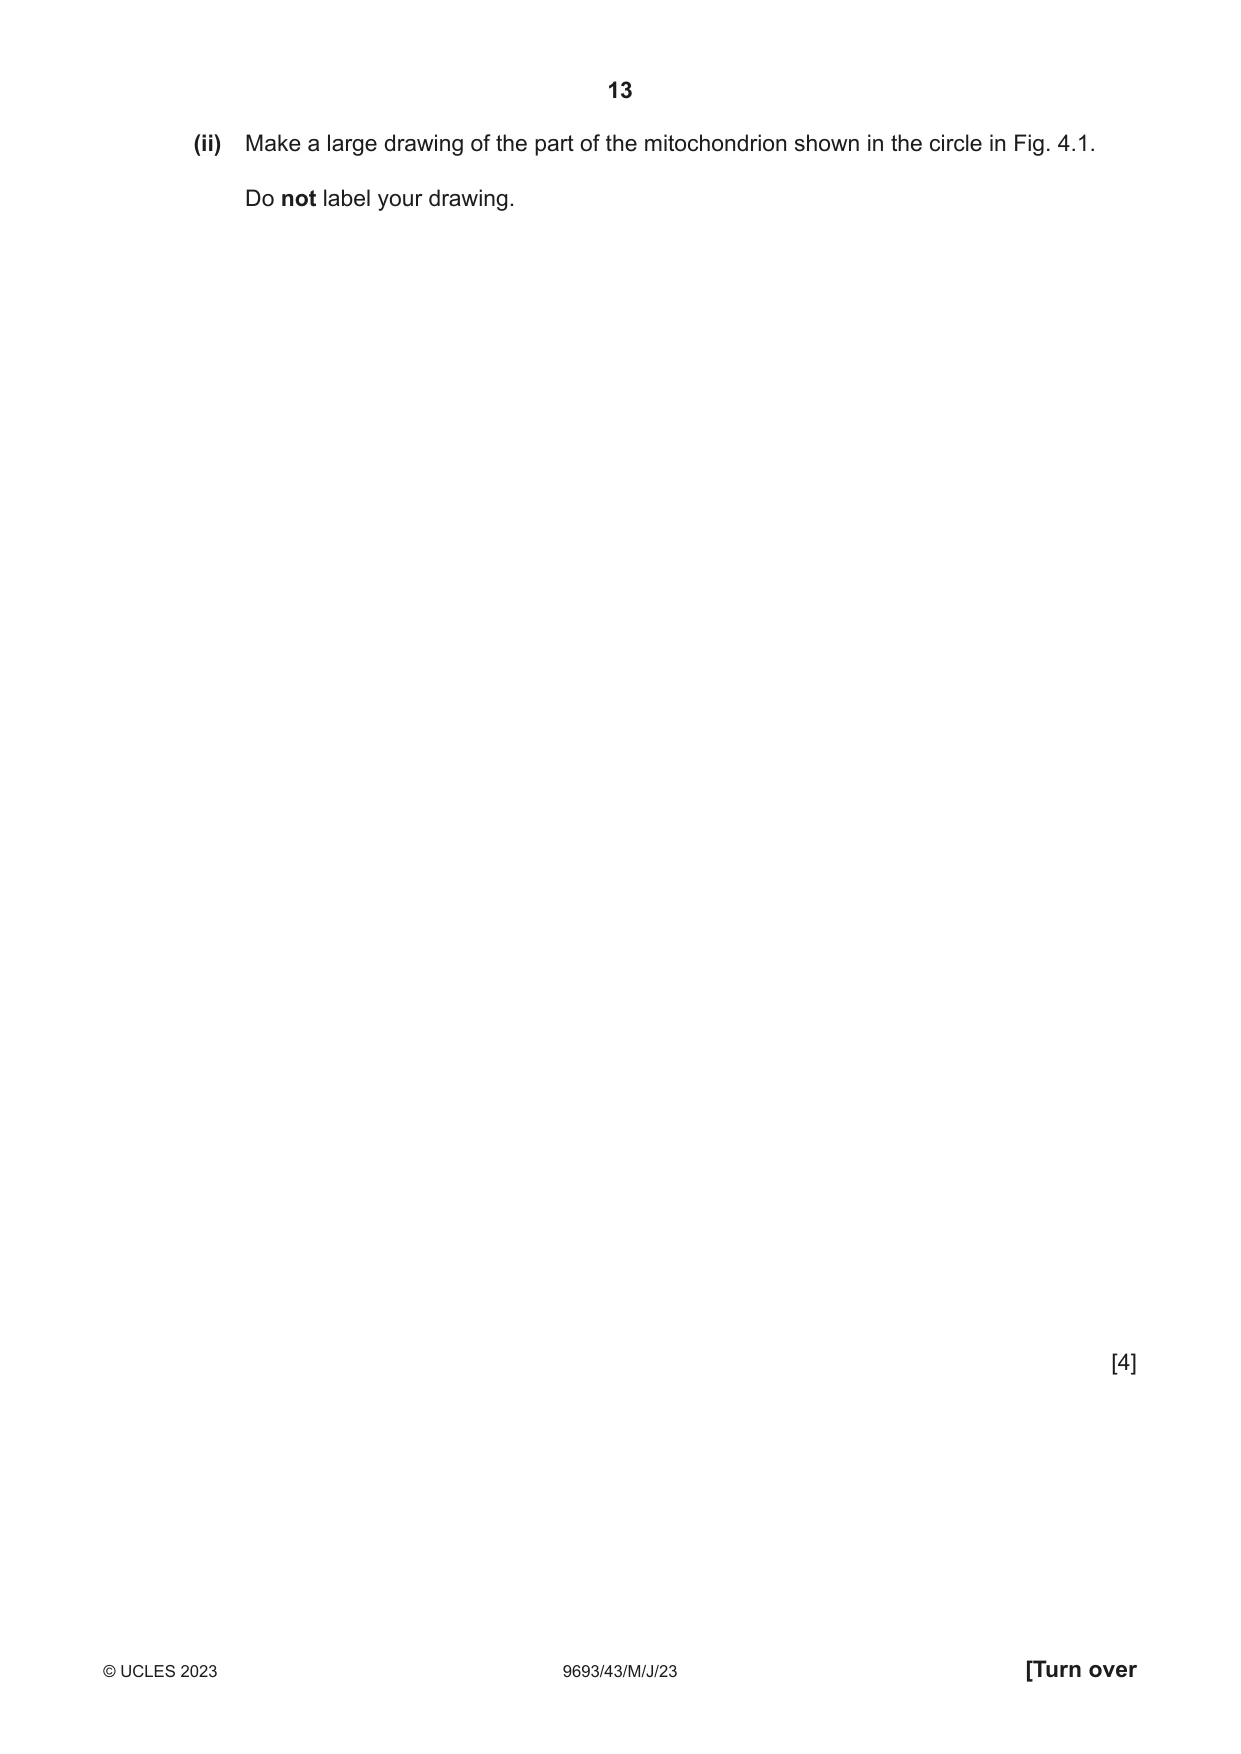
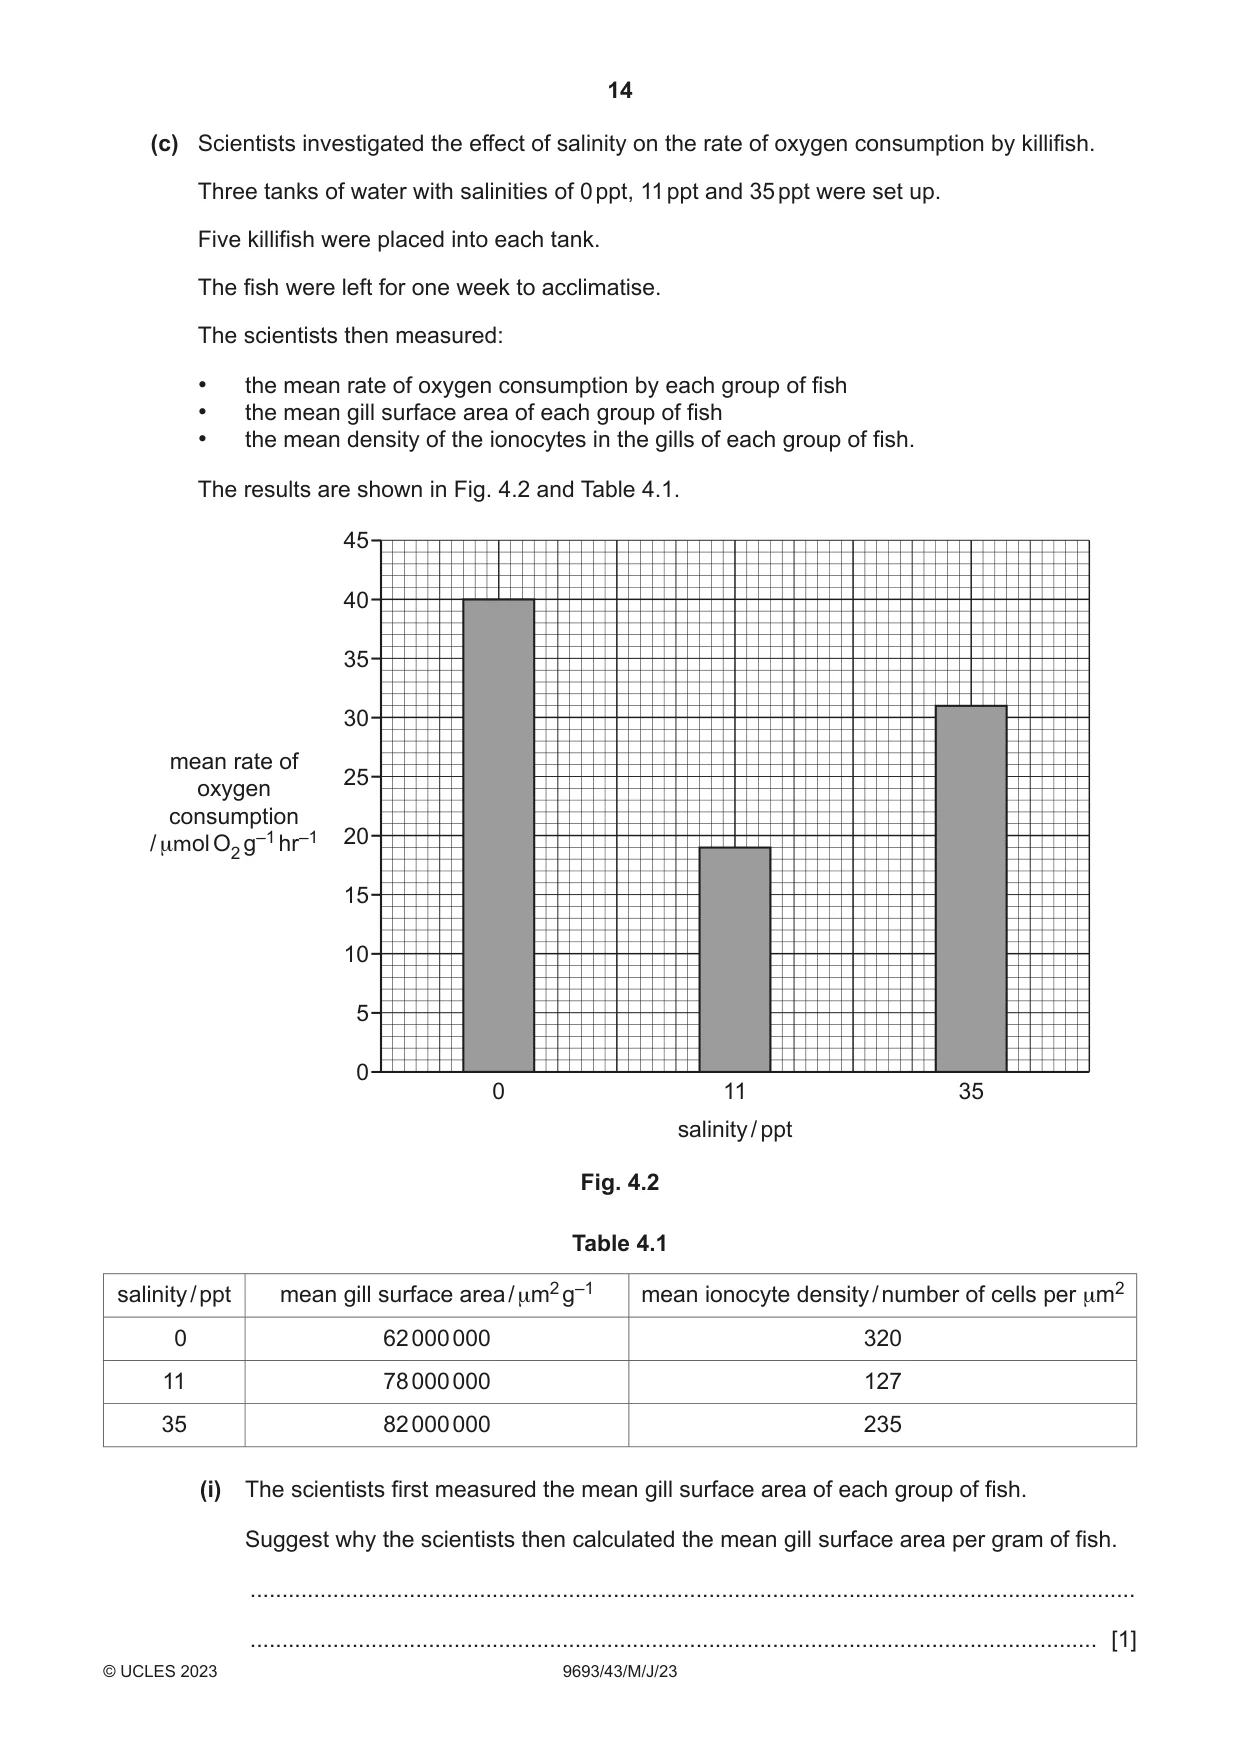
4 Killifish are a euryhaline species of fish. (a) State what is meant by the term euryhaline. ................................................................................................................................................... ............................................................................................................................................. [1] (b) Killifish have cells called ionocytes in their gills that are involved in osmoregulation. Ionocyte cells have large numbers of mitochondria. Fig. 4.1 shows an electron micrograph of a mitochondrion. B A Fig. 4.1 (i) The electron micrograph has a magnification of ×14 000. Calculate the actual length of the mitochondrion in Fig. 4.1 between A and B. Give your answer in micrometres (μm). Show your working. ..................................................... μm [2] (ii) Make a large drawing of the part of the mitochondrion shown in the circle in Fig. 4.1. Do not label your drawing. [4] (c) Scientists investigated the effect of salinity on the rate of oxygen consumption by killifish. Three tanks of water with salinities of 0 ppt, 11 ppt and 35 ppt were set up. Five killifish were placed into each tank. The fish were left for one week to acclimatise. The scientists then measured: • the mean rate of oxygen consumption by each group of fish • the mean gill surface area of each group of fish • the mean density of the ionocytes in the gills of each group of fish. The results are shown in Fig. 4.2 and Table 4.1. 45 40 35 30 mean rate of 25 oxygen consumption 20 / μmol O2 g–1 hr–1 15 10 5 0 0 11 35 salinity / ppt Fig. 4.2 Table 4.1 salinity / ppt mean gill surface area / μm2 g–1 mean ionocyte density / number of cells per μm2 0 62 000 000 320 11 78 000 000 127 35 82 000 000 235 (i) The scientists first measured the mean gill surface area of each group of fish. Suggest why the scientists then calculated the mean gill surface area per gram of fish. ........................................................................................................................................... ..................................................................................................................................... [1] (ii) Describe the effect of increasing salinity on the rate of oxygen consumption by the killifish. ........................................................................................................................................... ........................................................................................................................................... ........................................................................................................................................... ..................................................................................................................................... [2] (iii) Discuss the effects of increasing salinity on the gill surface area and density of ionocyte cells. Use information in Fig. 4.2 and Table 4.1 in your answer. ........................................................................................................................................... ........................................................................................................................................... ........................................................................................................................................... ........................................................................................................................................... ........................................................................................................................................... ........................................................................................................................................... ........................................................................................................................................... ..................................................................................................................................... [4] [Total: 14]
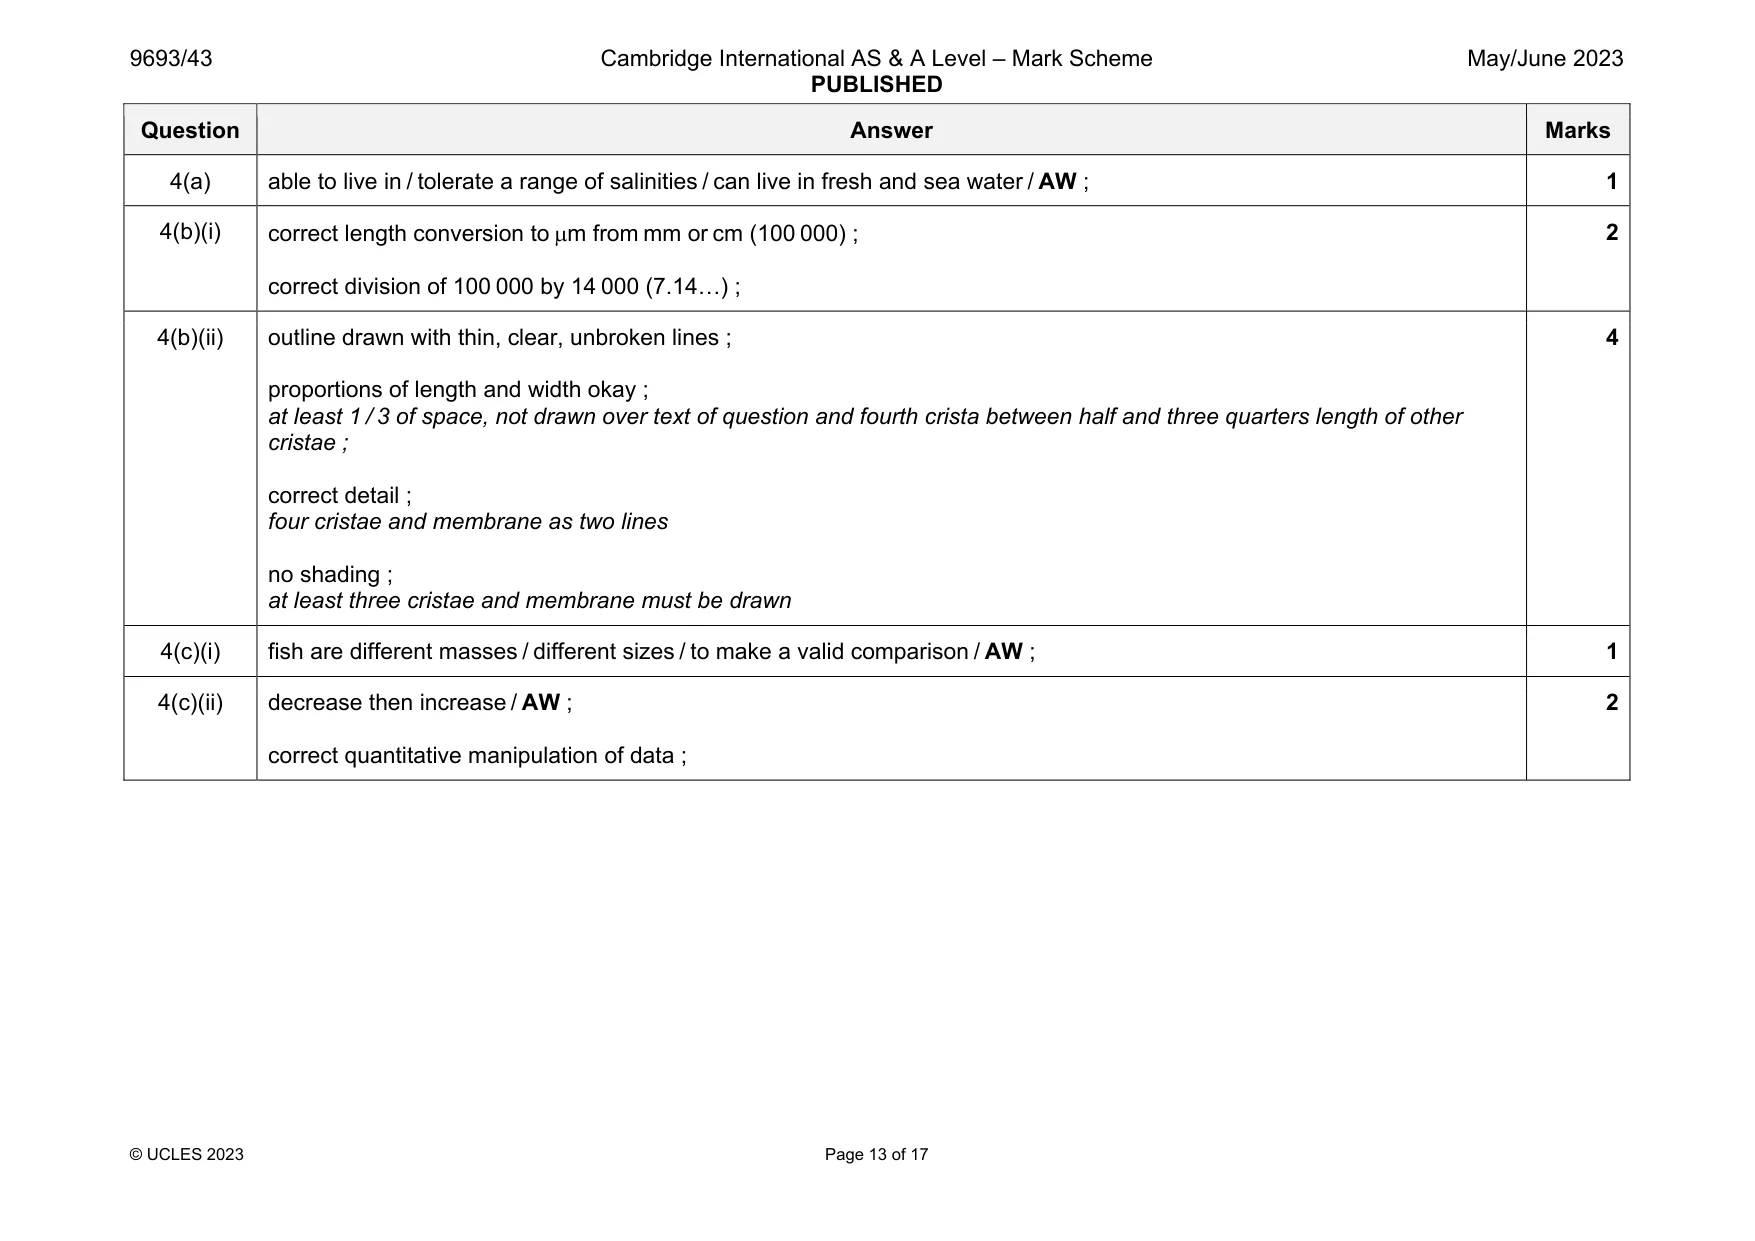
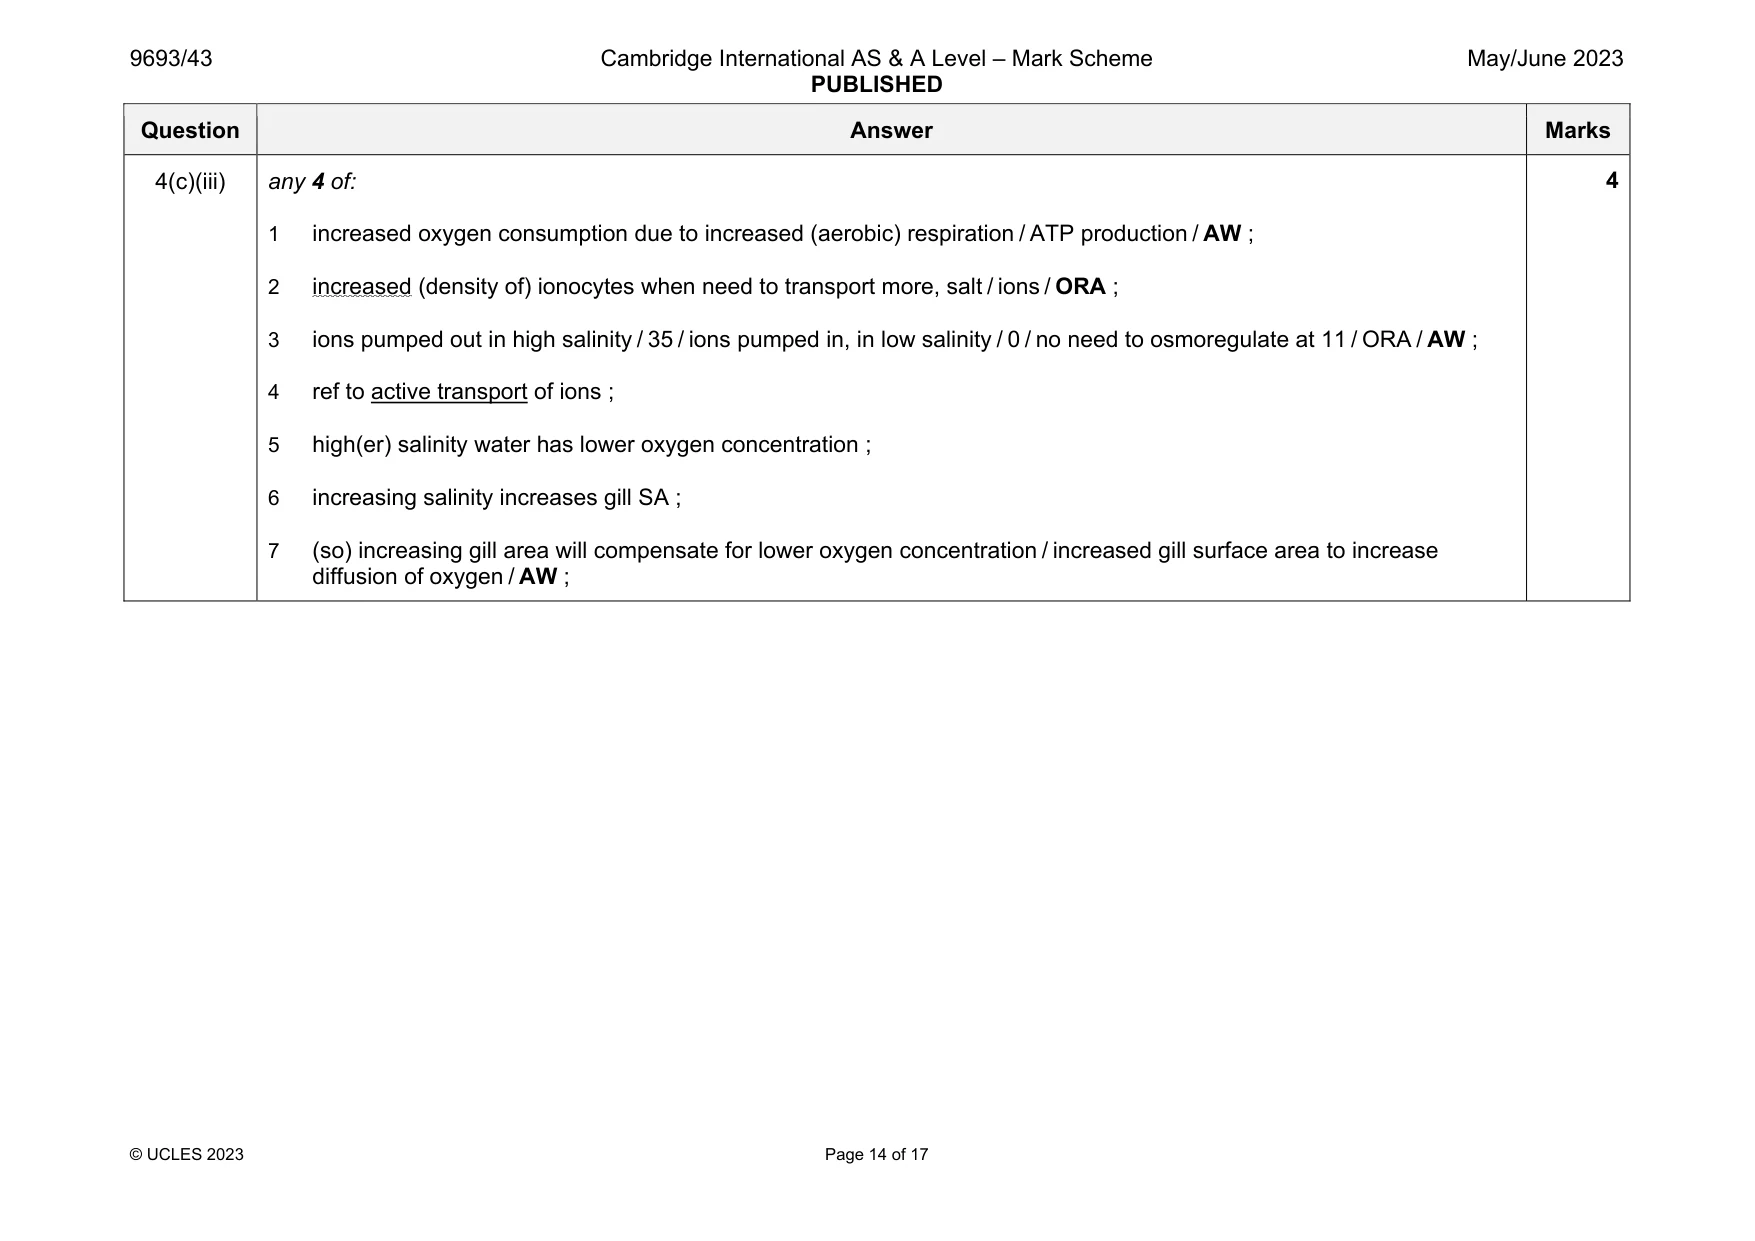
Mark scheme: 4(a) able to live in / tolerate a range of salinities / can live in fresh and sea water / AW ; 1 4(b)(i) correct length conversion to m from mm or cm (100 000) ; correct division of 100 000 by 14 000 (7.14…) ; 2 4(b)(ii) outline drawn with thin, clear, unbroken lines ; proportions of length and width okay ; at least 1 / 3 of space, not drawn over text of question and fourth crista between half and three quarters length of other cristae ; correct detail ; four cristae and membrane as two lines no shading ; at least three cristae and membrane must be drawn 4 4(c)(i) fish are different masses / different sizes / to make a valid comparison / AW ; 1 4(c)(ii) decrease then increase / AW ; correct quantitative manipulation of data ; 2 Question Answer Marks 4(c)(iii) any 4 of: 1 increased oxygen consumption due to increased (aerobic) respiration / ATP production / AW ; 2 increased (density of) ionocytes when need to transport more, salt / ions / ORA ; 3 ions pumped out in high salinity / 35 / ions pumped in, in low salinity / 0 / no need to osmoregulate at 11 / ORA / AW ; 4 ref to active transport of ions ; 5 high(er) salinity water has lower oxygen concentration ; 6 increasing salinity increases gill SA ; 7 (so) increasing gill area will compensate for lower oxygen concentration / increased gill surface area to increase diffusion of oxygen / AW ; 4
Q5 · Copepods are marine zooplankton
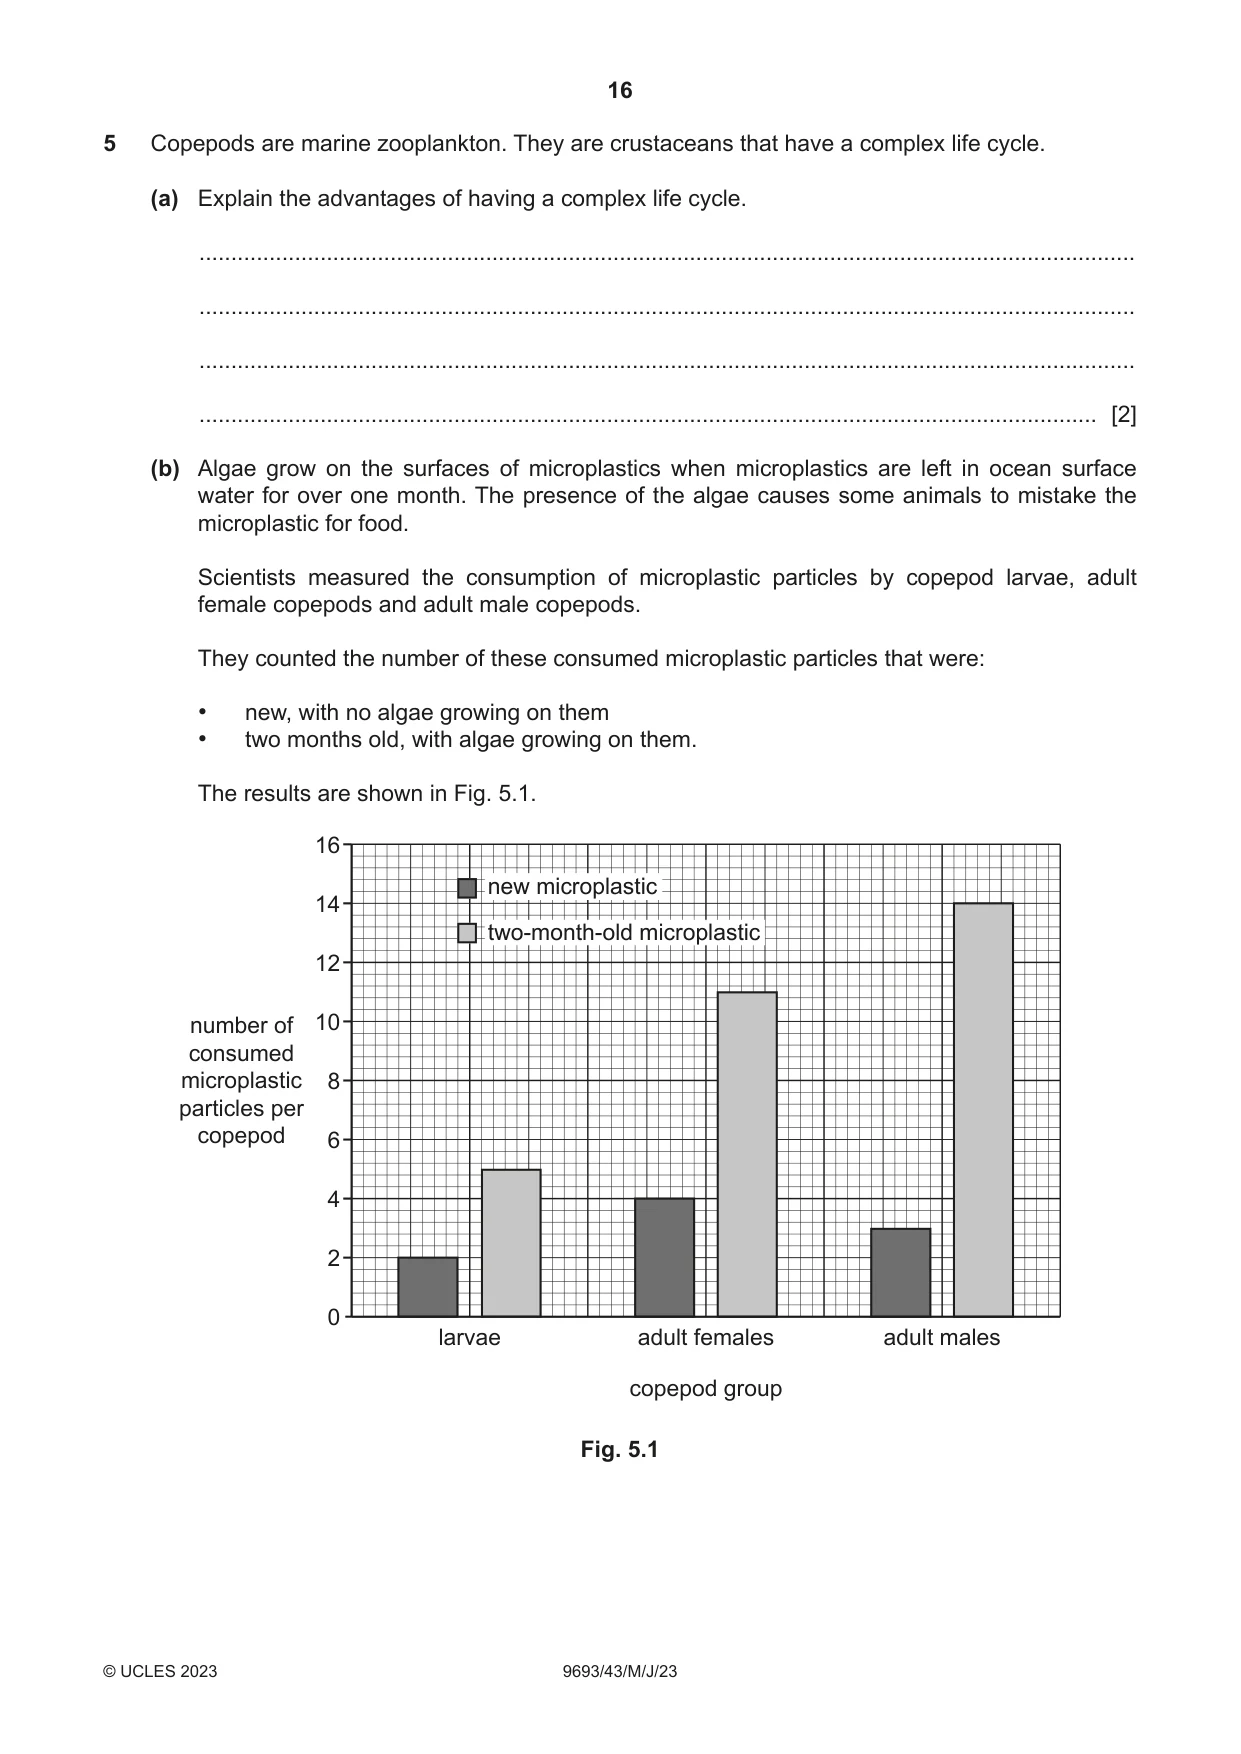
5 Copepods are marine zooplankton. They are crustaceans that have a complex life cycle. (a) Explain the advantages of having a complex life cycle. ................................................................................................................................................... ................................................................................................................................................... ................................................................................................................................................... ............................................................................................................................................. [2] (b) Algae grow on the surfaces of microplastics when microplastics are left in ocean surface water for over one month. The presence of the algae causes some animals to mistake the microplastic for food. Scientists measured the consumption of microplastic particles by copepod larvae, adult female copepods and adult male copepods. They counted the number of these consumed microplastic particles that were: • new, with no algae growing on them • two months old, with algae growing on them. The results are shown in Fig. 5.1. 16 newnew microplasticmicroplastic 14 two-month-oldtwo-month-old microplasticmicroplastic 12 number of 10 consumed microplastic 8 particles per copepod 6 4 2 0 larvae adult females adult males copepod group Fig. 5.1 (i) Describe the effect of age of the microplastics on their consumption by the different groups of copepod. ........................................................................................................................................... ........................................................................................................................................... ........................................................................................................................................... ........................................................................................................................................... ........................................................................................................................................... ..................................................................................................................................... [3] (ii) Salmon are grown for human consumption, using aquaculture in sea cages. Waste food from the salmon aquaculture is broken down by microorganisms, causing algal blooms. Copepods are small enough to swim into salmon cages and are eaten by salmon. Use this information and the information in Fig. 5.1 to suggest why the presence of microplastics in the waters around salmon aquaculture systems poses a threat to humans. ........................................................................................................................................... ........................................................................................................................................... ........................................................................................................................................... ........................................................................................................................................... ........................................................................................................................................... ..................................................................................................................................... [3] (iii) Plastic sheets placed into sea water gradually break down to form microplastics. As the plastic sheet breaks down, its area decreases. Temperature and wave action are two of the factors that affect the breakdown of plastic sheets into microplastics. Plan a laboratory‑based investigation that you could do to investigate the effect of water temperature on the rate of breakdown of plastic sheets. You are provided with standard laboratory apparatus and materials. Your plan should: • include a clear statement of the hypothesis • identify the independent, dependent and standardised variables • include full details of the method so that another person can follow it • describe how you would analyse your results • be safe and ethical. ........................................................................................................................................... ........................................................................................................................................... ........................................................................................................................................... ........................................................................................................................................... ........................................................................................................................................... ........................................................................................................................................... ........................................................................................................................................... ........................................................................................................................................... ........................................................................................................................................... ........................................................................................................................................... ........................................................................................................................................... ........................................................................................................................................... ........................................................................................................................................... ........................................................................................................................................... ........................................................................................................................................... ...........................................................................................................................................
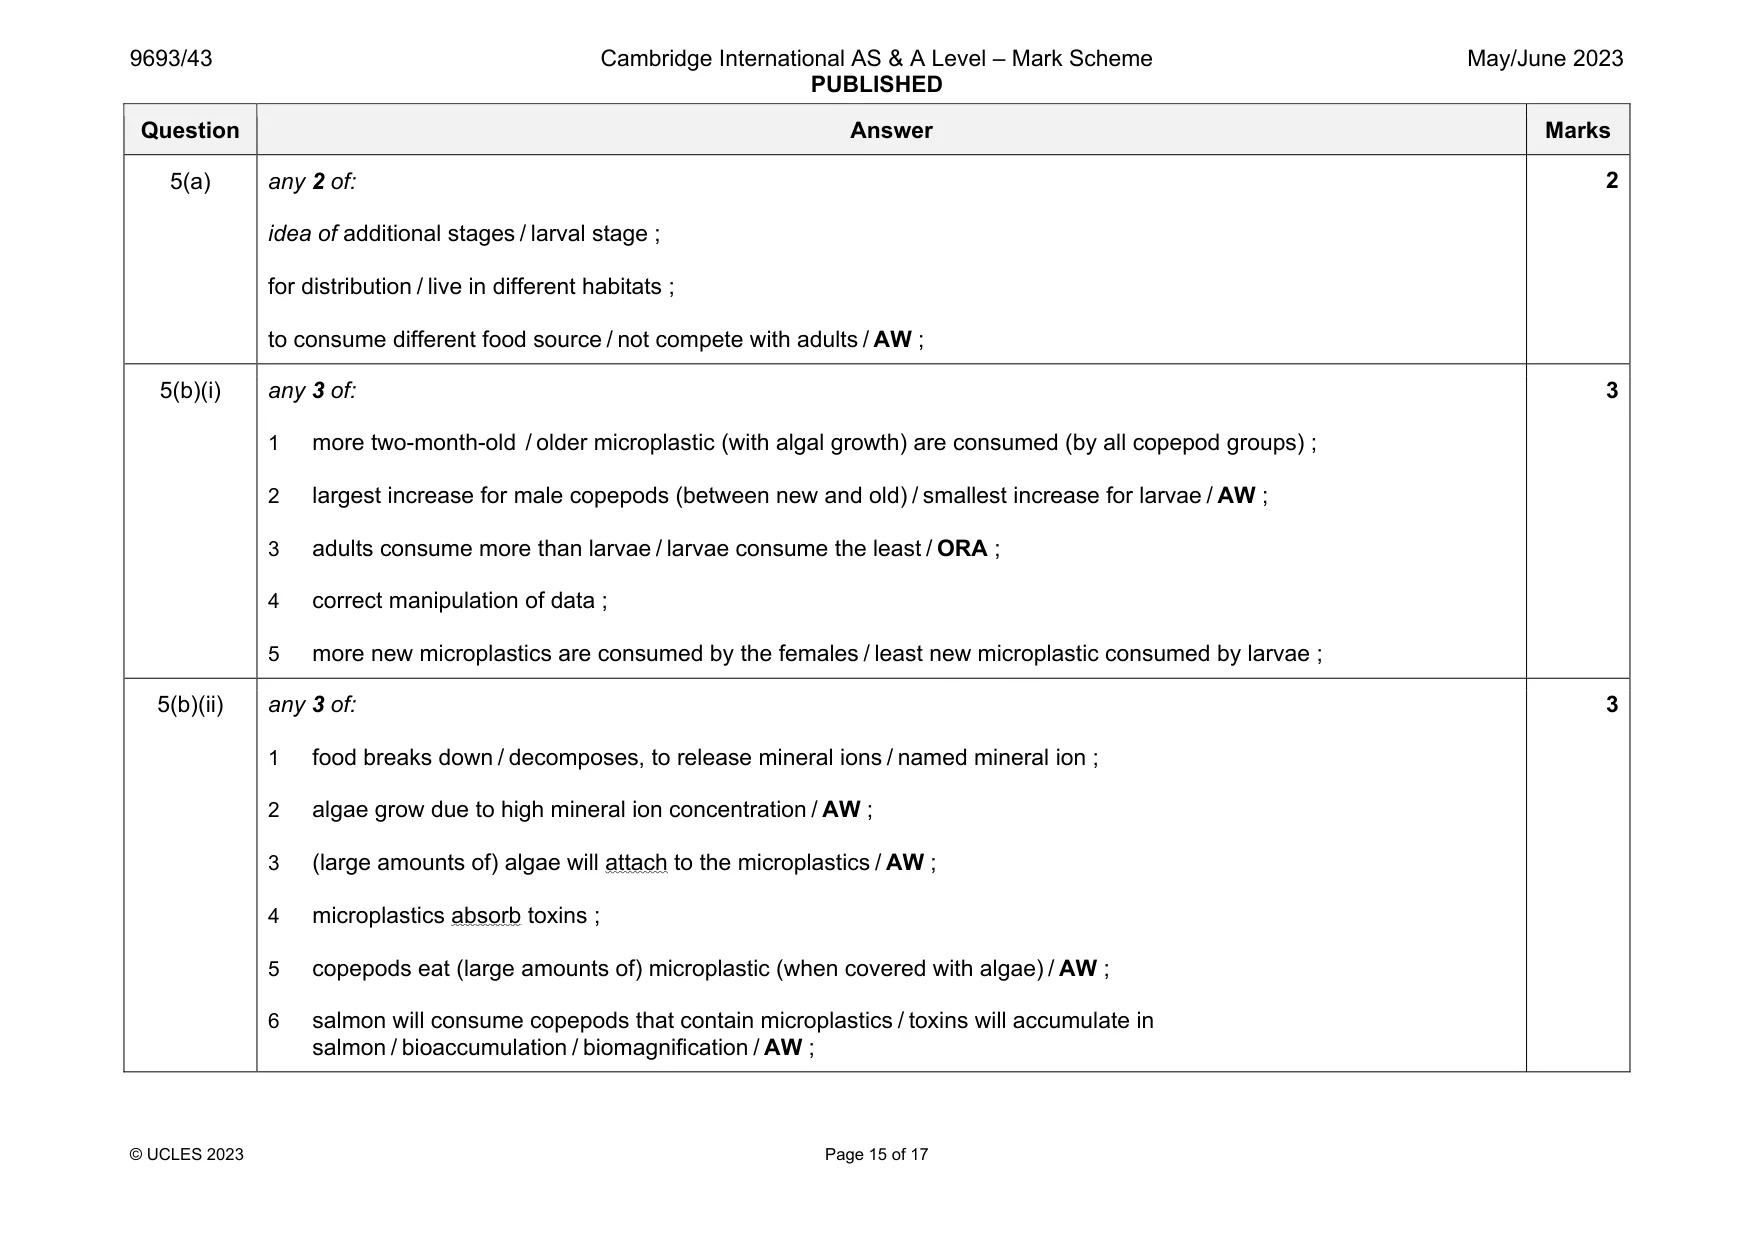
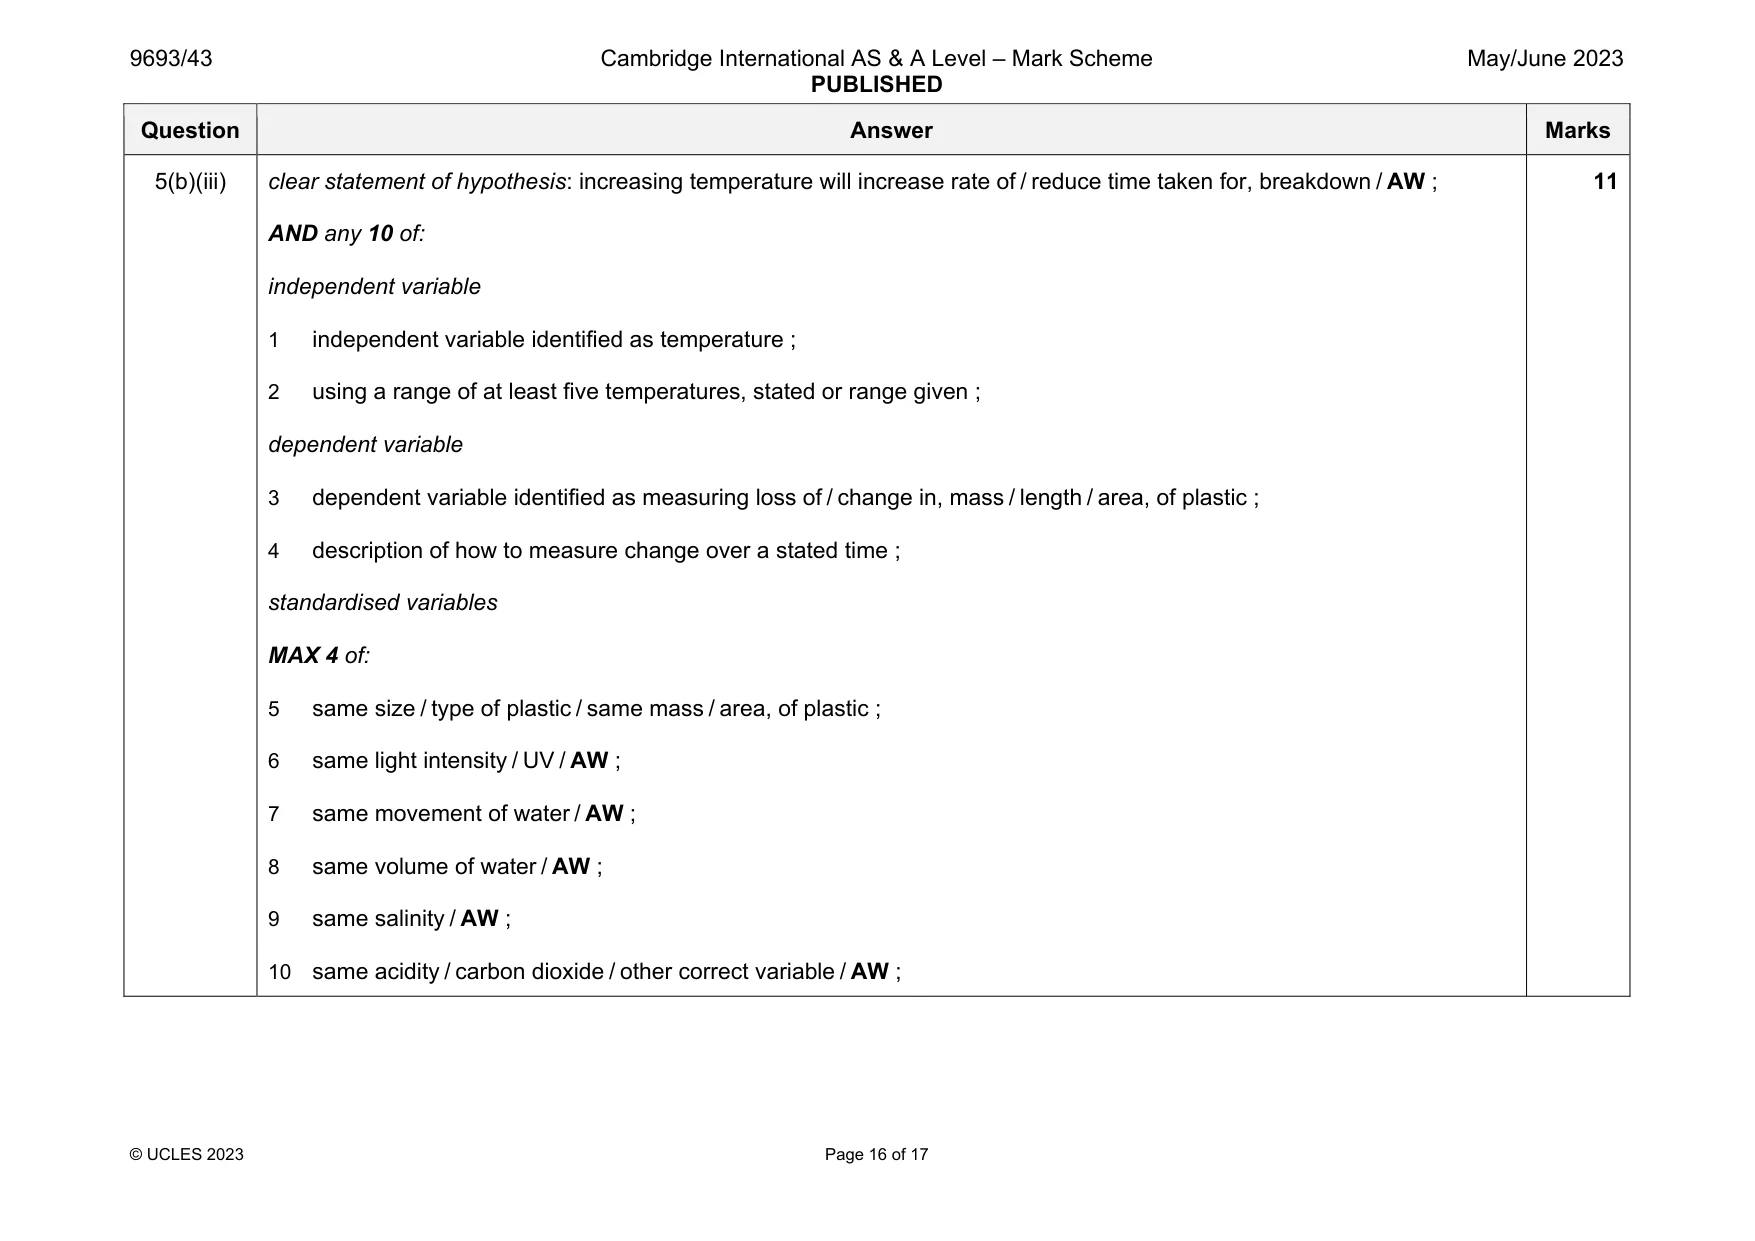
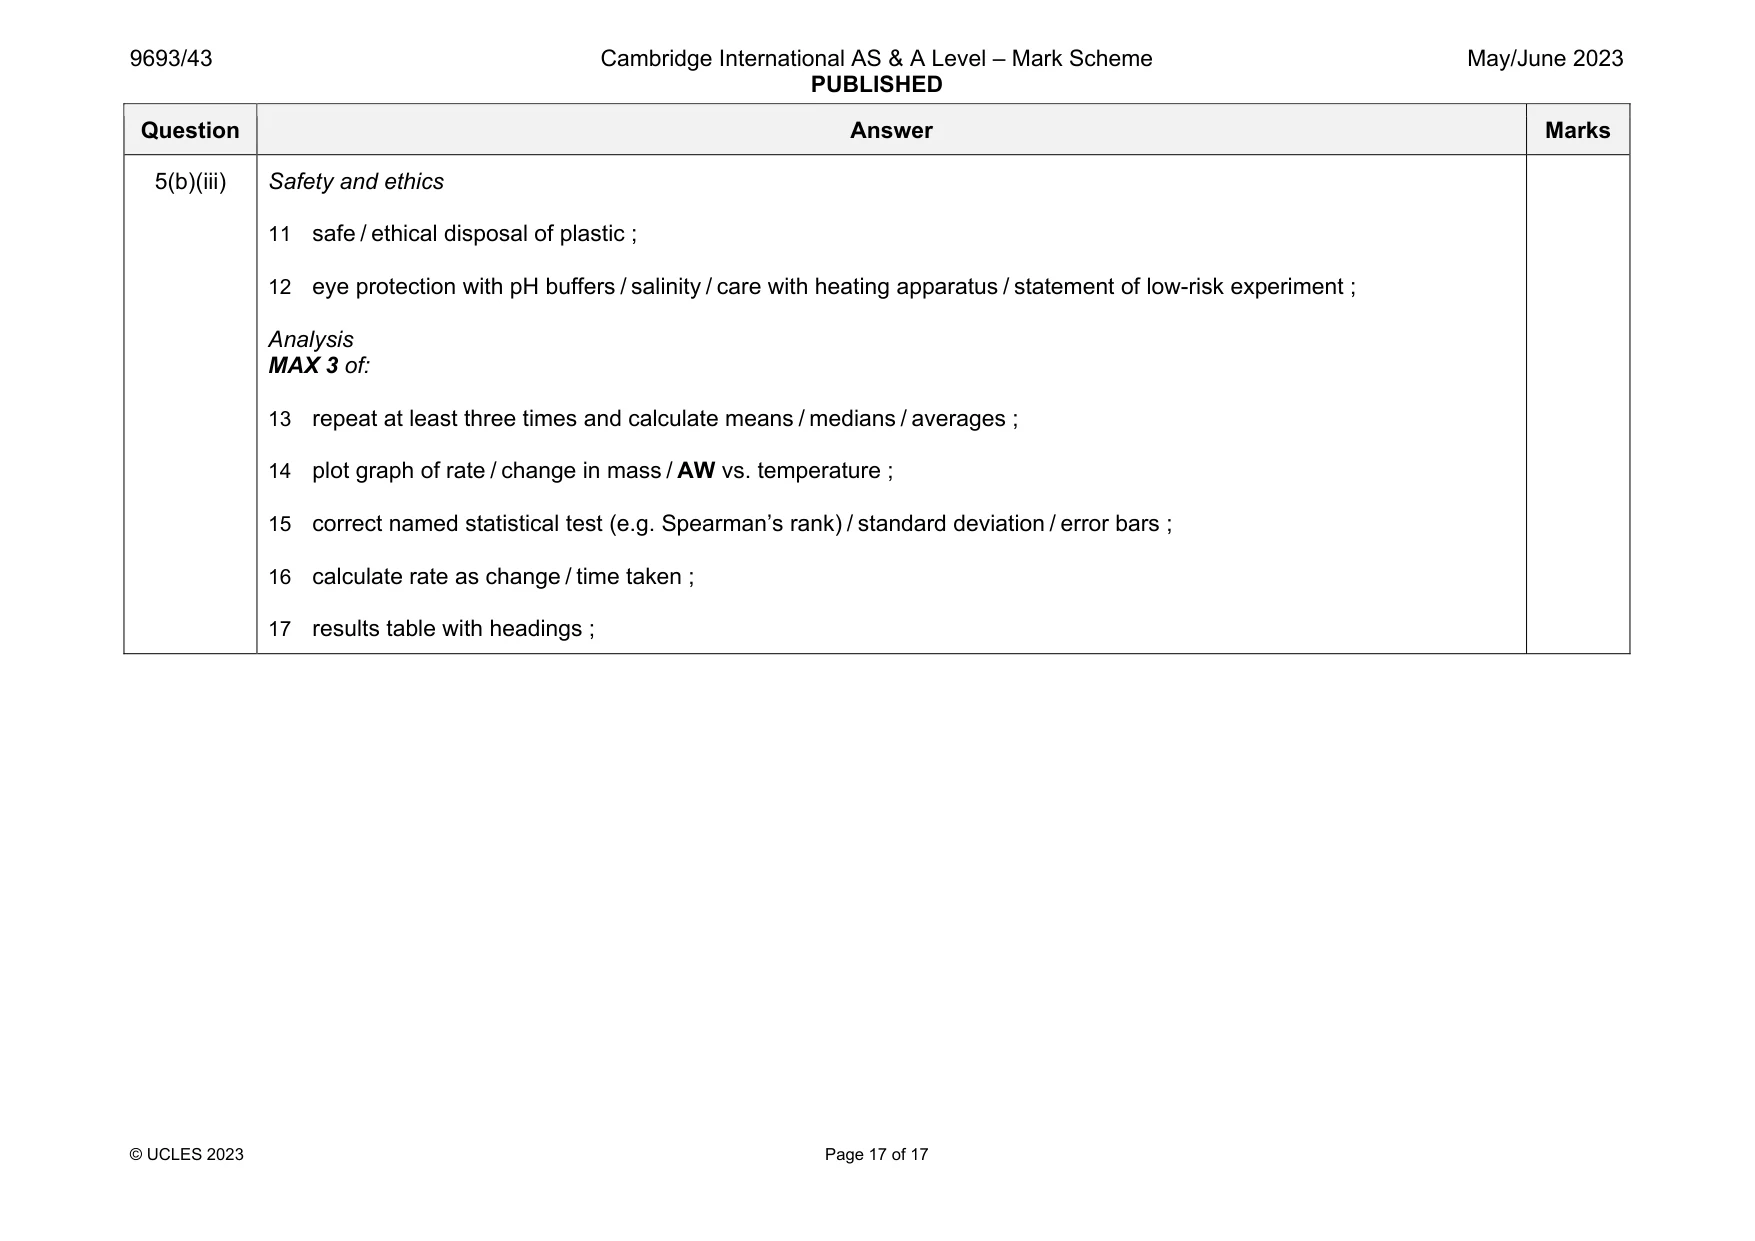
Mark scheme: 5(a) any 2 of: idea of additional stages / larval stage ; for distribution / live in different habitats ; to consume different food source / not compete with adults / AW ; 5(b)(i) any 3 of: 1 more two-month-old / older microplastic (with algal growth) are consumed (by all copepod groups) ; 2 largest increase for male copepods (between new and old) / smallest increase for larvae / AW ; 3 adults consume more than larvae / larvae consume the least / ORA ; 4 correct manipulation of data ; 5 more new microplastics are consumed by the females / least new microplastic consumed by larvae ; 3 5(b)(ii) any 3 of: 1 food breaks down / decomposes, to release mineral ions / named mineral ion ; 2 algae grow due to high mineral ion concentration / AW ; 3 (large amounts of) algae will attach to the microplastics / AW ; 4 microplastics absorb toxins ; 5 copepods eat (large amounts of) microplastic (when covered with algae) / AW ; 6 salmon will consume copepods that contain microplastics / toxins will accumulate in salmon / bioaccumulation / biomagnification / AW ; 3 Question Answer Marks 5(b)(iii) clear statement of hypothesis: increasing temperature will increase rate of / reduce time taken for, breakdown / AW ; AND any 10 of: independent variable 1 independent variable identified as temperature ; 2 using a range of at least five temperatures, stated or range given ; dependent variable 3 dependent variable identified as measuring loss of / change in, mass / length / area, of plastic ; 4 description of how to measure change over a stated time ; standardised variables MAX 4 of: 5 same size / type of plastic / same mass / area, of plastic ; 6 same light intensity / UV / AW ; 7 same movement of water / AW ; 8 same volume of water / AW ; 9 same salinity / AW ; 10 same acidity / carbon dioxide / other correct variable / AW ; 11 Question Answer Marks 5(b)(iii) Safety and ethics 11 safe / ethical disposal of plastic ; 12 eye protection with pH buffers / salinity / care with heating apparatus / statement of low-risk experiment ; Analysis MAX 3 of: 13 repeat at least three times and calculate means / medians / averages ; 14 plot graph of rate / change in mass / AW vs. temperature ; 15 correct named statistical test (e.g. Spearman’s rank) / standard deviation / error bars ; 16 calculate rate as change / time taken ; 17 results table with headings ;
What was in this paper
The subtopics covered by these 5 questions, and how many questions each got. Open one in a new tab to see every Cambridge question on it.
What you needed in this session
Cambridge’s own grade thresholds for 2023 May/June, Paper 4 · Variant 3. A higher threshold means an easier paper — the bar moves with how the cohort did.