Cambridge A Level Marine Science 9693 — 2020 May/June Paper 3 · Variant 0
9693/30/M/J/20 · 7 questions · 75 marks · ≈84 min
The question paper and its mark scheme, free to read here and free to download. This is Cambridge’s own paper, exactly as it was sat.
Question paper20 pages



Mark scheme
No mark scheme is in the library for this paper.
Questions as text
Q1 · The table shows some definitions of terms related to the commercial breeding of fish
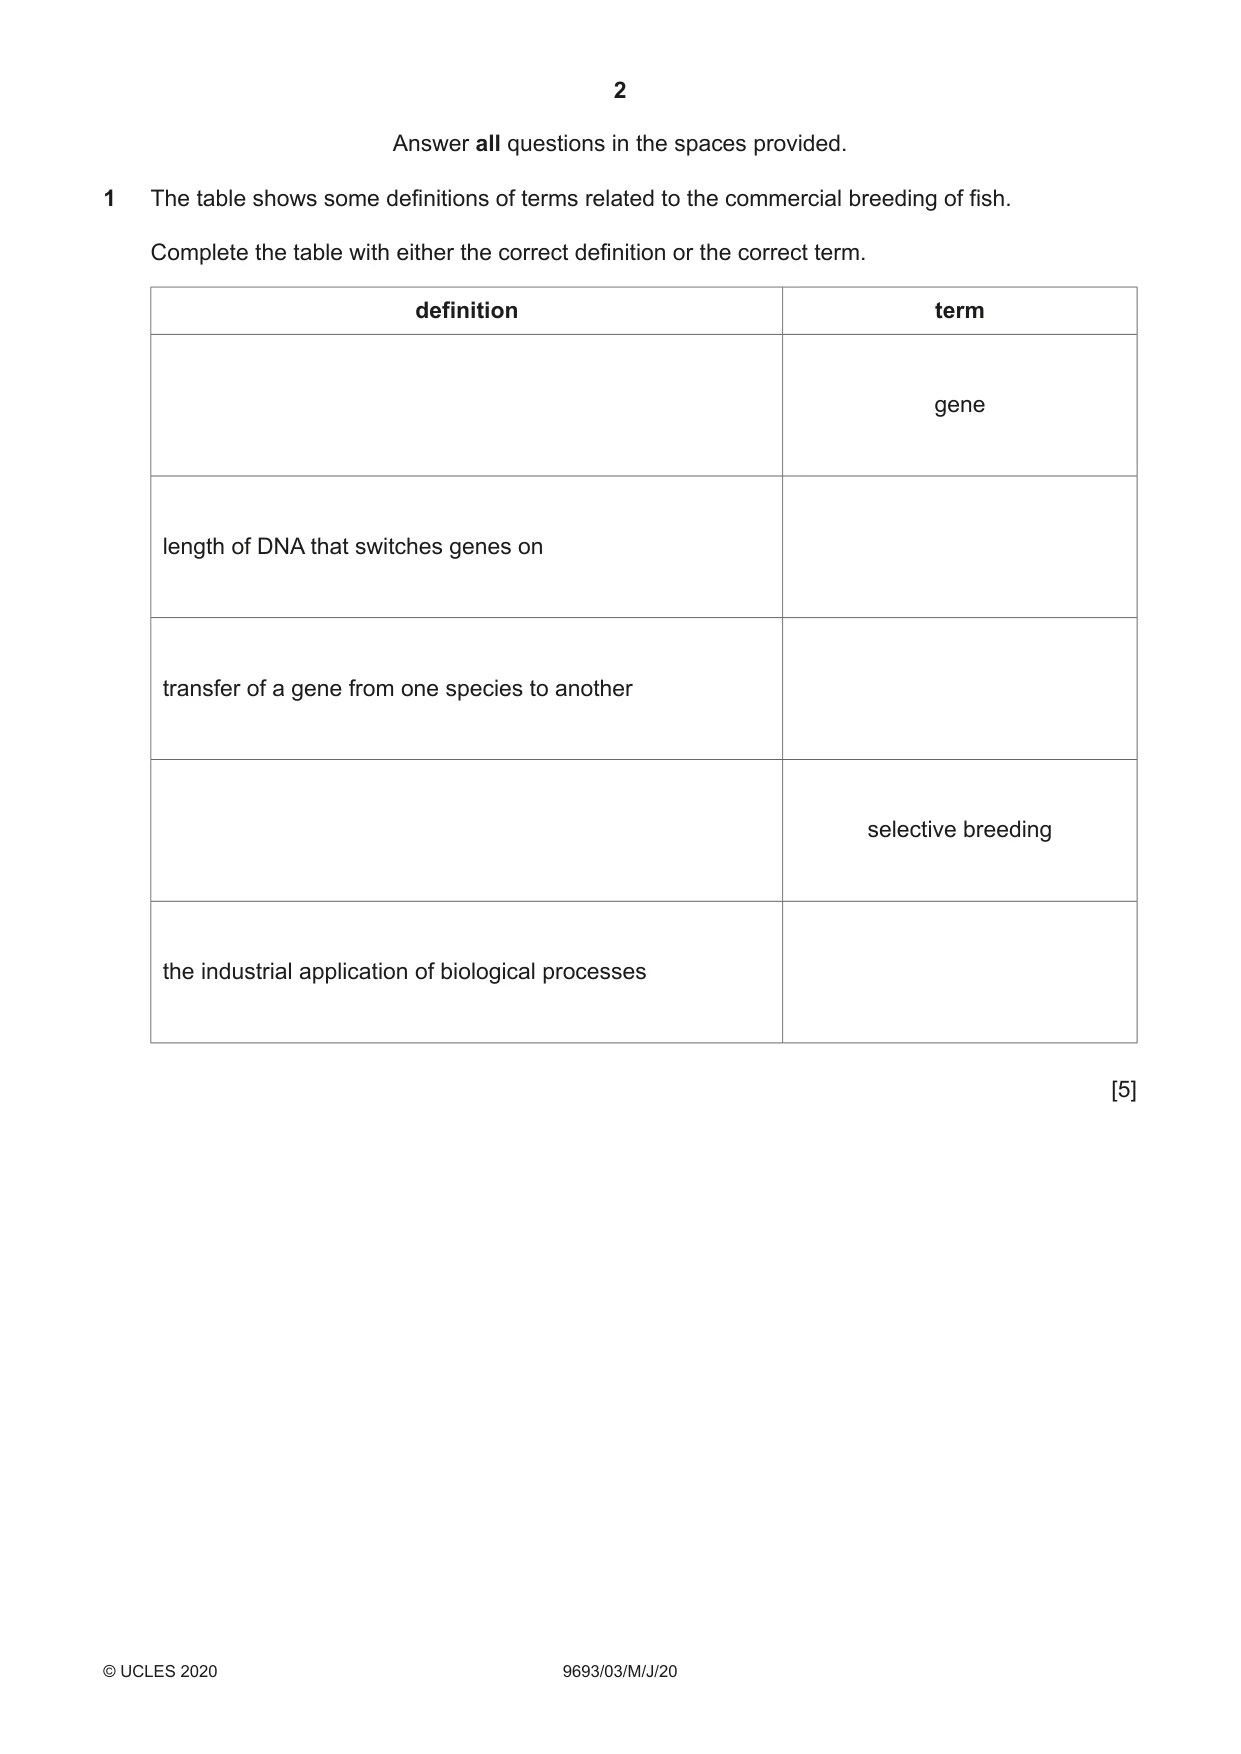
1 The table shows some definitions of terms related to the commercial breeding of fish. Complete the table with either the correct definition or the correct term. definition term gene length of DNA that switches genes on transfer of a gene from one species to another selective breeding the industrial application of biological processes [5]
Q2 · Phytoplankton productivity is reduced in some nutrient-rich oceans
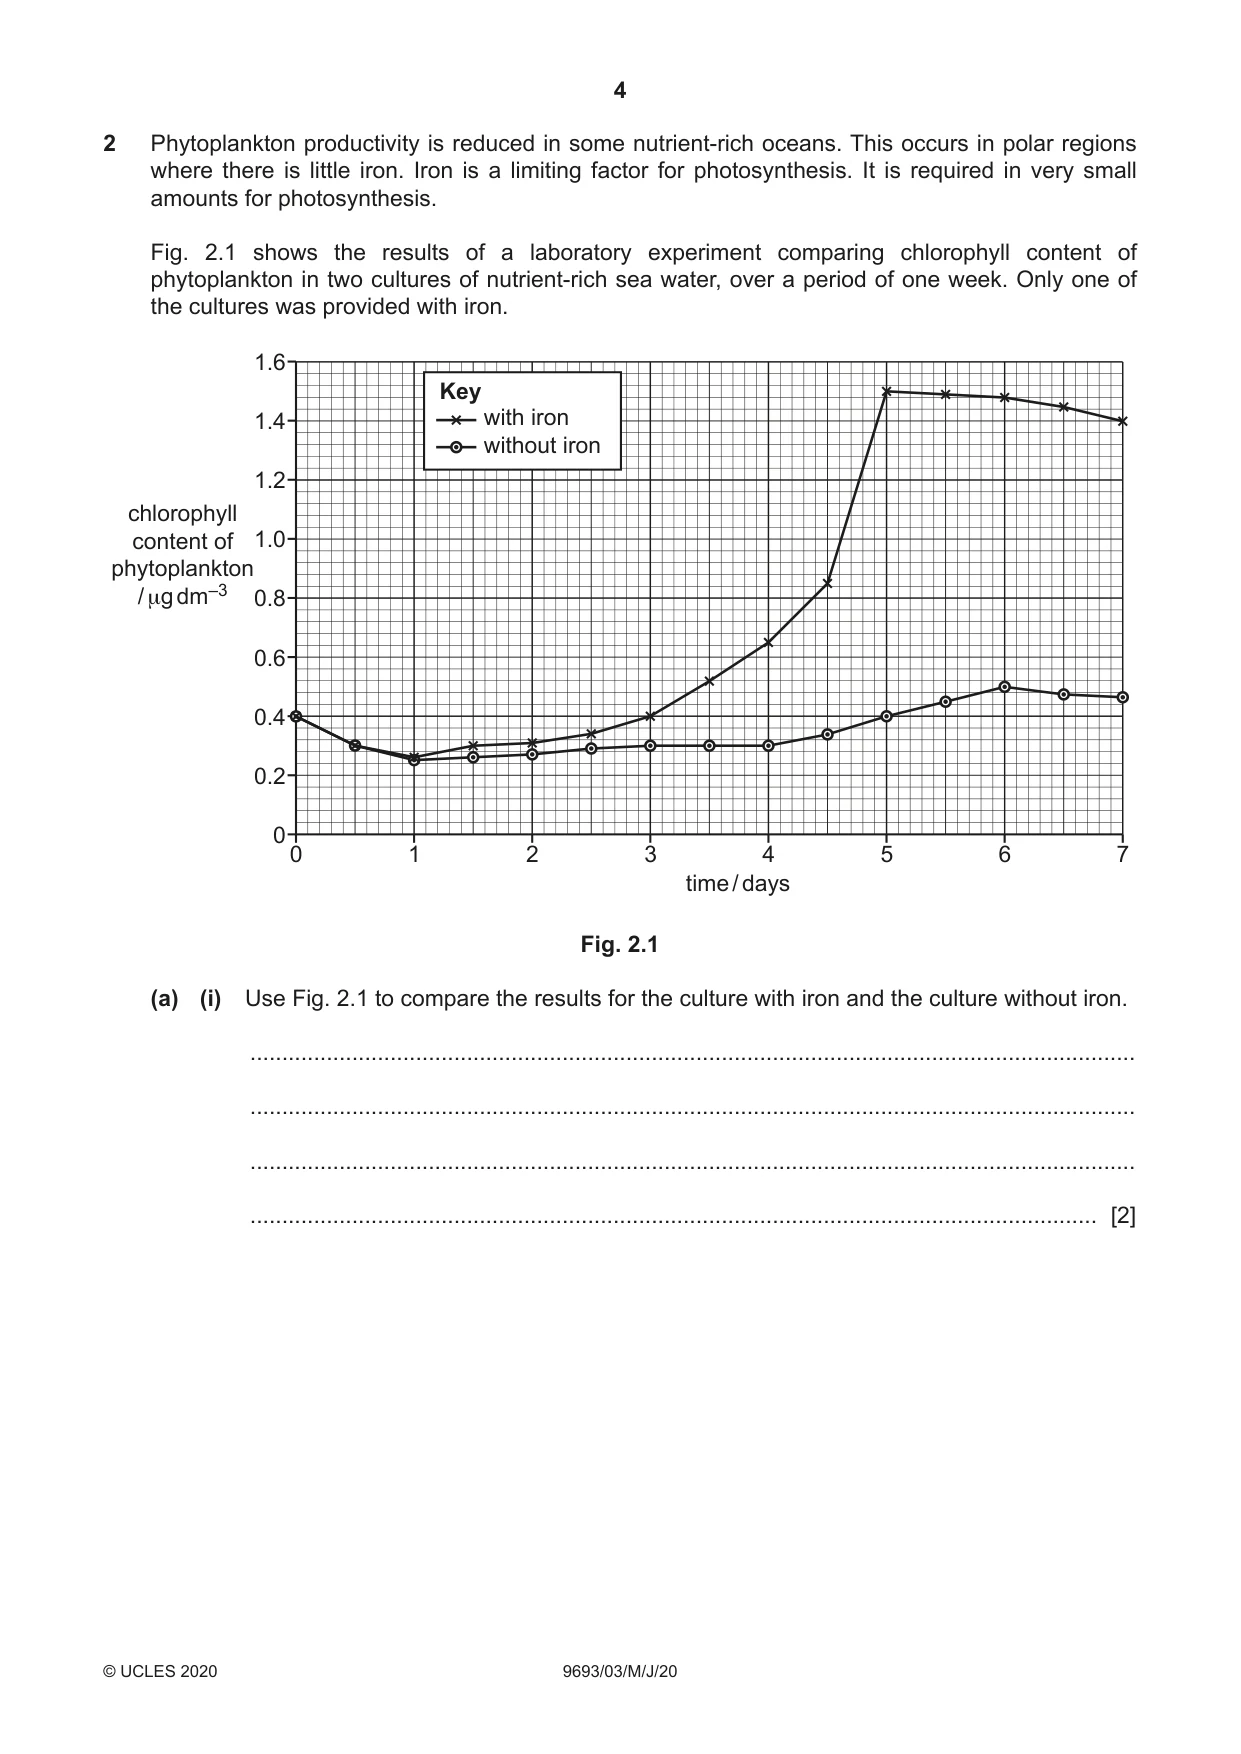
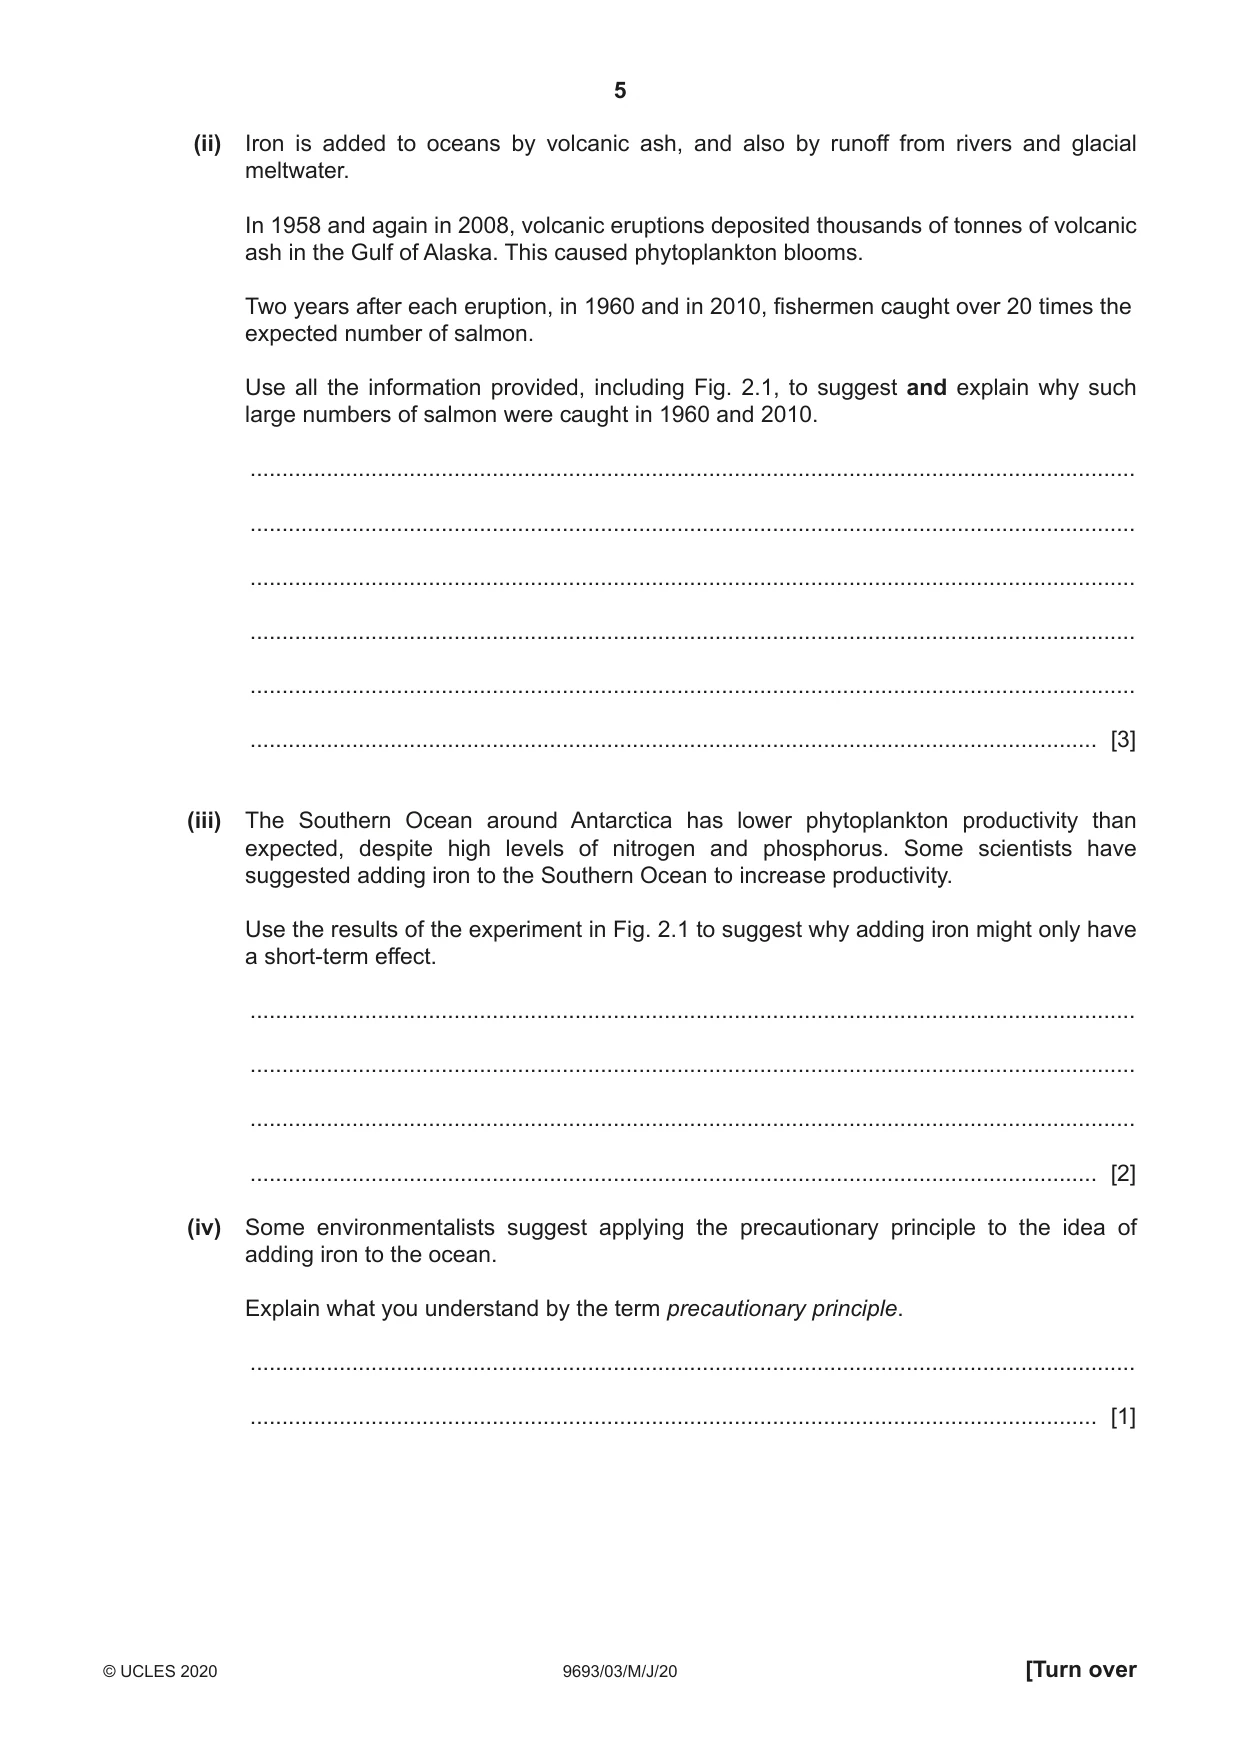
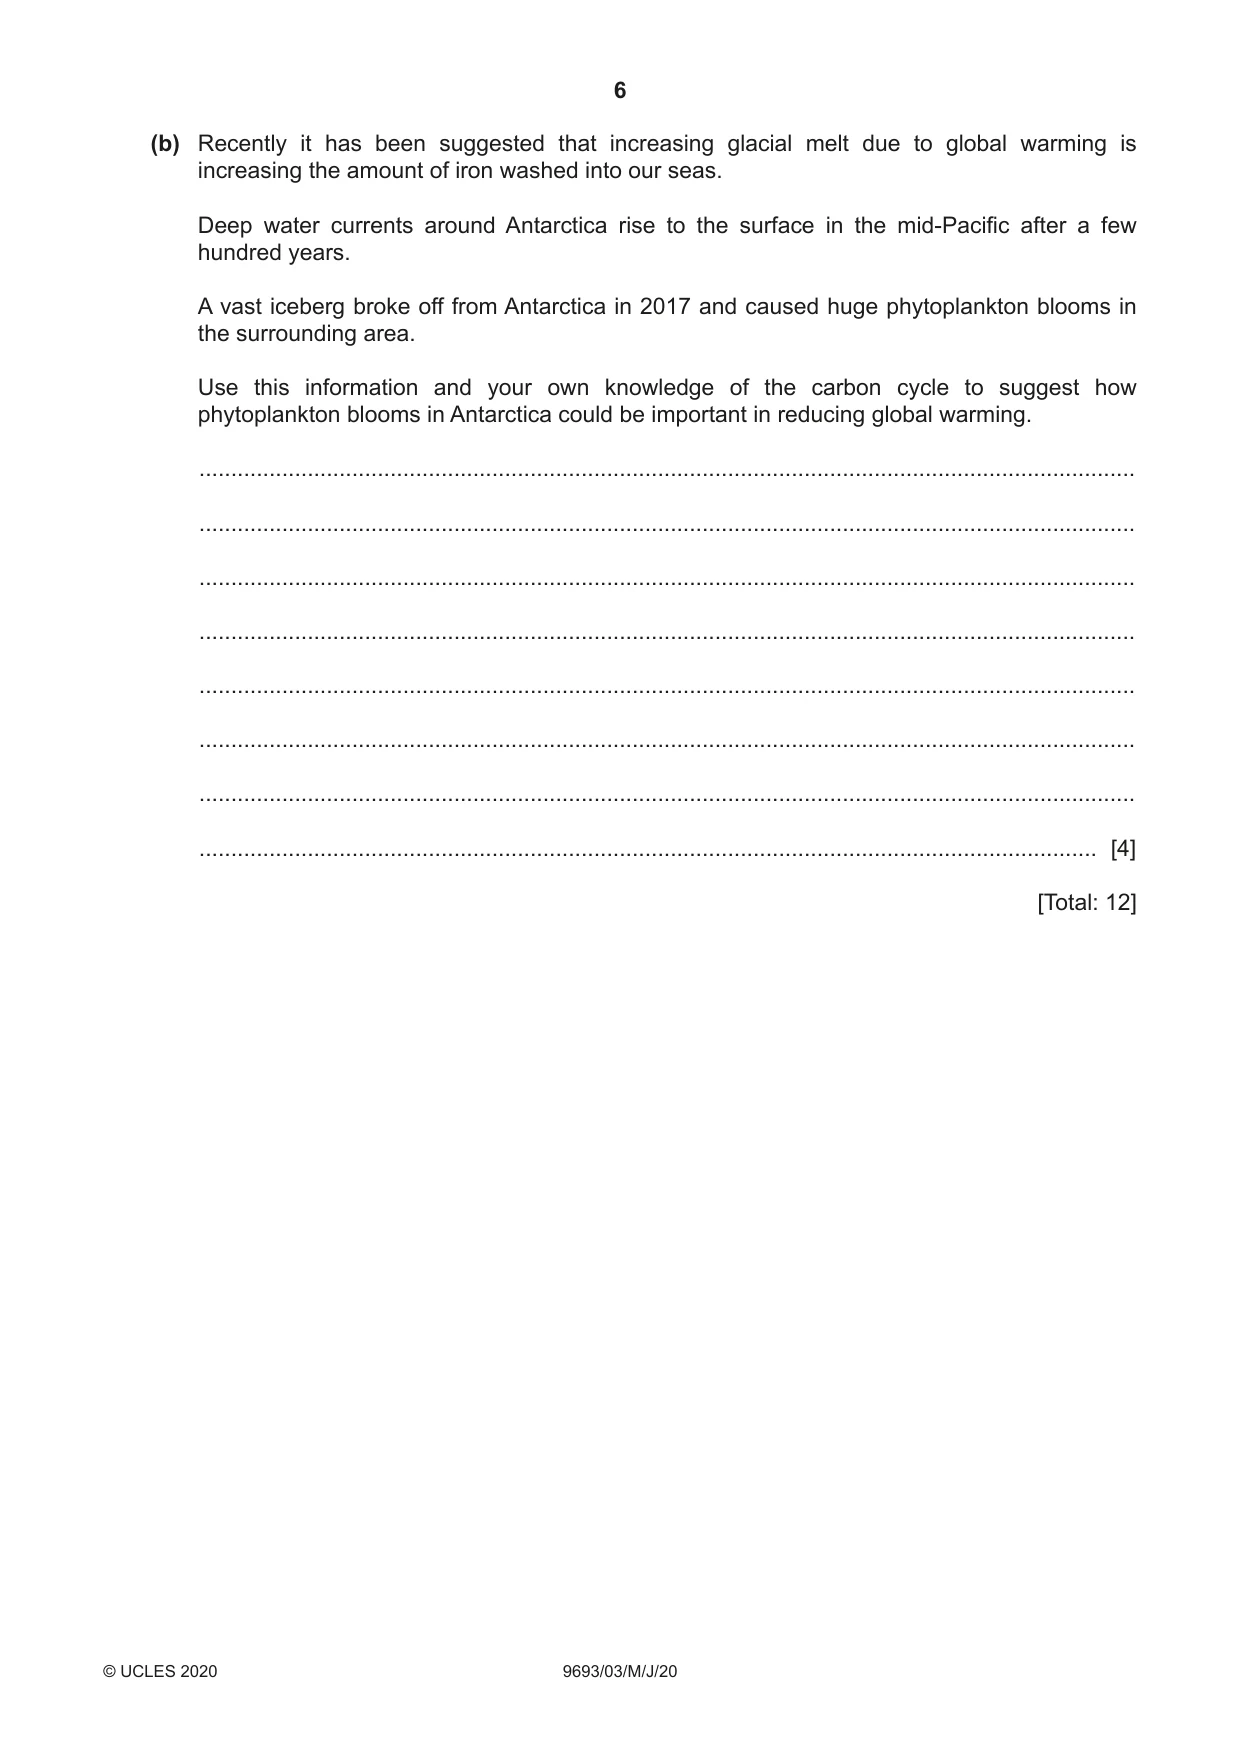
2 Phytoplankton productivity is reduced in some nutrient-rich oceans. This occurs in polar regions where there is little iron. Iron is a limiting factor for photosynthesis. It is required in very small amounts for photosynthesis. Fig. 2.1 shows the results of a laboratory experiment comparing chlorophyll content of phytoplankton in two cultures of nutrient-rich sea water, over a period of one week. Only one of the cultures was provided with iron. 1.6 Key 1.4 with iron without iron 1.2 chlorophyll content of 1.0 phytoplankton / μg dm–3 0.8 0.6 0.4 0.2 0 0 1 2 3 4 5 6 7 time / days Fig. 2.1 (a) (i) Use Fig. 2.1 to compare the results for the culture with iron and the culture without iron. ........................................................................................................................................... ........................................................................................................................................... ........................................................................................................................................... ..................................................................................................................................... [2] (ii) Iron is added to oceans by volcanic ash, and also by runoff from rivers and glacial meltwater. In 1958 and again in 2008, volcanic eruptions deposited thousands of tonnes of volcanic ash in the Gulf of Alaska. This caused phytoplankton blooms. Two years after each eruption, in 1960 and in 2010, fishermen caught over 20 times the expected number of salmon. Use all the information provided, including Fig. 2.1, to suggest and explain why such large numbers of salmon were caught in 1960 and 2010. ........................................................................................................................................... ........................................................................................................................................... ........................................................................................................................................... ........................................................................................................................................... ........................................................................................................................................... ..................................................................................................................................... [3] (iii) The Southern Ocean around Antarctica has lower phytoplankton productivity than expected, despite high levels of nitrogen and phosphorus. Some scientists have suggested adding iron to the Southern Ocean to increase productivity. Use the results of the experiment in Fig. 2.1 to suggest why adding iron might only have a short-term effect. ........................................................................................................................................... ........................................................................................................................................... ........................................................................................................................................... ..................................................................................................................................... [2] (iv) Some environmentalists suggest applying the precautionary principle to the idea of adding iron to the ocean. Explain what you understand by the term precautionary principle. ........................................................................................................................................... ..................................................................................................................................... [1] (b) Recently it has been suggested that increasing glacial melt due to global warming is increasing the amount of iron washed into our seas. Deep water currents around Antarctica rise to the surface in the mid-Pacific after a few hundred years. A vast iceberg broke off from Antarctica in 2017 and caused huge phytoplankton blooms in the surrounding area. Use this information and your own knowledge of the carbon cycle to suggest how phytoplankton blooms in Antarctica could be important in reducing global warming. ................................................................................................................................................... ................................................................................................................................................... ................................................................................................................................................... ................................................................................................................................................... ................................................................................................................................................... ................................................................................................................................................... ................................................................................................................................................... ............................................................................................................................................. [4] [Total: 12]
Q3 · State what is meant by the term osmoregulation
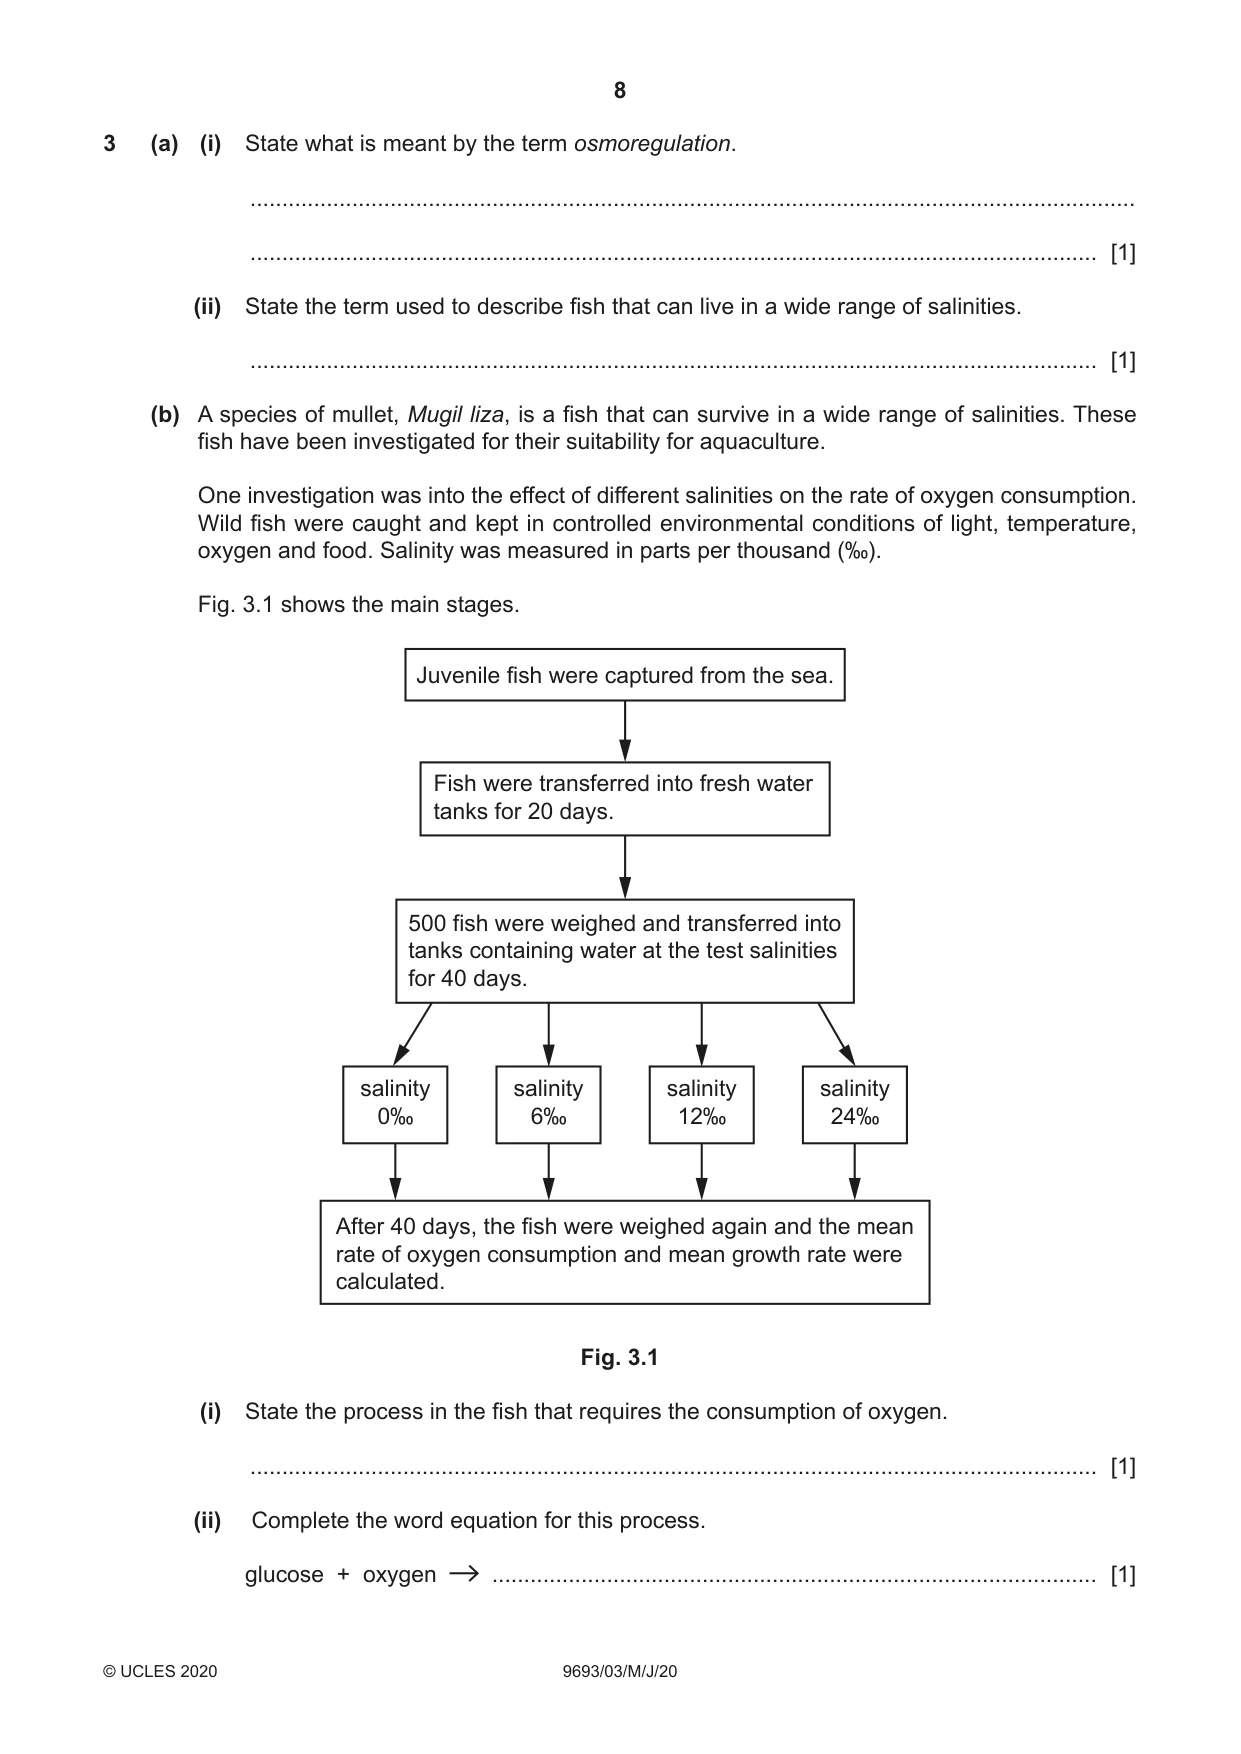
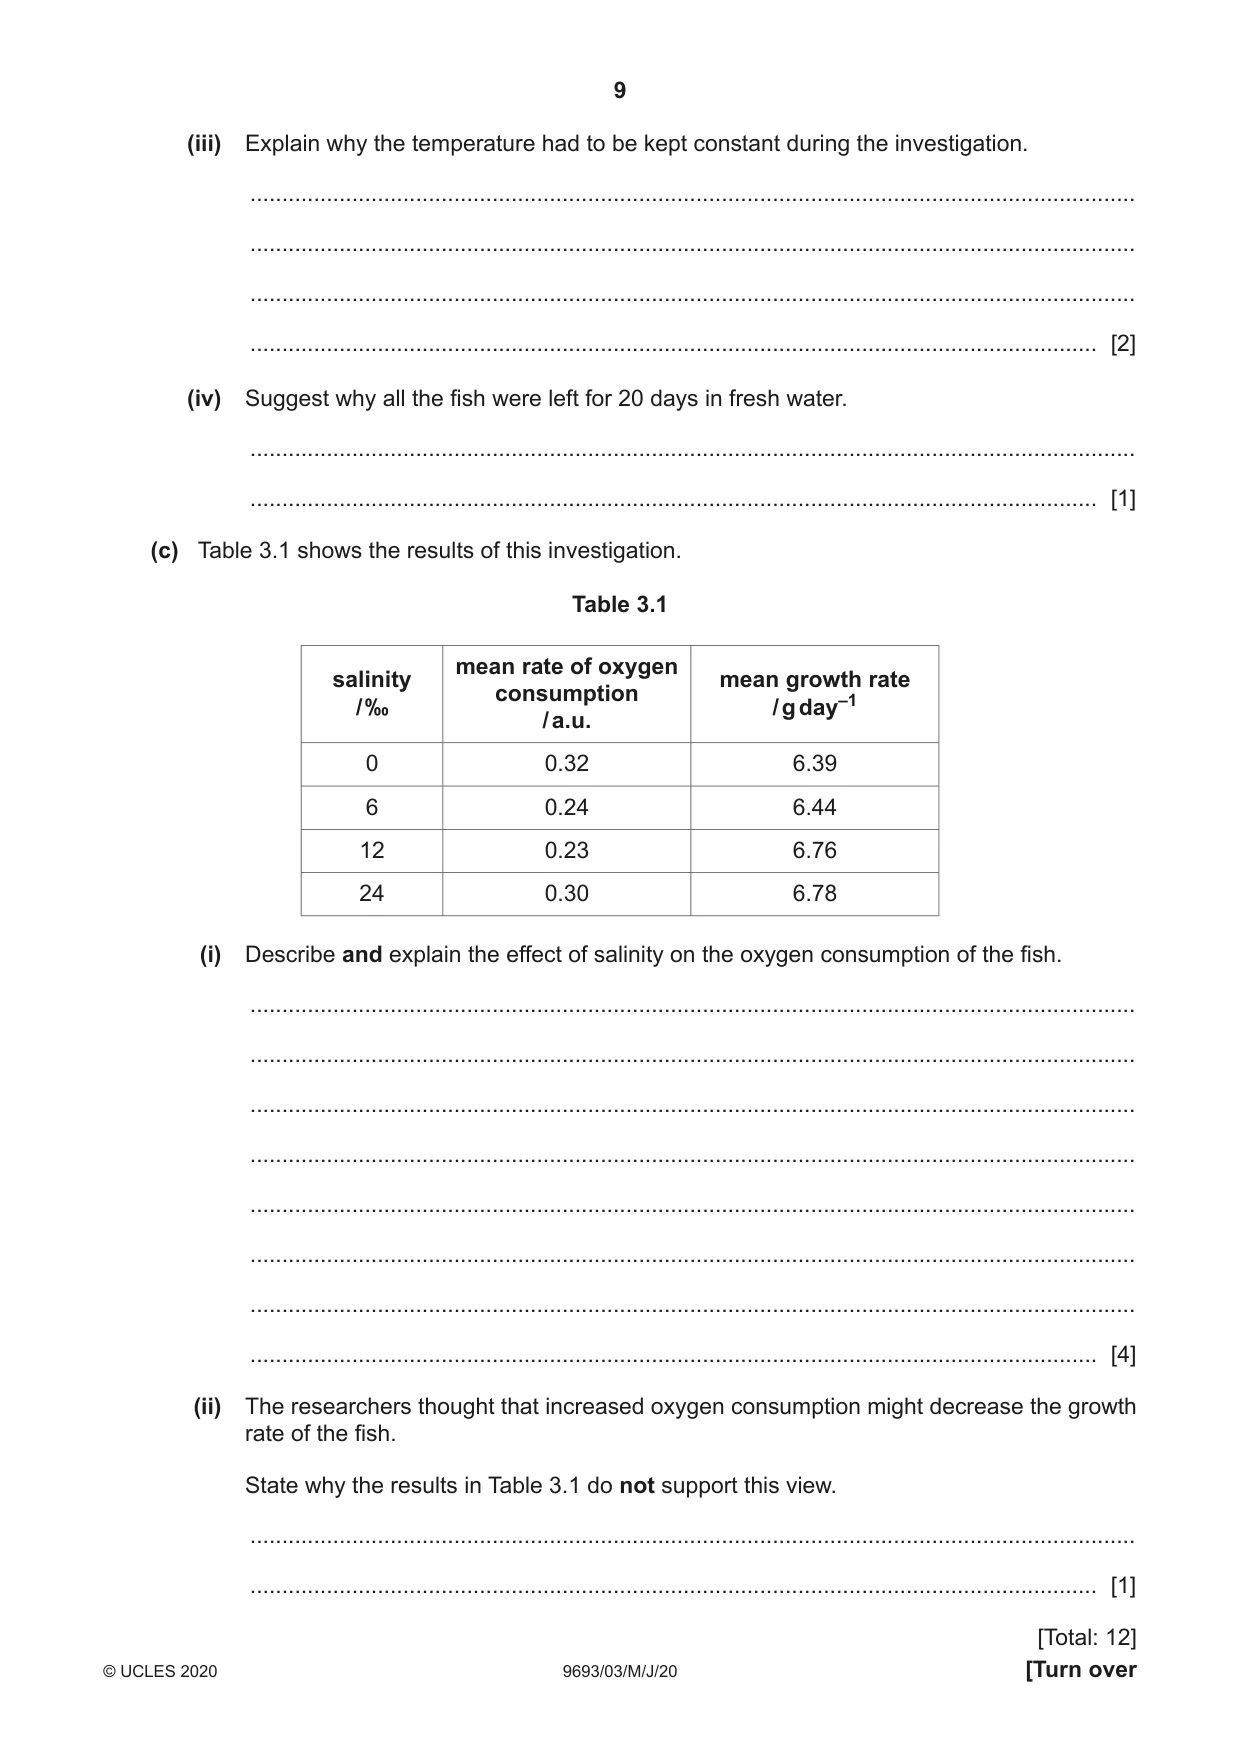
3 (a) (i) State what is meant by the term osmoregulation. ........................................................................................................................................... ..................................................................................................................................... [1] (ii) State the term used to describe fish that can live in a wide range of salinities. ..................................................................................................................................... [1] (b) A species of mullet, Mugil liza, is a fish that can survive in a wide range of salinities. These fish have been investigated for their suitability for aquaculture. One investigation was into the effect of different salinities on the rate of oxygen consumption. Wild fish were caught and kept in controlled environmental conditions of light, temperature, oxygen and food. Salinity was measured in parts per thousand (‰). Fig. 3.1 shows the main stages. Juvenile fish were captured from the sea. Fish were transferred into fresh water tanks for 20 days. 500 fish were weighed and transferred into tanks containing water at the test salinities for 40 days. salinity salinity salinity salinity 0‰ 6‰ 12‰ 24‰ After 40 days, the fish were weighed again and the mean rate of oxygen consumption and mean growth rate were calculated. Fig. 3.1 (i) State the process in the fish that requires the consumption of oxygen. ..................................................................................................................................... [1] (ii) Complete the word equation for this process. glucose + oxygen ............................................................................................... [1] (iii) Explain why the temperature had to be kept constant during the investigation. ........................................................................................................................................... ........................................................................................................................................... ........................................................................................................................................... ..................................................................................................................................... [2] (iv) Suggest why all the fish were left for 20 days in fresh water. ........................................................................................................................................... ..................................................................................................................................... [1] (c) Table 3.1 shows the results of this investigation. Table 3.1 mean rate of oxygen salinity mean growth rate consumption / ‰ / g day–1 / a.u. 0 0.32 6.39 6 0.24 6.44 12 0.23 6.76 24 0.30 6.78 (i) Describe and explain the effect of salinity on the oxygen consumption of the fish. ........................................................................................................................................... ........................................................................................................................................... ........................................................................................................................................... ........................................................................................................................................... ........................................................................................................................................... ........................................................................................................................................... ........................................................................................................................................... ..................................................................................................................................... [4] (ii) The researchers thought that increased oxygen consumption might decrease the growth rate of the fish. State why the results in Table 3.1 do not support this view. ........................................................................................................................................... ..................................................................................................................................... [1] [Total: 12]
Q4 · Different species of marine organism reproduce using internal or external fertilisation
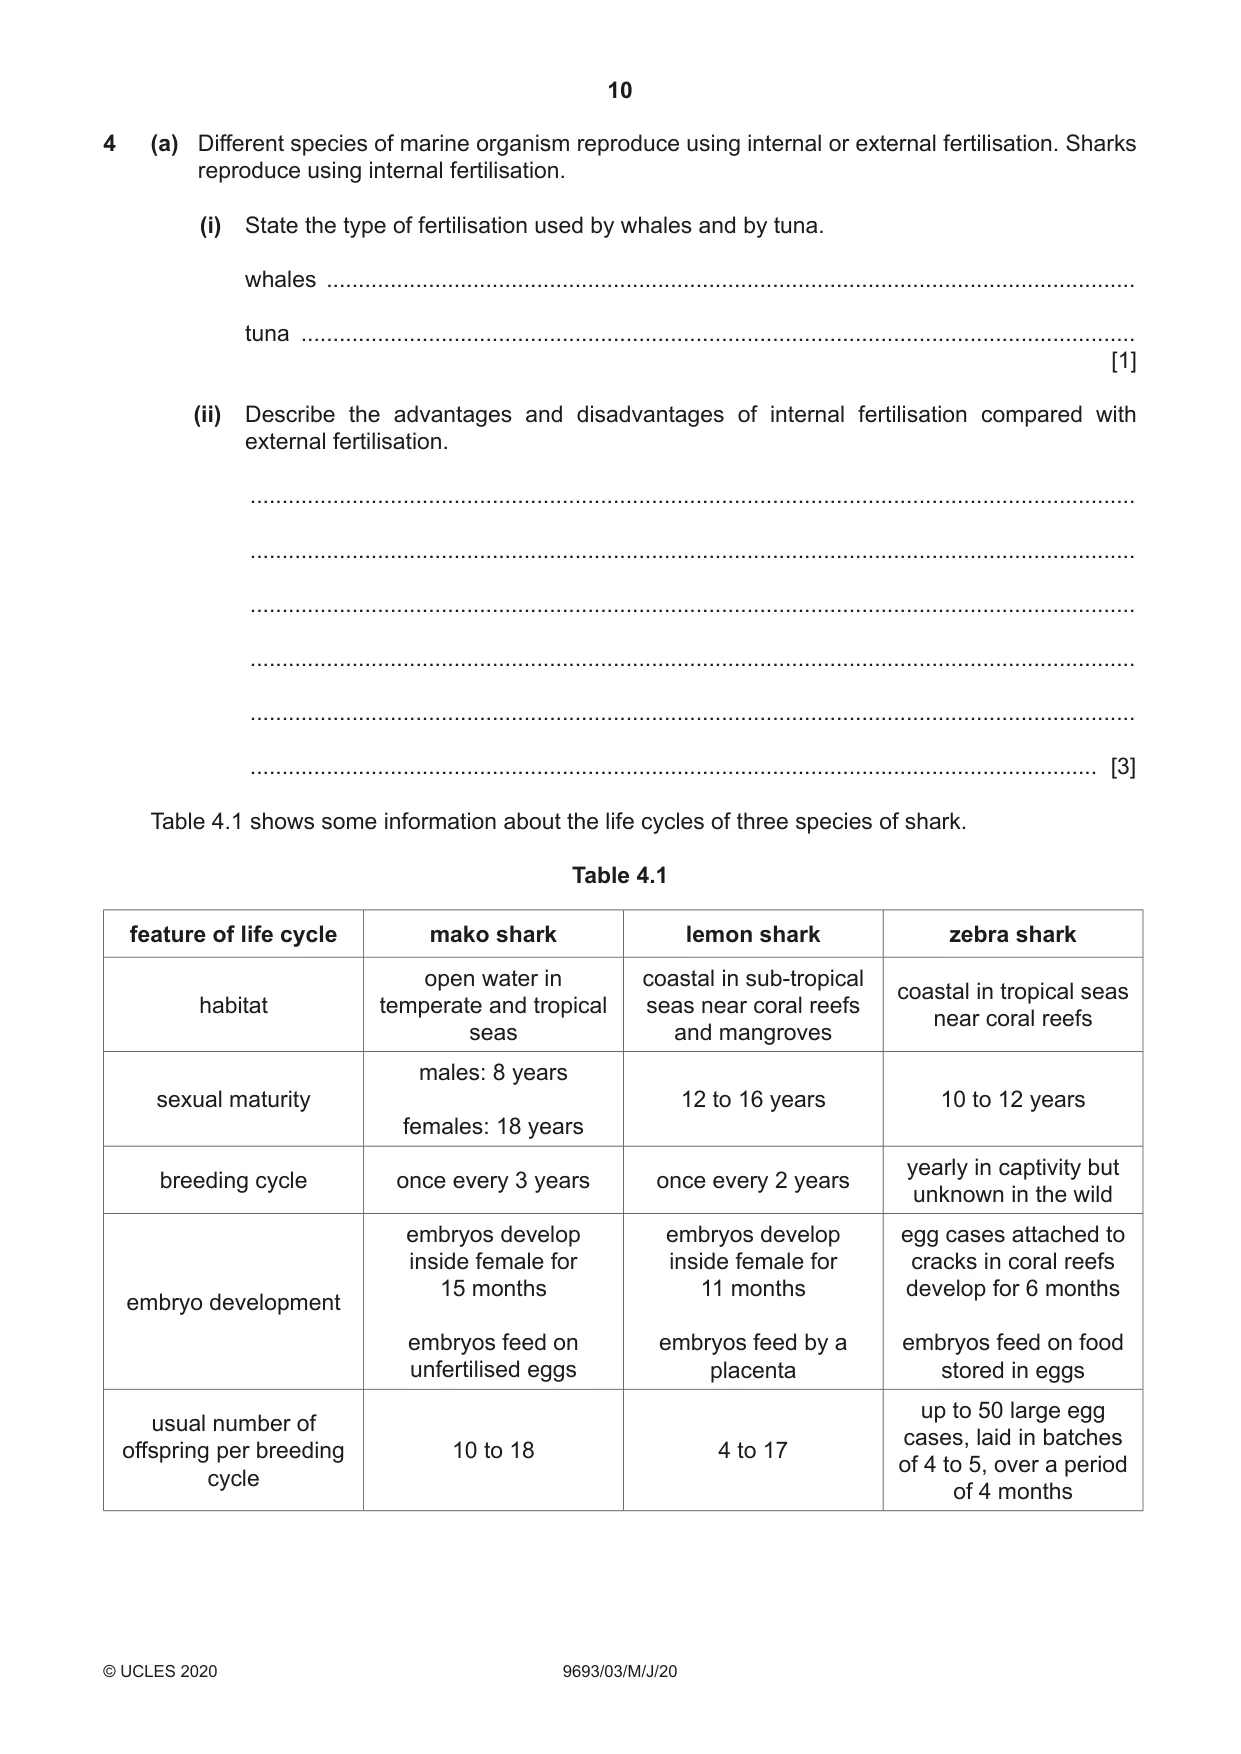
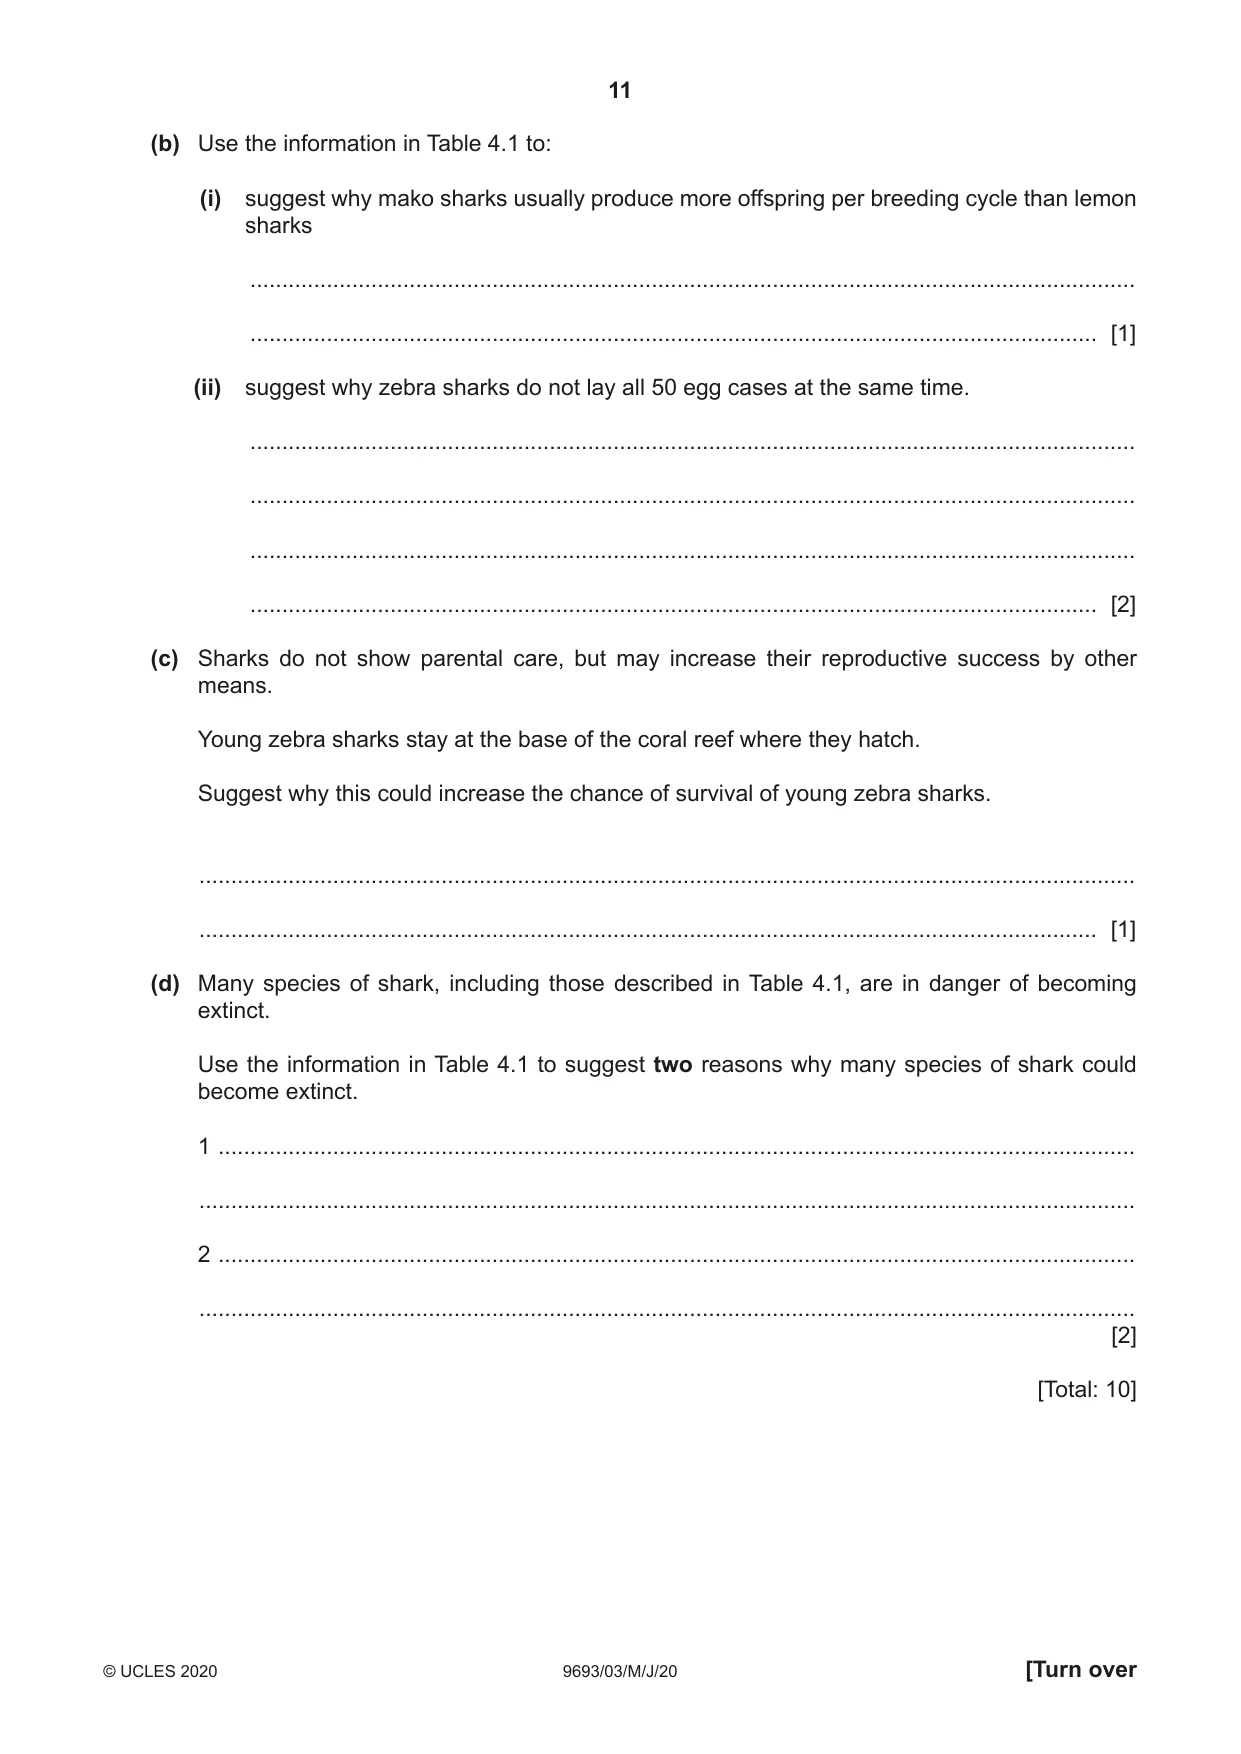
4 (a) Different species of marine organism reproduce using internal or external fertilisation. Sharks reproduce using internal fertilisation. (i) State the type of fertilisation used by whales and by tuna. whales ............................................................................................................................... tuna ................................................................................................................................... [1] (ii) Describe the advantages and disadvantages of internal fertilisation compared with external fertilisation. ........................................................................................................................................... ........................................................................................................................................... ........................................................................................................................................... ........................................................................................................................................... ........................................................................................................................................... ..................................................................................................................................... [3] Table 4.1 shows some information about the life cycles of three species of shark. Table 4.1 feature of life cycle mako shark lemon shark zebra shark open water in coastal in sub-tropical coastal in tropical seas habitat temperate and tropical seas near coral reefs near coral reefs seas and mangroves males: 8 years sexual maturity 12 to 16 years 10 to 12 years females: 18 years yearly in captivity but breeding cycle once every 3 years once every 2 years unknown in the wild embryos develop embryos develop egg cases attached to inside female for inside female for cracks in coral reefs 15 months 11 months develop for 6 months embryo development embryos feed on embryos feed by a embryos feed on food unfertilised eggs placenta stored in eggs up to 50 large egg usual number of cases, laid in batches offspring per breeding 10 to 18 4 to 17 of 4 to 5, over a period cycle of 4 months (b) Use the information in Table 4.1 to: (i) suggest why mako sharks usually produce more offspring per breeding cycle than lemon sharks ........................................................................................................................................... ..................................................................................................................................... [1] (ii) suggest why zebra sharks do not lay all 50 egg cases at the same time. ........................................................................................................................................... ........................................................................................................................................... ........................................................................................................................................... ..................................................................................................................................... [2] (c) Sharks do not show parental care, but may increase their reproductive success by other means. Young zebra sharks stay at the base of the coral reef where they hatch. Suggest why this could increase the chance of survival of young zebra sharks. ................................................................................................................................................... ............................................................................................................................................. [1] (d) Many species of shark, including those described in Table 4.1, are in danger of becoming extinct. Use the information in Table 4.1 to suggest two reasons why many species of shark could become extinct. 1 ................................................................................................................................................ ................................................................................................................................................... 2 ................................................................................................................................................ ................................................................................................................................................... [2] [Total: 10]
Q5 · Atlantic cod is a commercially important fish found in the North Sea
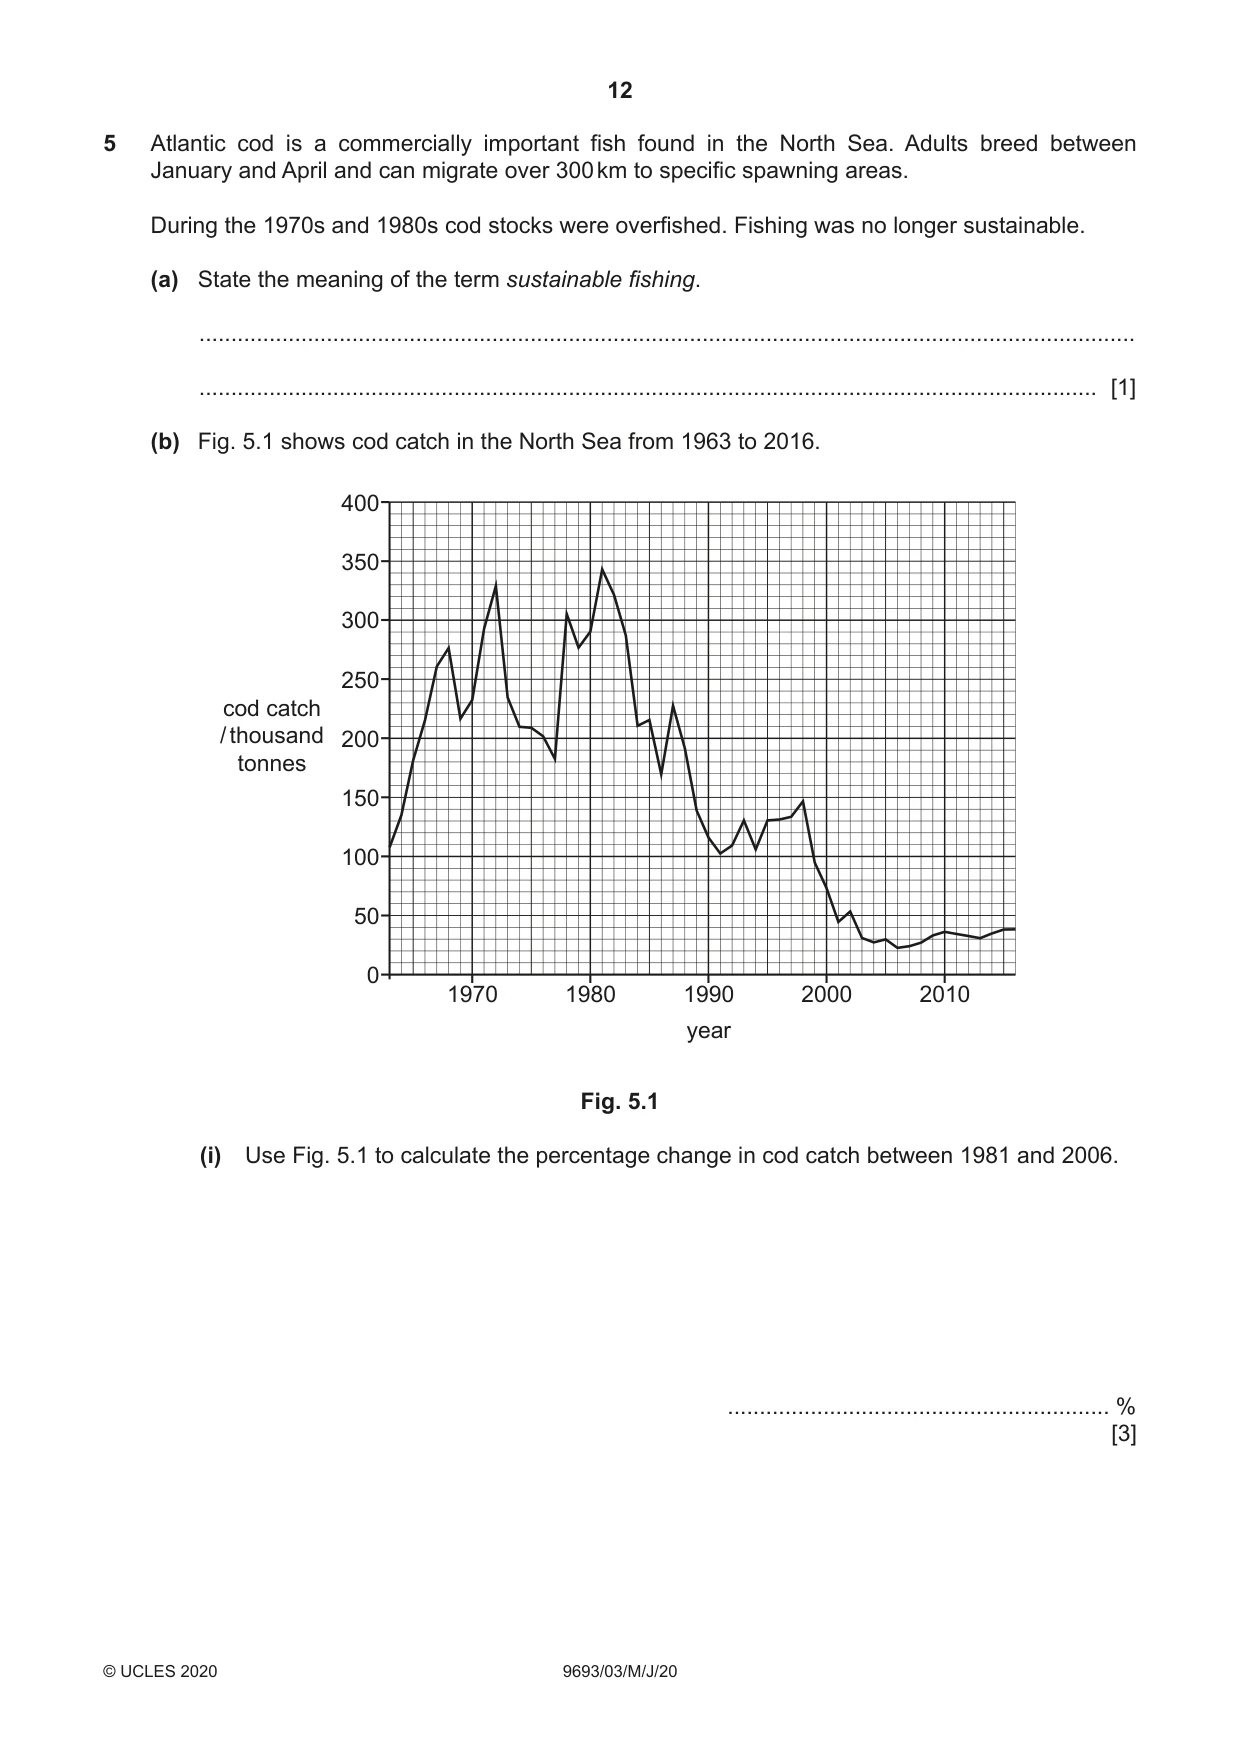
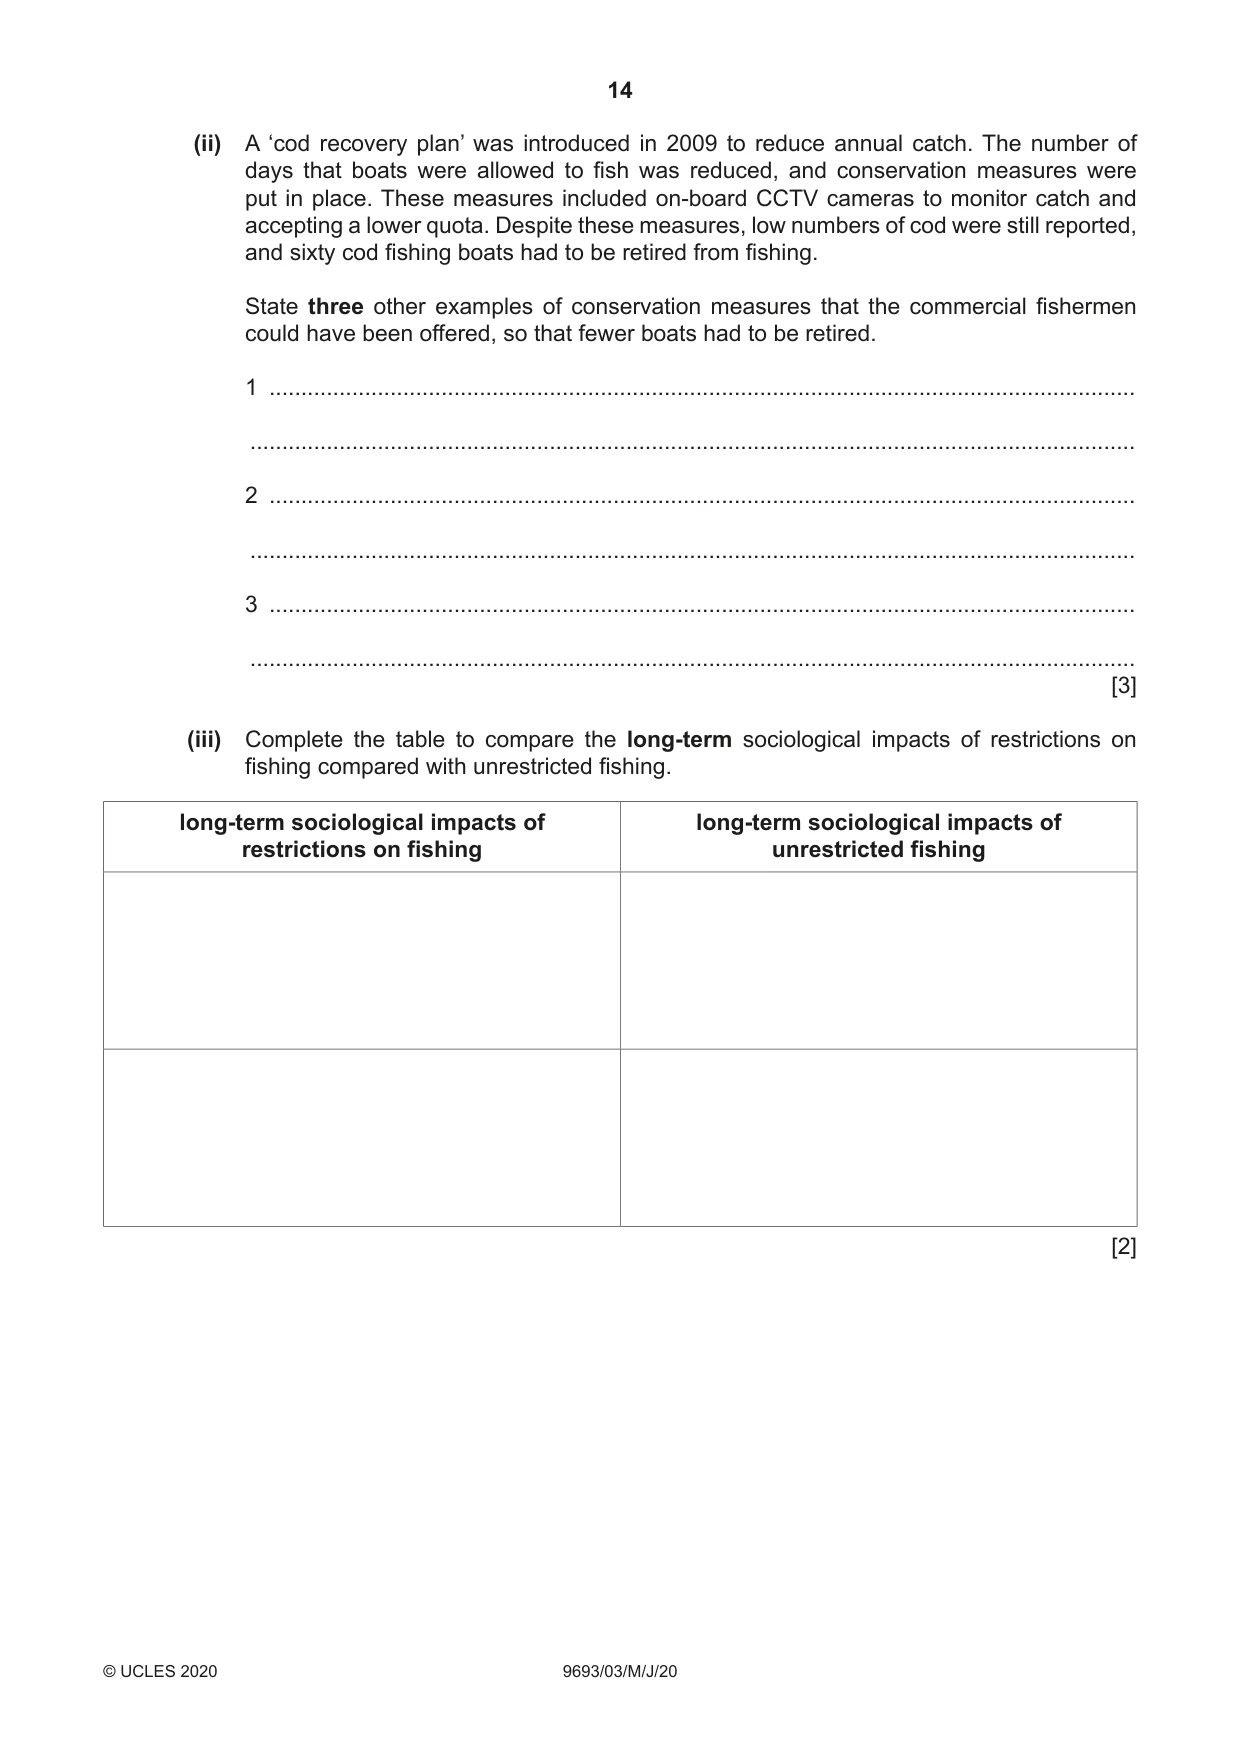
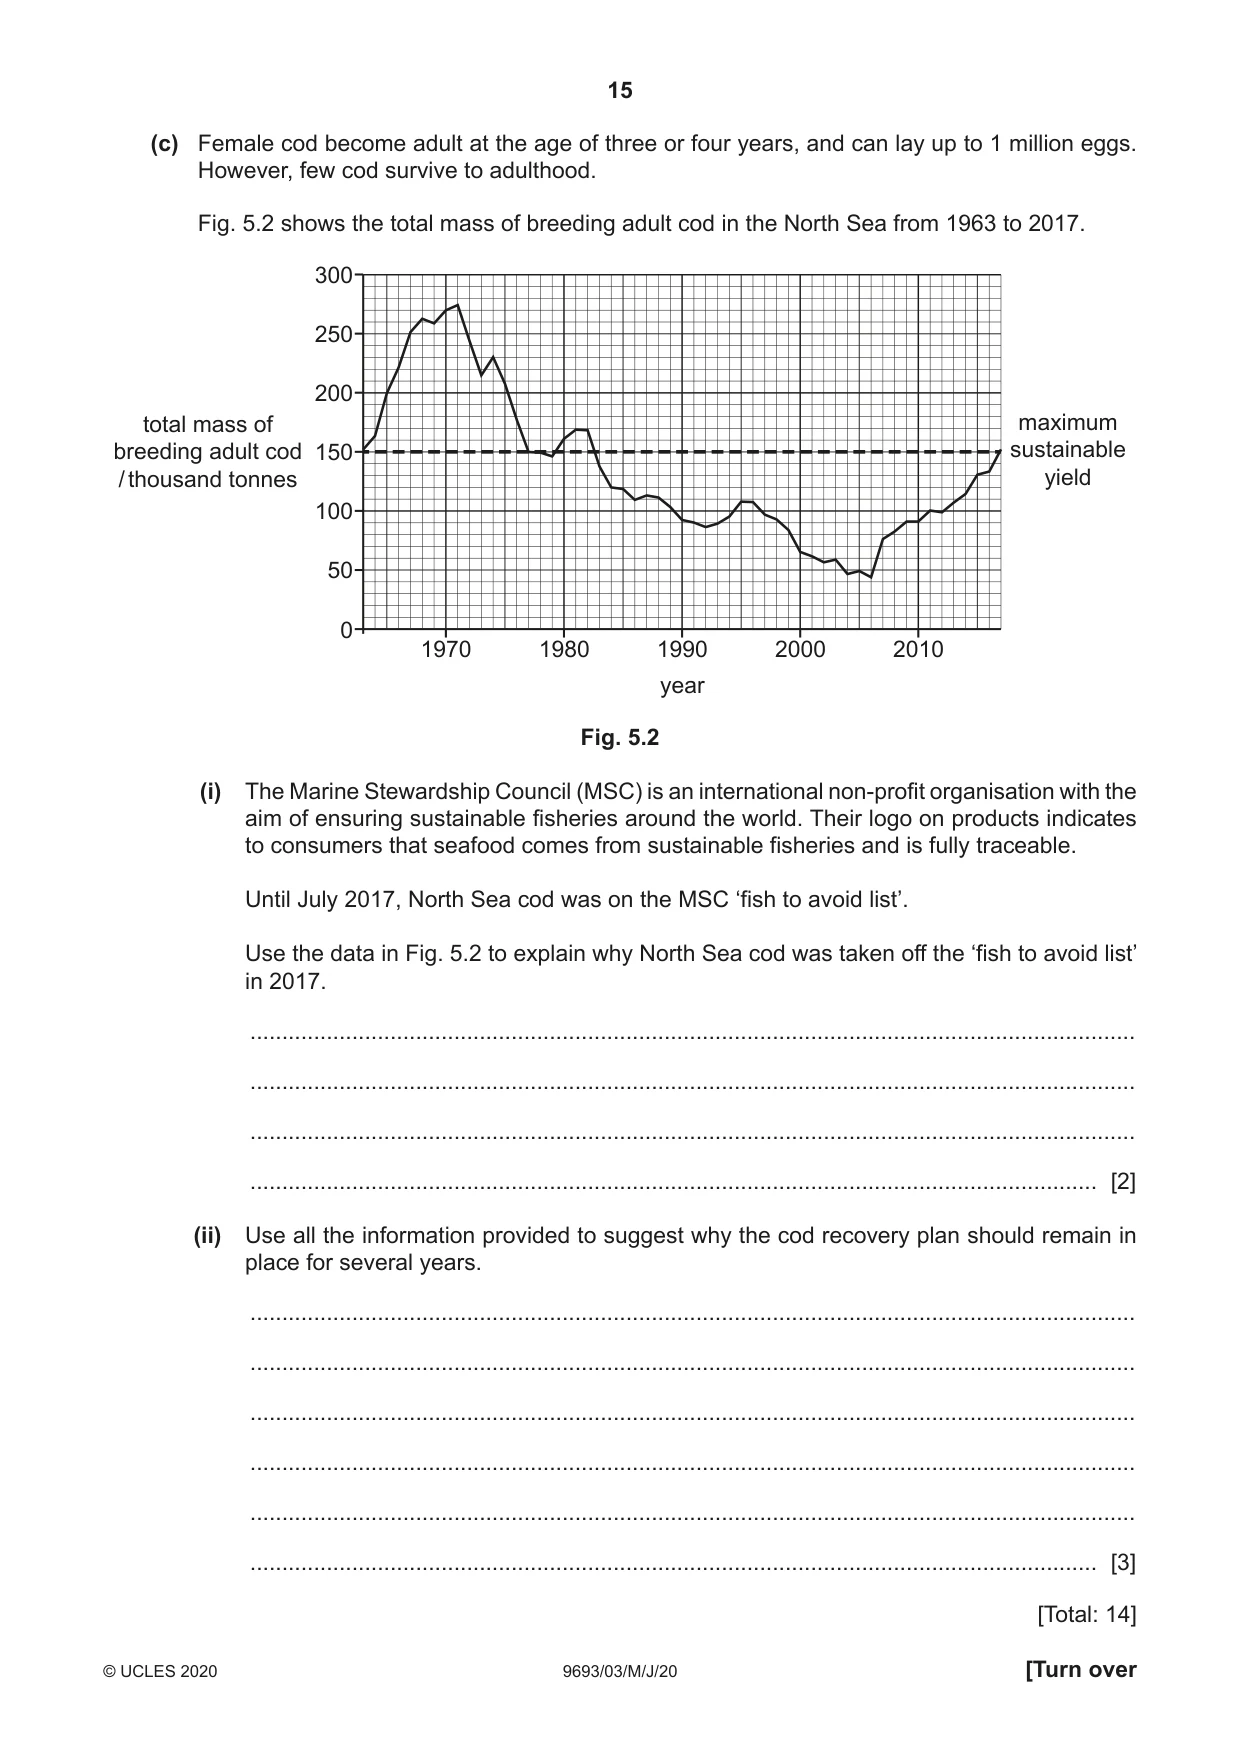
5 Atlantic cod is a commercially important fish found in the North Sea. Adults breed between January and April and can migrate over 300 km to specific spawning areas. During the 1970s and 1980s cod stocks were overfished. Fishing was no longer sustainable. (a) State the meaning of the term sustainable fishing. ................................................................................................................................................... ............................................................................................................................................. [1] (b) Fig. 5.1 shows cod catch in the North Sea from 1963 to 2016. 400 350 300 250 cod catch / thousand 200 tonnes 150 100 50 0 1970 1980 1990 2000 2010 year Fig. 5.1 (i) Use Fig. 5.1 to calculate the percentage change in cod catch between 1981 and 2006. ............................................................ % [3] (ii) A ‘cod recovery plan’ was introduced in 2009 to reduce annual catch. The number of days that boats were allowed to fish was reduced, and conservation measures were put in place. These measures included on-board CCTV cameras to monitor catch and accepting a lower quota. Despite these measures, low numbers of cod were still reported, and sixty cod fishing boats had to be retired from fishing. State three other examples of conservation measures that the commercial fishermen could have been offered, so that fewer boats had to be retired. 1 ........................................................................................................................................ ........................................................................................................................................... 2 ........................................................................................................................................ ........................................................................................................................................... 3 ........................................................................................................................................ ........................................................................................................................................... [3] (iii) Complete the table to compare the long-term sociological impacts of restrictions on fishing compared with unrestricted fishing. long-term sociological impacts of long-term sociological impacts of restrictions on fishing unrestricted fishing [2] (c) Female cod become adult at the age of three or four years, and can lay up to 1 million eggs. However, few cod survive to adulthood. Fig. 5.2 shows the total mass of breeding adult cod in the North Sea from 1963 to 2017. 300 250 200 total mass of maximum breeding adult cod 150 sustainable / thousand tonnes yield 100 50 0 1970 1980 1990 2000 2010 year Fig. 5.2 (i) The Marine Stewardship Council (MSC) is an international non-profit organisation with the aim of ensuring sustainable fisheries around the world. Their logo on products indicates to consumers that seafood comes from sustainable fisheries and is fully traceable. Until July 2017, North Sea cod was on the MSC ‘fish to avoid list’. Use the data in Fig. 5.2 to explain why North Sea cod was taken off the ‘fish to avoid list’ in 2017. ........................................................................................................................................... ........................................................................................................................................... ........................................................................................................................................... ..................................................................................................................................... [2] (ii) Use all the information provided to suggest why the cod recovery plan should remain in place for several years. ........................................................................................................................................... ........................................................................................................................................... ........................................................................................................................................... ........................................................................................................................................... ........................................................................................................................................... ..................................................................................................................................... [3] [Total: 14]
Q6 · The seas around Scotland are important for farming salmon in sea cages, as well as for…
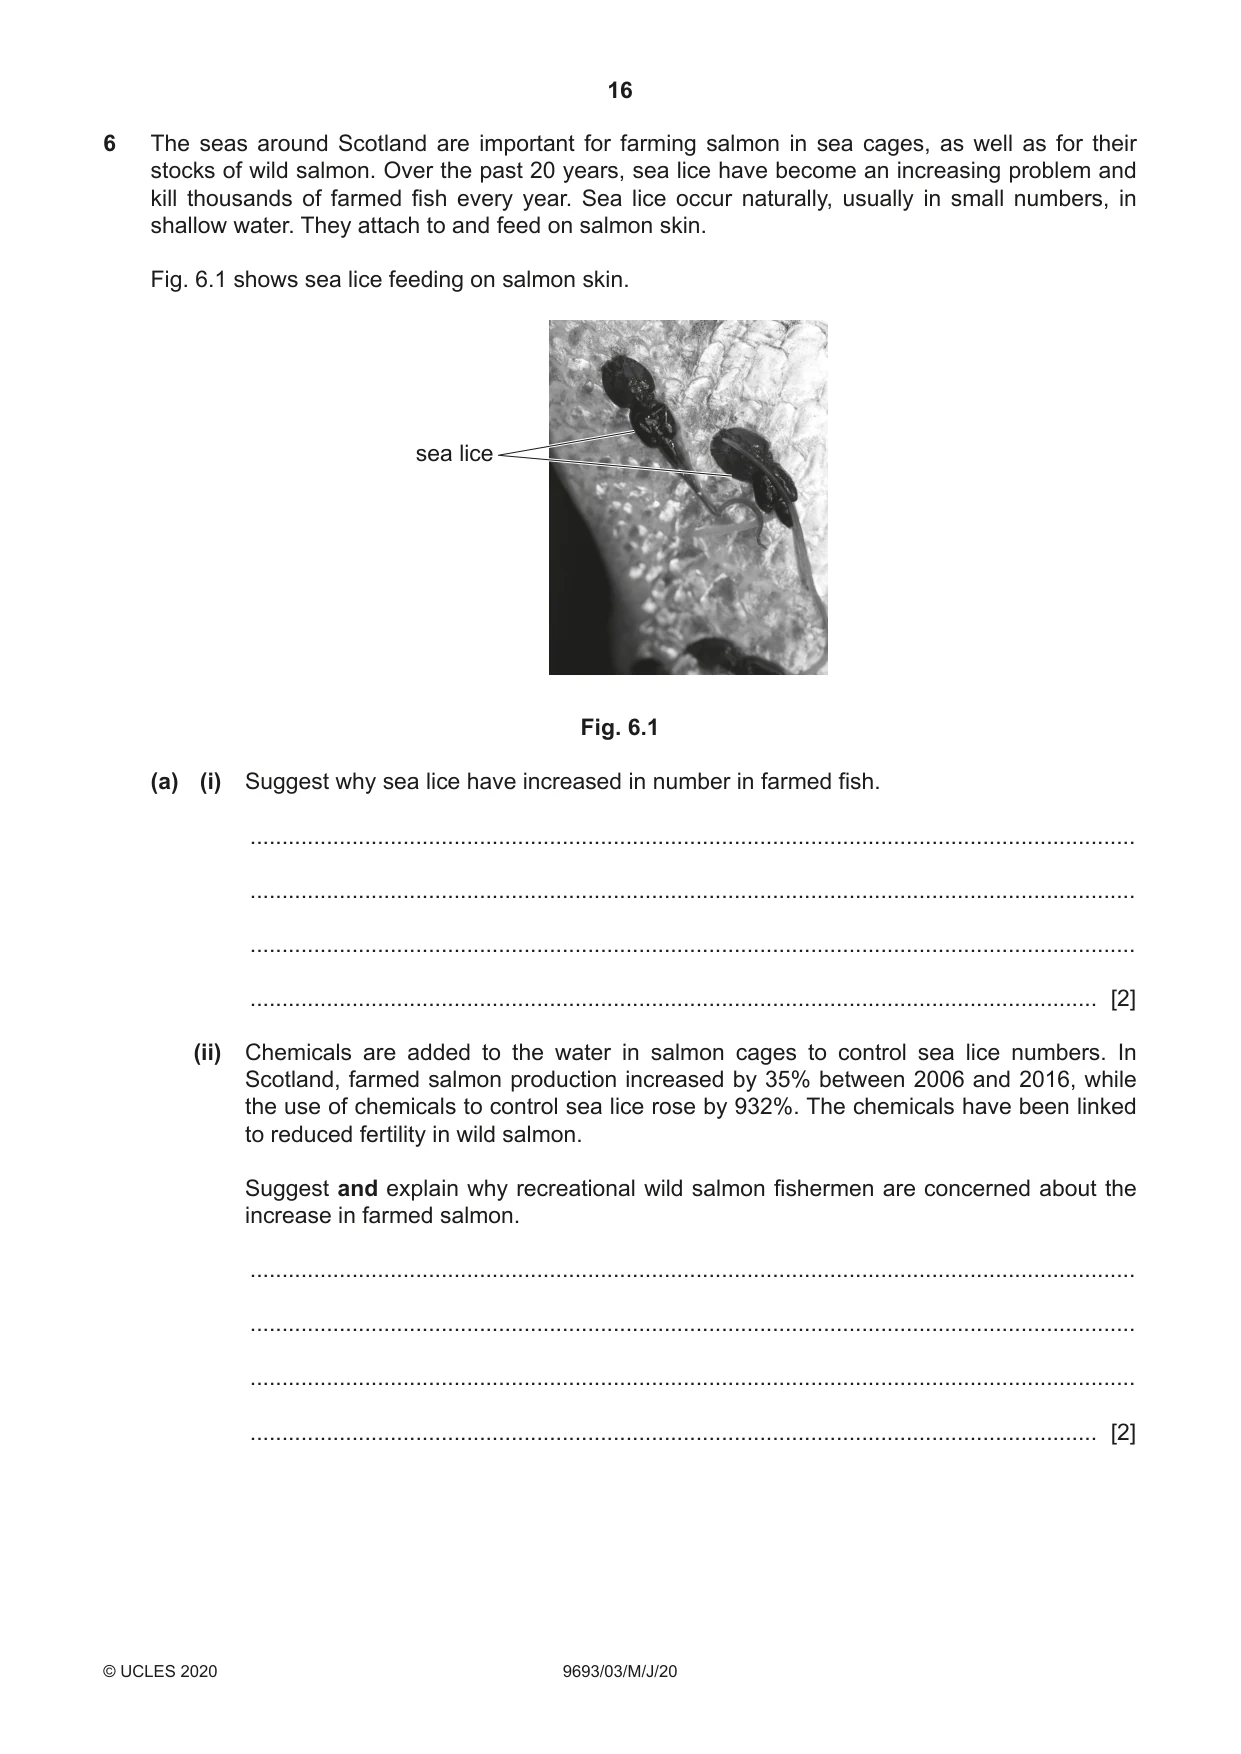
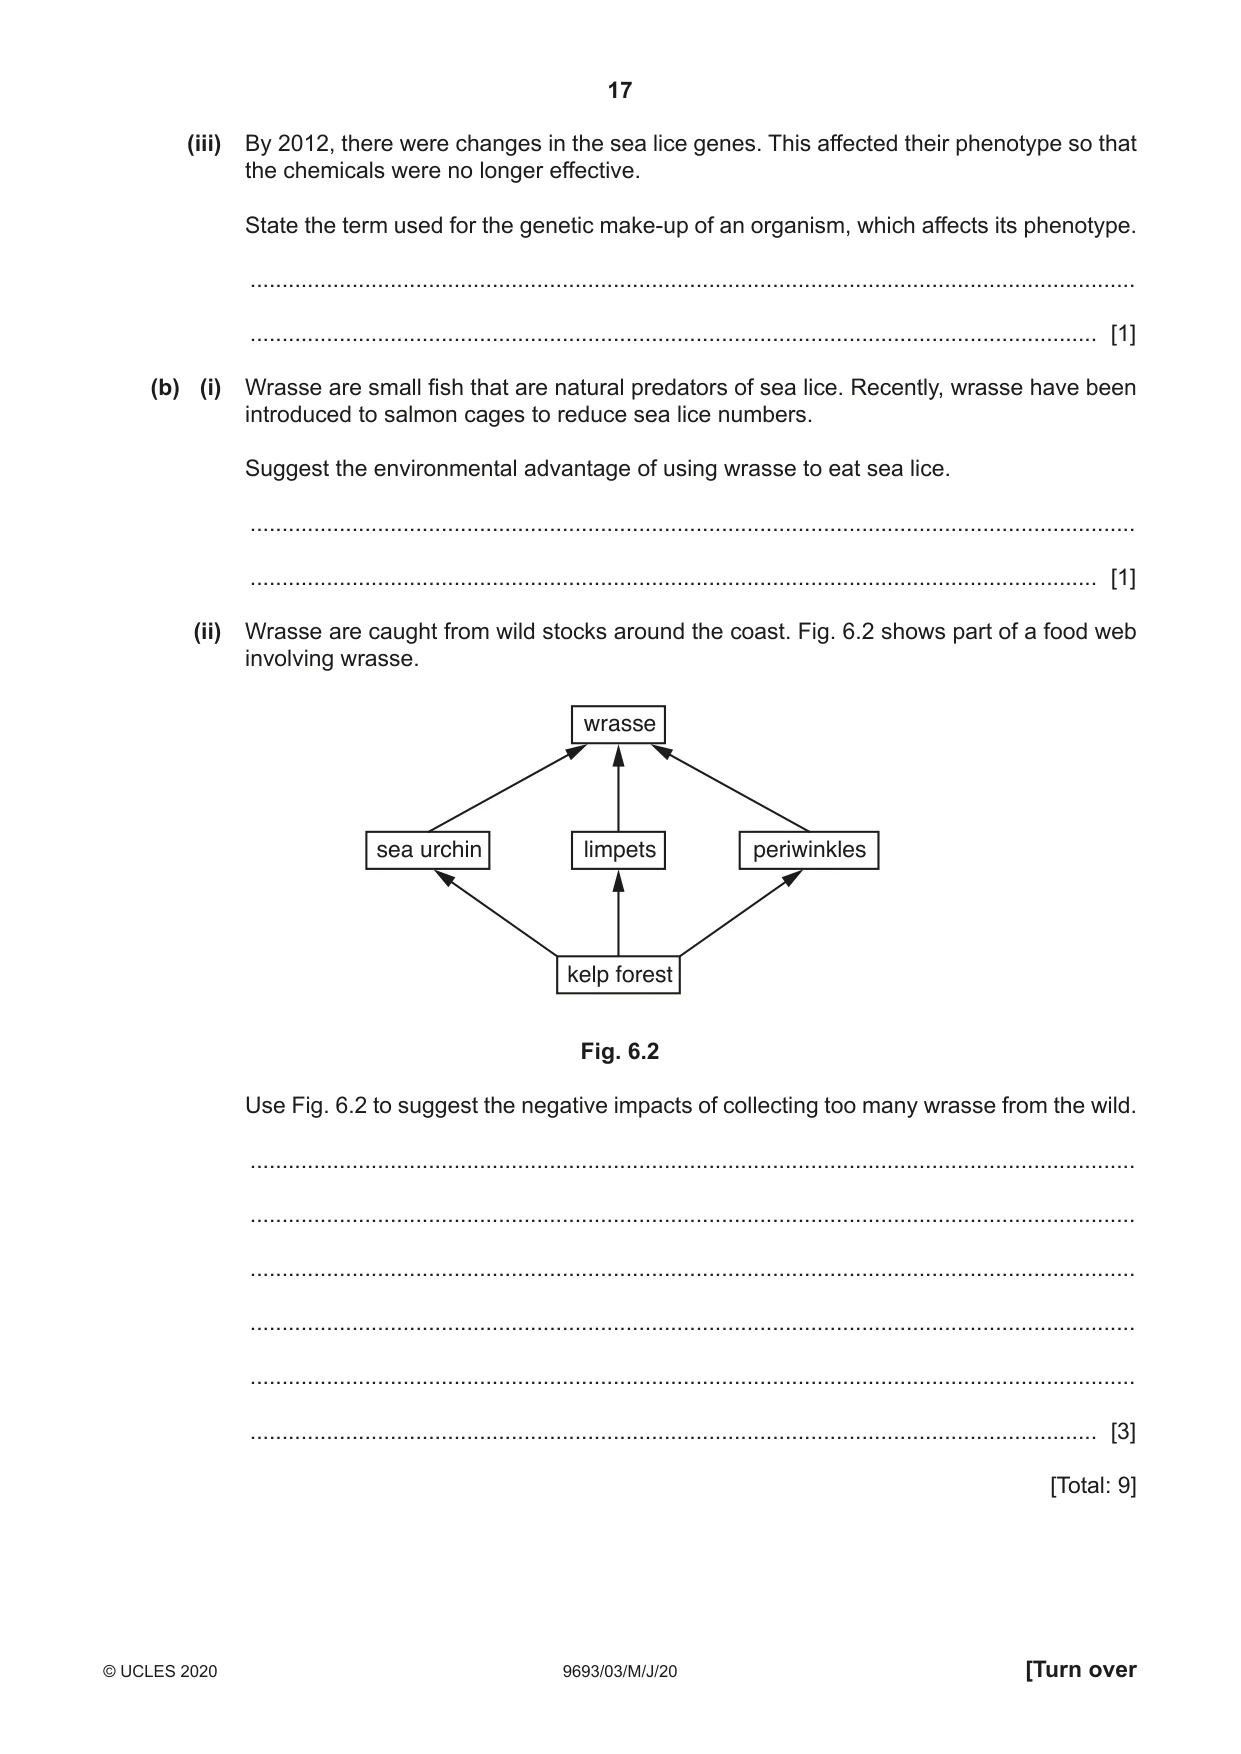
6 The seas around Scotland are important for farming salmon in sea cages, as well as for their stocks of wild salmon. Over the past 20 years, sea lice have become an increasing problem and kill thousands of farmed fish every year. Sea lice occur naturally, usually in small numbers, in shallow water. They attach to and feed on salmon skin. Fig. 6.1 shows sea lice feeding on salmon skin. sea lice Fig. 6.1 (a) (i) Suggest why sea lice have increased in number in farmed fish. ........................................................................................................................................... ........................................................................................................................................... ........................................................................................................................................... ..................................................................................................................................... [2] (ii) Chemicals are added to the water in salmon cages to control sea lice numbers. In Scotland, farmed salmon production increased by 35% between 2006 and 2016, while the use of chemicals to control sea lice rose by 932%. The chemicals have been linked to reduced fertility in wild salmon. Suggest and explain why recreational wild salmon fishermen are concerned about the increase in farmed salmon. ........................................................................................................................................... ........................................................................................................................................... ........................................................................................................................................... ..................................................................................................................................... [2] (iii) By 2012, there were changes in the sea lice genes. This affected their phenotype so that the chemicals were no longer effective. State the term used for the genetic make-up of an organism, which affects its phenotype. ........................................................................................................................................... ..................................................................................................................................... [1] (b) (i) Wrasse are small fish that are natural predators of sea lice. Recently, wrasse have been introduced to salmon cages to reduce sea lice numbers. Suggest the environmental advantage of using wrasse to eat sea lice. ........................................................................................................................................... ..................................................................................................................................... [1] (ii) Wrasse are caught from wild stocks around the coast. Fig. 6.2 shows part of a food web involving wrasse. wrasse sea urchin limpets periwinkles kelp forest Fig. 6.2 Use Fig. 6.2 to suggest the negative impacts of collecting too many wrasse from the wild. ........................................................................................................................................... ........................................................................................................................................... ........................................................................................................................................... ........................................................................................................................................... ........................................................................................................................................... ..................................................................................................................................... [3] [Total: 9]
Q7 · Macquarie Harbour is a large natural harbour, partly within the protected Tasmanian…
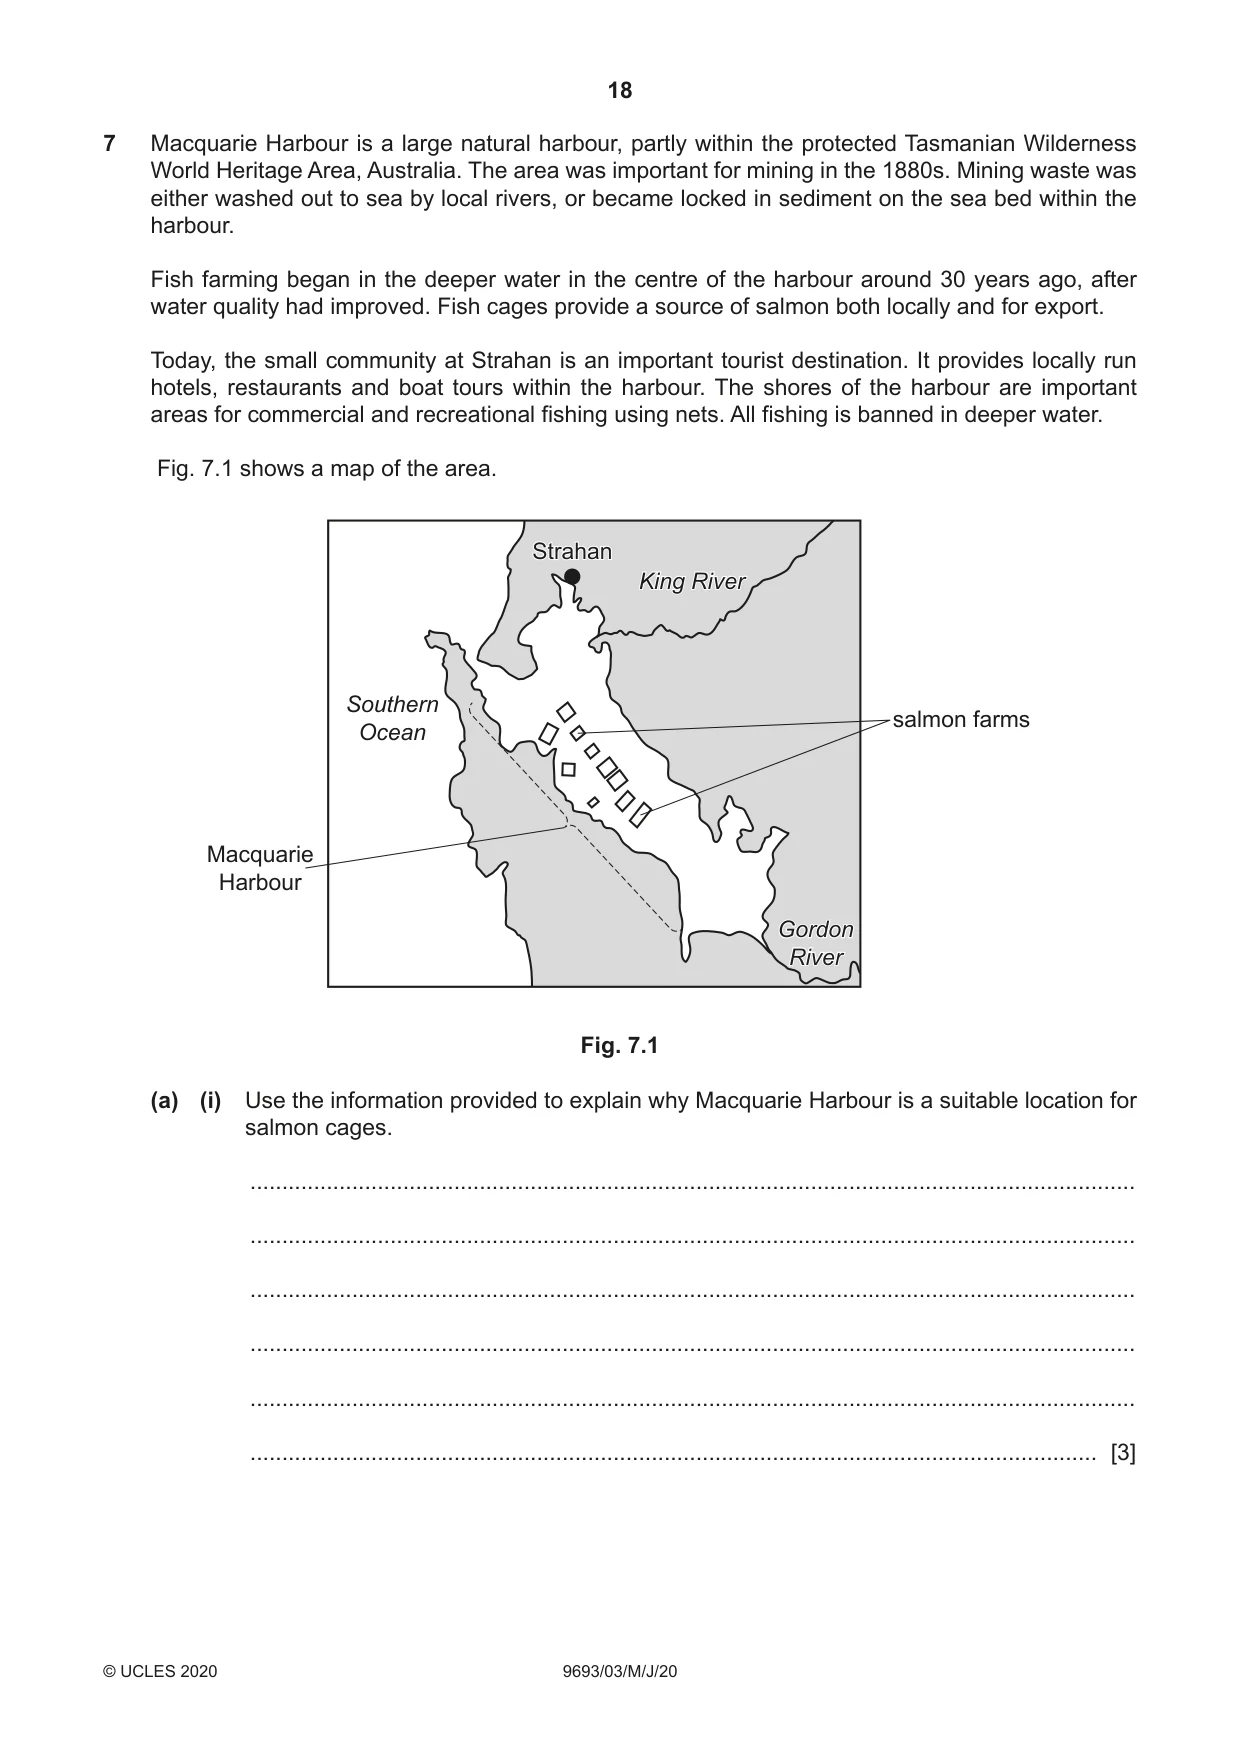
7 Macquarie Harbour is a large natural harbour, partly within the protected Tasmanian Wilderness World Heritage Area, Australia. The area was important for mining in the 1880s. Mining waste was either washed out to sea by local rivers, or became locked in sediment on the sea bed within the harbour. Fish farming began in the deeper water in the centre of the harbour around 30 years ago, after water quality had improved. Fish cages provide a source of salmon both locally and for export. Today, the small community at Strahan is an important tourist destination. It provides locally run hotels, restaurants and boat tours within the harbour. The shores of the harbour are important areas for commercial and recreational fishing using nets. All fishing is banned in deeper water. Fig. 7.1 shows a map of the area. Strahan King River Southern salmon farms Ocean Macquarie Harbour Gordon River Fig. 7.1 (a) (i) Use the information provided to explain why Macquarie Harbour is a suitable location for salmon cages. ........................................................................................................................................... ........................................................................................................................................... ........................................................................................................................................... ........................................................................................................................................... ........................................................................................................................................... ..................................................................................................................................... [3] (ii) Between 1990 and 2005 annual salmon production was less than 2000 tonnes. By 2011, production increased to 9000 tonnes and by 2015 it reached 20 000 tonnes. Water quality monitoring in the harbour since 2015 has shown a significant decrease in dissolved oxygen levels in deeper water, below 15 m depth. Explain how the increase in the number of salmon cages might have contributed to the decrease in dissolved oxygen levels. ........................................................................................................................................... ........................................................................................................................................... ........................................................................................................................................... ........................................................................................................................................... ........................................................................................................................................... ..................................................................................................................................... [3] (b) A meeting took place between the fish companies and other stakeholders to discuss a further increase in the number of salmon cages in the harbour. (i) State the meaning of the term stakeholder. ........................................................................................................................................... ..................................................................................................................................... [1] (ii) Conservationists may oppose the increase in the number of salmon cages in the harbour. Suggest one other stakeholder who would oppose this increase and give a reason for your answer. stakeholder ........................................................................................................................ reason ............................................................................................................................... ........................................................................................................................................... ........................................................................................................................................... [2] (c) The fish companies have suggested dredging the sediment beneath the fish cages to remove any pollutants and improve water quality. Use the information provided to suggest why this might not be a suitable solution. ................................................................................................................................................... ............................................................................................................................................. [1] (d) Macquarie Harbour is one of only two areas in Tasmania where the endangered Maugean skate is found. The adult lives in estuaries, in shallow water between 5 m and 10 m depth, around the shores of the harbour. It lays its eggs in deeper water, below 15 m depth, where juveniles are found. Suggest and explain why conservationists are concerned about the future of the Maugean skate in Macquarie Harbour. ................................................................................................................................................... ................................................................................................................................................... ................................................................................................................................................... ................................................................................................................................................... ................................................................................................................................................... ............................................................................................................................................. [3] [Total: 13]
What was in this paper
The subtopics covered by these 7 questions, and how many questions each got. Open one in a new tab to see every Cambridge question on it.