Cambridge A Level Marine Science 9693 — 2019 Oct/Nov Paper 3 · Variant 0
9693/30/O/N/19 · 7 questions · 75 marks · ≈84 min
The question paper and its mark scheme, free to read here and free to download. This is Cambridge’s own paper, exactly as it was sat.
Question paper20 pages



Mark scheme
No mark scheme is in the library for this paper.
Questions as text
Q1 · Phytoplankton are important primary producers in marine ecosystems
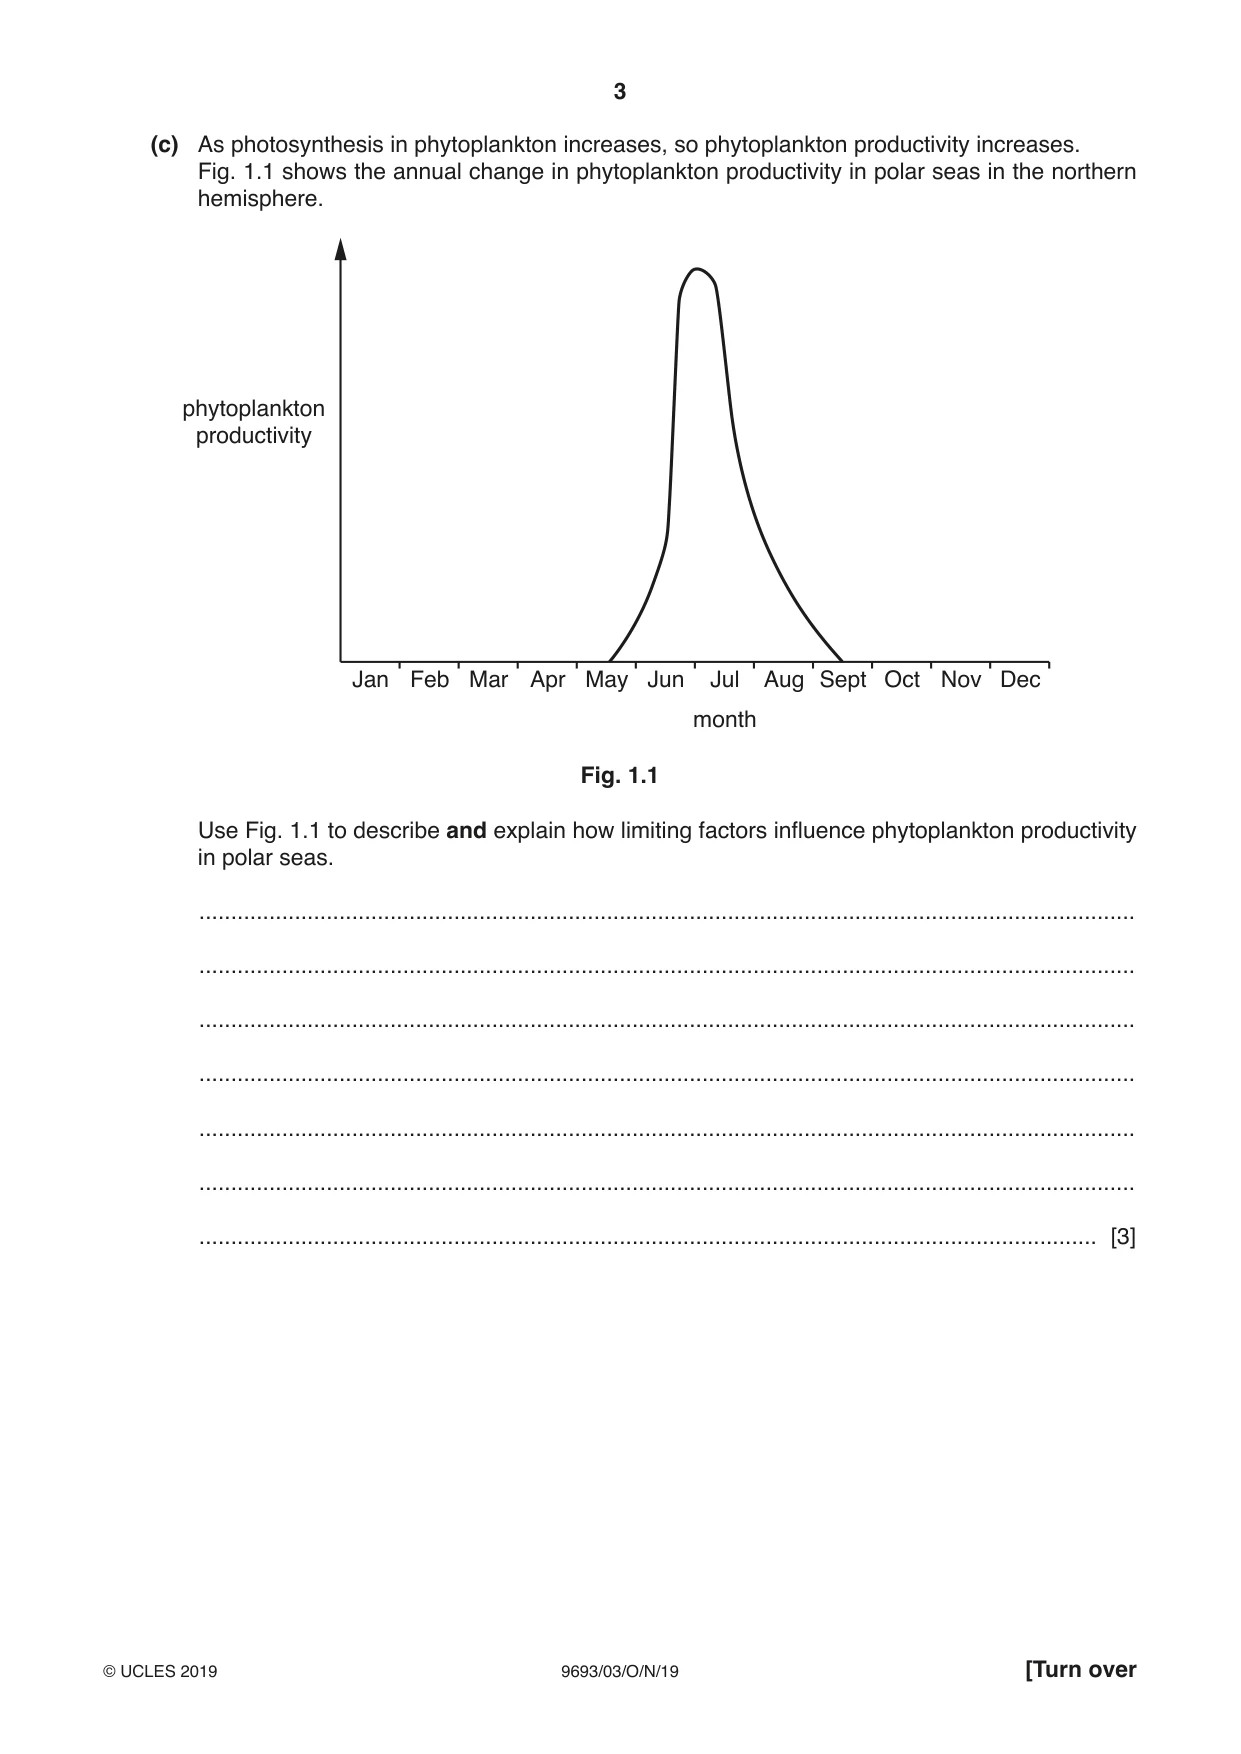
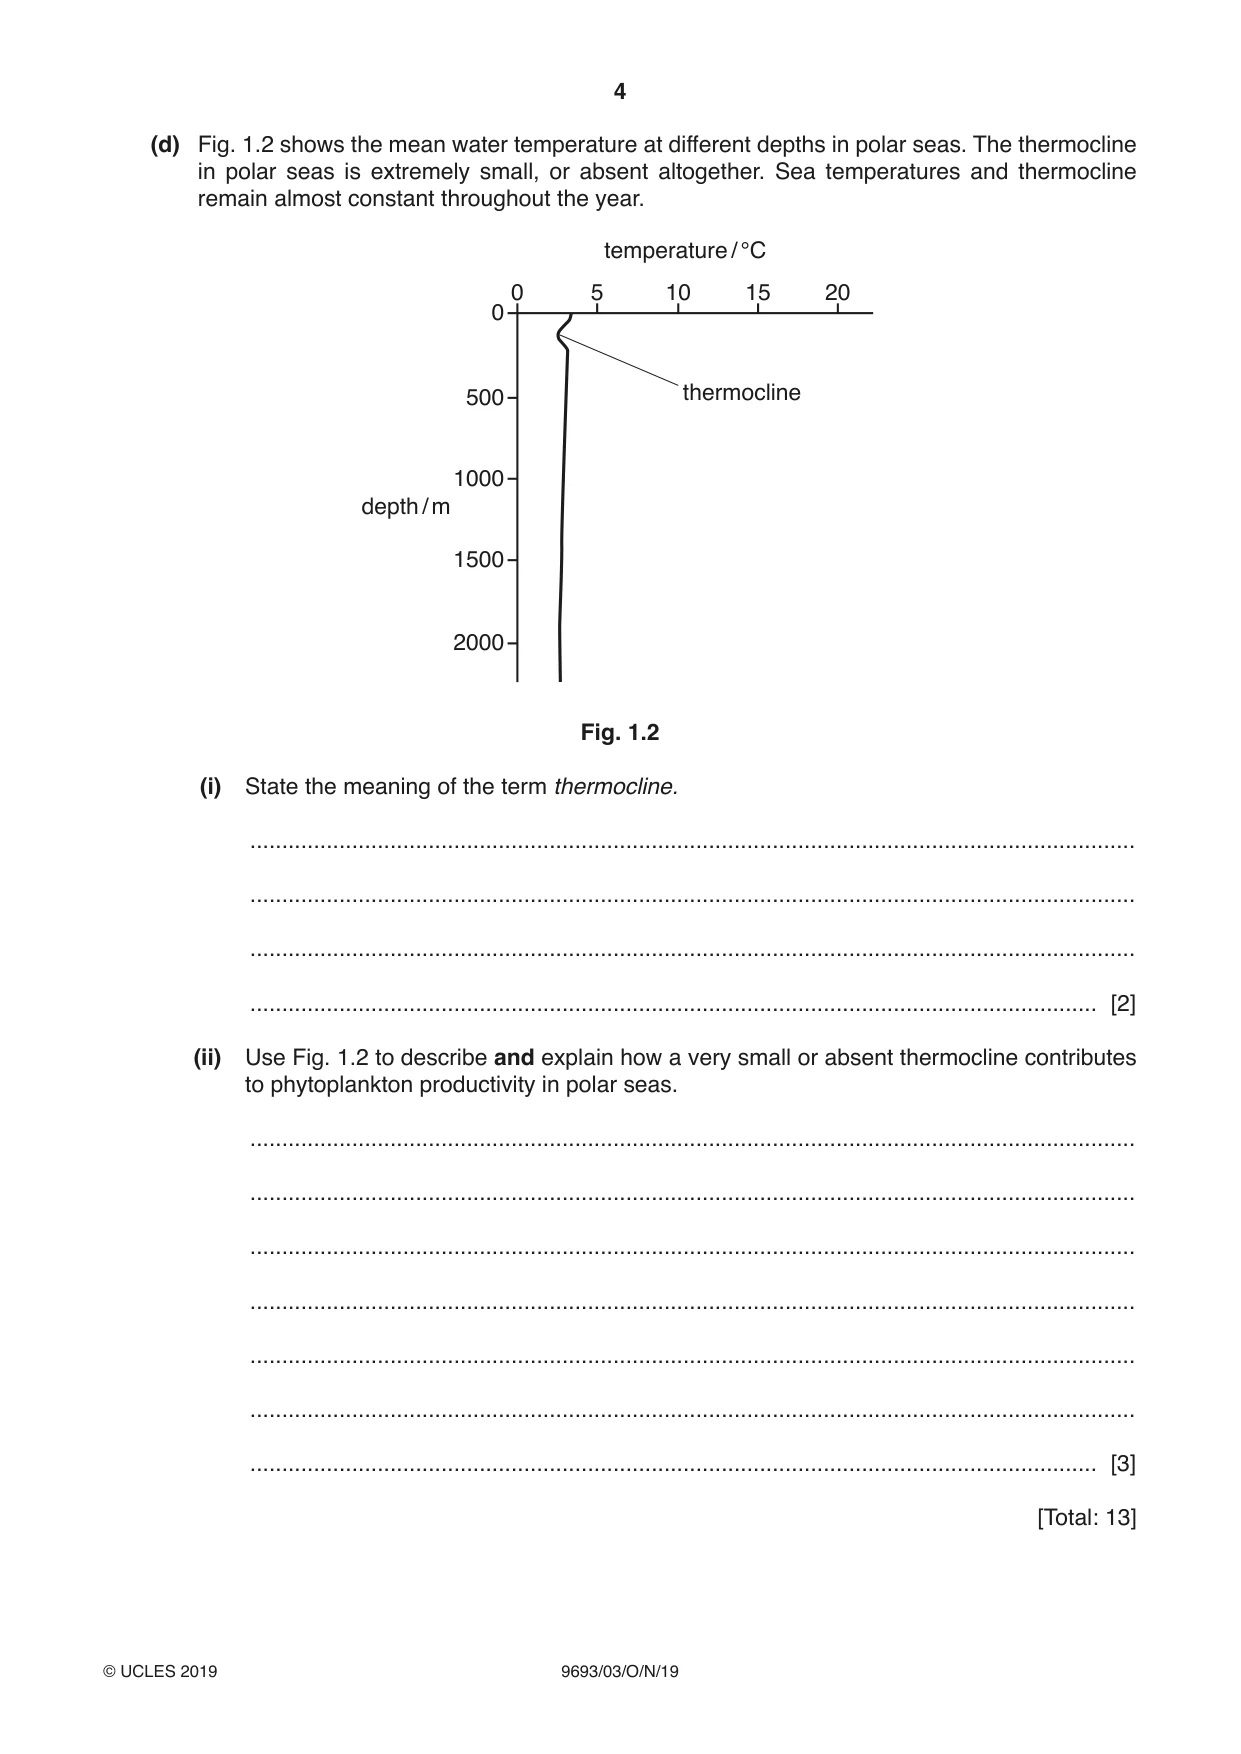
1 (a) (i) Phytoplankton are important primary producers in marine ecosystems. Name two examples of marine phytoplankton. 1 ........................................................................................................................................ 2 ........................................................................................................................................ [1] (ii) State the habitat of marine phytoplankton. ..................................................................................................................................... [1] (b) Primary producers are important in fixing carbon during photosynthesis. Describe how carbon is fixed during photosynthesis. ................................................................................................................................................... ................................................................................................................................................... ................................................................................................................................................... ................................................................................................................................................... ................................................................................................................................................... ................................................................................................................................................... ............................................................................................................................................. [3] (c) As photosynthesis in phytoplankton increases, so phytoplankton productivity increases. Fig. 1.1 shows the annual change in phytoplankton productivity in polar seas in the northern hemisphere. phytoplankton productivity Jan Feb Mar Apr May Jun Jul Aug Sept Oct Nov Dec month Fig. 1.1 Use Fig. 1.1 to describe and explain how limiting factors influence phytoplankton productivity in polar seas. ................................................................................................................................................... ................................................................................................................................................... ................................................................................................................................................... ................................................................................................................................................... ................................................................................................................................................... ................................................................................................................................................... ............................................................................................................................................. [3] (d) Fig. 1.2 shows the mean water temperature at different depths in polar seas. The thermocline in polar seas is extremely small, or absent altogether. Sea temperatures and thermocline remain almost constant throughout the year. temperature / °C 0 5 10 15 20 0 500 thermocline 1000 depth / m 1500 2000 Fig. 1.2 (i) State the meaning of the term thermocline. ........................................................................................................................................... ........................................................................................................................................... ........................................................................................................................................... ..................................................................................................................................... [2] (ii) Use Fig. 1.2 to describe and explain how a very small or absent thermocline contributes to phytoplankton productivity in polar seas. ........................................................................................................................................... ........................................................................................................................................... ........................................................................................................................................... ........................................................................................................................................... ........................................................................................................................................... ........................................................................................................................................... ..................................................................................................................................... [3] [Total: 13]
Q2 · Chinook salmon lay large eggs compared to other salmon species
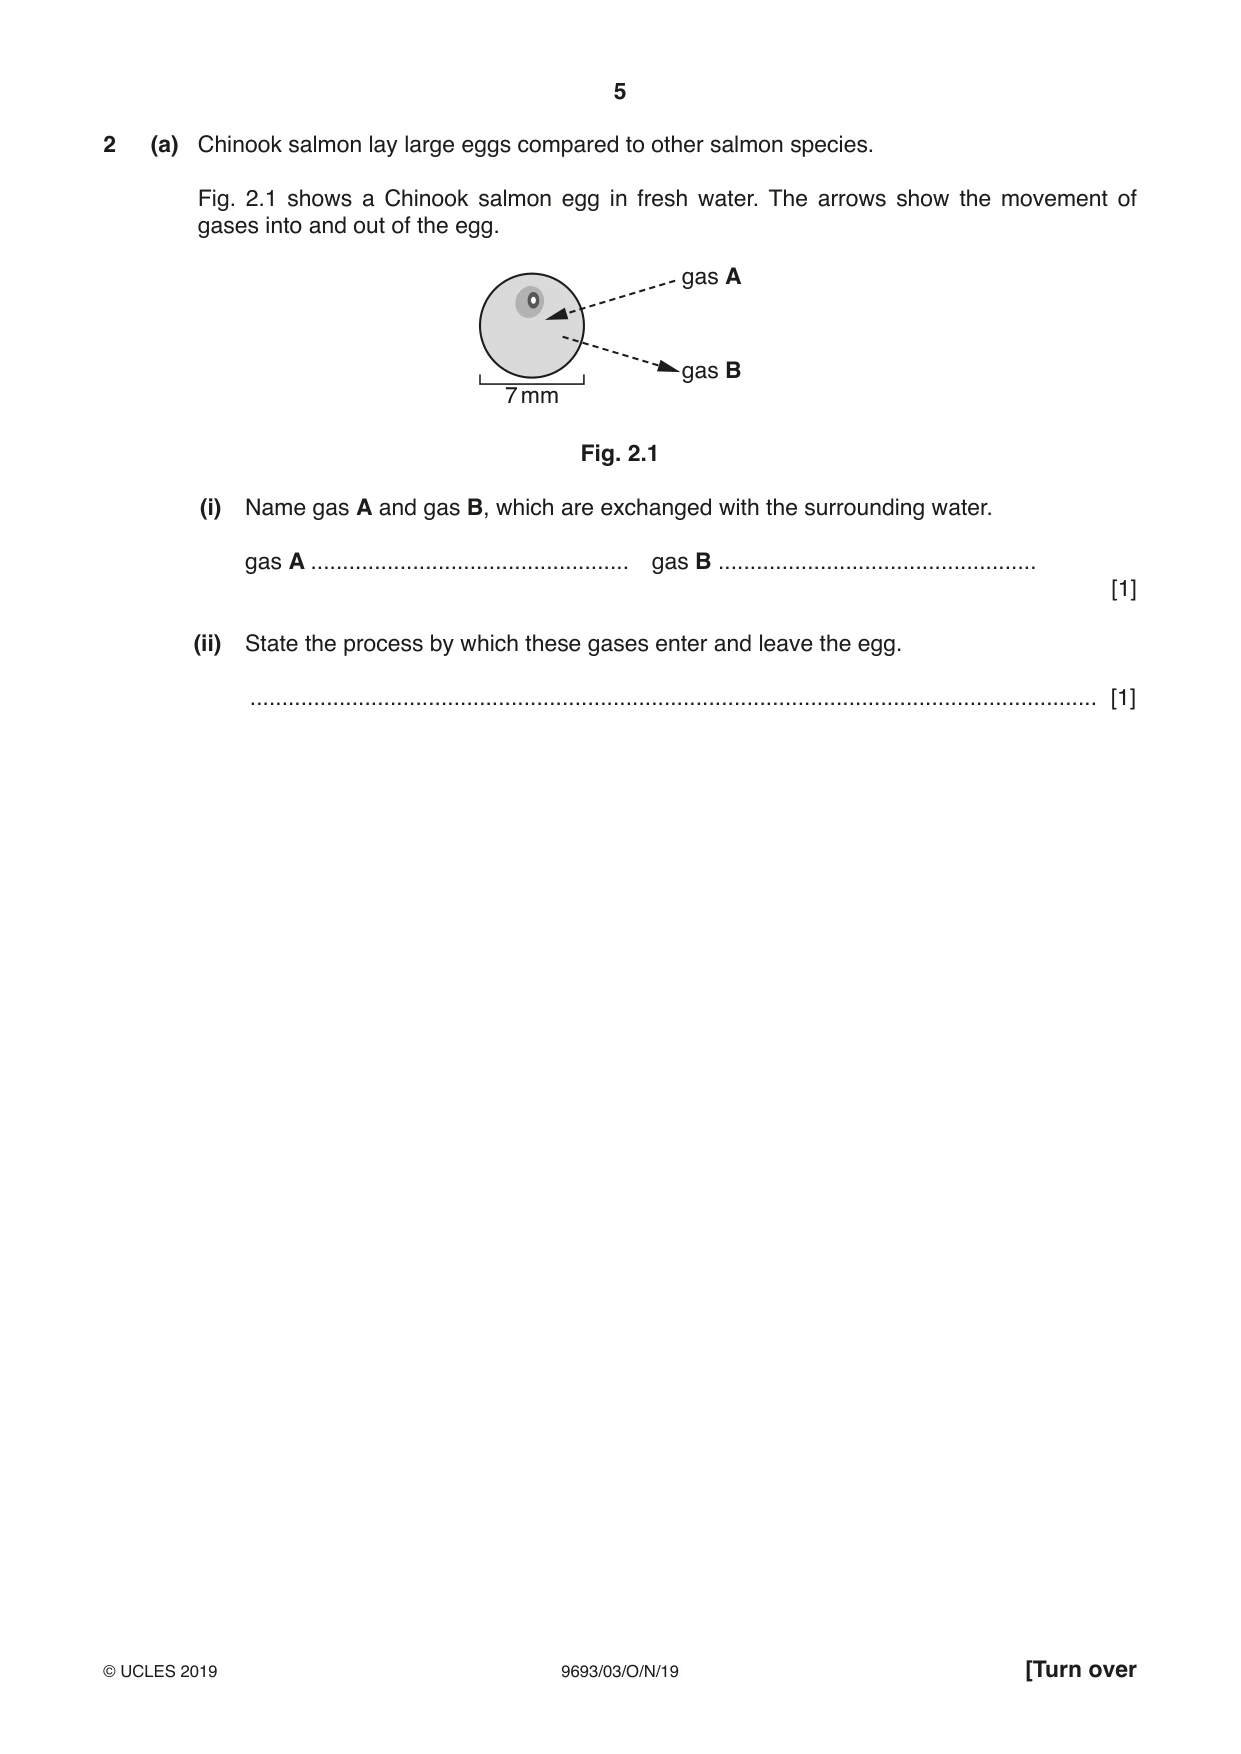
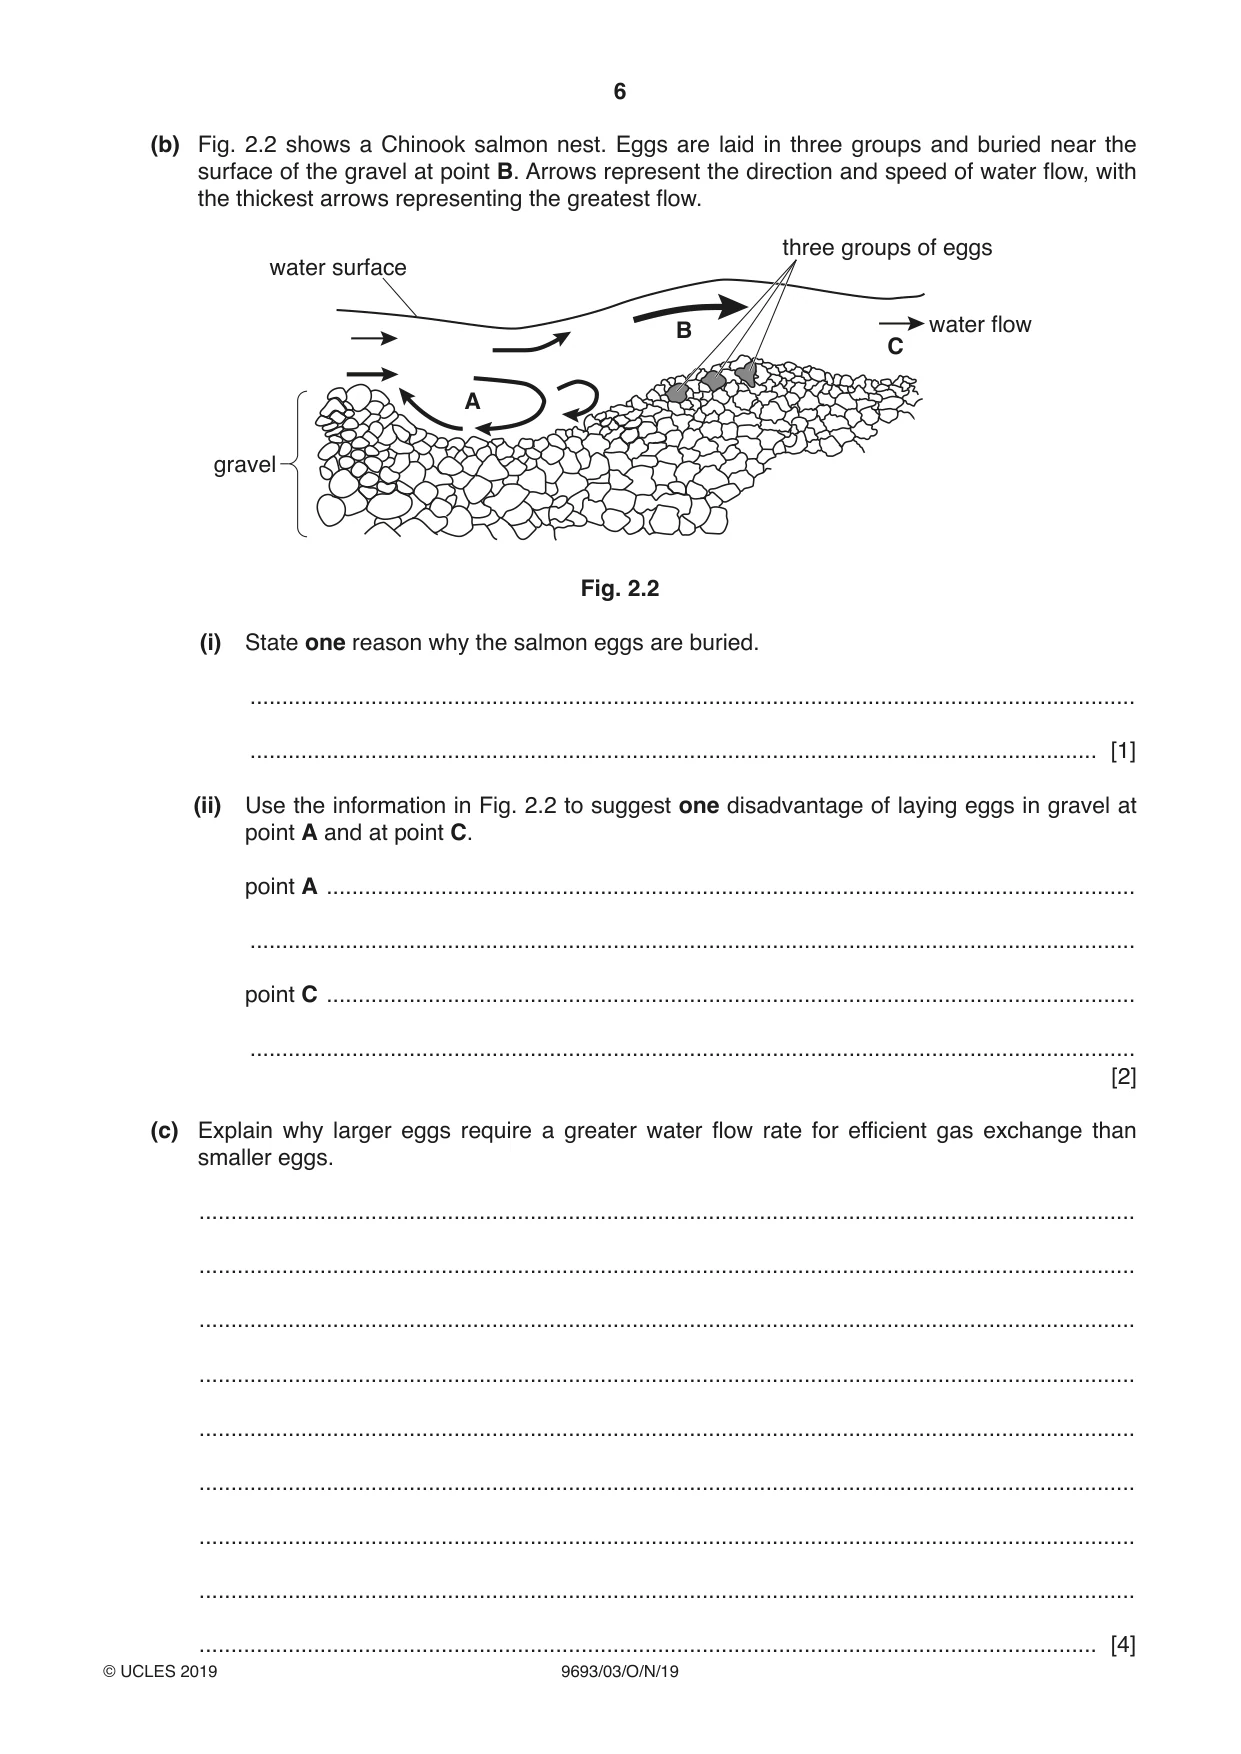
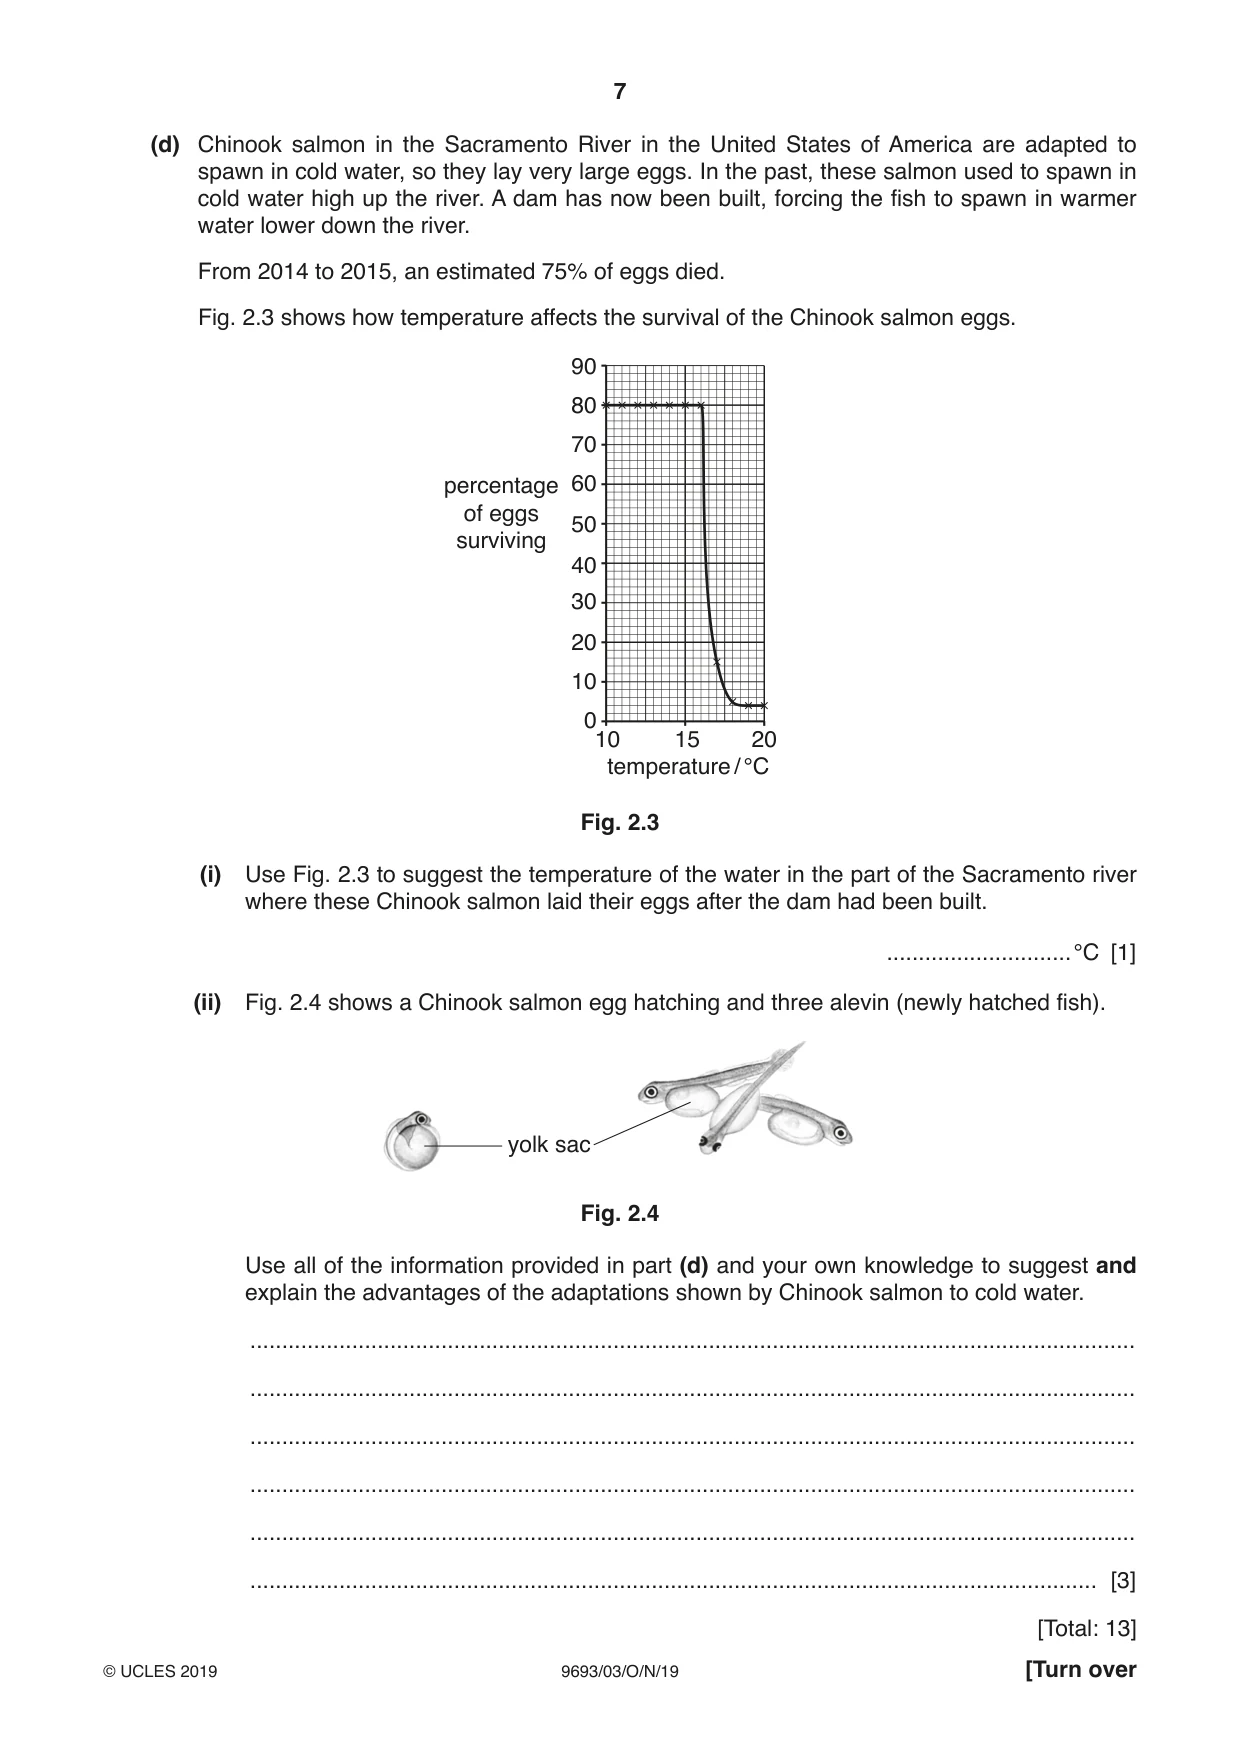
2 (a) Chinook salmon lay large eggs compared to other salmon species. Fig. 2.1 shows a Chinook salmon egg in fresh water. The arrows show the movement of gases into and out of the egg. gas A gas B 7 mm Fig. 2.1 (i) Name gas A and gas B, which are exchanged with the surrounding water. gas A .................................................. gas B .................................................. [1] (ii) State the process by which these gases enter and leave the egg. ..................................................................................................................................... [1] (b) Fig. 2.2 shows a Chinook salmon nest. Eggs are laid in three groups and buried near the surface of the gravel at point B. Arrows represent the direction and speed of water flow, with the thickest arrows representing the greatest flow. three groups of eggs water surface B water flow C A gravel Fig. 2.2 (i) State one reason why the salmon eggs are buried. ........................................................................................................................................... ..................................................................................................................................... [1] (ii) Use the information in Fig. 2.2 to suggest one disadvantage of laying eggs in gravel at point A and at point C. point A ............................................................................................................................... ........................................................................................................................................... point C ............................................................................................................................... ........................................................................................................................................... [2] (c) Explain why larger eggs require a greater water flow rate for efficient gas exchange than smaller eggs. ................................................................................................................................................... ................................................................................................................................................... ................................................................................................................................................... ................................................................................................................................................... ................................................................................................................................................... ................................................................................................................................................... ................................................................................................................................................... ................................................................................................................................................... (d) Chinook salmon in the Sacramento River in the United States of America are adapted to spawn in cold water, so they lay very large eggs. In the past, these salmon used to spawn in cold water high up the river. A dam has now been built, forcing the fish to spawn in warmer water lower down the river. From 2014 to 2015, an estimated 75% of eggs died. Fig. 2.3 shows how temperature affects the survival of the Chinook salmon eggs. 90 80 70 percentage 60 of eggs 50 surviving 40 30 20 10 0 10 15 20 temperature / °C Fig. 2.3 (i) Use Fig. 2.3 to suggest the temperature of the water in the part of the Sacramento river where these Chinook salmon laid their eggs after the dam had been built. .............................°C [1] (ii) Fig. 2.4 shows a Chinook salmon egg hatching and three alevin (newly hatched fish). yolk sac Fig. 2.4 Use all of the information provided in part (d) and your own knowledge to suggest and explain the advantages of the adaptations shown by Chinook salmon to cold water. ........................................................................................................................................... ........................................................................................................................................... ........................................................................................................................................... ........................................................................................................................................... ........................................................................................................................................... ..................................................................................................................................... [3] [Total: 13]
Q3 · Blue king crabs live in almost freezing water in the Bering Sea around Alaska
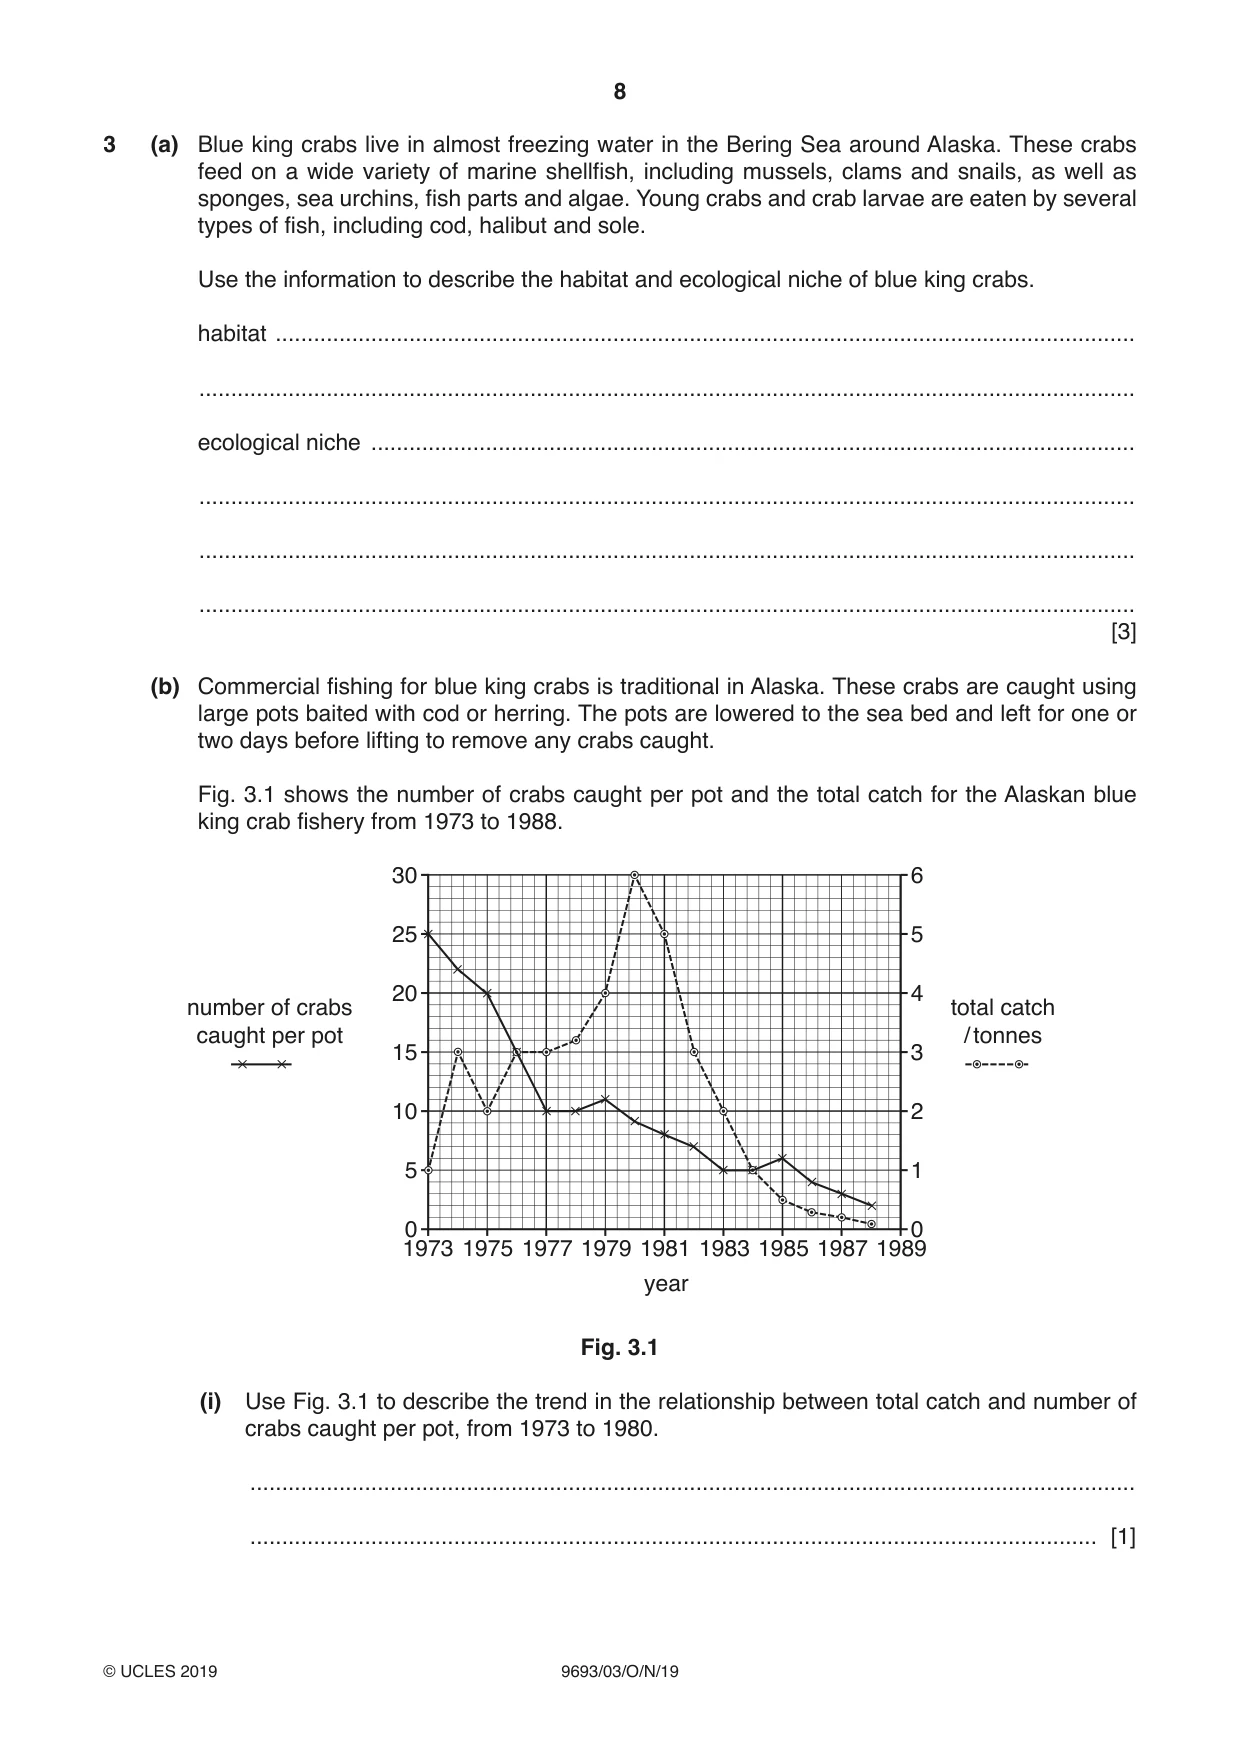
3 (a) Blue king crabs live in almost freezing water in the Bering Sea around Alaska. These crabs feed on a wide variety of marine shellfish, including mussels, clams and snails, as well as sponges, sea urchins, fish parts and algae. Young crabs and crab larvae are eaten by several types of fish, including cod, halibut and sole. Use the information to describe the habitat and ecological niche of blue king crabs. habitat ....................................................................................................................................... ................................................................................................................................................... ecological niche ........................................................................................................................ ................................................................................................................................................... ................................................................................................................................................... ................................................................................................................................................... [3] (b) Commercial fishing for blue king crabs is traditional in Alaska. These crabs are caught using large pots baited with cod or herring. The pots are lowered to the sea bed and left for one or two days before lifting to remove any crabs caught. Fig. 3.1 shows the number of crabs caught per pot and the total catch for the Alaskan blue king crab fishery from 1973 to 1988. 30 6 25 5 20 4 number of crabs total catch caught per pot / tonnes 15 3 10 2 5 1 0 0 1973 1975 1977 1979 1981 1983 1985 1987 1989 year Fig. 3.1 (i) Use Fig. 3.1 to describe the trend in the relationship between total catch and number of crabs caught per pot, from 1973 to 1980. ........................................................................................................................................... ..................................................................................................................................... [1] (ii) Suggest an explanation for this trend. ........................................................................................................................................... ........................................................................................................................................... ........................................................................................................................................... ..................................................................................................................................... [2] (iii) Suggest two explanations for the continuous fall in total catch after 1980. 1 ........................................................................................................................................ ........................................................................................................................................... ........................................................................................................................................... ........................................................................................................................................... 2 ........................................................................................................................................ ........................................................................................................................................... ........................................................................................................................................... ........................................................................................................................................... [4] [Total: 10]
Q4 · Read the information on prawn farming in the tidal delta region of Bangladesh
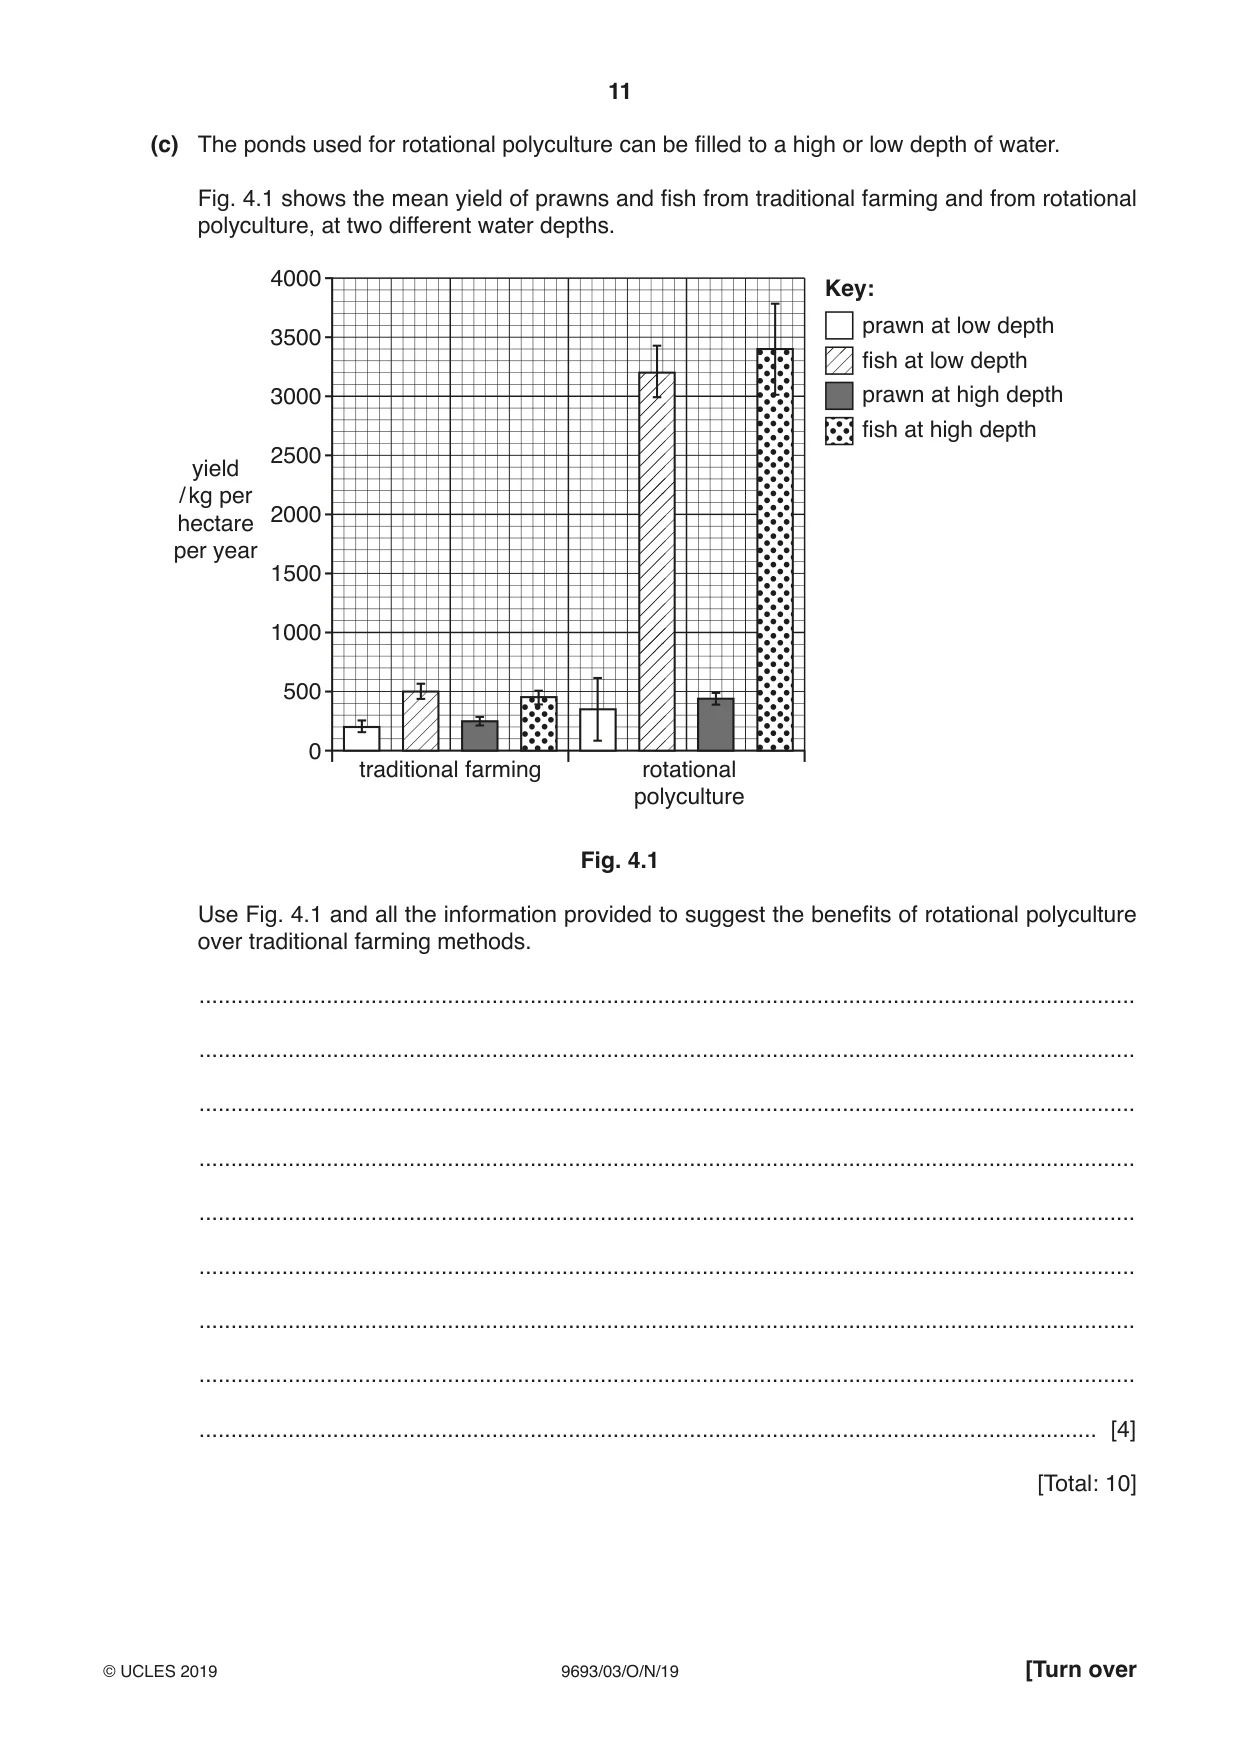
4 Read the information on prawn farming in the tidal delta region of Bangladesh. Traditional village communities in this region are self-sufficient, growing rice, fish and vegetables in fresh water ponds. The ponds are surrounded by earth banks to prevent sea water entry at high tide. A series of ditches and gates allows any excess fresh water to drain into the sea at low tide. Small scale salt water ponds produce prawns to sell. Over the past ten years, there has been a rapid change to higher income, prawn-only farming. Fresh water ponds were drained and flooded with salt water. In 2016, there were 35 000 prawn farms in the delta region. A consequence of this change is that the land becomes infertile and disease outbreaks in ponds are common. Recently, many village communities have experienced problems. The income from prawn farming has been much less than expected, as large companies who sell the prawns keep profits and pay less to the farmers. (a) Use the information provided to explain the negative impacts of the change to prawn-only farming on village communities. ................................................................................................................................................... ................................................................................................................................................... ................................................................................................................................................... ................................................................................................................................................... ................................................................................................................................................... ................................................................................................................................................... ............................................................................................................................................. [3] (b) Rotational polyculture is a method of growing prawns, rice and fresh water fish in the same ponds. The ponds are filled with salt water during the dry season, and used to produce prawns. In the monsoon season, the ponds are stocked with rice and fresh water fish such as tilapia. Suggest how the monsoon and design of the ponds can help to make the ponds suitable for growing rice and fresh water fish during the monsoon season. ................................................................................................................................................... ................................................................................................................................................... ................................................................................................................................................... ................................................................................................................................................... ................................................................................................................................................... ................................................................................................................................................... ............................................................................................................................................. [3] (c) The ponds used for rotational polyculture can be filled to a high or low depth of water. Fig. 4.1 shows the mean yield of prawns and fish from traditional farming and from rotational polyculture, at two different water depths. 4000 Key: prawn at low depth 3500 fish at low depth 3000 prawn at high depth fish at high depth 2500 yield / kg per 2000 hectare per year 1500 1000 500 0 traditional farming rotational polyculture Fig. 4.1 Use Fig. 4.1 and all the information provided to suggest the benefits of rotational polyculture over traditional farming methods. ................................................................................................................................................... ................................................................................................................................................... ................................................................................................................................................... ................................................................................................................................................... ................................................................................................................................................... ................................................................................................................................................... ................................................................................................................................................... ................................................................................................................................................... ............................................................................................................................................. [4] [Total: 10]
Q5 · Antifouling paint such as TBT (tributyltin) was developed to kill marine organisms such…
5 Antifouling paint such as TBT (tributyltin) was developed to kill marine organisms such as barnacles and algae that attach to the bottom of boats. (a) Suggest why it is necessary to prevent the attachment of marine organisms to the bottom of boats. ................................................................................................................................................... ................................................................................................................................................... ................................................................................................................................................... ............................................................................................................................................. [2] (b) TBT was used in antifouling paint from the 1960s until 2001. Applying TBT to boats was then banned because of its effect on the marine environment. In 2008 all boats with this type of antifouling paint were required under international law to replace it with another type of antifouling paint. The problems associated with TBT include: • It interferes with the development of mussels and oysters, causing females to develop male characteristics (imposex). • High levels of TBT have been found in tuna and dolphins as a result of bioaccumulation. • It gradually dissolves in the water and eventually binds to sediments on the sea bed. • It takes up to two years to decompose into less harmful chemicals and may be bound in sediments for up to 30 years before being released. (i) The oyster harvest in Arcachon Bay on the coast of France decreased from 15 000 tonnes per year in the mid-1970s to 3000 tonnes in 1981. Explain how the use of TBT caused this decrease. ........................................................................................................................................... ........................................................................................................................................... ........................................................................................................................................... ..................................................................................................................................... [2] (ii) Describe how bioaccumulation could lead to high levels of TBT in tuna and dolphins. ........................................................................................................................................... ........................................................................................................................................... ........................................................................................................................................... ........................................................................................................................................... ........................................................................................................................................... ........................................................................................................................................... ..................................................................................................................................... [3] (iii) Explain why the presence of TBT in the marine environment is still a problem, even though its use is banned by international law. ........................................................................................................................................... ........................................................................................................................................... ........................................................................................................................................... ..................................................................................................................................... [2] [Total: 9]
Q6 · Read the descriptions about some resorts in Central America which are marketed as…
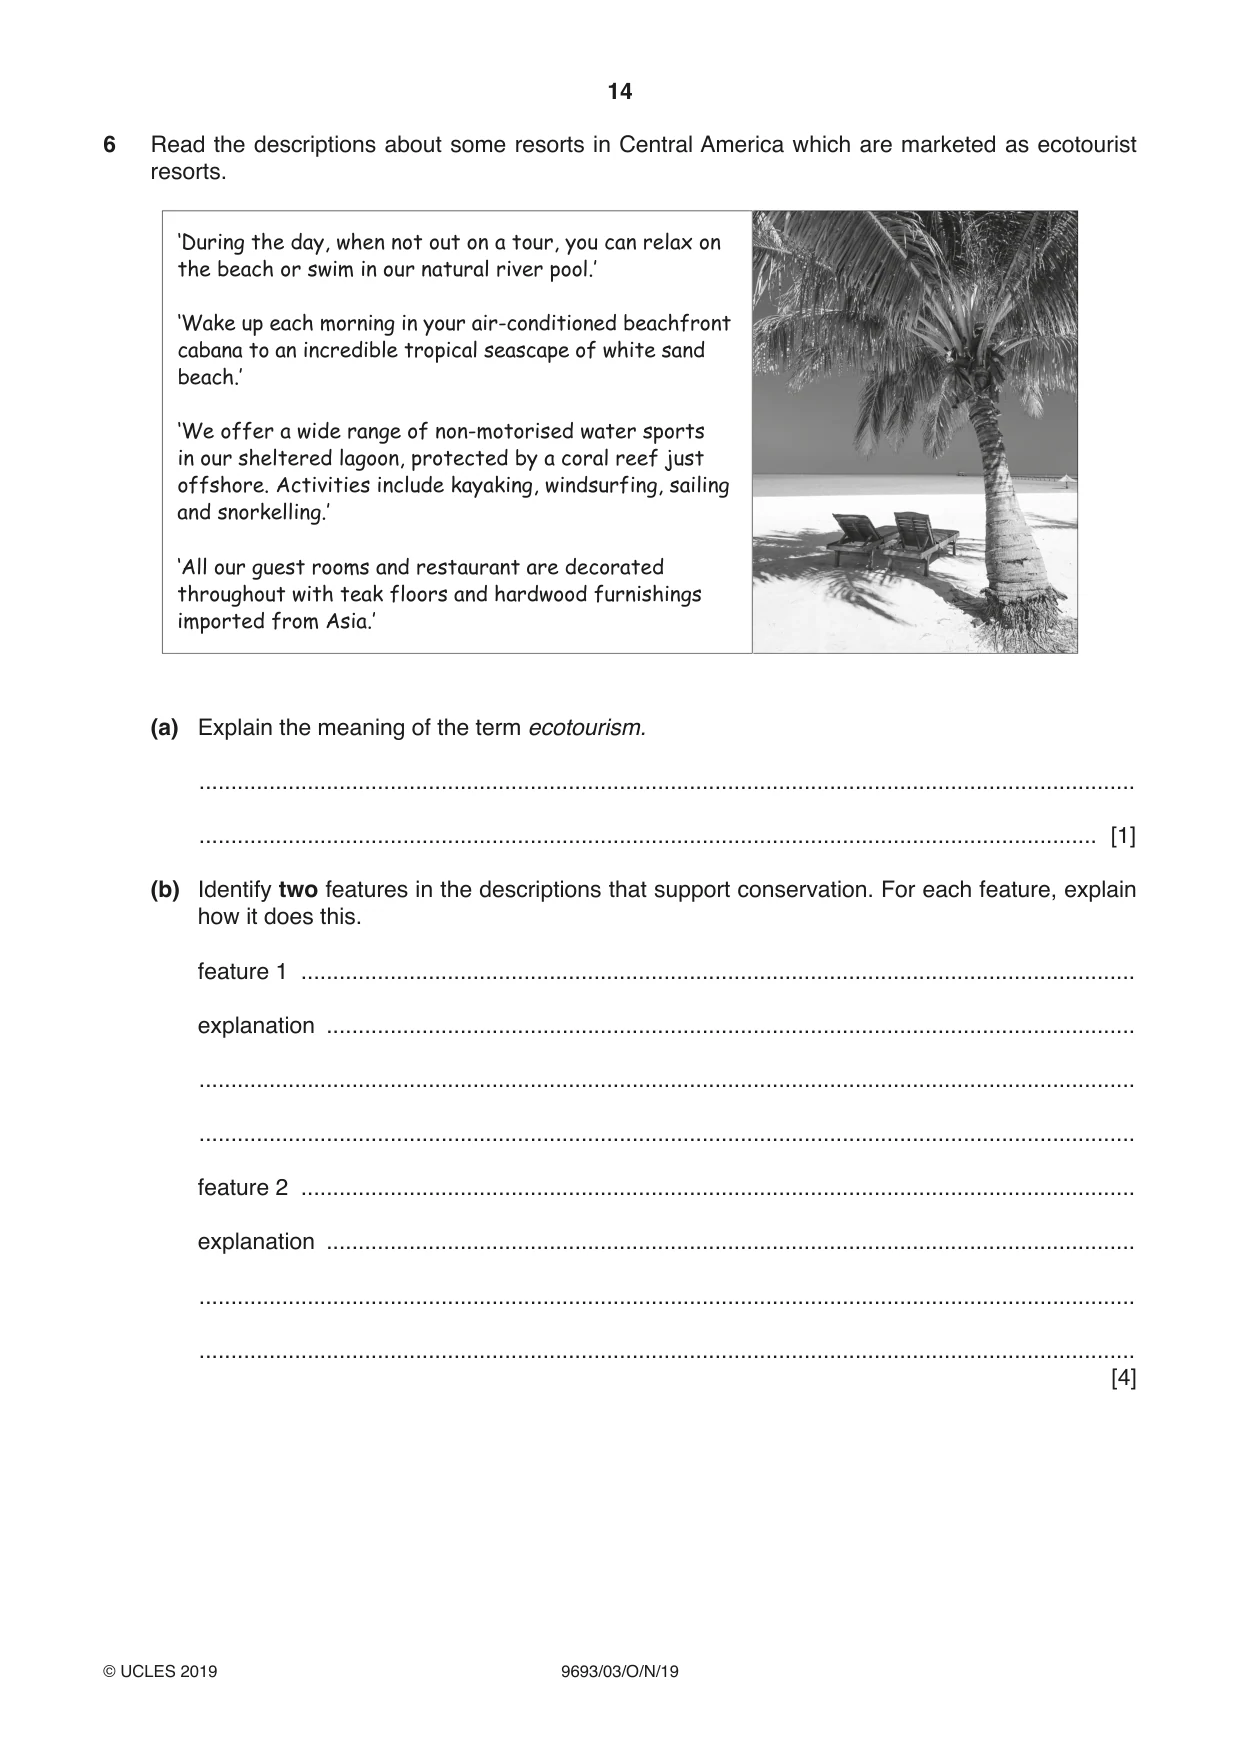
6 Read the descriptions about some resorts in Central America which are marketed as ecotourist resorts. ‘During the day, when not out on a tour, you can relax on the beach or swim in our natural river pool.’ ‘Wake up each morning in your air-conditioned beachfront cabana to an incredible tropical seascape of white sand beach.’ ‘We offer a wide range of non-motorised water sports in our sheltered lagoon, protected by a coral reef just offshore. Activities include kayaking, windsurfing, sailing and snorkelling.’ ‘All our guest rooms and restaurant are decorated throughout with teak floors and hardwood furnishings imported from Asia.’ (a) Explain the meaning of the term ecotourism. ................................................................................................................................................... ............................................................................................................................................. [1] (b) Identify two features in the descriptions that support conservation. For each feature, explain how it does this. feature 1 ................................................................................................................................... explanation ............................................................................................................................... ................................................................................................................................................... ................................................................................................................................................... feature 2 ................................................................................................................................... explanation ............................................................................................................................... ................................................................................................................................................... ................................................................................................................................................... [4] (c) Identify two features in the descriptions that undermine conservation. For each feature, suggest a suitable improvement. feature 1 ................................................................................................................................... improvement ............................................................................................................................. ................................................................................................................................................... ................................................................................................................................................... feature 2 ................................................................................................................................... improvement ............................................................................................................................. ................................................................................................................................................... ................................................................................................................................................... [4] [Total: 9]
Q7 · Explain the meaning of the term selective breeding
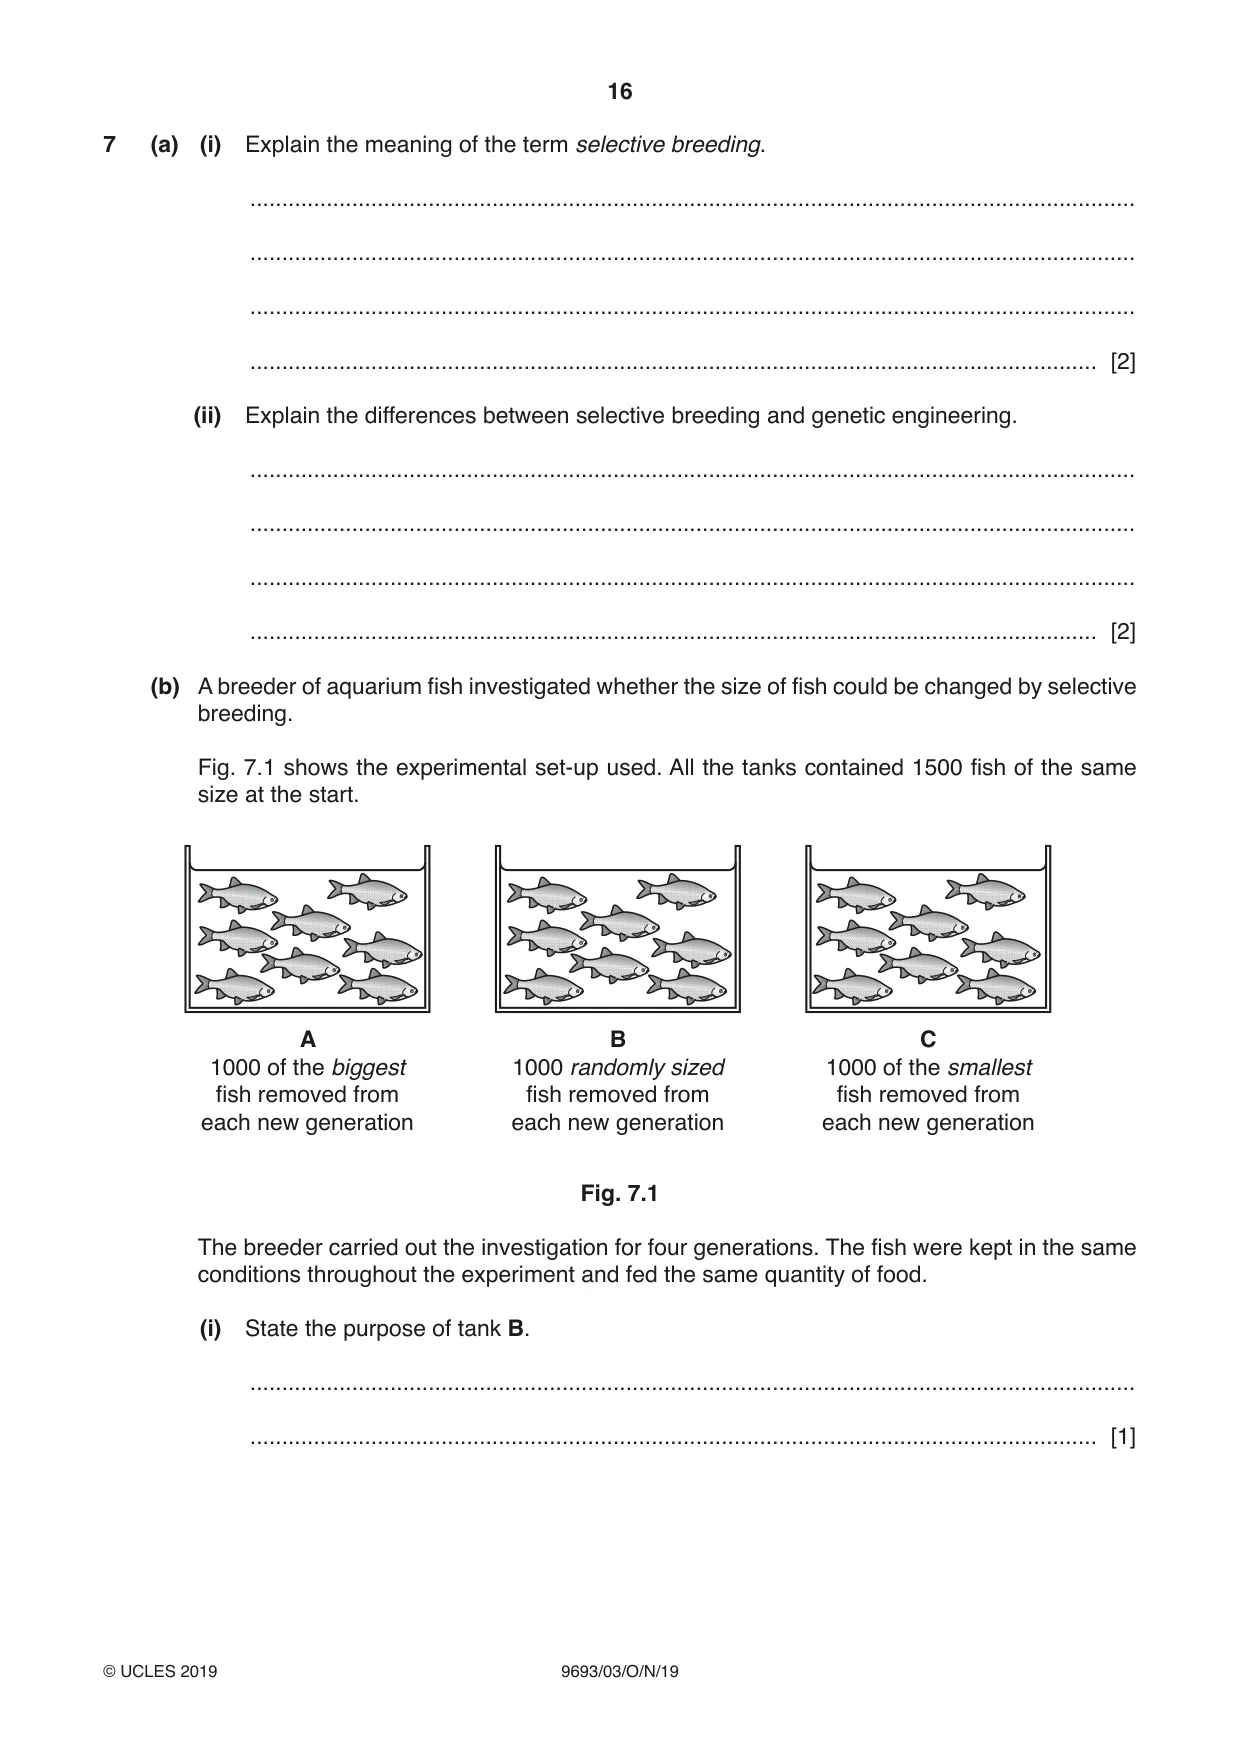
7 (a) (i) Explain the meaning of the term selective breeding. ........................................................................................................................................... ........................................................................................................................................... ........................................................................................................................................... ..................................................................................................................................... [2] (ii) Explain the differences between selective breeding and genetic engineering. ........................................................................................................................................... ........................................................................................................................................... ........................................................................................................................................... ..................................................................................................................................... [2] (b) A breeder of aquarium fish investigated whether the size of fish could be changed by selective breeding. Fig. 7.1 shows the experimental set-up used. All the tanks contained 1500 fish of the same size at the start. A B C 1000 of the biggest 1000 randomly sized 1000 of the smallest fish removed from fish removed from fish removed from each new generation each new generation each new generation Fig. 7.1 The breeder carried out the investigation for four generations. The fish were kept in the same conditions throughout the experiment and fed the same quantity of food. (i) State the purpose of tank B. ........................................................................................................................................... ..................................................................................................................................... [1] (ii) After four generations, the mean size of the fish in tank A had decreased. Suggest an explanation for this. ........................................................................................................................................... ........................................................................................................................................... ........................................................................................................................................... ..................................................................................................................................... [2] (iii) Based on the results of tank A, predict what will happen to the size of the fish in tank C. ........................................................................................................................................... ..................................................................................................................................... [1] (c) Selective breeding of rice fish produced a variety of colours. These are popular as aquarium fish, as they are easy to keep and breed quickly. In Japan, these fish have been genetically engineered. A gene from a jellyfish has been added so that they glow against a dark background. These have been approved for sale, under licence, as pet fish. (i) Genetic engineering in fish often needs a promoter gene to be joined to the required gene. State why this is necessary. ........................................................................................................................................... ..................................................................................................................................... [1] (ii) Suggest one advantage and one disadvantage to commercial fish breeders of these genetically engineered fish. advantage ......................................................................................................................... ........................................................................................................................................... disadvantage ..................................................................................................................... ........................................................................................................................................... [2] [Total: 11]
What was in this paper
The subtopics covered by these 7 questions, and how many questions each got. Open one in a new tab to see every Cambridge question on it.