Cambridge A Level Marine Science 9693 — 2018 Oct/Nov Paper 3 · Variant 0
9693/30/O/N/18 · 7 questions · 75 marks · ≈84 min
The question paper and its mark scheme, free to read here and free to download. This is Cambridge’s own paper, exactly as it was sat.
Question paper20 pages



Mark scheme
No mark scheme is in the library for this paper.
Questions as text
Q1 · Describe how light is used in photosynthesis
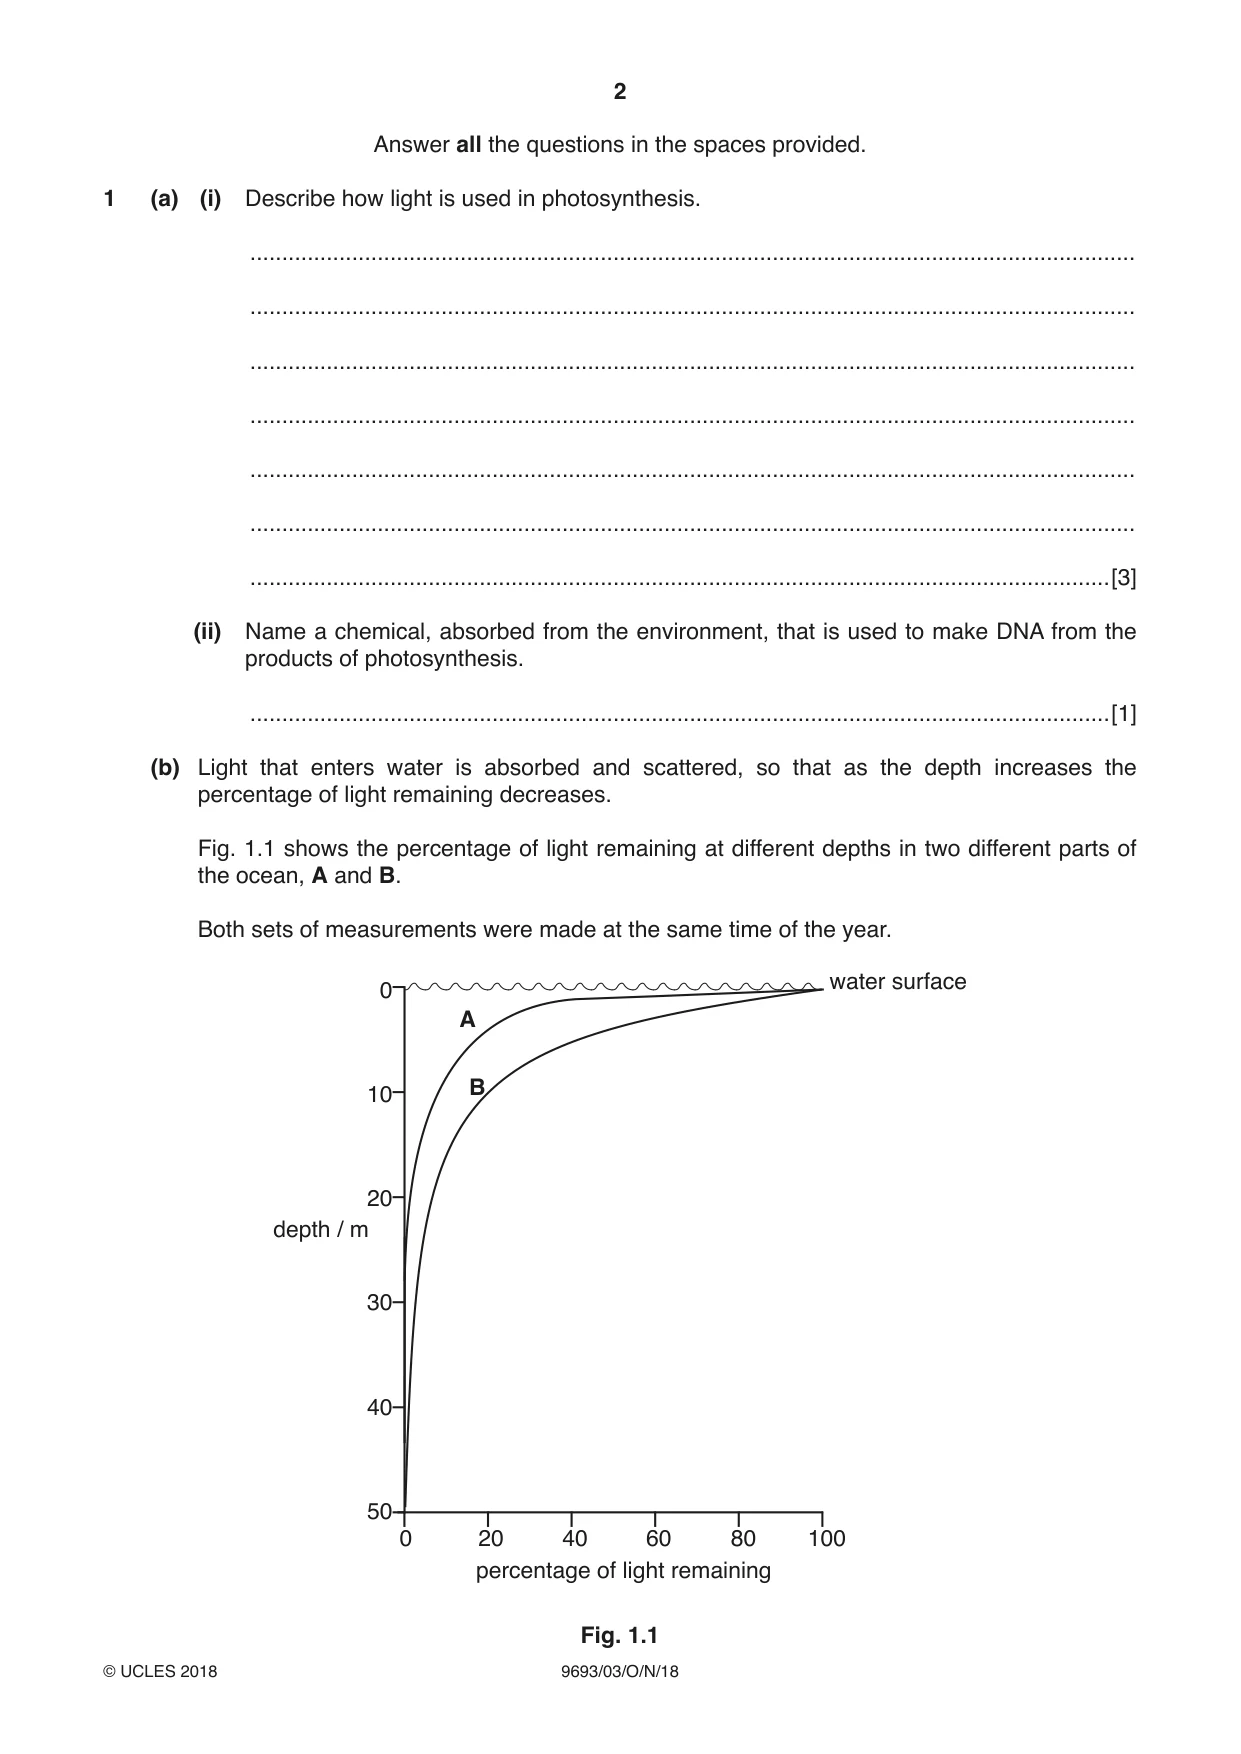
1 (a) (i) Describe how light is used in photosynthesis. ........................................................................................................................................... ........................................................................................................................................... ........................................................................................................................................... ........................................................................................................................................... ........................................................................................................................................... ........................................................................................................................................... .......................................................................................................................................[3] (ii) Name a chemical, absorbed from the environment, that is used to make DNA from the products of photosynthesis. .......................................................................................................................................[1] (b) Light that enters water is absorbed and scattered, so that as the depth increases the percentage of light remaining decreases. Fig. 1.1 shows the percentage of light remaining at different depths in two different parts of the ocean, A and B. Both sets of measurements were made at the same time of the year. water surface 0 A B 10 20 depth / m 30 40 50 0 20 40 60 80 100 percentage of light remaining Fig. 1.1 (i) Suggest why the percentage of light remaining at 20 m in part A differs from part B. ........................................................................................................................................... ........................................................................................................................................... ........................................................................................................................................... ........................................................................................................................................... .......................................................................................................................................[2] (ii) Use the information in Fig. 1.1 to explain why productivity in part A might be lower than in part B. ........................................................................................................................................... ........................................................................................................................................... ........................................................................................................................................... ........................................................................................................................................... ........................................................................................................................................... ........................................................................................................................................... ........................................................................................................................................... ........................................................................................................................................... .......................................................................................................................................[4] [Total: 10]
Q2 · Respiration is a process common to all marine animals and plants
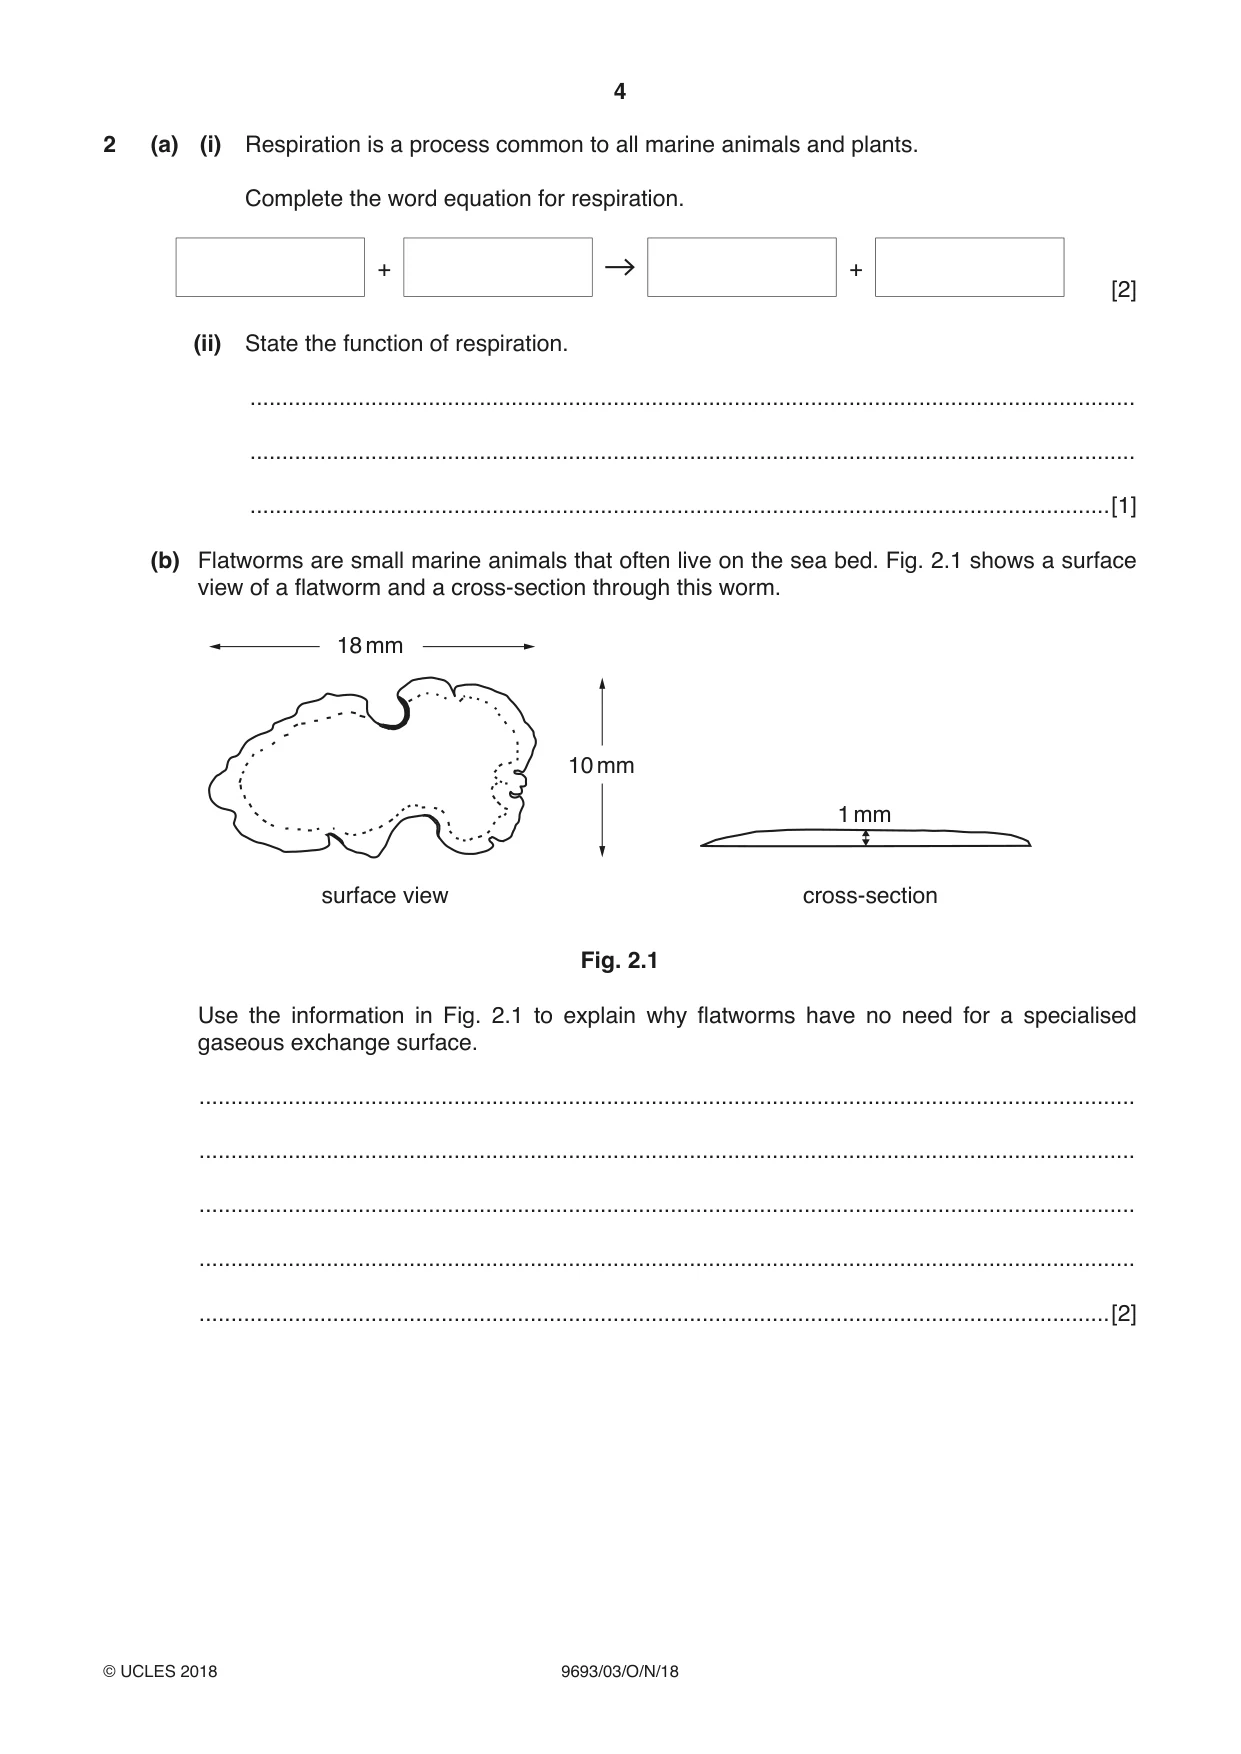
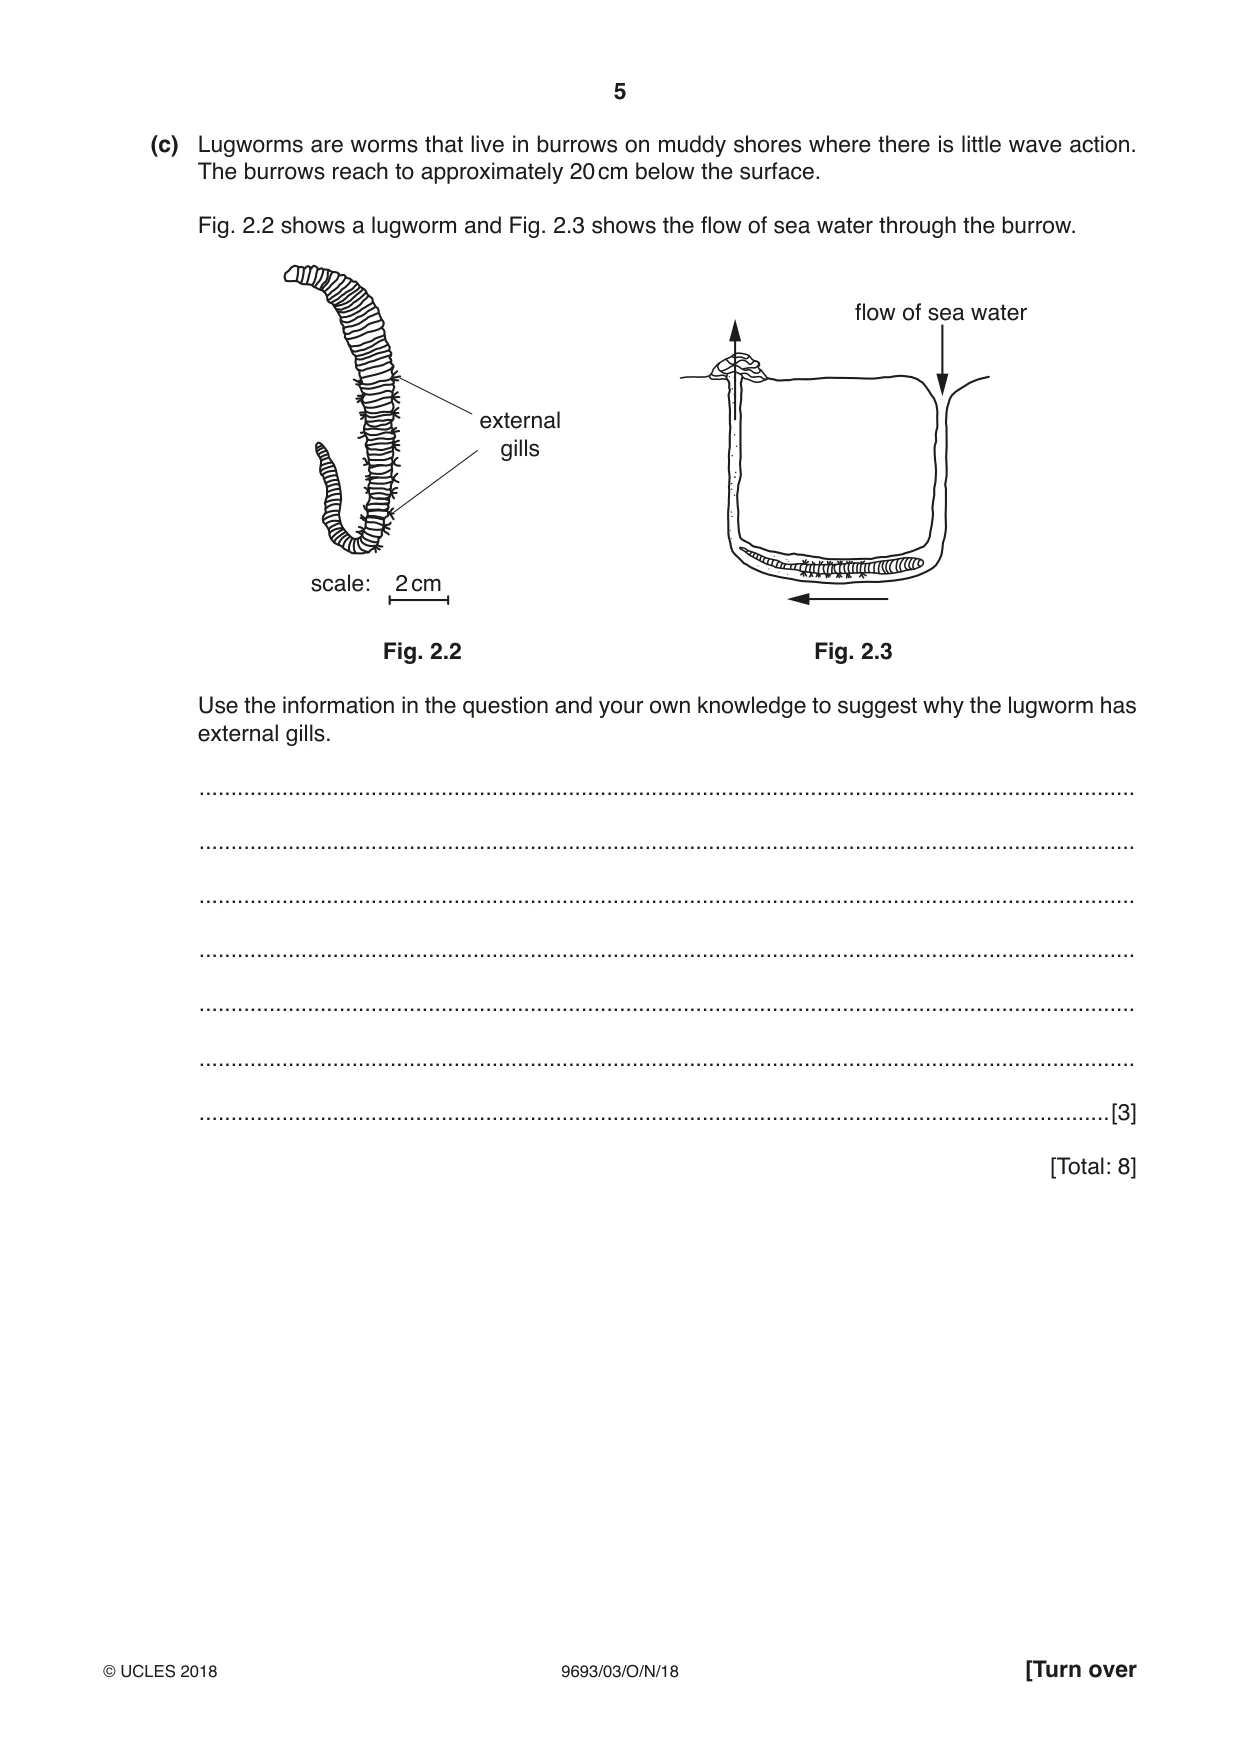
2 (a) (i) Respiration is a process common to all marine animals and plants. Complete the word equation for respiration. + + [2] (ii) State the function of respiration. ........................................................................................................................................... ........................................................................................................................................... .......................................................................................................................................[1] (b) Flatworms are small marine animals that often live on the sea bed. Fig. 2.1 shows a surface view of a flatworm and a cross‑section through this worm. 18 mm 10 mm 1 mm surface view cross-section Fig. 2.1 Use the information in Fig. 2.1 to explain why flatworms have no need for a specialised gaseous exchange surface. ................................................................................................................................................... ................................................................................................................................................... ................................................................................................................................................... ................................................................................................................................................... ...............................................................................................................................................[2] (c) Lugworms are worms that live in burrows on muddy shores where there is little wave action. The burrows reach to approximately 20 cm below the surface. Fig. 2.2 shows a lugworm and Fig. 2.3 shows the flow of sea water through the burrow. flow of sea water external gills scale: 2 cm Fig. 2.2 Fig. 2.3 Use the information in the question and your own knowledge to suggest why the lugworm has external gills. ................................................................................................................................................... ................................................................................................................................................... ................................................................................................................................................... ................................................................................................................................................... ................................................................................................................................................... ................................................................................................................................................... ...............................................................................................................................................[3] [Total: 8]
Q3 · Some of the stages in the life cycle of oysters
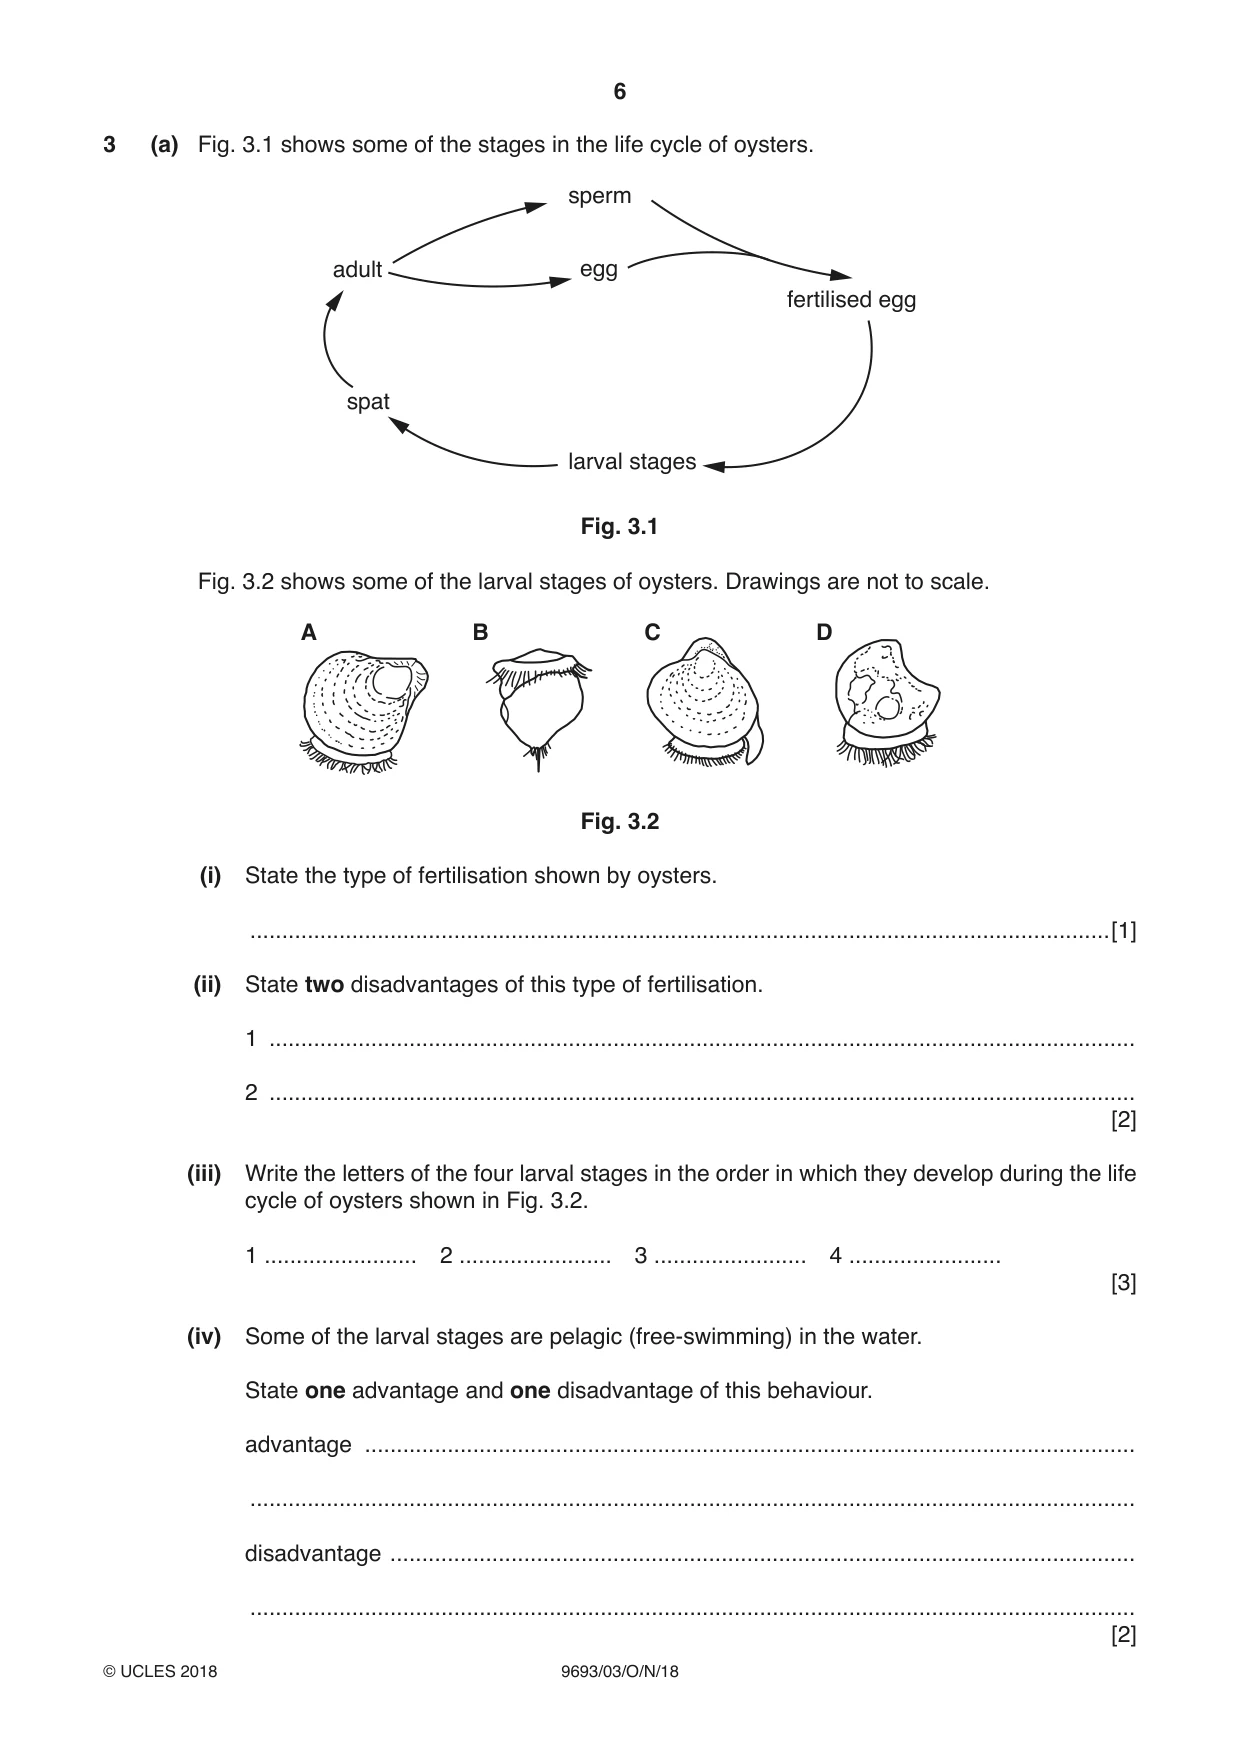
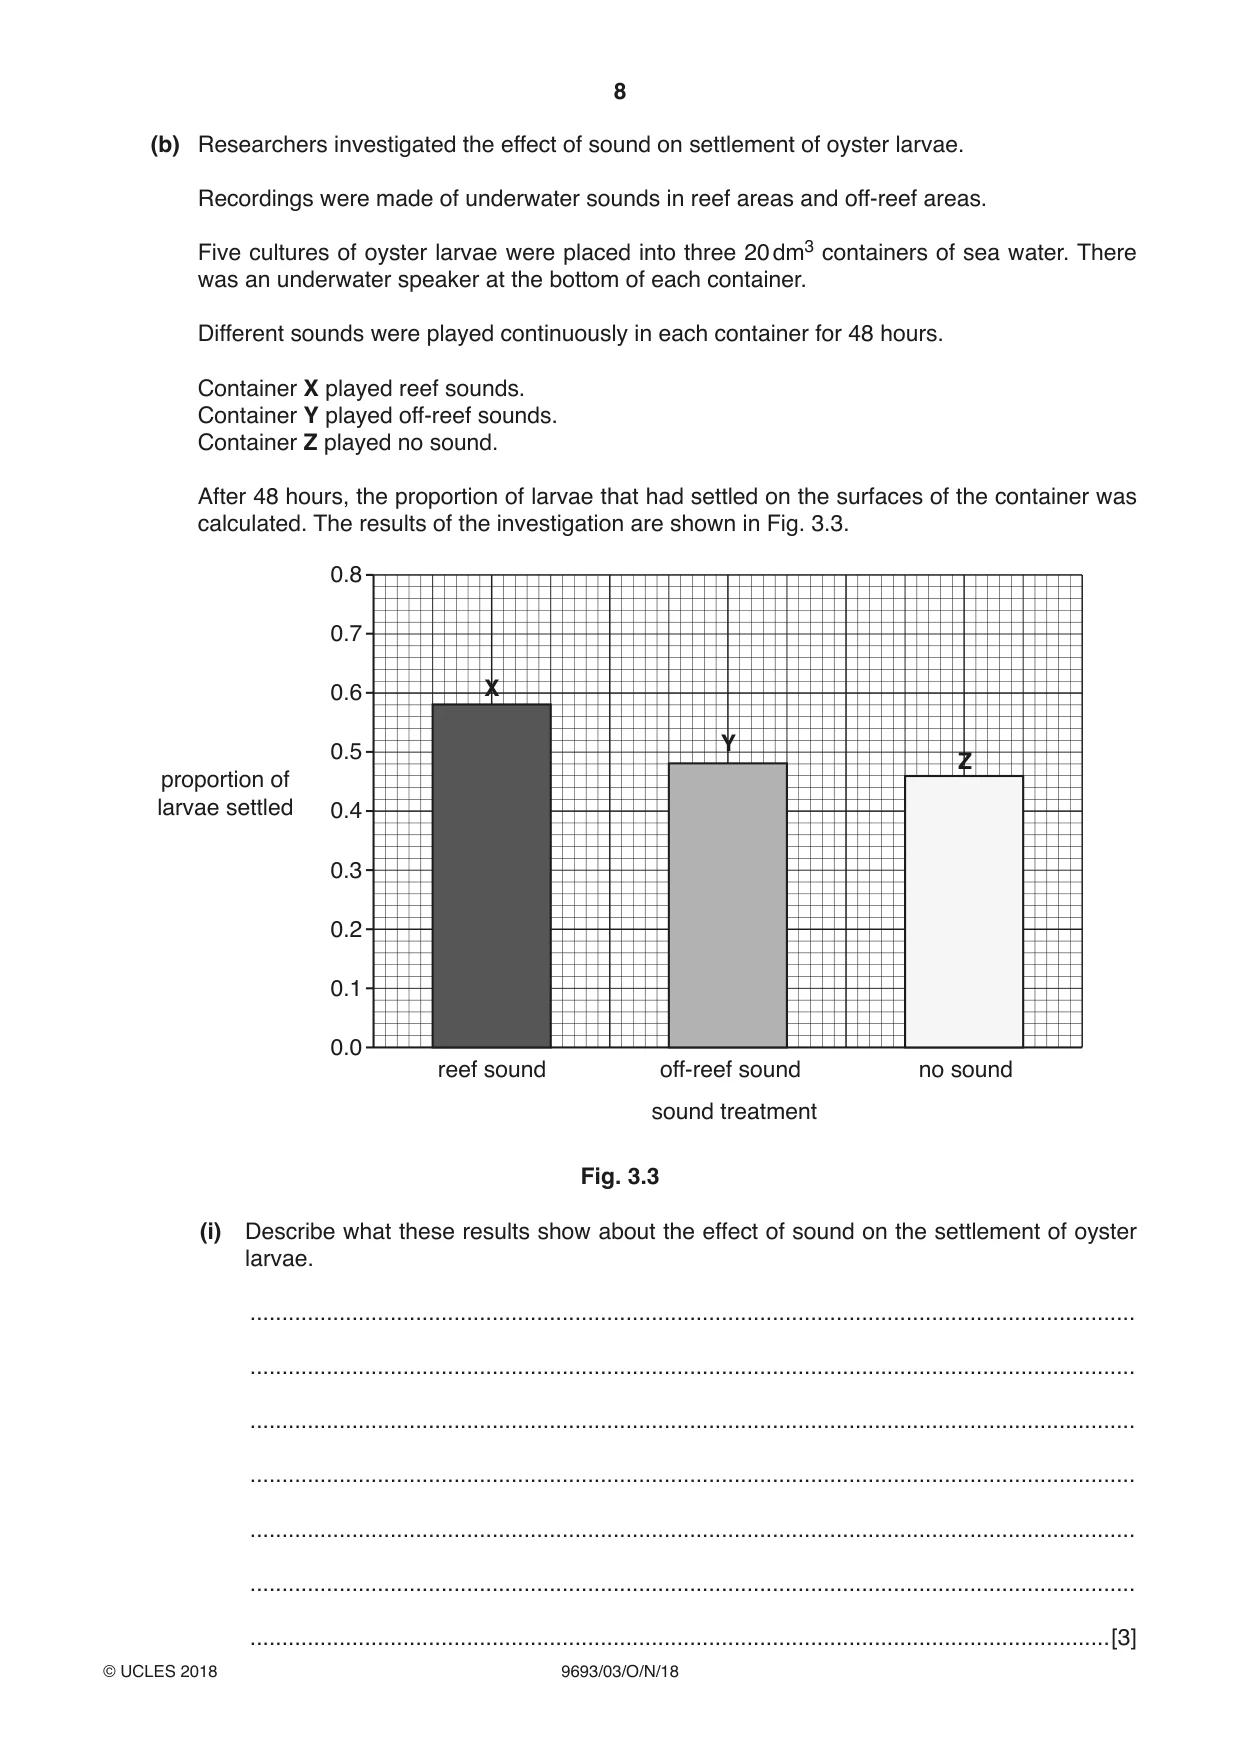
3 (a) Fig. 3.1 shows some of the stages in the life cycle of oysters. sperm adult egg fertilised egg spat larval stages Fig. 3.1 Fig. 3.2 shows some of the larval stages of oysters. Drawings are not to scale. A B C D Fig. 3.2 (i) State the type of fertilisation shown by oysters. .......................................................................................................................................[1] (ii) State two disadvantages of this type of fertilisation. 1 ........................................................................................................................................ 2 ........................................................................................................................................ [2] (iii) Write the letters of the four larval stages in the order in which they develop during the life cycle of oysters shown in Fig. 3.2. 1 ........................ 2 ........................ 3 ........................ 4 ........................ [3] (iv) Some of the larval stages are pelagic (free‑swimming) in the water. State one advantage and one disadvantage of this behaviour. advantage ......................................................................................................................... ........................................................................................................................................... disadvantage ..................................................................................................................... ........................................................................................................................................... [2] (b) Researchers investigated the effect of sound on settlement of oyster larvae. Recordings were made of underwater sounds in reef areas and off‑reef areas. Five cultures of oyster larvae were placed into three 20 dm3 containers of sea water. There was an underwater speaker at the bottom of each container. Different sounds were played continuously in each container for 48 hours. Container X played reef sounds. Container Y played off‑reef sounds. Container Z played no sound. After 48 hours, the proportion of larvae that had settled on the surfaces of the container was calculated. The results of the investigation are shown in Fig. 3.3. 0.8 0.7 0.6 X Y 0.5 Z proportion of larvae settled 0.4 0.3 0.2 0.1 0.0 reef sound off-reef sound no sound sound treatment Fig. 3.3 (i) Describe what these results show about the effect of sound on the settlement of oyster larvae. ........................................................................................................................................... ........................................................................................................................................... ........................................................................................................................................... ........................................................................................................................................... ........................................................................................................................................... ........................................................................................................................................... .......................................................................................................................................[3] (ii) Suggest the advantages to the oyster larvae of this response to sound. ........................................................................................................................................... ........................................................................................................................................... ........................................................................................................................................... ........................................................................................................................................... .......................................................................................................................................[2] [Total: 13]
Q4 · Fish tend to gather around any floating object in the sea
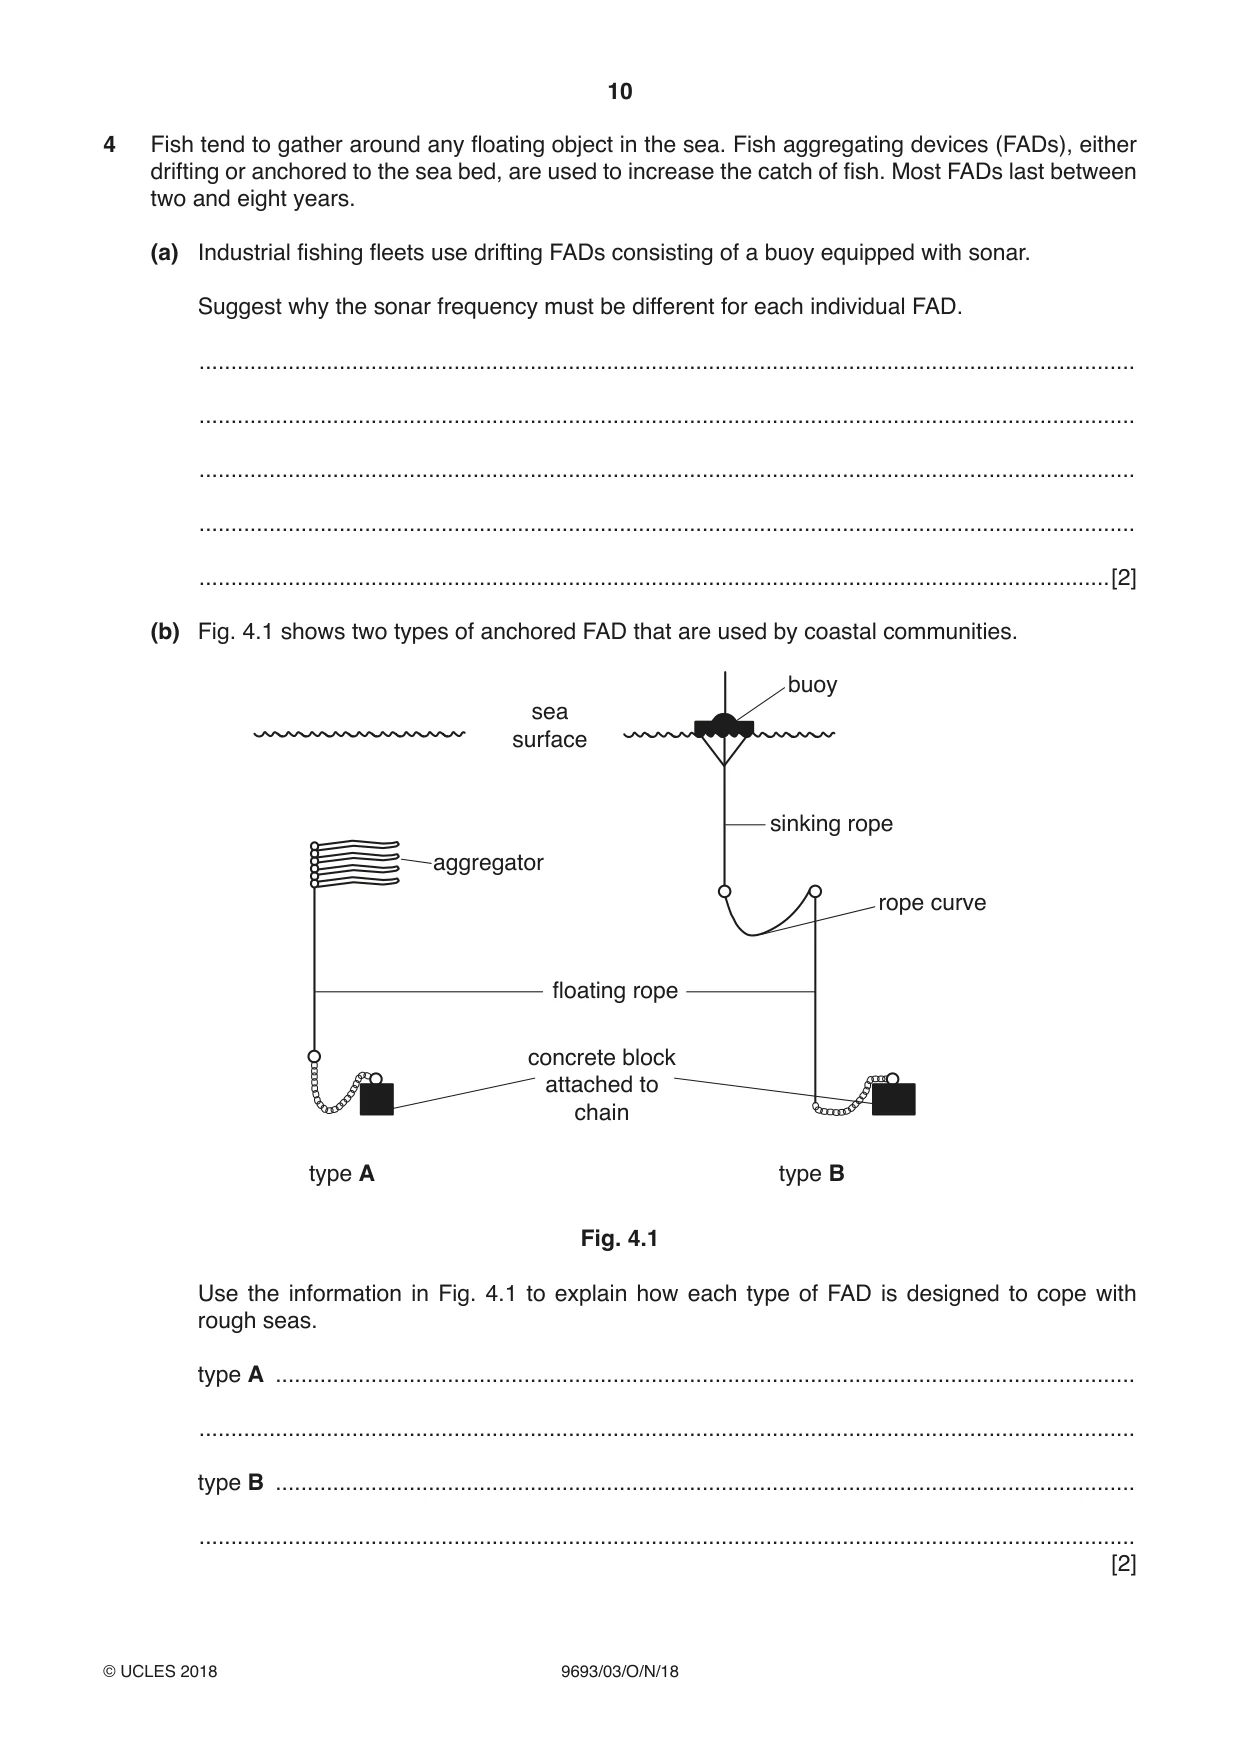
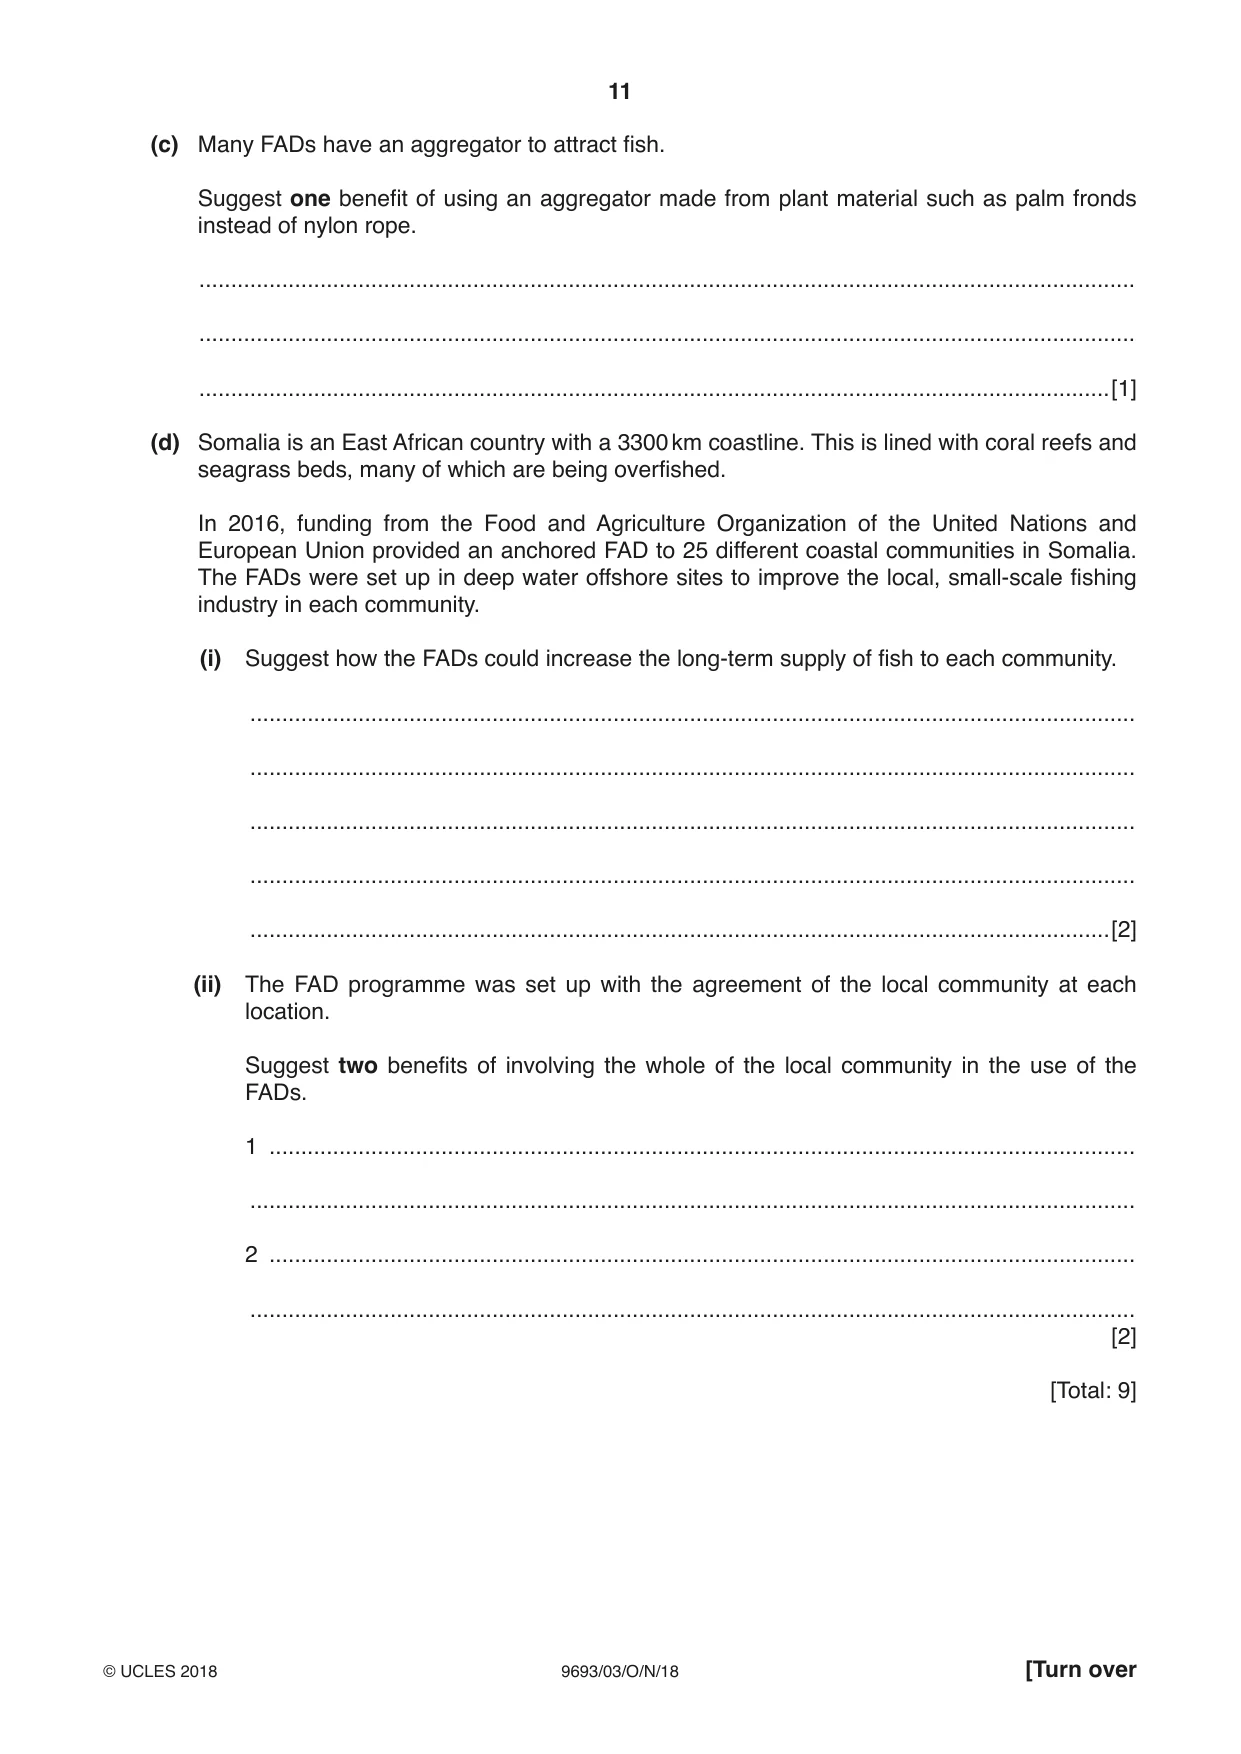
4 Fish tend to gather around any floating object in the sea. Fish aggregating devices (FADs), either drifting or anchored to the sea bed, are used to increase the catch of fish. Most FADs last between two and eight years. (a) Industrial fishing fleets use drifting FADs consisting of a buoy equipped with sonar. Suggest why the sonar frequency must be different for each individual FAD. ................................................................................................................................................... ................................................................................................................................................... ................................................................................................................................................... ................................................................................................................................................... ...............................................................................................................................................[2] (b) Fig. 4.1 shows two types of anchored FAD that are used by coastal communities. buoy sea surface sinking rope aggregator rope curve floating rope concrete block attached to chain type A type B Fig. 4.1 Use the information in Fig. 4.1 to explain how each type of FAD is designed to cope with rough seas. type A ....................................................................................................................................... ................................................................................................................................................... type B ....................................................................................................................................... ................................................................................................................................................... [2] (c) Many FADs have an aggregator to attract fish. Suggest one benefit of using an aggregator made from plant material such as palm fronds instead of nylon rope. ................................................................................................................................................... ................................................................................................................................................... ...............................................................................................................................................[1] (d) Somalia is an East African country with a 3300 km coastline. This is lined with coral reefs and seagrass beds, many of which are being overfished. In 2016, funding from the Food and Agriculture Organization of the United Nations and European Union provided an anchored FAD to 25 different coastal communities in Somalia. The FADs were set up in deep water offshore sites to improve the local, small‑scale fishing industry in each community. (i) Suggest how the FADs could increase the long‑term supply of fish to each community. ........................................................................................................................................... ........................................................................................................................................... ........................................................................................................................................... ........................................................................................................................................... .......................................................................................................................................[2] (ii) The FAD programme was set up with the agreement of the local community at each location. Suggest two benefits of involving the whole of the local community in the use of the FADs. 1 ........................................................................................................................................ ........................................................................................................................................... 2 ........................................................................................................................................ ........................................................................................................................................... [2] [Total: 9]
Q5 · Read the information about aquaculture
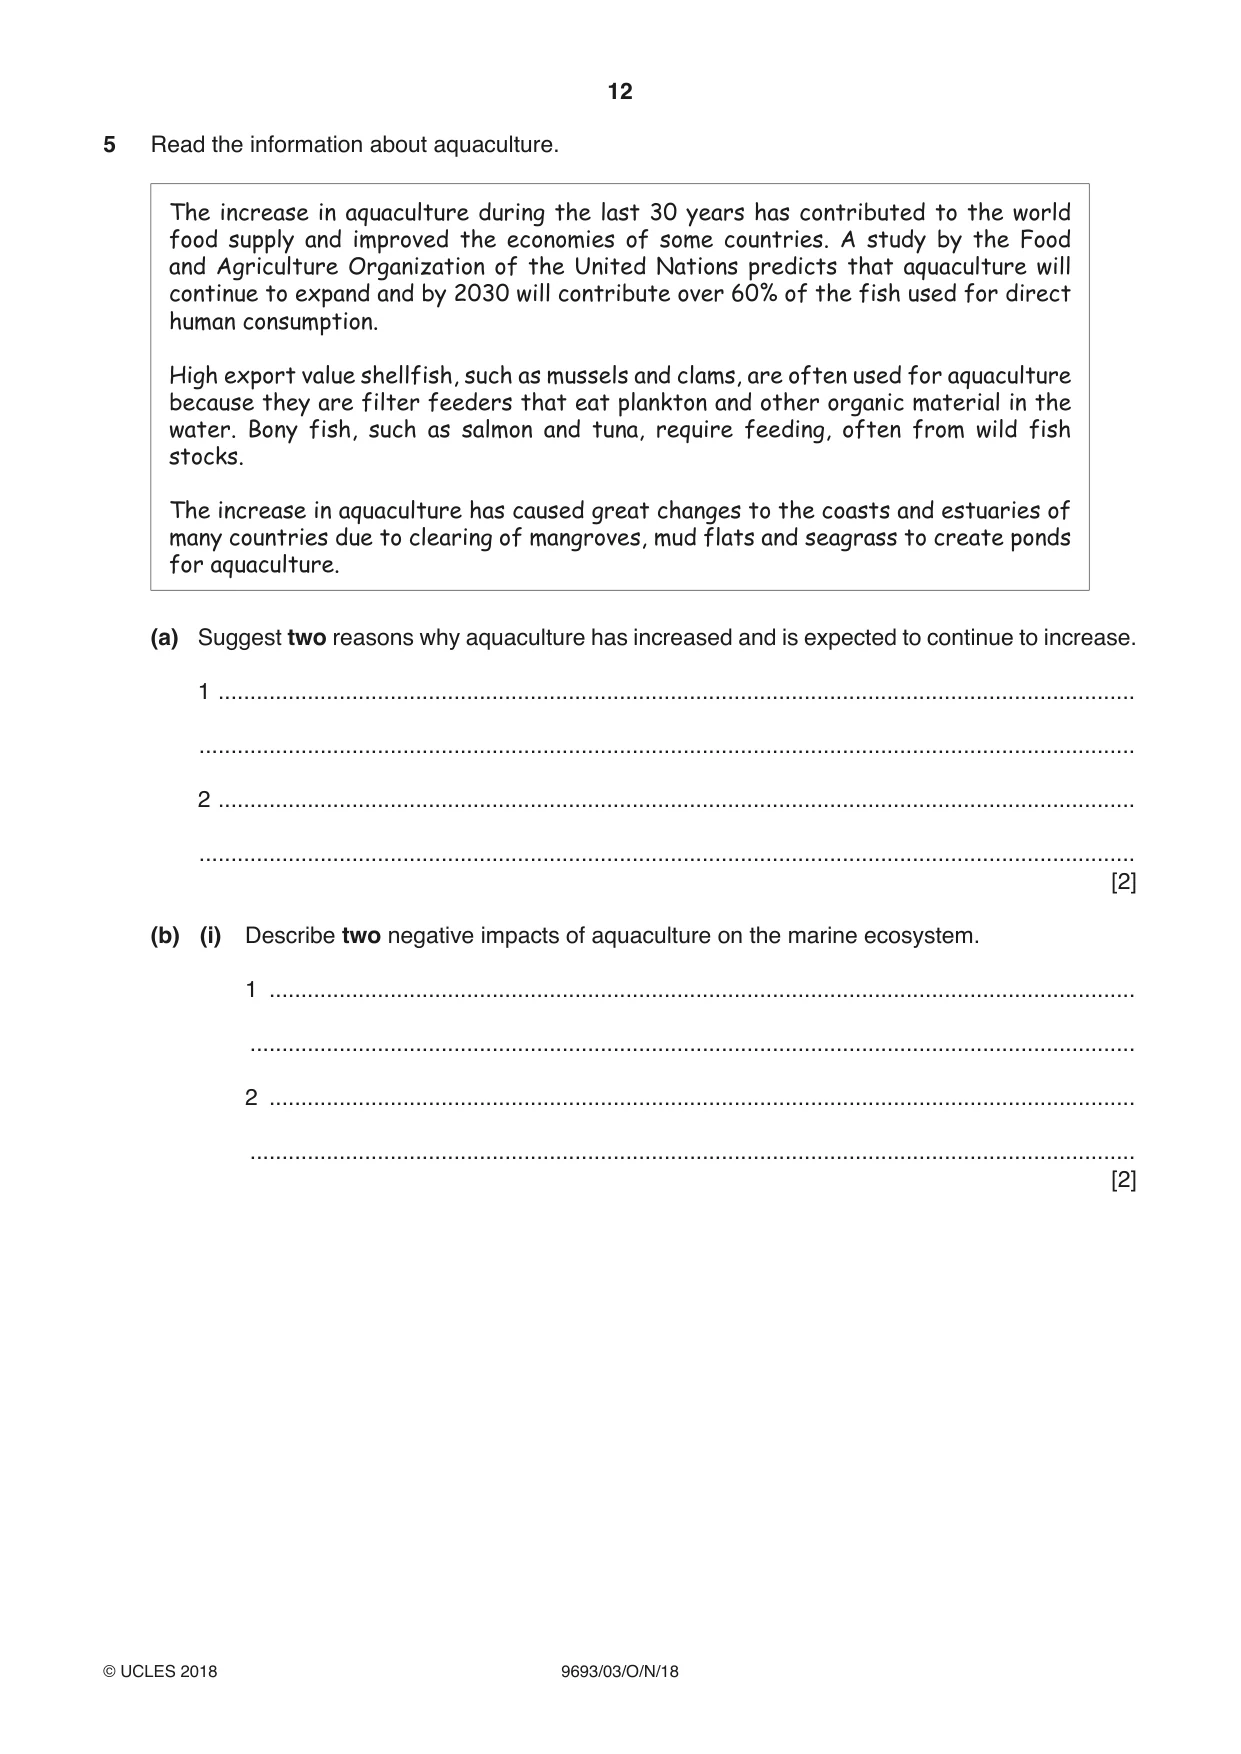
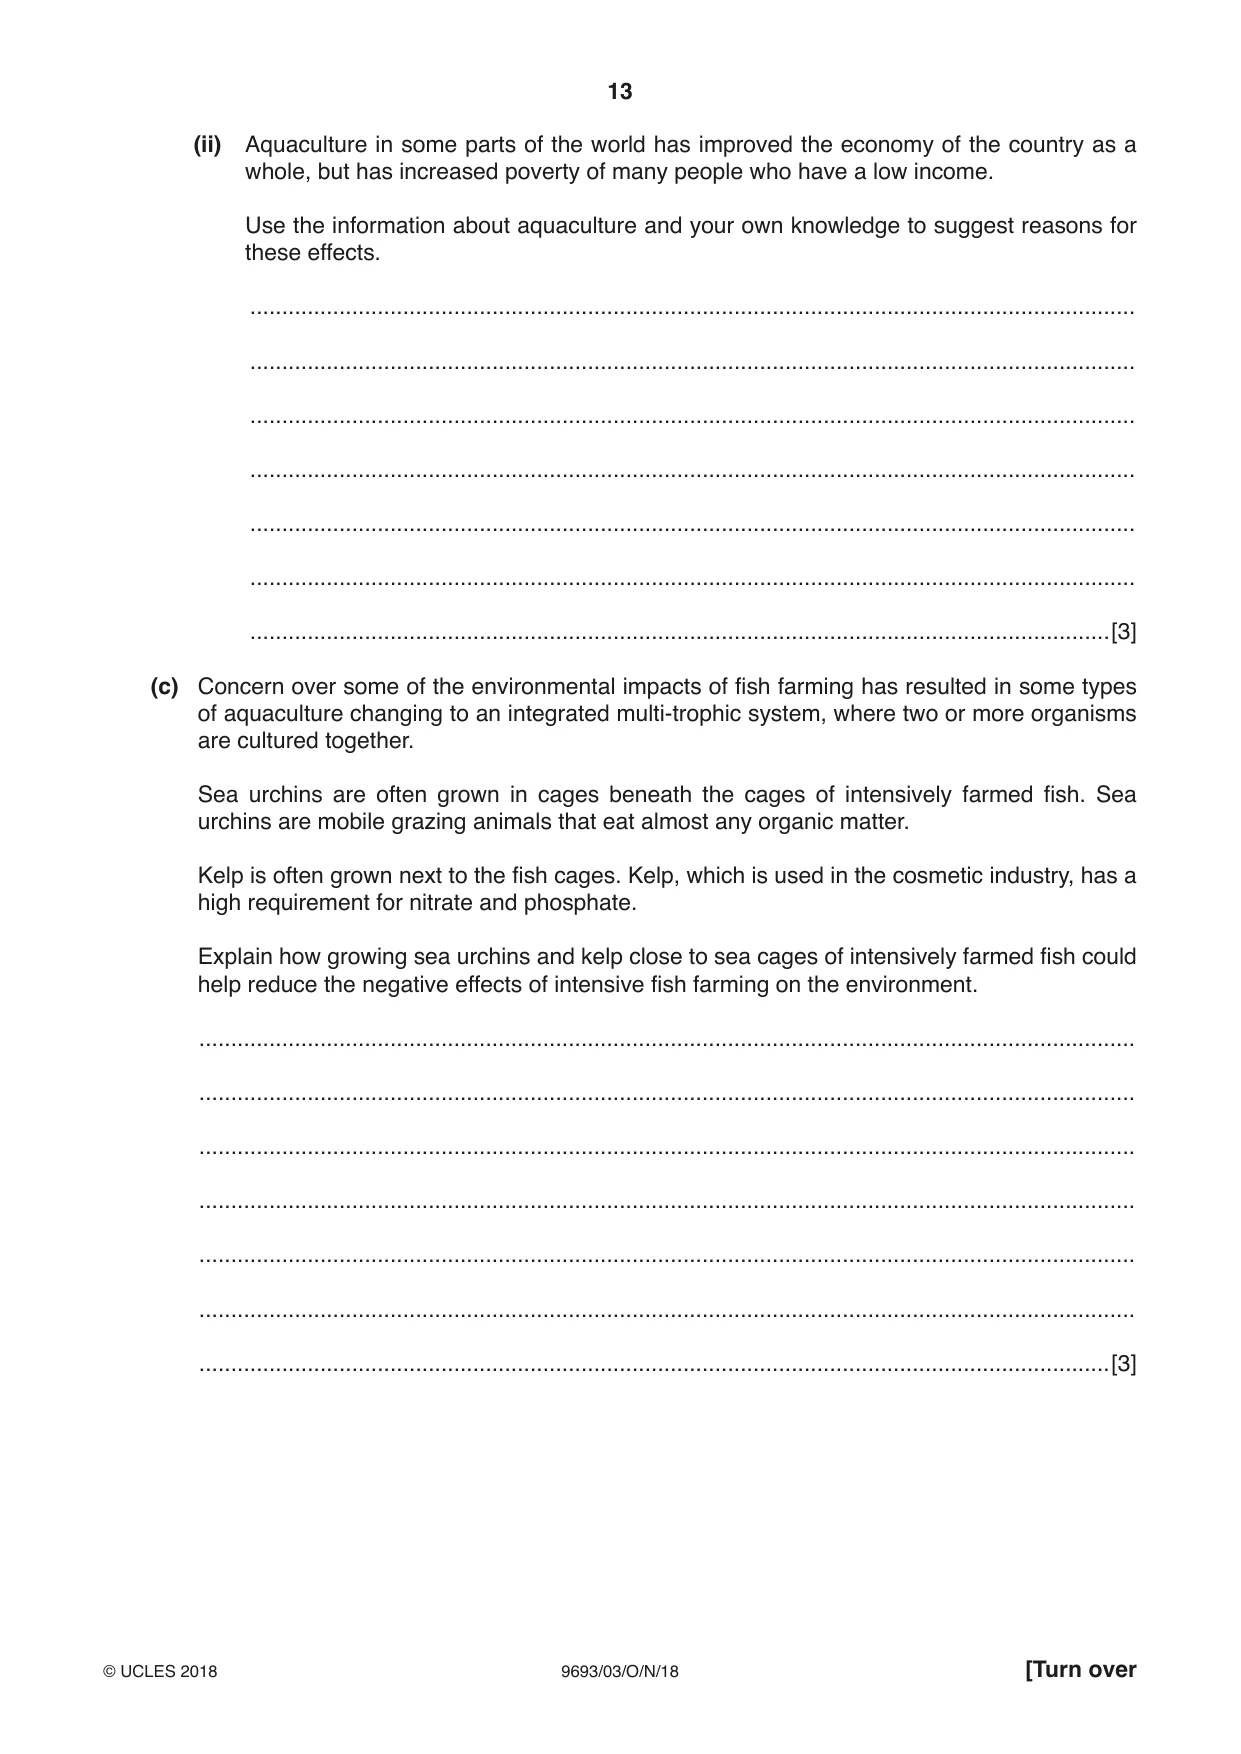
5 Read the information about aquaculture. The increase in aquaculture during the last 30 years has contributed to the world food supply and improved the economies of some countries. A study by the Food and Agriculture Organization of the United Nations predicts that aquaculture will continue to expand and by 2030 will contribute over 60% of the fish used for direct human consumption. High export value shellfish, such as mussels and clams, are often used for aquaculture because they are filter feeders that eat plankton and other organic material in the water. Bony fish, such as salmon and tuna, require feeding, often from wild fish stocks. The increase in aquaculture has caused great changes to the coasts and estuaries of many countries due to clearing of mangroves, mud flats and seagrass to create ponds for aquaculture. (a) Suggest two reasons why aquaculture has increased and is expected to continue to increase. 1 ................................................................................................................................................ ................................................................................................................................................... 2 ................................................................................................................................................ ................................................................................................................................................... [2] (b) (i) Describe two negative impacts of aquaculture on the marine ecosystem. 1 ........................................................................................................................................ ........................................................................................................................................... 2 ........................................................................................................................................ ........................................................................................................................................... [2] (ii) Aquaculture in some parts of the world has improved the economy of the country as a whole, but has increased poverty of many people who have a low income. Use the information about aquaculture and your own knowledge to suggest reasons for these effects. ........................................................................................................................................... ........................................................................................................................................... ........................................................................................................................................... ........................................................................................................................................... ........................................................................................................................................... ........................................................................................................................................... .......................................................................................................................................[3] (c) Concern over some of the environmental impacts of fish farming has resulted in some types of aquaculture changing to an integrated multi‑trophic system, where two or more organisms are cultured together. Sea urchins are often grown in cages beneath the cages of intensively farmed fish. Sea urchins are mobile grazing animals that eat almost any organic matter. Kelp is often grown next to the fish cages. Kelp, which is used in the cosmetic industry, has a high requirement for nitrate and phosphate. Explain how growing sea urchins and kelp close to sea cages of intensively farmed fish could help reduce the negative effects of intensive fish farming on the environment. ................................................................................................................................................... ................................................................................................................................................... ................................................................................................................................................... ................................................................................................................................................... ................................................................................................................................................... ................................................................................................................................................... ...............................................................................................................................................[3] (d) Explain how, apart from global warming, increasing quantities of carbon dioxide in the atmosphere may result in problems for shellfish aquaculture. ................................................................................................................................................... ................................................................................................................................................... ................................................................................................................................................... ................................................................................................................................................... ................................................................................................................................................... ................................................................................................................................................... ...............................................................................................................................................[3] [Total: 13]
Q6 · Coral reefs around the island of Maui in Hawaii provide major economic benefits from…
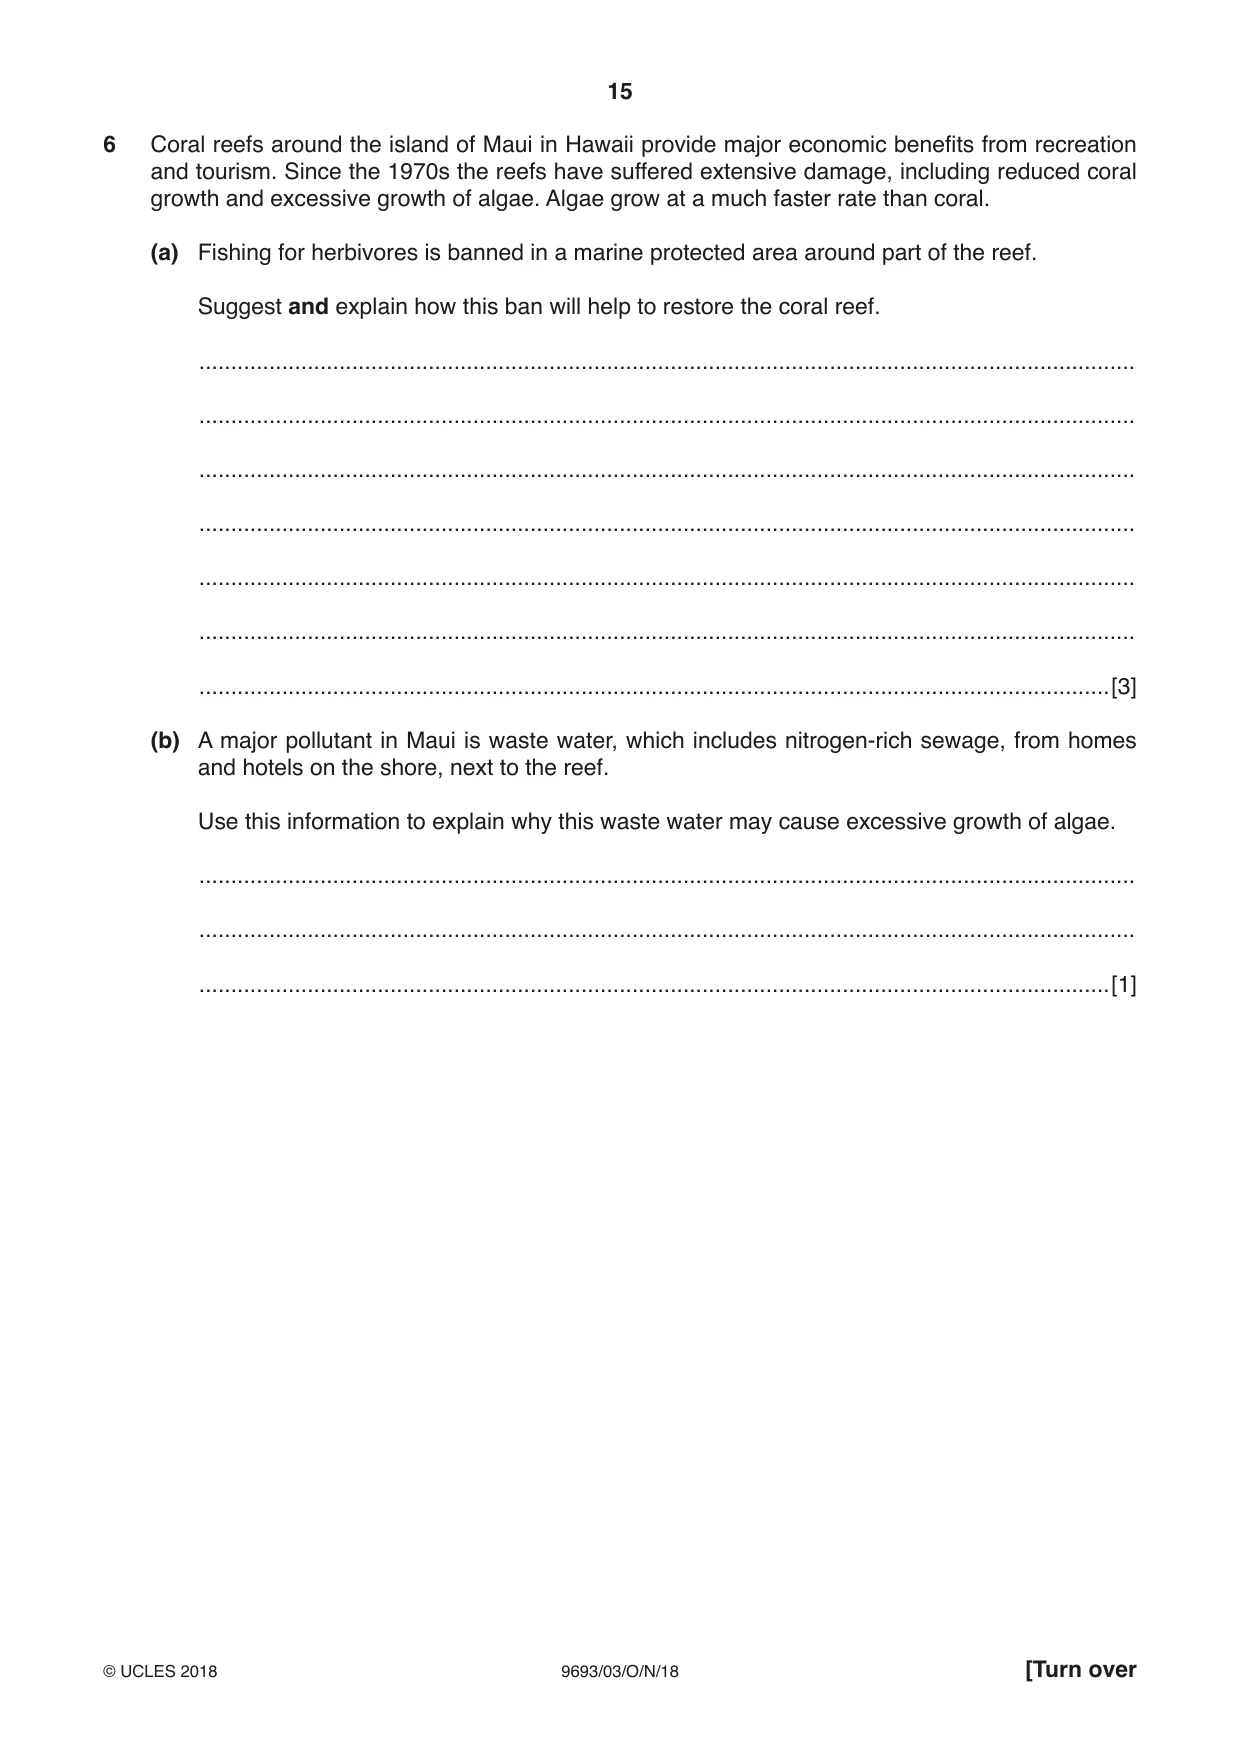
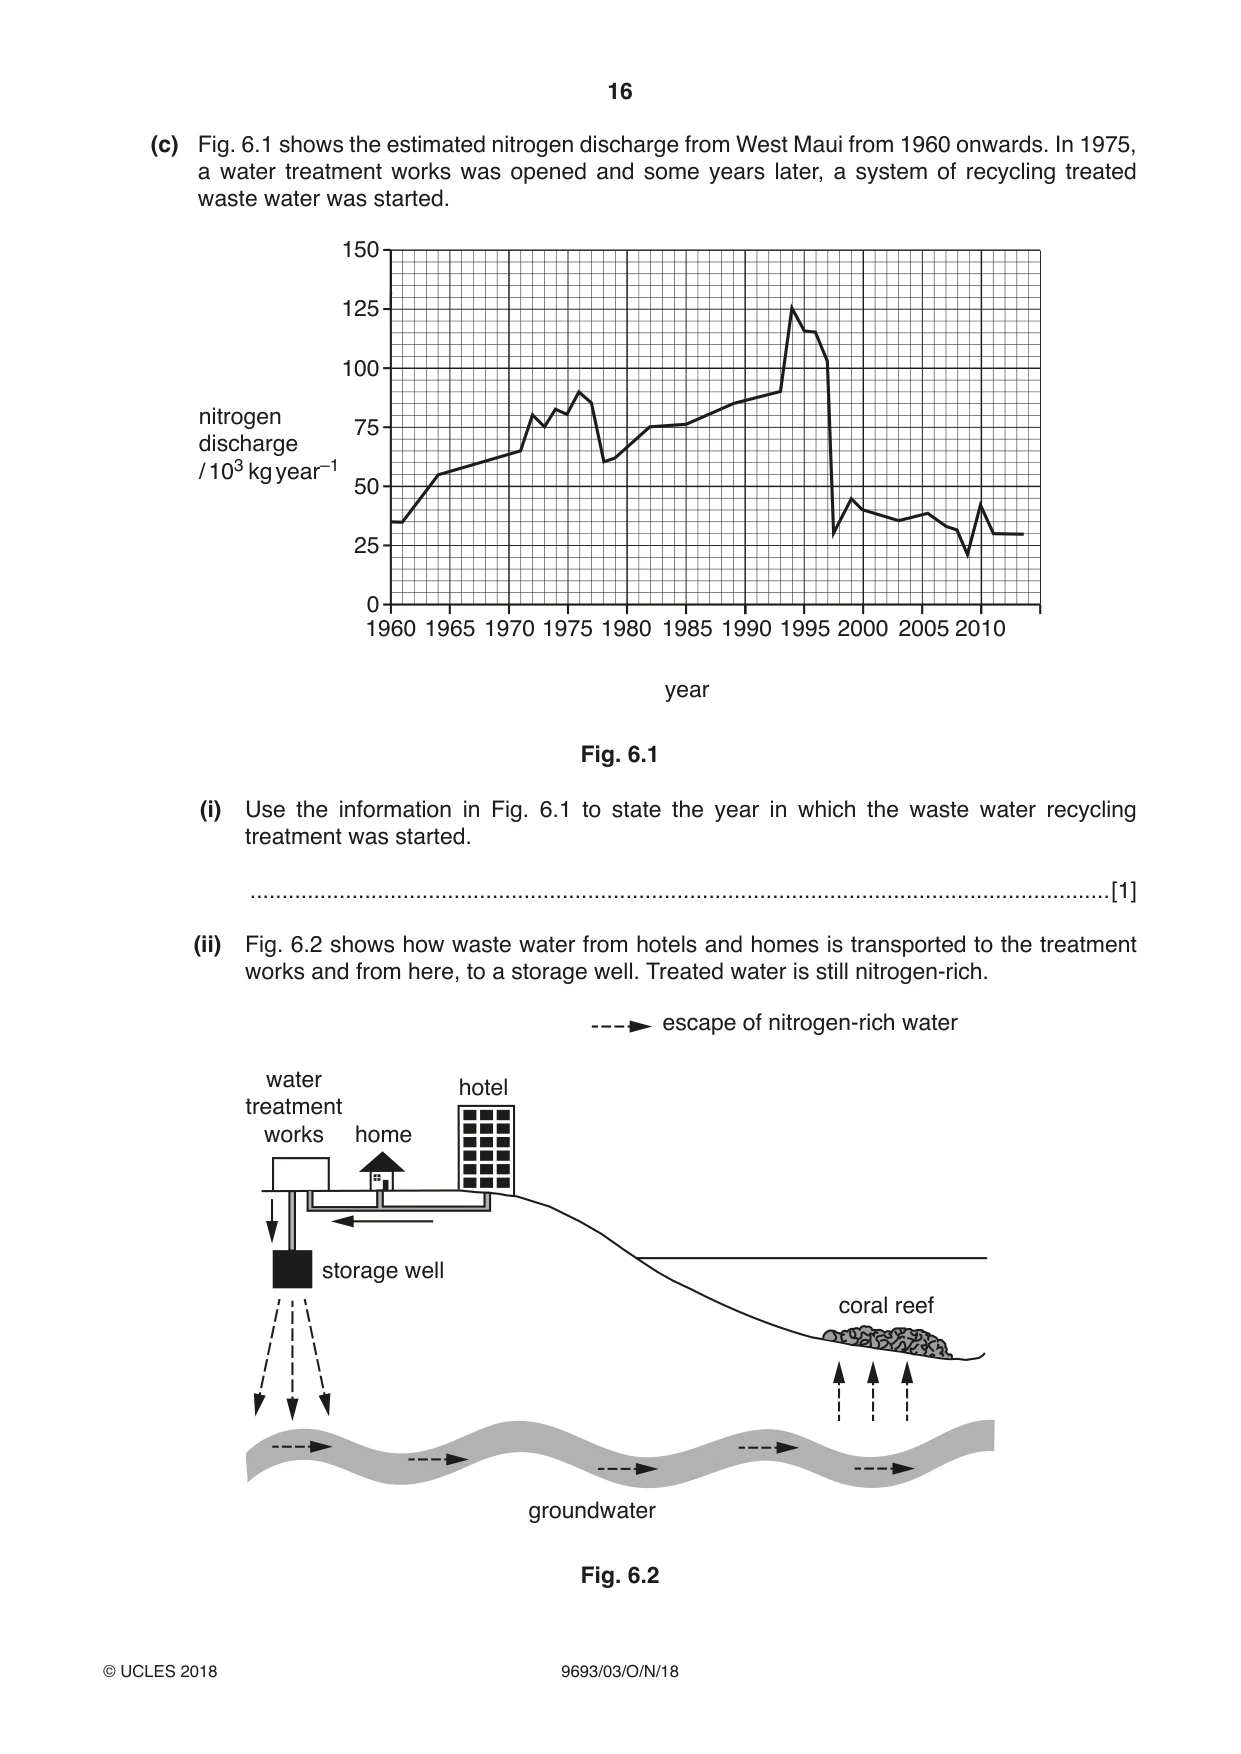
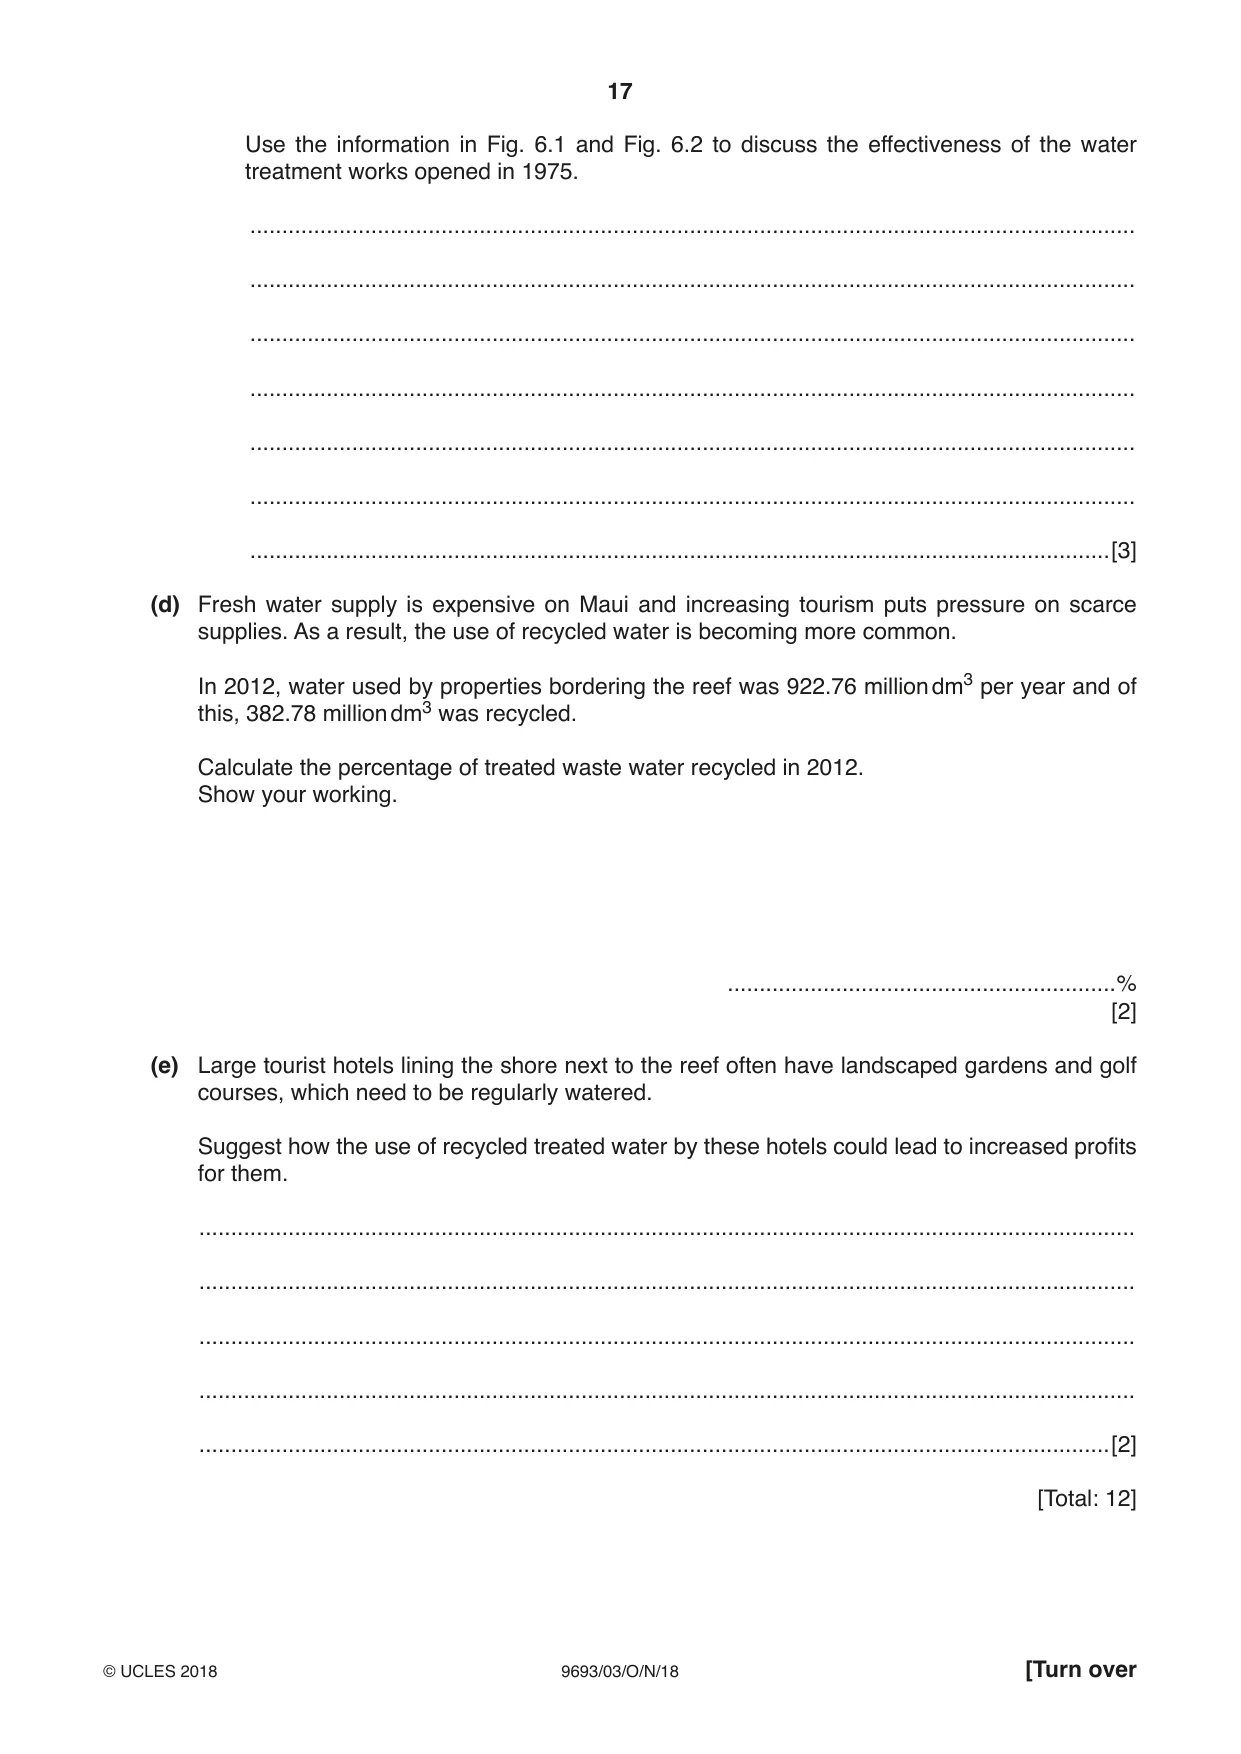
6 Coral reefs around the island of Maui in Hawaii provide major economic benefits from recreation and tourism. Since the 1970s the reefs have suffered extensive damage, including reduced coral growth and excessive growth of algae. Algae grow at a much faster rate than coral. (a) Fishing for herbivores is banned in a marine protected area around part of the reef. Suggest and explain how this ban will help to restore the coral reef. ................................................................................................................................................... ................................................................................................................................................... ................................................................................................................................................... ................................................................................................................................................... ................................................................................................................................................... ................................................................................................................................................... ...............................................................................................................................................[3] (b) A major pollutant in Maui is waste water, which includes nitrogen‑rich sewage, from homes and hotels on the shore, next to the reef. Use this information to explain why this waste water may cause excessive growth of algae. ................................................................................................................................................... ................................................................................................................................................... ...............................................................................................................................................[1] (c) Fig. 6.1 shows the estimated nitrogen discharge from West Maui from 1960 onwards. In 1975, a water treatment works was opened and some years later, a system of recycling treated waste water was started. 150 125 100 nitrogen 75 discharge / 103 kg year–1 50 25 0 1960 1965 1970 1975 1980 1985 1990 1995 2000 2005 2010 year Fig. 6.1 (i) Use the information in Fig. 6.1 to state the year in which the waste water recycling treatment was started. .......................................................................................................................................[1] (ii) Fig. 6.2 shows how waste water from hotels and homes is transported to the treatment works and from here, to a storage well. Treated water is still nitrogen‑rich. escape of nitrogen-rich water water hotel treatment works home storage well coral reef groundwater Fig. 6.2 Use the information in Fig. 6.1 and Fig. 6.2 to discuss the effectiveness of the water treatment works opened in 1975. ........................................................................................................................................... ........................................................................................................................................... ........................................................................................................................................... ........................................................................................................................................... ........................................................................................................................................... ........................................................................................................................................... .......................................................................................................................................[3] (d) Fresh water supply is expensive on Maui and increasing tourism puts pressure on scarce supplies. As a result, the use of recycled water is becoming more common. In 2012, water used by properties bordering the reef was 922.76 million dm3 per year and of this, 382.78 million dm3 was recycled. Calculate the percentage of treated waste water recycled in 2012. Show your working. .............................................................% [2] (e) Large tourist hotels lining the shore next to the reef often have landscaped gardens and golf courses, which need to be regularly watered. Suggest how the use of recycled treated water by these hotels could lead to increased profits for them. ................................................................................................................................................... ................................................................................................................................................... ................................................................................................................................................... ................................................................................................................................................... ...............................................................................................................................................[2] [Total: 12]
Q7 · Define the term gene
7 (a) Define the term gene. ................................................................................................................................................... ...............................................................................................................................................[1] (b) (i) Genetically engineered salmon, GM salmon, contain genes from Chinook salmon and ocean pout. The GM salmon grow all year and can be harvested sooner than non‑genetically engineered salmon. Name the two types of gene that were transferred to produce these GM salmon. 1 ........................................................................................................................................ 2 ........................................................................................................................................ [2] (ii) State the effect of this change in genotype on the phenotype of these GM salmon. ........................................................................................................................................... ........................................................................................................................................... .......................................................................................................................................[1] (c) In November 2015 the United States of America Food and Drug Administration announced that they had approved production, sale and human consumption of GM salmon. GM salmon eggs are produced at a land‑based hatchery in Canada. Fertilised eggs are treated so that they develop into sterile salmon. The eggs are then flown directly to a land‑ based facility in Panama to grow to market size before being harvested and processed for sale. State what you understand by the term precautionary principle and describe how this is applied to GM salmon production. ................................................................................................................................................... ................................................................................................................................................... ................................................................................................................................................... ................................................................................................................................................... ................................................................................................................................................... ................................................................................................................................................... ...............................................................................................................................................[3] (d) Production time for GM salmon takes about two years compared to three to four years for non‑genetically engineered salmon. State the economic advantage of producing GM salmon compared with non‑genetically engineered salmon. ................................................................................................................................................... ................................................................................................................................................... ...............................................................................................................................................[1] (e) Suggest two reasons why GM salmon production in aquaculture could be considered more sustainable than fishing for wild salmon. 1 ................................................................................................................................................ ................................................................................................................................................... 2 ................................................................................................................................................ ................................................................................................................................................... [2] [Total: 10]
What was in this paper
The subtopics covered by these 7 questions, and how many questions each got. Open one in a new tab to see every Cambridge question on it.