Cambridge A Level Marine Science 9693 — 2016 Oct/Nov Paper 2 · Variant 1
9693/21/O/N/16 · 50 marks · ≈56 min
The question paper and its mark scheme, free to read here and free to download. This is Cambridge’s own paper, exactly as it was sat.
Question paper12 pages

Mark scheme6 pages
Answers below. Sit the paper first if you are practising.
Paper as text
Question paper, page 1
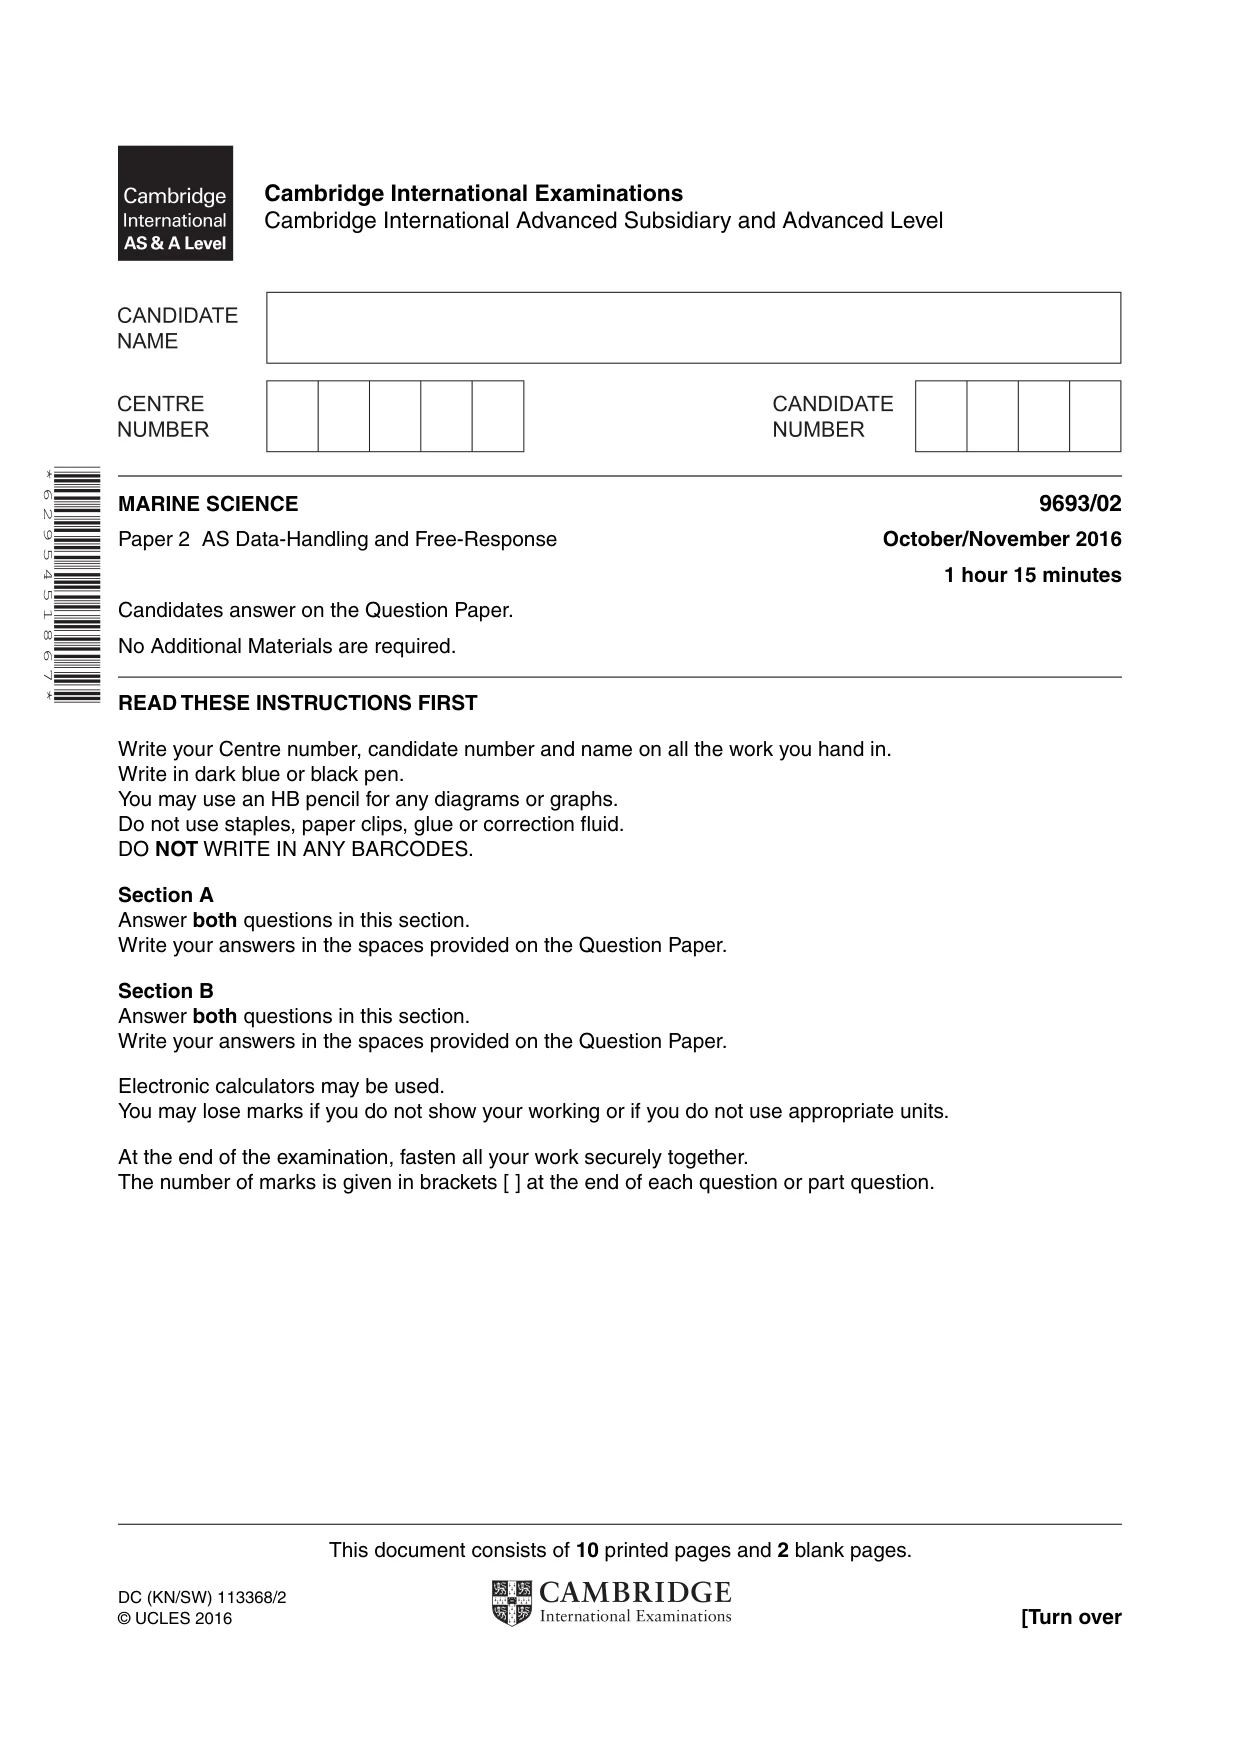
This document consists of 10 printed pages and 2 blank pages. DC (KN/SW) 113368/2 © UCLES 2016 [Turn over Cambridge International Examinations Cambridge International Advanced Subsidiary and Advanced Level * 6 2 9 5 4 5 1 8 6 7 * MARINE SCIENCE 9693/02 Paper 2 AS Data-Handling and Free-Response October/November 2016 1 hour 15 minutes Candidates answer on the Question Paper. No Additional Materials are required. READ THESE INSTRUCTIONS FIRST Write your Centre number, candidate number and name on all the work you hand in. Write in dark blue or black pen. You may use an HB pencil for any diagrams or graphs. Do not use staples, paper clips, glue or correction fluid. DO NOT WRITE IN ANY BARCODES. Section A Answer both questions in this section. Write your answers in the spaces provided on the Question Paper. Section B Answer both questions in this section. Write your answers in the spaces provided on the Question Paper. Electronic calculators may be used. You may lose marks if you do not show your working or if you do not use appropriate units. At the end of the examination, fasten all your work securely together. The number of marks is given in brackets [ ] at the end of each question or part question.
Question paper, page 2
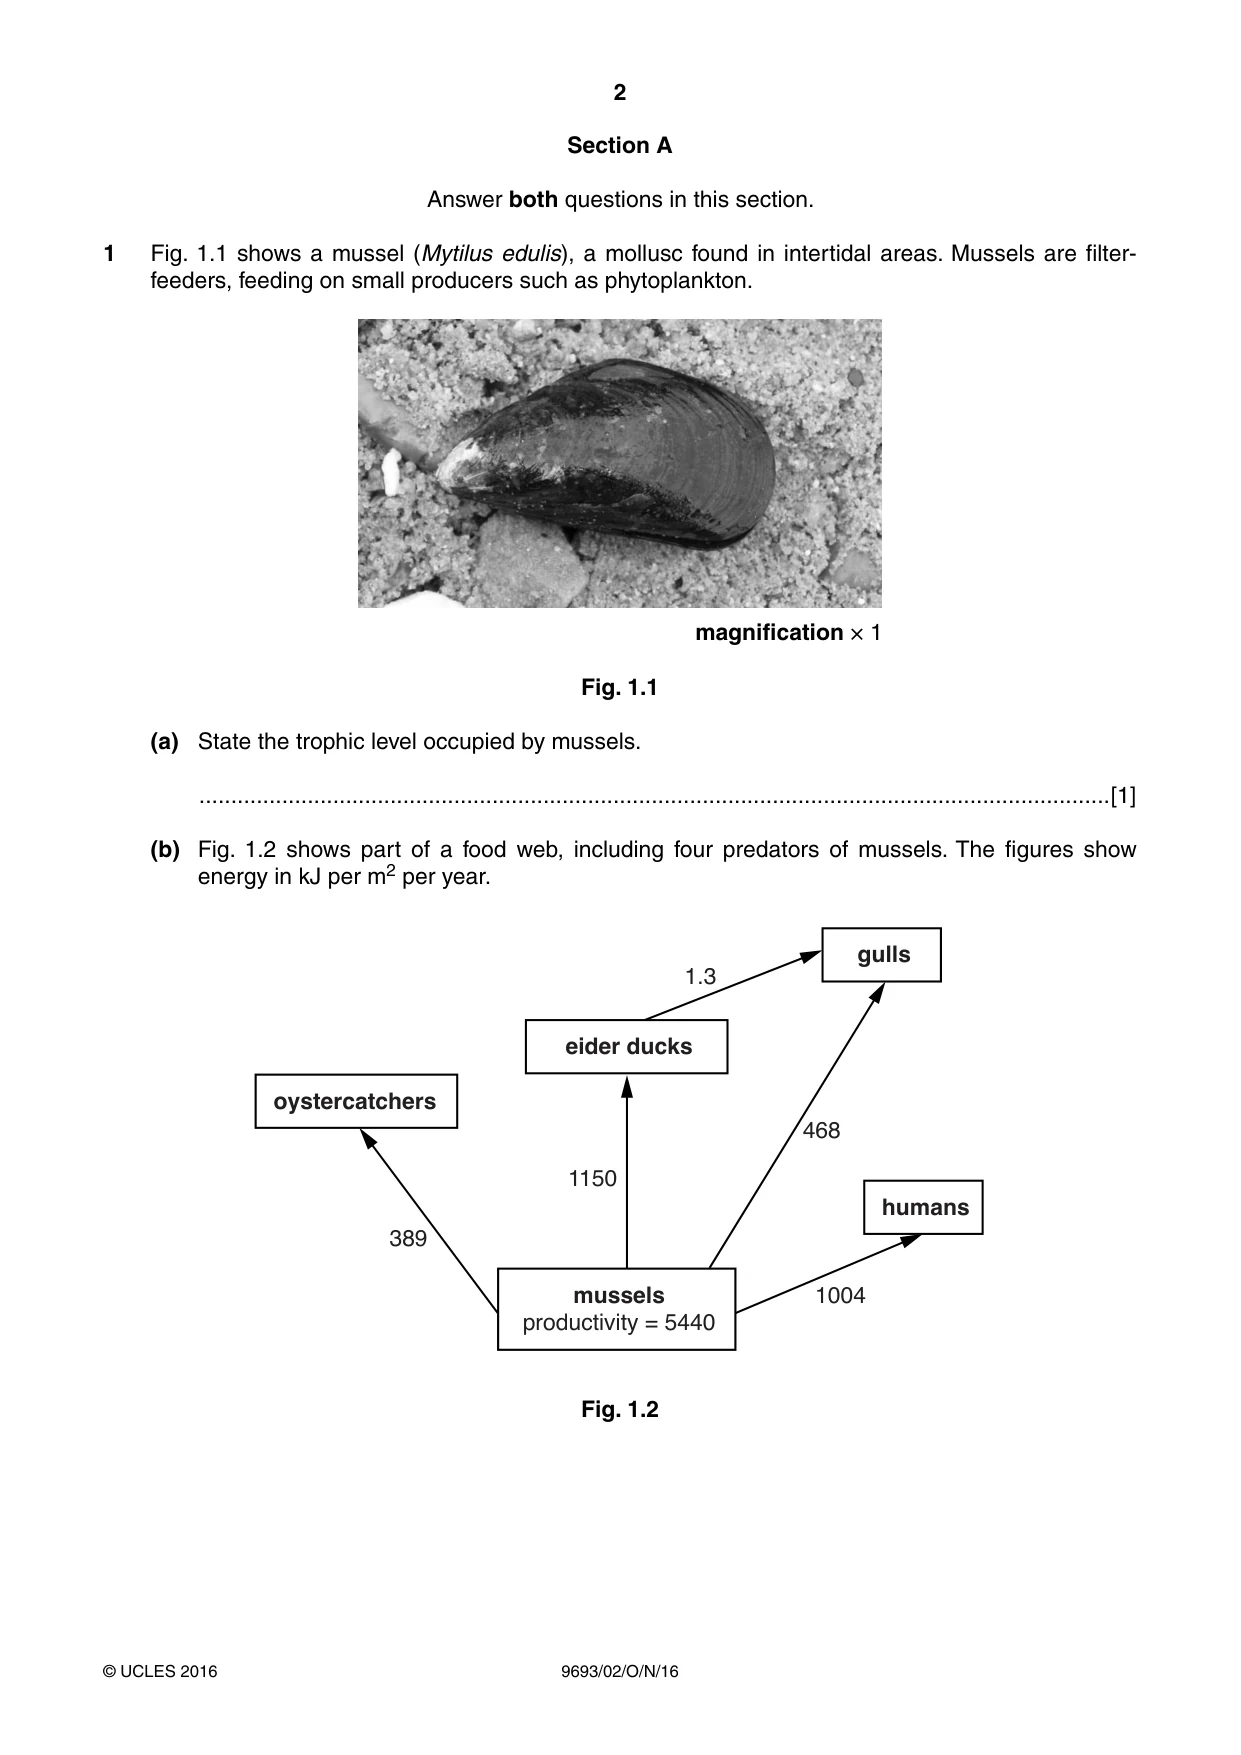
2 9693/02/O/N/16 © UCLES 2016 Section A Answer both questions in this section. 1 Fig. 1.1 shows a mussel (Mytilus edulis), a mollusc found in intertidal areas. Mussels are filter- feeders, feeding on small producers such as phytoplankton. magnification × 1 Fig. 1.1 (a) State the trophic level occupied by mussels. …[1] (b) Fig. 1.2 shows part of a food web, including four predators of mussels. The figures show energy in kJ per m2 per year. gulls eider ducks humans mussels productivity = 5440 oystercatchers 1.3 468 1004 1150 389 Fig. 1.2
Question paper, page 3
3 9693/02/O/N/16 © UCLES 2016 [Turn over (i) Using the information in Fig. 1.2, calculate the total energy transferred to predators from mussels. … [2] (ii) Express your answer to (i) as a percentage of the productivity of mussels. Show your working. … % [2] (iii) It has been estimated that mussels in this food web lose a further 2500 kJ per m2 per year as a result of their metabolism. Suggest what effect the total energy losses have on the size of the mussel population. … … … … … … …[3] [Total: 8]
Question paper, page 4
4 9693/02/O/N/16 © UCLES 2016 BLANK PAGE
Question paper, page 5
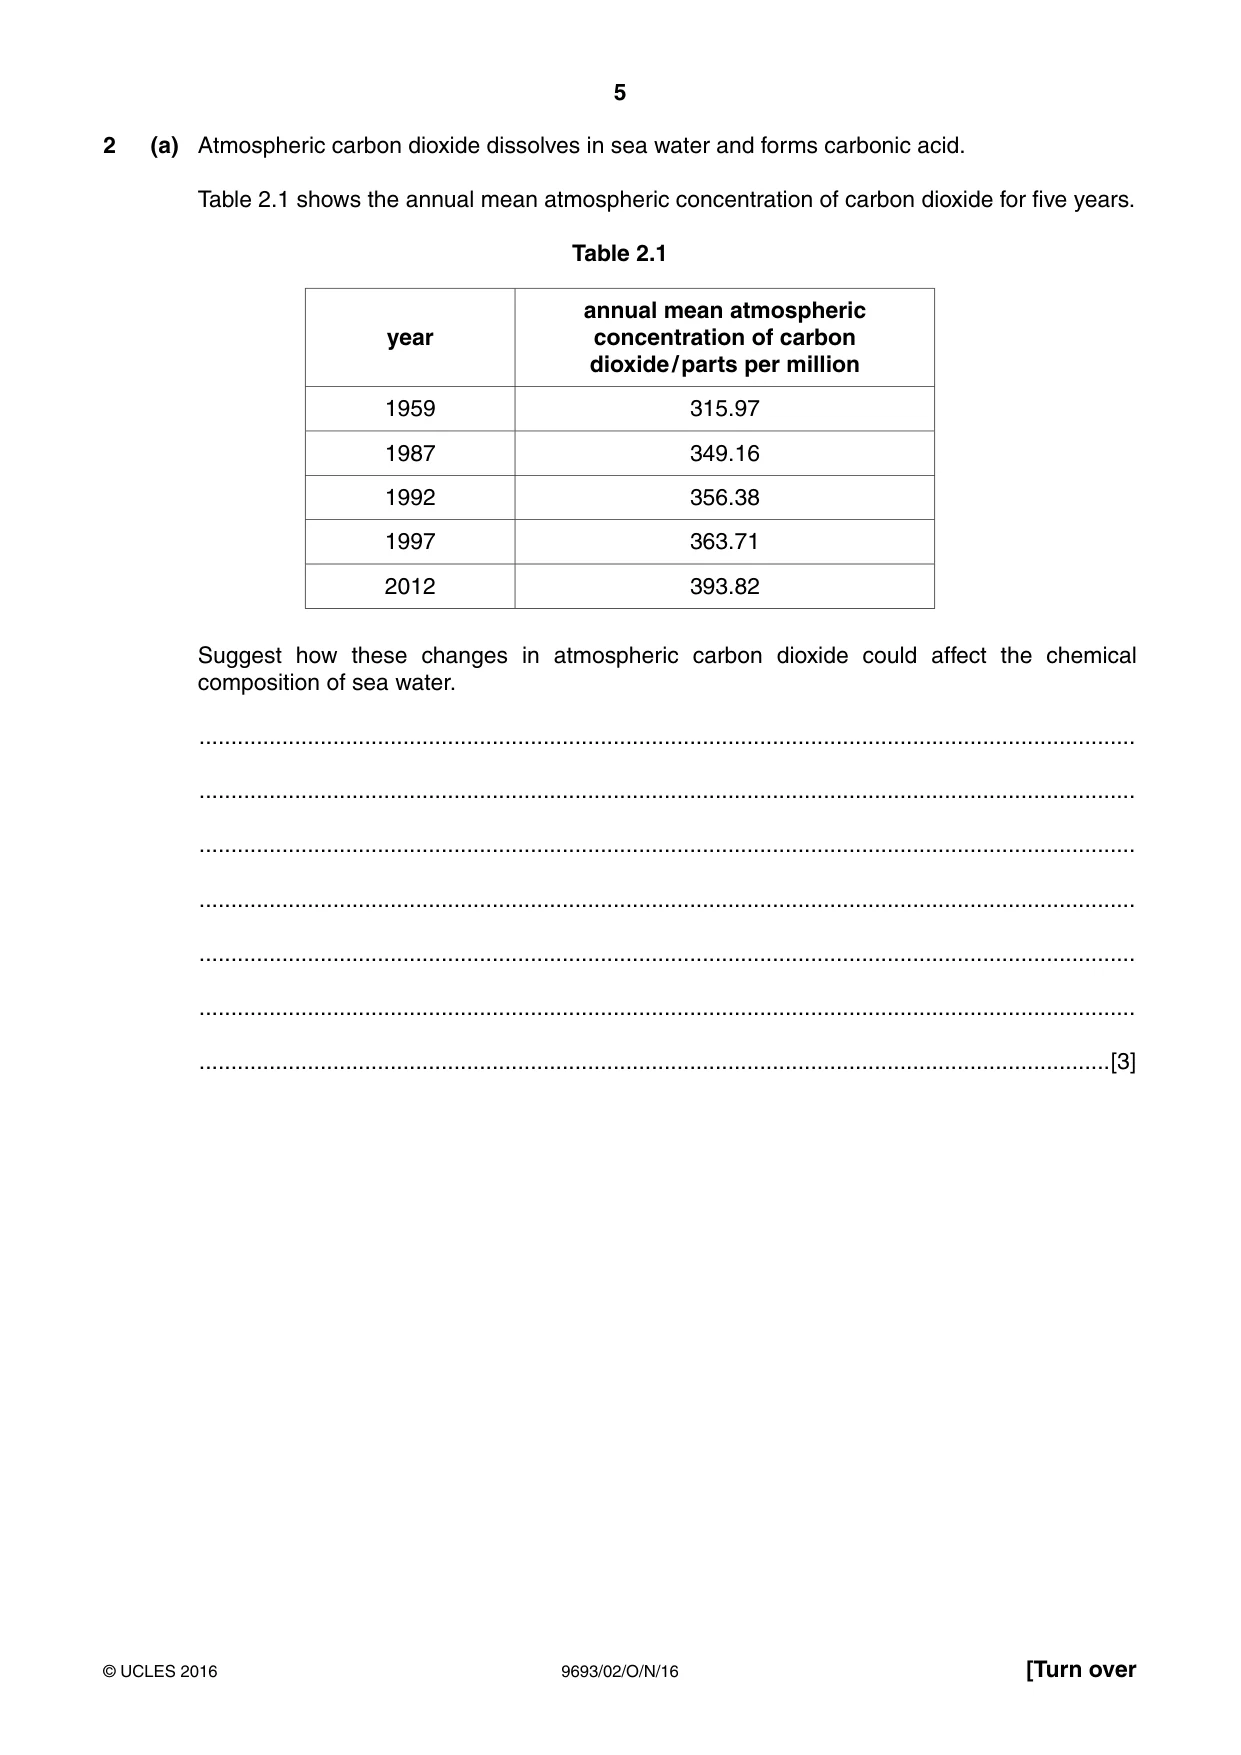
5 9693/02/O/N/16 © UCLES 2016 [Turn over 2 (a) Atmospheric carbon dioxide dissolves in sea water and forms carbonic acid. Table 2.1 shows the annual mean atmospheric concentration of carbon dioxide for five years. Table 2.1 year annual mean atmospheric concentration of carbon dioxide / parts per million 1959 315.97 1987 349.16 1992 356.38 1997 363.71 2012 393.82 Suggest how these changes in atmospheric carbon dioxide could affect the chemical composition of sea water. … … … … … … …[3]
Question paper, page 6
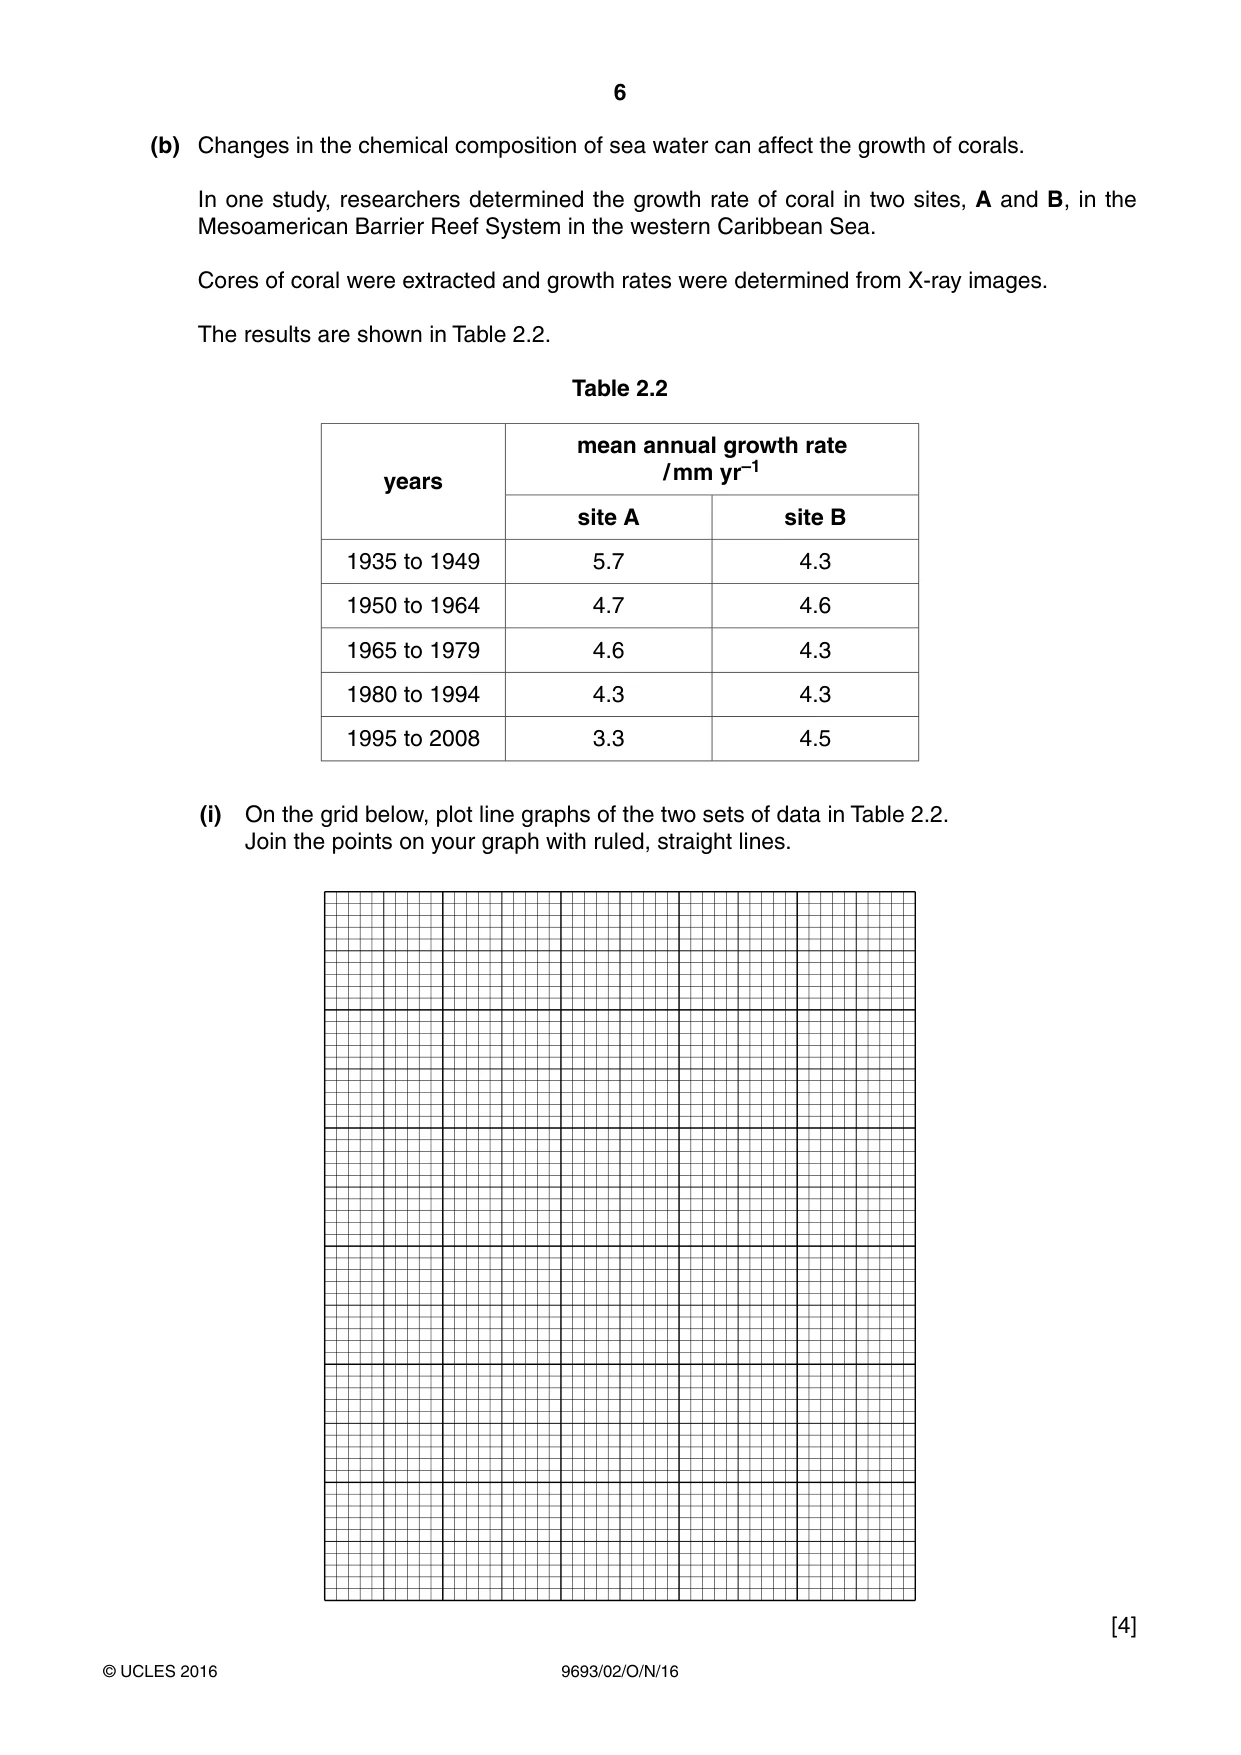
6 9693/02/O/N/16 © UCLES 2016 (b) Changes in the chemical composition of sea water can affect the growth of corals. In one study, researchers determined the growth rate of coral in two sites, A and B, in the Mesoamerican Barrier Reef System in the western Caribbean Sea. Cores of coral were extracted and growth rates were determined from X-ray images. The results are shown in Table 2.2. Table 2.2 years mean annual growth rate / mm yr–1 site A site B 1935 to 1949 5.7 4.3 1950 to 1964 4.7 4.6 1965 to 1979 4.6 4.3 1980 to 1994 4.3 4.3 1995 to 2008 3.3 4.5 (i) On the grid below, plot line graphs of the two sets of data in Table 2.2. Join the points on your graph with ruled, straight lines. [4]
Question paper, page 7
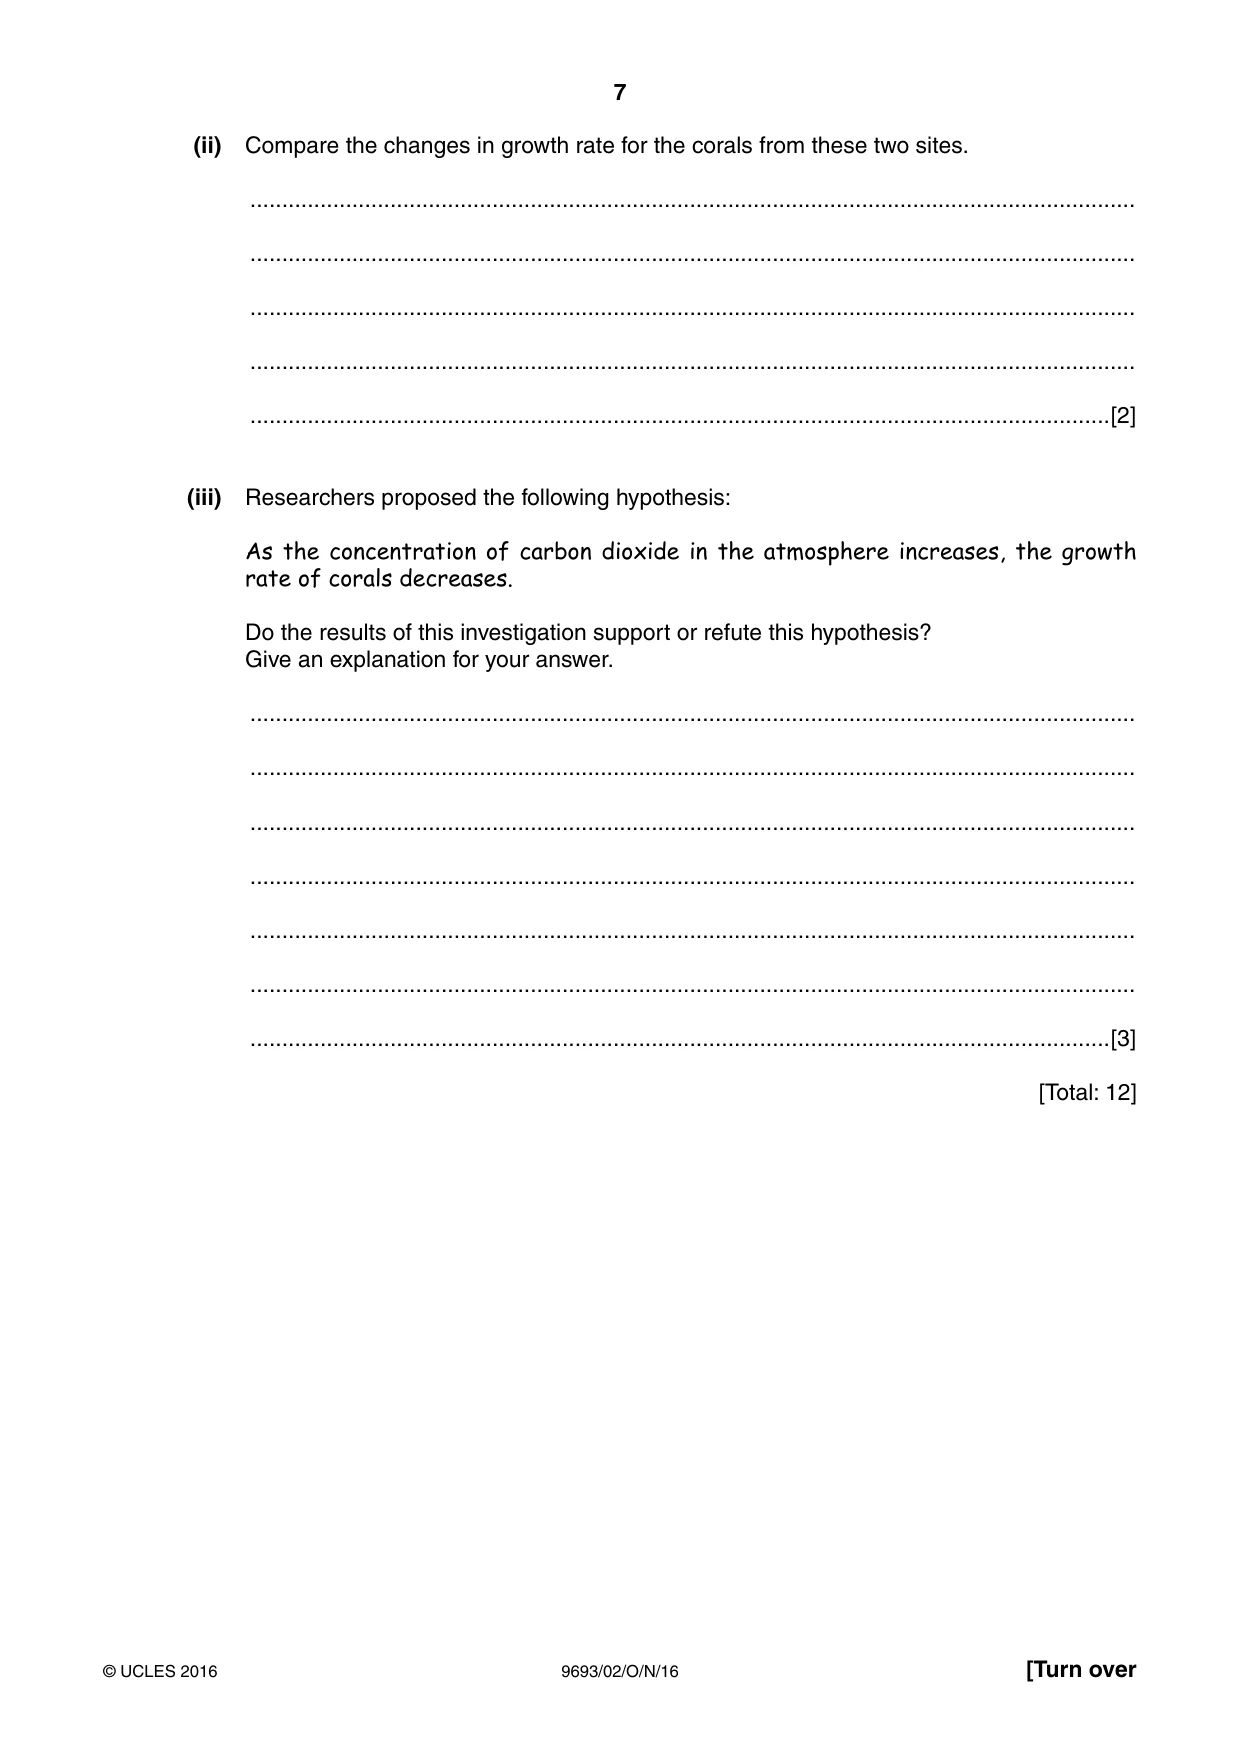
7 9693/02/O/N/16 © UCLES 2016 [Turn over (ii) Compare the changes in growth rate for the corals from these two sites. … … … … …[2] (iii) Researchers proposed the following hypothesis: As the concentration of carbon dioxide in the atmosphere increases, the growth rate of corals decreases. Do the results of this investigation support or refute this hypothesis? Give an explanation for your answer. … … … … … … …[3] [Total: 12]
Question paper, page 8
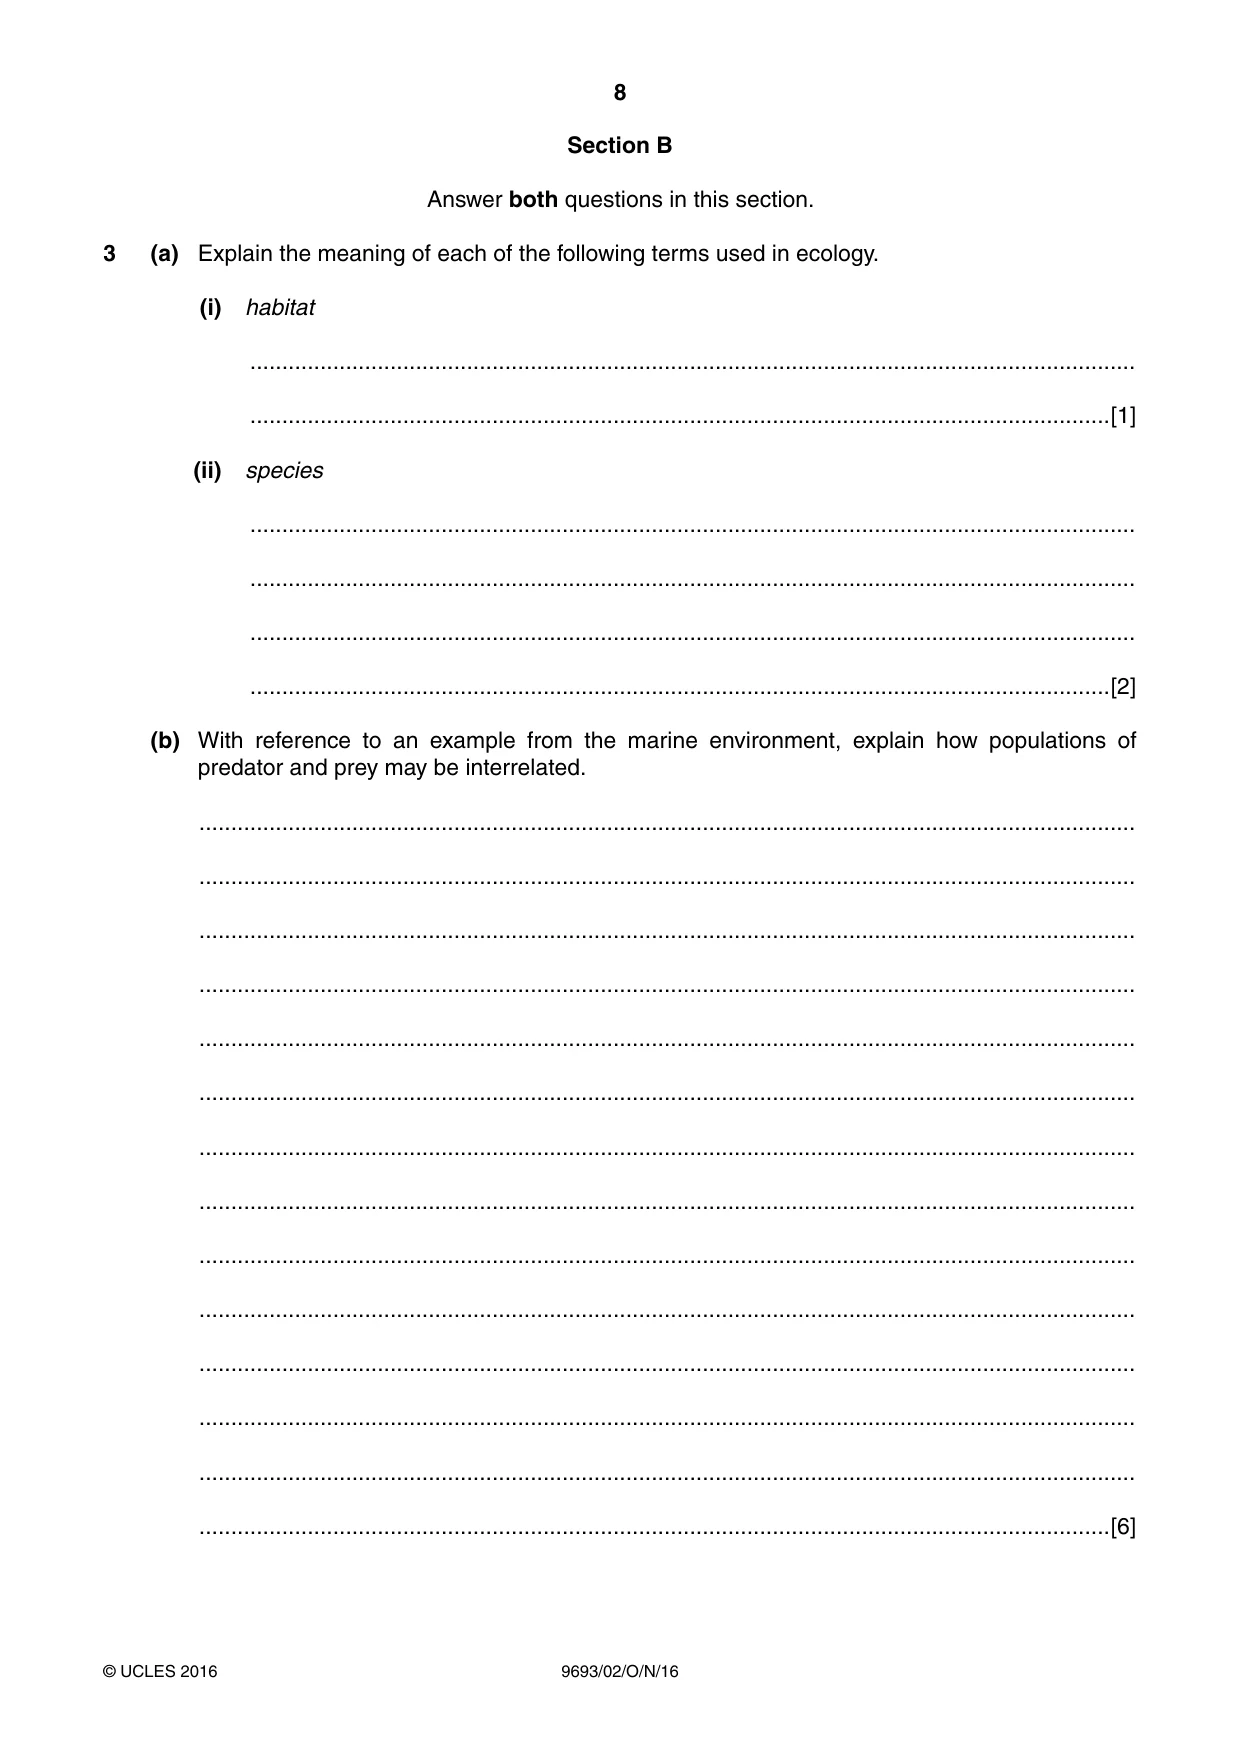
8 9693/02/O/N/16 © UCLES 2016 Section B Answer both questions in this section. 3 (a) Explain the meaning of each of the following terms used in ecology. (i) habitat … …[1] (ii) species … … … …[2] (b) With reference to an example from the marine environment, explain how populations of predator and prey may be interrelated. … … … … … … … … … … … … … …[6]
Question paper, page 9
9 9693/02/O/N/16 © UCLES 2016 [Turn over (c) Explain why coral reefs tend to contain narrow ecological niches. … … … … … … … … … … … … … …[6] [Total: 15]
Question paper, page 10
10 9693/02/O/N/16 © UCLES 2016 4 (a) Explain how the alignment of the Sun, the Moon and Earth affect the tidal range. … … … … … … … … … … … … …[6] (b) Explain how a region of low pressure over an ocean can develop into a tropical cyclone. … … … … … … … … … … … … …[6]
Question paper, page 11
11 9693/02/O/N/16 © UCLES 2016 (c) Suggest why the concentration of dissolved oxygen may be lower in a tropical lagoon than in the open ocean. … … … … … … …[3] [Total: 15]
Question paper, page 12
12 9693/02/O/N/16 © UCLES 2016 Permission to reproduce items where third-party owned material protected by copyright is included has been sought and cleared where possible. Every reasonable effort has been made by the publisher (UCLES) to trace copyright holders, but if any items requiring clearance have unwittingly been included, the publisher will be pleased to make amends at the earliest possible opportunity. To avoid the issue of disclosure of answer-related information to candidates, all copyright acknowledgements are reproduced online in the Cambridge International Examinations Copyright Acknowledgements Booklet. This is produced for each series of examinations and is freely available to download at www.cie.org.uk after the live examination series. Cambridge International Examinations is part of the Cambridge Assessment Group. Cambridge Assessment is the brand name of University of Cambridge Local Examinations Syndicate (UCLES), which is itself a department of the University of Cambridge. BLANK PAGE
Mark scheme, page 1
® IGCSE is the registered trademark of Cambridge International Examinations. This document consists of 6 printed pages. © UCLES 2016 [Turn over Cambridge International Examinations Cambridge International Advanced Subsidiary and Advanced Level MARINE SCIENCE 9693/02 Paper 2 AS Data-Handling and Free Response October/November 2016 MARK SCHEME Maximum Mark: 50 Published This mark scheme is published as an aid to teachers and candidates, to indicate the requirements of the examination. It shows the basis on which Examiners were instructed to award marks. It does not indicate the details of the discussions that took place at an Examiners’ meeting before marking began, which would have considered the acceptability of alternative answers. Mark schemes should be read in conjunction with the question paper and the Principal Examiner Report for Teachers. Cambridge will not enter into discussions about these mark schemes. Cambridge is publishing the mark schemes for the October/November 2016 series for most Cambridge IGCSE®, Cambridge International A and AS Level components and some Cambridge O Level components.
Mark scheme, page 2
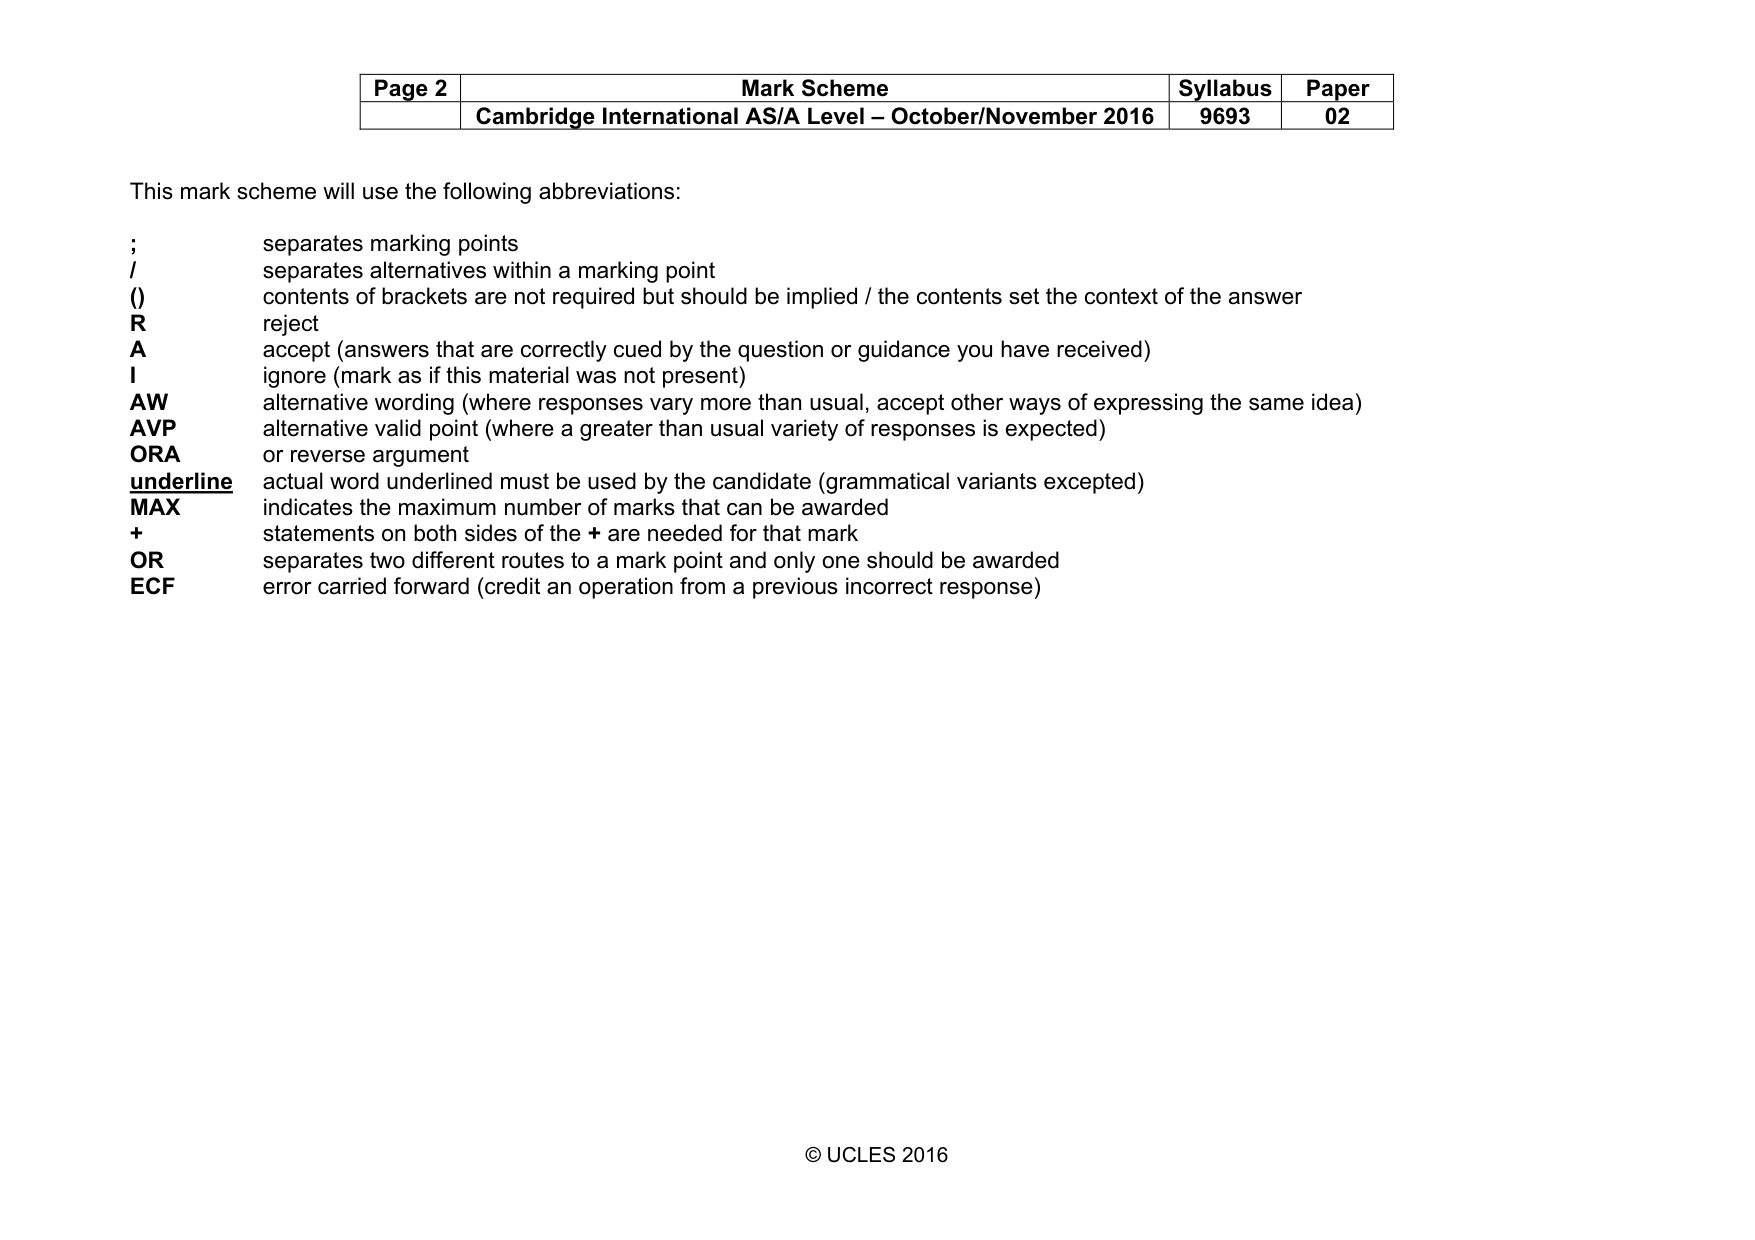
Page 2 Mark Scheme Syllabus Paper Cambridge International AS/A Level – October/November 2016 9693 02 © UCLES 2016 This mark scheme will use the following abbreviations: ; separates marking points / separates alternatives within a marking point () contents of brackets are not required but should be implied / the contents set the context of the answer R reject A accept (answers that are correctly cued by the question or guidance you have received) I ignore (mark as if this material was not present) AW alternative wording (where responses vary more than usual, accept other ways of expressing the same idea) AVP alternative valid point (where a greater than usual variety of responses is expected) ORA or reverse argument underline actual word underlined must be used by the candidate (grammatical variants excepted) MAX indicates the maximum number of marks that can be awarded + statements on both sides of the + are needed for that mark OR separates two different routes to a mark point and only one should be awarded ECF error carried forward (credit an operation from a previous incorrect response)
Mark scheme, page 3
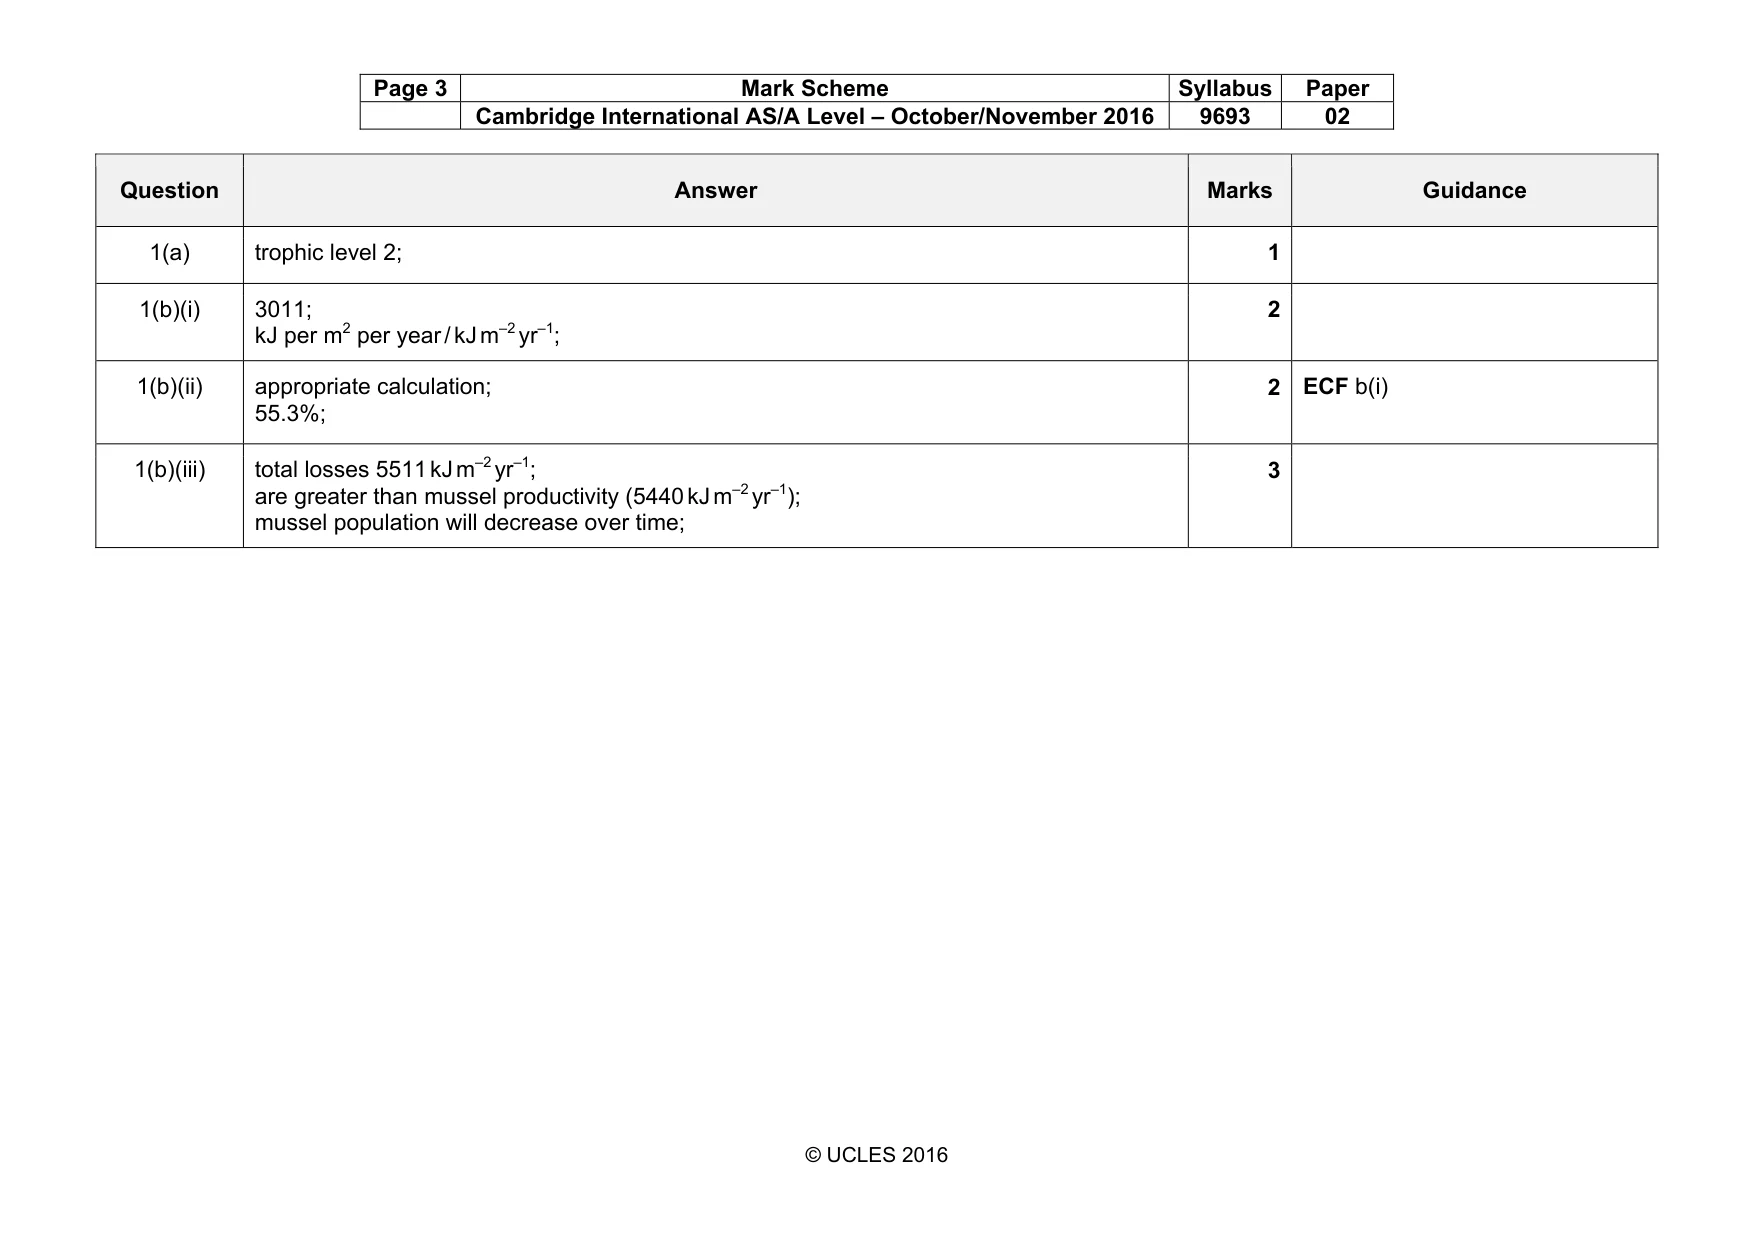
Page 3 Mark Scheme Syllabus Paper Cambridge International AS/A Level – October/November 2016 9693 02 © UCLES 2016 Question Answer Marks Guidance 1(a) trophic level 2; 1 1(b)(i) 3011; kJ per m2 per year / kJ m–2 yr–1; 2 1(b)(ii) appropriate calculation; 55.3%; 2 ECF b(i) 1(b)(iii) total losses 5511 kJ m–2 yr–1; are greater than mussel productivity (5440 kJ m–2 yr–1); mussel population will decrease over time; 3
Mark scheme, page 4
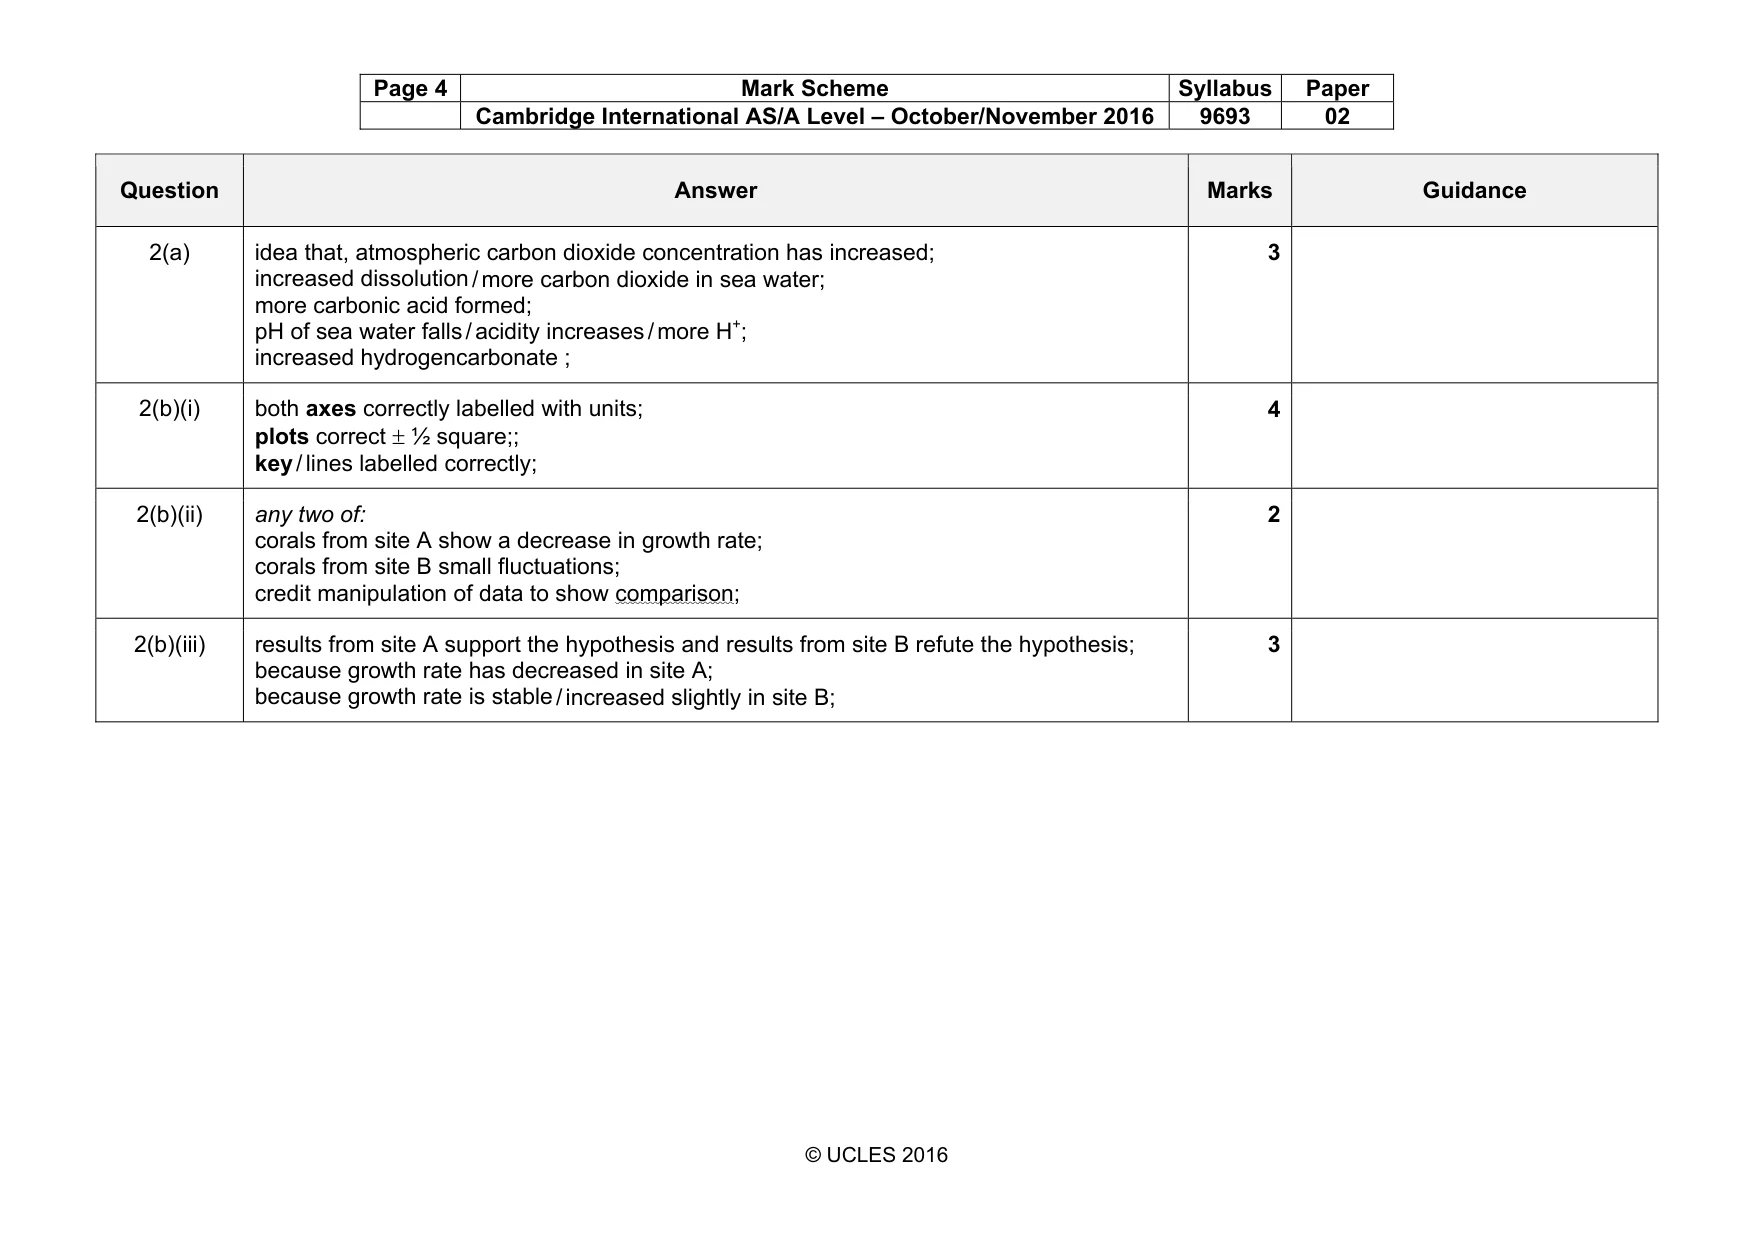
Page 4 Mark Scheme Syllabus Paper Cambridge International AS/A Level – October/November 2016 9693 02 © UCLES 2016 Question Answer Marks Guidance 2(a) idea that, atmospheric carbon dioxide concentration has increased; increased dissolution / more carbon dioxide in sea water; more carbonic acid formed; pH of sea water falls / acidity increases / more H+; increased hydrogencarbonate ; 3 2(b)(i) both axes correctly labelled with units; plots correct ± ½ square;; key / lines labelled correctly; 4 2(b)(ii) any two of: corals from site A show a decrease in growth rate; corals from site B small fluctuations; credit manipulation of data to show comparison; 2 2(b)(iii) results from site A support the hypothesis and results from site B refute the hypothesis; because growth rate has decreased in site A; because growth rate is stable / increased slightly in site B; 3
Mark scheme, page 5
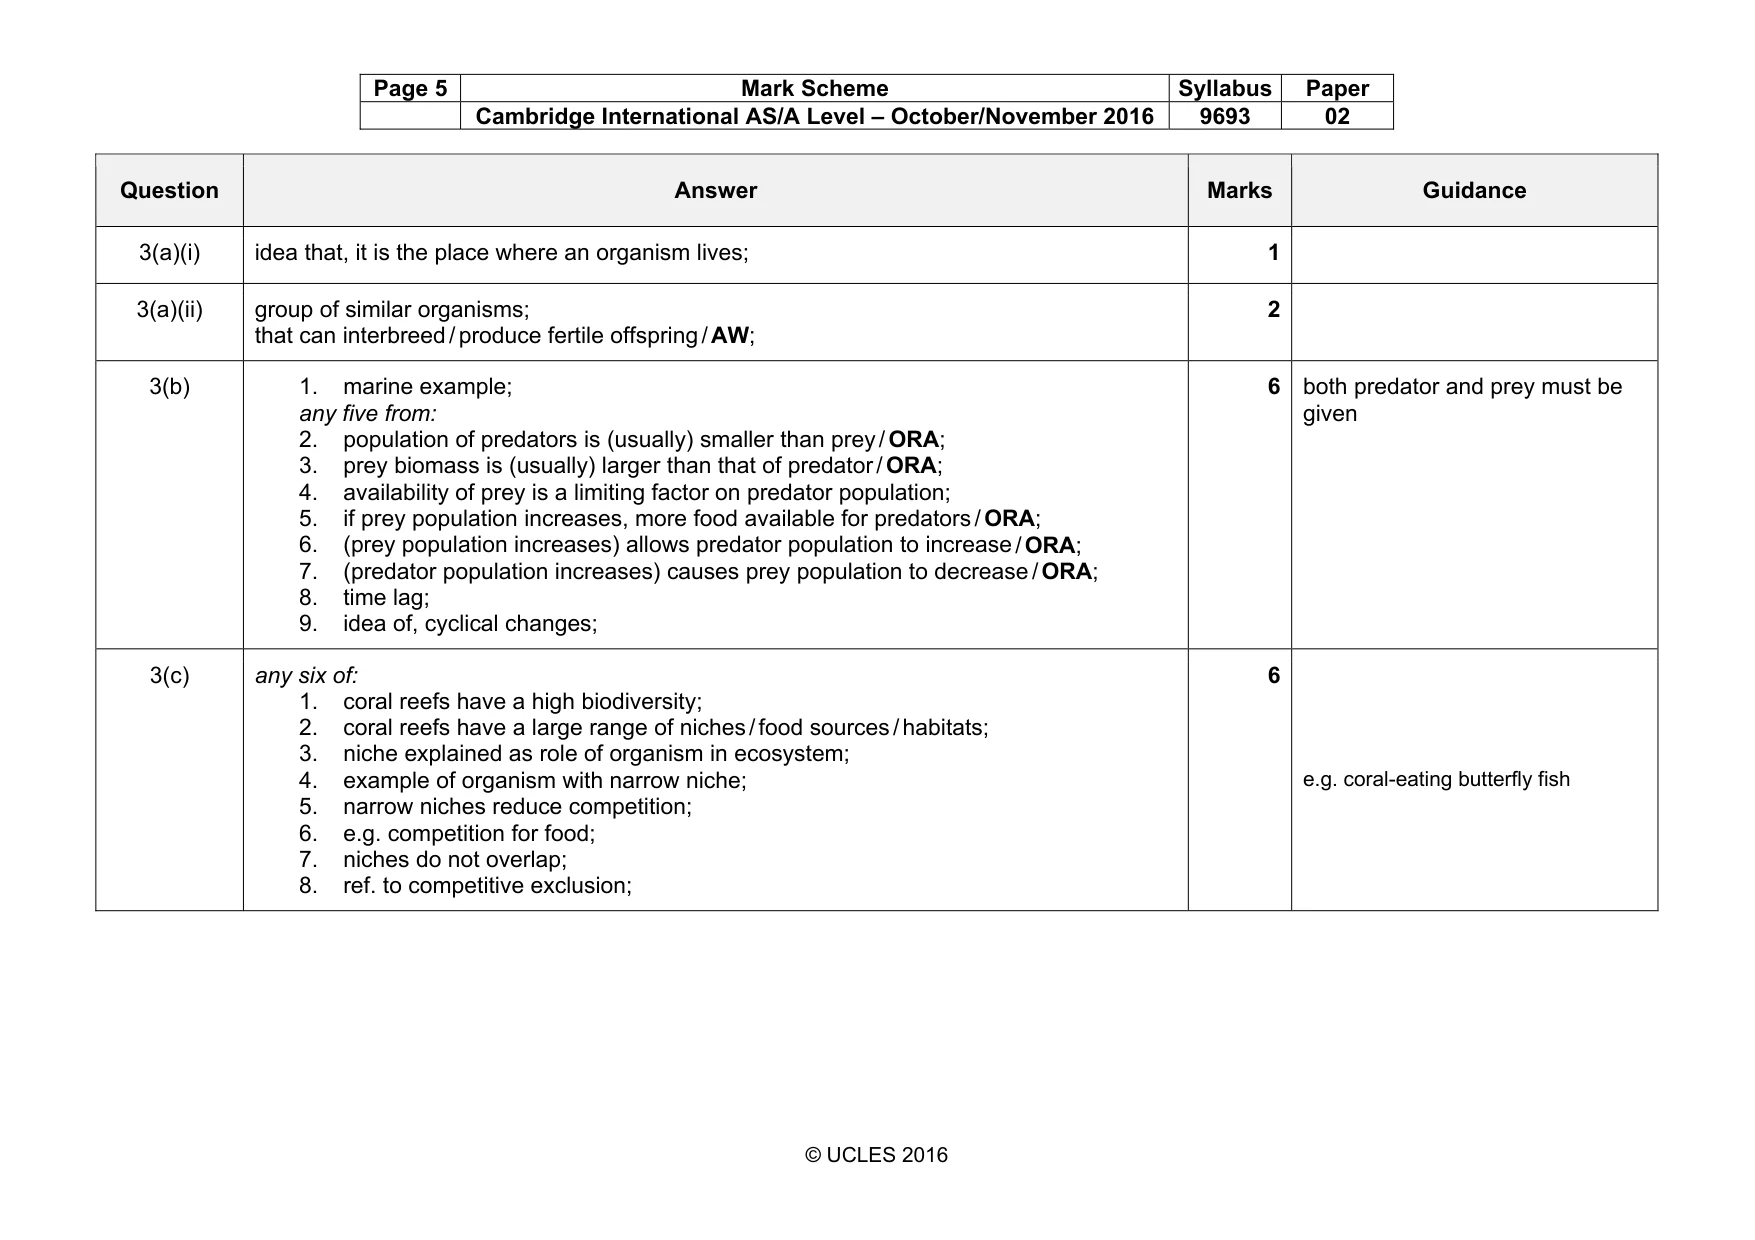
Page 5 Mark Scheme Syllabus Paper Cambridge International AS/A Level – October/November 2016 9693 02 © UCLES 2016 Question Answer Marks Guidance 3(a)(i) idea that, it is the place where an organism lives; 1 3(a)(ii) group of similar organisms; that can interbreed / produce fertile offspring / AW; 2 3(b) 1. marine example; any five from: 2. population of predators is (usually) smaller than prey / ORA; 3. prey biomass is (usually) larger than that of predator / ORA; 4. availability of prey is a limiting factor on predator population; 5. if prey population increases, more food available for predators / ORA; 6. (prey population increases) allows predator population to increase / ORA; 7. (predator population increases) causes prey population to decrease / ORA; 8. time lag; 9. idea of, cyclical changes; 6 both predator and prey must be given 3(c) any six of: 1. coral reefs have a high biodiversity; 2. coral reefs have a large range of niches / food sources / habitats; 3. niche explained as role of organism in ecosystem; 4. example of organism with narrow niche; 5. narrow niches reduce competition; 6. e.g. competition for food; 7. niches do not overlap; 8. ref. to competitive exclusion; 6 e.g. coral-eating butterfly fish
Mark scheme, page 6
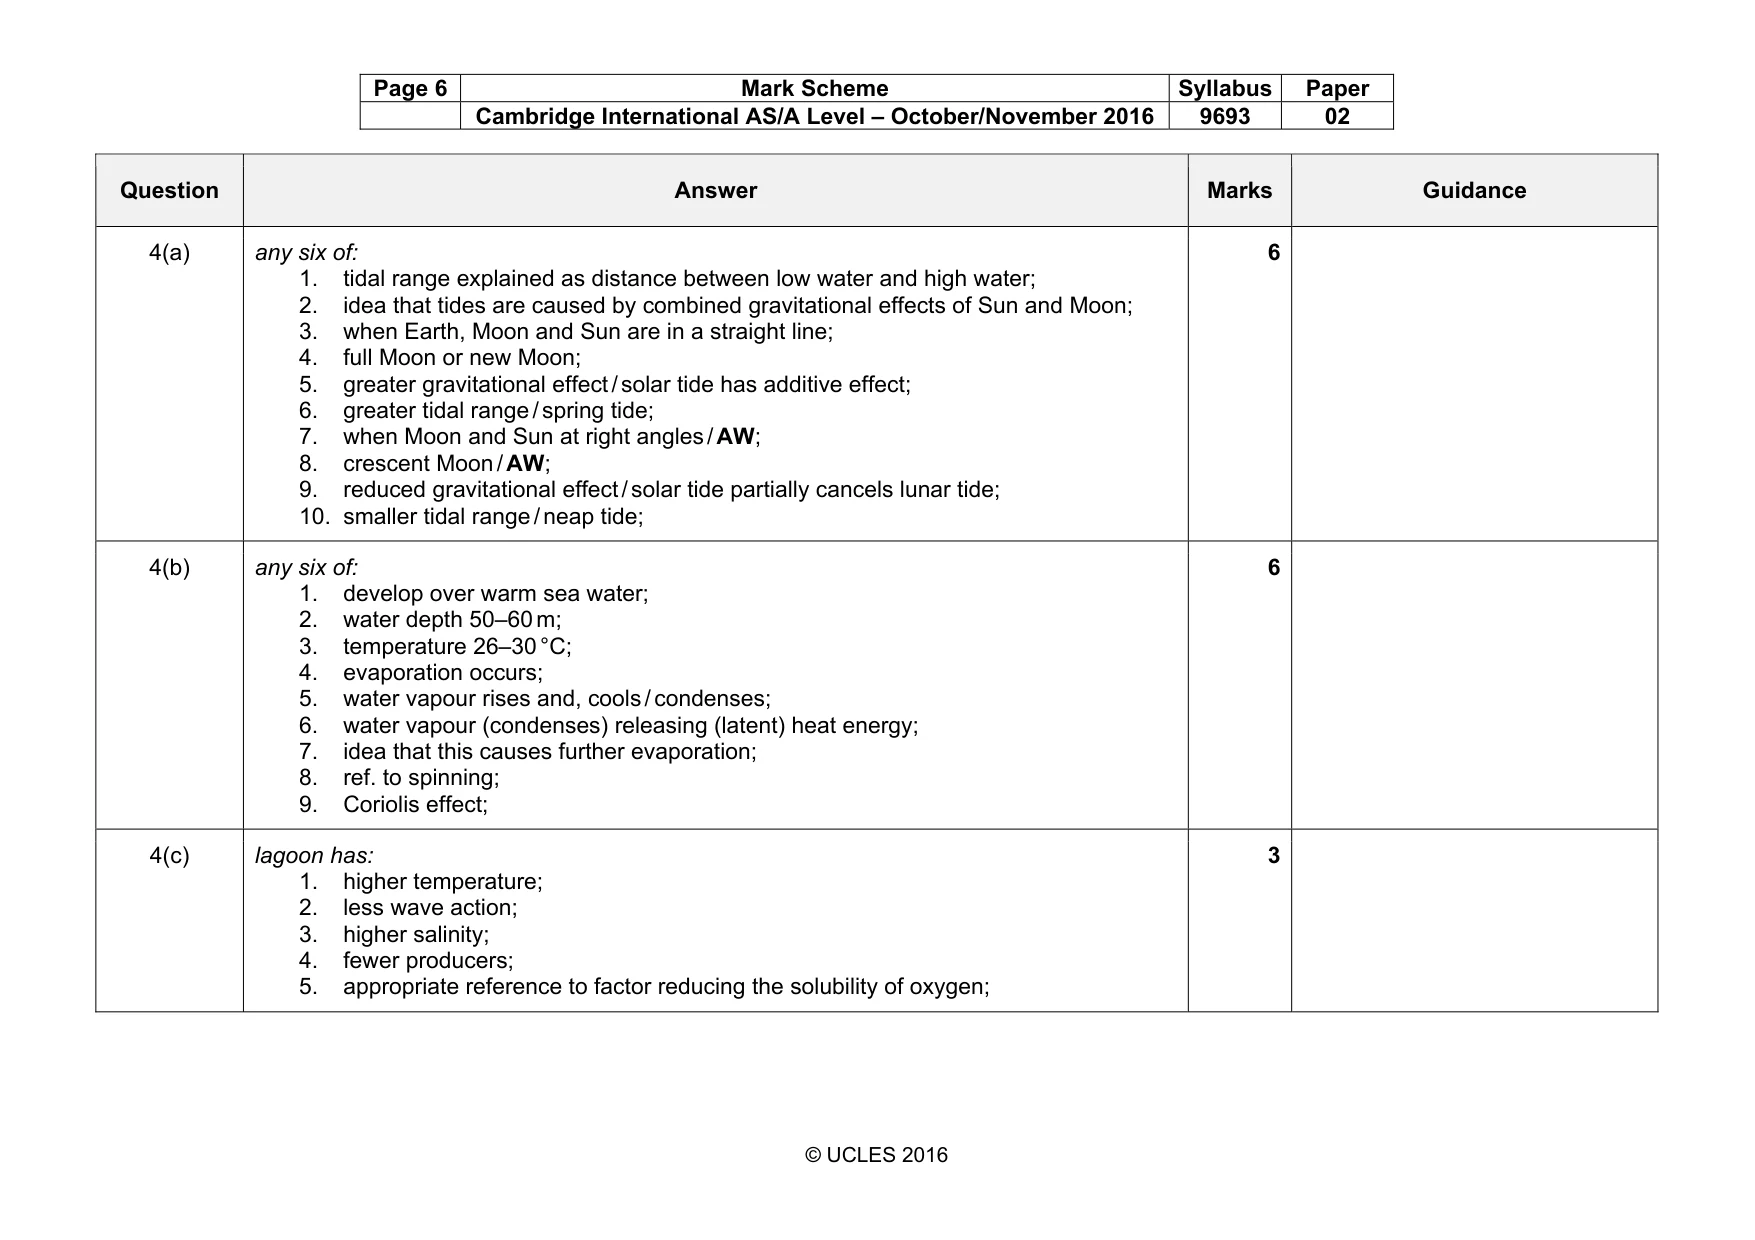
Page 6 Mark Scheme Syllabus Paper Cambridge International AS/A Level – October/November 2016 9693 02 © UCLES 2016 Question Answer Marks Guidance 4(a) any six of: 1. tidal range explained as distance between low water and high water; 2. idea that tides are caused by combined gravitational effects of Sun and Moon; 3. when Earth, Moon and Sun are in a straight line; 4. full Moon or new Moon; 5. greater gravitational effect / solar tide has additive effect; 6. greater tidal range / spring tide; 7. when Moon and Sun at right angles / AW; 8. crescent Moon / AW; 9. reduced gravitational effect / solar tide partially cancels lunar tide; 10. smaller tidal range / neap tide; 6 4(b) any six of: 1. develop over warm sea water; 2. water depth 50–60 m; 3. temperature 26–30 °C; 4. evaporation occurs; 5. water vapour rises and, cools / condenses; 6. water vapour (condenses) releasing (latent) heat energy; 7. idea that this causes further evaporation; 8. ref. to spinning; 9. Coriolis effect; 6 4(c) lagoon has: 1. higher temperature; 2. less wave action; 3. higher salinity; 4. fewer producers; 5. appropriate reference to factor reducing the solubility of oxygen; 3
What you needed in this session
Cambridge’s own grade thresholds for 2016 Oct/Nov, Paper 2 · Variant 1. A higher threshold means an easier paper — the bar moves with how the cohort did.