Cambridge A Level Geography 9696 — 2018 May/June Paper 4 · Variant 1
9696/41/M/J/18 · 12 questions · 60 marks · ≈68 min
The question paper and its mark scheme, free to read here and free to download. This is Cambridge’s own paper, exactly as it was sat.
Question paper4 pages

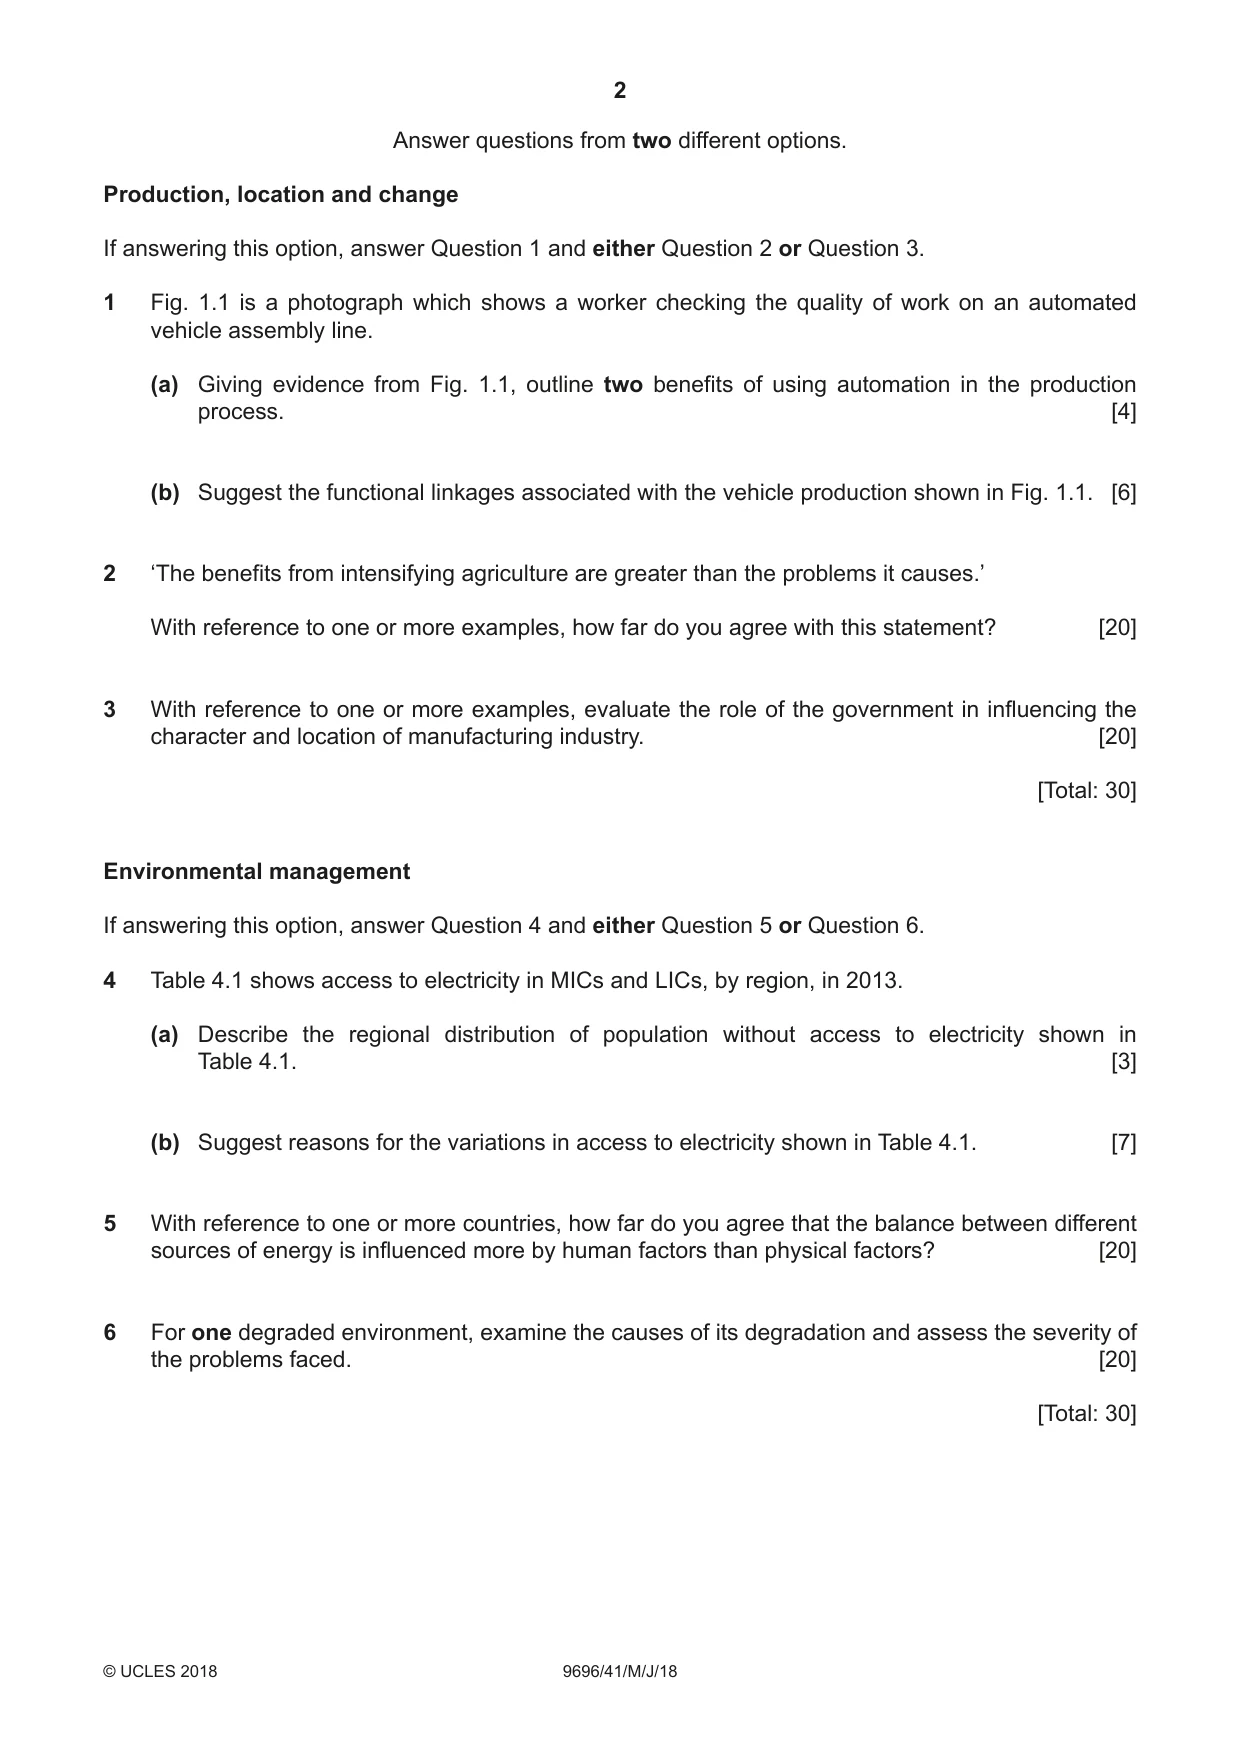
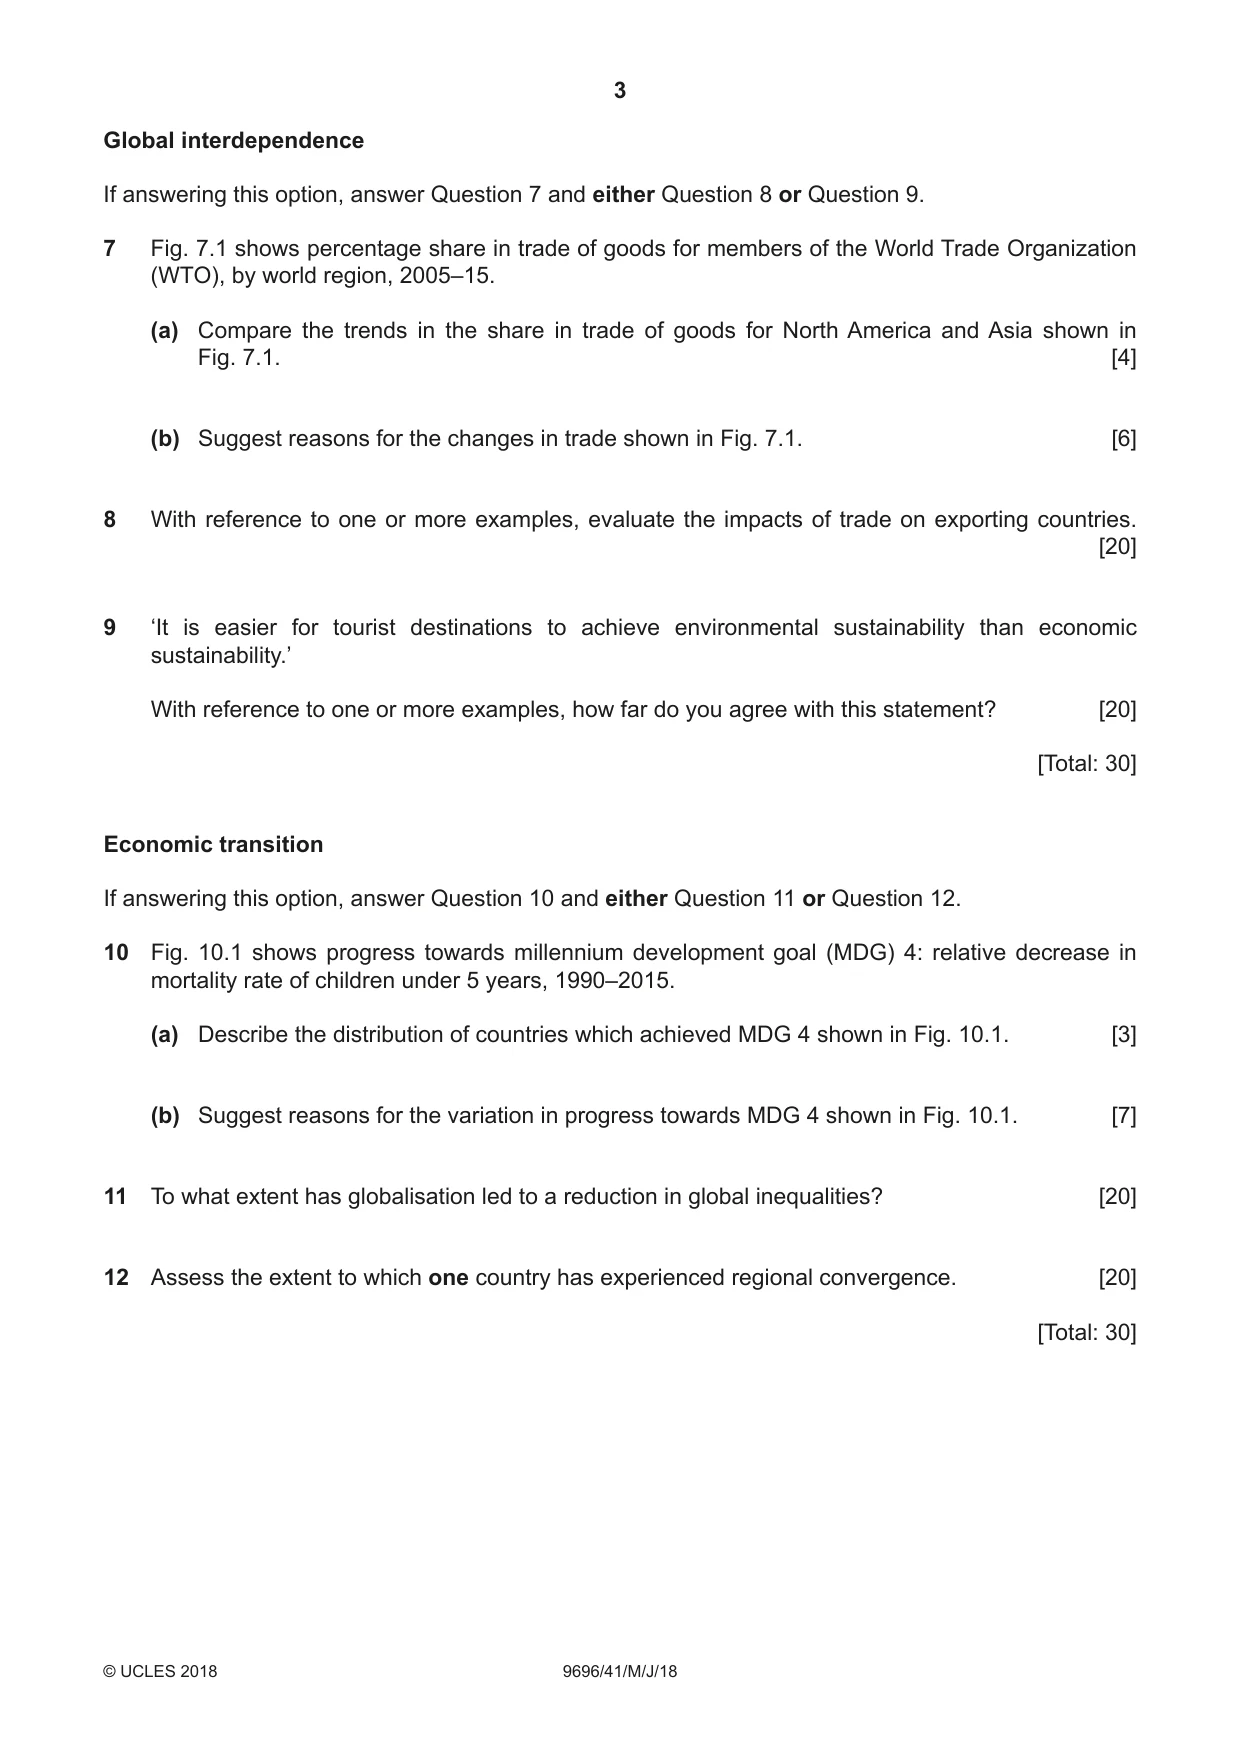

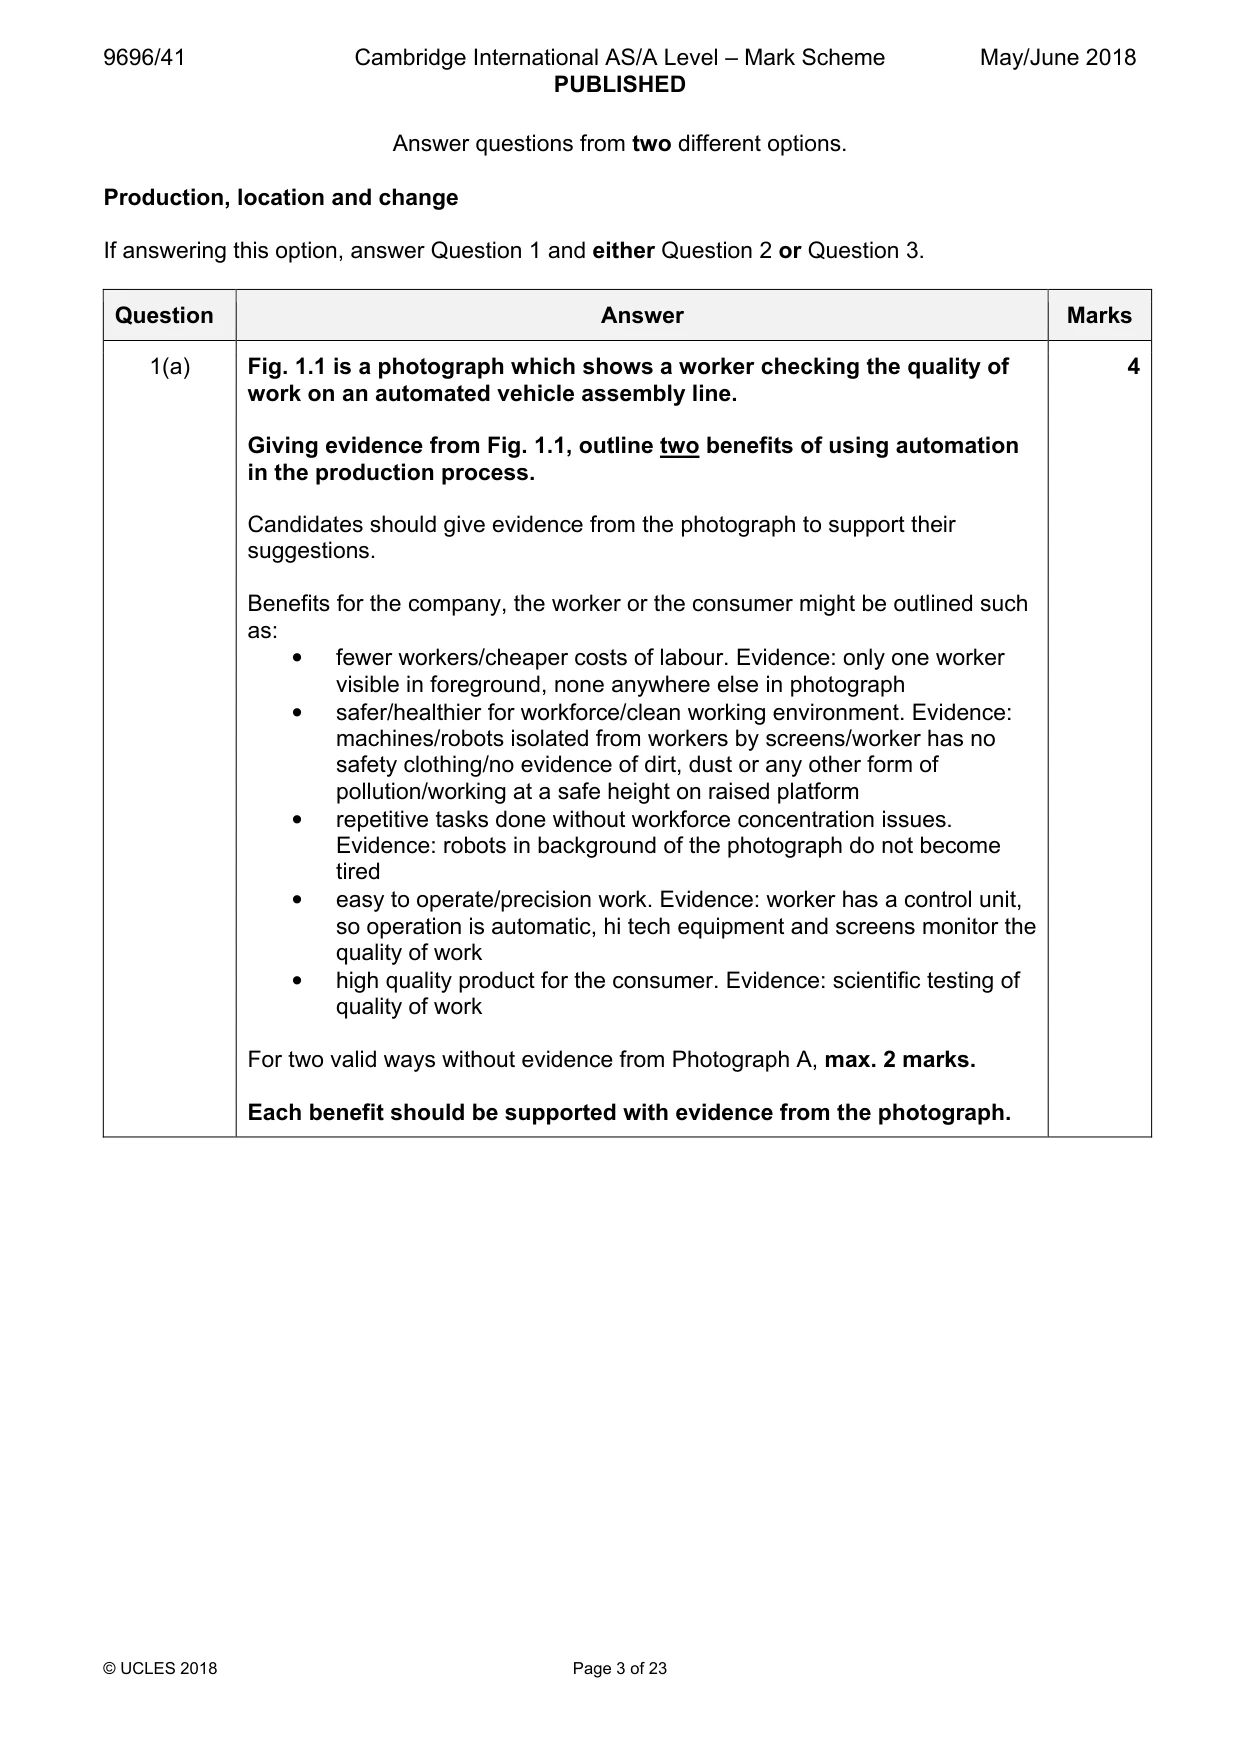
Mark scheme23 pages
Answers below. Sit the paper first if you are practising.



Questions as text
Q1 · A photograph which shows a worker checking the quality of work on an automated vehicle…
1 Fig. 1.1 is a photograph which shows a worker checking the quality of work on an automated vehicle assembly line. (a) Giving evidence from Fig. 1.1, outline two benefits of using automation in the production process. [4] (b) Suggest the functional linkages associated with the vehicle production shown in Fig. 1.1. [6]
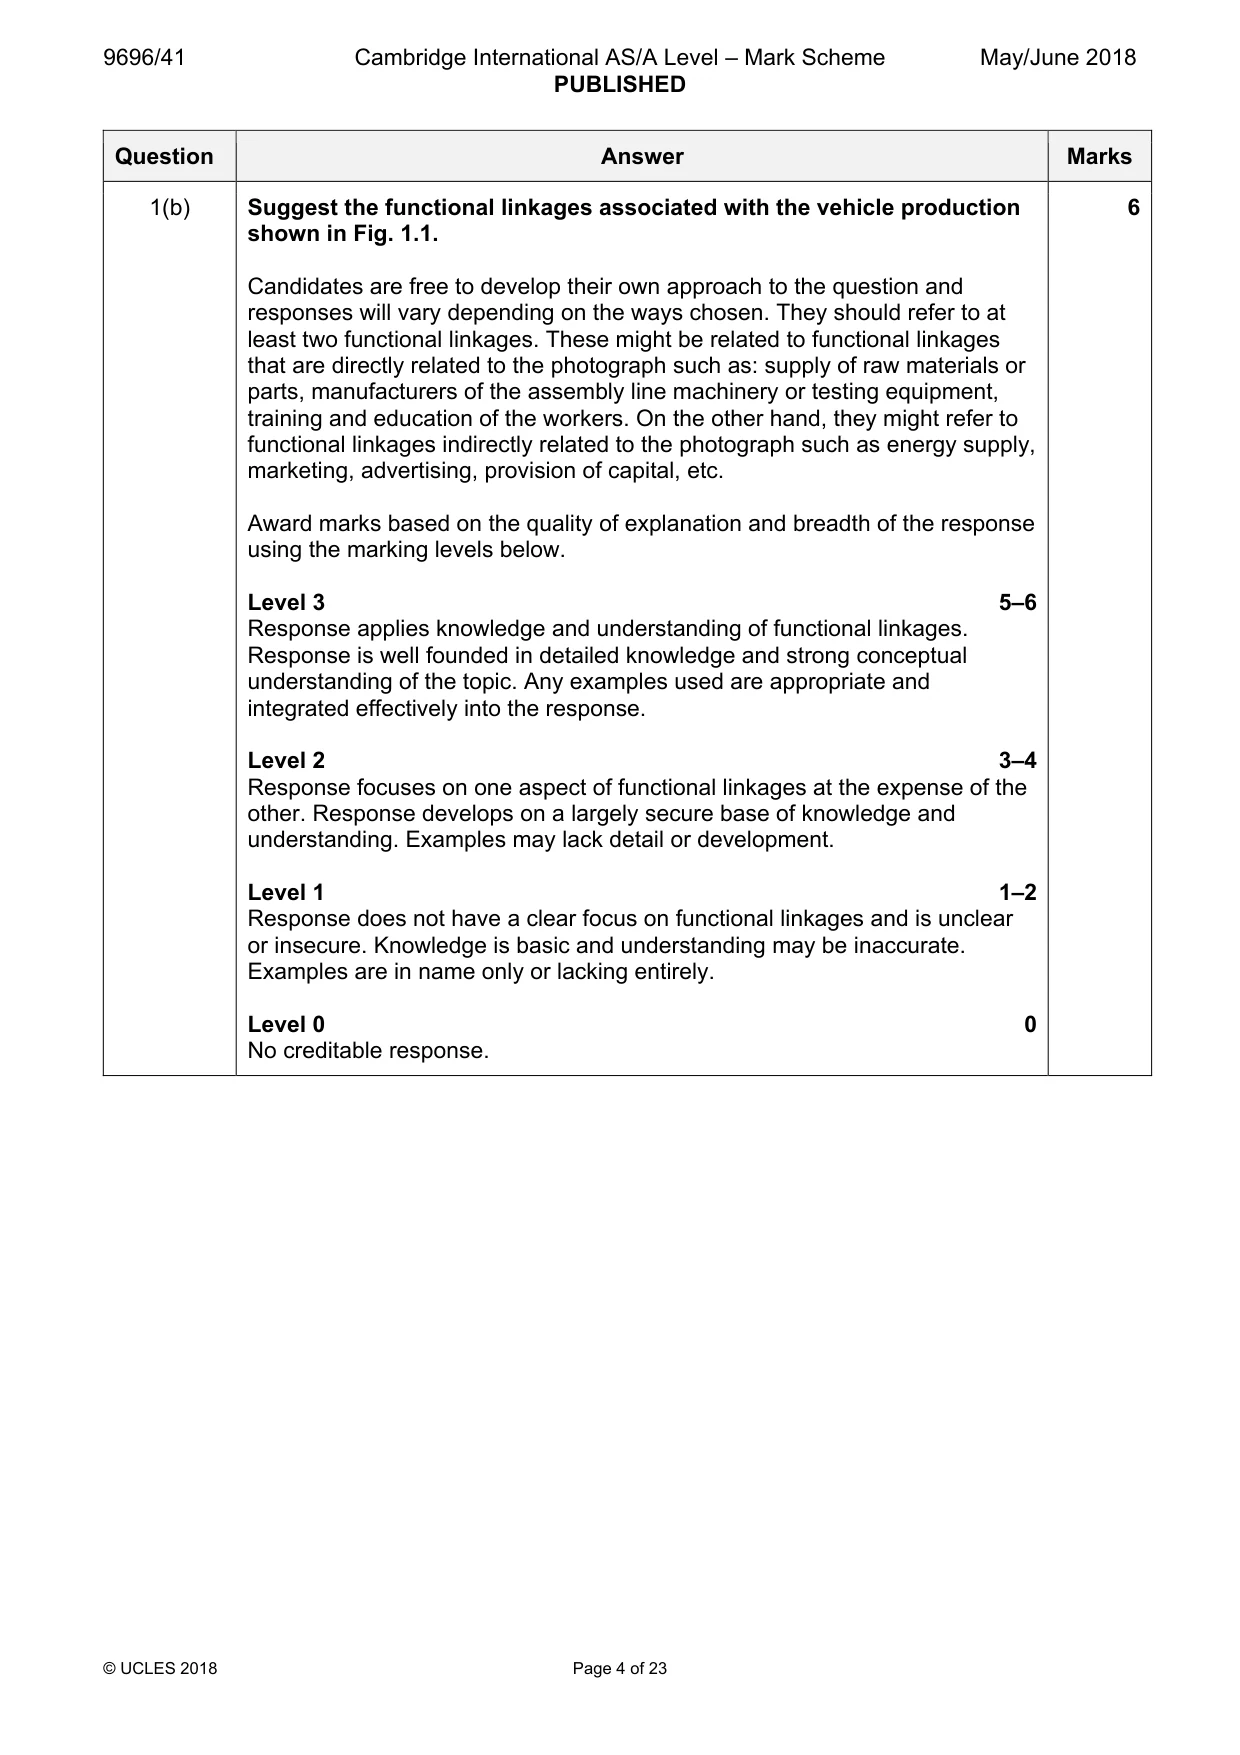
Mark scheme: Question Answer Marks 1(a) Fig. 1.1 is a photograph which shows a worker checking the quality of 4 work on an automated vehicle assembly line. Giving evidence from Fig. 1.1, outline two benefits of using automation in the production process. Candidates should give evidence from the photograph to support their suggestions. Benefits for the company, the worker or the consumer might be outlined such as: • fewer workers/cheaper costs of labour. Evidence: only one worker visible in foreground, none anywhere else in photograph • safer/healthier for workforce/clean working environment. Evidence: machines/robots isolated from workers by screens/worker has no safety clothing/no evidence of dirt, dust or any other form of pollution/working at a safe height on raised platform • repetitive tasks done without workforce concentration issues. Evidence: robots in background of the photograph do not become tired • easy to operate/precision work. Evidence: worker has a control unit, so operation is automatic, hi tech equipment and screens monitor the quality of work • high quality product for the consumer. Evidence: scientific testing of quality of work For two valid ways without evidence from Photograph A, max. 2 marks. Each benefit should be supported with evidence from the photograph. 1(b) Suggest the functional linkages associated with the vehicle production 6 shown in Fig. 1.1. Candidates are free to develop their own approach to the question and responses will vary depending on the ways chosen. They should refer to at least two functional linkages. These might be related to functional linkages that are directly related to the photograph such as: supply of raw materials or parts, manufacturers of the assembly line machinery or testing equipment, training and education of the workers. On the other hand, they might refer to functional linkages indirectly related to the photograph such as energy supply, marketing, advertising, provision of capital, etc. Award marks based on the quality of explanation and breadth of the response using the marking levels below. Level 3 5–6 Response applies knowledge and understanding of functional linkages. Response is well founded in detailed knowledge and strong conceptual understanding of the topic. Any examples used are appropriate and integrated effectively into the response. Level 2 3–4 Response focuses on one aspect of functional linkages at the expense of the other. Response develops on a largely secure base of knowledge and understanding. Examples may lack detail or development. Level 1 1–2 Response does not have a clear focus on functional linkages and is unclear or insecure. Knowledge is basic and understanding may be inaccurate. Examples are in name only or lacking entirely. Level 0 0 No creditable response.
Q2 · ‘The benefits from intensifying agriculture are greater than the problems it causes.’…
2 ‘The benefits from intensifying agriculture are greater than the problems it causes.’ With reference to one or more examples, how far do you agree with this statement? [20]
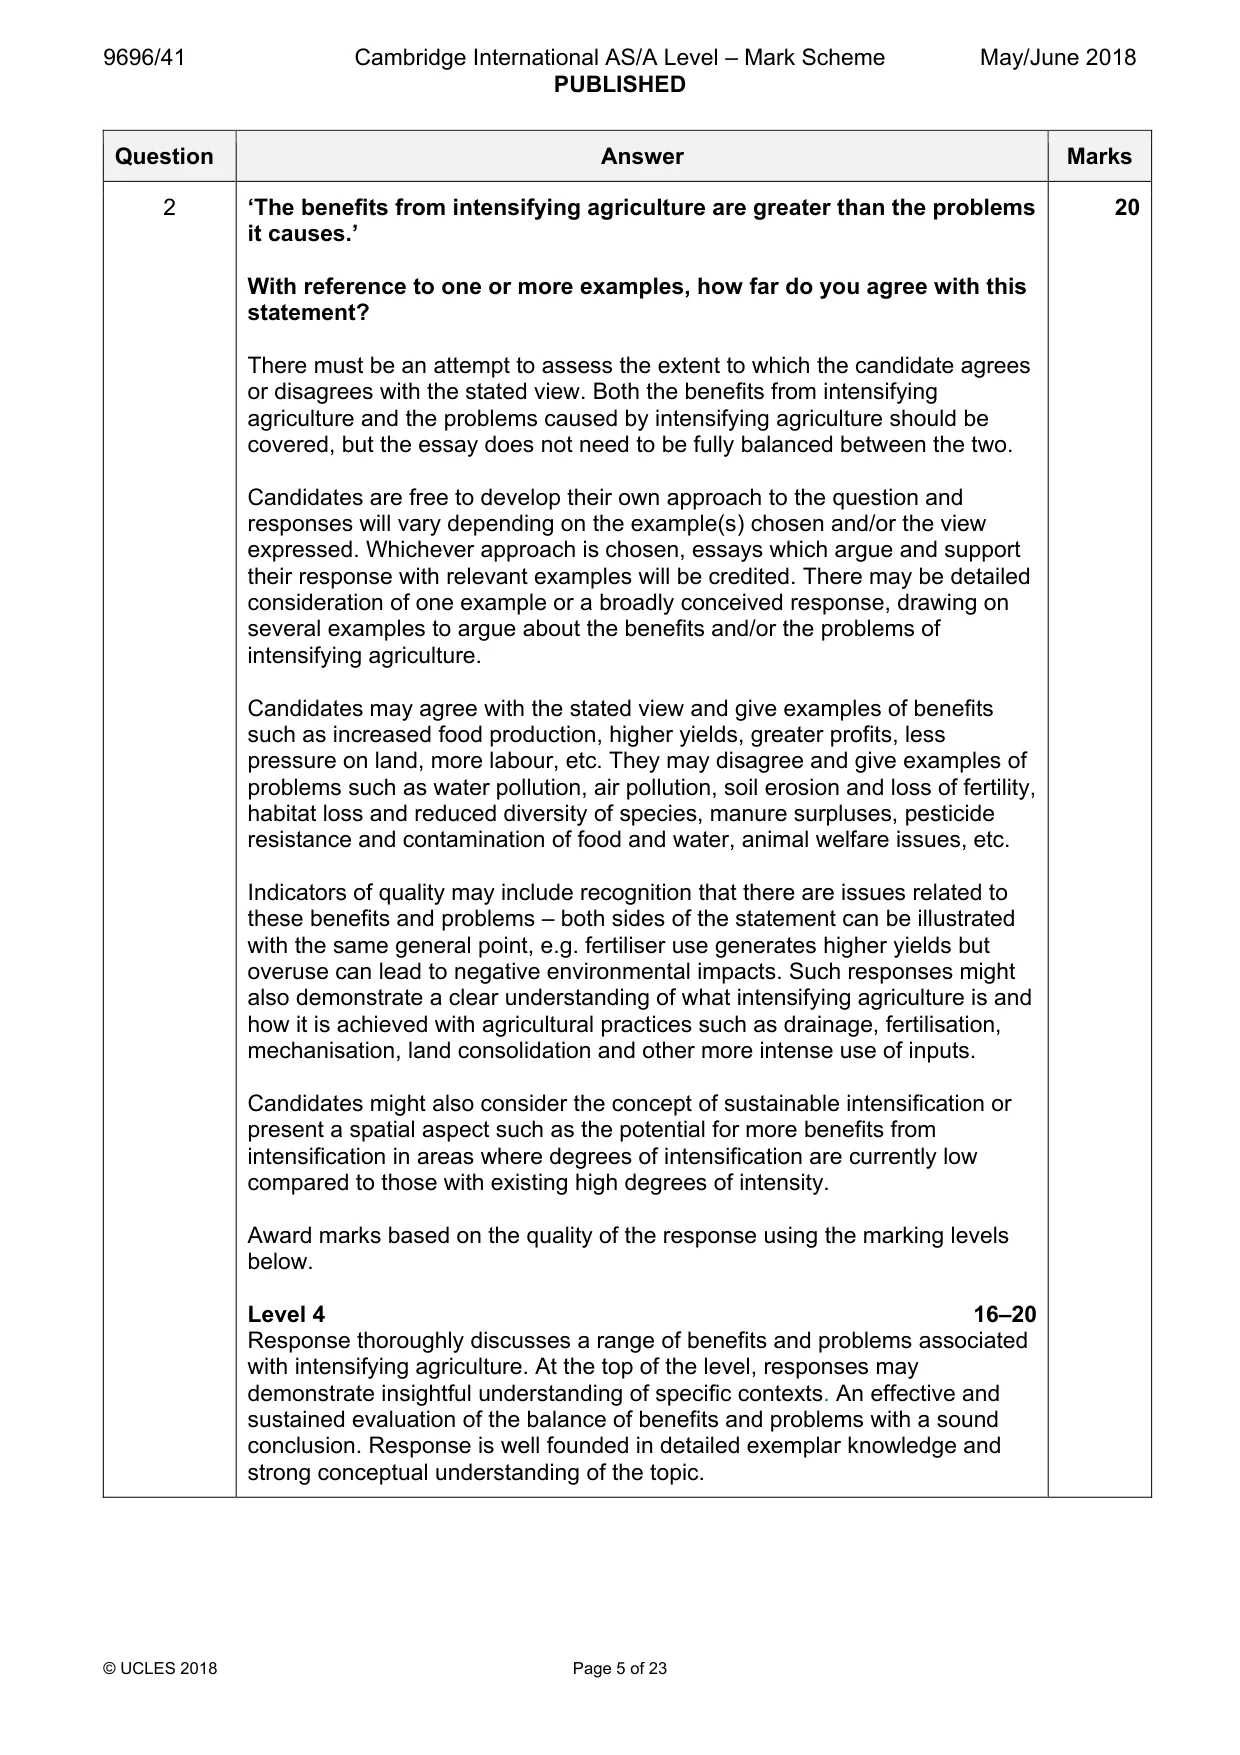
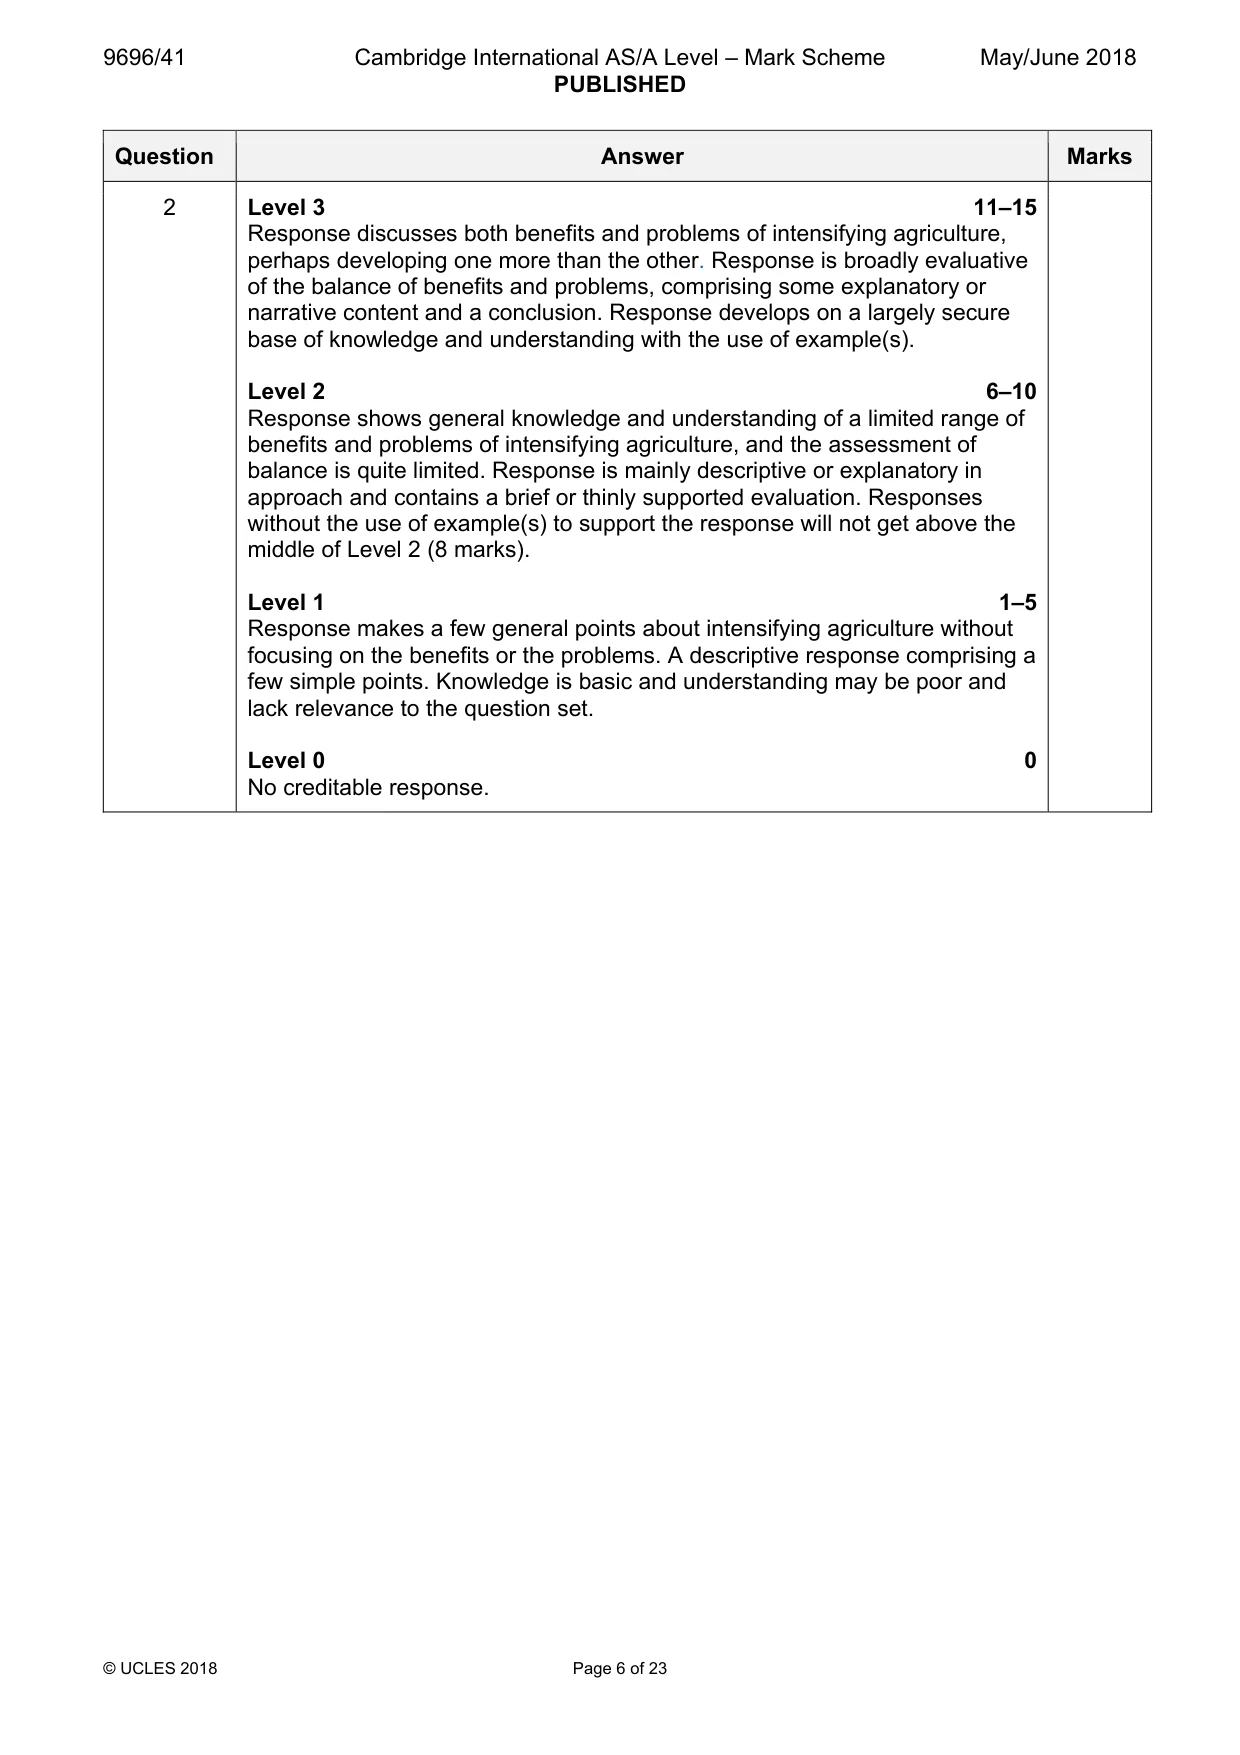
Mark scheme: 2 ‘The benefits from intensifying agriculture are greater than the problems 20 it causes.’ With reference to one or more examples, how far do you agree with this statement? There must be an attempt to assess the extent to which the candidate agrees or disagrees with the stated view. Both the benefits from intensifying agriculture and the problems caused by intensifying agriculture should be covered, but the essay does not need to be fully balanced between the two. Candidates are free to develop their own approach to the question and responses will vary depending on the example(s) chosen and/or the view expressed. Whichever approach is chosen, essays which argue and support their response with relevant examples will be credited. There may be detailed consideration of one example or a broadly conceived response, drawing on several examples to argue about the benefits and/or the problems of intensifying agriculture. Candidates may agree with the stated view and give examples of benefits such as increased food production, higher yields, greater profits, less pressure on land, more labour, etc. They may disagree and give examples of problems such as water pollution, air pollution, soil erosion and loss of fertility, habitat loss and reduced diversity of species, manure surpluses, pesticide resistance and contamination of food and water, animal welfare issues, etc. Indicators of quality may include recognition that there are issues related to these benefits and problems – both sides of the statement can be illustrated with the same general point, e.g. fertiliser use generates higher yields but overuse can lead to negative environmental impacts. Such responses might also demonstrate a clear understanding of what intensifying agriculture is and how it is achieved with agricultural practices such as drainage, fertilisation, mechanisation, land consolidation and other more intense use of inputs. Candidates might also consider the concept of sustainable intensification or present a spatial aspect such as the potential for more benefits from intensification in areas where degrees of intensification are currently low compared to those with existing high degrees of intensity. Award marks based on the quality of the response using the marking levels below. Level 4 16–20 Response thoroughly discusses a range of benefits and problems associated with intensifying agriculture. At the top of the level, responses may demonstrate insightful understanding of specific contexts. An effective and sustained evaluation of the balance of benefits and problems with a sound conclusion. Response is well founded in detailed exemplar knowledge and strong conceptual understanding of the topic. 2 Level 3 11–15 Response discusses both benefits and problems of intensifying agriculture, perhaps developing one more than the other. Response is broadly evaluative of the balance of benefits and problems, comprising some explanatory or narrative content and a conclusion. Response develops on a largely secure base of knowledge and understanding with the use of example(s). Level 2 6–10 Response shows general knowledge and understanding of a limited range of benefits and problems of intensifying agriculture, and the assessment of balance is quite limited. Response is mainly descriptive or explanatory in approach and contains a brief or thinly supported evaluation. Responses without the use of example(s) to support the response will not get above the middle of Level 2 (8 marks). Level 1 1–5 Response makes a few general points about intensifying agriculture without focusing on the benefits or the problems. A descriptive response comprising a few simple points. Knowledge is basic and understanding may be poor and lack relevance to the question set. Level 0 0 No creditable response.
Q3 · With reference to one or more examples, evaluate the role of the government in…
3 With reference to one or more examples, evaluate the role of the government in influencing the character and location of manufacturing industry. [20] [Total: 30] Environmental management If answering this option, answer Question 4 and either Question 5 or Question 6.
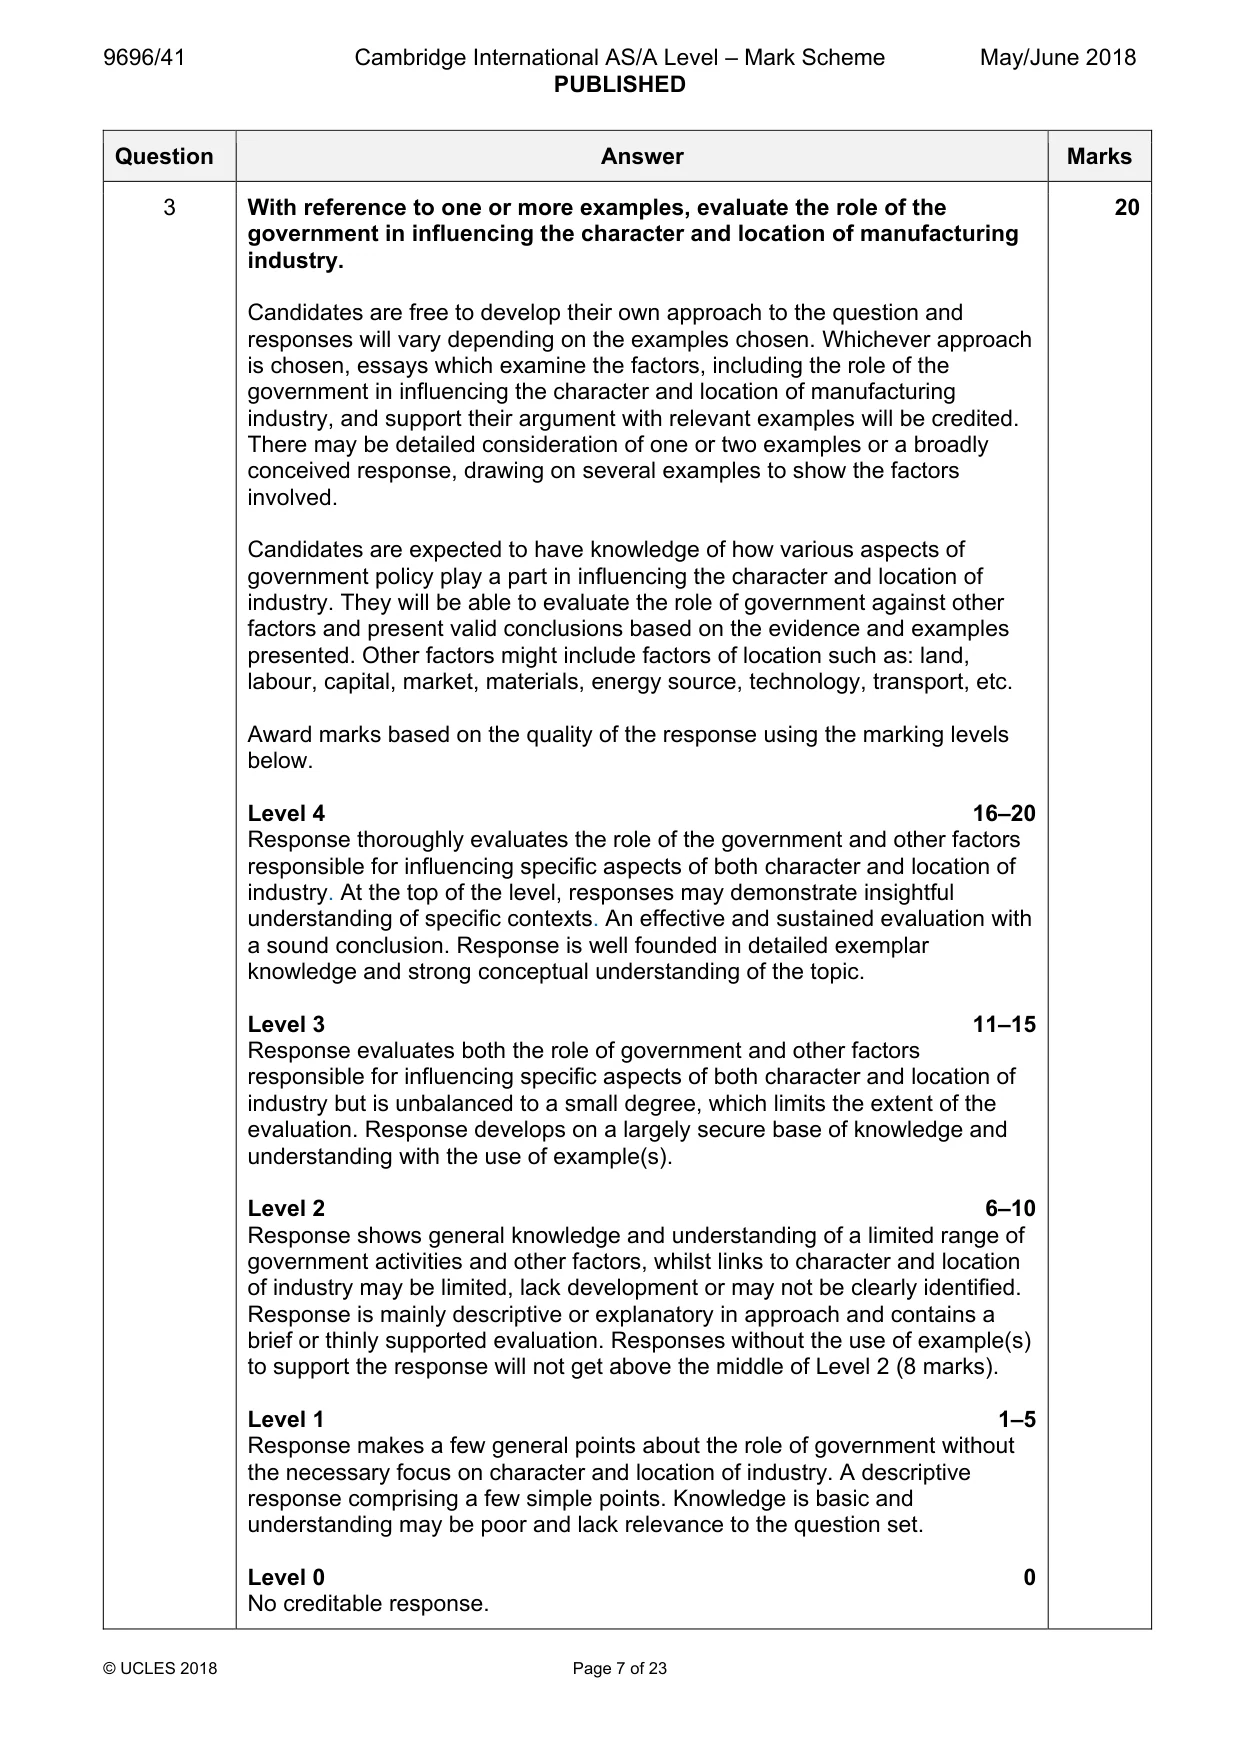
Mark scheme: 3 With reference to one or more examples, evaluate the role of the 20 government in influencing the character and location of manufacturing industry. Candidates are free to develop their own approach to the question and responses will vary depending on the examples chosen. Whichever approach is chosen, essays which examine the factors, including the role of the government in influencing the character and location of manufacturing industry, and support their argument with relevant examples will be credited. There may be detailed consideration of one or two examples or a broadly conceived response, drawing on several examples to show the factors involved. Candidates are expected to have knowledge of how various aspects of government policy play a part in influencing the character and location of industry. They will be able to evaluate the role of government against other factors and present valid conclusions based on the evidence and examples presented. Other factors might include factors of location such as: land, labour, capital, market, materials, energy source, technology, transport, etc. Award marks based on the quality of the response using the marking levels below. Level 4 16–20 Response thoroughly evaluates the role of the government and other factors responsible for influencing specific aspects of both character and location of industry. At the top of the level, responses may demonstrate insightful understanding of specific contexts. An effective and sustained evaluation with a sound conclusion. Response is well founded in detailed exemplar knowledge and strong conceptual understanding of the topic. Level 3 11–15 Response evaluates both the role of government and other factors responsible for influencing specific aspects of both character and location of industry but is unbalanced to a small degree, which limits the extent of the evaluation. Response develops on a largely secure base of knowledge and understanding with the use of example(s). Level 2 6–10 Response shows general knowledge and understanding of a limited range of government activities and other factors, whilst links to character and location of industry may be limited, lack development or may not be clearly identified. Response is mainly descriptive or explanatory in approach and contains a brief or thinly supported evaluation. Responses without the use of example(s) to support the response will not get above the middle of Level 2 (8 marks). Level 1 1–5 Response makes a few general points about the role of government without the necessary focus on character and location of industry. A descriptive response comprising a few simple points. Knowledge is basic and understanding may be poor and lack relevance to the question set. Level 0 0 No creditable response. Environmental management If answering this option, answer Question 4 and either Question 5 or Question 6.
Q4 · Access to electricity in MICs and LICs, by region, in 2013
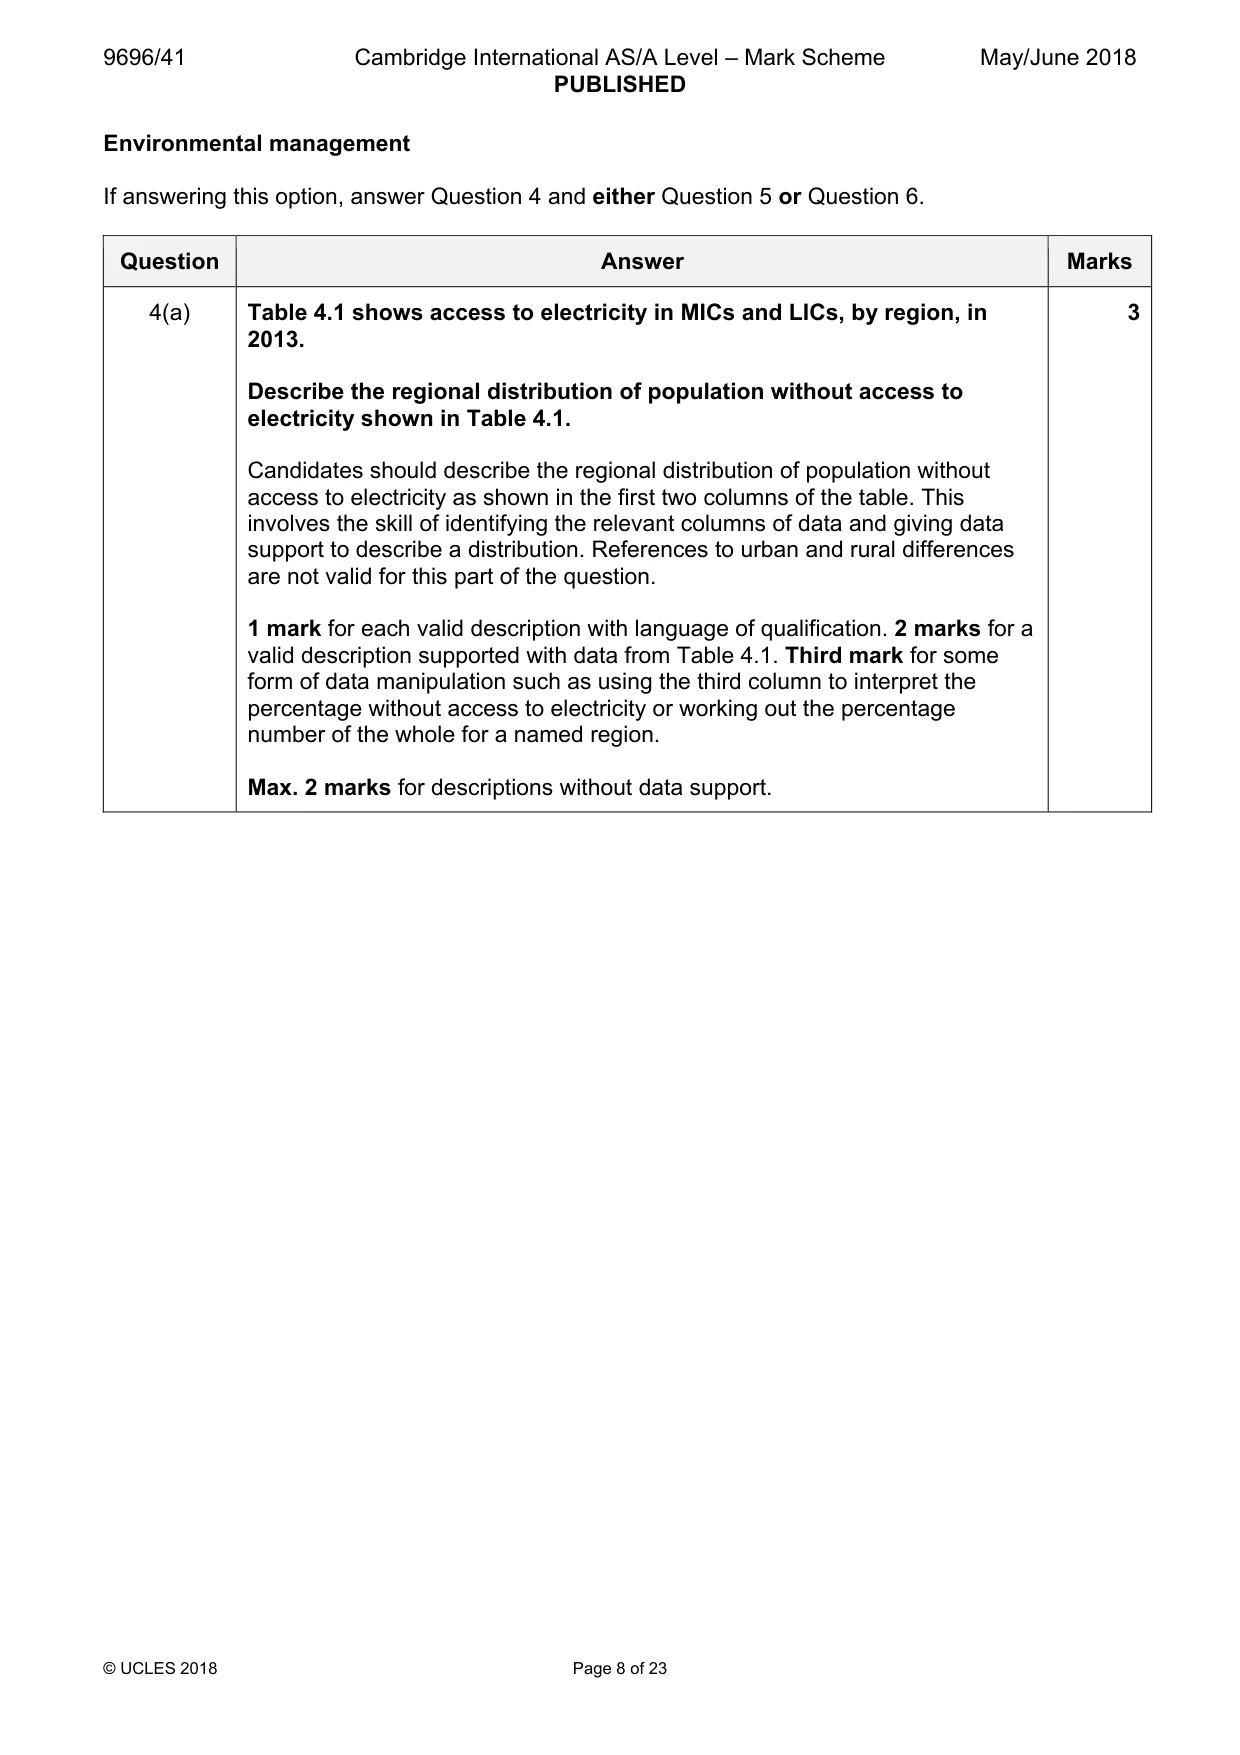
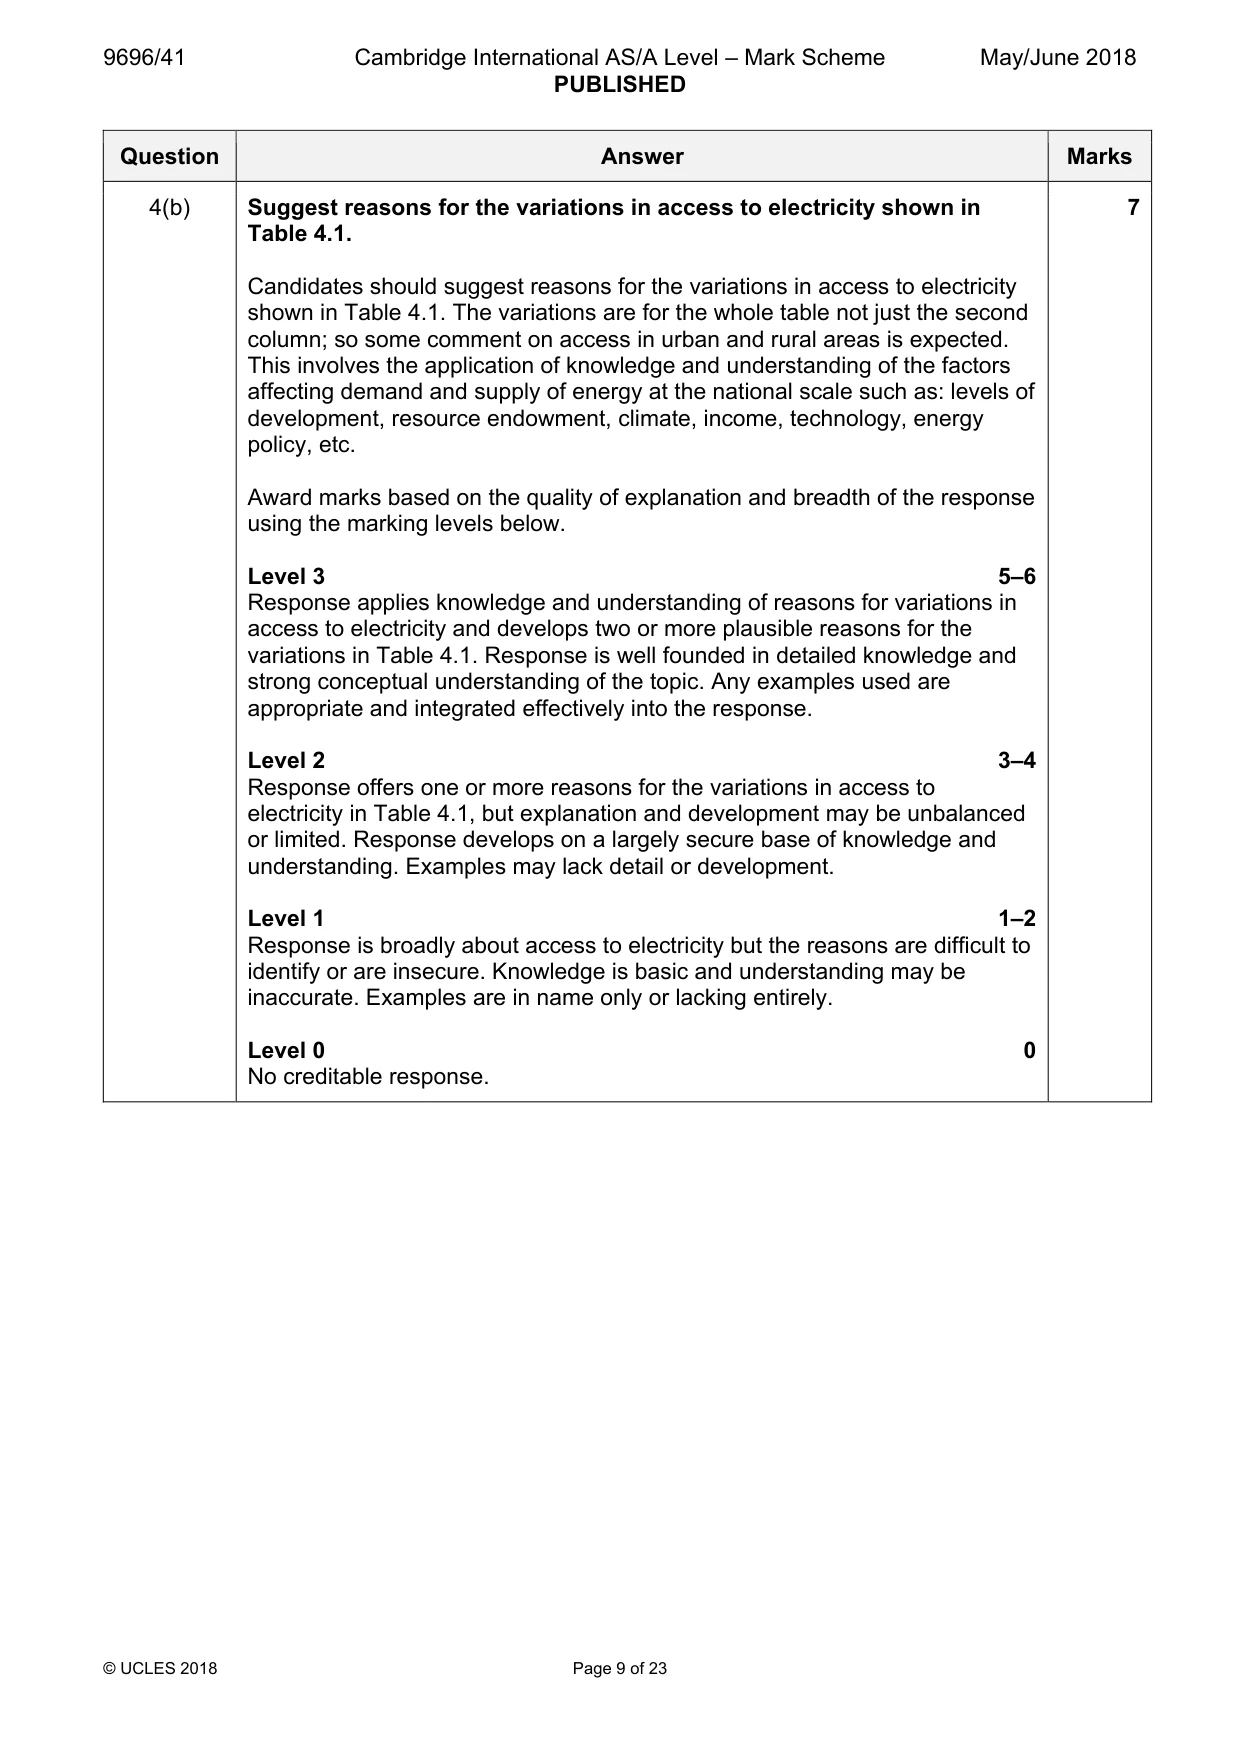
4 Table 4.1 shows access to electricity in MICs and LICs, by region, in 2013. (a) Describe the regional distribution of population without access to electricity shown in Table 4.1. [3] (b) Suggest reasons for the variations in access to electricity shown in Table 4.1. [7]
Mark scheme: 4(a) Table 4.1 shows access to electricity in MICs and LICs, by region, in 3 2013. Describe the regional distribution of population without access to electricity shown in Table 4.1. Candidates should describe the regional distribution of population without access to electricity as shown in the first two columns of the table. This involves the skill of identifying the relevant columns of data and giving data support to describe a distribution. References to urban and rural differences are not valid for this part of the question. 1 mark for each valid description with language of qualification. 2 marks for a valid description supported with data from Table 4.1. Third mark for some form of data manipulation such as using the third column to interpret the percentage without access to electricity or working out the percentage number of the whole for a named region. Max. 2 marks for descriptions without data support. 4(b) Suggest reasons for the variations in access to electricity shown in 7 Table 4.1. Candidates should suggest reasons for the variations in access to electricity shown in Table 4.1. The variations are for the whole table not just the second column; so some comment on access in urban and rural areas is expected. This involves the application of knowledge and understanding of the factors affecting demand and supply of energy at the national scale such as: levels of development, resource endowment, climate, income, technology, energy policy, etc. Award marks based on the quality of explanation and breadth of the response using the marking levels below. Level 3 5–6 Response applies knowledge and understanding of reasons for variations in access to electricity and develops two or more plausible reasons for the variations in Table 4.1. Response is well founded in detailed knowledge and strong conceptual understanding of the topic. Any examples used are appropriate and integrated effectively into the response. Level 2 3–4 Response offers one or more reasons for the variations in access to electricity in Table 4.1, but explanation and development may be unbalanced or limited. Response develops on a largely secure base of knowledge and understanding. Examples may lack detail or development. Level 1 1–2 Response is broadly about access to electricity but the reasons are difficult to identify or are insecure. Knowledge is basic and understanding may be inaccurate. Examples are in name only or lacking entirely. Level 0 0 No creditable response.
Q5 · With reference to one or more countries, how far do you agree that the balance between…
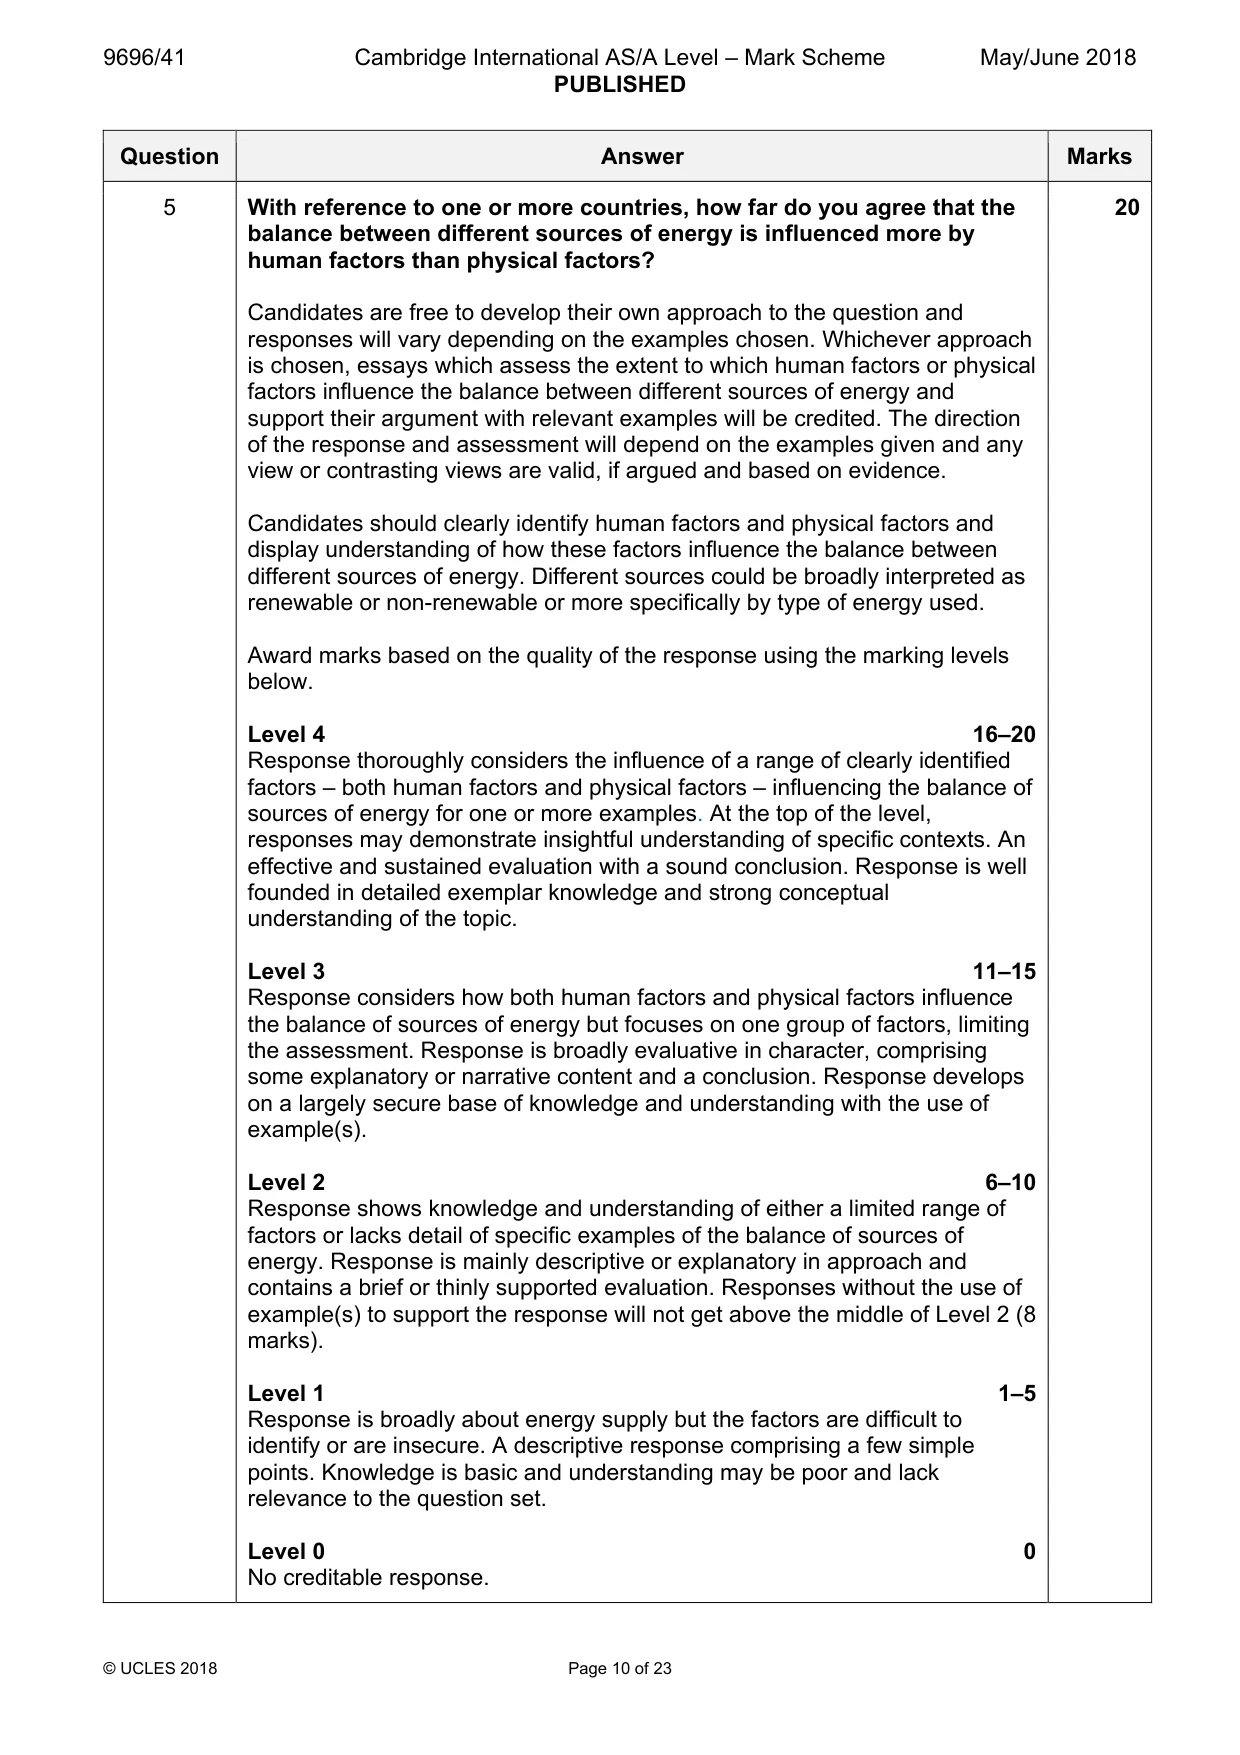
5 With reference to one or more countries, how far do you agree that the balance between different sources of energy is influenced more by human factors than physical factors? [20]
Mark scheme: 5 With reference to one or more countries, how far do you agree that the 20 balance between different sources of energy is influenced more by human factors than physical factors? Candidates are free to develop their own approach to the question and responses will vary depending on the examples chosen. Whichever approach is chosen, essays which assess the extent to which human factors or physical factors influence the balance between different sources of energy and support their argument with relevant examples will be credited. The direction of the response and assessment will depend on the examples given and any view or contrasting views are valid, if argued and based on evidence. Candidates should clearly identify human factors and physical factors and display understanding of how these factors influence the balance between different sources of energy. Different sources could be broadly interpreted as renewable or non-renewable or more specifically by type of energy used. Award marks based on the quality of the response using the marking levels below. Level 4 16–20 Response thoroughly considers the influence of a range of clearly identified factors – both human factors and physical factors – influencing the balance of sources of energy for one or more examples. At the top of the level, responses may demonstrate insightful understanding of specific contexts. An effective and sustained evaluation with a sound conclusion. Response is well founded in detailed exemplar knowledge and strong conceptual understanding of the topic. Level 3 11–15 Response considers how both human factors and physical factors influence the balance of sources of energy but focuses on one group of factors, limiting the assessment. Response is broadly evaluative in character, comprising some explanatory or narrative content and a conclusion. Response develops on a largely secure base of knowledge and understanding with the use of example(s). Level 2 6–10 Response shows knowledge and understanding of either a limited range of factors or lacks detail of specific examples of the balance of sources of energy. Response is mainly descriptive or explanatory in approach and contains a brief or thinly supported evaluation. Responses without the use of example(s) to support the response will not get above the middle of Level 2 (8 marks). Level 1 1–5 Response is broadly about energy supply but the factors are difficult to identify or are insecure. A descriptive response comprising a few simple points. Knowledge is basic and understanding may be poor and lack relevance to the question set. Level 0 0 No creditable response.
Q6 · For one degraded environment, examine the causes of its degradation and assess the…
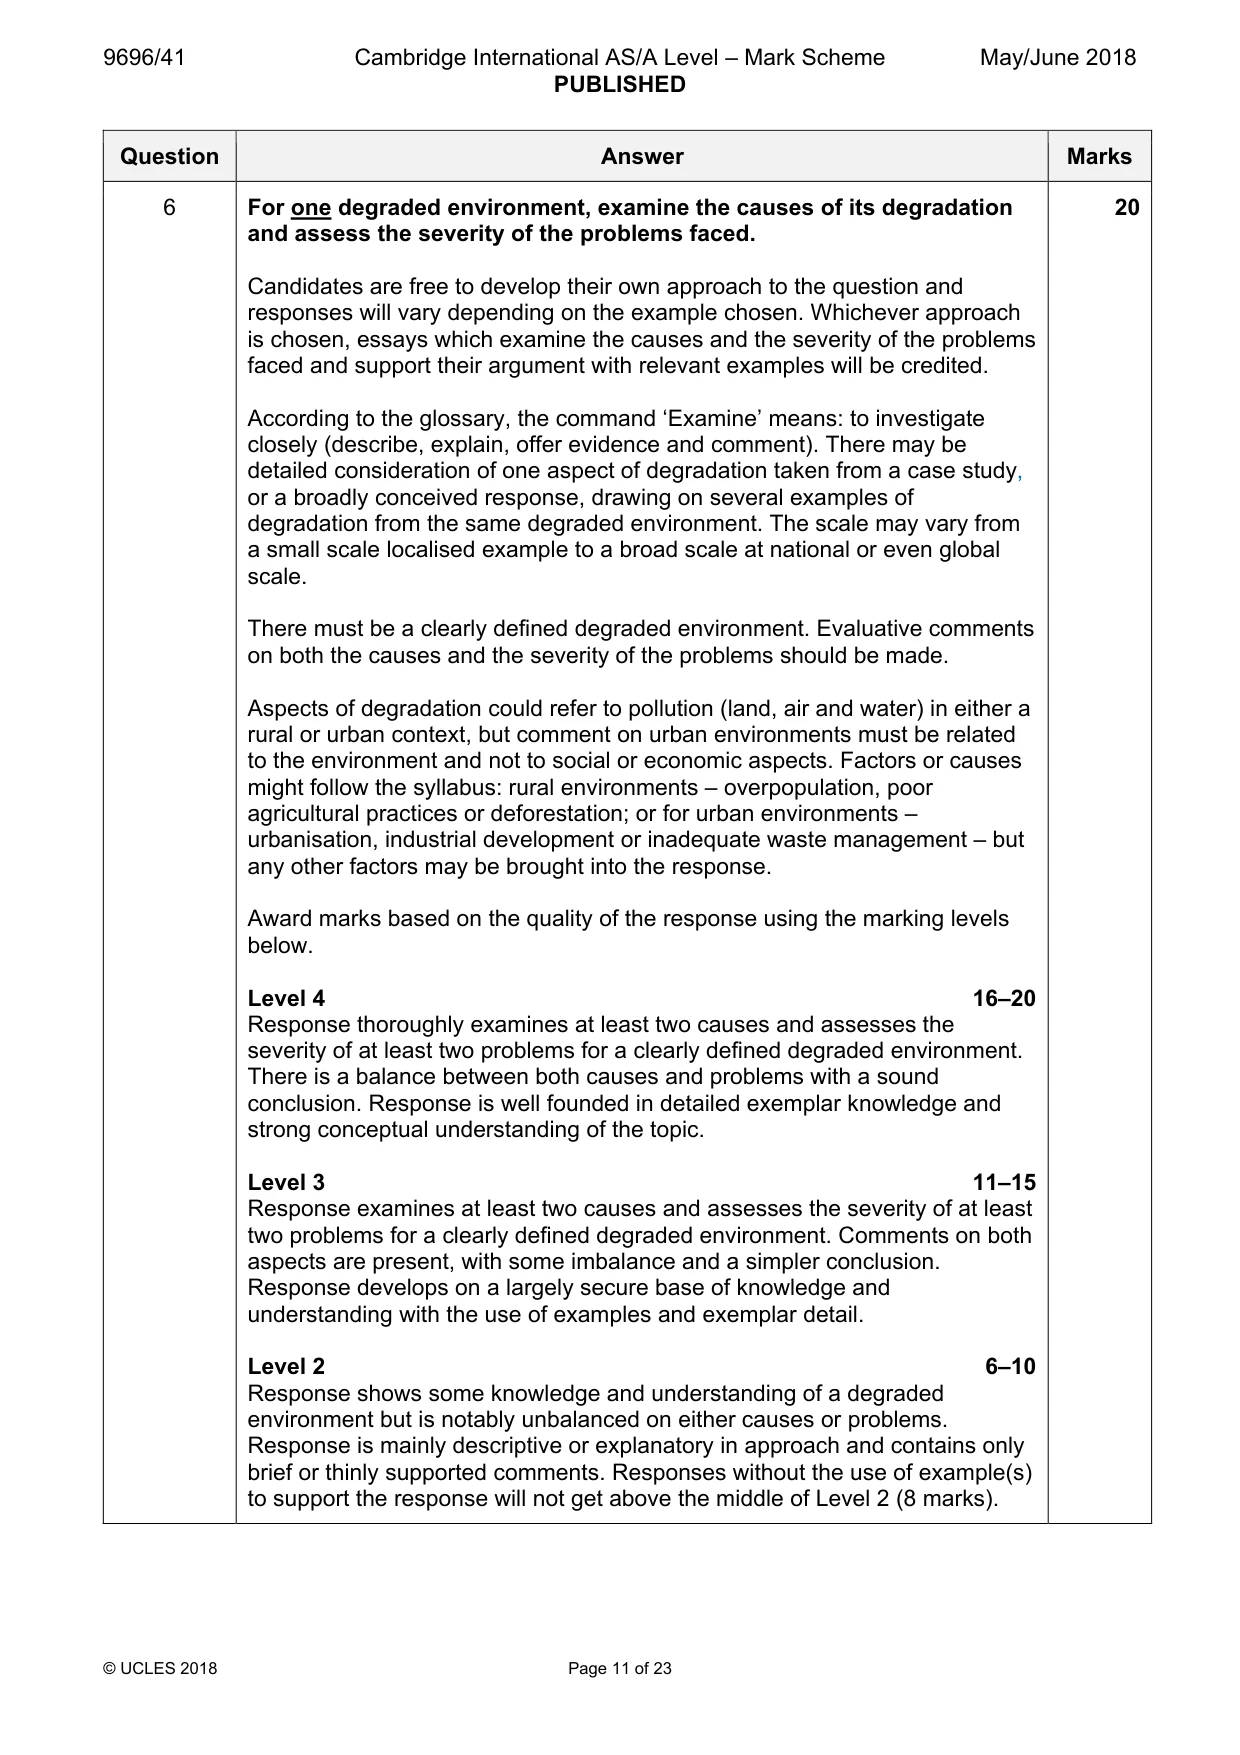
6 For one degraded environment, examine the causes of its degradation and assess the severity of the problems faced. [20] [Total: 30] Global interdependence If answering this option, answer Question 7 and either Question 8 or Question 9.
Mark scheme: 6 For one degraded environment, examine the causes of its degradation 20 and assess the severity of the problems faced. Candidates are free to develop their own approach to the question and responses will vary depending on the example chosen. Whichever approach is chosen, essays which examine the causes and the severity of the problems faced and support their argument with relevant examples will be credited. According to the glossary, the command ‘Examine’ means: to investigate closely (describe, explain, offer evidence and comment). There may be detailed consideration of one aspect of degradation taken from a case study, or a broadly conceived response, drawing on several examples of degradation from the same degraded environment. The scale may vary from a small scale localised example to a broad scale at national or even global scale. There must be a clearly defined degraded environment. Evaluative comments on both the causes and the severity of the problems should be made. Aspects of degradation could refer to pollution (land, air and water) in either a rural or urban context, but comment on urban environments must be related to the environment and not to social or economic aspects. Factors or causes might follow the syllabus: rural environments – overpopulation, poor agricultural practices or deforestation; or for urban environments – urbanisation, industrial development or inadequate waste management – but any other factors may be brought into the response. Award marks based on the quality of the response using the marking levels below. Level 4 16–20 Response thoroughly examines at least two causes and assesses the severity of at least two problems for a clearly defined degraded environment. There is a balance between both causes and problems with a sound conclusion. Response is well founded in detailed exemplar knowledge and strong conceptual understanding of the topic. Level 3 11–15 Response examines at least two causes and assesses the severity of at least two problems for a clearly defined degraded environment. Comments on both aspects are present, with some imbalance and a simpler conclusion. Response develops on a largely secure base of knowledge and understanding with the use of examples and exemplar detail. Level 2 6–10 Response shows some knowledge and understanding of a degraded environment but is notably unbalanced on either causes or problems. Response is mainly descriptive or explanatory in approach and contains only brief or thinly supported comments. Responses without the use of example(s) to support the response will not get above the middle of Level 2 (8 marks). 6 Level 1 1–5 Response comprises a few simple points about a degraded environment without clearly identifying causes and/or problems. Knowledge is basic and understanding may be inaccurate and lack relevance to the question set. Example in name only and could be taken as a generic response. Level 0 0 No creditable response. Global interdependence If answering this option, answer Question 7 and either Question 8 or Question 9.
Q7 · Percentage share in trade of goods for members of the World Trade Organization (WTO), by…
7 Fig. 7.1 shows percentage share in trade of goods for members of the World Trade Organization (WTO), by world region, 2005–15. (a) Compare the trends in the share in trade of goods for North America and Asia shown in Fig. 7.1. [4] (b) Suggest reasons for the changes in trade shown in Fig. 7.1. [6]
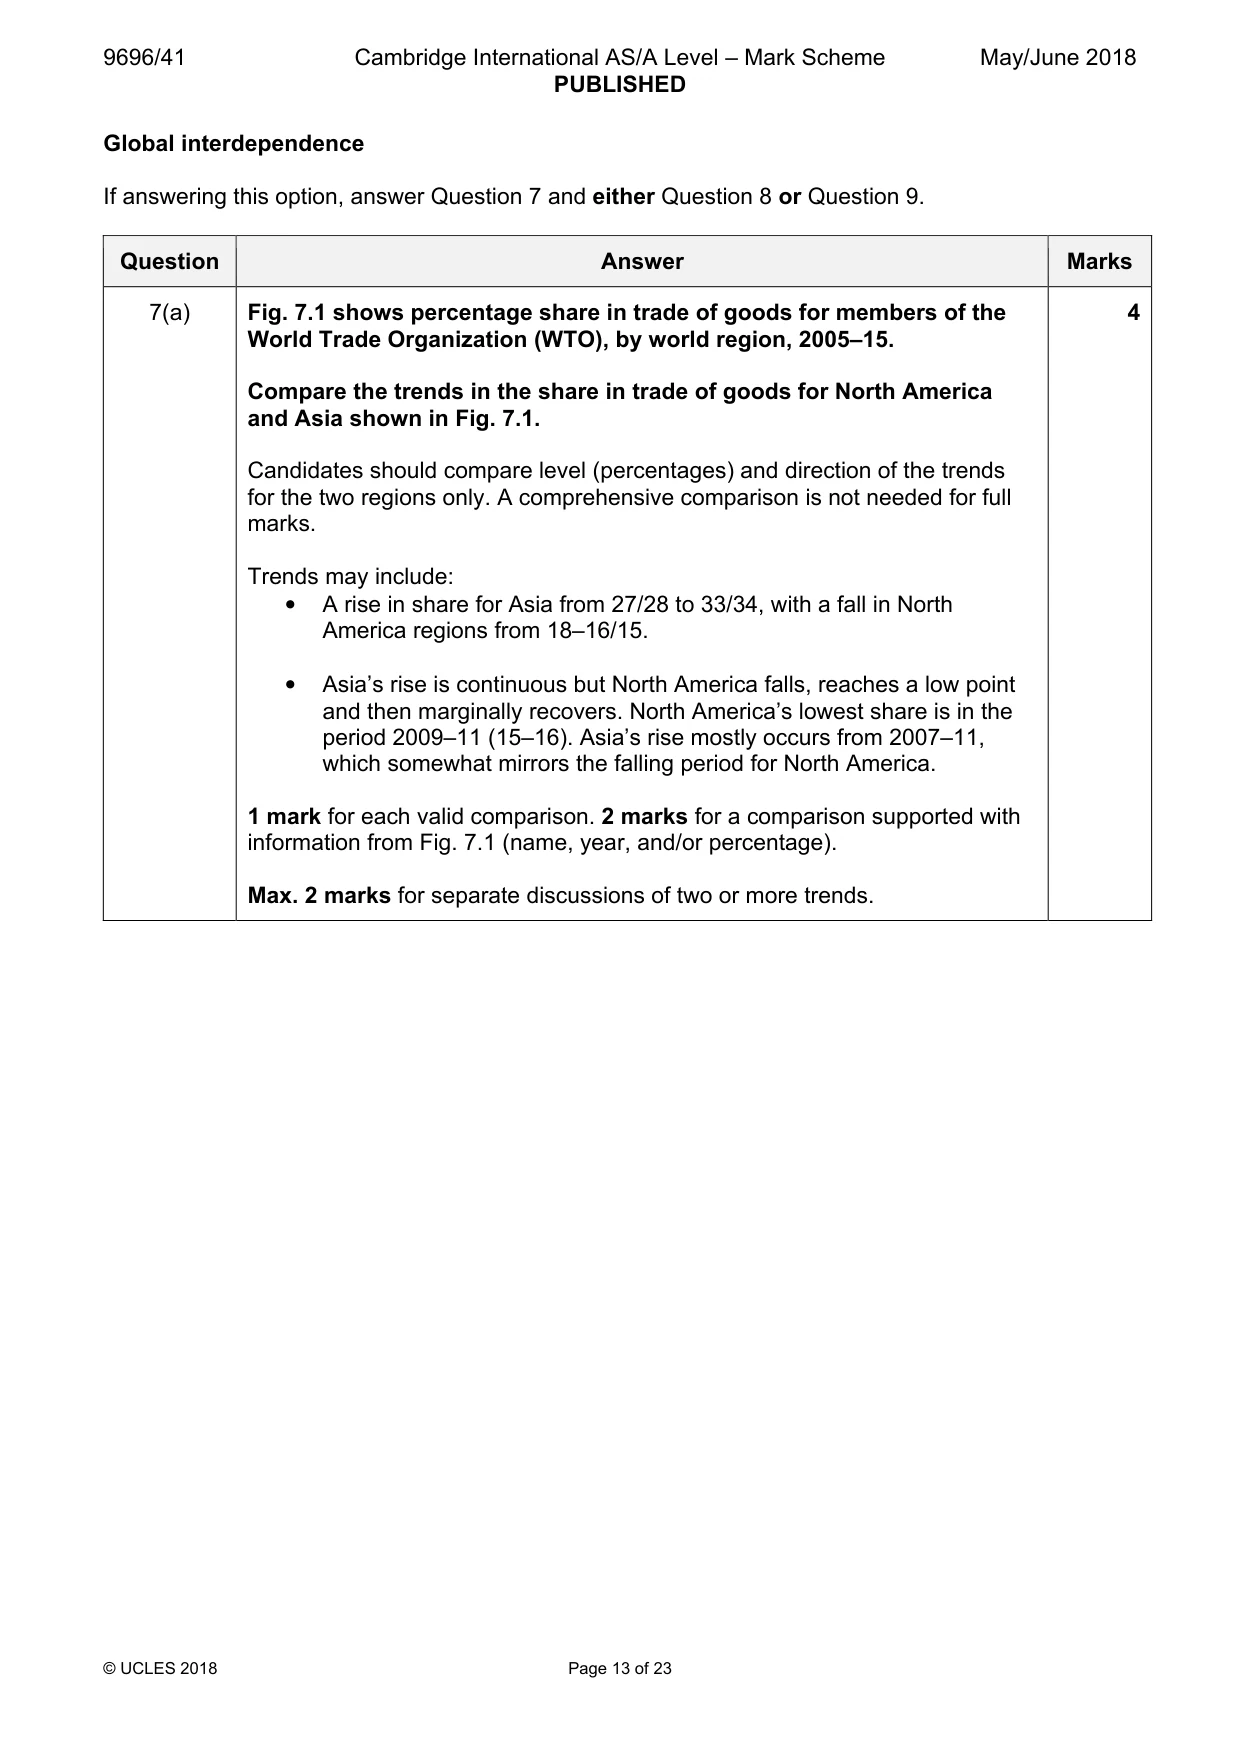
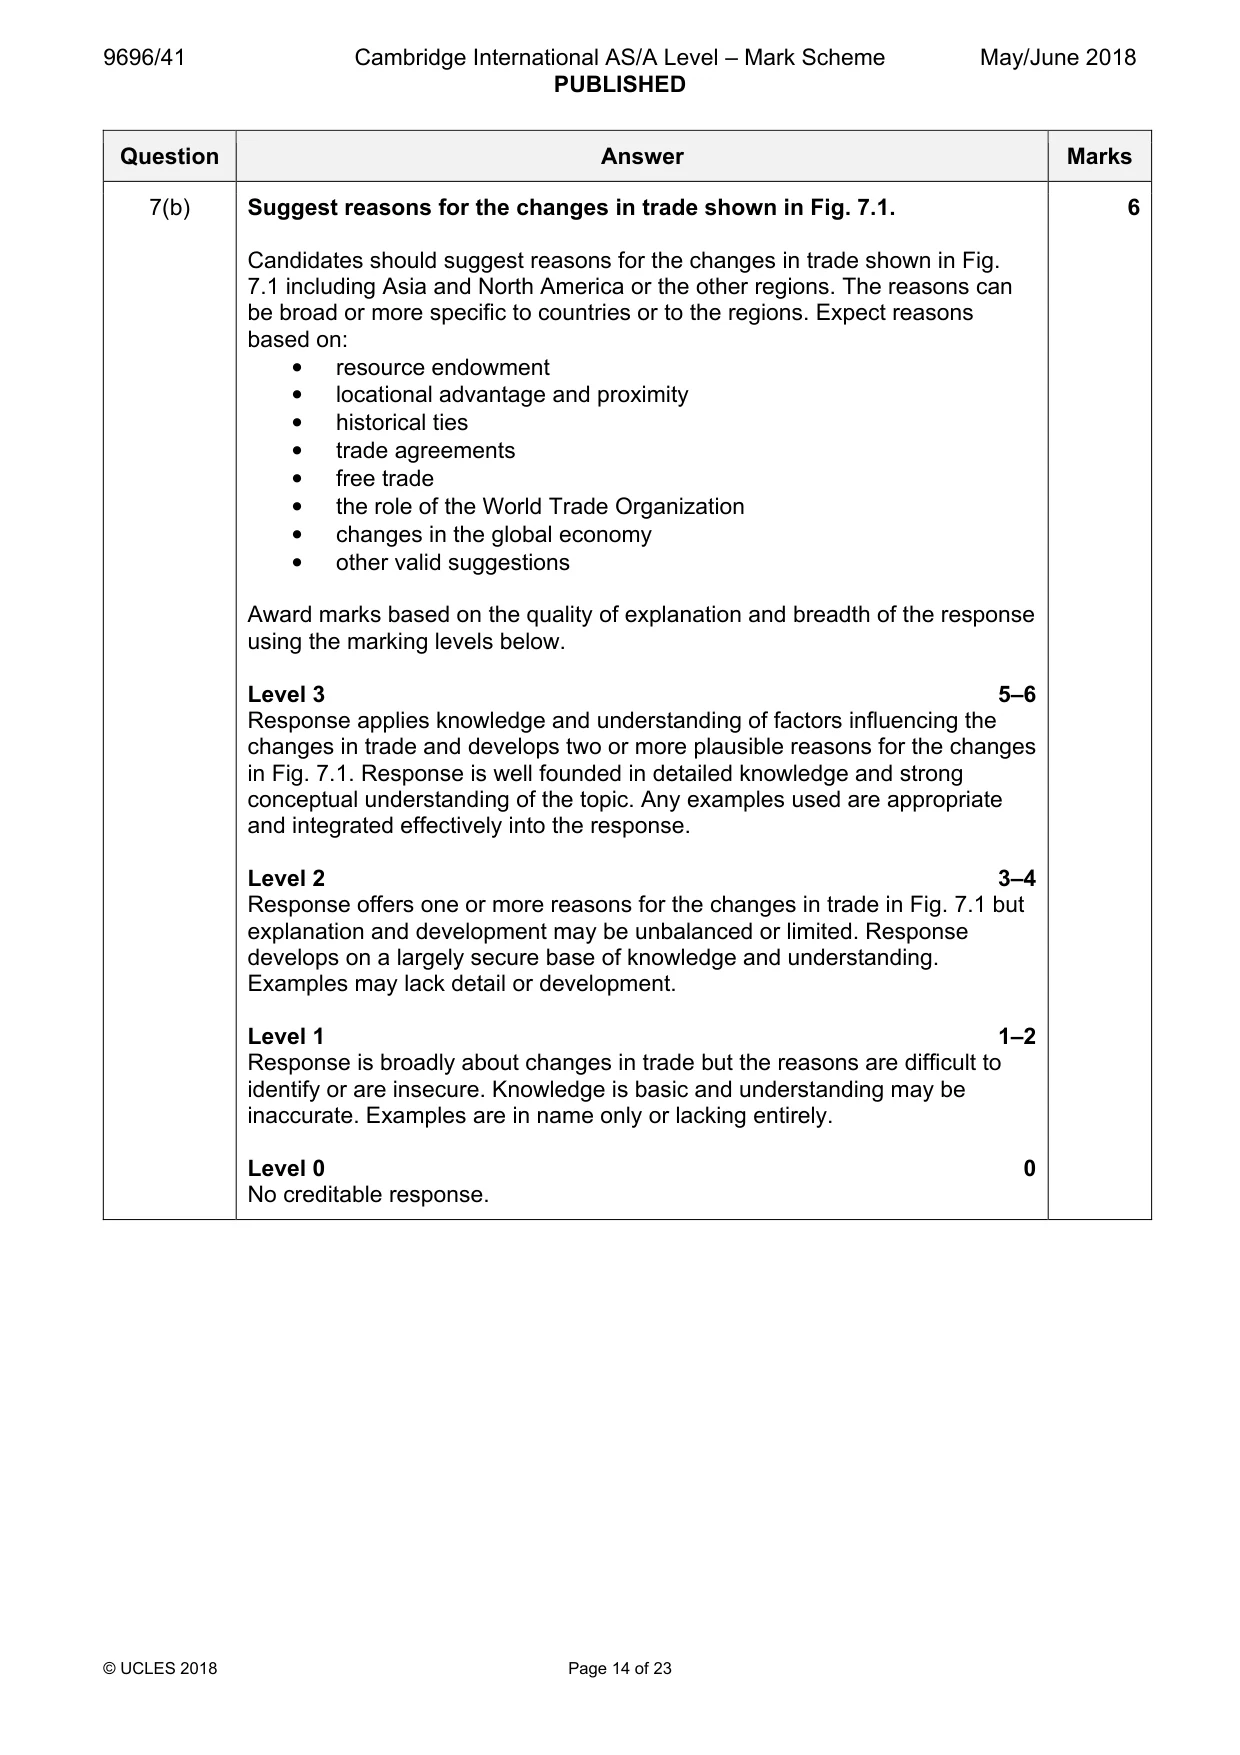
Mark scheme: 7(a) Fig. 7.1 shows percentage share in trade of goods for members of the 4 World Trade Organization (WTO), by world region, 2005–15. Compare the trends in the share in trade of goods for North America and Asia shown in Fig. 7.1. Candidates should compare level (percentages) and direction of the trends for the two regions only. A comprehensive comparison is not needed for full marks. Trends may include: • A rise in share for Asia from 27/28 to 33/34, with a fall in North America regions from 18–16/15. • Asia’s rise is continuous but North America falls, reaches a low point and then marginally recovers. North America’s lowest share is in the period 2009–11 (15–16). Asia’s rise mostly occurs from 2007–11, which somewhat mirrors the falling period for North America. 1 mark for each valid comparison. 2 marks for a comparison supported with information from Fig. 7.1 (name, year, and/or percentage). Max. 2 marks for separate discussions of two or more trends. 7(b) Suggest reasons for the changes in trade shown in Fig. 7.1. 6 Candidates should suggest reasons for the changes in trade shown in Fig. 7.1 including Asia and North America or the other regions. The reasons can be broad or more specific to countries or to the regions. Expect reasons based on: • resource endowment • locational advantage and proximity • historical ties • trade agreements • free trade • the role of the World Trade Organization • changes in the global economy • other valid suggestions Award marks based on the quality of explanation and breadth of the response using the marking levels below. Level 3 5–6 Response applies knowledge and understanding of factors influencing the changes in trade and develops two or more plausible reasons for the changes in Fig. 7.1. Response is well founded in detailed knowledge and strong conceptual understanding of the topic. Any examples used are appropriate and integrated effectively into the response. Level 2 3–4 Response offers one or more reasons for the changes in trade in Fig. 7.1 but explanation and development may be unbalanced or limited. Response develops on a largely secure base of knowledge and understanding. Examples may lack detail or development. Level 1 1–2 Response is broadly about changes in trade but the reasons are difficult to identify or are insecure. Knowledge is basic and understanding may be inaccurate. Examples are in name only or lacking entirely. Level 0 0 No creditable response.
Q8 · With reference to one or more examples, evaluate the impacts of trade on exporting…
8 With reference to one or more examples, evaluate the impacts of trade on exporting countries. [20]
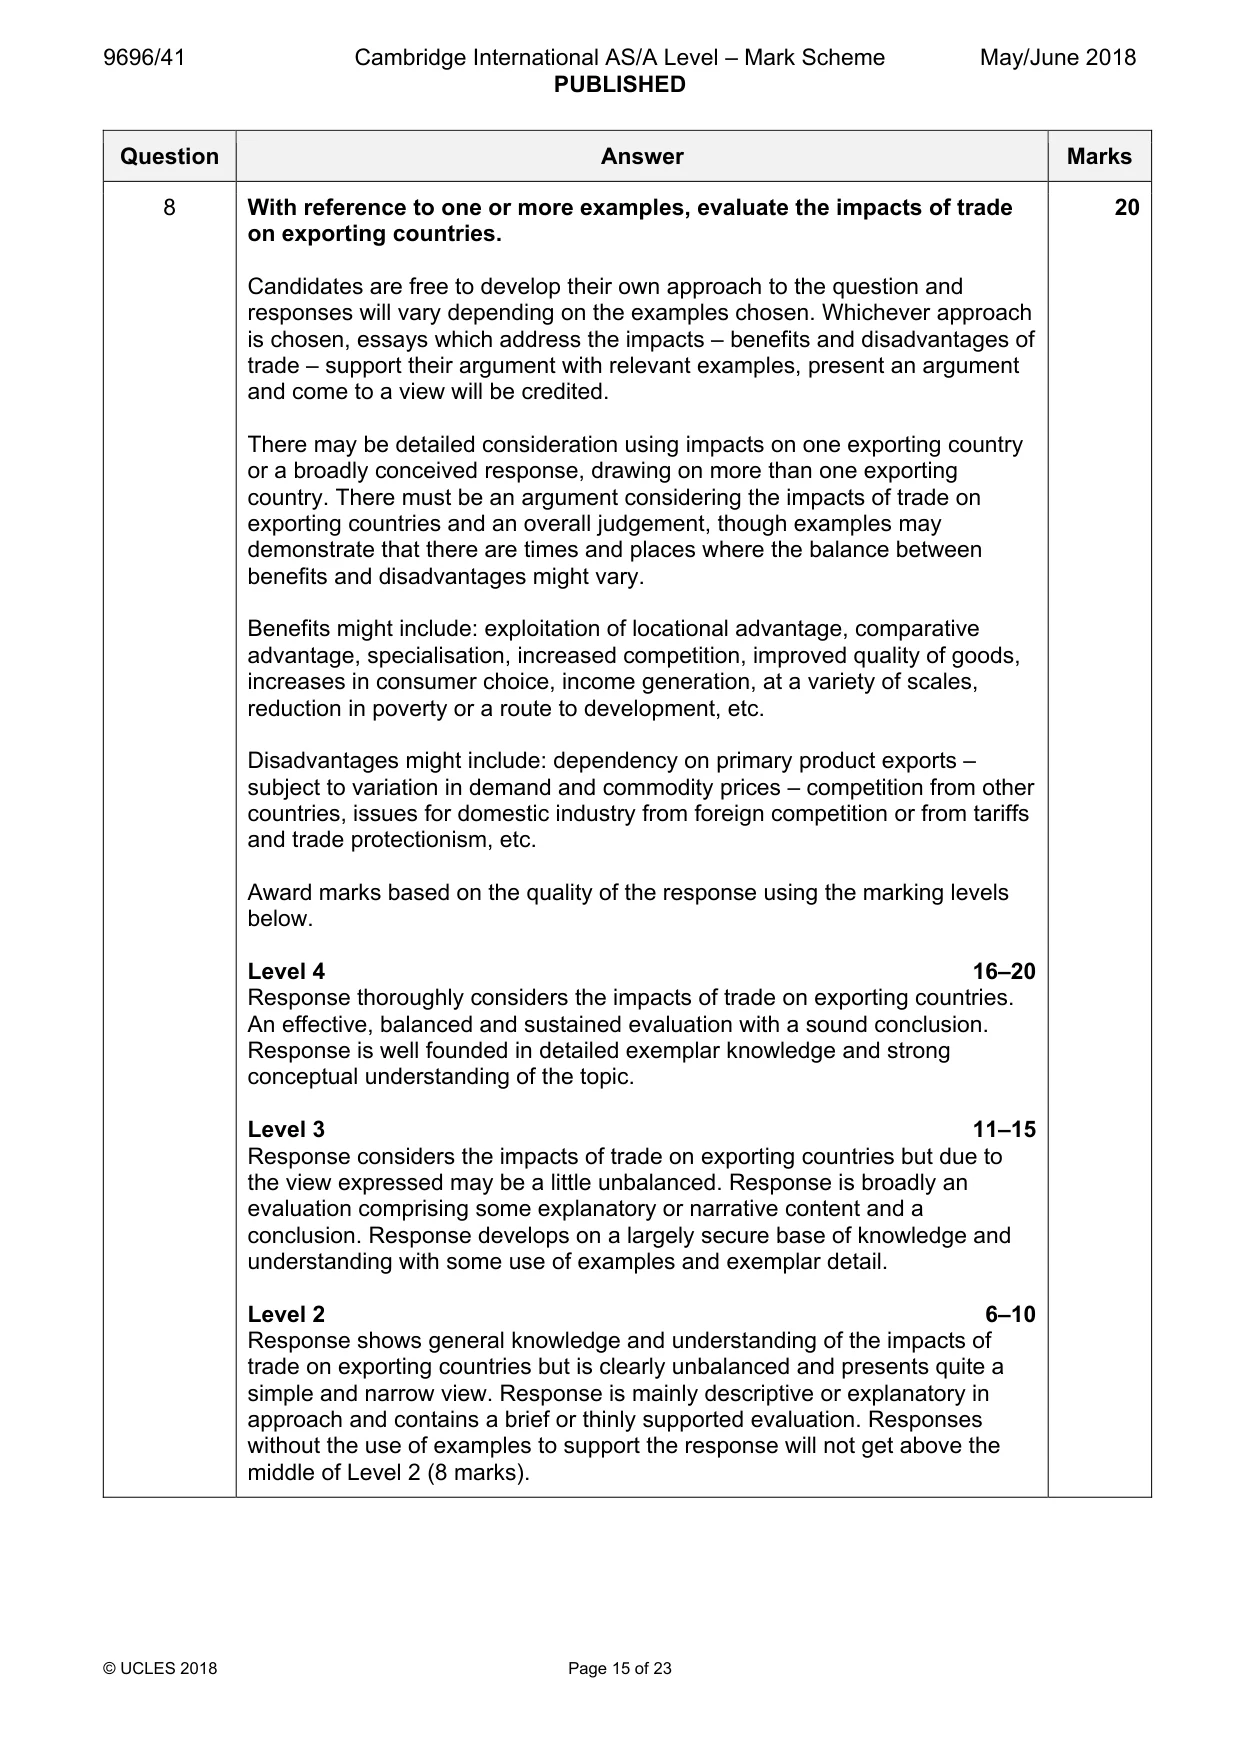
Mark scheme: 8 With reference to one or more examples, evaluate the impacts of trade 20 on exporting countries. Candidates are free to develop their own approach to the question and responses will vary depending on the examples chosen. Whichever approach is chosen, essays which address the impacts – benefits and disadvantages of trade – support their argument with relevant examples, present an argument and come to a view will be credited. There may be detailed consideration using impacts on one exporting country or a broadly conceived response, drawing on more than one exporting country. There must be an argument considering the impacts of trade on exporting countries and an overall judgement, though examples may demonstrate that there are times and places where the balance between benefits and disadvantages might vary. Benefits might include: exploitation of locational advantage, comparative advantage, specialisation, increased competition, improved quality of goods, increases in consumer choice, income generation, at a variety of scales, reduction in poverty or a route to development, etc. Disadvantages might include: dependency on primary product exports – subject to variation in demand and commodity prices – competition from other countries, issues for domestic industry from foreign competition or from tariffs and trade protectionism, etc. Award marks based on the quality of the response using the marking levels below. Level 4 16–20 Response thoroughly considers the impacts of trade on exporting countries. An effective, balanced and sustained evaluation with a sound conclusion. Response is well founded in detailed exemplar knowledge and strong conceptual understanding of the topic. Level 3 11–15 Response considers the impacts of trade on exporting countries but due to the view expressed may be a little unbalanced. Response is broadly an evaluation comprising some explanatory or narrative content and a conclusion. Response develops on a largely secure base of knowledge and understanding with some use of examples and exemplar detail. Level 2 6–10 Response shows general knowledge and understanding of the impacts of trade on exporting countries but is clearly unbalanced and presents quite a simple and narrow view. Response is mainly descriptive or explanatory in approach and contains a brief or thinly supported evaluation. Responses without the use of examples to support the response will not get above the middle of Level 2 (8 marks). Level 1 1–5 Response comprises one or more descriptive points about trade with little reference to impacts and/or with little reference to exporting countries. Knowledge is basic and understanding may be inaccurate. Examples are in name only or lacking entirely. Level 0 0 No creditable response.
Q9 · ‘It is easier for tourist destinations to achieve environmental sustainability than…
9 ‘It is easier for tourist destinations to achieve environmental sustainability than economic sustainability.’ With reference to one or more examples, how far do you agree with this statement? [20] [Total: 30] Economic transition If answering this option, answer Question 10 and either Question 11 or Question 12.
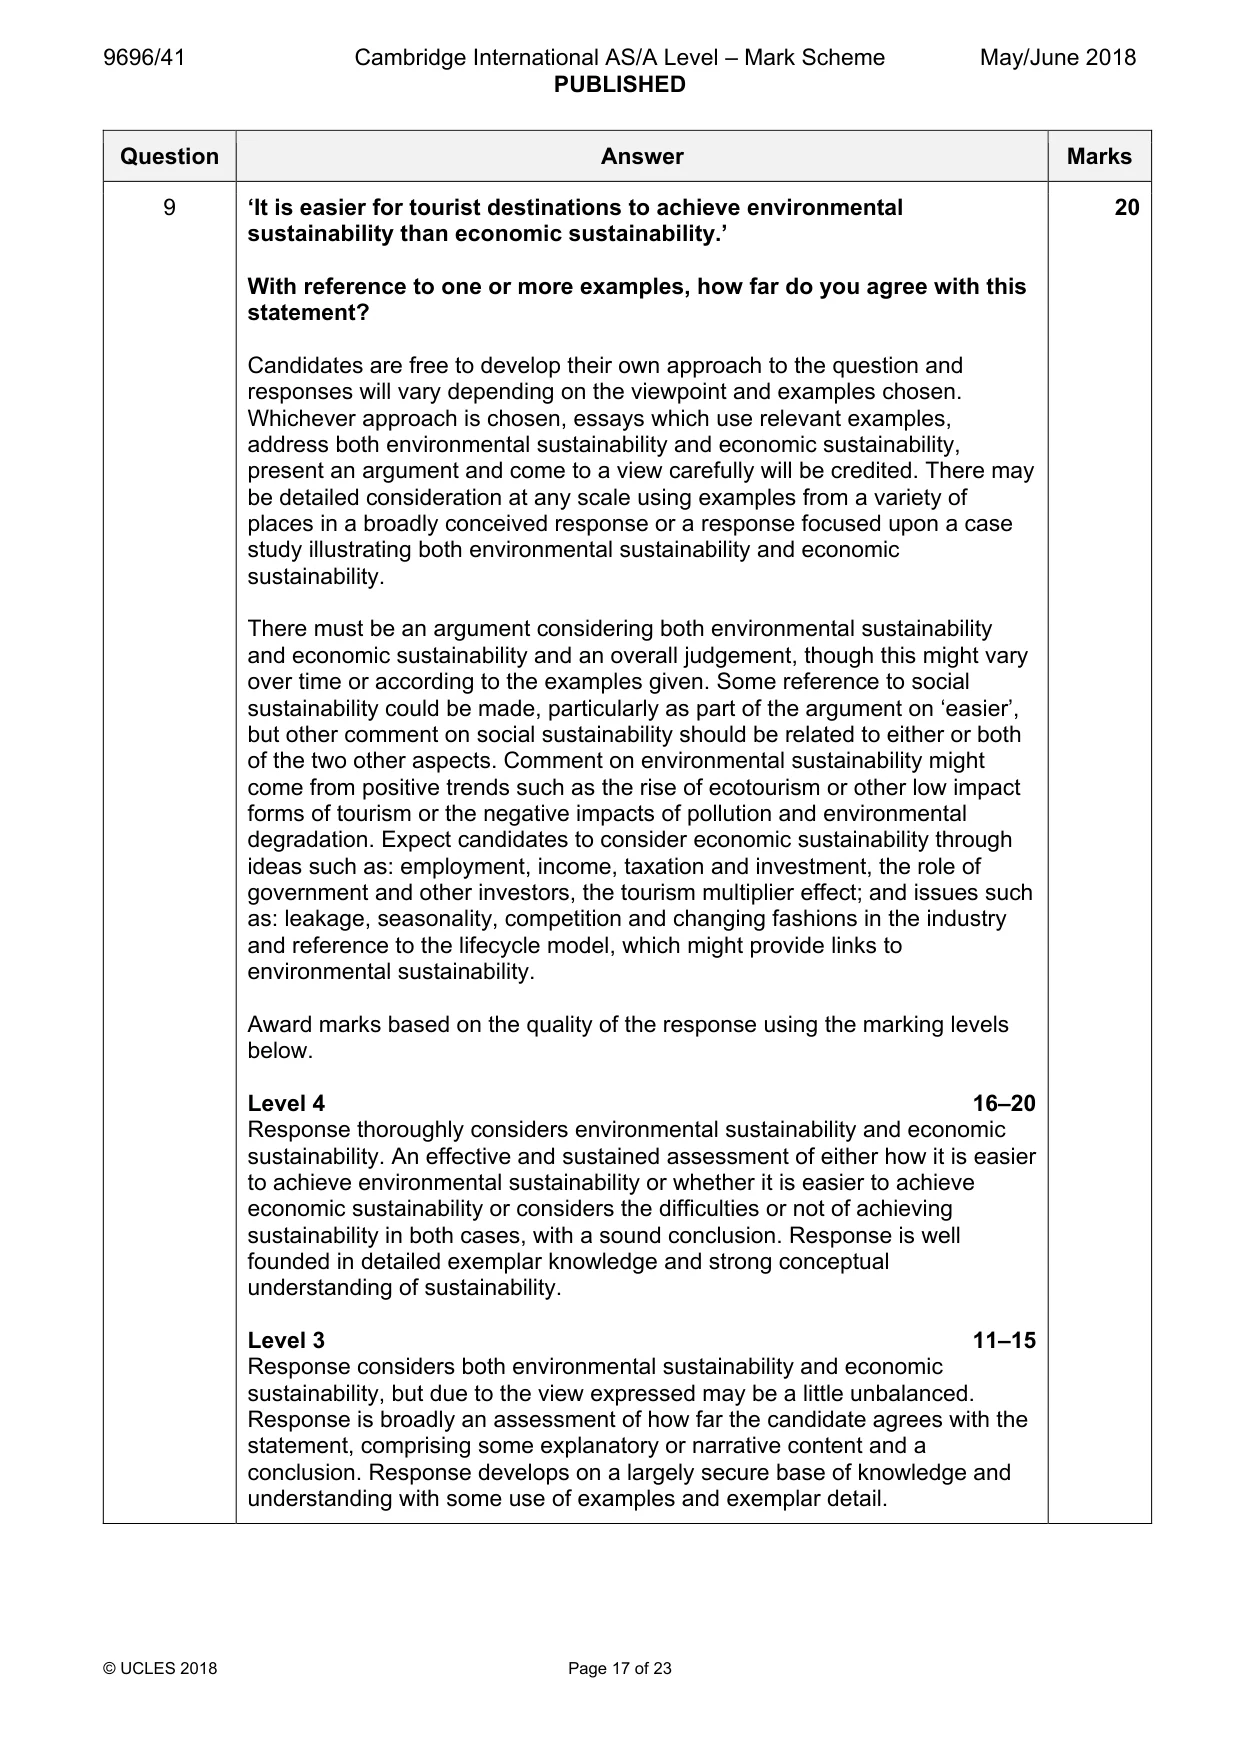
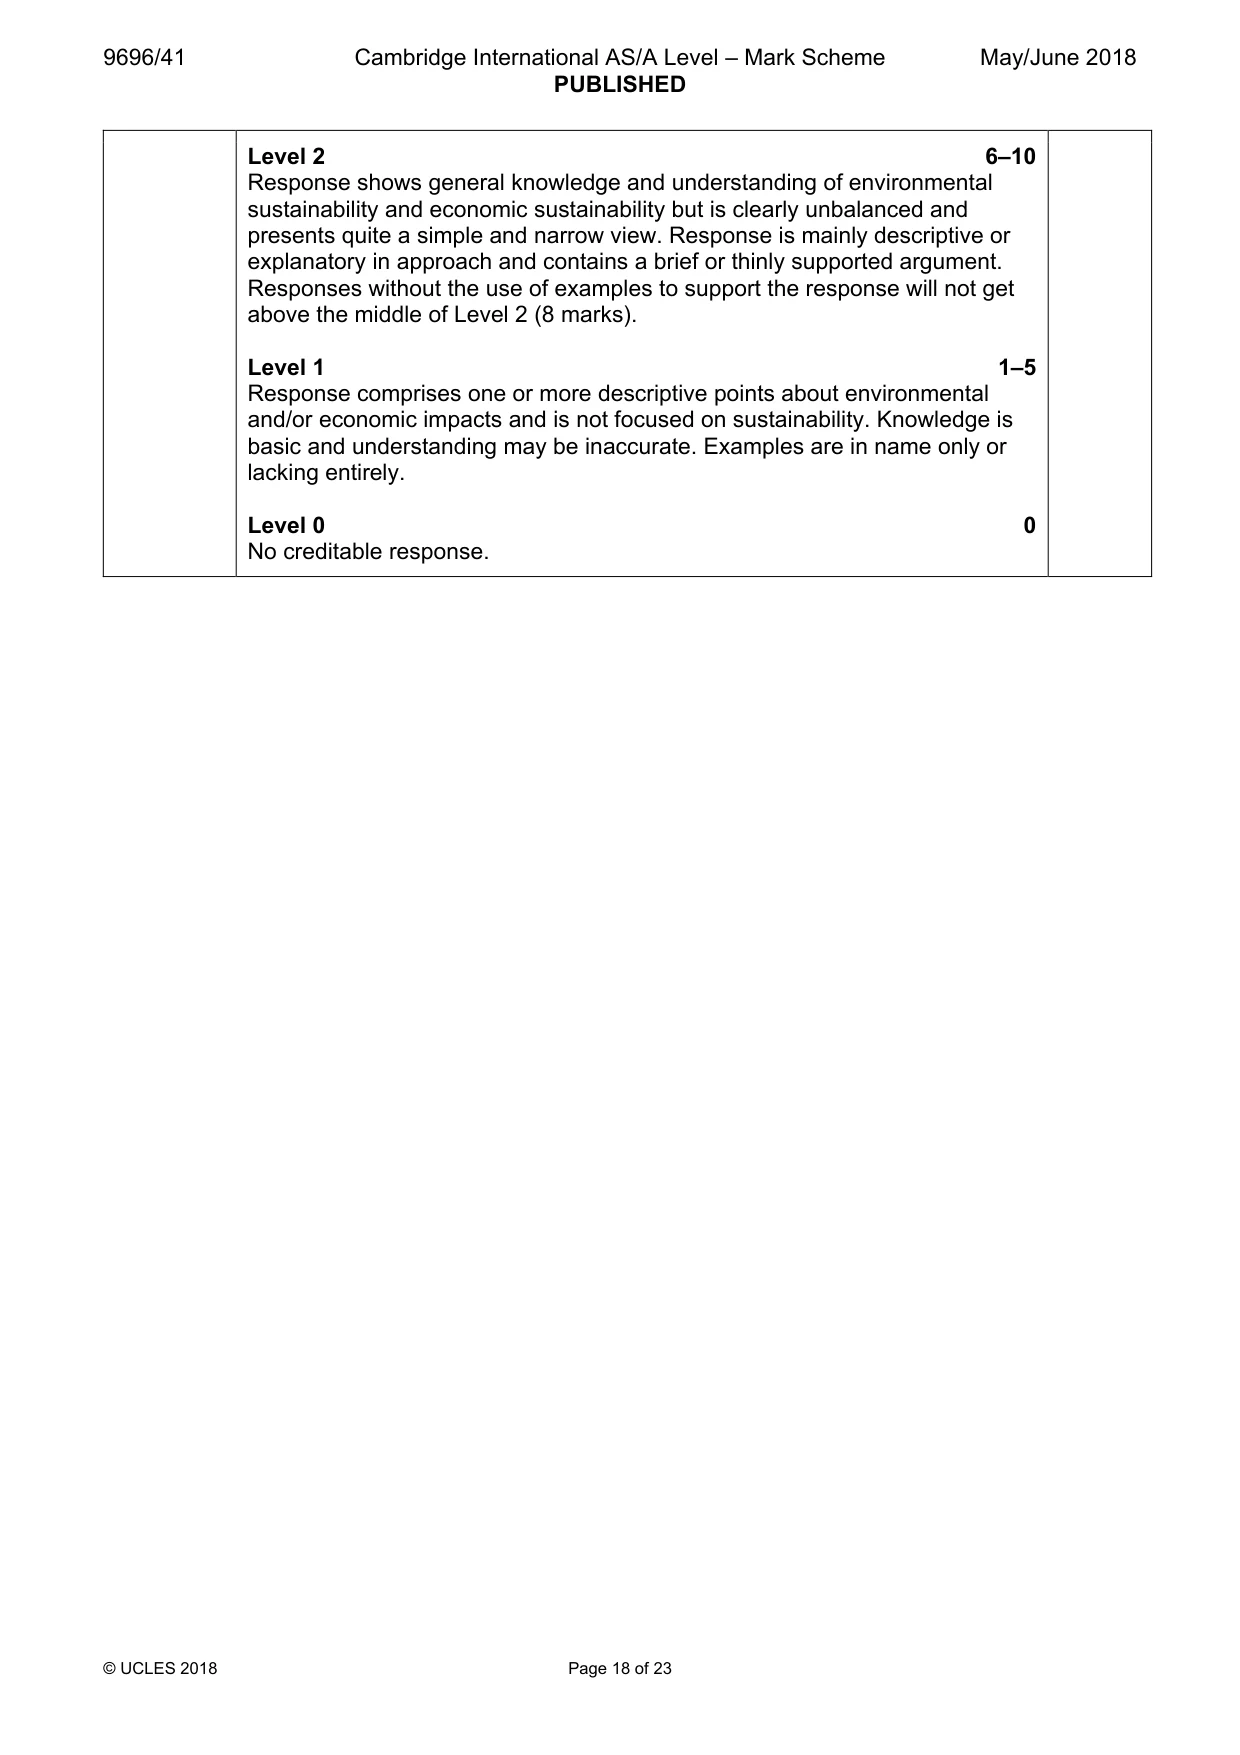
Mark scheme: 9 ‘It is easier for tourist destinations to achieve environmental 20 sustainability than economic sustainability.’ With reference to one or more examples, how far do you agree with this statement? Candidates are free to develop their own approach to the question and responses will vary depending on the viewpoint and examples chosen. Whichever approach is chosen, essays which use relevant examples, address both environmental sustainability and economic sustainability, present an argument and come to a view carefully will be credited. There may be detailed consideration at any scale using examples from a variety of places in a broadly conceived response or a response focused upon a case study illustrating both environmental sustainability and economic sustainability. There must be an argument considering both environmental sustainability and economic sustainability and an overall judgement, though this might vary over time or according to the examples given. Some reference to social sustainability could be made, particularly as part of the argument on ‘easier’, but other comment on social sustainability should be related to either or both of the two other aspects. Comment on environmental sustainability might come from positive trends such as the rise of ecotourism or other low impact forms of tourism or the negative impacts of pollution and environmental degradation. Expect candidates to consider economic sustainability through ideas such as: employment, income, taxation and investment, the role of government and other investors, the tourism multiplier effect; and issues such as: leakage, seasonality, competition and changing fashions in the industry and reference to the lifecycle model, which might provide links to environmental sustainability. Award marks based on the quality of the response using the marking levels below. Level 4 16–20 Response thoroughly considers environmental sustainability and economic sustainability. An effective and sustained assessment of either how it is easier to achieve environmental sustainability or whether it is easier to achieve economic sustainability or considers the difficulties or not of achieving sustainability in both cases, with a sound conclusion. Response is well founded in detailed exemplar knowledge and strong conceptual understanding of sustainability. Level 3 11–15 Response considers both environmental sustainability and economic sustainability, but due to the view expressed may be a little unbalanced. Response is broadly an assessment of how far the candidate agrees with the statement, comprising some explanatory or narrative content and a conclusion. Response develops on a largely secure base of knowledge and understanding with some use of examples and exemplar detail. Level 2 6–10 Response shows general knowledge and understanding of environmental sustainability and economic sustainability but is clearly unbalanced and presents quite a simple and narrow view. Response is mainly descriptive or explanatory in approach and contains a brief or thinly supported argument. Responses without the use of examples to support the response will not get above the middle of Level 2 (8 marks). Level 1 1–5 Response comprises one or more descriptive points about environmental and/or economic impacts and is not focused on sustainability. Knowledge is basic and understanding may be inaccurate. Examples are in name only or lacking entirely. Level 0 0 No creditable response. Economic transition If answering this option, answer Question 10 and either Question 11 or Question 12.
Q10 · Progress towards millennium development goal (MDG) 4: relative decrease in mortality rate…
10 Fig. 10.1 shows progress towards millennium development goal (MDG) 4: relative decrease in mortality rate of children under 5 years, 1990–2015. (a) Describe the distribution of countries which achieved MDG 4 shown in Fig. 10.1. [3] (b) Suggest reasons for the variation in progress towards MDG 4 shown in Fig. 10.1. [7]
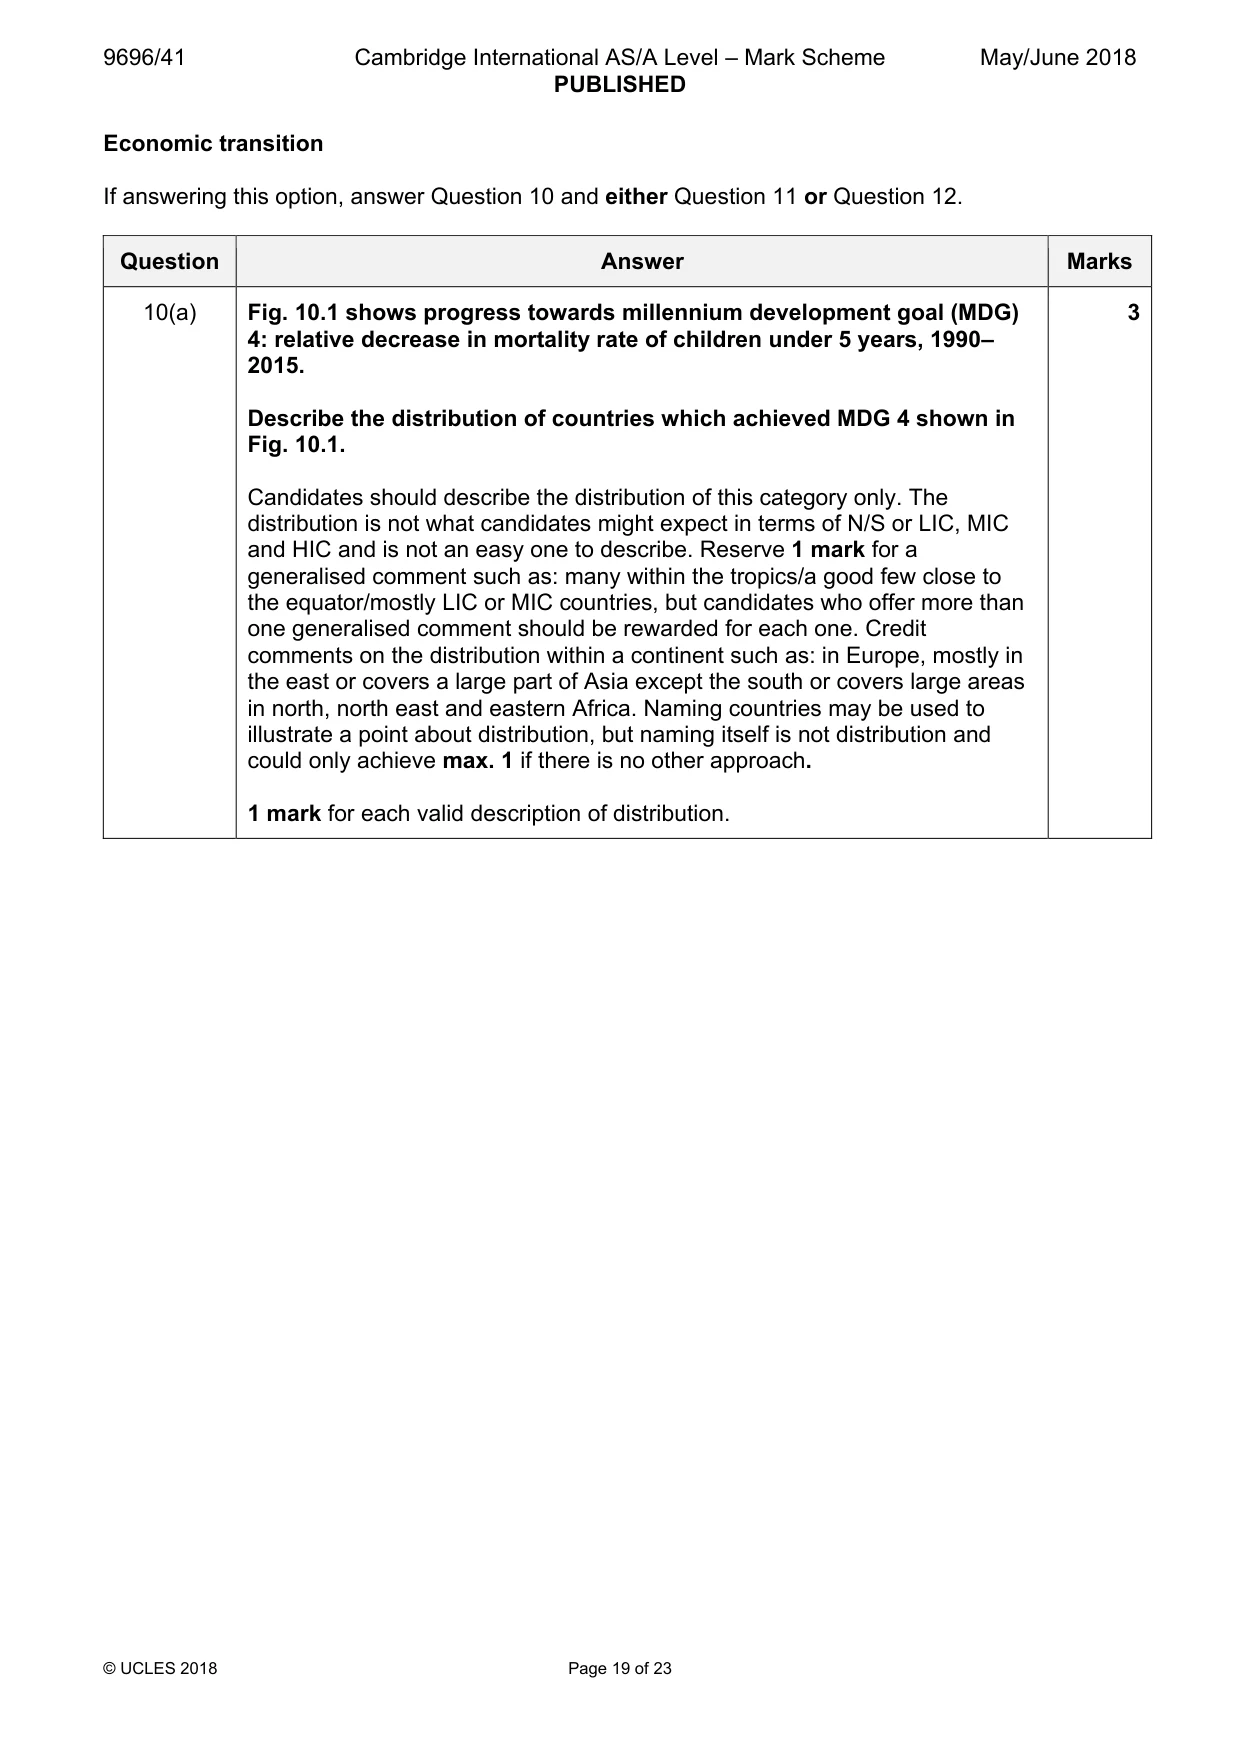
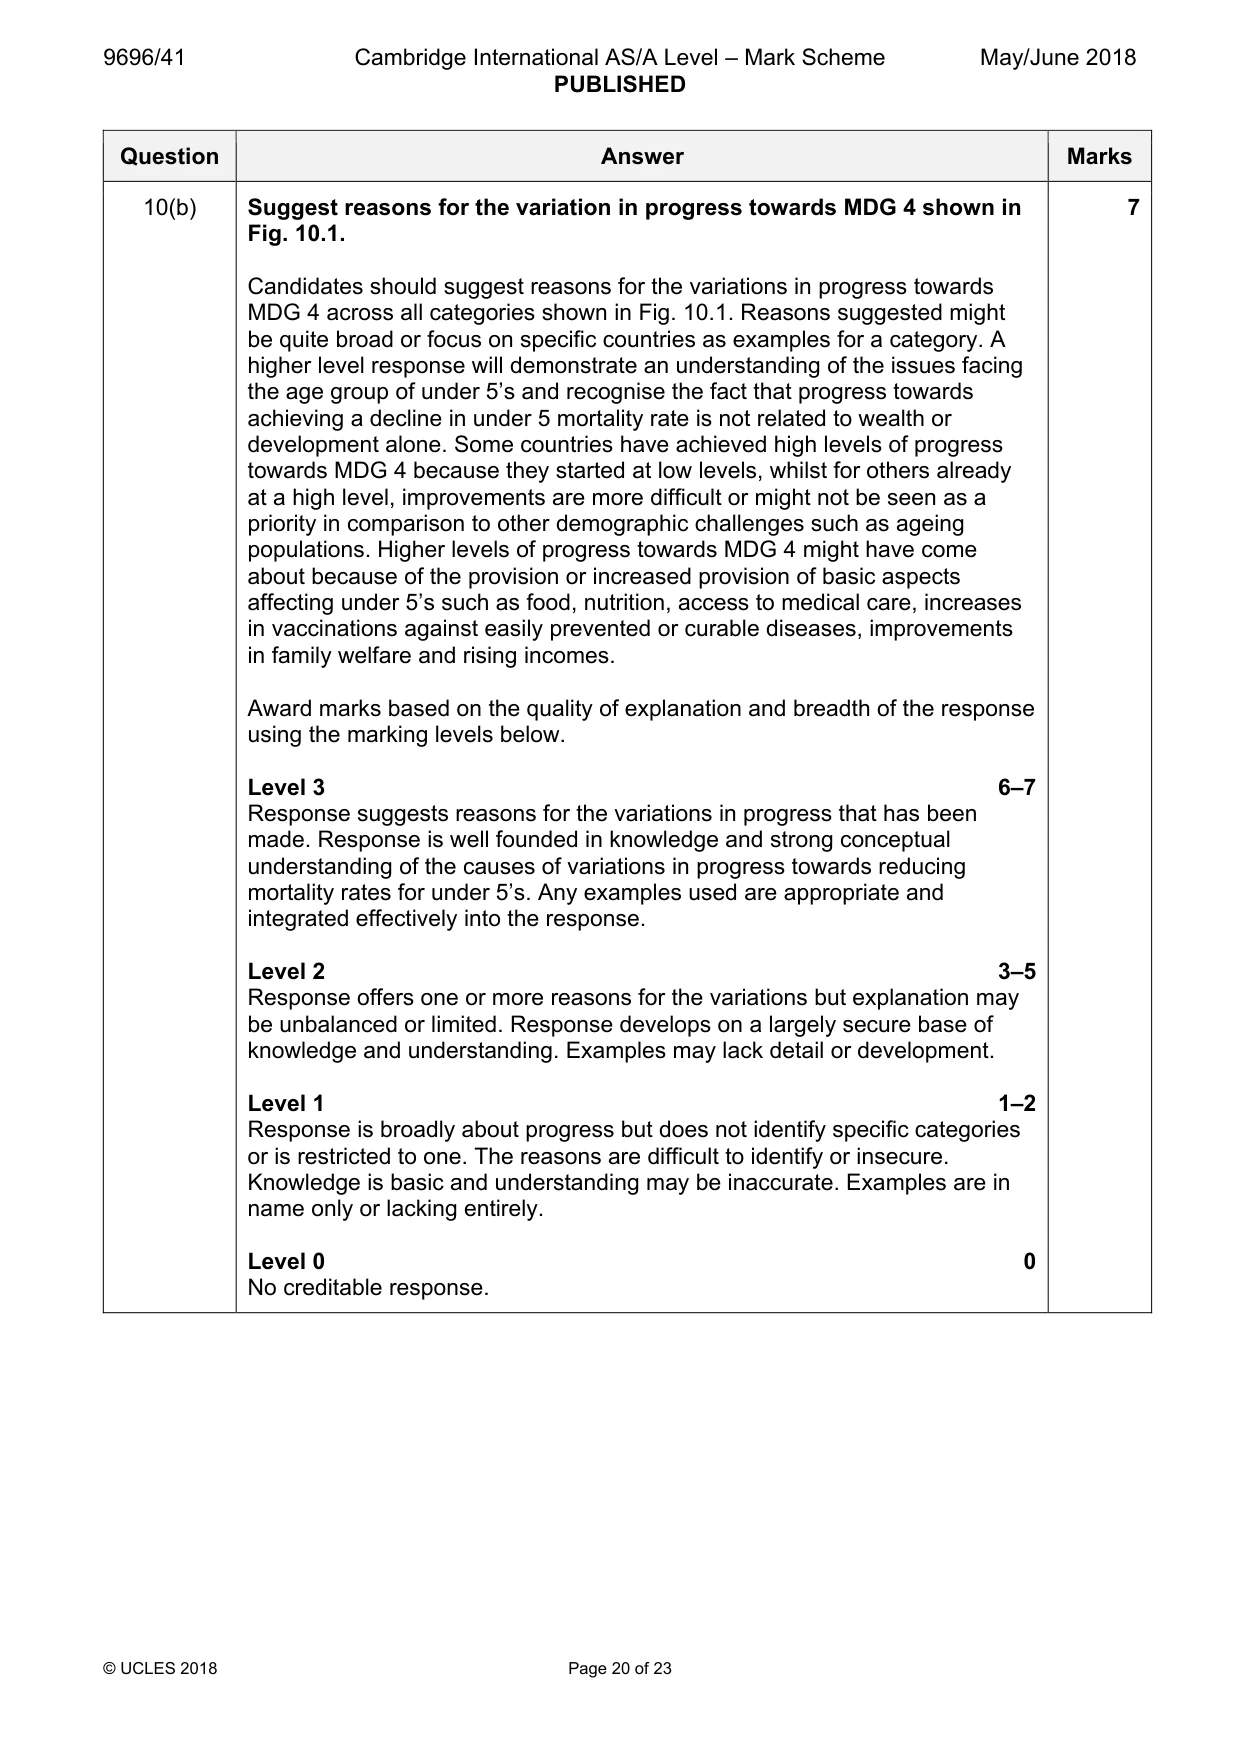
Mark scheme: 10(a) Fig. 10.1 shows progress towards millennium development goal (MDG) 3 4: relative decrease in mortality rate of children under 5 years, 1990– 2015. Describe the distribution of countries which achieved MDG 4 shown in Fig. 10.1. Candidates should describe the distribution of this category only. The distribution is not what candidates might expect in terms of N/S or LIC, MIC and HIC and is not an easy one to describe. Reserve 1 mark for a generalised comment such as: many within the tropics/a good few close to the equator/mostly LIC or MIC countries, but candidates who offer more than one generalised comment should be rewarded for each one. Credit comments on the distribution within a continent such as: in Europe, mostly in the east or covers a large part of Asia except the south or covers large areas in north, north east and eastern Africa. Naming countries may be used to illustrate a point about distribution, but naming itself is not distribution and could only achieve max. 1 if there is no other approach. 1 mark for each valid description of distribution. 10(b) Suggest reasons for the variation in progress towards MDG 4 shown in 7 Fig. 10.1. Candidates should suggest reasons for the variations in progress towards MDG 4 across all categories shown in Fig. 10.1. Reasons suggested might be quite broad or focus on specific countries as examples for a category. A higher level response will demonstrate an understanding of the issues facing the age group of under 5’s and recognise the fact that progress towards achieving a decline in under 5 mortality rate is not related to wealth or development alone. Some countries have achieved high levels of progress towards MDG 4 because they started at low levels, whilst for others already at a high level, improvements are more difficult or might not be seen as a priority in comparison to other demographic challenges such as ageing populations. Higher levels of progress towards MDG 4 might have come about because of the provision or increased provision of basic aspects affecting under 5’s such as food, nutrition, access to medical care, increases in vaccinations against easily prevented or curable diseases, improvements in family welfare and rising incomes. Award marks based on the quality of explanation and breadth of the response using the marking levels below. Level 3 6–7 Response suggests reasons for the variations in progress that has been made. Response is well founded in knowledge and strong conceptual understanding of the causes of variations in progress towards reducing mortality rates for under 5’s. Any examples used are appropriate and integrated effectively into the response. Level 2 3–5 Response offers one or more reasons for the variations but explanation may be unbalanced or limited. Response develops on a largely secure base of knowledge and understanding. Examples may lack detail or development. Level 1 1–2 Response is broadly about progress but does not identify specific categories or is restricted to one. The reasons are difficult to identify or insecure. Knowledge is basic and understanding may be inaccurate. Examples are in name only or lacking entirely. Level 0 0 No creditable response.
Q11 · To what extent has globalisation led to a reduction in global inequalities?
11 To what extent has globalisation led to a reduction in global inequalities? [20]
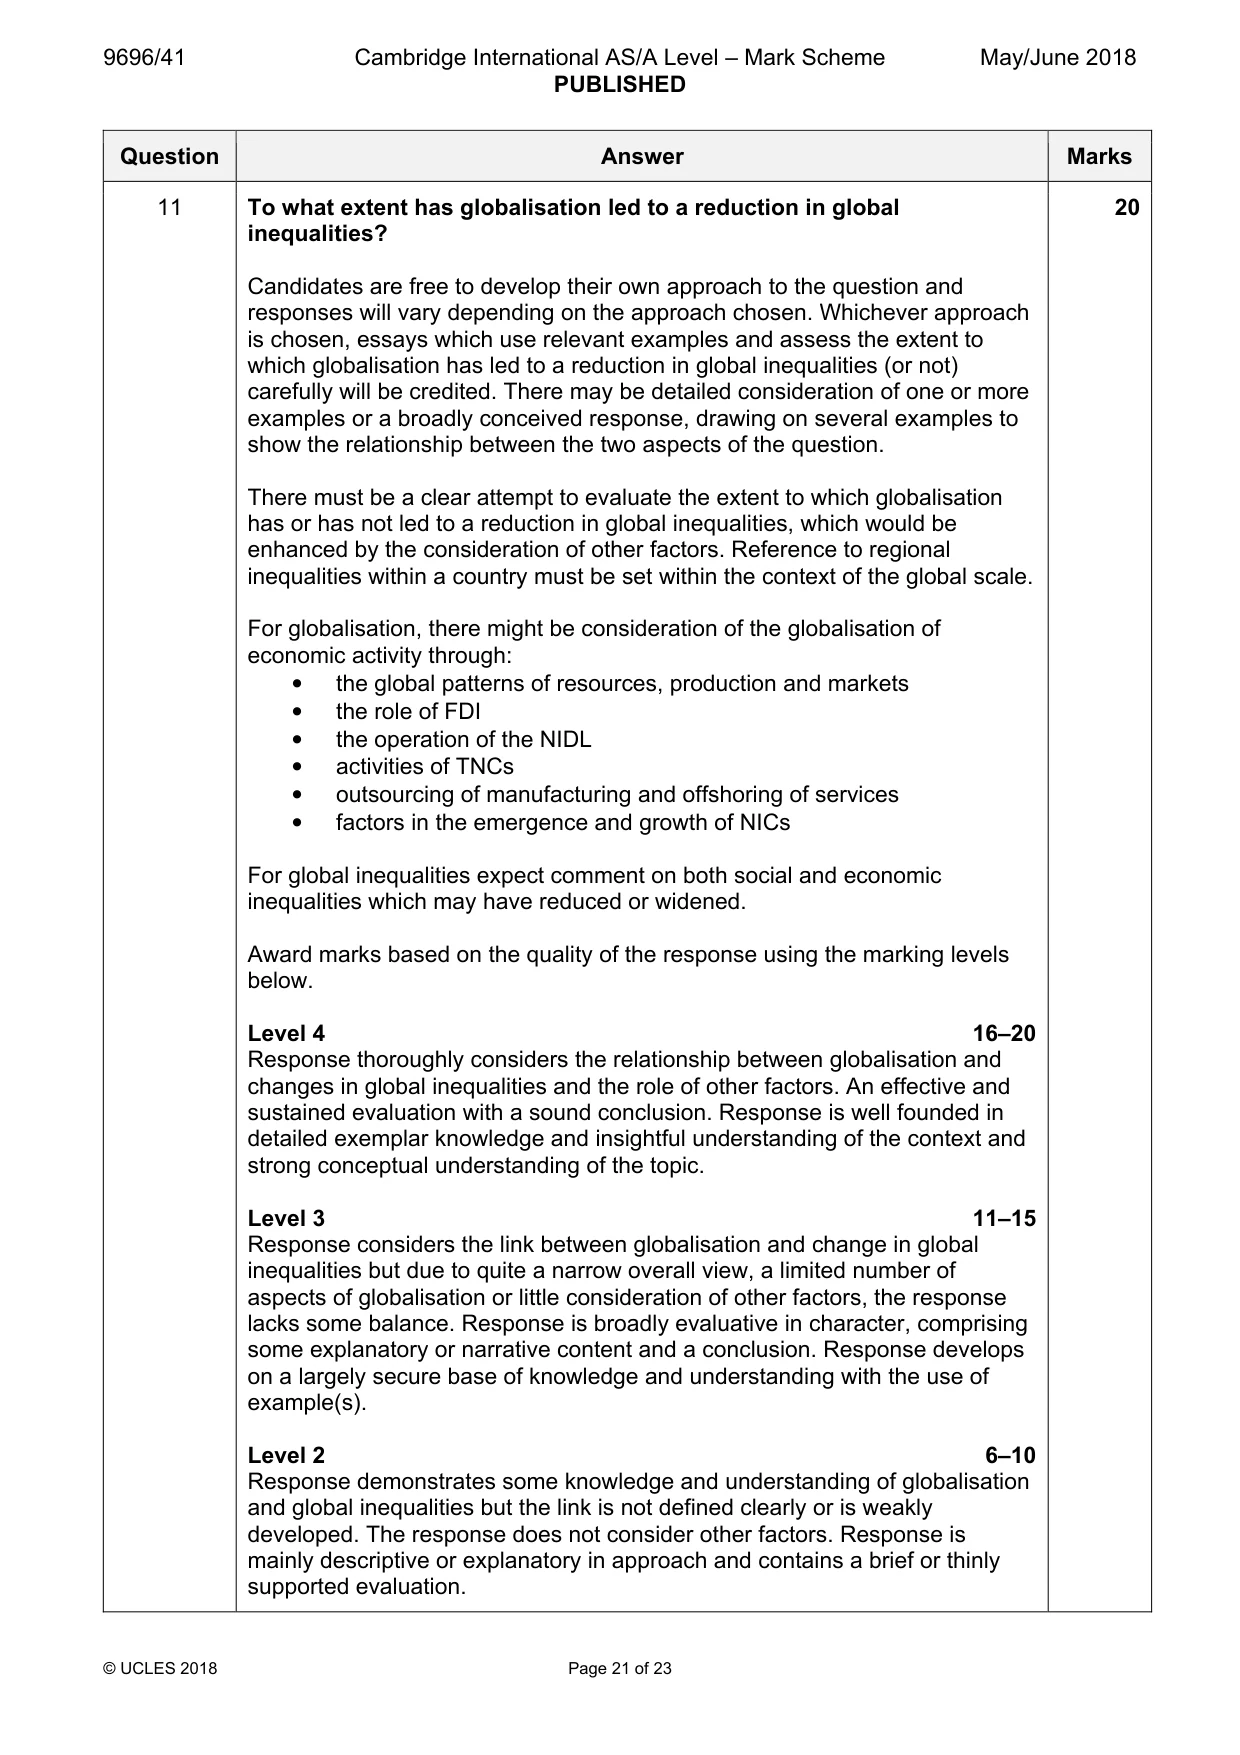
Mark scheme: 11 To what extent has globalisation led to a reduction in global 20 inequalities? Candidates are free to develop their own approach to the question and responses will vary depending on the approach chosen. Whichever approach is chosen, essays which use relevant examples and assess the extent to which globalisation has led to a reduction in global inequalities (or not) carefully will be credited. There may be detailed consideration of one or more examples or a broadly conceived response, drawing on several examples to show the relationship between the two aspects of the question. There must be a clear attempt to evaluate the extent to which globalisation has or has not led to a reduction in global inequalities, which would be enhanced by the consideration of other factors. Reference to regional inequalities within a country must be set within the context of the global scale. For globalisation, there might be consideration of the globalisation of economic activity through: • the global patterns of resources, production and markets • the role of FDI • the operation of the NIDL • activities of TNCs • outsourcing of manufacturing and offshoring of services • factors in the emergence and growth of NICs For global inequalities expect comment on both social and economic inequalities which may have reduced or widened. Award marks based on the quality of the response using the marking levels below. Level 4 16–20 Response thoroughly considers the relationship between globalisation and changes in global inequalities and the role of other factors. An effective and sustained evaluation with a sound conclusion. Response is well founded in detailed exemplar knowledge and insightful understanding of the context and strong conceptual understanding of the topic. Level 3 11–15 Response considers the link between globalisation and change in global inequalities but due to quite a narrow overall view, a limited number of aspects of globalisation or little consideration of other factors, the response lacks some balance. Response is broadly evaluative in character, comprising some explanatory or narrative content and a conclusion. Response develops on a largely secure base of knowledge and understanding with the use of example(s). Level 2 6–10 Response demonstrates some knowledge and understanding of globalisation and global inequalities but the link is not defined clearly or is weakly developed. The response does not consider other factors. Response is mainly descriptive or explanatory in approach and contains a brief or thinly supported evaluation. Responses without the use of example(s) to support the response will not get above the middle of Level 2 (8 marks). Level 1 1–5 Response makes a few general points about globalisation and/or global inequalities without establishing any links to reduction or widening of inequalities. A descriptive response comprising a few simple points. Knowledge is basic and understanding may be poor and lack relevance to the question set. Level 0 0 No creditable response.
Q12 · Assess the extent to which one country has experienced regional convergence
12 Assess the extent to which one country has experienced regional convergence. [20] [Total: 30]
Mark scheme: 12 Assess the extent to which one country has experienced regional 20 convergence. Candidates are free to develop their own approach to the question and responses will vary depending on the country chosen. Whichever approach is chosen, essays which use relevant examples from one country and which assess the extent to which regional convergence has occurred will be credited. An historical approach is valid considering the classic of first divergence and then convergence, though this may vary according to the example chosen. The use of theories such as core-periphery and cumulative causation, along with processes such as spread and backwash are valid but must be illustrated with reference to regional development of specific regions in a country. Award marks based on the quality of the response using the marking levels below. Level 4 16–20 Response thoroughly considers the extent to which regional convergence has taken place within a country. An effective, balanced and sustained assessment with a sound conclusion. Response is well founded in detailed exemplar knowledge, insightful understanding of the context and strong conceptual understanding of the topic. Level 3 11–15 Response considers the extent to which regional convergence has taken place within a country. Response is broadly an assessment comprising some explanatory or narrative content and a conclusion. Response develops on a largely secure base of knowledge and understanding with the use of example(s). Level 2 6–10 Response demonstrates some knowledge of inequalities within a country but struggles with the idea of regional convergence. Response is mainly descriptive or explanatory in approach and contains a brief or thinly supported assessment. Responses without the use of example(s) to support the response will not get above the middle of Level 2 (8 marks). Level 1 1–5 Response makes a few simple points about inequalities within a country but struggles to demonstrate knowledge about more than one region or does not consider convergence. A descriptive response comprising a few simple points. Knowledge is basic and understanding may be poor and lack relevance to the question set. Level 0 0 No creditable response.
What was in this paper
The subtopics covered by these 12 questions, and how many questions each got. Open one in a new tab to see every Cambridge question on it.
2Trade flows and trading patterns2Agricultural systems and food production1Environmental degradation1Manufacturing and related service industry1National development1Regional development within countries1The globalisation of economic activity1The management of a tourist destination1The management of change in manufacturing industry1What you needed in this session
Cambridge’s own grade thresholds for 2018 May/June, Paper 4 · Variant 1. A higher threshold means an easier paper — the bar moves with how the cohort did.