Cambridge A Level Geography 9696 — 2018 May/June Paper 2 · Variant 3
9696/23/M/J/18 · 6 questions · 60 marks · ≈68 min
The question paper and its mark scheme, free to read here and free to download. This is Cambridge’s own paper, exactly as it was sat.
Question paper4 pages

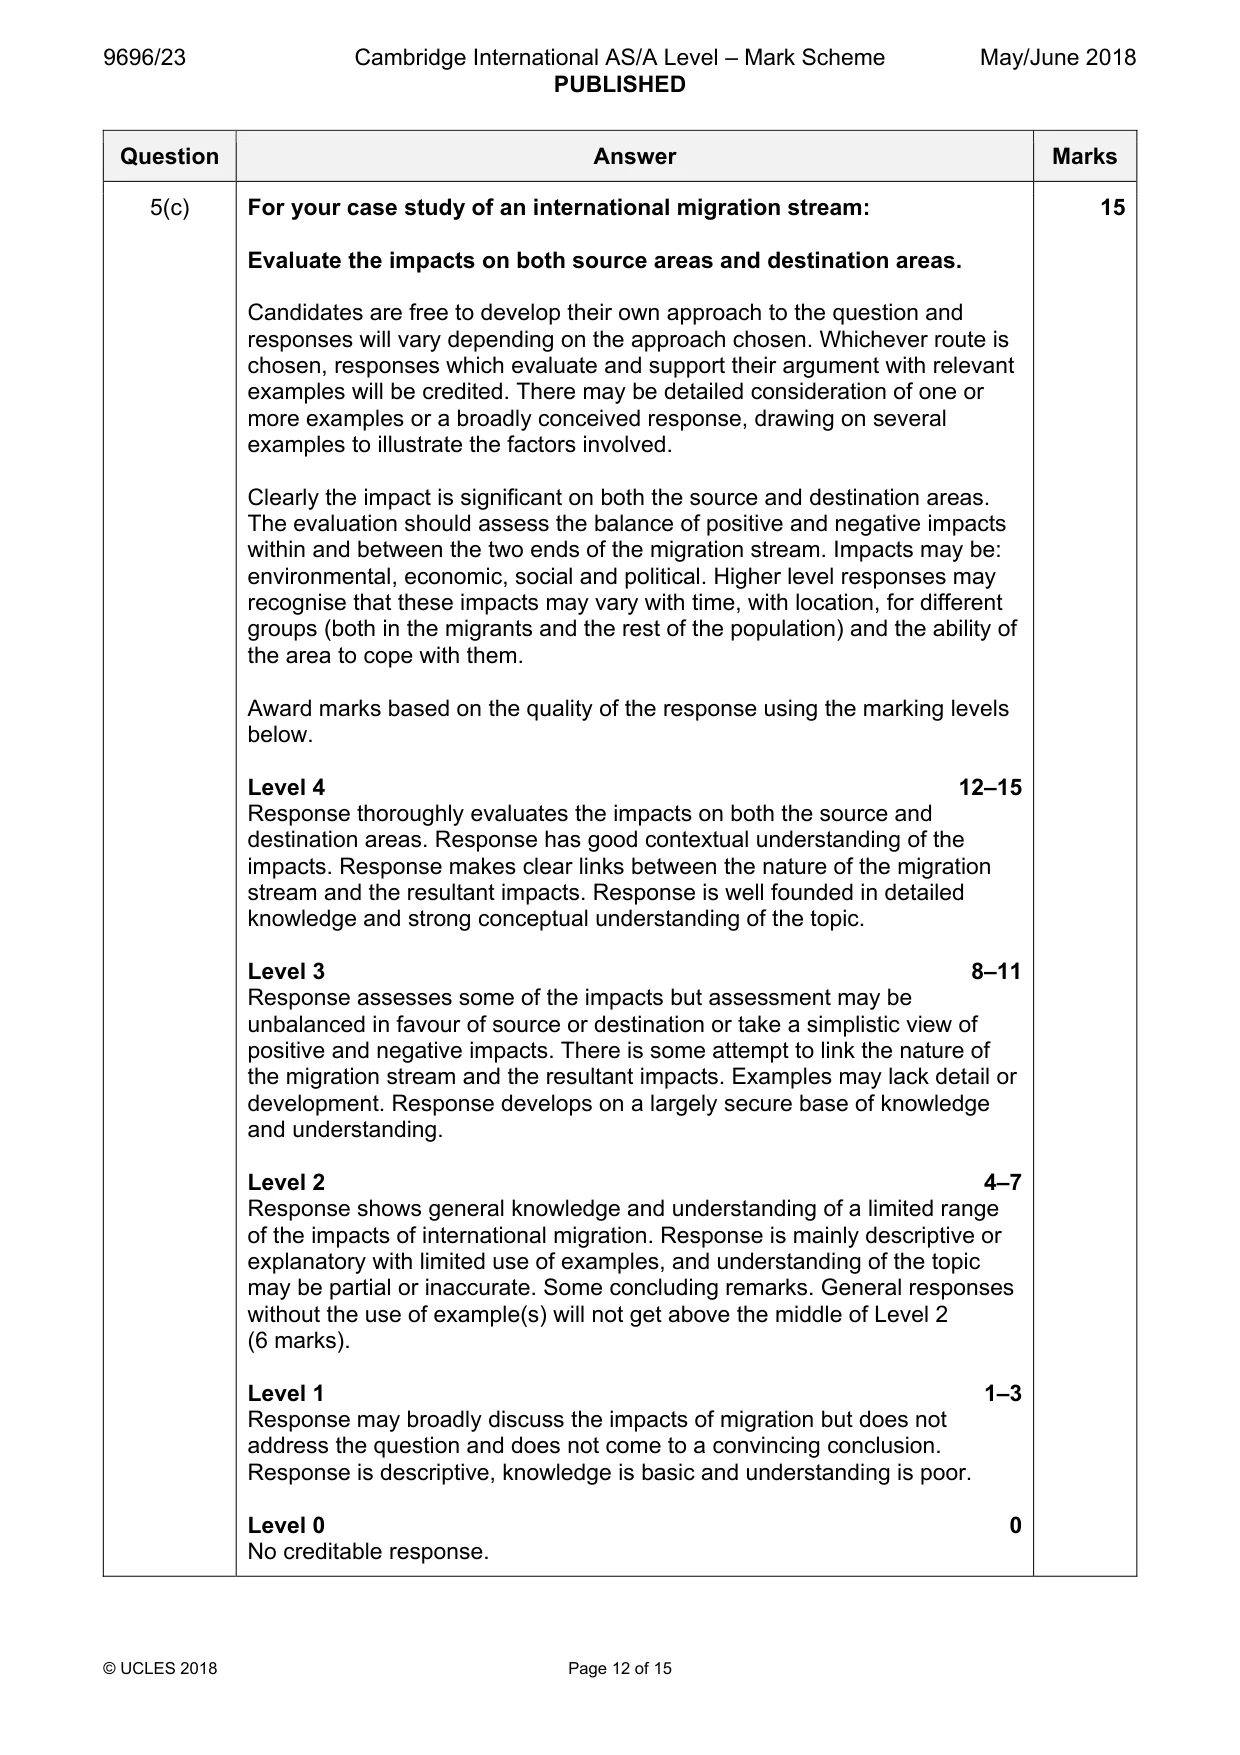
Mark scheme15 pages
Answers below. Sit the paper first if you are practising.


Questions as text
Q1 · The top five causes of death in the USA (an HIC) and Mali (an LIC in Africa) in 2013
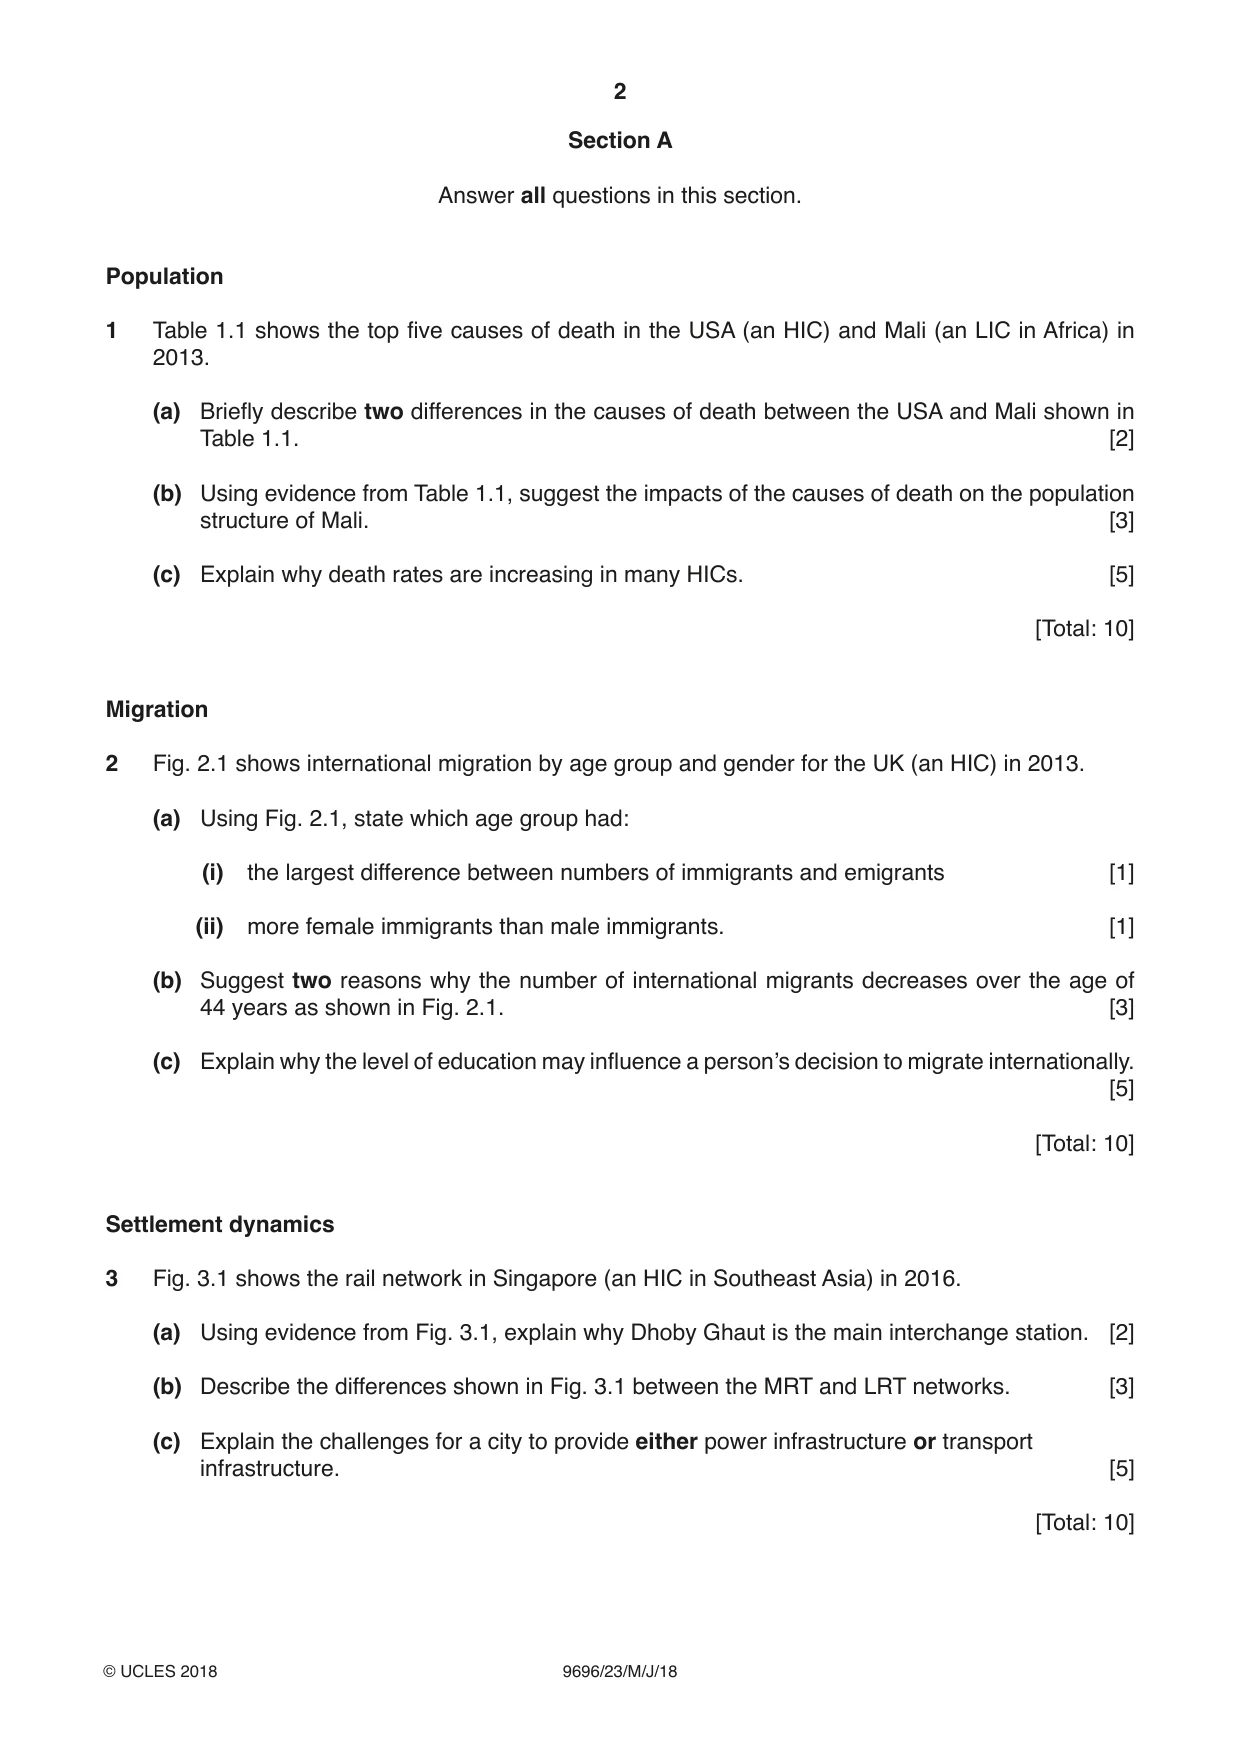
1 Table 1.1 shows the top five causes of death in the USA (an HIC) and Mali (an LIC in Africa) in 2013. (a) Briefly describe two differences in the causes of death between the USA and Mali shown in Table 1.1. [2] (b) Using evidence from Table 1.1, suggest the impacts of the causes of death on the population structure of Mali. [3] (c) Explain why death rates are increasing in many HICs. [5] [Total: 10] Migration
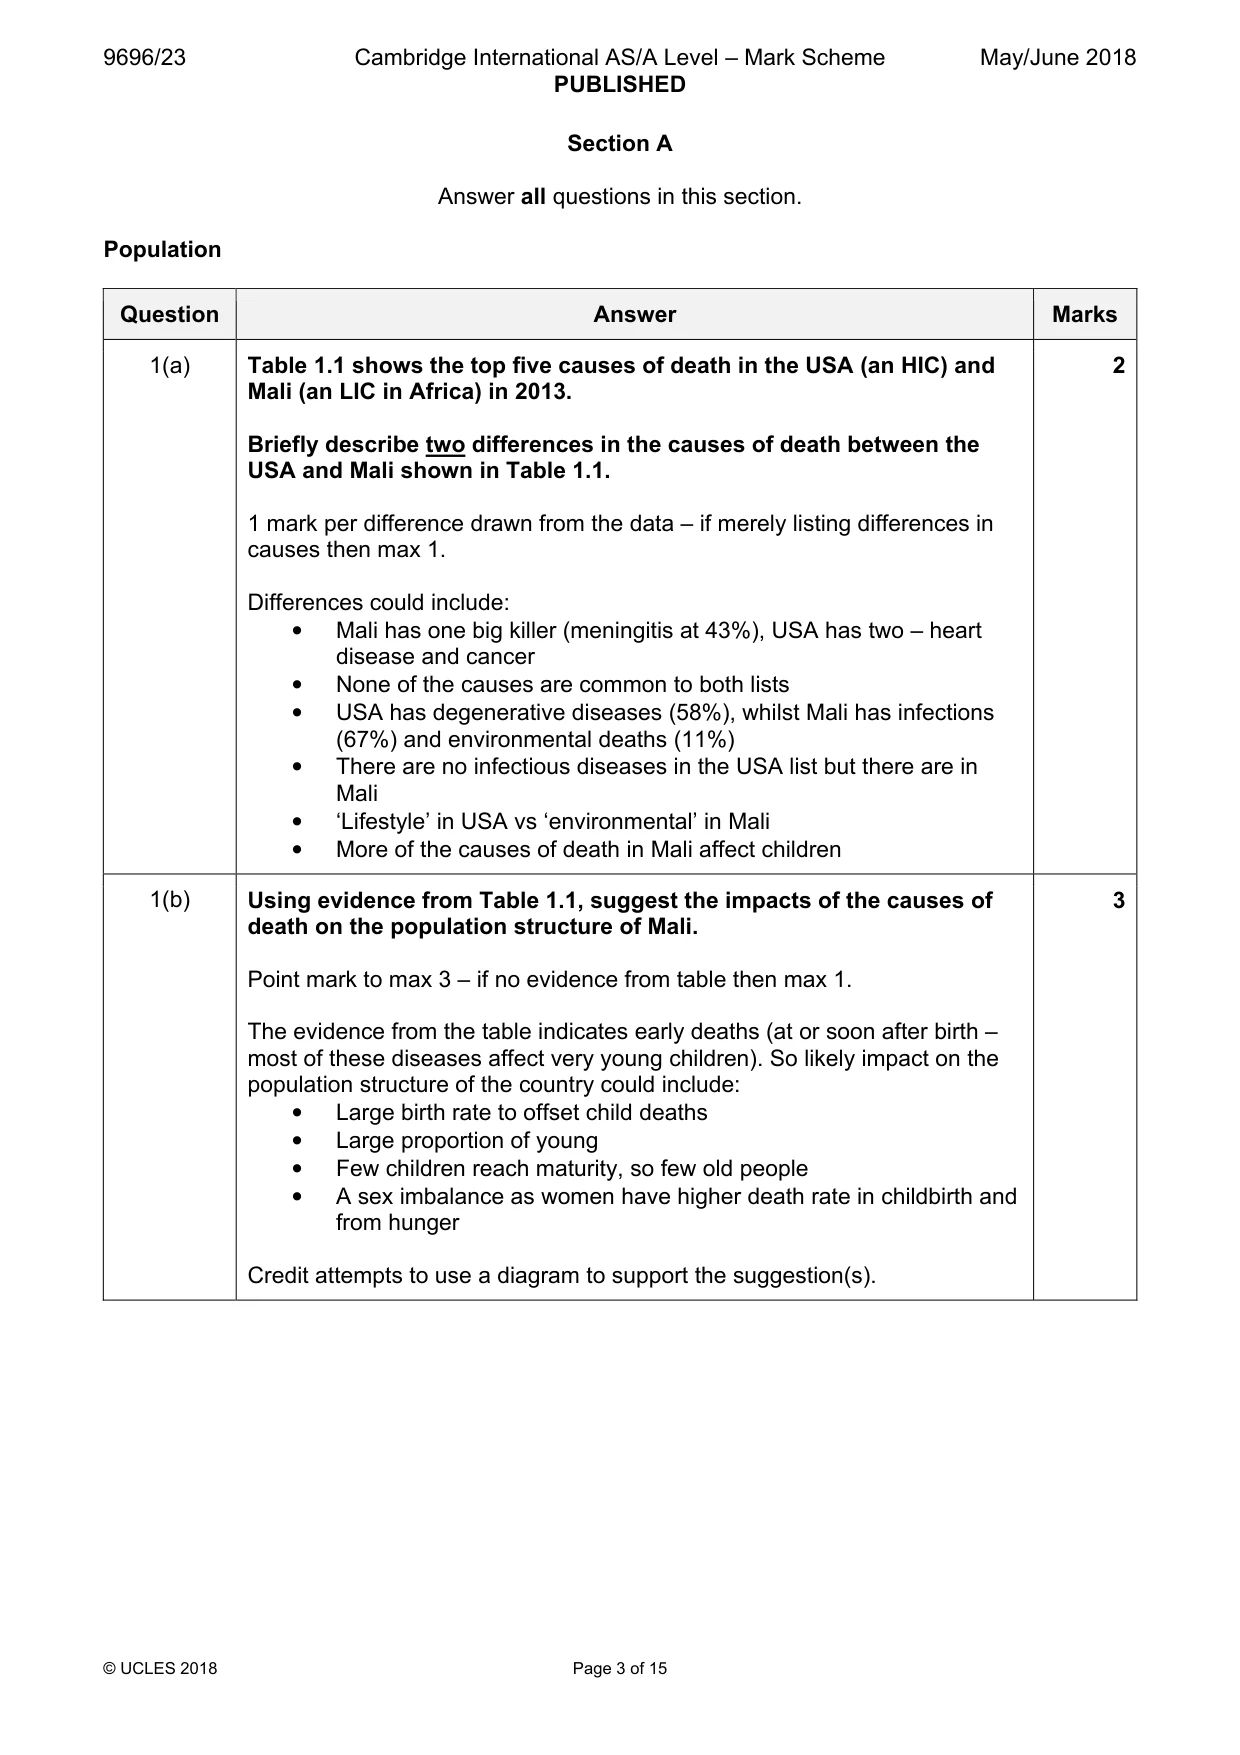
Mark scheme: Question Answer Marks 1(a) Table 1.1 shows the top five causes of death in the USA (an HIC) and 2 Mali (an LIC in Africa) in 2013. Briefly describe two differences in the causes of death between the USA and Mali shown in Table 1.1. 1 mark per difference drawn from the data – if merely listing differences in causes then max 1. Differences could include: • Mali has one big killer (meningitis at 43%), USA has two – heart disease and cancer • None of the causes are common to both lists • USA has degenerative diseases (58%), whilst Mali has infections (67%) and environmental deaths (11%) • There are no infectious diseases in the USA list but there are in Mali • ‘Lifestyle’ in USA vs ‘environmental’ in Mali • More of the causes of death in Mali affect children 1(b) Using evidence from Table 1.1, suggest the impacts of the causes of 3 death on the population structure of Mali. Point mark to max 3 – if no evidence from table then max 1. The evidence from the table indicates early deaths (at or soon after birth – most of these diseases affect very young children). So likely impact on the population structure of the country could include: • Large birth rate to offset child deaths • Large proportion of young • Few children reach maturity, so few old people • A sex imbalance as women have higher death rate in childbirth and from hunger Credit attempts to use a diagram to support the suggestion(s). 1(c) Explain why death rates are increasing in many HICs. 5 This is a fairly recent phenomenon and reflects a number of factors. These could include: • An ageing population, so more deaths from degenerative diseases • Affluent lifestyle leading to obesity, diabetes, etc. • Environmental pollution (especially traffic fumes) causing cancer and lung problems • Increased stress (e.g. work-related) leading to depression, suicide, excessive use of alcohol, etc. • Social habits, e.g. smoking, alcohol, drugs • More travel abroad – skin cancer Point mark 1 per point or more if point developed with detail and/or example. Migration
Q2 · International migration by age group and gender for the UK (an HIC) in 2013
2 Fig. 2.1 shows international migration by age group and gender for the UK (an HIC) in 2013. (a) Using Fig. 2.1, state which age group had: (i) the largest difference between numbers of immigrants and emigrants [1] (ii) more female immigrants than male immigrants. [1] (b) Suggest two reasons why the number of international migrants decreases over the age of 44 years as shown in Fig. 2.1. [3] (c) Explain why the level of education may influence a person’s decision to migrate internationally. [5] [Total: 10] Settlement dynamics
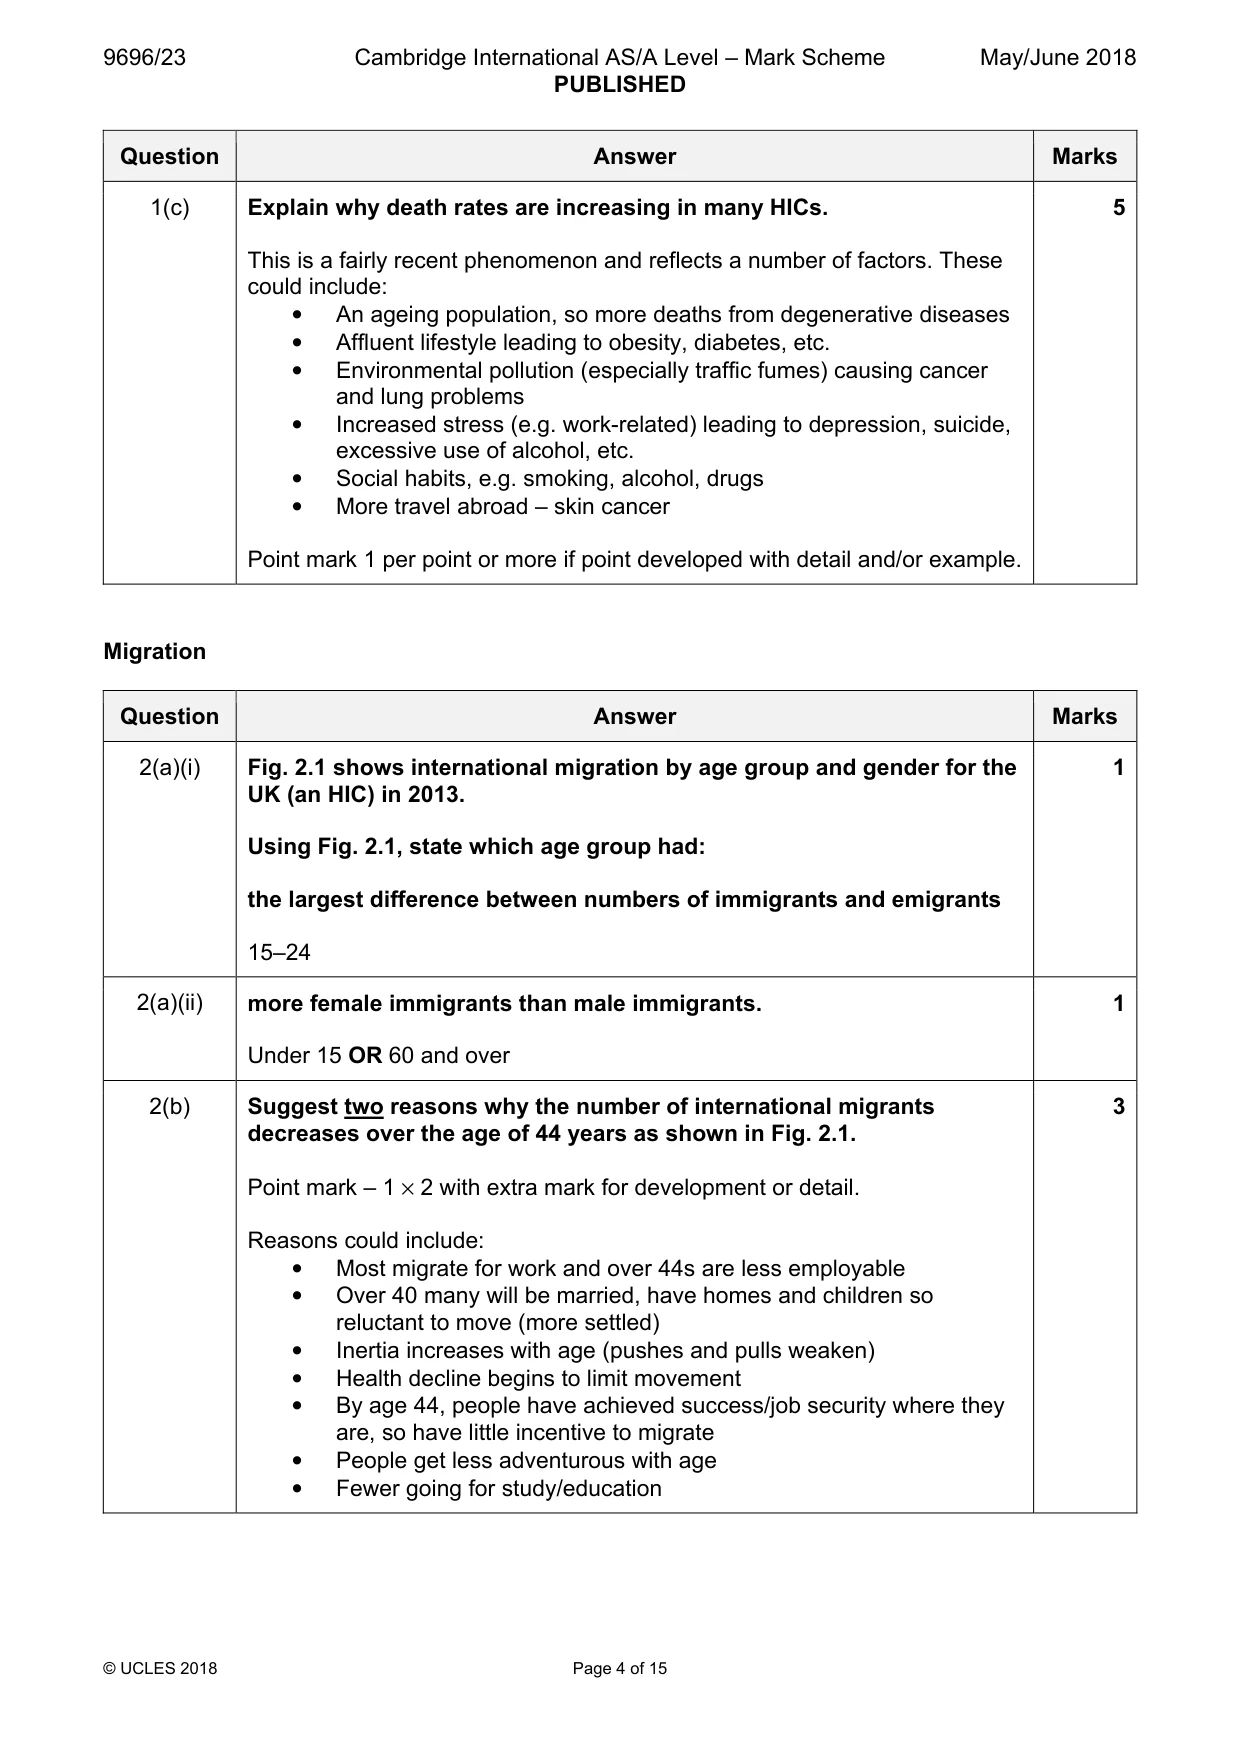
Mark scheme: 2(a)(i) Fig. 2.1 shows international migration by age group and gender for the 1 UK (an HIC) in 2013. Using Fig. 2.1, state which age group had: the largest difference between numbers of immigrants and emigrants 15–24 2(a)(ii) more female immigrants than male immigrants. 1 Under 15 OR 60 and over 2(b) Suggest two reasons why the number of international migrants 3 decreases over the age of 44 years as shown in Fig. 2.1. Point mark – 1 × 2 with extra mark for development or detail. Reasons could include: • Most migrate for work and over 44s are less employable • Over 40 many will be married, have homes and children so reluctant to move (more settled) • Inertia increases with age (pushes and pulls weaken) • Health decline begins to limit movement • By age 44, people have achieved success/job security where they are, so have little incentive to migrate • People get less adventurous with age • Fewer going for study/education 2(c) Explain why the level of education may influence a person’s decision 5 to migrate internationally. There are a number of ways of answering this, so one reason well developed could gain a maximum if well supported with an example or data or a range of points in less detail. The level of education influences the migrant’s decision to migrate in a number of ways. These include: • Some migrate to improve their education (to colleges abroad) • Some migrate to spread/use their education, e.g. doctors • Education improves the perception and understanding of opportunities elsewhere • Some countries operate controls that consider the level of education • Higher education tends to increase ambition and reduce inertia • The higher the education level, the later people have children which would hinder the ability to migrate Settlement dynamics
Q3 · The rail network in Singapore (an HIC in Southeast Asia) in 2016
3 Fig. 3.1 shows the rail network in Singapore (an HIC in Southeast Asia) in 2016. (a) Using evidence from Fig. 3.1, explain why Dhoby Ghaut is the main interchange station. [2] (b) Describe the differences shown in Fig. 3.1 between the MRT and LRT networks. [3] (c) Explain the challenges for a city to provide either power infrastructure or transport infrastructure. [5] [Total: 10]
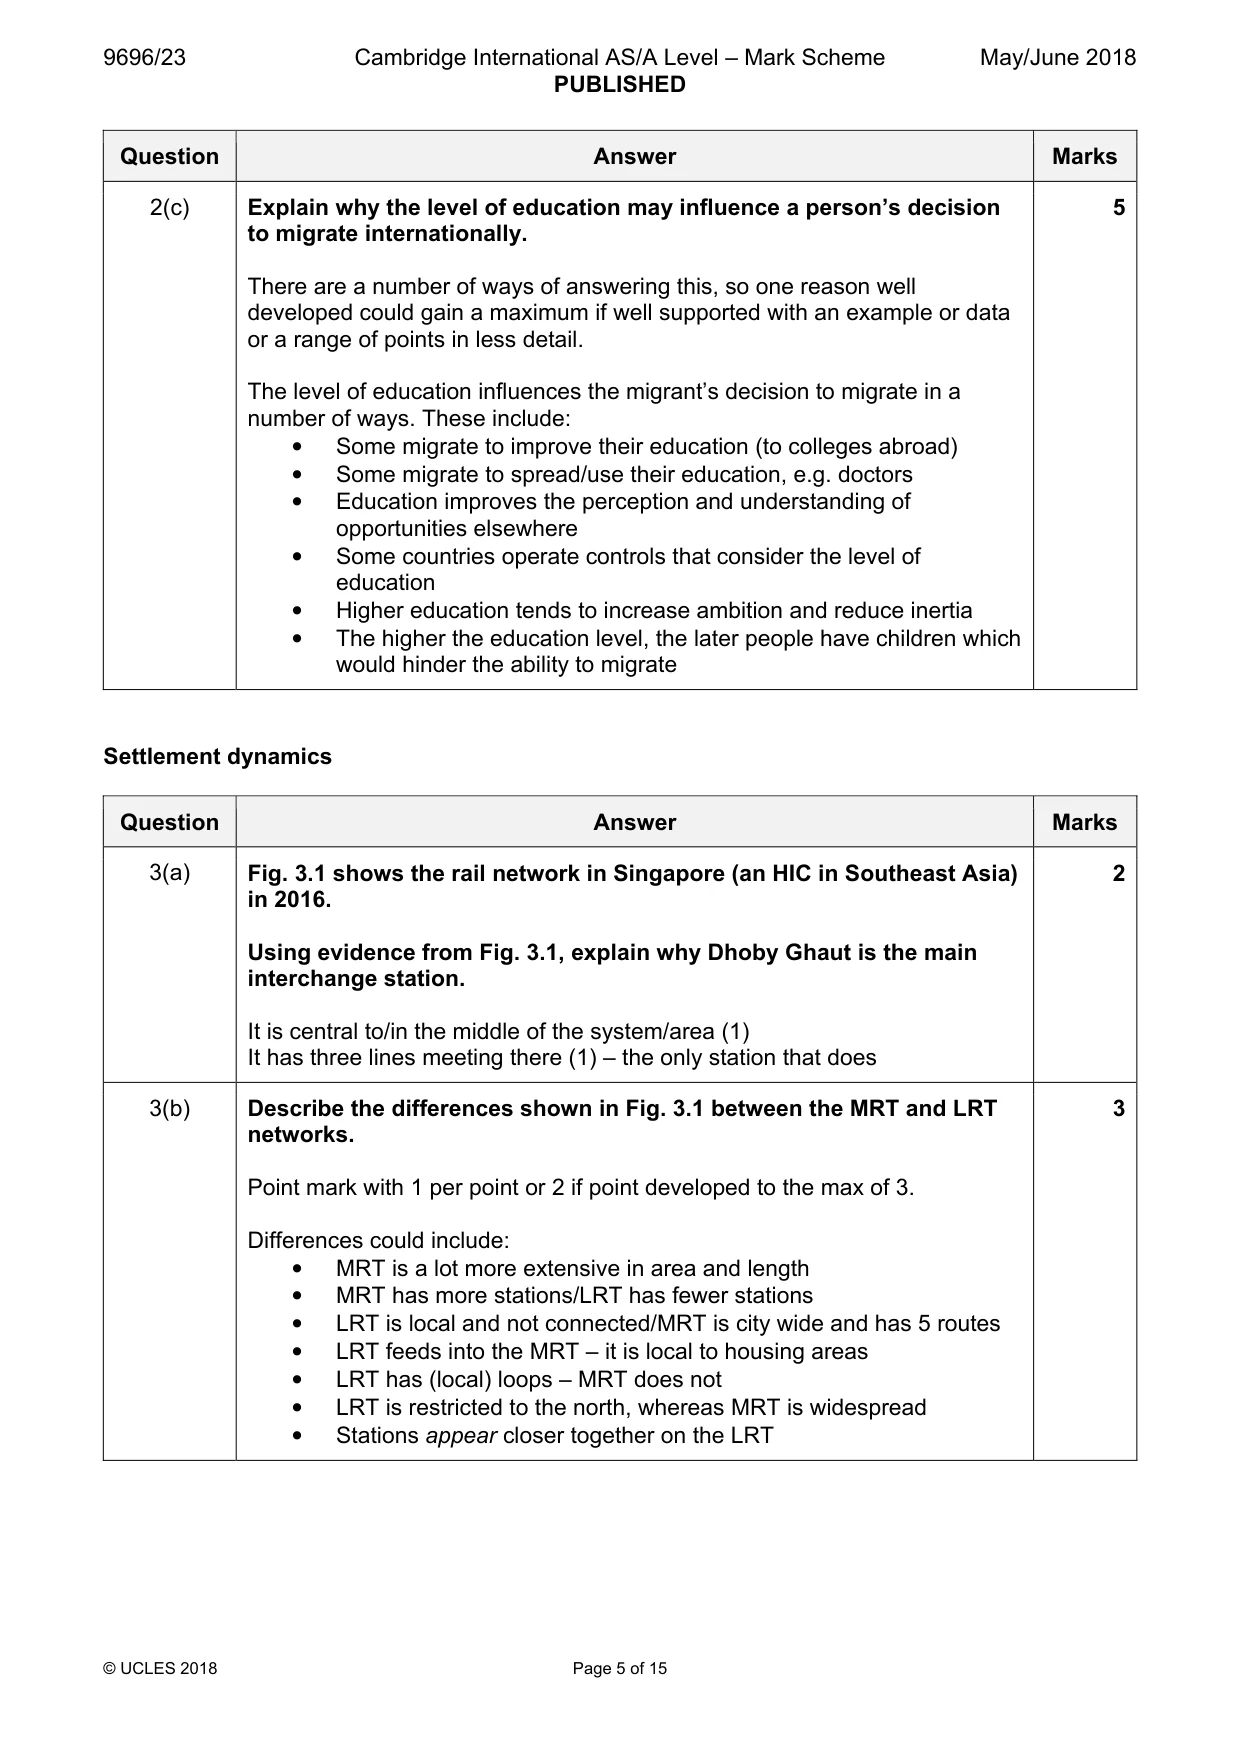
Mark scheme: 3(a) Fig. 3.1 shows the rail network in Singapore (an HIC in Southeast Asia) 2 in 2016. Using evidence from Fig. 3.1, explain why Dhoby Ghaut is the main interchange station. It is central to/in the middle of the system/area (1) It has three lines meeting there (1) – the only station that does 3(b) Describe the differences shown in Fig. 3.1 between the MRT and LRT 3 networks. Point mark with 1 per point or 2 if point developed to the max of 3. Differences could include: • MRT is a lot more extensive in area and length • MRT has more stations/LRT has fewer stations • LRT is local and not connected/MRT is city wide and has 5 routes • LRT feeds into the MRT – it is local to housing areas • LRT has (local) loops – MRT does not • LRT is restricted to the north, whereas MRT is widespread • Stations appear closer together on the LRT 3(c) Explain the challenges for a city to provide either power infrastructure 5 or transport infrastructure. Point mark with 1 per point or 2 if point developed to the max of 5. It depends on which case study the candidate has done but there are some common challenges such as: • Finding the expensive investment capital for construction • Noise and disruption during the development phase/construction • Pricing policies • Distribution of the service – who gets what and where • Size or scale of the area involved • May need to demolish existing property to deliver the infrastructure • Environmental issues – e.g. pollution • Finding the expertise and technology to construct and operate the infrastructure • Opposition from locals, environmental campaigners, etc. • Persuading people to switch from their existing mode of transport Section B Answer one question from this section. Population
Q4 · Explain the concept of food security
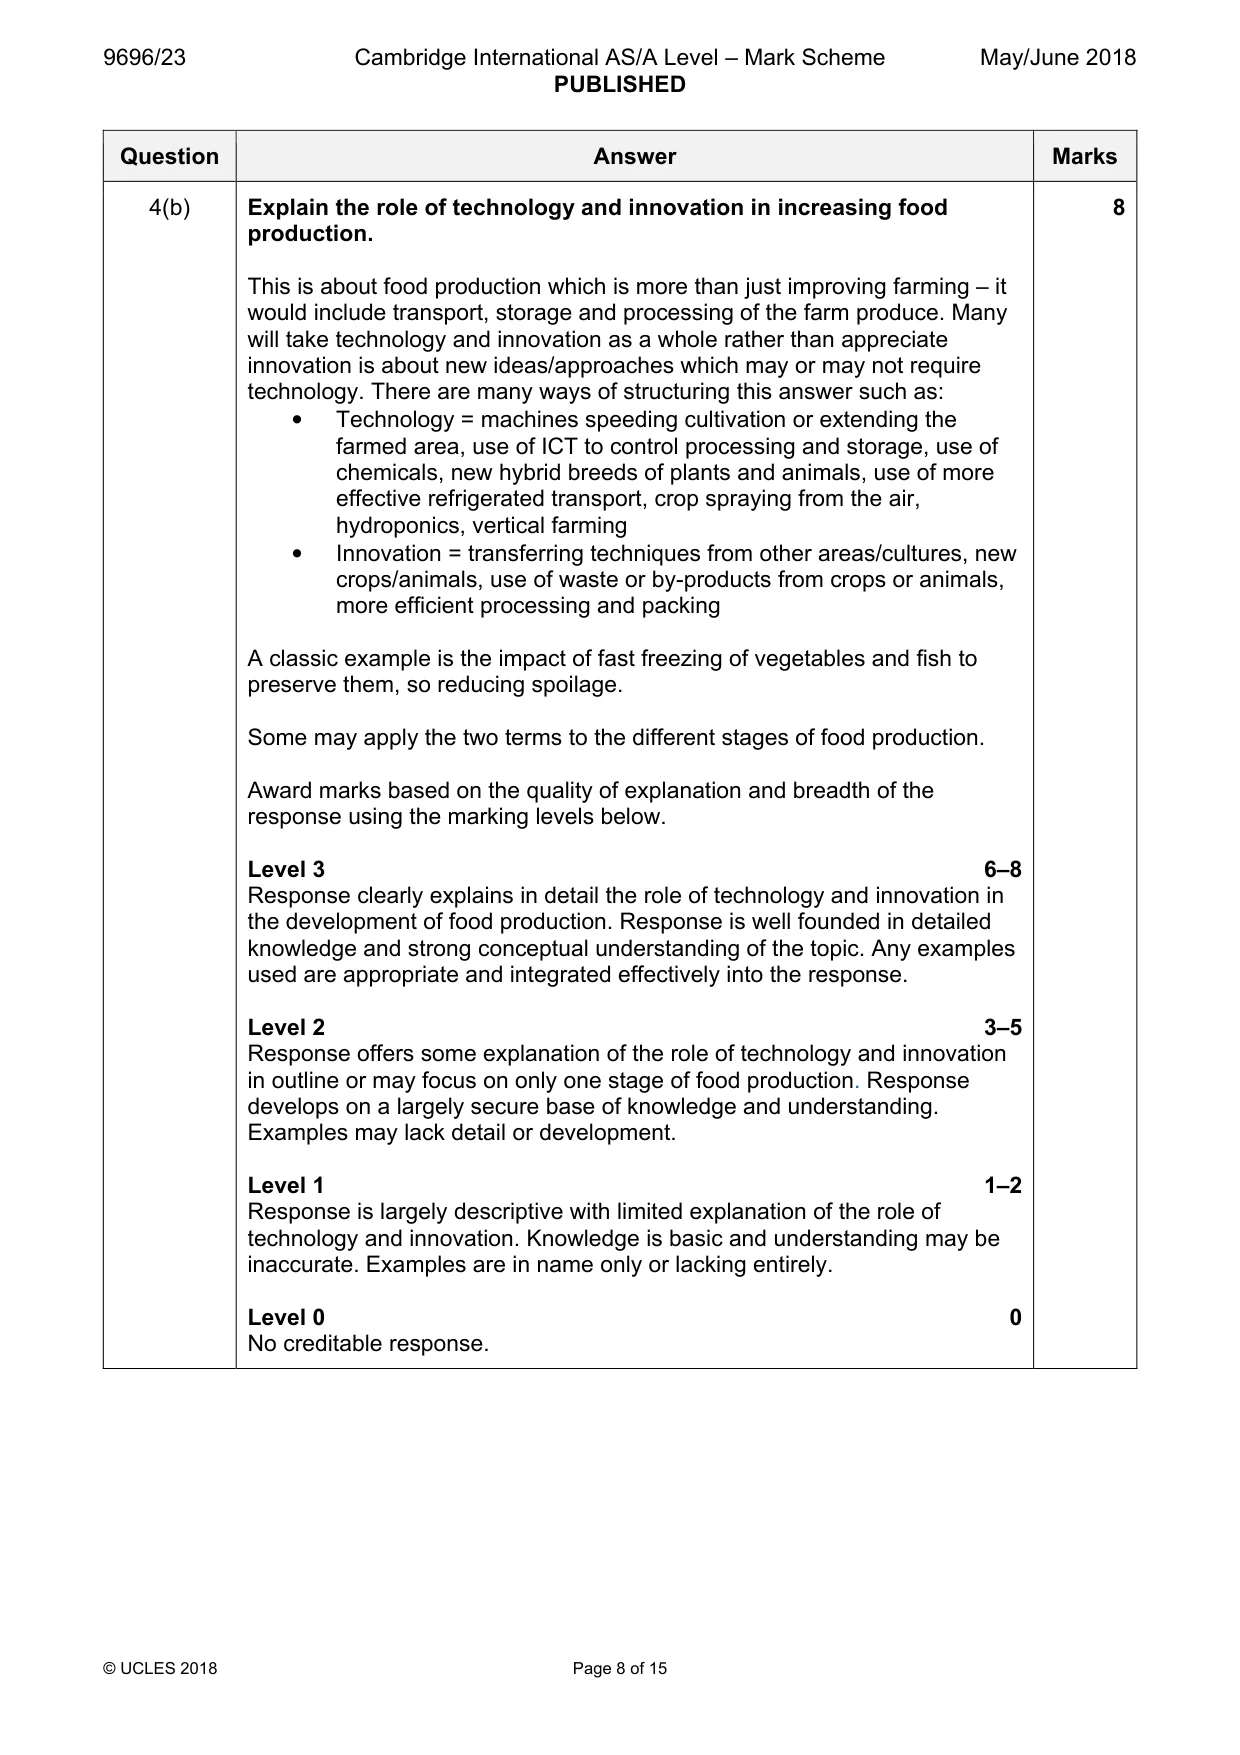
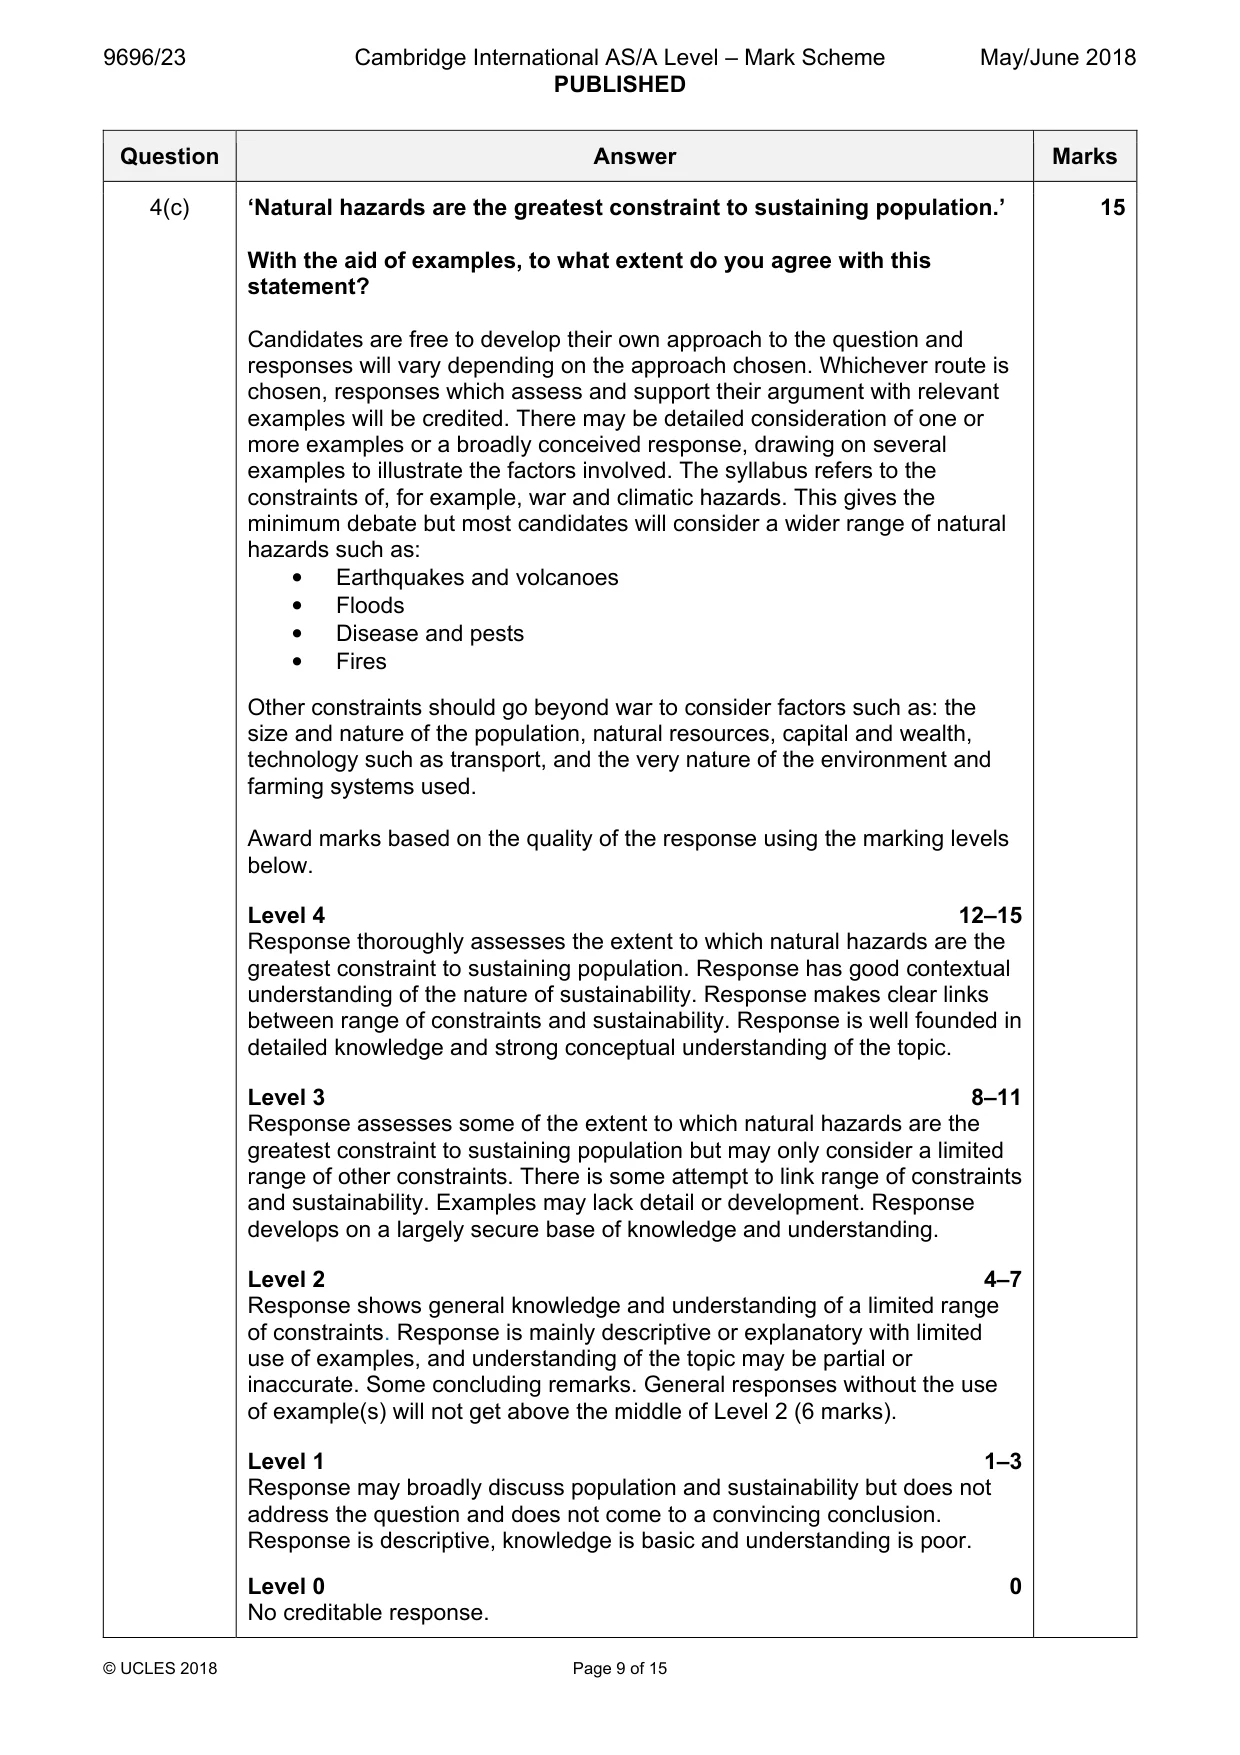
4 (a) (i) Explain the concept of food security. [3] (ii) Describe two consequences of food shortages. [4] (b) Explain the role of technology and innovation in increasing food production. [8] (c) ‘Natural hazards are the greatest constraint to sustaining population.’ With the aid of examples, to what extent do you agree with this statement? [15] [Total: 30] Population/Migration
Mark scheme: 4(a)(i) Explain the concept of food security. 3 The World Food Summit of 1996 defined food security as existing ‘when all people (1) at all times have access to sufficient (1), safe (1), nutritious food (1) to maintain a healthy and active life.’ (1) Equally, credit other versions that stress sufficient, safe, nutritious and linked to healthy life. 4(a)(ii) Describe two consequences of food shortages. 4 Point mark with 1 per point or 2 if point developed to the max of 4. There are numerous consequences including: • Starvation and death • Malnutrition/ill-health/increased vulnerability to diseases • Lack of energy, so productivity falls • Migration out of area • Rationing – often by price rise • Increased friction between haves and have-nots • Positive responses, e.g. stimulus to improve food production (technology, innovation) 4(b) Explain the role of technology and innovation in increasing food 8 production. This is about food production which is more than just improving farming – it would include transport, storage and processing of the farm produce. Many will take technology and innovation as a whole rather than appreciate innovation is about new ideas/approaches which may or may not require technology. There are many ways of structuring this answer such as: • Technology = machines speeding cultivation or extending the farmed area, use of ICT to control processing and storage, use of chemicals, new hybrid breeds of plants and animals, use of more effective refrigerated transport, crop spraying from the air, hydroponics, vertical farming • Innovation = transferring techniques from other areas/cultures, new crops/animals, use of waste or by-products from crops or animals, more efficient processing and packing A classic example is the impact of fast freezing of vegetables and fish to preserve them, so reducing spoilage. Some may apply the two terms to the different stages of food production. Award marks based on the quality of explanation and breadth of the response using the marking levels below. Level 3 6–8 Response clearly explains in detail the role of technology and innovation in the development of food production. Response is well founded in detailed knowledge and strong conceptual understanding of the topic. Any examples used are appropriate and integrated effectively into the response. Level 2 3–5 Response offers some explanation of the role of technology and innovation in outline or may focus on only one stage of food production. Response develops on a largely secure base of knowledge and understanding. Examples may lack detail or development. Level 1 1–2 Response is largely descriptive with limited explanation of the role of technology and innovation. Knowledge is basic and understanding may be inaccurate. Examples are in name only or lacking entirely. Level 0 0 No creditable response. 4(c) ‘Natural hazards are the greatest constraint to sustaining population.’ 15 With the aid of examples, to what extent do you agree with this statement? Candidates are free to develop their own approach to the question and responses will vary depending on the approach chosen. Whichever route is chosen, responses which assess and support their argument with relevant examples will be credited. There may be detailed consideration of one or more examples or a broadly conceived response, drawing on several examples to illustrate the factors involved. The syllabus refers to the constraints of, for example, war and climatic hazards. This gives the minimum debate but most candidates will consider a wider range of natural hazards such as: • Earthquakes and volcanoes • Floods • Disease and pests • Fires Other constraints should go beyond war to consider factors such as: the size and nature of the population, natural resources, capital and wealth, technology such as transport, and the very nature of the environment and farming systems used. Award marks based on the quality of the response using the marking levels below. Level 4 12–15 Response thoroughly assesses the extent to which natural hazards are the greatest constraint to sustaining population. Response has good contextual understanding of the nature of sustainability. Response makes clear links between range of constraints and sustainability. Response is well founded in detailed knowledge and strong conceptual understanding of the topic. Level 3 8–11 Response assesses some of the extent to which natural hazards are the greatest constraint to sustaining population but may only consider a limited range of other constraints. There is some attempt to link range of constraints and sustainability. Examples may lack detail or development. Response develops on a largely secure base of knowledge and understanding. Level 2 4–7 Response shows general knowledge and understanding of a limited range of constraints. Response is mainly descriptive or explanatory with limited use of examples, and understanding of the topic may be partial or inaccurate. Some concluding remarks. General responses without the use of example(s) will not get above the middle of Level 2 (6 marks). Level 1 1–3 Response may broadly discuss population and sustainability but does not address the question and does not come to a convincing conclusion. Response is descriptive, knowledge is basic and understanding is poor. Level 0 0 No creditable response. Population/Migration
Q5 · For your case study of an international migration stream: (a) describe the character [7]…
5 For your case study of an international migration stream: (a) describe the character [7] (b) explain the causes [8] (c) evaluate the impacts on both source areas and destination areas. [15] [Total: 30] Migration/Settlement dynamics
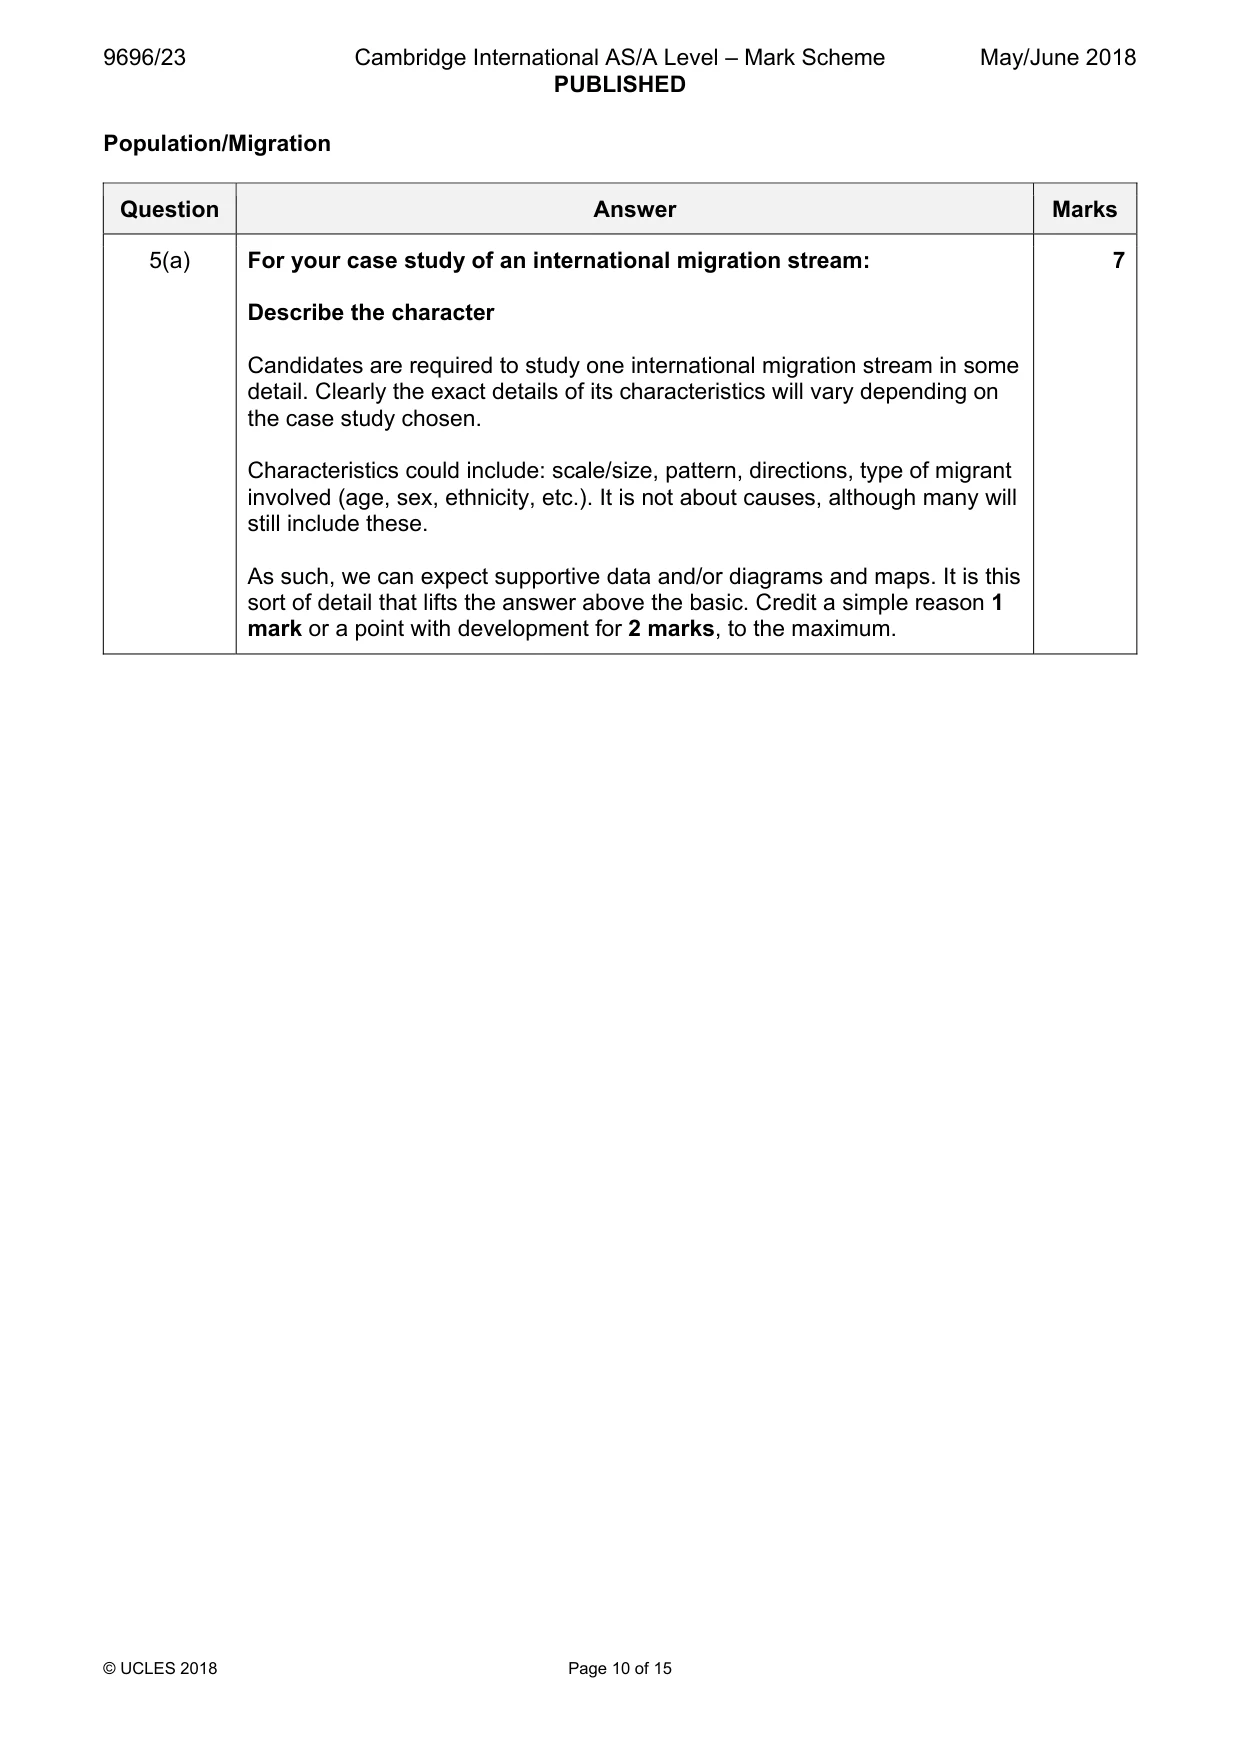
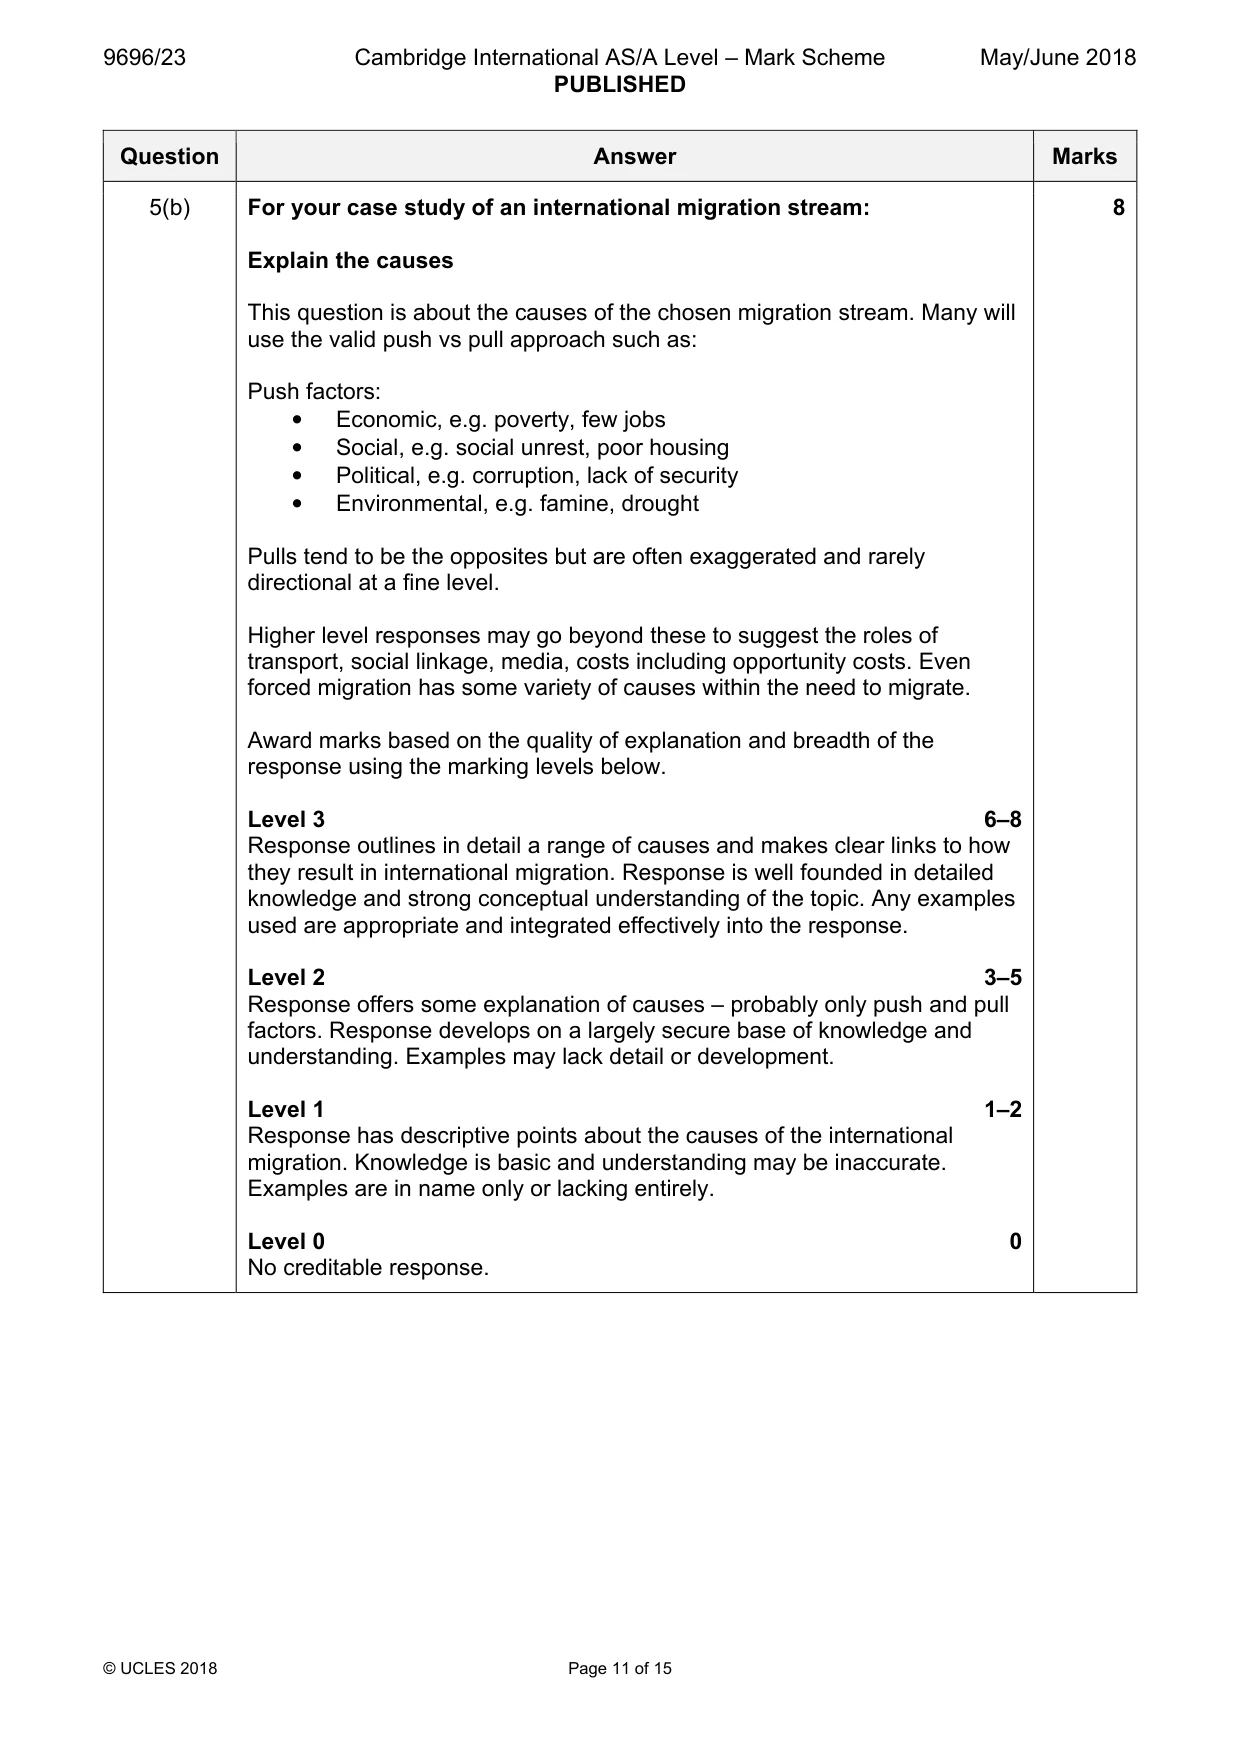
Mark scheme: 5(a) For your case study of an international migration stream: 7 Describe the character Candidates are required to study one international migration stream in some detail. Clearly the exact details of its characteristics will vary depending on the case study chosen. Characteristics could include: scale/size, pattern, directions, type of migrant involved (age, sex, ethnicity, etc.). It is not about causes, although many will still include these. As such, we can expect supportive data and/or diagrams and maps. It is this sort of detail that lifts the answer above the basic. Credit a simple reason 1 mark or a point with development for 2 marks, to the maximum. 5(b) For your case study of an international migration stream: 8 Explain the causes This question is about the causes of the chosen migration stream. Many will use the valid push vs pull approach such as: Push factors: • Economic, e.g. poverty, few jobs • Social, e.g. social unrest, poor housing • Political, e.g. corruption, lack of security • Environmental, e.g. famine, drought Pulls tend to be the opposites but are often exaggerated and rarely directional at a fine level. Higher level responses may go beyond these to suggest the roles of transport, social linkage, media, costs including opportunity costs. Even forced migration has some variety of causes within the need to migrate. Award marks based on the quality of explanation and breadth of the response using the marking levels below. Level 3 6–8 Response outlines in detail a range of causes and makes clear links to how they result in international migration. Response is well founded in detailed knowledge and strong conceptual understanding of the topic. Any examples used are appropriate and integrated effectively into the response. Level 2 3–5 Response offers some explanation of causes – probably only push and pull factors. Response develops on a largely secure base of knowledge and understanding. Examples may lack detail or development. Level 1 1–2 Response has descriptive points about the causes of the international migration. Knowledge is basic and understanding may be inaccurate. Examples are in name only or lacking entirely. Level 0 0 No creditable response. 5(c) For your case study of an international migration stream: 15 Evaluate the impacts on both source areas and destination areas. Candidates are free to develop their own approach to the question and responses will vary depending on the approach chosen. Whichever route is chosen, responses which evaluate and support their argument with relevant examples will be credited. There may be detailed consideration of one or more examples or a broadly conceived response, drawing on several examples to illustrate the factors involved. Clearly the impact is significant on both the source and destination areas. The evaluation should assess the balance of positive and negative impacts within and between the two ends of the migration stream. Impacts may be: environmental, economic, social and political. Higher level responses may recognise that these impacts may vary with time, with location, for different groups (both in the migrants and the rest of the population) and the ability of the area to cope with them. Award marks based on the quality of the response using the marking levels below. Level 4 12–15 Response thoroughly evaluates the impacts on both the source and destination areas. Response has good contextual understanding of the impacts. Response makes clear links between the nature of the migration stream and the resultant impacts. Response is well founded in detailed knowledge and strong conceptual understanding of the topic. Level 3 8–11 Response assesses some of the impacts but assessment may be unbalanced in favour of source or destination or take a simplistic view of positive and negative impacts. There is some attempt to link the nature of the migration stream and the resultant impacts. Examples may lack detail or development. Response develops on a largely secure base of knowledge and understanding. Level 2 4–7 Response shows general knowledge and understanding of a limited range of the impacts of international migration. Response is mainly descriptive or explanatory with limited use of examples, and understanding of the topic may be partial or inaccurate. Some concluding remarks. General responses without the use of example(s) will not get above the middle of Level 2 (6 marks). Level 1 1–3 Response may broadly discuss the impacts of migration but does not address the question and does not come to a convincing conclusion. Response is descriptive, knowledge is basic and understanding is poor. Level 0 0 No creditable response. Migration/Settlement dynamics
Q6 · Explain why the population of many large cities is decreasing
6 (a) Explain why the population of many large cities is decreasing. [7] (b) Suggest why urban renewal occurs in many cities in HICs. [8] (c) ‘Residential segregation within urban areas is mainly caused by differences in income.’ With the aid of examples, how far do you agree? [15] [Total: 30]
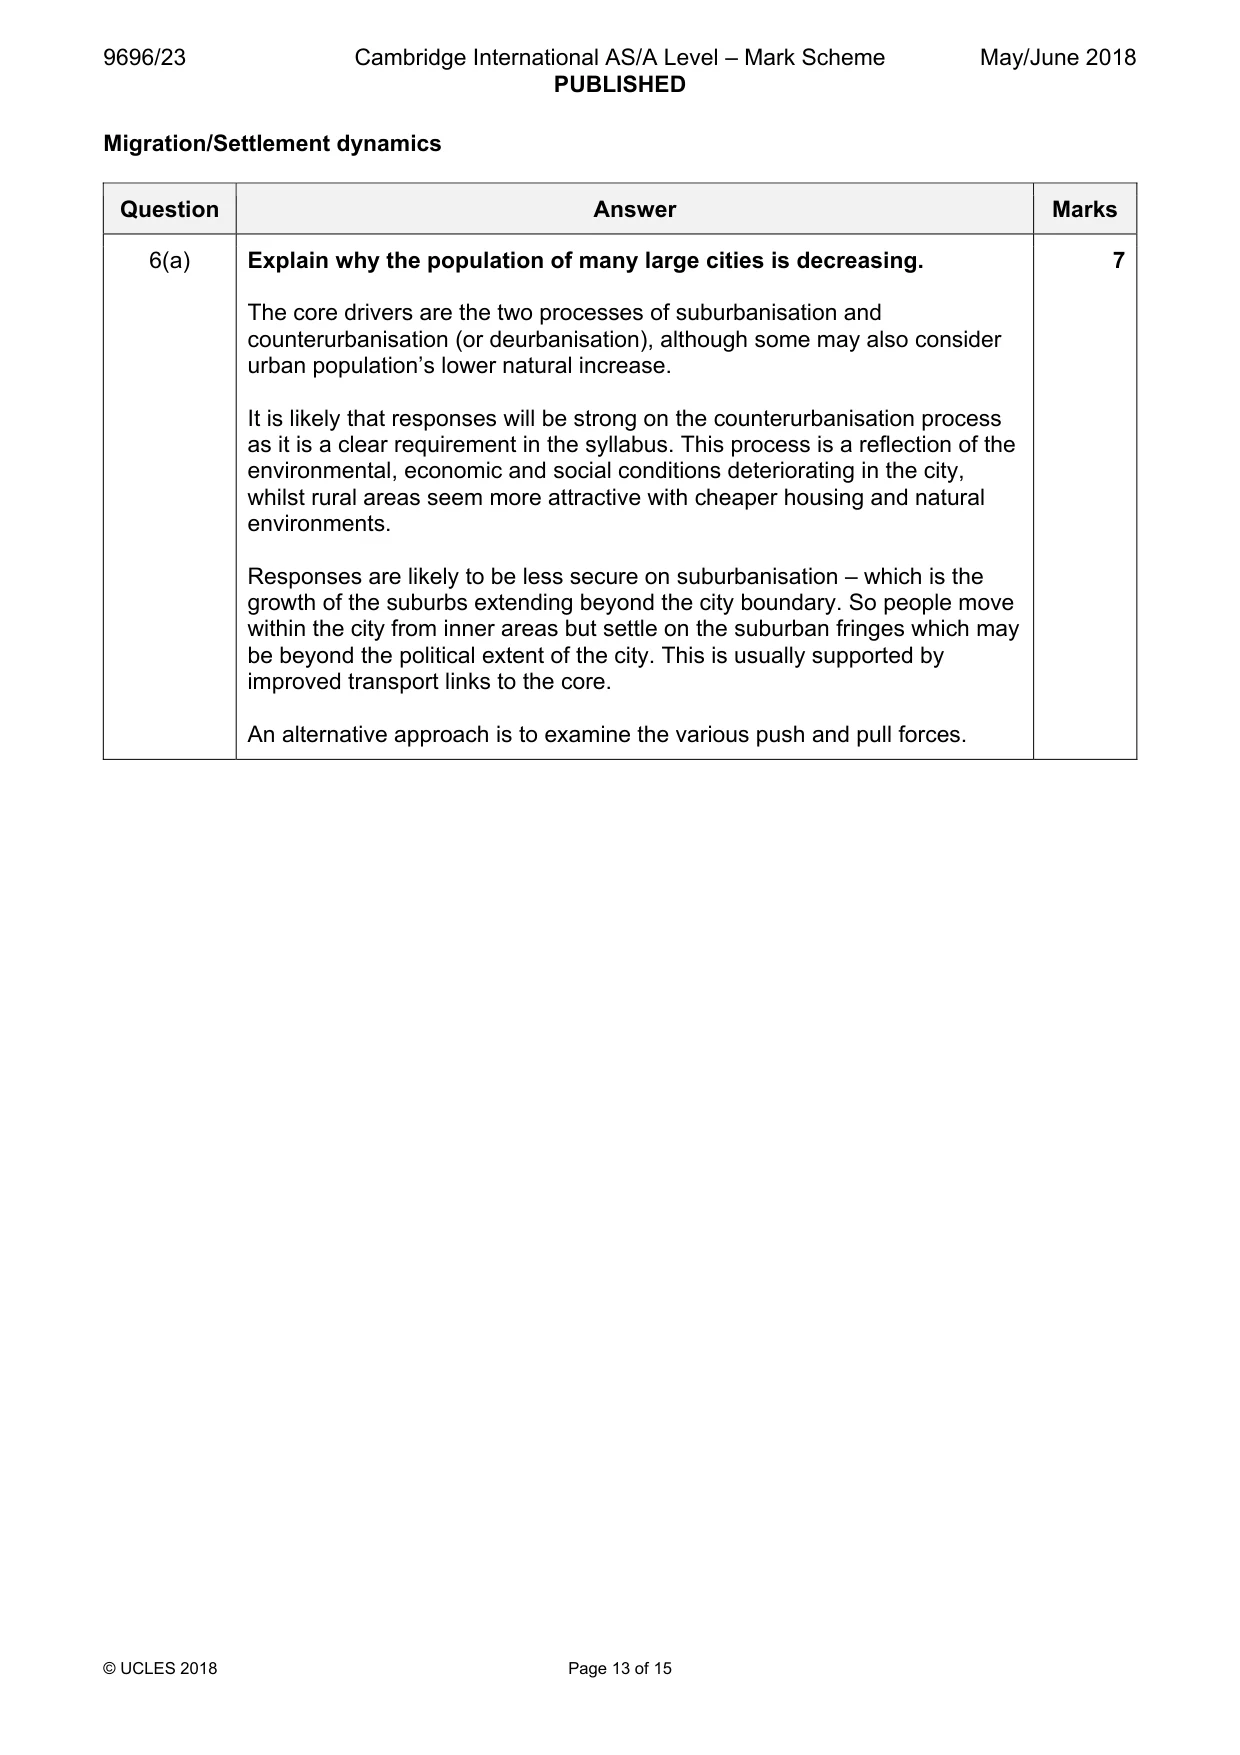
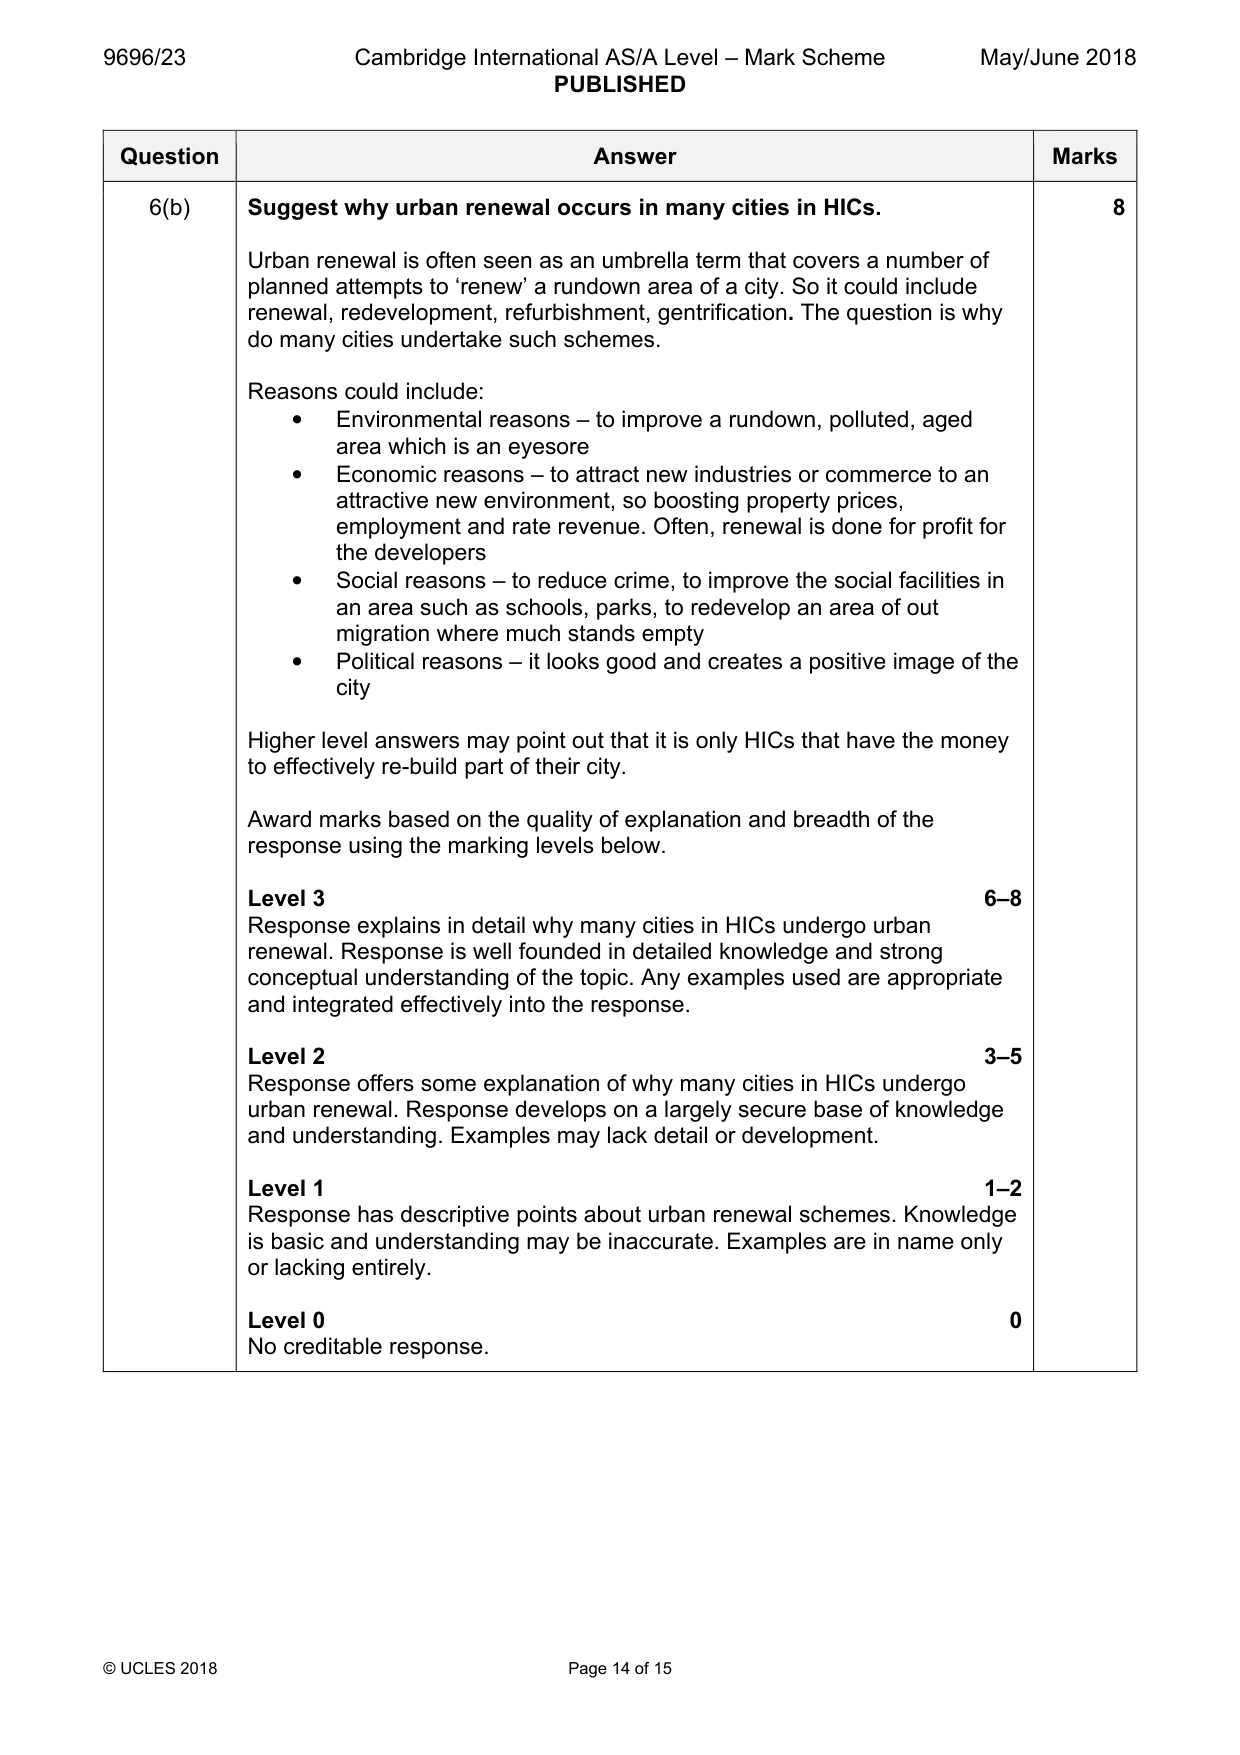
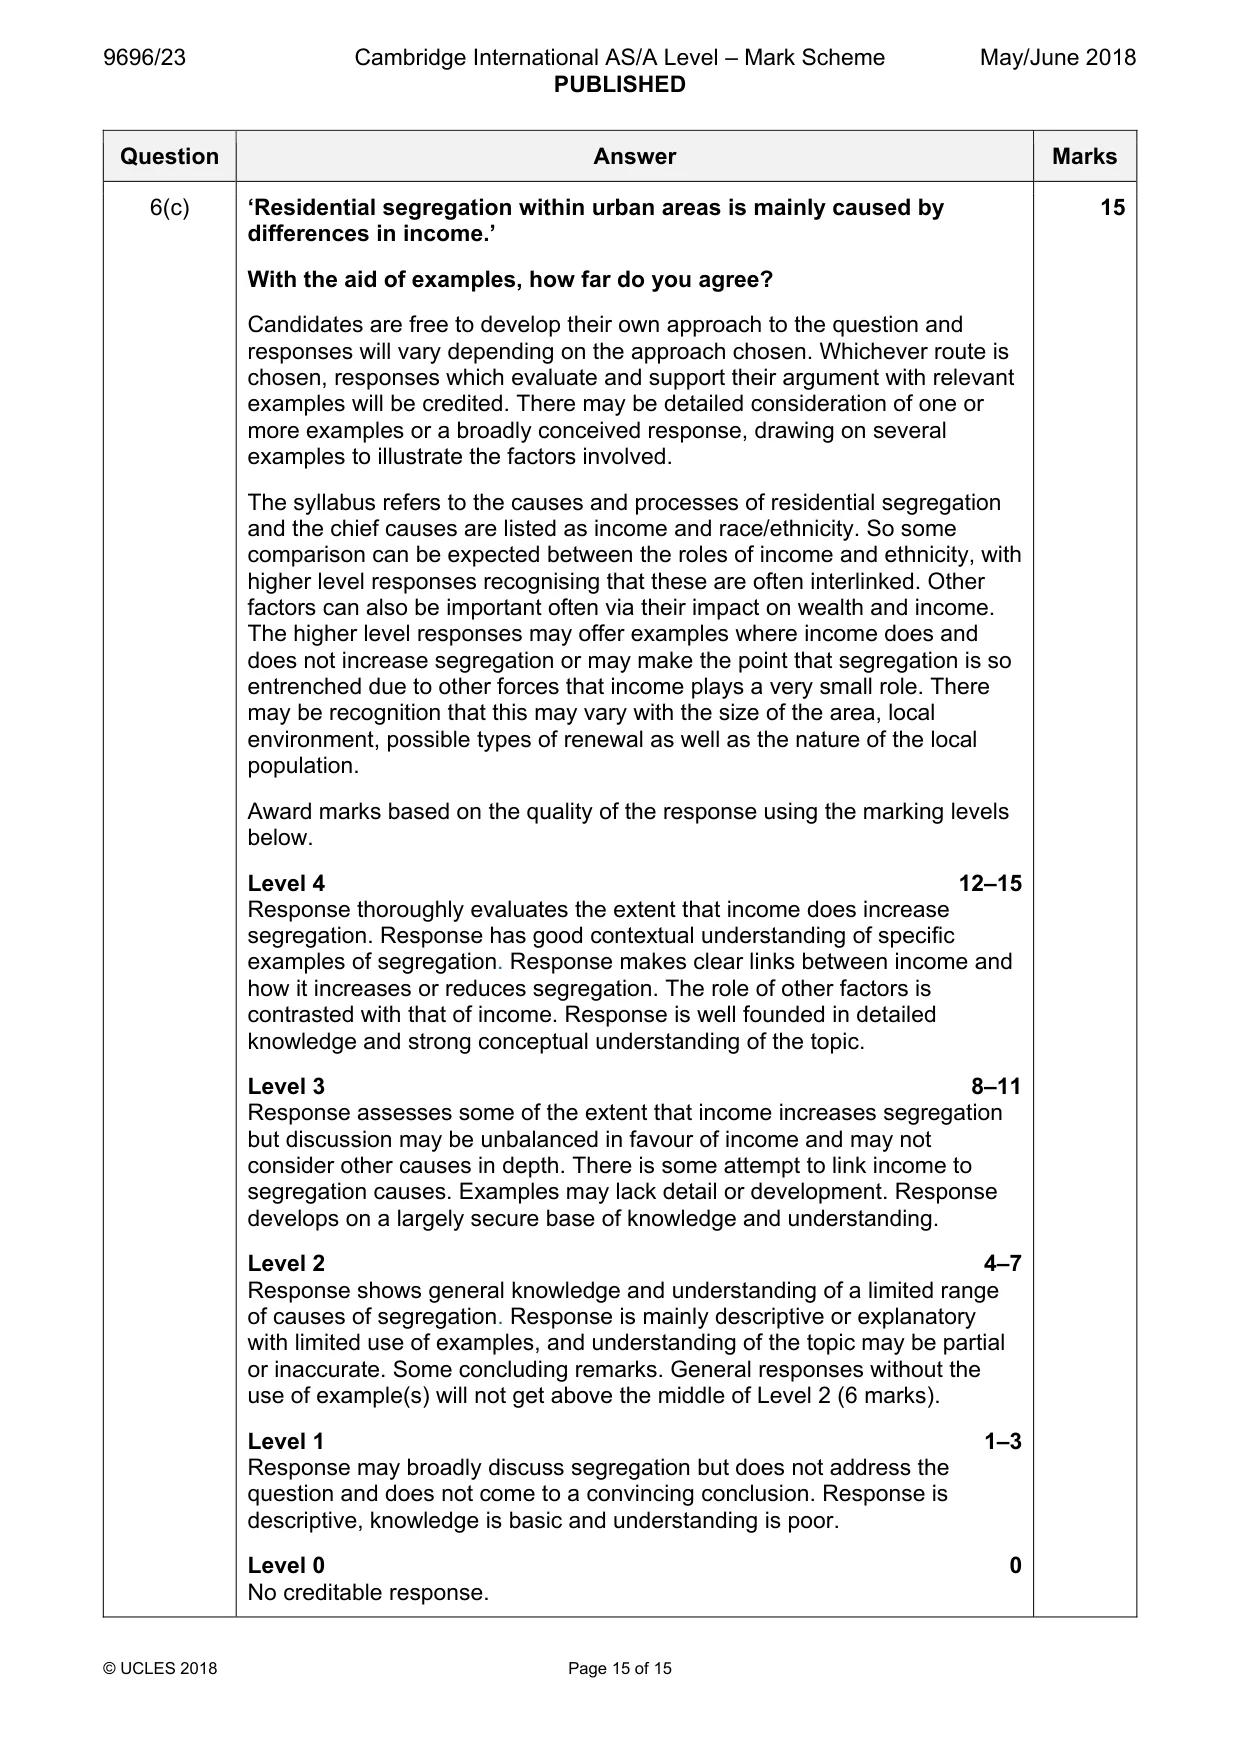
Mark scheme: 6(a) Explain why the population of many large cities is decreasing. 7 The core drivers are the two processes of suburbanisation and counterurbanisation (or deurbanisation), although some may also consider urban population’s lower natural increase. It is likely that responses will be strong on the counterurbanisation process as it is a clear requirement in the syllabus. This process is a reflection of the environmental, economic and social conditions deteriorating in the city, whilst rural areas seem more attractive with cheaper housing and natural environments. Responses are likely to be less secure on suburbanisation – which is the growth of the suburbs extending beyond the city boundary. So people move within the city from inner areas but settle on the suburban fringes which may be beyond the political extent of the city. This is usually supported by improved transport links to the core. An alternative approach is to examine the various push and pull forces. 6(b) Suggest why urban renewal occurs in many cities in HICs. 8 Urban renewal is often seen as an umbrella term that covers a number of planned attempts to ‘renew’ a rundown area of a city. So it could include renewal, redevelopment, refurbishment, gentrification. The question is why do many cities undertake such schemes. Reasons could include: • Environmental reasons – to improve a rundown, polluted, aged area which is an eyesore • Economic reasons – to attract new industries or commerce to an attractive new environment, so boosting property prices, employment and rate revenue. Often, renewal is done for profit for the developers • Social reasons – to reduce crime, to improve the social facilities in an area such as schools, parks, to redevelop an area of out migration where much stands empty • Political reasons – it looks good and creates a positive image of the city Higher level answers may point out that it is only HICs that have the money to effectively re-build part of their city. Award marks based on the quality of explanation and breadth of the response using the marking levels below. Level 3 6–8 Response explains in detail why many cities in HICs undergo urban renewal. Response is well founded in detailed knowledge and strong conceptual understanding of the topic. Any examples used are appropriate and integrated effectively into the response. Level 2 3–5 Response offers some explanation of why many cities in HICs undergo urban renewal. Response develops on a largely secure base of knowledge and understanding. Examples may lack detail or development. Level 1 1–2 Response has descriptive points about urban renewal schemes. Knowledge is basic and understanding may be inaccurate. Examples are in name only or lacking entirely. Level 0 0 No creditable response. 6(c) ‘Residential segregation within urban areas is mainly caused by 15 differences in income.’ With the aid of examples, how far do you agree? Candidates are free to develop their own approach to the question and responses will vary depending on the approach chosen. Whichever route is chosen, responses which evaluate and support their argument with relevant examples will be credited. There may be detailed consideration of one or more examples or a broadly conceived response, drawing on several examples to illustrate the factors involved. The syllabus refers to the causes and processes of residential segregation and the chief causes are listed as income and race/ethnicity. So some comparison can be expected between the roles of income and ethnicity, with higher level responses recognising that these are often interlinked. Other factors can also be important often via their impact on wealth and income. The higher level responses may offer examples where income does and does not increase segregation or may make the point that segregation is so entrenched due to other forces that income plays a very small role. There may be recognition that this may vary with the size of the area, local environment, possible types of renewal as well as the nature of the local population. Award marks based on the quality of the response using the marking levels below. Level 4 12–15 Response thoroughly evaluates the extent that income does increase segregation. Response has good contextual understanding of specific examples of segregation. Response makes clear links between income and how it increases or reduces segregation. The role of other factors is contrasted with that of income. Response is well founded in detailed knowledge and strong conceptual understanding of the topic. Level 3 8–11 Response assesses some of the extent that income increases segregation but discussion may be unbalanced in favour of income and may not consider other causes in depth. There is some attempt to link income to segregation causes. Examples may lack detail or development. Response develops on a largely secure base of knowledge and understanding. Level 2 4–7 Response shows general knowledge and understanding of a limited range of causes of segregation. Response is mainly descriptive or explanatory with limited use of examples, and understanding of the topic may be partial or inaccurate. Some concluding remarks. General responses without the use of example(s) will not get above the middle of Level 2 (6 marks). Level 1 1–3 Response may broadly discuss segregation but does not address the question and does not come to a convincing conclusion. Response is descriptive, knowledge is basic and understanding is poor. Level 0 0 No creditable response.
What was in this paper
The subtopics covered by these 6 questions, and how many questions each got. Open one in a new tab to see every Cambridge question on it.
What you needed in this session
Cambridge’s own grade thresholds for 2018 May/June, Paper 2 · Variant 3. A higher threshold means an easier paper — the bar moves with how the cohort did.